Attached files
Table of Contents
As filed with the Securities and Exchange Commission on February 15, 2017
Registration No. 333-214755
UNITED STATES
SECURITIES AND EXCHANGE COMMISSION
Washington, D.C. 20549
AMENDMENT NO. 3
TO
FORM S-1
REGISTRATION STATEMENT
UNDER
THE SECURITIES ACT OF 1933
Presidio, Inc.
(Exact name of registrant as specified in its charter)
| Delaware | 5045 | 47-2398593 | ||
| (State or other jurisdiction of incorporation) |
(Primary Industrial Classification Code Number) | (I.R.S. Employer Identification Number) |
One Penn Plaza, Suite 2832
New York, New York 10119
(212) 652-5700
(Address, including zip code, and telephone number, including area code, of registrant’s principal executive offices)
Robert Cagnazzi
Chief Executive Officer
Presidio, Inc.
One Penn Plaza, Suite 2832
New York, New York 10119
(212) 652-5700
(Name, address, including zip, code and telephone number, including area code, of agent for service)
Copy to:
| Elliot Brecher Senior Vice President and General Counsel Presidio, Inc. One Penn Plaza, Suite 2832 New York, New York 10119 (212) 652-5700 |
Andrew J. Nussbaum Gordon S. Moodie Wachtell, Lipton, Rosen & Katz 51 West 52nd Street New York, New York 10019 (212) 403-1000 |
Ian D. Schuman Stelios G. Saffos Latham & Watkins LLP 885 Third Avenue New York, New York 10022 (212) 906-1200 |
Approximate date of commencement of proposed sale to the public: As promptly as practicable after the effective date of this registration statement.
If any of the securities being registered on this Form are to be offered on a delayed or continuous basis pursuant to Rule 415 under the Securities Act of 1933, check the following box. ☐
If this Form is filed to register additional securities for an offering pursuant to Rule 462(b) under the Securities Act, check the following box and list the Securities Act registration statement number of the earlier effective registration statement for the same offering. ☐
If this Form is a post-effective amendment filed pursuant to Rule 462(c) under the Securities Act, check the following box and list the Securities Act registration statement number of the earlier effective registration statement for the same offering. ☐
If this Form is a post-effective amendment filed pursuant to Rule 462(d) under the Securities Act, check the following box and list the Securities Act registration statement number of the earlier effective registration statement for the same offering. ☐
Indicate by check mark whether the registrant is a large accelerated filer, an accelerated filer, a non-accelerated filer, or a smaller reporting company. See the definitions of “large accelerated filer,” “accelerated filer” and “smaller reporting company” in Rule 12b-2 of the Exchange Act of 1934.
| ☐ | Large accelerated filer | ☐ | Accelerated filer | |||||
| ☒ | Non-accelerated filer | (Do not check if a smaller reporting company) | ☐ | Smaller reporting company |
The registrant hereby amends this registration statement on such date or dates as may be necessary to delay its effective date until the registrant shall file a further amendment which specifically states that this registration statement shall thereafter become effective in accordance with section 8(a) of the Securities Act of 1933 or until this registration statement shall become effective on such date as the Securities and Exchange Commission, acting pursuant to said section 8(a), may determine.
Table of Contents
The information in this prospectus is not complete and may be changed. We may not sell these securities until the registration statement filed with the Securities and Exchange Commission is effective. This prospectus is not an offer to sell these securities, and we are not soliciting an offer to buy these securities, in any state where the offer or sale is not permitted.
Subject to completion, dated February 15, 2017
Preliminary prospectus
shares

Common stock
This is an initial public offering of common stock of Presidio, Inc. We are selling shares of our common stock. The estimated initial public offering price is between $ and $ per share.
After the completion of this offering (this “Offering”), investment funds affiliated with or managed by Apollo Global Management, LLC will beneficially own % of our outstanding common stock (or % of our outstanding common stock if the underwriters exercise their option to purchase additional shares in full). As a result, Apollo Global Management, LLC will control a majority of the voting power of our outstanding common stock, and we expect to be a “controlled company” within the meaning of the corporate governance standards of the Nasdaq Global Select Market (the “NASDAQ”). See “Principal Stockholders.”
Prior to this Offering, there has been no public market for our common stock. We have applied to list our common stock on the NASDAQ under the symbol “PSDO.”
We intend to use approximately $ million of the net proceeds from this Offering to repurchase all of our 10.25% Senior Subordinated Notes (the “Subordinated Notes”) and approximately $ million to redeem a portion of our 10.25% Senior Notes (the “Senior Notes”), in each case at a purchase price of 110.25% of the principal amount so repurchased or redeemed, plus accrued and unpaid interest, if any, up to but excluding, the date of such repurchase or redemption. We expect any remaining net proceeds to be used for working capital or general corporate purposes, including the repayment of amounts outstanding under our February 2015 Credit Agreement or our Receivables Securitization Facility (each as defined herein). See “Use of Proceeds.”
An alternative investment vehicle formed by the limited partners of the Apollo Funds (as defined herein) owns substantially all of the economic interests in the Subordinated Notes pursuant to certain derivative arrangements entered into with Deutsche Bank AG, who is the holder of 100% of the outstanding Subordinated Notes. As such, we presently anticipate that any portion of the proceeds of this Offering used by the Company to repurchase the Subordinated Notes would be paid, directly or indirectly, to such alternative investment vehicle (net of any amounts owed by such alternative investment vehicle to Deutsche Bank AG pursuant to such derivative arrangements).
| Per share | Total | |||||||
| Initial public offering price |
$ | $ | ||||||
| Underwriting discounts and commissions(1) |
$ | $ | ||||||
| Proceeds to us, before expenses |
$ | $ | ||||||
| (1) | See “Underwriting (Conflicts of Interest)” for additional information regarding total underwriter compensation. |
We have granted the underwriters an option for a period of 30 days to purchase up to an additional shares of common stock from us at the initial public offering price less underwriting discounts and commissions.
Investing in our common stock involves a high degree of risk. See “Risk Factors” beginning on page 24.
Neither the Securities and Exchange Commission nor any state securities commission has approved or disapproved of these securities or passed on the adequacy or accuracy of this prospectus. Any representation to the contrary is a criminal offense.
The underwriters expect to deliver the shares of common stock to investors on or about , .
| J.P. Morgan | Citigroup | |
| Barclays | RBC Capital Markets |
| Credit Suisse | Goldman, Sachs & Co. | Wells Fargo Securities | Evercore ISI |
| Guggenheim Securities | Apollo Global Securities | LionTree |
Prospectus dated , .
Table of Contents

Table of Contents
| Page | ||||
| 1 | ||||
| 18 | ||||
| 24 | ||||
| 46 | ||||
| 48 | ||||
| 50 | ||||
| 51 | ||||
| 53 | ||||
| 55 | ||||
| Unaudited Pro Forma Condensed Consolidated Financial Information |
63 | |||
| Management’s Discussion and Analysis of Financial Condition and Results of Operations |
71 | |||
| 135 | ||||
| 151 | ||||
| 158 | ||||
| 177 | ||||
| 179 | ||||
| 183 | ||||
| 189 | ||||
| 196 | ||||
| Certain Material United States Federal Income Tax Considerations for Non-U.S. Holders |
198 | |||
| 202 | ||||
| 210 | ||||
| 210 | ||||
| 210 | ||||
| F-1 | ||||
You should rely only on the information contained in this prospectus and any free writing prospectus prepared by us or on our behalf that we have referred you to. We and the underwriters have not authorized anyone to provide you with additional or different information. If anyone provides you with additional, different or inconsistent information, you should not rely on it. We are not making an offer of these securities in any state or other jurisdiction where the offer is not permitted. You should not assume that the information in this prospectus and any free writing prospectus is accurate as of any date other than the date of the applicable document regardless of its time of delivery or the time of any sales of our common stock. Our business, financial condition, results of operations or cash flows may have changed since the date of the applicable document.
Table of Contents
Basis of Presentation
Presidio, Inc. (formerly named Aegis Holdings, Inc.) (the “Successor”) was incorporated on November 20, 2014 by certain investment funds affiliated with or managed by Apollo Global Management, LLC (together with its subsidiaries, “Apollo”), including Apollo Investment Fund VIII, L.P., along with their parallel investment funds (collectively, the “Apollo Funds”) in order to complete the acquisition of Presidio Holdings Inc. (the “Predecessor”). The Apollo Funds completed the acquisition of the Predecessor on February 2, 2015 (the “Presidio Acquisition”), at which time the Predecessor became a direct wholly owned subsidiary of the Successor. See “Principal Stockholders.” As a result of this acquisition, the resulting change in control and changes due to the impact of purchase accounting, we are required to present separately the operating results of (A) the Predecessor for periods ending prior to February 2, 2015 and (B) of the Successor for periods ending on or after February 2, 2015. Accordingly, unless otherwise indicated or the context otherwise requires, all references in this prospectus to the “Company,” “Presidio,” “we,” “us,” “our” and other similar terms mean (1) the Predecessor for periods ending prior to February 2, 2015 and (2) the Successor for periods ending on or after February 2, 2015, in each case together with its consolidated subsidiaries. From November 20, 2014 to February 1, 2015, the Successor had no operations or activities other than the incurrence of transaction costs related to the Presidio Acquisition.
Unless otherwise indicated, all references in this prospectus to “dollars” and “$” are to U.S. dollars, and all amounts in this prospectus are presented in U.S. dollars.
Our fiscal year ends on June 30 of each year. References in this prospectus to a fiscal year mean the year in which that fiscal year ends. References in this prospectus to “fiscal 2012” or “our 2012 fiscal year” relate to the fiscal year ended June 30, 2012, references in this prospectus to “fiscal 2013” or “our 2013 fiscal year” relate to the fiscal year ended June 30, 2013, references in this prospectus to “fiscal 2014” or “our 2014 fiscal year” relate to the fiscal year ended June 30, 2014 and references in this prospectus to “fiscal 2016” or “our 2016 fiscal year” relate to the fiscal year ended June 30, 2016. References in this prospectus to “fiscal 2015” or “our Combined 2015 fiscal year” represent the sum of the results of the period from July 1, 2014 to February 1, 2015 (Predecessor) and the period from November 20, 2014 to June 30, 2015 (Successor) (collectively, the “Combined period” or sometimes referred to herein as the “Combined fiscal year,” “Combined 2015 fiscal year” or “Combined fiscal year ended June 30, 2015”). We believe that our use of the Combined period, which represents the mathematical addition of Successor’s fiscal 2015 period and Predecessor’s fiscal 2015 period, provides meaningful information about our results of operations on a period-to-period basis. This approach is not consistent with GAAP, may yield results that are not strictly comparable on a period-to-period basis and may not reflect the actual results we would have achieved if the Presidio Acquisition had occurred at the beginning of the Combined period. Refer to “Management’s Discussion and Analysis of Financial Condition and Results of Operations” in this prospectus for additional information including the pro forma adjustments necessary to reflect the Presidio Acquisition as if it had occurred on July 1, 2014.
We calculate total addressable market (“TAM”) amounts using a methodology combining calculations of Gartner, Inc. (“Gartner”) and the Company’s management. The data underlying the TAM amounts were calculated by Gartner, and the Company’s management used the TAM amounts to calculate the compound annual growth rate (“CAGR”) between certain periods. In calculating TAM amounts with respect to the Digital Infrastructure, Cloud and Security components, Gartner excluded certain sub-components from the Security TAM because they are not part of our solution set: Consumer Security Software, Data Loss Prevention, Endpoint Protection Platform (Enterprise), Identity Governance and Administration, IPS Equipment, Other Identity Access Management, Other Security Software, Secure E-Mail Gateway, Secure Web Gateway, Security Information and Event Management (SIEM), Security Testing, VPN/Firewall Equipment, and Web Access Management (WAM). Our management then calculated CAGR using the revised TAM amounts, resulting in the amounts reported in this prospectus for TAM CAGR in this prospectus. See “Prospectus Summary—Market Overview” and “Business—Market Overview.”
ii
Table of Contents
We calculate revenue per existing client (exclusive of Netech Corporation (“Netech”)) as our GAAP revenue, excluding revenue produced by Netech, divided by the total number of customers, excluding Netech customers, that produced revenue in the relevant period.
Some of the statements in this prospectus constitute forward-looking statements. See “Cautionary Statement Concerning Forward-Looking Statements.”
Trademarks and Trade Names
This prospectus contains references to a number of our trademarks (including service marks) that are registered trademarks or trademarks for which we have pending applications or common-law rights. Trade names, trademarks and service marks of other companies appearing in this prospectus are the property of their respective owners.
Market, Industry and Other Data
This prospectus contains industry and market data, forecasts and projections that are based on internal data and estimates, independent industry publications, reports by market research firms and other independent sources, such as Gartner. Although we believe them to be accurate, there can be no assurance as to the accuracy or completeness of such information. Although we are responsible for all of the disclosures contained in this prospectus, we have not independently verified any of the data from third-party sources, nor have we ascertained the underlying economic assumptions relied upon therein. In addition, while we believe that the industry information included herein is generally reliable, such information is inherently imprecise. While we are not aware of any misstatements regarding the industry data presented herein, our estimates involve risks and uncertainties and are subject to change based on various factors, including those discussed under the caption “Risk Factors” in this prospectus.
Net Promoter Score (“NPS”) is a measure of customer satisfaction on a scale ranging from -100 to 100 developed by Bain and Co. It measures satisfaction using a scale of one to 10 based on a customer’s response to the following question: “How likely is it that you would recommend Presidio to a friend or colleague?” Scores of 9 or 10 are considered “Promoters.” Scores of 7 or 8 are considered neutral. Scores of 6 or less are considered “Detractors.” The NPS, a percentage expressed as a numerical value, is calculated by subtracting the percentage of respondents who are Promoters from the percentage who are Detractors. The NPS calculation gives no weight to customers who decline to answer the survey question. We measure our NPS quarterly by surveying all customers with whom we have transacted in such quarter, except for those who responded to the survey in the previous quarter. Our NPS for the quarter ended September 30, 2016 is 68, which is 8 points higher than our NPS for the fourth quarter of our 2016 fiscal year.
The Gartner Reports described herein (the “Gartner Reports”), which were prepared for us in connection with this prospectus, represent research opinions or viewpoints published, as part of a syndicated subscription service, by Gartner and are not representations of fact. The Gartner Reports speak as of their original publication date (and not as of the date of this prospectus) and the opinions expressed in the Gartner Reports are subject to change without notice.
In certain instances where the Gartner Reports are identified as the sources of market and industry data contained in this prospectus, the applicable report is identified by superscript notations. The sources of these data are provided below:
| (1) | Gartner, Market Databook, 2Q16 Update, dated as of June 29, 2016. |
| (2) | Gartner, 2016 CIO Agenda: A U.S. Perspective, dated as of February 19, 2016. |
iii
Table of Contents
| (3) | Gartner, Report to Presidio, dated as of May 10, 2016. |
| (4) | Gartner, Forecast: Information Security, Worldwide, 2014-2020, 2Q16 Update, dated as of August 25, 2016. |
| (5) | Gartner, Market Share: IT Services, 2015, dated as of April 6, 2016. |
| (6) | Gartner, Market Trends: Cloud Adoption Trends Favor Public Cloud with a Hybrid Twist, dated as of August 4, 2016. |
| (7) | Gartner, Market Databook, 4Q13 Update, dated as of December 24, 2013. |
In the Gartner Reports, the market and industry data presented is based on end-user spending and represents calendar year data.
Unless otherwise indicated, in this prospectus, companies in the geographic market of the United States and Canada (the “North American IT market”) are divided into four categories. These categories are those used by Gartner, and are based on the size of the company. SOHO (Small Office/Home Office) companies are characterized by one-nine employees. Small businesses are characterized by 10-99 employees and less than $50 million in revenue. Midsize, or middle market, companies are characterized by 100-1,000 employees and $50 million to $1 billion in revenue. Large, or enterprise, companies are characterized by over 1,000 employees and more than $1 billion in revenue.
Unless otherwise indicated, in this prospectus, spend in the North American IT market is divided into five categories:
| • | The “Data Center Systems / Network” category includes servers, external controller-based storage, enterprise network equipment and unified communications; |
| • | The “Devices” category includes PCs, tablets, phones and printers; |
| • | The “Software” category includes enterprise application software (enterprise resource planning (“ERP”), human resources (“HR”), collaborative, client relationship management (“CRM”) and engineering software) and infrastructure software (application development, information management, enterprise system management, security system software and operating systems); |
| • | The “IT Services” category includes business IT services (consulting, implementation, IT outsourcing and “business process outsourcing”) and IT product support (software support and hardware support); and |
| • | The “Communications Services” category includes enterprise fixed and mobile services (wide area network (“WAN”), core network, voice services, mobile data services, etc.) and consumer fixed and mobile services (fixed-line voice services, broadband, mobile access and traffic fees, etc.). |
Certain monetary amounts, percentages and other figures included in this prospectus have been subject to rounding adjustments. Accordingly, figures shown as totals in certain tables and charts may not be the arithmetic aggregation of the figures that precede them and figures expressed as percentages in the text may not total 100% or, as applicable, when aggregated, may not be the arithmetic aggregation of the percentages that precede them.
iv
Table of Contents
Non-GAAP Financial Measures
The U.S. Securities and Exchange Commission (the “SEC”) has adopted rules to regulate the use in filings with the SEC and in other public disclosures of “non-GAAP financial measures,” which include Adjusted EBITDA, Adjusted Net Income and Adjusted Revenue and ratios related thereto. These measures are derived on the basis of methodologies other than in accordance with accounting principles generally accepted in the United States (“GAAP”). These rules govern the manner in which non-GAAP financial measures are publicly presented and require, among other things:
| • | a presentation with equal or greater prominence of the most comparable financial measure or measures calculated and presented in accordance with GAAP; and |
| • | a statement disclosing the purposes for which the registrant’s management uses the non-GAAP financial measure. |
The rules prohibit, among other things:
| • | exclusion of charges or liabilities that require cash settlement or would have required cash settlement absent an ability to settle in another manner from non-GAAP liquidity measures; and |
| • | adjustment of a non-GAAP performance measure to eliminate or smooth items identified as non-recurring, infrequent or unusual, when the nature of the charge or gain is such that it is reasonably likely to occur. |
In addition to financial information presented in accordance with GAAP, management uses Adjusted EBITDA, Adjusted Net Income and Adjusted Revenue (all of which are non-GAAP measures) in this prospectus in its evaluation of past performance and prospects for the future. We define Adjusted EBITDA as net income (loss) plus (i) total depreciation and amortization, (ii) interest and other (income) expense and (iii) income tax expense (benefit), as further adjusted to eliminate noncash share-based compensation expense, purchase accounting adjustments, transaction costs, other costs and earnings from disposed business. We believe that Adjusted EBITDA provides helpful information with respect to our operating performance as viewed by management, including a view of our business that is not dependent on (1) the impact of our capitalization structure and (2) items that are not part of our day-to-day operations.
Management also uses Adjusted Net Income, a non-GAAP measure, in this prospectus in its evaluation of past performance and prospects for the future. We define Adjusted Net Income as net income (loss) adjusted to exclude (i) amortization of intangible assets, (ii) amortization of debt issuance costs, (iii) losses recognized on the disposal of business, (iv) losses on extinguishment of debt, (v) noncash share-based compensation expense, (vi) purchase accounting adjustments, (vii) transaction costs, (viii) other costs, (ix) earnings from disposed business and (x) the income tax impact associated with the foregoing items and adjusted for (1) the impact of permanently nondeductible expenses, (2) the impact of tax-deductible goodwill and intangible assets resulting from certain historical acquisitions and (3) the impact of discrete tax items. We believe that Adjusted Net Income provides additional information regarding our operating performance while considering the interest expense associated with our outstanding debt, as well as the impact of depreciation on our fixed assets and income tax expense. We believe Adjusted Net Income is utilized by investors and other interested parties to facilitate period–over–period comparisons and, relative to other performance measures, provides additional information as to how trends impact our operating performance.
Management also uses Adjusted Revenue, a non-GAAP measure, in its evaluation of historical revenue activity. We define Adjusted Revenue as revenue adjusted to exclude (i) total revenue generated by disposed businesses and (ii) noncash purchase accounting adjustments to total revenue as a result of our acquisitions. We believe that Adjusted Revenue provides supplemental information with respect to our revenue activity associated
v
Table of Contents
with our ongoing operations. However, Adjusted Revenue does not represent and should not be considered an alternative to Revenue as determined under GAAP and may not be comparable to other similarly titled measures of other businesses.
Adjusted EBITDA, Adjusted Net Income and Adjusted Revenue should be considered in addition to, not as a substitute for, or superior to, financial measures calculated in accordance with GAAP. They are not measurements of our financial performance under GAAP and should not be considered as alternatives to net income (loss) or revenue, as applicable, or any other performance measures derived in accordance with GAAP and may not be comparable to other similarly titled measures of other businesses. Adjusted EBITDA, Adjusted Net Income and Adjusted Revenue have limitations as analytical tools and you should not consider them in isolation or as a substitute for analysis of our operating results as reported under GAAP. Some of these limitations include:
| • | noncash compensation is and will remain a key element of our overall long-term incentive compensation package, although we exclude it as an expense when evaluating our ongoing operating performance for a particular period; |
| • | Adjusted EBITDA and Adjusted Net Income do not reflect the impact of certain cash charges resulting from matters we consider not to be indicative of our ongoing operations; and |
| • | other companies in our industry may calculate Adjusted EBITDA, Adjusted Net Income and Adjusted Revenue differently than we do, limiting their usefulness as comparative measures. |
We compensate for these limitations to Adjusted EBITDA, Adjusted Net Income and Adjusted Revenue by relying primarily on our GAAP results and using Adjusted EBITDA, Adjusted Net Income and Adjusted Revenue only for supplemental purposes. Adjusted EBITDA and Adjusted Net Income include adjustments for items that may occur in future periods. However, we believe these adjustments are appropriate because the amounts recognized can vary significantly from period to period, do not directly relate to the ongoing operations of our business and complicate comparisons of our internal operating results and operating results of other peer companies over time. For example, it is useful to exclude noncash, share-based compensation expenses because the amount of such expenses in any specific period may not directly correlate to the underlying performance of the Company’s business operations and these expenses can vary significantly across periods due to timing of new share-based awards. We also exclude certain discrete, unusual or noncash costs, including noncash purchase accounting adjustments, transaction costs (including professional fees and other expenses associated with acquisition and disposition activity) and other costs (such as costs incurred to integrate our managed services customers onto a single platform) in order to facilitate a more useful period-over-period comparison of the Company’s financial performance. Each of the normal recurring adjustments and other adjustments described in this paragraph help management with a measure of our operating performance over time by removing items that are not related to day-to-day operations or are noncash expenses. See our historical consolidated financial statements included elsewhere in this prospectus for our GAAP results. For reconciliations of Adjusted EBITDA, Adjusted Net Income and Adjusted Revenue to the most comparable GAAP measure, see “Prospectus Summary—Summary Historical and Pro Forma Financial Information” and “Selected Historical Consolidated Financial Data.”
vi
Table of Contents
The following summary highlights information contained elsewhere in this prospectus and is qualified in its entirety by the more detailed information and historical consolidated financial statements included elsewhere in this prospectus. This summary is not complete and may not contain all of the information that may be important to you. You should carefully read the entire prospectus, including the “Risk Factors” section and our historical consolidated financial statements and related notes, before making an investment decision.
Company Overview
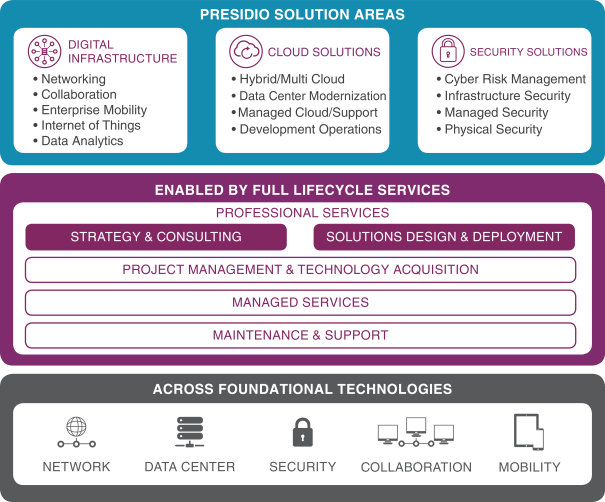
Presidio is a leading provider of information technology (“IT”) solutions to the middle market in North America. We enable business transformation through our expertise in IT solutions, with a specific focus on Digital Infrastructure, Cloud and Security solutions. Our solutions are delivered through a broad suite of professional services, including strategy, consulting, design and implementation. We complement our professional services with project management, technology acquisition, managed services, maintenance and support to offer a full lifecycle model. Our services-led, lifecycle model leads to ongoing client engagement. As of June 30, 2016, we serve approximately 7,000 middle-market, large and government organizations across a diverse range of industries.
We have three solution areas: (i) Digital Infrastructure, (ii) Cloud and (iii) Security. Through our increasing focus on cloud and security, we believe we are well positioned to benefit from the rapid growth in demand for these technologies and expect our business mix to continue shifting toward them. Within our three solutions areas, we offer customers enterprise-class solutions that are critical to driving digital transformation and expanding business capabilities. Examples of our solutions include advanced networking, Internet of Things (“IoT”), data center modernization, hybrid and multi-cloud, cyber risk management, enterprise mobility and management of data from sensors, cameras, wearables and machines that can be accessed and shaped to derive actionable insights and business outcomes (“data analytics”). These solutions are enabled by our expertise in foundational technologies, built upon our investments in network, data center, security, collaboration and mobility.
The middle market is a highly attractive segment of the IT Services market. We believe we are the leading middle-market provider of IT solutions and are differentiated by our strategic focus on this attractive segment. The increasing potential and complexity of emerging technologies and digital transformation are creating more demand for our solutions and services. As a trusted solutions provider, our clients rely on us for IT investment decisions. We simplify IT for them by building solutions utilizing what we view as the best possible technologies. Customers in the middle market are usually large enough to have substantial technology needs but typically have fewer IT resources and lack the broad expertise required to develop the necessary solutions as compared to larger companies. Since many large-scale IT Services providers focus on larger enterprises, and because many resellers are unable to provide end-to-end solutions, we believe the middle market has remained underpenetrated and underserved.
We develop and maintain our long-term client relationships through a localized direct sales force of over 500 employees based in over 60 offices across the United States as of June 30, 2016. As a strategic partner and trusted advisor to our clients, we provide the expertise to implement new solutions, as well as optimize and better leverage existing IT resources. We provide strategy, consulting, design, customized deployment, integration and lifecycle management through our team of approximately 1,600 engineers as of June 30, 2016, enabling us to architect and manage the ideal IT solutions for our clients. Our local delivery model, combining relationship managers and expert engineering teams, allows us to win, retain and expand our client relationships.
Our client base is diversified across individual customers and industry verticals. In our fiscal year ended June 30, 2016, only 19% of our revenue was attributable to our top 25 clients by revenue and no industry vertical accounted for more than 20% of our revenue. Among the verticals that we serve, healthcare, professional services, financial services, governments and education are our largest categories. We believe that our diversified business profile is a key driver of our ability to generate growth across different economic and technology cycles.
1
Table of Contents
Our strategic focus on the middle market and high-growth solutions areas has enabled us to achieve 11% annualized growth in our revenue from our fiscal year ended June 30, 2012 to our fiscal year ended June 30, 2016. Over the same period, we have significantly outpaced the overall IT market growth rate, according to Gartner. We believe that we are well positioned for continued success as IT becomes more transformative and complex, driving demand for our solutions.
Our revenue was $1,393 million for the Predecessor period beginning July 1, 2014 and ending February 1, 2015 and $985 million for the Successor period beginning November 20, 2014 and ending June 30, 2015. From November 20, 2014 to February 1, 2015, the Successor had no operations or activities other than the incurrence of transaction costs related to the Presidio Acquisition. Our revenue for our Combined fiscal year ended June 30, 2015 was $2,378 million and increased 14.2% to $2,715 million in our fiscal year ended June 30, 2016. In our fiscal year ended June 30, 2016, our net loss was $3.4 million. In the same period, Adjusted EBITDA and Adjusted Net Income were $211.1 million and $81.2 million, respectively. Adjusted EBITDA and Adjusted Net Income are non-GAAP financial measures. See “Non-GAAP Financial Measures” and footnotes 2 and 4 under “—Summary Historical and Pro Forma Financial Information” for the definitions of Adjusted EBITDA and Adjusted Net Income, the reasons for their inclusion and a reconciliation to net income.
Market Overview
We operate in the large and growing North American IT market. According to Gartner, the overall North American IT market is expected to grow to $1.3 trillion by 2020, representing a 2.6% CAGR from 2015, and the IT Services sub-market is expected to grow by 5.3% over the same period, to $497 billion. Our primary focus is on the attractive middle market of the overall North American IT market, which, according to Gartner, is projected to grow from $226 billion in 2015 to $293 billion in 2020, representing a 5.3% CAGR. The middle market is one of the fastest growing segments of the overall North American IT market in part because its companies often employ smaller internal IT teams that do not have the broad expertise required to keep pace with increasingly complex IT environments and constant technology changes. Industry dynamics continue to favor services-led solutions providers, as businesses increasingly rely on us to advise them on complex IT projects, enabling them to better focus on their core capabilities and enhance productivity.
| North America IT Spend by Category1
|
North America IT Spend by Company Size | |
|
| ||
While we primarily focus our operations on the U.S. middle market, we have generated sales in and have operations in Canada, the only other country included in Gartner’s North American IT market. Our sales in Canada generated approximately 0.3% of our revenue in the fiscal year ended June 30, 2016. Our total sales outside the United States
| 1 | See Gartner note (1) in the section titled “Market, Industry and Other Data.” |
2
Table of Contents
represented approximately 2% of our total revenue for each of the fiscal years ended June 30, 2016, June 30, 2015, and June 30, 2014, and the growth rates of the overall North American IT market and the IT Services sub-market generally indicate a growing market for our business.
We believe that growth in IT spending will continue to be driven by the adoption of new technologies and market-related trends in cloud, security and IoT and the desire to integrate people, process and technology into digital business models. These trends reflect expanding IT complexity that organizations must manage to remain competitive; however, many middle-market companies lack the resources to design, integrate and manage full life cycle solutions across multiple technology silos to capitalize on these new technologies. A recent survey by Gartner2 predicted that the four biggest drivers of increased IT budget spend would be in the areas of analytics, infrastructure and datacenter, security and cloud, all of which are areas addressed by our core solutions.
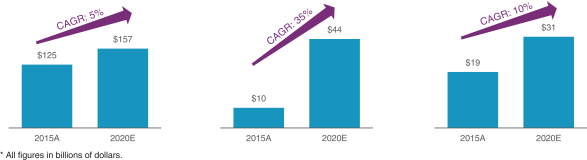
Because of our strategic focus on high-growth solutions areas, our North American TAM is expected to grow at a 9% CAGR from $154 billion in 2015 to $232 billion in 2020, according to Gartner and management estimates.3
| Digital Infrastructure TAM
|
Cloud TAM
|
Security TAM |
Specific components of our TAM are as follows:
| • | Digital Infrastructure solutions: Gartner and management estimate that our addressable enterprise-class infrastructure market was $125 billion in 2015 and is projected to grow at a 5% CAGR through 2020. Gartner defines infrastructure solutions as infrastructure services, infrastructure consulting, network services, data center outsourcing, enterprise network outsourcing, data center systems support and network systems support, as well as IoT implementation and consulting. Gartner defines enterprise-class as “the ability of a given tool or product to handle complex processes or services.” We believe key emerging trends driving this growth include increased infrastructure requirements for cloud (public, private and multi) usage including integration of Software-as-a-Service (“SaaS”) applications into environments, low-latency requirements, software-defined networks (“SDN”), IoT-connected devices and data management strategies supporting data analytics. We enable businesses to capitalize on these emerging trends by designing and deploying new solutions and by refreshing and replacing their inflexible or under-provisioned existing networks and infrastructure. |
| • | Cloud solutions: Over the past several years, the SaaS, Platform-as-a-Service (“PaaS”) and Infrastructure-as-a-Service (“IaaS”) markets have provided a viable complement to traditional on premise, enterprise-class infrastructure solutions. Clients are deploying multi-cloud solutions that drive increased demand for private clouds, networking, storage and virtualization, as well as public-cloud integration. Gartner estimates that the North American cloud infrastructure opportunity was approximately $10 billion in 2015 and is projected to grow at a CAGR of more than 35% through 2020. Gartner defines cloud solutions as cloud computing services. |
| 2 | See Gartner note (2) in the section titled “Market, Industry and Other Data.” |
| 3 | See Gartner note (3) in the section titled “Market, Industry and Other Data.” |
3
Table of Contents
| • | Security solutions: The information security market has been driven by an increase in threats and targeted attacks over the last several years. This is due to the substantial increase in sophistication of attacks (including organized crime and state-sponsored entities) and client adoption of new technologies such as cloud computing and IoT that have created new security exposures for businesses. Security attacks have affected nearly every organization, making security a top priority for senior management teams and boards of directors. Despite years of effort and an estimated tens of billions of dollars spent annually,4 we believe that most organizations are still not sufficiently protected against cyberattacks. Additionally, heightened sensitivity around data security has introduced new regulation and contractual requirements in a number of the industries we serve. According to Gartner and management estimates, the North American security market was $19 billion in 2015, with a projected CAGR of more than 10% through 2020.5 Gartner defines security solutions as consulting, hardware support, implementation and IT outsourcing. |
We believe that we are well positioned within the fragmented North American IT Services market—where no individual company has over 5% market share, according to Gartner.6 We have become a trusted advisor to our middle-market clients by providing enterprise-class, vendor-agnostic and end-to-end solutions through our national team of engineers and strong local relationships. We believe that our value proposition will allow us to take market share because local and regional service providers lack our scale, technology expertise and end-to-end solution capabilities and the larger national and global firms do not have the focus, local relationships and organizational structure to provide solutions to the middle market.
Our Solutions
We consider ourselves to be a leading provider of end-to-end and innovative IT solutions across our three solution areas: (i) Digital Infrastructure, (ii) Cloud and (iii) Security. Due to the accelerated growth and adoption of cloud and security solutions, as seen in Gartner’s projected growth in our total addressable markets, we expect Cloud and Security to continue to drive a mix shift in our revenue base over time.
(Percentage of fiscal 2016 revenue)
| Digital Infrastructure | Cloud | Security |

At the core of our solutions is our services expertise, which combines professional services, project management and technology acquisition, as well as managed, maintenance and support services across our clients’ IT lifecycle. Our offerings are focused on five core foundational IT technologies: network, data center, security, collaboration and mobility. We enable our clients to capitalize on technology advances, simplify IT complexity and optimize existing environments, which drives business transformation through new applications, user experiences and revenue models. As a services-led organization, we work with our clients to understand their unique business challenges and opportunities. Once a client’s
| 4 | See Gartner note (4) in the section titled “Market, Industry and Other Data.” |
| 5 | See Gartner note (4) in the section titled “Market, Industry and Other Data.” |
| 6 | See Gartner note (5) in the section titled “Market, Industry and Other Data.” |
4
Table of Contents
needs have been identified, a team of Presidio engineers designs a vendor-agnostic IT solution tailored to the client’s objectives and then acquires the technology and implements the solution. As part of our full lifecycle model, we also provide managed, maintenance and support services to our clients.
Across each of our solution areas, we focus on building expertise in the emerging trends and leading-edge technologies that matter most to our clients. Specifically, in Digital Infrastructure, we have deployed next-generation, converged network and data center technologies to support the increasing demands of multi-channel client interaction and an increasingly mobile workforce. In Cloud, we have developed solutions that allow us to deploy hybrid and multi-cloud environments and software-defined infrastructure, in an automated and orchestrated fashion, giving our clients agility and powerful governance over their application environments. In Security, we have developed strong capabilities in risk assessment, gap remediation, proactive risk management and incident response.
Digital Infrastructure Solutions: Our enterprise-class Digital Infrastructure solutions enable clients to deploy IT infrastructure that is cloud-flexible, mobile-ready, secure and insight-driven. We also make clients’ existing IT infrastructure more efficient and flexible for emerging technologies. Within Digital Infrastructure, we are focused on networking, collaboration, enterprise mobility, IoT and data analytics. In networking, we are designing and deploying the intelligent interconnectivity that will enable our customers to take advantage of the advances in IT, including cloud and data
5
Table of Contents
analytics. In collaboration, we help our clients create environments that allow for faster decision-making by integrating all their critical business and communications applications into a unified solution. Our solutions are mobile-ready, as we extend our clients’ local and wide area networks by enabling reliable, secure and scalable access to all types of mobile devices. In IoT, we are helping our clients move from traditional manual processes to automated machine-to-machine connectivity, enabling enhanced efficiency, powerful data insights and integration of historically non-IT assets into the IT environment. Given the millions of potential configurations across technologies, our clients rely on our expertise to simplify the highly complex IT landscape.
Cloud Solutions: We have found that businesses are increasingly required to deliver new products and services to market in shortened time frames by leveraging technology to transform the rate at which they can innovate. Part of this transformation is the proliferation and adoption of the cloud. As a result, companies are increasingly turning to us for help with their cloud strategy and adoption. A recent survey by Gartner7 indicated that 71% of organizations currently deploy or plan to deploy cloud services by the end of 2017. Through our acquisition of Sequoia Worldwide LLC (“Sequoia”) and our organic investments, we provide cloud enablement and migration services as well as private, hybrid and multi-cloud solutions, including data center modernization, managed cloud, orchestration and automation and operational support to our clients. We combine our highly specialized cloud professional services with our deep experience in cloud-managed services, converged infrastructure, server, storage, support and capacity-on-demand economic models to provide a complete lifecycle of cloud infrastructure solutions for our clients. Our proprietary tools, technical expertise and vendor-agnostic approach help our clients accelerate and simplify cloud adoption across the entire IT lifecycle.
Security Solutions: We use a risk-based security consulting methodology to assess, design, implement, manage and maintain information security solutions that protect our customers’ critical business data and protects against loss of client loyalty, corporate reputation and disruptions in ongoing operations. We offer cyber risk management, infrastructure security and managed security solutions to our clients. Through our Next Generation Risk Management (“NGRM”), we provide comprehensive risk assessments, detailed reporting, ongoing reviews, process and program development, and training services. NGRM ensures that identified vulnerabilities are mitigated and business risk has been properly addressed. Because our customers’ infrastructures are constantly changing, our NGRM offering is structured as a recurring service with regular periodic assessments of the current security posture combined with ongoing monitoring and surveillance through our 7x24 Security Operations Centers. Our experience spans all major verticals including retail, education, healthcare, government, banking, pharmaceutical and others. We have expertise with the Health Insurance Portability and Accountability Act of 1996, as amended (“HIPAA”), Payment Card Industry Data Security Standard (“PCI DSS”), the Federal Information Security Management Act (“FISMA”), the Sarbanes-Oxley Act of 2002 (the “Sarbanes-Oxley Act”) and others. We help our clients design and implement information security programs consistent with industry best practices and comply with the regulatory mandates of their specific vertical that are flexible enough to help ensure information security in an ever-changing risk environment. Findings, recommendations and real time security posture status, including our proprietary Risk Management Score, are provided through a 7x24 portal that is accessible by our clients and is updated with the up to date vulnerabilities identified by several industry sources.
We help our clients establish both technical and non-technical security controls and practices to prevent, detect, correct and minimize the risk of loss or damage to information resources, disruption of access to information resources, and unauthorized disclosure of information. In addition to our NGRM program, we offer options for security strategy program development, security awareness training, technology exposure assessments and incident response.
We offer our end-to-end solutions through our full lifecycle model. Our lifecycle approach is delivered through professional services, which includes strategy and consulting, solutions design, testing and configuration and custom deployment, as well as project management and technology acquisition, managed services and maintenance and support. Once a solution has been designed and agreed upon, our engineers provide expert implementation and integration of the customized solution into the client’s IT environment. As part of deployment, we stage and test solutions before installing
| 7 | See Gartner note (6) in the section titled “Market, Industry and Other Data.” |
6
Table of Contents
them and then coordinate resources and manage timelines to make sure we deliver according to our client’s exact specifications. Once a solution has been deployed, we provide managed maintenance and support services to ensure our clients IT environments are operating according to plan. As part of our ongoing support, we help our clients identify areas where they can further strengthen their IT solutions.
| Presidio’s Lifecycle Model
|

Our ability to provide a full lifecycle of services creates multiple ongoing touch points with our clients, which we believe drives deep client relationships and high satisfaction because we are able to serve as the single source for their IT solutions needs.
Our Go-to-market Approach
Our approach is to deliver engineering and services-led solutions to best meet our clients’ evolving IT needs. We have built an innovative and flexible organization with a proven history of identifying and capitalizing on disruptive technologies and market transitions. As of June 30, 2016, we have over 500 direct sales professionals and a team of approximately 1,600 engineers across more than 60 offices nationally who we believe provide high-quality, consistent service to our clients. Our model is focused on developing long-standing, deep relationships through local touch-points, combined with strong technical expertise and the ability to provide an end-to-end solution to solve our clients’ complex IT needs. Our relationships with our clients extend beyond the solutions we provide to include full lifecycle services such as managed services, maintenance and support, which drive our ongoing client engagement. Our service-led model resulted in 92% of our revenue for our fiscal year ended June 30, 2016 coming from clients that purchased our services. We believe the differentiated combination of our national scale, local reach, technology expertise, end-to-end solution capabilities and full lifecycle services separates us from other providers in the market.
7
Table of Contents
Our vendor-agnostic approach to the market allows us to develop optimal solutions based on what we view as the best mix of technologies. Our best-of-breed philosophy is a significant differentiator versus reseller and fulfillment models. Rather than responding to simple procurement requests, we advise clients on solutions that drive business transformation. We then design the solutions with what we view as the best technologies available.
To cater to certain clients’ desires to lower capital expenditures, we offer flexible consumption models. For example, we have the ability to deliver our full range of IT solutions in an ITaaS model. This provides clients with the option to consume technology “as a service,” accessing and paying for technology as it is consumed.
Our Competitive Strengths
Leading Provider of IT Solutions to the Middle Market
We focus on serving the attractive middle-market segment of the IT Services market. The middle market is one of the fastest growing segments of the overall IT Services market. We believe this is due to the strong demand for IT expertise in the segment, the massive number of companies in the segment and significant under-penetration in the segment. We believe we have created a compelling brand and reputation as a leading provider of enterprise-class IT solutions. We have a differentiated combination of national scale, local reach, technology expertise, end-to-end solution capabilities and full lifecycle services that we believe separates us from other providers in the market. Our ability to provide end-to-end solutions and solve complex needs has allowed us to become a partner of choice for our middle-market clients.
End-to-end Enterprise-class Solutions
We deliver our end-to-end solutions through a full lifecycle model, which combines consulting, engineering, managed services and technology to give us a significant competitive advantage compared to other IT providers. We believe that businesses increasingly seek a single provider of integrated multi-vendor, multi-technology solutions for their complex and mission-critical IT needs. Our ability to take a client’s high-level vision and distill it into a tangible IT roadmap is a key differentiator for our company; it requires a high degree of investment and technical know-how across technologies that would be difficult and costly to replicate. Our solutions enhance the technology capabilities that our clients believe are most important to their businesses by empowering enhanced productivity and expanded offerings to their clients. With our clients, our lifecycle approach allows for ongoing engagement across new projects and upgrades, as well as ongoing managed services and support. This service-led model resulted in 92% of our revenue for our fiscal year ended June 30, 2016 coming from clients that purchased our services.
Cutting-edge Technology Capabilities with a Proven Record of Capitalizing on Technological Shifts
We believe that our flexible business model has enabled us to stay at the forefront of technology trends and develop a strong track record of growing across technology innovation cycles. We actively make organic and inorganic investments in the future of IT solutions, including multi-cloud, IoT, security and managed services. Recent examples of solutions developed for clients include our connected-vehicle solutions, Presidio Managed Cloud and our proprietary NGRM security offering. To ensure our clients have access to a wide range of technologies and best-of-breed solutions, we have developed strong relationships with over 500 original equipment manufacturers (“OEMs”) as of June 30, 2016. We partner with leading IT providers, such as Cisco, Citrix, Dell, EMC, F5, NetApp and VMware, as well as with emerging OEMs who specialize in next-generation technology such as Arista, FireEye, Nutanix, Palo Alto and Pure. We also partner with cloud service providers, such as Amazon Web Services and Microsoft Azure, to help our clients capitalize on public and multi-cloud environments.
8
Table of Contents
National Scale with Local Relationships Driven by an Industry-leading Team of Engineers
While we operate on a national scale, our go-to-market approach is highly localized, helping to ensure a high degree of connectivity and continuity with our clients. Our solutions capability is powered by our services-led organization with specialized expertise across over 60 offices in the United States and over 2,800 employees nationally (in each case, as of June 30, 2016) to provide a high degree of connectivity with our clients. We deploy our end-to-end IT solutions through our team of approximately 1,600 engineers as of June 30, 2016, providing our middle-market client base with expertise that is difficult to replicate in-house. Our productive sales force, combined with our strong consulting capabilities, drive what we believe is our industry-leading engineer-to-sales-person ratio. We believe that the talent, experience and credibility of our engineering team help make us a preferred provider for advanced IT solutions.
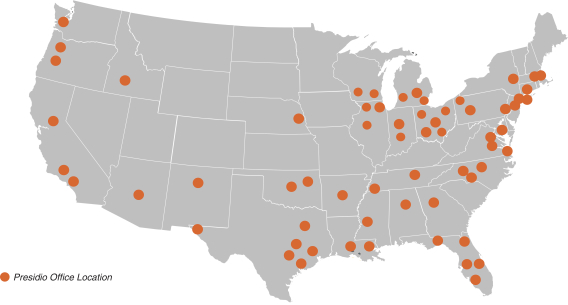
The following map shows our office locations, which we believe demonstrates our broad geographic reach.
| Presidio’s Geographic Footprint
|
Broad and Loyal Client Base
As of June 30, 2016, we have approximately 7,000 clients, primarily in the middle market and government segments. In addition, we also serve clients that have grown beyond the middle market, as well as targeted large enterprises. Our clients span a number of large and economically important verticals, including financial services, healthcare, professional services, retail, media and education, as well as local and federal government. Our broad client base provides us a diversified and reoccurring revenue opportunity that helps us grow across economic and technology cycles. Our high-touch, lifecycle approach has resulted in strong client satisfaction, as demonstrated by our NPS of 49 in 2014, 59 in 2015 and 65 in 2016, which compares very favorably to the Tech Vendor NPS Benchmark, 2016 (B2B) average score of 30 according to Temkin Group. This positive client satisfaction helps drive our long-term and expanding client relationships. Since 2014, we have grown the number of clients to whom we have sold solutions across all three of our solutions areas from approximately 900 to approximately 1,600. Our relationship with our top 25 clients averages over six years. Our clients are loyal and continue to rely on us for services and new solutions, as evidenced by the fact that clients comprising 95% of our fiscal 2013 revenue made repeat purchases during our 2014 to 2016 fiscal years. We have grown the number of clients that produced more than $100,000 of revenue from approximately 1,900 in fiscal 2014 to 2,150 in fiscal 2016.
9
Table of Contents
Strong Domain Expertise
Our engineers develop custom solutions for clients within specific technologies and verticals and drive them across our national network. We have expertise in digital infrastructure, cloud and security solutions, and we have a deep understanding of the emerging trends, technologies and best practices. Our extensive experience with a broad set of technologies allows us to create differentiated and best-in-class solutions, which we expect to be increasingly important as IT solutions become more multi-vendor and tailored for clients. Across our national platform, we develop insights into the specific IT challenges facing our clients, which provide us with a significant advantage in developing superior solutions and winning new clients. We are able to leverage this domain expertise within and across verticals and technologies. Our ability to replicate and scale our knowledge and practices greatly enhances our efficiency and the quality of our solutions. Through our proprietary iConnect internal intranet, Presidio engineering and sales teams are able to access prior work product including successful proposals, scopes of work, design and as-built drawings, configurations and technical training. By leveraging this knowledge base, our professionals are able to quickly and efficiently respond to new opportunities with validated technical details based on previous work for that client or another of a similar size or in a similar vertical.
Our Growth Strategies
Expand and Deepen Relationships with Existing Clients
We have a long history of expanding revenue from existing clients by selling additional solutions based on their evolving needs. Our sales force and consulting teams grew our revenue per existing client (exclusive of Netech) from $382,000 in our fiscal year ended June 30, 2014 to $459,000 in our fiscal year ended June 30, 2016 by expanding the breadth of technical solutions we provide and further penetrating our client base. We believe increasing complexity in the market, combined with our end-to-end IT solutions and our high-touch, lifecycle approach, position us for continued growth. This approach has resulted in strong client satisfaction and increasing client engagement that we believe will enable us to continue expanding our revenue per client as our clients leverage our expertise to adopt emerging technologies. As middle-market businesses embrace cloud capabilities and enhance digital security, we believe we are well positioned to capture increased spend from our existing client relationships.
Develop New Client Relationships
We believe the diverse and fragmented nature of the North American IT Services market provides us with a significant opportunity to further grow our client base. We have developed domain expertise managing complex technologies and vertical specific-challenges, which makes us a compelling choice for potential clients looking for an IT solutions partner. Our efforts to develop new client relationships are supported by our existing, referenceable client base. With our technological capabilities and proven record of success with clients, we are well positioned to acquire more clients as the need grows for consulting, deployment, integration and managed services. We also conduct highly coordinated marketing and sales activities using the strength of the Presidio brand to win new clients and penetrate highly localized markets. In these markets, we are well positioned against smaller, regional IT providers who lack the resources to invest in increasingly advanced IT solutions.
Develop and Offer New Services and Solutions
We focus on providing our clients with the highest quality, optimal solutions for their complex IT needs. We have developed innovative solutions for our clients across technology cycles and are currently developing and providing solutions based on emerging IT trends. Digital Infrastructure, Cloud and Security are some of the fastest growing areas of IT spend and we are focused on developing and deploying new solutions to serve these markets. For example, we have a proprietary connected-vehicle solution, Presidio Managed Cloud and NGRM security offering that help solve complex IT problems associated with these trends. Through our national team of engineers, we maintain institutional knowledge and services capabilities that are adaptable, scalable and transferrable. We are constantly improving our offerings and developing new services and solutions for our clients, which we expect to drive incremental growth from existing and new clients.
10
Table of Contents
Further Penetrate the North American Market
We have been expanding our geographic footprint in North America organically and inorganically and see new opportunities in several major regions. We take a deliberate and strategic approach to deciding which markets to pursue and consider a number of factors. Our expertise and solutions are scalable from region to region, so as we continue to expand we expect to take market share and create opportunities in new markets. For example, through organic investment in the Great Lakes region we generated a revenue CAGR of 36% from fiscal year 2012 to fiscal year 2016 in that region. Over that time period, we expanded our sales organization in key markets in Chicago, Indianapolis, Detroit, Cincinnati and Cleveland, and at the same time we made investments in engineering personnel to support our expanded activities in the region.
Pursue Strategic Acquisitions
We expect to continue to consider strategic acquisitions that can increase our technology expertise and geographic presence. We believe that our M&A strategy enhances and augments all of our growth avenues, including gaining capabilities, cross-selling to our existing clients and entering new markets and verticals. Since 2004, we have acquired and successfully integrated ten companies, capitalizing on our scale, client relationships and vendor partnerships to drive margin expansion post-acquisition. In 2015, we acquired Sequoia, a consulting, integration and services company headquartered in California, which provides us with improved cloud consulting and integration capabilities. Most recently, in 2016, we acquired Netech, an IT solutions provider headquartered in Michigan, which provides us with 11 offices to penetrate significant opportunities in the Midwestern United States. We have been successful at integrating our acquisitions and at retaining key management talent. These acquisitions are complementary with new office openings and the organic expansion of our presence in existing geographic markets. We expect to continue to selectively pursue acquisition opportunities within the highly fragmented IT solutions market, with a focus on enhancing our solutions offerings and geographic presence.
Our History
Since our founding in 2004, the hallmarks of our culture have centered around client service and collaboration. Our business model has been defined by delivering engineering- and services-led solutions using a cost-effective, localized model that leverages a powerful OEM vendor ecosystem. This formula has driven our internal organic growth while at the same time setting the criteria for identifying acquisition opportunities. From our 2012 fiscal year to our 2016 fiscal year, we have grown our revenue from $1.76 billion to $2.71 billion, representing an 11% CAGR, which is significantly faster than U.S. IT spending and U.S. real GDP, which have grown at 2.1% and 1.9%, respectively, over the same periods, according to Gartner8 and the Bureau of Economic Analysis, respectively.9
We are led by Chief Executive Officer Bob Cagnazzi, Chief Financial Officer Paul Fletcher, Chief Operating Officer Dave Hart and Chief Technology Officer Vinu Thomas. They are joined by a management team with an extensive track record of performance and execution, drawing on approximately 280 collective years of experience in the North American IT solutions markets. Our senior leadership team is backed by a deep bench of management and technology talent that we believe provides us with a pipeline of future leaders and innovators.
Under this team’s leadership, we have entered new geographies and adjacent technologies and achieved above-market growth. Presidio has grown into a national business with the scale and capability to serve a diverse set of end markets and technology challenges. We believe that the depth and extensive industry experience of our management team will serve to provide solid leadership for continued growth and profitability.
| 8 | See Gartner notes (1) and (7) in the section titled “Market, Industry and Other Data.” |
| 9 | Source: Bureau of Economic Analysis—U.S. Department of Commerce, “NIPA Tables.” |
11
Table of Contents
Acquisitions
We have a long and successful track record of growing and improving our business and retaining key personnel through strategic tuck-in acquisitions. Since 2004, we have made ten strategic acquisitions. We acquire assets to improve our technology expertise and expand our geographic footprint. Recent examples include:
| • | In 2016, we acquired Netech to expand our reach in the U.S. Midwest / Great Lakes region; |
| • | In 2015, we acquired Sequoia to improve our highly specialized cloud professional services; |
| • | In 2012, we acquired BlueWater Communications to expand our portfolio of advanced IT solutions and managed services; and |
| • | In 2011, we acquired INX to broaden our portfolio of services and solutions and to significantly expand our footprint across the United States. |
Through this experience we have created specific methodologies and processes related to the identification and integration of targets.
Risk Factors
Investing in our common stock involves substantial risk. You should carefully consider all of the information in this prospectus prior to investing in our common stock. There are several risks related to our business and our ability to leverage our strengths that are described under “Risk Factors.” Among these important risks are the following:
| • | our reliance on key vendors and any potential termination of those relationships; |
| • | the role of rapid innovation and the introduction of new products in our industry; |
| • | our ability to compete effectively in a competitive industry; |
| • | risks pertaining to our substantial level of indebtedness; and |
| • | risks associated with investing in a controlled company. |
Our Sponsor
AP VIII Aegis Holdings, L.P. (“Aegis LP”) is the beneficial owner of most of our common stock. See “Principal Stockholders.” AP VIII Aegis Holdings GP, LLC (“Aegis GP”) is the general partner of Aegis LP and Apollo Investment Fund VIII, L.P. (“Apollo VIII”), Apollo Overseas Partners VIII, L.P. (“Apollo Overseas VIII”), Apollo Overseas Partners (Delaware) VIII, L.P. (“Apollo Overseas Delaware”) and Apollo Overseas Partners (Delaware 892) VIII, L.P. (“Apollo Overseas Delaware 892”) (collectively, the “Equity Funds”) are members of Aegis GP. Apollo VIII serves as the investment manager of the Equity Funds and as the non-member manager of Aegis GP. Apollo Management, L.P. (“Apollo Management”) is the sole member and manager of Apollo VIII and Apollo Management GP, LLC (“Apollo Management GP”) is the general partner of Apollo Management. Apollo Management Holdings, L.P. (“Management Holdings”) is the sole member and manager of Apollo Management GP and Apollo Management Holdings GP, LLC (“Management Holdings GP”) is the general partner of Management Holdings. Leon Black, Joshua Harris and Marc Rowan are the managers, as well as executive officers, of Management Holdings GP. The address of each of the entities and individuals, respectively, listed in this paragraph is 9 West 57th Street, New York, New York 10019.
12
Table of Contents
Founded in 1990, Apollo is a leading global alternative investment manager with offices in New York, Los Angeles, Houston, Chicago, Bethesda, Toronto, London, Frankfurt, Madrid, Luxembourg, Mumbai, Delhi, Singapore, Hong Kong and Shanghai. As of December 31, 2016, Apollo had assets under management of approximately $192 billion in private equity, credit and real estate funds, invested across a core group of nine industries in which Apollo has considerable knowledge and resources. For more information about Apollo, please visit www.agm.com. Information contained on Apollo’s website is not intended to form a part of or be incorporated by reference into this prospectus.
Additional Information
We were incorporated in Delaware on November 20, 2014 under the name Aegis Holdings, Inc. On September 15, 2016, we changed our name to Presidio, Inc. Our principal executive offices are located at One Penn Plaza, Suite 2832, New York, New York 10119 and our telephone number is (212) 652-5700. We also maintain a website at http://www.Presidio.com. Our website and the information contained therein or connected thereto shall not be deemed to be incorporated into this prospectus or the registration statement of which this prospectus forms a part and you should not rely on any such information in making your decision whether to purchase our common stock.
13
Table of Contents
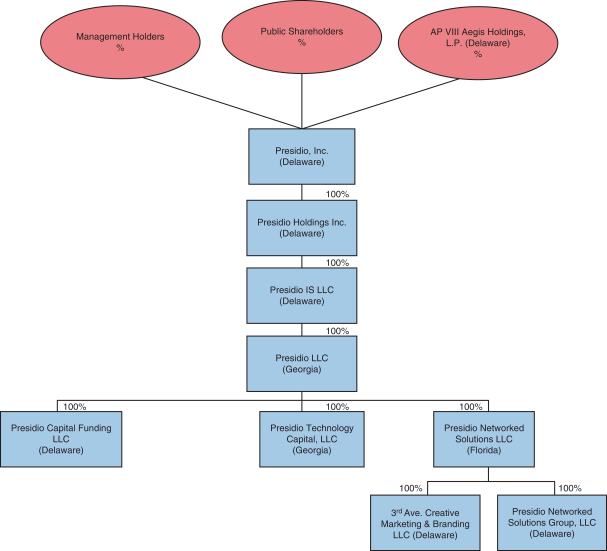
Ownership and Organizational Structure
The following diagram sets forth our ownership and organizational structure immediately following the completion of this Offering. See “Principal Stockholders” and “Capitalization.”
14
Table of Contents
THE OFFERING
| Common stock offered |
shares. |
| Underwriters’ option to purchase additional shares |
shares. |
| Common stock to be outstanding after this Offering |
shares ( shares if the underwriters exercise their option to purchase additional shares in full). |
| Listing |
We have applied to list our common stock on the NASDAQ under the symbol “PSDO.” |
| Use of proceeds |
Assuming an initial public offering price of $ per share, which is the midpoint of the price range set forth on the cover page of this prospectus, we estimate that the net proceeds to us from the sale of our common stock will be $ million (or $ million if the underwriters exercise in full their option to purchase additional shares of common stock from us), after deducting estimated underwriting discounts and commissions and estimated offering expenses payable by us. |
| We intend to use the net proceeds from this Offering as follows: |
(a) We intend to use approximately $ million of the net proceeds from this Offering to repurchase all of our outstanding Subordinated Notes, of which $111.8 million in aggregate principal amount are currently outstanding, at a purchase price of 110.25% of the principal amount thereof, plus accrued and unpaid interest, if any, up to but excluding the date of such repurchase (the “Subordinated Notes Repurchase Price”). If the net proceeds from this Offering are not sufficient to repurchase all of our outstanding Subordinated Notes at such price, we will purchase a lesser aggregate principal amount of Subordinated Notes with the available net proceeds. The Subordinated Notes accrue interest at a rate equal to 10.25% per annum and will mature on February 15, 2023.
(b) We intend to use approximately $ million of the net proceeds from this Offering to redeem $97.5 million in aggregate principal amount of our Senior Notes at a redemption price of 110.25% of the principal amount thereof, plus accrued and unpaid interest, if any, up to but excluding the date of such redemption. Net proceeds from this Offering will be applied first, to repurchase up to all of our Subordinated Notes, and second, to redeem up to $97.5 million in aggregate principal amount of our Senior Notes, as described above. If the net proceeds from this Offering are not sufficient to redeem $97.5 million in aggregate principal amount of our Senior Notes at such price after repurchasing all of our outstanding Subordinated Notes, as described above, we will redeem a lesser aggregate principal amount of Senior Notes with the available net proceeds. The Senior Notes accrue interest at a rate equal to 10.25% per annum and will mature on February 15, 2023.
(c) To the extent any net proceeds from this Offering remain after repurchasing all of our Subordinated Notes and redeeming $97.5 million in aggregate principal amount of our Senior Notes, we intend to use such remaining net proceeds for working capital or general corporate purposes,
15
Table of Contents
including the repayment of amounts outstanding under our February 2015 Credit Agreement or our Receivables Securitization Facility (each as defined herein). Borrowings under the February 2015 Credit Agreement bear interest at a rate equal to either (a) a LIBOR rate determined by reference to the costs of funds for Eurodollar deposits for the interest period relevant to such borrowing, adjusted for certain additional costs, subject to a 1.00% floor in the case of term loans, plus a margin of 3.50% (or, after a qualifying initial public offering and subject to other conditions as described herein, 3.25%), or (b) a base rate plus 1.00%, in each case, plus a margin of 2.50%. Borrowings under the Receivables Securitization Facility bear interest based on a Eurodollar borrowing rate plus a utilized program fee of 1.40%. See “Description of Certain Indebtedness.”
| Controlled company |
After the completion of this Offering, the Apollo Funds will continue to own a majority of the voting power of our outstanding common stock. As a result, we expect to be a “controlled company” within the meaning of the corporate governance standards of the NASDAQ. See “Principal Stockholders.” |
| Dividends |
We currently expect to retain all available funds and any future earnings for use in the operation and expansion of our business. We do not currently anticipate paying dividends on our common stock following this Offering. Any declaration and payment of future dividends to holders of our common stock may be limited by restrictive covenants in our debt agreements and will be at the sole discretion of our Board of Directors and will depend on many factors, including our financial condition, earnings, capital requirements, level of indebtedness, statutory and contractual restrictions applying to the payment of dividends and other considerations that our Board of Directors deems relevant. See “Dividend Policy.” |
| Risk factors |
You should carefully read and consider the information set forth under “Risk Factors,” beginning on page 24 of this prospectus, and all the other information set forth in this prospectus before investing in our stock. |
| Conflicts of interest |
The Apollo Funds own in excess of 10% of our issued and outstanding ordinary shares. An alternative investment vehicle formed by the limited partners of the Apollo Funds owns substantially all of the economic interests in the Subordinated Notes pursuant to certain derivative arrangements entered into with Deutsche Bank AG and, therefore, will receive in excess of 5% of the net proceeds of this Offering. Because the Apollo Funds are affiliated with Apollo Global Securities, LLC, an underwriter on this Offering, Apollo Global Securities, LLC is deemed to have a “conflict of interest” under Rule 5121 (“Rule 5121”) of the Financial Industry Regulatory Authority, Inc. (“FINRA”). Accordingly, this Offering will be conducted in accordance with Rule 5121. Pursuant to that rule, the appointment of a “qualified independent underwriter” is not required in connection with this Offering as the members primarily responsible for managing the public offering do not have conflict of interest, are not affiliates of any member that has conflict of interest and meet the requirements of paragraph (f)(12)(E) of FINRA Rule 5121. See “Underwriting (Conflicts of Interest).” |
16
Table of Contents
Unless otherwise noted, references in this prospectus to the number of shares outstanding exclude:
| • | shares of our common stock issuable upon the exercise of options outstanding as of December 31, 2016 at a weighted average exercise price of $ per share; and |
| • | shares of common stock reserved for issuance under our share-based compensation plans. |
Unless otherwise indicated, the information contained in this prospectus assumes:
| • | no exercise of the underwriters’ option to purchase additional shares; |
| • | an initial public offering price of $ , which is the midpoint of the price range set forth on the cover page of this prospectus; |
| • | the filing of our amended and restated certificate of incorporation (the “Amended Certificate”), and the adoption of our amended and restated bylaws (the “Amended Bylaws”), each of which will become effective prior to the consummation of this Offering; and |
| • | the completion of a -for- split of our common stock, which was effected prior to the consummation of this Offering on , 2017 (the “Stock Split”). As a result of the Stock Split, the shares of our common stock then outstanding were converted into shares of our common stock. |
17
Table of Contents
SUMMARY HISTORICAL AND PRO FORMA FINANCIAL INFORMATION
The following tables present our summary historical and pro forma financial data for the periods presented. The summary historical consolidated statements of operations for the six months ended December 31, 2016 and 2015 and the summary historical consolidated balance sheet information as of December 31, 2016 have been derived from our unaudited interim consolidated financial statements, included elsewhere in this prospectus. The summary historical statements of operations for the fiscal year ended June 30, 2016, the Successor period from November 20, 2014 to June 30, 2015, the Predecessor period from July 1, 2014 to February 1, 2015 and the fiscal year ended June 30, 2014 and the summary historical balance sheet information as of June 30, 2016 and 2015 have been derived from our audited historical consolidated financial statements, included elsewhere in this prospectus.
The unaudited interim consolidated financial statements have been prepared on the same basis as the audited consolidated financial statements and, in the opinion of our management, consist only of normal and recurring adjustments necessary for a fair presentation of the information set forth herein.
The summary pro forma condensed consolidated statement of operations for the six months ended December 31, 2016 and the summary pro forma condensed consolidated balance sheet information as of December 31, 2016 have been derived from our unaudited condensed consolidated financial statements, included elsewhere in this prospectus and have been adjusted to reflect the completion of this Offering, and the resulting capital structure upon consummation of this Offering, including the issuance of common stock and the use of proceeds therefrom, as described under “Use of Proceeds” to the extent they have not been fully reflected in the historical consolidated financial statements. The summary pro forma condensed consolidated statement of operations for the fiscal year ended June 30, 2016 has been derived from our condensed consolidated financial statements, included elsewhere in this prospectus and has been adjusted to reflect the completion of this Offering, and the resulting capital structure upon consummation of this Offering, including the issuance of common stock and the use of proceeds therefrom, as described under “Use of Proceeds,” to the extent they have not been fully reflected in the historical consolidated financial statements. The unaudited pro forma condensed consolidated balance sheet gives effect to transactions as if they had occurred on December 31, 2016. The unaudited pro forma condensed consolidated statement of operations for the six months ended December 31, 2016 gives effect to the transactions described above as if they had occurred on July 1, 2015. The unaudited pro forma condensed consolidated statement of operations for the fiscal year ended June 30, 2016 gives effect to the transactions described above as if they had occurred on July 1, 2015.
The unaudited pro forma condensed consolidated financial information set forth below is based upon available information and assumptions that we believe are reasonable. The unaudited pro forma condensed consolidated financial information is for illustrative and informational purposes only and is not intended to represent or be indicative of what our financial condition or results of operations would have been had the above transactions occurred on the dates indicated. The unaudited pro forma condensed consolidated financial information also should not be considered representative of our future financial condition or results of operations.
On February 2, 2015, the Apollo Funds completed the Presidio Acquisition. Under the terms of the Presidio Acquisition, Presidio Holdings Inc. (the Predecessor) became a wholly owned subsidiary of Presidio, Inc. (the Successor). As a result of the Presidio Acquisition, the financial information for all periods ending on or after February 2, 2015 represent the financial information of the Successor. Periods ending prior to February 2, 2015 represent the financial information of the Predecessor. From November 20, 2014 (its date of inception) to February 1, 2015, the Successor had no operations or activities other than the incurrence of transaction costs related to the Presidio Acquisition.
18
Table of Contents
The following financial information should be read in conjunction with “Selected Historical Consolidated Financial Data,” “Unaudited Pro Forma Condensed Consolidated Financial Information” and “Management’s Discussion and Analysis of Financial Condition and Results of Operations,” and our historical consolidated financial statements and the related notes included elsewhere in this prospectus. Historical results are not necessarily indicative of the results to be expected in the future, and interim financial results are not necessarily indicative of results that may be expected for the full fiscal year.
| Predecessor | Successor | Pro Forma | ||||||||||||||||||||||||||||||
| (in millions, except share and per share data) |
Fiscal year ended June 30, 2014 |
July 1, 2014 to February 1, 2015 |
November 20, 2014 to June 30, 2015 |
Fiscal year ended June 30, 2016 |
Six months ended December 31, 2015 |
Six months ended December 31, 2016 |
Fiscal year ended June 30, 2016 |
Six months ended December 31, 2016 |
||||||||||||||||||||||||
| Statement of operations data: |
||||||||||||||||||||||||||||||||
| Revenue |
$ | 2,266.0 | $ | 1,392.8 | $ | 985.5 | $ | 2,714.9 | $ | 1,374.6 | $ | 1,459.5 | $ | $ | ||||||||||||||||||
| Gross margin |
$ | 454.0 | $ | 289.3 | $ | 197.0 | $ | 540.6 | $ | 269.8 | $ | 291.5 | $ | $ | ||||||||||||||||||
| Operating income |
$ | 91.5 | $ | 26.8 | $ | 10.6 | $ | 98.9 | $ | 66.2 | $ | 57.8 | $ | $ | ||||||||||||||||||
| Net income (loss) |
$ | 32.5 | $ | (5.1 | ) | $ | (24.3 | ) | $ | (3.4 | ) | $ | 10.5 | $ | 9.0 | $ | $ | |||||||||||||||
| Earnings (loss) per share: |
||||||||||||||||||||||||||||||||
| Basic |
$ | 0.06 | $ | (0.01 | ) | $ | (0.69 | ) | $ | (0.10 | ) | $ | 0.30 | $ | 0.25 | $ | $ | |||||||||||||||
| Diluted |
$ | 0.06 | $ | (0.01 | ) | $ | (0.69 | ) | $ | (0.10 | ) | $ | 0.29 | $ | 0.24 | $ | $ | |||||||||||||||
| Weighted average shares used to compute earnings (loss) per share: |
||||||||||||||||||||||||||||||||
| Basic |
561,829,775 | 561,886,602 | 35,005,269 | 35,558,981 | 35,264,021 | 35,967,493 | ||||||||||||||||||||||||||
| Diluted |
572,656,299 | 561,886,602 | 35,005,269 | 35,558,981 | 36,052,159 | 37,312,195 | ||||||||||||||||||||||||||
| Balance sheet data (at end of period): |
||||||||||||||||||||||||||||||||
| Cash and cash equivalents |
$ | 8.5 | $ | 88.3 | $ | 33.0 | $ | 45.5 | ||||||||||||||||||||||||
| Total assets |
1,545.0 | 2,444.4 | 2,623.1 | 2,675.8 | ||||||||||||||||||||||||||||
| Total long-term debt |
618.7 | 933.7 | 1,038.0 | 1,008.1 | ||||||||||||||||||||||||||||
| Total liabilities |
1,448.5 | 2,108.6 | 2,276.2 | 2,318.8 | ||||||||||||||||||||||||||||
| Total stockholders’ equity |
96.5 | 335.8 | 346.9 | 357.0 | ||||||||||||||||||||||||||||
| Cash dividends declared per common share |
$ | 0.46 | $ | — | $ | — | $ | — | ||||||||||||||||||||||||
| Other financial data: |
||||||||||||||||||||||||||||||||
| Adjusted Revenue (1) |
$ | 2,149.9 | $ | 1,323.4 | $ | 940.8 | $ | 2,683.7 | $ | 1,342.9 | $ | 1,460.0 | $ | $ | ||||||||||||||||||
| Adjusted EBITDA (2) |
$ | 167.0 | $ | 116.2 | $ | 68.6 | $ | 211.1 | $ | 116.6 | $ | 112.9 | $ | $ | ||||||||||||||||||
| Adjusted EBITDA |
7.8 | % | 8.8 | % | 7.3 | % | 7.9 | % | 8.7 | % | 7.7 | % | % | % | ||||||||||||||||||
| Adjusted Net Income (4) |
$ | 81.7 | $ | 58.6 | $ | 13.4 | $ | 81.2 | $ | 47.9 | $ | 46.9 | $ | $ | ||||||||||||||||||
| Adjusted Net Income per share: |
||||||||||||||||||||||||||||||||
| Basic |
$ | 0.15 | $ | 0.10 | $ | 0.38 | $ | 2.28 | $ | 1.36 | $ | 1.30 | $ | $ | ||||||||||||||||||
| Diluted |
$ | 0.14 | $ | 0.10 | $ | 0.38 | $ | 2.23 | $ | 1.33 | $ | 1.26 | $ | $ | ||||||||||||||||||
| Weighted average shares used to compute Adjusted Net Income per share: (5) |
||||||||||||||||||||||||||||||||
| Basic |
561,829,775 | 561,886,602 | 35,005,269 | 35,558,981 | 35,264,021 | 35,967,493 | ||||||||||||||||||||||||||
| Diluted |
572,656,299 | 593,353,683 | 35,655,707 | 36,415,101 | 36,052,159 | 37,312,195 | ||||||||||||||||||||||||||
| (1) | We define Adjusted Revenue as revenue adjusted to exclude (i) revenue generated by disposed businesses and (ii) noncash purchase accounting adjustments to revenue as a result of our acquisitions. The following table presents a reconciliation of Adjusted Revenue from Revenue. |
19
Table of Contents
| Predecessor | Successor | Pro Forma | ||||||||||||||||||||||||||||||
| (in millions) | Fiscal year ended June 30, 2014 |
July 1, 2014 to February 1, 2015 |
November 20, 2014 to June 30, 2015 |
Fiscal year ended June 30, 2016 |
Six months ended December 31, 2015 |
Six months ended December 31, 2016 |
Fiscal year ended June 30, 2016 |
Six months ended December 31, 2016 |
||||||||||||||||||||||||
| Revenue |
$ | 2,266.0 | $ | 1,392.8 | $ | 985.5 | $ | 2,714.9 | $ | 1,374.6 | $ | 1,459.5 | $ | $ | ||||||||||||||||||
| Adjustments: |
||||||||||||||||||||||||||||||||
| Revenue from disposed business (a) |
(116.1 | ) | (69.4 | ) | (46.0 | ) | (32.8 | ) | (32.8 | ) | — | |||||||||||||||||||||
| Purchase accounting adjustments (b) |
— | — | 1.3 | 1.6 | 1.1 | 0.5 | ||||||||||||||||||||||||||
|
|
|
|
|
|
|
|
|
|
|
|
|
|
|
|
|
|||||||||||||||||
| Total adjustments |
(116.1 | ) | (69.4 | ) | (44.7 | ) | (31.2 | ) | (31.7 | ) | 0.5 | |||||||||||||||||||||
|
|
|
|
|
|
|
|
|
|
|
|
|
|
|
|
|
|||||||||||||||||
| Adjusted Revenue |
$ | 2,149.9 | $ | 1,323.4 | $ | 940.8 | $ | 2,683.7 | $ | 1,342.9 | $ | 1,460.0 | $ | $ | ||||||||||||||||||
|
|
|
|
|
|
|
|
|
|
|
|
|
|
|
|
|
|||||||||||||||||
| (a) | “Revenue from disposed business” represents the removal of the historical revenue of Atlantix prior to the sale of the business. |
| (b) | “Purchase accounting adjustments” includes the noncash reduction to revenue associated with deferred revenue step down fair value adjustments in connection with purchase accounting. |
| (2) | We define Adjusted EBITDA as net income (loss) plus (i) total depreciation and amortization, (ii) interest and other (income) expense and (iii) income tax expense (benefit), as further adjusted to eliminate noncash share-based compensation expense, purchase accounting adjustments, transaction costs, other costs and earnings from disposed business. The following table presents a reconciliation of Adjusted EBITDA from Net income (loss). |
| Predecessor | Successor | Pro Forma | ||||||||||||||||||||||||||||||
| (in millions) | Fiscal year ended June 30, 2014 |
July 1, 2014 to February 1, 2015 |
November 20, 2014 to June 30, 2015 |
Fiscal year ended June 30, 2016 |
Six months ended December 31, 2015 |
Six months ended December 31, 2016 |
Fiscal year ended June 30, 2016 |
Six months ended December 31, 2016 |
||||||||||||||||||||||||
| Adjusted EBITDA Reconciliation: |
||||||||||||||||||||||||||||||||
| Net income (loss) |
$ | 32.5 | $ | (5.1 | ) | $ | (24.3 | ) | $ | (3.4 | ) | $ | 10.5 | $ | 9.0 | $ | $ | |||||||||||||||
| Total depreciation and amortization (a) |
50.6 | 24.9 | 32.1 | 81.7 | 38.0 | 43.6 | ||||||||||||||||||||||||||
| Interest and other (income) expense |
34.6 | 28.7 | 47.5 | 98.5 | 46.5 | 42.5 | ||||||||||||||||||||||||||
| Income tax expense (benefit) |
24.4 | 3.2 | (12.6 | ) | 3.8 | 9.2 | 6.3 | |||||||||||||||||||||||||
|
|
|
|
|
|
|
|
|
|
|
|
|
|
|
|
|
|||||||||||||||||
| EBITDA |
142.1 | 51.7 | 42.7 | 180.6 | 104.2 | 101.4 | ||||||||||||||||||||||||||
| Adjustments: |
||||||||||||||||||||||||||||||||
| Share-based compensation expense |
5.5 | 20.1 | 1.0 | 2.2 | 1.2 | 1.0 | ||||||||||||||||||||||||||
| Purchase accounting adjustments (b) |
— | — | 4.9 | 3.9 | 2.2 | 0.6 | ||||||||||||||||||||||||||
| Transaction costs (c) |
14.8 | 42.6 | 21.3 | 20.6 | 8.9 | 6.0 | ||||||||||||||||||||||||||
| Other costs (d) |
13.0 | 4.5 | 1.9 | 5.6 | 1.9 | 3.9 | ||||||||||||||||||||||||||
| Earnings from disposed business (e) |
(8.4 | ) | (2.7 | ) | (3.2 | ) | (1.8 | ) | (1.8 | ) | — | |||||||||||||||||||||
|
|
|
|
|
|
|
|
|
|
|
|
|
|
|
|
|
|||||||||||||||||
| Total adjustments |
24.9 | 64.5 | 25.9 | 30.5 | 12.4 | 11.5 | ||||||||||||||||||||||||||
|
|
|
|
|
|
|
|
|
|
|
|
|
|
|
|
|
|||||||||||||||||
| Adjusted EBITDA |
$ | 167.0 | $ | 116.2 | $ | 68.6 | $ | 211.1 | $ | 116.6 | $ | 112.9 | $ | $ | ||||||||||||||||||
|
|
|
|
|
|
|
|
|
|
|
|
|
|
|
|
|
|||||||||||||||||
| (a) | “Total depreciation and amortization” equals the sum of (i) depreciation and amortization within total operating expenses and (ii) depreciation and amortization recorded as part of cost of revenue within our consolidated financial statements. |
| (b) | “Purchase accounting adjustments” includes charges associated with noncash adjustments to acquired assets and liabilities in connection with purchase accounting, such as recognition of increased cost of revenue in connection with an inventory step up fair value adjustment, recognition of reduced revenue in connection with a deferred revenue step down fair value adjustment and recognition of increased office rent expense associated with a fair value adjustment to the liabilities associated with deferred rent. |
20
Table of Contents
| (c) | “Transaction costs” (1) of $14.8 million for the fiscal year ended June 30, 2014 includes acquisition-related expenses of $0.8 million related to stay and retention bonuses, $0.3 million related to severance charges, $0.7 million related to transaction-related legal, accounting and tax fees and $13.0 million related to professional fees and expenses associated with debt refinancings; (2) of $42.6 million for the Predecessor period from July 1, 2014 to February 1, 2015 includes acquisition-related expenses of $0.3 million related to stay and retention bonuses, $0.2 million related to severance charges, $31.2 million related to transaction-related legal, accounting and tax fees in connection with the Presidio Acquisition and $10.9 million related to professional fees and expenses associated with debt refinancings; (3) of $21.3 million for the Successor period from November 20, 2014 to June 30, 2015 includes acquisition-related expenses of $0.6 million related to stay and retention bonuses, $0.6 million related to severance charges, $18.5 million related to transaction-related legal, accounting and tax fees in connection with the Presidio Acquisition and $1.6 million related to professional fees and expenses associated with debt refinancings; (4) of $20.6 million for the fiscal year ended June 30, 2016 includes acquisition-related expenses of $3.0 million related to stay and retention bonuses, $1.1 million related to severance charges, $8.7 million related to transaction-related advisory and diligence fees, $6.0 million related to transaction-related legal, accounting and tax fees and $1.8 million related to professional fees and expenses associated with debt refinancings; (5) of $8.9 million for the six months ended December 31, 2015 includes acquisition-related expenses of $1.0 million related to stay and retention bonuses, $0.9 million related to severance charges, $3.5 million related to transaction-related advisory and diligence fees and $3.5 million related to transaction-related legal, accounting and tax fees; and (6) of $6.0 million for the six months ended December 31, 2016 includes acquisition-related expenses of $2.2 million related to stay and retention bonuses, $3.4 million related to transaction-related advisory and diligence fees and $0.4 million related to transaction-related legal, accounting and tax fees. |
| (d) | “Other costs” (1) of $13.0 million for the fiscal year ended June 30, 2014 includes expenses of $3.7 million associated with the integration of previously acquired managed services platforms into one system, certain expenses of $1.1 million related to unusual office start-up development costs, an unusual and non-recurring loss of $1.7 million related to an Atlantix customer receivable, certain unusual legal expenses of $2.2 million, $2.1 million related to payments to our former sponsor for advisory and consulting services and $2.2 million related to certain acquisition-related integration and related costs; (2) of $4.5 million for the Predecessor period from July 1, 2014 to February 1, 2015 includes expenses of $2.2 million associated with the integration of previously acquired managed services platforms into one system, certain expenses of $0.4 million related to unusual office start-up development costs, $1.6 million related to payments to our former sponsor for advisory and consulting services and $0.3 million related to other non-recurring items; (3) of $1.9 million for the Successor period from November 20, 2014 to June 30, 2015 includes expenses of $1.0 million associated with the integration of previously acquired managed services platforms into one system, $0.7 million related to certain non-recurring costs incurred in the development of our new cloud service offerings and certain unusual legal expenses of $0.2 million; (4) of $5.6 million for the fiscal year ended June 30, 2016 includes expenses of $0.5 million associated with the integration of previously acquired managed services platforms into one system, $3.4 million related to certain non-recurring costs incurred in the development of our new cloud service offerings, certain expenses of $0.5 million related to unusual office start-up development costs and certain unusual legal expenses of $1.2 million; (5) of $1.9 million for the six months ended December 31, 2015 includes expenses of $0.4 million associated with the integration of previously acquired managed services platforms into one system, $1.0 million related to certain non-recurring costs incurred in the development of our new cloud service offerings and certain unusual legal expenses of $0.5 million; and (6) of $3.9 million for the six months ended December 31, 2016 includes $3.6 million related to certain non-recurring costs incurred in the development of our new cloud service offerings and $0.3 million related to severance charges. |
| (e) | “Earnings from disposed business” represents the removal of the historical earnings contribution of Atlantix prior to the sale of the business. |
| (3) | Adjusted EBITDA margin represents the ratio of Adjusted EBITDA to Adjusted Revenue. |
21
Table of Contents
| (4) | We define Adjusted Net Income as net income (loss) adjusted to exclude (i) amortization of intangible assets, (ii) amortization of debt issuance costs, (iii) losses recognized on the disposal of business, (iv) losses on extinguishment of debt, (v) noncash share-based compensation expense, (vi) purchase accounting adjustments, (vii) transaction costs, (viii) other costs, (ix) earnings from disposed business and (x) the income tax impact associated with the foregoing items and adjusted for (1) the impact of permanently nondeductible expenses, (2) the impact of tax-deductible goodwill and intangible assets resulting from certain historical acquisitions and (3) the impact of discrete tax items. The following table presents a reconciliation of Adjusted Net Income from Net income (loss). |
| Predecessor | Successor | Pro Forma | ||||||||||||||||||||||||||||||
| (in millions) | Fiscal year ended June 30, 2014 |
July 1, 2014 to February 1, 2015 |
November 20, 2014 to June 30, 2015 |
Fiscal year ended June 30, 2016 |
Six months ended December 31, 2015 |
Six months ended December 31, 2016 |
Fiscal year ended June 30, 2016 |
Six months ended December 31, 2016 |
||||||||||||||||||||||||
| Adjusted Net Income reconciliation: |
||||||||||||||||||||||||||||||||
| Net income (loss) |
$ | 32.5 | $ | (5.1 | ) | $ | (24.3 | ) | $ | (3.4 | ) | $ | 10.5 | $ | 9.0 | $ | $ | |||||||||||||||
| Adjustments: |
||||||||||||||||||||||||||||||||
| Amortization of intangible assets |
38.3 | 18.3 | 26.4 | 67.2 | 31.4 | 36.8 | ||||||||||||||||||||||||||
| Amortization of debt issuance costs |
4.4 | 2.4 |
|
2.7 |
|
7.6 | 3.5 | 3.4 | ||||||||||||||||||||||||
| Loss on disposal of business |
— | — | — | 6.8 | 6.8 | — | ||||||||||||||||||||||||||
| Loss on extinguishment of debt |
2.7 | 7.5 |
|
0.7 |
|
9.7 | 0.1 | 0.8 | ||||||||||||||||||||||||
| Share-based compensation expense |
5.5 | 20.1 |
|
1.0 |
|
2.2 | 1.2 | 1.0 | ||||||||||||||||||||||||
| Purchase accounting adjustments (a) |
— | — | 4.9 | 3.9 | 2.2 | 0.6 | ||||||||||||||||||||||||||
| Transaction costs (b) |
14.8 | 42.6 | 21.3 | 20.6 | 8.9 | 6.0 | ||||||||||||||||||||||||||
| Other costs (c) |
13.0 | 4.5 | 1.9 | 5.6 | 1.9 | 3.9 | ||||||||||||||||||||||||||
| Earnings from disposed business (d) |
(8.4 | ) | (2.7 | ) |
|
(3.2 |
) |
(1.8 | ) | (1.8 | ) | — | ||||||||||||||||||||
| Income tax impact of adjustments (e) |
(21.1 | ) | (29.0 | ) | (18.0 | ) | (37.2 | ) | (16.8 | ) | (14.6 | ) | ||||||||||||||||||||
|
|
|
|
|
|
|
|
|
|
|
|
|
|
|
|
|
|||||||||||||||||
| Total adjustments |
49.2 | 63.7 | 37.7 | 84.6 | 37.4 | 37.9 | ||||||||||||||||||||||||||
|
|
|
|
|
|
|
|
|
|
|
|
|
|
|
|
|
|||||||||||||||||
| Adjusted Net Income |
$ | 81.7 | $ | 58.6 | $ | 13.4 | $ | 81.2 | $ | 47.9 | $ | 46.9 | $ | $ | ||||||||||||||||||
|
|
|
|
|
|
|
|
|
|
|
|
|
|
|
|
|
|||||||||||||||||
| (a) | “Purchase accounting adjustments” includes charges associated with noncash adjustments to acquired assets and liabilities in connection with purchase accounting, such as recognition of increased cost of revenue in connection with an inventory step up fair value adjustment, recognition of reduced revenue in connection with a deferred revenue step down fair value adjustment and recognition of increased office rent expense associated with a fair value adjustment to the liabilities associated with deferred rent. |
| (b) | “Transaction costs” (1) of $14.8 million for the fiscal year ended June 30, 2014 includes acquisition-related expenses of $0.8 million related to stay and retention bonuses, $0.3 million related to severance charges, $0.7 million related to transaction-related legal, accounting and tax fees and $13.0 million related to professional fees and expenses associated with debt refinancings; (2) of $42.6 million for the Predecessor period from July 1, 2014 to February 1, 2015 includes acquisition-related expenses of $0.3 million related to stay and retention bonuses, $0.2 million related to severance charges, $31.2 million related to transaction-related legal, accounting and tax fees in connection with the Presidio Acquisition and $10.9 million related to professional fees and expenses associated with debt refinancings; (3) of $21.3 million for the Successor period from November 20, 2014 to June 30, 2015 includes acquisition-related expenses of $0.6 million related to stay and retention bonuses, $0.6 million related to severance charges, $18.5 million related to transaction- |
22
Table of Contents
| related legal, accounting and tax fees in connection with the Presidio Acquisition and $1.6 million related to professional fees and expenses associated with debt refinancings; (4) of $20.6 million for the fiscal year ended June 30, 2016 includes acquisition-related expenses of $3.0 million related to stay and retention bonuses, $1.1 million related to severance charges, $8.7 million related to transaction-related advisory and diligence fees, $6.0 million related to transaction-related legal, accounting and tax fees and $1.8 million related to professional fees and expenses associated with debt refinancings; (5) of $8.9 million for the six months ended December 31, 2015 includes acquisition-related expenses of $1.0 million related to stay and retention bonuses, $0.9 million related to severance charges, $3.5 million related to transaction-related advisory and diligence fees and $3.5 million related to transaction-related legal, accounting and tax fees; and (6) of $6.0 million for the six months ended December 31, 2016 includes acquisition-related expenses of $2.2 million related to stay and retention bonuses, $3.4 million related to transaction-related advisory and diligence fees and $0.4 million related to transaction-related legal, accounting and tax fees. |
| (c) | “Other costs” (1) of $13.0 million for the fiscal year ended June 30, 2014 includes expenses of $3.7 million associated with the integration of previously acquired managed services platforms into one system, certain expenses of $1.1 million related to unusual office start-up development costs, an unusual and non-recurring loss of $1.7 million related to an Atlantix customer receivable, certain unusual legal expenses of $2.2 million, $2.1 million related to payments to our former sponsor for advisory and consulting services and $2.2 million related to certain acquisition-related integration and related costs; (2) of $4.5 million for the Predecessor period from July 1, 2014 to February 1, 2015 includes expenses of $2.2 million associated with the integration of previously acquired managed services platforms into one system, certain expenses of $0.4 million related to unusual office start-up development costs, $1.6 million related to payments to our former sponsor for advisory and consulting services and $0.3 million related to other non-recurring items; (3) of $1.9 million for the Successor period from November 20, 2014 to June 30, 2015 includes expenses of $1.0 million associated with the integration of previously acquired managed services platforms into one system, $0.7 million related to certain non-recurring costs incurred in the development of our new cloud service offerings and certain unusual legal expenses of $0.2 million; (4) of $5.6 million for the fiscal year ended June 30, 2016 includes expenses of $0.5 million associated with the integration of previously acquired managed services platforms into one system, $3.4 million related to certain non-recurring costs incurred in the development of our new cloud service offerings, certain expenses of $0.5 million related to unusual office start-up development costs and certain unusual legal expenses of $1.2 million; (5) of $1.9 million for the six months ended December 31, 2015 includes expenses of $0.4 million associated with the integration of previously acquired managed services platforms into one system, $1.0 million related to certain non-recurring costs incurred in the development of our new cloud service offerings and certain unusual legal expenses of $0.5 million; and (6) of $3.9 million for the six months ended December 31, 2016 includes $3.6 million related to certain non-recurring costs incurred in the development of our new cloud service offerings and $0.3 million related to severance charges. |
| (d) | “Earnings from disposed business” represents the removal of the historical earnings contribution of Atlantix prior to the sale of the business. |
| (e) | “Income tax impact of adjustments” includes an estimated tax impact of the adjustments to net income at the Company’s average statutory rate of 39.0%, except for (i) the adjustment of certain transaction costs that are permanently nondeductible for tax purposes and (ii) the impact of tax-deductible goodwill and intangible assets resulting from certain historical acquisitions, and further adjusted for discrete tax items such as the remeasurement of deferred tax liabilities due to state rate changes and write off of deferred tax assets resulting from reorganizations. |
| (5) | For purposes of this table, weighted average shares has not been adjusted to reflect the Stock Split. After the Stock Split is effected, and before the effectiveness of the registration statement of which this prospectus forms a part, the Registrant will update the per share data in this table to reflect the Stock Split. |
23
Table of Contents
Investing in our common stock involves a high degree of risk. You should carefully consider the risk factors set forth below as well as the other information contained in this prospectus before investing in our common stock. Any of the following risks could materially and adversely affect our business, financial condition or results of operations. In such a case, you may lose part or all of your original investment.
Risks Related to Our Business
General economic conditions could adversely impact technology spending by our clients and put downward pressure on prices, which could adversely impact our business, financial condition or results of operations.
Weak economic conditions generally, sustained uncertainty about global economic conditions, U.S. federal or other government spending cuts or a tightening of credit markets could cause our clients and potential clients to postpone or reduce spending on technology solutions, products or services. If our industry becomes more price-sensitive, these conditions could also result in customers demanding lower prices for our solutions. Any downward pressure on prices could affect our sales growth and profitability, which could adversely impact our business, financial condition or results of operations.
Changes and innovation in the information technology industry may result in reduced demand for our information technology solutions.
Our results of operations are influenced by a variety of factors, including the condition of the information technology industry and shifts in demand for, or availability of, information technology solutions. The information technology industry is characterized by rapid technological change and the frequent introduction of new products, product enhancements and new distribution methods or channels, each of which can decrease demand for current solutions or render them obsolete. In addition, demand for the solutions we sell to our customers could decrease if we are unable to adapt in areas like cloud technology, IaaS, SaaS, PaaS, SDN or other emerging technologies. Cloud offerings may influence our customers to move workloads to cloud providers, which may reduce the procurement of products and solutions from us. Changes in the information technology industry may also negatively impact the demand for our solutions, which could adversely impact our business, financial condition or results of operations.
Our financial performance could be adversely impacted if our federal, state and local government clients decrease their spending on technology products.
We provide IT services to various government agencies, including federal, state and local government entities. For the fiscal year ended June 30, 2016, 11% of our revenue came from sales to state and local governments and 6% of our revenue was derived from sales to the federal government. These sales may be impacted by government spending policies, budget priorities and revenue levels.
While our sales to public sector clients are diversified across various agencies and departments, an across-the-board change in government spending policies, including budget cuts at the federal level, could result in our public sector clients reducing their purchases and terminating their service contracts, which could adversely impact our business, financial condition or results of operations.
Our solutions business depends on our vendor partner relationships and the availability of their products.
Our solutions depend on the resale of products that we purchase from vendor partners, which include OEMs, software publishers and wholesale distributors. Under our agreements with our vendor partners, we are authorized to sell all or some of their products in connection with our end-to-end solutions, such as pre- and post-sales network design, configuration, troubleshooting and the support and sale of complementary products and services. Our
24
Table of Contents
authorization with each vendor partner has specific terms and conditions with respect to product return privileges, purchase discounts and vendor partner programs and financing programs. These include purchase rebates, sales volume rebates, purchasing incentives and cooperative advertising reimbursements. However, we do not have any long-term contracts with our vendor partners and our agreements with key vendors may be terminable upon notice by any party. As such, from time to time, vendor partners may limit or terminate our right to sell some or all of their products, or change the terms and conditions under which we obtain their products for integration into our solutions.
We also receive payments and credits from vendors, including consideration under volume incentive programs, shared marketing expense programs and early pay discounts. Our vendor partners may decide to terminate or reduce the benefits under their incentive programs, or change the conditions under which we may obtain such benefits. Any sizable reduction, termination or significant delay in receiving benefits under these programs could adversely impact our business, financial condition or results of operations. If we are unable to timely react to any changes in our vendors’ programs, such as the elimination of funding for some of the activities for which we have been compensated in the past, such changes could adversely impact our business, financial condition or results of operations.
While we purchase from a diverse vendor base, we have significant supplier relationships with our vendor partners Cisco Systems, Inc. (“Cisco”) and EMC Corporation (“EMC”). For the fiscal year ended June 30, 2016, Cisco provided products that made up 67% of our purchases from all manufacturers, while EMC provided products that constituted 10% of our purchases from all manufacturers. Other significant vendor partners are VMware, Inc. and VCE Company, LLC, which provided hardware products that generated 2% and 1%, respectively, of our purchases from all manufacturers in the fiscal year ended June 30, 2016. Our portfolio has been heavily concentrated in Cisco products. Though we do not maintain a long-term contractual arrangement with Cisco, historically Cisco has held a leading position in the IT infrastructure market. The loss of, change in business relationship with or change in the behavior, including the timing of fulfillment, of Cisco, any of the other vendors named in this prospectus or any other key vendor partners, or the diminished availability of their products, may impact the timing of our sales or could reduce the supply and increase the cost of the products we sell, eroding our competitive position.
Our Systems Integrator Agreement with Cisco (the “Systems Integrator Agreement”) sets forth the terms and conditions for our purchase and licensing of various products and services from Cisco, serving as the master agreement for all material business transactions with Cisco. The Systems Integrator Agreement sets forth our obligations to maintain certain quality standards in the services we provide our customers and training standards for certain of our personnel in Cisco products, including incentives for our company to maintain high levels of certification in Cisco expertise, which is measured periodically. The Systems Integrator Agreement had an original term of one year and has been regularly extended since its effective date on May 14, 2002, including on February 7, 2017 for a period of thirty days. The Agreement may be terminated by either party without reason by providing the other party with forty-five days’ written notice prior to termination, or by Cisco upon twenty days’ written notice if there are certain changes in control of our Company.
Given the significance of our vendor partners to our business model, any geographic relocation of key distributors used in our purchasing model could increase our cost of working capital, which would have a negative impact on our business, financial condition or results of operations. Similarly, the sale, spin-off or combination of any of our vendor partners and/or of certain of their business units, including a sale or combination with a vendor with whom we do not have an existing relationship, could adversely impact our business, financial condition or results of operations.
Our solutions depend on the innovation and adaptability of our vendor partners, as well as our ability to partner with emerging technology providers.
The technology industry has experienced rapid innovation and the introduction of new hardware, software and services offerings, such as cloud-based solutions. We have been and will expect to continue to be dependent on innovations in hardware, software and services offerings, as well as the acceptance of these
25
Table of Contents
products by clients. If we are unable to keep up with changes in technology and new offerings—for example, by providing the appropriate training to our account managers, technology sales specialists and engineers—it could adversely impact our business, financial condition or results of operations.
Because our solutions involve the resale of vendor products, our business depends on the ability of our vendor suppliers to develop and provide competitive hardware, software and other products. If our vendor partners cannot compete effectively against vendors with whom we do not have a supply relationship, our business, financial condition or results of operations could be adversely impacted. Further, we depend on developing and maintaining relationships with new vendors who can provide products and services in emerging areas of technology, such as cloud, security, mobility, data analytics, software-defined networking and the IoT. To the extent that we cannot develop or maintain relationships with vendors who provide desirable hardware, software and other services, it could adversely impact our business, financial condition or results of operations.
Substantial competition could reduce our market share and significantly harm our financial performance.
Our current competition includes large system integrators and resellers, such as Accenture, Dimension Data and Computer Sciences Corporation; large value-added resellers, such as CDW Corporation and ePlus; local providers in the four regional markets in which we operate (North, South, Tri-State and West); manufacturers who sell directly to end users, such as Dell, Hewlett-Packard and Apple; cloud providers, such as AT&T, Amazon Web Services and Box; and boutique solutions providers, such as Optiv, Cognizant Infrastructure Services and Equinix. Strong performance by these competitors, the increasing number of services providers in the market and rapid innovation in our industry could erode our market share and adversely impact our business, financial condition or results of operations.
We expect our competitive landscape to continue to change as new technologies are developed, resulting in increasingly short technology refresh cycles. Innovation could disrupt our business model and create new and stronger competitors. Some of our hardware and software vendor partners sell and could intensify their efforts to sell their products directly to our clients. For example, ERP systems vendors and other major software vendors increasingly sell their procurement and asset management products along with their application suites. Because of their significant installed client base, these ERP vendors may have the opportunity to offer additional products to existing clients. Further, traditional OEMs have increased their services capabilities through mergers and acquisitions with services providers, which could potentially increase competition in the market to provide clients with comprehensive technology solutions. Any of these trends could adversely impact our business, financial condition or results of operations.
Some solutions providers in our industry compete on the basis of price. To the extent that we face increased competition to gain or retain clients, we may be required to reduce prices, increase advertising expenditures or take other actions that could impact our cash flows. If we are forced to reduce prices and in doing so we are unable to attract new clients or sell increased quantities of products, our sales growth and profitably could be negatively affected, which could adversely impact our business, financial condition or results of operations.
Our earnings could be affected if we lose several larger clients.
Generally, our contracts with our clients are nonexclusive agreements that are terminable upon either party’s discretion with 30 days’ notice. Only certain of our client agreements require longer periods of notice (60 days’ to 90 days’ notice). As of June 30, 2016, we have approximately 7,000 middle-market, large and government clients across a diverse range of industries. In our fiscal year ended June 30, 2016, 19% of our revenue was attributable to our top 25 clients (measured by revenue generated by client). Further, we do not have guaranteed purchasing volume commitments from our clients. As a result, the loss of several of our larger clients, the failure of such clients to pay amounts due to us or a material reduction in purchases made by such clients could adversely impact our business, financial condition or results of operations.
26
Table of Contents
The success of our business depends on the continuing development, maintenance and operation of our information technology systems.
Our success is dependent on the accuracy, proper use and continuing development of our information technology systems, including our business systems and our operational platforms. Our ability to effectively use the information generated by our information technology systems, as well as our success in implementing new systems and upgrades, affects our ability to:
| • | conduct business with our clients, including delivering services and solutions; |
| • | manage our inventory and accounts receivable; |
| • | purchase, sell, ship and invoice our products and services efficiently and on a timely basis; and |
| • | maintain our cost-efficient operating model while expanding our business in revenue and in scale. |
Disruption or breaches of security to our information technology systems and the misappropriation of our clients’ data could adversely impact our business.
Our information technology systems are vulnerable to disruption by forces outside our control. We have taken steps to protect our information technology systems from a variety of internal and external threats, including computer viruses, malware, phishing, social engineering, unauthorized access and other malicious attacks, but there can be no guarantee that these steps will be effective. Any disruption to or infiltration of our information technology systems could adversely impact our business, financial condition or results of operations. In addition, in order to ensure customer confidence in our solutions and services, we may choose to remediate actual or perceived security concerns by implementing further security measures which could require us to expend significant resources.
Further, our business may involve the storage and transmission of proprietary, sensitive or confidential information. In addition, we operate data centers and other information technology for our clients, which host our clients’ technology infrastructure and may store and transmit business-critical and confidential data. We have privacy and data security policies in place that are designed to prevent security breaches and confidentiality and data security provisions are standard in our client contracts. However, as newer technologies evolve, our security practices and products may be sabotaged or circumvented by third parties, such as hackers, which could result in disruptions to our clients’ businesses, unauthorized procurement and the disclosure of sensitive corporate information or private personal information. Such breaches in security could damage our reputation and our business; they could also expose us to legal claims, proceedings and liability and to regulatory penalties under laws that protect the privacy of personal information, which could adversely impact our business, financial condition or results of operations.
Our investments in new services and technologies may not be successful.
We have recently begun and continue to invest in new services and technologies, including cloud, security, mobility, data analytics, software-defined networking and IoT. The complexity of these solutions, our learning curve in developing and supporting them and significant competition in the markets for these solutions could make it difficult for us to market and implement these solutions successfully. There is further risk that we will be unable to protect and enforce our rights to use such intellectual property. Additionally, there is a risk that our clients may not adopt these solutions widely, which would prevent us from realizing expected returns on these investments. Even if these solutions are successful in the market, these solutions still rely on third-party hardware and software and our ability to meet stringent service levels; if we are unable to deploy these solutions successfully or profitably, it would adversely impact our business, financial condition or results of operations.
27
Table of Contents
If we infringe on the intellectual property rights of third parties, we may be subject to costly disputes or indemnification obligations that could adversely impact our business, financial condition or results of operations.
We cannot assure you that our activities will not infringe on patents, trademarks or other intellectual property rights owned by others. If we are required to defend ourselves against intellectual property rights claims, we may spend significant time and effort and incur significant litigation costs, regardless of whether such claims have merit. If we are found to have infringed on the patents, trademarks or other intellectual property rights of others, we may also be subject to substantial claims for damages or a requirement to cease the use of such disputed intellectual property, which could have an adverse effect on our operations. Such litigation or claims and the consequences that could follow could distract our management from the ordinary operation of our business and could increase our costs of doing business, resulting in a negative impact on our business, financial condition or results of operations.
Furthermore, third parties may assert infringement claims against our clients for infringement by our products on the intellectual property rights of such third parties. These claims may require us to initiate or defend protracted and costly litigation on behalf of our clients, regardless of the merits of these claims. We also generally extend the indemnification granted by our OEMs to our clients for any such infringement. If any of these claims succeed, we may be forced to pay damages on behalf of our clients or may be required to obtain licenses for the products they use, even though our OEMs may in turn be liable for any such damages. Any infringement on the intellectual property rights of third parties could adversely impact our business, financial condition or results of operations.
Our engagements with our clients are based on estimated pricing terms. If our estimates are incorrect, these terms could become unprofitable.
Some of our client contracts for professional services are fixed-price contracts to which we commit before we provide services to these clients. In pricing such fixed-price client contracts, we are required to make estimates and assumptions at the time we enter into these contracts that could differ from actual results. As a result, the profit that is anticipated at a contract’s inception may not be guaranteed. Our estimates reflect our best judgments about the nature of the engagement and our expected costs in providing the contracted services. However, any increased or unexpected costs, or any unanticipated delays in connection with our performance of these engagements—including delays caused by our third-party providers or by factors outside our control—could make these contracts less profitable or unprofitable and could have an adverse impact on our business, financial condition or results of operations.
Failure to comply with the terms of our contracts with our public sector clients, or with applicable laws and regulations, could result in the termination of our contracts, fines or liabilities. Further, changes in government procurement regulations could adversely impact our business.
We provide information technology services to various government agencies, including federal, state and local government entities, as well as international and intergovernmental agencies. Sales to such public sector clients are highly regulated. Any noncompliance with contract provisions, government procurement regulations or other applicable laws or regulations—including, but not limited to, the False Claims Act and the Foreign Corrupt Practices Act—could result in civil, criminal and administrative liability, such as substantial monetary fines or damages, the termination of government contracts or other public sector client contracts and suspension, debarment or ineligibility from doing business with the government and with other clients in the public sector.
Our contracts with our public sector clients are terminable at any time at the convenience of the contracting agency or group purchasing organization (“GPO”). As such, our relationships with public sector clients are susceptible to government budget, procurement and other policies. Our inability to enter into or retain
28
Table of Contents
contracts with GPOs could threaten our ability to sell to current and potential clients in those GPOs. Further, the adoption of new or modified procurement regulations and other requirements may increase our compliance costs and reduce our gross margins, which could have a negative effect on our business, financial condition or results of operations.
We also provide services to certain government agencies that require us to have and maintain security clearance at an appropriate level. If an acquisition or any other action we take causes us to lose our security clearance status, or results in our having a lower level of security clearance, we could lose the business of such clients, which could adversely impact our business, financial condition or results of operations.
We rely on third-party companies to perform certain of our obligations to clients, which could impact our business if not performed.
We deliver and manage mission-critical software, systems and network solutions for our clients. We also offer certain services, such as implementation, installation and deployment services, to our clients through various third-party providers who are engaged to perform these services on our behalf. We are also required, as a component of some of our contracts with our OEM partners, to utilize their engineers as part of our solutions. For the fiscal year ended June 30, 2016, 5% of our revenue was attributable to these third-party services. Further, to provide services to our clients outside of the United States, we rely heavily on an international network of preferred sales partners that are generally vetted by our OEM vendor partners. If we or our third-party services providers fail to provide high-quality services to our clients, or if such services result in a disruption of our clients’ businesses, we could be subject to legal claims, proceedings and liability.
As we expand our services and solutions business, we may be exposed to additional operational, regulatory and other risks. For example, we could incur liability for failure to comply with the rules and regulations applicable to the new services and solutions we provide to our clients. Such issues could adversely affect our reputation with our clients, tarnish our brand or render us unable to compete for new work and could adversely impact our business, financial condition or results of operations.
We rely on third-party commercial delivery services to provide products and services to our clients, which if not performed could lead to significant disruption to our business.
We also depend heavily on commercial delivery services to provide products and services to our clients. For example, we generally ship hardware products to our clients by FedEx, United Parcel Service and other commercial delivery services and invoice clients for delivery charges. However, our inability to pass future increases in the cost of commercial delivery services to our clients could decrease our profitability. Additionally, strikes, inclement weather, natural disasters or other service interruptions by such shippers could affect our ability to deliver products to our clients in a timely manner and could adversely impact our business, financial condition or results of operations.
Our business depends on our ability to attract and retain talented personnel.
Our success depends on our ability to attract, develop, engage and retain key personnel to manage and grow our business, including our key executive, management, sales, services and technical employees.
For example, as we seek to expand our offerings of value-added services and solutions, our success depends on attracting and retaining highly skilled technology specialists and engineers, for whom the market is extremely competitive. Increasingly, our competitors are requiring their employees to sign Non-Compete and Non-Solicitation agreements as part of their employment, making it more difficult for us to hire talented individuals with experience in our industry. We do not carry any “key man insurance”—that is, an insurance policy that would cover any financial loss that would arise from the death or incapacity of an important member of our business. Our failure to recruit and retain mission-critical employees could adversely impact our business, financial condition or results of operations.
29
Table of Contents
International trade laws and Anti-Corruption regulations and policies may adversely impact our ability to generate revenue from sales outside of the United States.
A small portion of our revenue is derived from our sales outside of the United States, mostly from the non-U.S. activities of our clients based in the United States. Specifically, non-U.S. sales represented approximately 2% of our total revenue for each of the fiscal years ended June 30, 2016, June 30, 2015, and June 30, 2014, respectively. We are exposed to risk under international trade laws because of our sales derived from countries associated with higher risks of corruption and our use of third-party preferred agents to provide services to our clients outside of the United States. We have implemented a global anti-corruption policy that addresses U.S. laws and regulations governing Anti-Corruption and Anti-Bribery. However, our failure to implement guidance and procedures for specific situations as they arise, as well as inadequate training of our employees on these issues, could result in our inability to comply with international trade laws and regulations.
We also export hardware and software that are subject to certain trade-related U.S. laws and regulations, including the Export Administration Regulations administered by the U.S. Department of Commerce, Bureau of Industry and Security (“BIS”) and various economic sanctions programs administered by the U.S. Treasury’s Office of Foreign Assets Control. Exports and re-exports of such hardware and software to certain countries in which we conduct business may require regulatory licensing or other authorization. Our failure to implement compliance policies and procedures, including those relating to product classification, licensing, and screening, or to adequately train our personnel to understand and comply with applicable regulations, could result in export or sanctions violations, which could have an adverse impact on our business, financial condition or results of operations.
The results of the United Kingdom’s referendum on withdrawal from the European Union may have a negative effect on global economic conditions, financial markets and our business.
In June 2016, a majority of voters in the United Kingdom elected to withdraw from the European Union in a national referendum. The referendum was advisory and the terms of any withdrawal are subject to a negotiation period that could last years after the government of the United Kingdom formally initiates a withdrawal process. Nevertheless, the referendum has created significant uncertainty about the future relationship between the United Kingdom and the European Union, including with respect to the laws and regulations that will apply as the United Kingdom determines which European Union laws to replace or replicate in the event of a withdrawal. The referendum has also given rise to calls for the governments of other European Union member states to consider withdrawal. These developments, or the perception that any of them could occur, have had and may continue to have a material adverse effect on global economic conditions and the stability of global financial markets and may significantly reduce global market liquidity and restrict the ability of key market participants to operate in certain financial markets. Any of these factors could depress economic activity and restrict our access to capital, which could have a material adverse impact on our business, financial condition and results of operations.
Interruption of the flow of hardware products from suppliers could disrupt our supply chain.
We rely on hardware products that our vendor partners manufacture or purchase outside of the United States, primarily in Asia. Political, social or economic instability in Asia, or in other regions in which our vendor partners purchase or manufacture the products that we resell, could cause disruptions in trade, which would affect our supply chain. Other events that could disrupt our supply chain include:
| • | the imposition of additional trade law provisions or regulations; |
| • | the imposition of additional duties, tariffs and other charges on imports and exports; |
| • | foreign currency fluctuations; |
| • | natural disasters affecting any of our suppliers’ facilities; |
30
Table of Contents
| • | restrictions on the transfer of funds; |
| • | dependence on an international supply chain; |
| • | the financial instability or bankruptcy of manufacturers; and |
| • | significant labor disputes, such as strikes. |
We cannot predict whether the countries in which our products are purchased or manufactured, or may be purchased or manufactured in the future, will be subject to new or additional trade restrictions or sanctions imposed by the U.S. or other governments. Trade restrictions—including new or increased tariffs, quotas, embargoes, sanctions, safeguards and customs restrictions—against the products we sell, as well as foreign labor strikes, work stoppages or boycotts, could increase the cost or reduce the supply of the product available to us.
We could experience, and have experienced in the past, periodic product shortages from our vendor partners if they fail to adequately project demand for certain products. Because we do not maintain hardware inventory that is not supported by executed client orders, except for insignificant spares, we depend on our vendor partners’ continued supply so we can fulfill our clients’ orders on a timely basis. A substantial disruption to our supply chain could adversely impact our business, financial condition or results of operations.
We are exposed to accounts receivables and inventory risks.
We extend credit to our clients for a significant portion of our revenue, typically on 30-day payment terms. As a result, we are subject to the risk that our clients will not pay for the products they have purchased or that they will pay at a slower rate than we have historically experienced. This risk is particularly pronounced during periods of economic downturn or uncertainty or, in the case of our public sector clients, due to governmental budget constraints. Though we devote resources to collections operations and have a low write off rate, any failure or delay by our clients in paying for the products they have purchased could adversely impact our business, financial condition or results of operations.
Any of our clients may experience a downturn in its business that may weaken its business, financial condition or results of operations. As a result, a client may fail to make payments when due, become insolvent or declare bankruptcy. Any client bankruptcy or insolvency, or the failure of any client to make payments when due, could result in losses. A client bankruptcy would delay or preclude full collection of amounts owed to us.
In certain cases, we are able to return unused equipment to our vendors. We primarily acquire inventory once we have an agreement executed with a client and with the exception of an immaterial level of spare parts inventory, we do not generally maintain inventory that is not already designated for sale. However, we may be exposed to the risk that our inventory cannot be returned to the vendor in situations where a client cancels an executed order.
We seek to minimize our inventory exposure through a variety of inventory management procedures and policies, including buying limits and restrictions on inventory purchase authority. However, if we were unable to successfully maintain our inventory management procedures and policies, or if there are unforeseen product developments that result in the more rapid obsolescence of our inventory, our inventory risks could increase, which could adversely impact our business, financial condition or results of operations.
We may not be able to realize our entire investment in the equipment we lease.
We are a lessor of technology equipment and the realization of equipment values (residual values) during the life and predominantly at the end of the term of a lease is an important element in our leasing business. At the inception of each lease, we record a residual value for the leased equipment based on our estimate of the value of the equipment at the expected disposition date.
31
Table of Contents
If the market value of leased equipment decreases at a faster rate than we projected, whether due to rapid technological or economic obsolescence, unusual wear and tear on the equipment, excessive use of the equipment or other factors, this would adversely affect the recoverability of the estimated residual values of such equipment. Further, certain equipment residual values are dependent on the vendor’s warranties, reputation and other factors, including market liquidity. We also may not realize the full market value of equipment if we are required to sell it to meet liquidity needs or for other reasons outside of the ordinary course of business. Consequently, there can be no assurance that we will realize our estimated residual values for equipment, which failure to realize such values could adversely impact our business, financial condition or results of operations.
We may not realize the full amount of our backlog, which could have a material adverse impact on our business, financial condition or results of operations.
As of December 31, 2016, our backlog orders believed to be firm was approximately $517 million, compared to approximately $410 million as of December 31, 2015. There can be no assurance that our backlog will result in actual revenue in any particular period, or at all, or that any contract included in our backlog will be profitable. This is because the actual realization and timing of any of this revenue is subject to various contingencies, many of which are beyond our control. The actual realization of revenue on engagements included in backlog may never occur or may change because an order could be reduced, modified or terminated early. Several of our orders involve the delivery of services that can be up to five years in duration and may be subject to delays in performance that are beyond our control. Our failure to realize the full amount of our backlog could adversely impact our business, financial condition or results of operations.
Our acquisitions may not achieve expectations, which could affect our profitability.
We have acquired and may acquire, companies and operations that extend or complement our existing business. These transactions involve numerous business risks, including finding suitable transaction partners, the diversion of management’s attention from other business concerns, extending our product or service offerings into areas in which we have limited experience, entering into new geographic markets, the potential loss of key employees or business relationships and the integration of acquired businesses, any of which could adversely impact our business, financial condition or results of operations.
Furthermore, failure to successfully integrate acquired operations may adversely affect our cost structure, reducing our gross margins and return on investment. In addition, we may acquire entities with unknown liabilities. Should an unknown liability emerge following an acquisition, it could adversely impact our business, financial condition or results of operations.
As with most acquisitions in our industry, we paid a premium to book value in our prior acquisitions and the portion of the purchase price paid in excess of the book value of the assets acquired has been recorded on our books as goodwill or intangible assets. We may be required to account for similar premiums paid on future acquisitions in the same manner. Under existing GAAP, goodwill is not amortized and is carried on our books at its original value, subject to annual review and evaluation for impairment, whereas finite-lived intangible assets are amortized over the life of the asset. If market and economic conditions (including business valuation levels and trends) deteriorate, we may have to record impairment charges to the extent the carrying value of our goodwill exceeds the fair value of our overall business. Additionally, if existing GAAP were modified to require amortization, such impairment charges or amortization expense could adversely affect our net earnings during the period in which the charge or expense is recorded. As of December 31, 2016, we had goodwill and other intangible assets related to our prior acquisitions of $1,570.2 million. Any failure to successfully integrate our acquisitions or a change to existing GAAP goodwill and intangible asset accounting policies could adversely impact our business, financial condition or results of operations.
32
Table of Contents
Our operating results could fluctuate significantly in the future because of industry factors and other factors outside of our control.
Our operating results are dependent on a variety of industry factors, including the condition of the technology industry in general, shifts in demand and pricing for hardware, software and services and the introduction of new products or upgrades.
Our operating results are also dependent on our level of gross profit as a percentage of revenue. Our gross profit percentage fluctuates due to numerous factors, some of which may be outside of our control. These include general macroeconomic conditions; pricing pressures; changes in product costs from our vendor partners; the availability of price protection, purchase discounts and incentive programs from our vendor partners; changes in product, order size and client mix; the risk that certain items in our inventory become obsolete; increases in delivery costs that we cannot pass on to clients; and general market and competitive conditions.
Our results may be affected by slight variances as a result of seasonality we may experience across our business. This seasonality is typically driven by budget cycles and spending patterns across our diverse client base. For example, our local, state and federal government clients operate on an annual budget cycle, most often on the basis of a fiscal year that begins October 1. Our private sector clients operate on an annual budget cycle, most often on the basis of a fiscal year that begins January 1. It is not uncommon to experience a higher level of contract awards, funding actions and overall government and private demand for services in the final months and weeks of the government and private fiscal years, respectively. Consequently, our revenue in the first and second quarters of our fiscal year may be greater than the revenue recognized in the third and fourth quarters of our fiscal year.
Furthermore, due to general economic conditions, we may not only experience difficulty in collecting our receivables on a timely basis but also may experience a loss due to a client’s inability to pay. In addition, certain economic factors may impact the valuation of certain investments we may make in other businesses.
As a result of these and other factors, quarterly period-to-period comparisons of our financial results are not necessarily meaningful and should not be relied upon as an indication of future performance.
In addition, our cost structure is based in part on anticipated sales and gross margins. Therefore, we may not be able to adjust our cost structure quickly enough to compensate for any unexpected sales or gross margin shortfall. Any such inability could adversely impact our business, financial condition or results of operations.
We are exposed to risks from legal proceedings and audits.
We are party to various legal proceedings that arise in the ordinary course of our business, which include commercial, employment, tort and other litigation.
We are also subject to intellectual property infringement claims in the ordinary course of our business, which come in the form of cease-and-desist letters, licensing inquiries, lawsuits and other demands. These claims may arise either from the products and services we sell or the business systems and products we use to sell the products and services. In our industry, such claims have become more frequent with the increasing complexity of technological products. In fact, many of these assertions are brought by Non-Practicing entities, whose principal business model is to secure patent licensing revenue.
Because of our significant sales to public sector clients, we are also subject to audits by federal, state and local authorities. From time to time, we receive subpoenas and other requests for information from various government authorities. We may also be subject to audits by various vendor partners and large clients, including government agencies, pursuant to certain purchase and sale agreements. Further, we may be required to indemnify our vendor partners and our clients from claims brought by third parties under certain agreements. See “Business—Governmental, Legal and Regulatory Matters.”
33
Table of Contents
Current and future litigation, infringement claims, governmental proceedings, audits or indemnification claims may result in substantial costs and expenses and regardless of the outcome, significantly divert the attention of our management, which could adversely impact our business, financial condition or results of operations.
Changes in accounting rules could adversely affect our future financial results.
We prepare our financial statements in conformity with GAAP. These accounting principles are subject to interpretation by the Financial Accounting Standards Board, the Public Company Accounting Oversight Board, the SEC, the American Institute of Certified Public Accountants and various other bodies formed to interpret and create appropriate accounting policies. Products and services and the manner in which they are bundled, are technologically complex and the characterization of these products and services require judgment to apply revenue recognition policies. Any mischaracterization of these products and services could result in misapplication of revenue recognition policies. Future periodic assessments required by current or new accounting standards may result in noncash changes and/or changes in presentation or disclosure. In addition, any change in accounting standards may influence our clients’ decision to purchase from us or to finance transactions with us, which could adversely impact our business, financial condition or results of operations.
Increased costs of labor and employee health and welfare benefits may adversely impact our results of operations.
Given our large number of employees, labor-related costs represent a significant portion of our expenses. Salaries, wages, benefits, commissions and other labor compensation costs (not including bonus and payroll tax) for our full-time employees amounted to $380 million, which represented approximately 73% of our selling, general and administrative expenses and approximately 6% of our cost of sales for the fiscal year ended June 30, 2016. An increase in labor costs (for example, as a result of increased competition for skilled labor) or employee benefit costs (such as health care costs or otherwise) could adversely impact our business, financial condition or results of operations.
Our future results will depend on our ability to continue to focus our resources, maintain our business structure and manage costs effectively.
We are continually implementing productivity measures and focusing on measures intended to further improve cost efficiency. We may be unable to realize all expected cost savings in connection with these efforts within the expected time frame, or at all, and we may incur additional and/or unexpected costs to realize them. Further, we may not be able to sustain any achieved savings in the future. Future results will depend on the success of these efforts.
We believe that our corporate culture has been and will continue to be a key contributor to our success. From December 31, 2015 to December 31, 2016, we increased the size of our workforce by 515 employees (including acquisitions and dispositions during the period) and we expect to continue to hire as we expand. If we do not continue to maintain our corporate culture, we may be unable to foster growth. Our inability to maintain our current business structure will adversely impact our business, financial condition or results of operations.
Under our contracts, should we be unable to control costs, we may incur losses, which could decrease our operating margins and significantly reduce or eliminate our profits. As our industry becomes more price-sensitive, our future profitability will depend on our ability to manage costs or increase productivity. An inability to effectively manage costs will adversely impact our business, financial condition or results of operations.
Any failure in our delivery of high-quality technical support services may adversely affect our relationships with our clients and our financial results.
Our clients depend on our services desk to provide technical support. We may be unable to respond quickly enough to accommodate short-term increases in client demand for support services. Increased client
34
Table of Contents
demand for these services, without corresponding revenue, could increase costs and adversely affect our operating results. In the same vein, any failure to maintain high-quality technical support, or a market perception that we do not maintain high-quality support, could adversely impact our reputation and our business, financial condition or results of operations.
We may not meet our growth objectives and strategies, which may impact our competitiveness.
On an ongoing basis, we seek to achieve profitable growth by providing superior solutions to our clients. As we continue to invest in growth opportunities, including our investments in new technologies and capabilities, we may experience unfavorable demand for these services and we may be unable to deploy these solutions successfully or profitably. In addition, we have historically been focused on reducing our costs and may not be able to achieve or maintain targeted cost reductions. Our inability to effectively invest in new growth opportunities or to reduce cost could impact our competitiveness and render it difficult for us to meet our growth objectives and strategies, which could adversely impact our business, financial condition or results of operations.
Ineffective internal controls could impact our business and operating results.
Our internal control over financial reporting may not prevent or detect misstatements because of its inherent limitations, including the possibility of human error, the circumvention or overriding of controls or fraud. Even effective internal controls can provide only reasonable assurance with respect to the preparation and fair presentation of financial statements. If we fail to maintain the adequacy of our internal controls, including any failure to implement required new or improved controls, or if we experience difficulties in their implementation, our business and results of operations could be harmed and we could fail to meet our financial reporting obligations, which could adversely impact our business, financial condition or results of operations.
Risks Related to an Investment in Our Common Stock and this Offering
Apollo and its affiliates will continue to have control over us after this Offering, including the ability to elect all of our directors and prevent any transaction that requires approval of our Board of Directors or our stockholders and may also pursue corporate opportunities independent of us that could present conflicts with our and our stockholders’ interests.
After the consummation of this Offering, the Apollo Funds will indirectly beneficially own approximately % of our common stock (or % assuming the underwriters exercise in full their option to purchase additional shares) after the completion of this Offering. As a result, the Apollo Funds will have the power to elect all of our directors after the completion of this Offering. Therefore, the Apollo Funds effectively will have the ability to prevent any transaction that requires the approval of our Board of Directors or our stockholders, including the approval of significant corporate transactions, such as mergers and the sale of substantially all of our assets after the completion of this Offering. Thus, the Apollo Funds will continue to be able to significantly influence or effectively control our decisions after the completion of this Offering.
In addition, the stockholders’ agreement with the Apollo Funds that we will enter into in connection with this Offering (the “Apollo Stockholders Agreement”) (as described under “Certain Relationships and Related Party Transactions”) will provide that, except as otherwise required by applicable law, if the Apollo Funds hold (a) at least 50% of our outstanding common stock, they will have the right to designate up to five nominees to our Board of Directors, (b) at least 30% but less than 50% of our outstanding common stock, they will have the right to designate up to four nominees to our Board of Directors, (c) at least 20% but less than 30% of our outstanding common stock, they will have the right to designate up to three nominees to our Board of Directors and (d) at least 10% but less than 20% of our outstanding common stock, they will have the right to designate two nominees to our Board of Directors. The agreement will provide that if the size of our Board of Directors is increased or decreased at any time, the nomination rights of the Apollo Funds will be proportionately increased or decreased, respectively, rounded up to the nearest whole number.
35
Table of Contents
The interests of the Apollo Funds could conflict with or differ from your interests as a holder of our common stock. For example, the concentration of ownership held by the Apollo Funds could delay, defer or prevent a change of control of the Company or impede a merger, takeover or other business combination that you as a stockholder may otherwise view favorably. In addition, a sale of a substantial number of shares of stock in the future by the Apollo Funds could cause our stock price to decline.
Additionally, the group of (A) Apollo, (B) the Apollo Funds, (C) any other investment fund or other collective investment vehicle affiliated with or managed by Apollo or whose general partner or managing member is owned, directly or indirectly, by Apollo and (D) any affiliate of the foregoing (in each case, other than the Company and its subsidiaries) (collectively, the “Apollo Group”) is in the business of making or advising on investments in companies and holds (and may from time to time in the future acquire) interests in or provides advice to businesses that directly or indirectly compete with certain portions of our business or are suppliers or customers of ours. The Apollo Group may also pursue acquisitions that may be complementary to our business and, as a result, those acquisition opportunities may not be available to us.
Our Amended Certificate will provide that no officer or director of the Company who is also an officer, director, employee, managing director or other affiliate of any member of the Apollo Group will be liable to us or our stockholders for breach of any fiduciary duty by reason of the fact that any such individual pursues or acquires a corporate opportunity for its own account or the account of an affiliate, as applicable, instead of us, directs a corporate opportunity to any other person, instead of us or does not communicate information regarding a corporate opportunity to us.
So long as the Apollo Funds continue to beneficially own a significant amount of our equity, even if such amount is less than 50%, the Apollo Funds may continue to be able to strongly influence or effectively control our decisions.
The foregoing and other issues related to the Apollo Funds’ control of any of the foregoing may adversely impact prevailing market prices for our common stock.
There is no existing market for our common stock and we do not know if one will develop, which could impede your ability to sell your shares and depress the market price of our common stock.
Prior to this Offering, there has not been a public market for our common stock. We cannot predict the extent to which investor interest in the Company will lead to the development of an active trading market on the NASDAQ or otherwise, or how liquid that market might become. If an active trading market does not develop, you may have difficulty selling any of our common stock that you buy. The initial public offering price for the common stock will be determined by negotiations between us and the representatives of the underwriters and may not be indicative of prices that will prevail in the open market following this Offering. See “Underwriting (Conflicts of Interest).” Consequently, you may not be able to sell our common stock at prices equal to or greater than the price you paid in this Offering.
The price of our common stock may fluctuate significantly and you could lose all or part of your investment.
Volatility in the market price of our common stock may prevent you from being able to sell your shares of common stock at or above the price you paid for them. In addition to the risks described in this “Risk Factors” section, the market price for our common stock could fluctuate significantly for various reasons, including:
| • | our operating and financial performance and prospects; |
| • | our quarterly or annual earnings or those of other companies in our industry; |
| • | changes in earnings estimates or recommendations by securities analysts, if any, or termination of coverage of our common stock by securities analysts; |
| • | our failure to meet estimates or forecasts made by securities analysts, if any; |
36
Table of Contents
| • | conditions that impact demand for our products and services; |
| • | future announcements concerning our business or our competitors’ businesses; |
| • | the public’s reaction to our press releases, other public announcements and filings with the SEC; |
| • | market and industry perception of our success, or lack thereof, in pursuing our growth strategy; |
| • | strategic actions by us or our competitors, such as acquisitions or restructurings; |
| • | changes in government and environmental regulation; |
| • | changes in accounting standards, policies, guidance, interpretations or principles; |
| • | arrival and departure of key personnel; |
| • | the number of shares to be publicly traded after this Offering; |
| • | sales of common stock by us, the Apollo Funds, members of our management team or any other party; |
| • | adverse resolution of new or pending litigation against us; |
| • | changes in general market, economic and political conditions in the United States and global economies or financial markets, including those resulting from natural disasters, terrorist attacks, acts of war and responses to such events; and |
| • | material weakness in our internal controls over financial reporting. |
In addition, in recent years, the stock market has experienced significant price and volume fluctuations. This volatility has had a significant impact on the market price of securities issued by many companies. The changes frequently appear to occur without regard to the operating performance of the affected companies. Hence, the price of our common stock could fluctuate based upon factors that have little or nothing to do with the Company and these fluctuations may adversely impact prevailing market prices for our common stock.
We expect to be a “controlled company” within the meaning of applicable the NASDAQ rules and, as a result, will qualify for and intend to rely on, exemptions from certain corporate governance requirements.
We have applied to list our common stock on the NASDAQ. Upon the closing of this Offering, the Apollo Funds will continue to control a majority of our voting common stock. As a result, we expect to qualify as a “controlled company” within the meaning of the NASDAQ corporate governance standards. Under the NASDAQ rules, a company of which more than 50% of the voting power for the election of directors is held by an individual, group or another company is a “controlled company” and may elect not to comply with certain the NASDAQ corporate governance requirements, including the requirements:
| • | that a majority of the Board of Directors consists of independent directors, as defined under the rules of the NASDAQ; |
| • | that we have a compensation committee that is composed entirely of independent directors with a written charter addressing the committee’s purpose and responsibilities; and |
| • | that we have a nominating and governance committee composed entirely of independent directors with a written charter addressing the committee’s purpose and responsibilities. |
37
Table of Contents
Accordingly, you will not have the same protections afforded to stockholders of companies that are subject to such corporate governance requirements of the NASDAQ.
The foregoing and other issues related to the Apollo Funds’ control of any of the foregoing may adversely impact prevailing market prices for our common stock.
We have no plans to pay regular dividends on our common stock, so you may not receive funds without selling your common stock.
We have no plans to pay regular dividends on our common stock. Any declaration and payment of future dividends to holders of our common stock may be limited by restrictive covenants of our debt agreements, will be at the sole discretion of our Board of Directors and will depend on many factors, including our financial condition, earnings, capital requirements, level of indebtedness, statutory and contractual restrictions applying to the payment of dividends and other considerations that our Board of Directors deems relevant. See “Dividend Policy.”
The terms of our senior secured credit facilities and the indentures governing our notes may restrict our ability to pay cash dividends on our common stock. Our debt instruments contain covenants that restrict our ability to pay dividends on our common stock, as well as the ability of our subsidiaries to pay dividends to us. See “Description of Certain Indebtedness” and “Description of Capital Stock—Common Stock.” Furthermore, we will be permitted under the terms of our debt instrument to incur additional indebtedness, which may restrict or prevent us from paying dividends on our common stock. Agreements governing any future indebtedness, in addition to those governing our current indebtedness, may not permit us to pay dividends on our common stock. Any of the foregoing may adversely impact prevailing market prices for our common stock.
Future sales or the possibility of future sales of a substantial amount of our common stock may depress the price of shares of our common stock.
Future sales or the availability for sale of substantial amounts of our common stock in the public market could adversely affect the prevailing market price of our common stock and could impair our ability to raise capital through future sales of equity securities.
Effective upon consummation of this Offering, we will amend and restate our certificate of incorporation to increase our authorized capital stock so that it consists of million authorized shares, of which million shares, par value $0.01, will be designated as common stock and million shares, par value $0.01, will be designated as preferred stock. Upon consummation of this Offering, shares will be outstanding. This number includes shares that we are selling in this Offering, which will be freely transferable without restriction or further registration under the Securities Act of 1933, as amended (the “Securities Act”), subject to the terms of the lock-up agreements. The remaining shares of our common stock outstanding, including the shares of common stock owned by the Apollo Funds, our directors and our executive officers, will be subject to holding requirements under the federal securities laws described in “Shares Eligible for Future Sale” and subject to the lock-up agreements between such current stockholders and the underwriters. Pursuant to the lock-up agreements, we, each of our executive officers and directors and the Apollo Funds have agreed, subject to certain exceptions, with the underwriters not to dispose of or hedge any of the shares of common stock or securities convertible into or exchangeable for shares of common stock during the period from the date of this prospectus continuing through the date that is days after the date of this prospectus. J.P. Morgan Securities LLC and Citigroup Global Markets Inc. may, in their sole discretion, release any of these shares from the restrictions at any time without notice. See “Underwriting (Conflicts of Interest).” Following the expiration of the applicable lock-up period, all of these shares of our common stock will be eligible for resale under Rule 144 or Rule 701 of the Securities Act, subject to volume limitations and applicable holding period requirements. See “Shares Eligible for Future Sale” for a discussion of the shares of our common stock that may be sold into the public market in the future.
38
Table of Contents
Subject to the terms of the lock-up agreements, we also may issue shares of our common stock or other securities from time to time as consideration for future acquisitions and investments. If any such acquisition or investment is significant, the number of shares of our common stock, or the number or aggregate principal amount, as the case may be, of other securities that we may issue may in turn be substantial. We may also grant registration rights covering those shares of our common stock or other securities in connection with any such acquisitions and investments.
The Company, Aegis LP, the Apollo Fund that is the beneficial owner of most of our common stock, and certain of our employees who invested in the Company in connection with the Presidio Acquisition are parties to a securityholders agreement, which is being amended and restated in connection with the consummation of this Offering (the “Amended Management Stockholders Agreement”). Pursuant to the Amended Management Stockholders Agreement, following this Offering, Aegis LP and certain of its affiliates will have certain demand registration rights for shares of our common stock held by them. In addition, under the Amended Management Stockholders Agreement, Aegis LP, certain of its affiliates and certain owners of our common stock who are employed by or serve as consultants to or directors of our Company or any of its affiliates (the “Management Holders”) will have piggyback and other registration rights with respect to shares of our common stock held by them. Furthermore, under the Amended Management Stockholders Agreement, we will agree to indemnify (A) each party to the Amended Management Stockholders Agreement and their respective officers, directors, employees, representatives and each person who controls such party, (B) Aegis LP and its officers, managers, employees, representatives and affiliates and (C) any portfolio company of the Apollo Group against losses, claims, damages, liabilities and expenses caused by any untrue or alleged untrue statement of a material fact contained in any registration statement or prospectus or any omission or alleged omission to state therein a material fact required to be stated therein or necessary to make the statements therein not misleading, except insofar as the same may be caused by or contained in any information furnished in writing to our Company by such party set forth in (A), (B) or (C) above for use therein.
We cannot predict the size of future issuances of our common stock or the effect, if any, that future issuances and sales of our common stock will have on the market price of our common stock. Sales of substantial amounts of our common stock (including shares of our common stock issued in connection with an acquisition) or the exercising of any registration rights, or the perception that such sales or such exercising of registration rights could occur, may adversely affect prevailing market prices for shares of our common stock. Any of the foregoing may adversely impact prevailing market prices for our common stock.
Delaware law and our organizational documents may impede or discourage a takeover, which could deprive our investors of the opportunity to receive a premium for their shares.
We are a Delaware corporation and the antitakeover provisions of Delaware law impose various impediments to the ability of a third party to acquire control of us, even if a change of control would be beneficial to our existing stockholders. In addition, provisions of our Amended Certificate and Amended Bylaws may make it more difficult for, or prevent a third party from, acquiring control of us without the approval of our Board of Directors. Among other things, these provisions:
| • | classify our Board of Directors so that only some of our directors are elected each year; |
| • | do not permit cumulative voting in the election of directors, which would otherwise allow less than a majority of stockholders to elect director candidates; |
| • | delegate the sole power of a majority of the Board of Directors to fix the number of directors; |
| • | provide the power of our Board of Directors to fill any vacancy on our board, whether such vacancy occurs as a result of an increase in the number of directors or otherwise; |
39
Table of Contents
| • | authorize the issuance of “blank check” preferred stock without any need for action by stockholders; |
| • | impose limitations on the ability of our stockholders to call special meetings and act by written consent; and |
| • | establish advance notice requirements for nominations for election to our Board of Directors or for proposing matters that can be acted on by stockholders at stockholders’ meetings. |
Additionally, Section 203 of the Delaware General Corporation Law (the “DGCL”) prohibits a publicly held Delaware corporation from engaging in a business combination with an interested stockholder, generally a person, which together with any “interested” stockholder, or within the last three years has owned, 15% of our voting stock, for a period of which such person became an interested stockholder, unless the business combination is approved in a prescribed manner.
We have elected not to opt out of Section 203 of the DGCL. We expect, however, to include a provision in our Amended Certificate that will exempt us from the provisions of the DGCL with respect to combinations between any member of the Apollo Group (including any portfolio company thereof), on the one hand, and us, on the other.
The foregoing factors, as well as the significant common stock ownership by our equity sponsor, could impede a merger, takeover or other business combination or discourage a potential investor from making a tender offer for our common stock, which, under certain circumstances, may adversely impact prevailing market prices for our common stock. See “Description of Capital Stock.”
Our Amended Certificate will provide that the Court of Chancery of the State of Delaware will be the sole and exclusive forum for substantially all disputes between us and our stockholders, which could limit our stockholders’ ability to obtain a favorable judicial forum for disputes with us or our directors, officers or employees.
Our Amended Certificate will provide that, unless we consent in writing to the selection of an alternative forum, the Court of Chancery of the State of Delaware is the sole and exclusive forum for (a) any derivative action or proceeding brought on our behalf; (b) any action asserting a claim for or based on a breach of a fiduciary duty owed by any of our current or former directors or officers or other employees of the Company to the Company or to the Company’s stockholders, including a claim alleging the aiding and abetting of such a breach of fiduciary duty; (c) any action asserting a claim against the Company or any of our current or former directors, officers or other employees arising pursuant to any provision of the DGCL or our Amended Certificate or our Amended Bylaws; (d) any action asserting a claim related to or involving the Company that is governed by the internal affairs doctrine; or (e) any action asserting an “internal corporate claim” as that term is defined in Section 115 of the DGCL. The choice of forum provision may limit a stockholder’s ability to bring a claim in a judicial forum that it finds favorable for disputes with us or our directors, officers, or other employees, which may discourage such lawsuits against us and our directors, officers and other employees. Alternatively, if a court were to find the choice of forum provision contained in our Amended Certificate to be inapplicable or unenforceable in an action, we may incur additional costs associated with resolving such action in other jurisdictions, which could adversely impact our business, financial condition or results of operations.
We may issue shares of preferred stock in the future, which could make it difficult for another company to acquire us or could otherwise adversely affect holders of our common stock, which could depress the price of our common stock.
Our Amended Certificate will authorize us to issue one or more series of preferred stock. Our Board of Directors will have the authority to determine the preferences, limitations and relative rights of shares of preferred stock and to fix the number of shares constituting any series and the designation of such series, without any further
40
Table of Contents
vote or action by our stockholders. Our preferred stock could be issued with voting, liquidation, dividend and other rights superior to the rights of our common stock. The potential issuance of preferred stock may delay or prevent a change in control of us, discouraging bids for our common stock at a premium to the market price and may adversely impact prevailing market prices for our common stock and the voting and other rights of the holders of shares of our common stock.
You will suffer immediate and substantial dilution in the net tangible book value of the common stock you purchase.
Prior investors have paid substantially less per share than the price per share in this Offering. The initial offering price is substantially higher than the net tangible book value per share of the outstanding common stock immediately after this Offering. Accordingly, based on our net tangible book value as of December 31, 2016, assuming an initial public offering price of $ per share (the midpoint of the price range set forth on the cover page of this prospectus), we expect that purchasers of common stock in this Offering will experience immediate and substantial dilution of approximately $ per share. See “Dilution.”
We are a holding company and rely on dividends and other payments, advances and transfers of funds from our subsidiaries to meet our obligations and pay dividends.
We are a holding company and we conduct all of our operations through our subsidiaries. As a result, we rely on our subsidiaries for dividends and other payments to generate the funds necessary to meet our financial obligations and to pay any dividends with respect to our common stock. The ability of our subsidiaries to pay dividends or to make other payments or distributions to us depends substantially on their respective operating results and is subject to restrictions under, among other things, the laws of their jurisdiction of organization (which may limit the amount of funds available for the payment of dividends), agreements of those subsidiaries, the terms of our financing arrangements and the terms of any future financing arrangements of our subsidiaries. In addition, the earnings from, or other available assets of, our subsidiaries, may not be sufficient to pay dividends or make distributions or loans to enable us to pay any dividends on our common stock.
Fulfilling our obligations incident to being a public company, including with respect to the requirements of and related rules under the Sarbanes-Oxley Act of 2002 and the Dodd-Frank Act, will be expensive and time-consuming and any delays or difficulties in satisfying these obligations could have a material adverse effect on our future results of operations and our stock price.
After the consummation of this Offering, we will be subject to reporting, accounting and corporate governance requirements of the NASDAQ, the Securities Exchange Act of 1934, as amended, the Sarbanes-Oxley Act and Dodd-Frank Wall Street Reform and Consumer Protection Act (“Dodd-Frank”). The Sarbanes-Oxley Act requires that we maintain effective disclosure controls and procedures and internal control for financial reporting. Under Section 404 of the Sarbanes-Oxley Act and pursuant to the terms therein, our independent public accountants auditing our financial statements must attest to the effectiveness of our internal control over financial reporting. To continue to maintain the effectiveness of our disclosure controls and procedures and internal control over financial reporting following the consummation of this Offering, significant resources and management oversight will be required. To comply with the requirements of being a public company, we may need to undertake various actions, such as implementing new internal controls and procedures and hiring additional accounting or internal audit staff. In addition, we may identify control deficiencies which could result in a material weakness or significant deficiency. Furthermore, if we are unable to conclude that our disclosure controls and procedures and internal control over financial reporting are effective, or if our independent public accounting firm is unable to provide us with an unqualified report as to management’s assessment of the effectiveness of our internal control over financial reporting in future years, investors may lose confidence in our financial reports and our stock price may decline.
41
Table of Contents
In addition, Dodd-Frank, which amended the Sarbanes-Oxley Act and other federal laws, has created uncertainty for public companies and we cannot predict with any certainty the requirements of the regulations that will ultimately be adopted under Dodd-Frank or how such regulations will affect the cost of compliance for a company with publicly traded common stock. There is likely to be continuing uncertainty regarding compliance matters because the application of these laws and regulations, which are subject to varying interpretations, may evolve over time as new guidance is provided by regulatory and governing bodies. We intend to invest resources to comply with these evolving laws and regulations, which may result in increased general and administrative expenses and divert management’s time and attention from other business concerns. Furthermore, if our compliance efforts differ from the activities that regulatory and governing bodies expect or intend due to ambiguities related to interpretation or practice, we may face legal proceedings initiated by such regulatory or governing bodies and our business may be harmed. In addition, new rules and regulations may make it more difficult for us to attract and retain qualified directors and officers and may make it more expensive for us to obtain director and officer liability insurance.
If securities analysts do not publish research or reports about our company, or if they publish unfavorable commentary about us or our industry or downgrade our common stock, the price of our common stock could decline.
The trading market for our common stock will depend in part on the research and reports that third-party securities analysts publish about our company and our industry. One or more analysts could downgrade our common stock or issue other negative commentary about our company or our industry. In addition, we may be unable or slow to attract research coverage. Alternatively, if one or more of these analysts cease coverage of our company, we could lose visibility in the market. As a result of one or more of these factors, the trading price of our common stock could decline.
Risks Related to Our Indebtedness
Our substantial indebtedness could impair our financial flexibility, competitive position and financial condition.
We have a substantial amount of indebtedness and other obligations. As of December 31, 2016, on a pro forma basis giving effect to this Offering and the use of the estimated net proceeds thereof, we would have had $ million in aggregate principal amount of total debt outstanding, which includes $ million of indebtedness under a series of 10.25% senior notes which will mature on February 15, 2023 and which were issued by Presidio Holdings Inc. (successor by merger to Aegis Merger Sub, Inc.), a direct wholly owned subsidiary of the Company (“Presidio Holdings” and such notes, the “Senior Notes”), $ million of indebtedness under a series of 10.25% senior subordinated notes which will mature on February 15, 2023 and which were issued by Presidio Holdings (the “Subordinated Notes” and, together with the Senior Notes, the “Notes”), $ million of indebtedness under the February 2015 Credit Agreement (without giving effect to undrawn letters of credit), and no obligations owed under our $250 million accounts receivable securitization facility (the “Receivables Securitization Facility”). See “Description of Certain Indebtedness.”
Our substantial indebtedness could have important consequences. For example, it could:
| • | limit our ability to obtain additional financing in the future for working capital, capital expenditures and acquisitions; |
| • | make it more difficult for us to satisfy our obligations under the terms of our financing arrangements; |
| • | make it more difficult to comply with the obligations of our debt instruments, including restrictive covenants and borrowing conditions, the failure of which could result in an event of default under the agreements governing our other indebtedness; |
42
Table of Contents
| • | limit our ability to refinance our indebtedness on terms acceptable to us or at all; |
| • | limit our flexibility to plan for and to adjust to changing business and market conditions in the industry in which we operate and increase our vulnerability to general adverse economic and industry conditions; |
| • | require us to dedicate a substantial portion of our cash flow from operations to make interest and principal payments on our debt, thereby limiting the availability of our cash flow to fund future investments, capital expenditures, working capital, business activities, acquisitions and other general corporate requirements; |
| • | limit our ability to obtain additional financing for working capital and capital expenditures to fund growth or for general corporate purposes, even when necessary to maintain adequate liquidity, particularly if any ratings assigned to our debt securities by rating organizations were revised downward; |
| • | subject us to higher levels of indebtedness than our competitors, which may cause a competitive disadvantage and may reduce our flexibility in responding to increased competition; and |
| • | expose us to the risk of increased interest rates, as certain of our borrowings, including borrowings under the February 2015 Credit Agreement and the Receivables Securitization Facility, are at variable rates of interest. |
In addition, the terms of the agreements governing our indebtedness contain restrictive covenants that limit our ability to engage in activities that may be in our long-term best interests. Our failure to comply with those covenants could result in an event of default, which, if not cured or waived, could result in the acceleration of our debts. The occurrence of any one of these events could adversely impact our business, financial condition or results of operations, as well as our prospects or ability to satisfy our debt obligations.
In addition to the restrictions contained in our indebtedness, the agreements governing our accounts payable facility with Castle Pines Capital LLC (the “CPC Facility”) also contain restrictive covenants that may limit our ability to engage in activities that may be in our long-term best interests. Our failure to comply with those covenants could result in the termination of the CPC Facility and the acceleration of our obligations thereunder.
Despite our substantial indebtedness level, we may still be able to incur substantial additional amounts of debt that could further exacerbate the risks associated with our indebtedness.
We and our subsidiaries may be able to incur substantial additional indebtedness in the future. Although the terms of the Receivables Securitization Facility, the indentures governing our Notes and the February 2015 Credit Agreement contain restrictions on our and our subsidiaries’ ability to incur additional indebtedness, these restrictions are subject to a number of important qualifications and exceptions and the indebtedness incurred in compliance with these restrictions could be substantial. For example, as of December 31, 2016, on a pro forma basis giving effect to this Offering and the use of the estimated net proceeds thereof, we would have had approximately $ million available for additional borrowing under the revolving credit facility under our February 2015 Credit Agreement (without giving effect to letters of credit) and $ million available under the Receivables Securitization Facility. These restrictions also will not prevent us from incurring obligations that do not constitute indebtedness. Following this Offering, we may opportunistically raise debt capital, subject to market and other conditions, to refinance our existing capital structure or for strategic alternatives and general corporate purposes as part of our growth strategy. There can be no assurance that such debt capital will be available to us on a timely basis, at reasonable rates or at all. If new debt is added to our existing debt levels, the related risks that we face would intensify and we may not be able to meet all of our debt obligations.
43
Table of Contents
The agreements governing our debt contain, and future financing arrangements may contain, various covenants that limit our ability to take certain actions and require us to meet financial maintenance tests. Failure to comply with these terms could adversely impact our financial condition.
Our financing arrangements, including the indentures governing our Notes, the February 2015 Credit Agreement and the Receivables Securitization Facility, contain restrictions, covenants and events of default that, among other things, require us to satisfy certain financial tests and maintain certain financial ratios and restrict our ability to incur additional indebtedness and to refinance our existing indebtedness. Financing arrangements that we enter into in the future could contain similar restrictions and could additionally require us to comply with similar, new or additional financial tests or to maintain similar, new or additional financial ratios. The terms of our existing financing arrangements, financing arrangements that we enter into in the future and any future indebtedness may impose various restrictions and covenants on us that could limit our ability to pay dividends, respond to market conditions, provide for capital investment needs or take advantage of business opportunities because they limit the amount of additional borrowings we may incur. These restrictions include compliance with, or maintenance of, certain financial tests and ratios and may limit or prohibit our ability to, among other things:
| • | borrow money or guarantee debt; |
| • | create liens; |
| • | pay dividends on or redeem or repurchase stock or other securities; |
| • | make investments and acquisitions; |
| • | enter into or permit to exist contractual limits on the ability of our subsidiaries to pay dividends to us; |
| • | enter into new lines of business; |
| • | enter into transactions with affiliates; and |
| • | sell assets or merge with other companies. |
Various risks, uncertainties and events beyond our control could affect our ability to comply with these restrictions and covenants. Failure to comply with any of the restrictions and covenants in our existing or future financing arrangements could result in a default under those arrangements and under other arrangements containing cross-default provisions.
An event of default would permit lenders to accelerate the maturity of the debt under these arrangements and to foreclose upon any collateral securing the debt. Under such circumstances, we might not have sufficient funds or other resources to satisfy all of our obligations, including our debt obligations. In addition, the limitations imposed by our financing agreements on our ability to incur additional debt and to take other actions might significantly impair our ability to obtain other financing.
To service our indebtedness and other cash needs, we require a significant amount of cash. Our ability to generate cash depends on many factors beyond our control.
Our ability to satisfy our debt obligations and to fund any planned capital expenditures, dividends and other cash needs will depend in part upon the future financial and operating performance of our subsidiaries and upon our ability to renew or refinance borrowings. We cannot assure you that our business will generate cash flow from operations, or that we will be able to draw under our revolving credit facility or otherwise, in an
44
Table of Contents
amount sufficient to fund our liquidity needs, including the payment of principal and interest on our indebtedness. Prevailing economic conditions and financial, business, competitive, legislative, regulatory and other factors, many of which are beyond our control, will affect our ability to make these payments.
If we are unable to make payments, refinance our debt or obtain new financing under these circumstances, we may consider other options, including:
| • | sales of assets; |
| • | sales of equity; |
| • | reduction or delay of capital expenditures, strategic acquisitions, investments and alliances; or |
| • | negotiations with our lenders to restructure the applicable debt. |
These alternative measures may not be successful and may not permit us to meet our scheduled debt service obligations. Our ability to restructure or refinance our debt will depend on the condition of the capital markets and our financial condition at such time. Any refinancing of our debt could be at higher interest rates and may require us to comply with more onerous covenants, which could further restrict our business operations. In addition, the terms of existing or future debt agreements, including the February 2015 Credit Agreement, the Receivables Securitization Facility and the indentures governing our Notes, may restrict us from adopting some of these alternatives. In the absence of sufficient cash flow from operating results and other resources, we could face substantial liquidity problems and could be required to dispose of material assets or operations to meet our debt service and other obligations. We may not be able to consummate those dispositions for fair market value, or at all. Furthermore, any proceeds that we could realize from any such dispositions may not be adequate to meet our debt service obligations then due. Our inability to generate sufficient cash flow to satisfy our debt obligations, or to refinance our indebtedness on commercially reasonable terms or at all, could adversely impact our business, financial condition or results of operation.
Any decline in the ratings of our corporate credit could adversely affect our ability to access capital.
Any decline in the ratings of our corporate credit or any indications from the rating agencies that their ratings on our corporate credit are under surveillance or review with possible negative implications could adversely impact our ability to access capital.
We are subject to fluctuations in interest rates.
Borrowings under the February 2015 Credit Agreement and the Receivables Securitization Facility are subject to variable rates of interest and expose us to interest rate risk. For example, assuming the revolving credit facility under the February 2015 Credit Agreement and the Receivables Securitization Facility are fully drawn along with the outstanding term loan balance as of December 31, 2016, on a pro forma basis, each 0.125% change in assumed blended interest rates would result in an approximately $1.2 million change in annual interest expense on indebtedness. At present, we do not have any existing interest rate swap agreements, which involve the exchange of floating for fixed rate interest payments to reduce interest rate volatility. However, we may decide to enter into such swaps in the future. If we do, we may not maintain interest rate swaps with respect to all of our variable rate indebtedness and any swaps we enter into may not fully mitigate our interest rate risk, may prove disadvantageous or may create additional risks.
45
Table of Contents
CAUTIONARY STATEMENT CONCERNING FORWARD-LOOKING STATEMENTS
This prospectus contains “forward-looking statements” that involve risks and uncertainties. You can identify forward-looking statements because they contain words such as “believes,” “expects,” “may,” “will,” “should,” “would,” “could,” “seeks,” “approximately,” “intends,” “plans,” “estimates,” or “anticipates” or similar expressions that relate to our strategy, plans or intentions. All statements we make relating to our estimated and projected earnings, margins, costs, expenditures, cash flows, growth rates and financial results or to our expectations regarding future industry trends are forward-looking statements. In addition, we, through our senior management, from time to time make forward-looking public statements concerning our expected future operations and performance and other developments. These forward-looking statements are subject to risks and uncertainties that may change at any time and, therefore, our actual results may differ materially from those that we expected. We derive many of our forward-looking statements from our operating budgets and forecasts, which are based upon many detailed assumptions. While we believe that our assumptions are reasonable, we caution that it is very difficult to predict the impact of known factors and it is impossible for us to anticipate all factors that could affect our actual results. All forward-looking statements are based upon information available to us on the date of this prospectus.
Important factors that could cause actual results to differ materially from our expectations, which we refer to as “cautionary statements,” are disclosed under “Risk Factors” and elsewhere in this prospectus, including, without limitation, in conjunction with the forward-looking statements included in this prospectus. All forward-looking information in this prospectus and subsequent written and oral forward-looking statements attributable to us, or to persons acting on our behalf, are expressly qualified in their entirety by the cautionary statements. Some of the factors that we believe could affect our results include:
| • | general economic conditions; |
| • | a reduced demand for our information technology solutions; |
| • | a decrease in spending on technology products by our federal and local government clients; |
| • | the availability of products from vendor partners and maintenance of vendor relationships; |
| • | the role of rapid innovation and the introduction of new products in our industry; |
| • | our ability to compete effectively in a competitive industry; |
| • | the termination of our client contracts; |
| • | the failure to effectively develop, maintain and operate our information technology systems; |
| • | our inability to adequately maintain the security of our information technology systems and clients’ confidential information; |
| • | investments in new services and technologies may not be successful; |
| • | the costs of litigation and losses if we infringe on the intellectual property rights of third parties; |
| • | inaccurate estimates of pricing terms with our clients; |
| • | failure to comply with the terms of our public sector contracts; |
| • | any failures by third-party contractors upon whom we rely to provide our services; |
| • | any failures by third-party commercial delivery services; |
46
Table of Contents
| • | our inability to retain or hire skilled technology professionals and key personnel; |
| • | our sales outside of the United States that subject us to additional risks; |
| • | the adverse impact of the United Kingdom’s decision to withdraw from the European Union; |
| • | the disruption to our supply chain if suppliers fail to provide products; |
| • | the risks associated with accounts receivables and inventory exposure; |
| • | the failure to realize the entire investment in leased equipment; |
| • | our inability to realize the full amount of our backlog; |
| • | our acquisitions may not achieve expectations; |
| • | fluctuations in our operating results; |
| • | potential litigation and claims; |
| • | changes in accounting rules, tax legislation and other legislation; |
| • | increased costs of labor and benefits; |
| • | our inability to focus our resources, maintain our business structure and manage costs effectively; |
| • | the failure to deliver technical support services of sufficient quality; |
| • | the failure to meet our growth objectives and strategies; |
| • | the ineffectiveness of our internal controls; |
| • | the risks related to this Offering; |
| • | the risks pertaining to our substantial level of indebtedness; and |
| • | the other factors discussed in the section of this prospectus entitled “Risk Factors.” |
We caution you that the foregoing list of important factors may not contain all of the material factors that are important to you. In addition, in light of these risks and uncertainties, the matters referred to in the forward-looking statements contained in this prospectus may not, in fact, occur. Accordingly, investors should not place undue reliance on those statements. We undertake no obligation to publicly update or revise any forward-looking statement as a result of new information, future events or otherwise, except as otherwise required by law.
47
Table of Contents
We estimate that the net proceeds to us from the sale of our common stock in this Offering will be approximately $ , or approximately $ , if the underwriters elect to exercise in full their option to purchase additional shares of common stock from us, assuming an initial public offering price of $ per share, the midpoint of the price range set forth on the cover page of this prospectus and after deducting estimated underwriting discounts and commissions and estimated offering expenses payable by us.
We intend to use the net proceeds from this Offering as follows:
(a) We intend to use approximately $ million of the net proceeds from this Offering to repurchase all of our outstanding Subordinated Notes, of which $111.8 million in aggregate principal amount are currently outstanding, at a purchase price of 110.25% of the principal amount thereof, plus accrued and unpaid interest, if any, up to but excluding the date of such repurchase. If the net proceeds from this Offering are not sufficient to repurchase all of our outstanding Subordinated Notes at such price, we will purchase a lesser aggregate principal amount of Subordinated Notes with the available net proceeds. The Subordinated Notes accrue interest at a rate equal to 10.25% per annum and will mature on February 15, 2023.
(b) We intend to use approximately $ million of the net proceeds from this Offering to redeem $97.5 million in aggregate principal amount of our Senior Notes at a redemption price of 110.25% of the principal amount thereof, plus accrued and unpaid interest, if any, up to but excluding the date of such redemption. Net proceeds from this Offering will be applied first, to repurchase up to all of our Subordinated Notes, and second, to redeem up to $97.5 million in aggregate principal amount of our Senior Notes, as described above. If the net proceeds from this Offering are not sufficient to redeem $97.5 million in aggregate principal amount of our Senior Notes at such price after repurchasing all of our outstanding Subordinated Notes, as described above, we will redeem a lesser aggregate principal amount of Senior Notes with the available net proceeds. The Senior Notes accrue interest at a rate equal to 10.25% per annum and will mature on February 15, 2023.
(c) To the extent any net proceeds from this Offering remain after repurchasing all of our Subordinated Notes and redeeming $97.5 million in aggregate principal amount of our Senior Notes, we intend to use such remaining net proceeds for working capital or general corporate purposes, including the repayment of amounts outstanding under our February 2015 Credit Agreement or our Receivables Securitization Facility. Borrowings under the February 2015 Credit Agreement bear interest at a rate equal to either (a) a LIBOR rate determined by reference to the costs of funds for Eurodollar deposits for the interest period relevant to such borrowing, adjusted for certain additional costs, subject to a 1.00% floor in the case of term loans, plus a margin of 3.50%, or (b) a base rate plus 1.00%, in each case, plus a margin of 2.50%. Borrowings under the Receivables Securitization Facility bear interest based on a Eurodollar borrowing rate plus a utilized program fee of 1.40%. See “Description of Certain Indebtedness.”
Under the terms of the indenture governing the Senior Notes, on or prior to February 15, 2018, we may, subject to certain restrictions, redeem up to 40% of the original aggregate principal amount of the Senior Notes, with the net cash proceeds of one or more equity offerings at a price equal to 110.25% of the principal amount thereof, plus accrued and unpaid interest, if any, up to but excluding the date of redemption, provided that at least 50% of the original aggregate principal amount of the Senior Notes remain outstanding after such redemption. As of the date of this prospectus, up to $97.5 million in aggregate principal amount of the $250.0 million in original aggregate principal amount of our outstanding Senior Notes (of which $222.5 million is currently outstanding) can be redeemed pursuant to the optional redemption provision described in the preceding sentence. See “Description of Certain Indebtedness—Senior Notes and Subordinated Notes.”
On February 15, 2017, we entered into a Notes Purchase Agreement with Deutsche Bank AG (the “Notes Purchase Agreement”), who is the holder of 100% of our outstanding Subordinated Notes, pursuant to which we agreed to use the net proceeds of this Offering to repurchase, and Deutsche Bank AG agreed to sell to
48
Table of Contents
us, all of the outstanding Subordinated Notes (or, to the extent the net proceeds are not sufficient to repurchase all Subordinated Notes, a lesser amount) at the Subordinated Notes Repurchase Price. Following the repurchase by us of the Subordinated Notes, we anticipate that any such Subordinated Notes would be cancelled.
An alternative investment vehicle formed by the limited partners of the Apollo Funds owns substantially all of the economic interests in the Subordinated Notes pursuant to certain derivative arrangements entered into with Deutsche Bank AG. As such, we presently anticipate that any portion of the proceeds of this Offering used by the Company to repurchase the Subordinated Notes would be paid, directly or indirectly, to such alternative investment vehicle (net of any amounts owed by such alternative investment vehicle to Deutsche Bank AG pursuant to such derivative arrangements).
An independent special committee of our Board of Directors, advised by its own counsel and financial advisor, recommended to our Board of Directors for their approval that the net proceeds of this Offering be used to repurchase our Subordinated Notes. The Board of Directors subsequently approved the proposed use of proceeds of this Offering, including the repurchase of the Subordinated Notes and the redemption of the Senior Notes.
Each $1.00 increase (decrease) in the assumed initial public offering price of $ per share, which is the midpoint of the price range set forth on the cover page of this prospectus, would increase (decrease) the net proceeds to us from this Offering by approximately $ , assuming the number of shares offered by us, as set forth on the cover page of this prospectus, remains the same.
Each increase (decrease) of 1.0 million shares in the number of shares sold in this Offering, as set forth on the cover page of this prospectus, would increase (decrease) the net proceeds to us from this Offering by approximately $ , assuming the assumed initial public offering price of $ per share, which is the midpoint of the price range set forth on the cover page of this prospectus, remains the same. The information discussed above is illustrative only and will adjust based on the actual initial public offering price and other terms of this Offering determined at pricing. Any increase or decrease in the net proceeds would not change our intended use of proceeds.
The expected use of proceeds from this Offering represents our intentions based upon our current plans and business conditions. The amounts and timing of our actual expenditures may vary significantly depending on numerous factors and any unforeseen cash needs. As a result, management will retain broad discretion over the allocation of the net proceeds from this Offering, subject to the terms and conditions of the Notes Purchase Agreement.
49
Table of Contents
We currently expect to retain all available funds and any future earnings for use in the operation and expansion of our business. We do not currently anticipate paying dividends on our common stock following this Offering. Any declaration and payment of future dividends to holders of our common stock will be at the discretion of our Board of Directors and will depend on many factors, including our financial condition, earnings, capital requirements, level of indebtedness, statutory and contractual restrictions applying to the payment of dividends and other considerations that our Board of Directors deems relevant. Because we are a holding company and have no direct operations, we will only be able to pay dividends from our available cash on hand and any funds we receive from our subsidiaries. The terms of our indebtedness may restrict us from paying dividends, or may restrict our subsidiaries from paying dividends to us. Under Delaware law, dividends may be payable only out of surplus, which is our net assets minus our liabilities and our capital, or, if we have no surplus, out of our net profits for the fiscal year in which the dividend is declared and/or the preceding fiscal year. See “Description of Certain Indebtedness” and “Description of Capital Stock—Common Stock.”
50
Table of Contents
The following table sets forth cash and cash equivalents and capitalization as of December 31, 2016:
| • | on a historical basis; and |
| • | on a pro forma basis to reflect (a) the sale of shares of our common stock in this Offering at the initial public offering price of $ per share, the midpoint of the offering price range set forth on the cover page of this prospectus, providing net proceeds to us from this Offering (after deducting the estimated underwriting discounts and commissions and estimated offering expenses payable by us) of approximately $ million and (b) the use of the estimated net proceeds from this Offering as described under “Use of Proceeds.” |
This table should be read together with “Risk Factors,” “Use of Proceeds,” “Selected Historical Consolidated Financial Data,” “Management’s Discussion and Analysis of Financial Condition and Results of Operations,” “Unaudited Pro Forma Condensed Consolidated Financial Information” and our historical consolidated financial statements and related notes included elsewhere in this prospectus.
| As of December 31, 2016 |
||||||||
| (in millions, except share and per share data) | Historical | Pro Forma | ||||||
| Cash and cash equivalents |
$ | 45.5 | $ | |||||
|
|
|
|
|
|||||
| Long-term debt, including current portion: |
||||||||
| Term loan facility, due February 2022 |
703.6 | |||||||
| Revolving credit facility |
— | |||||||
| Receivables Securitization Facility |
— | |||||||
| 10.25% Senior Notes due February 2023 |
222.5 | |||||||
| 10.25% Subordinated Notes due February 2023 |
111.8 | |||||||
|
|
|
|
|
|||||
| Total debt |
1,037.9 | |||||||
| Stockholders’ equity: |
||||||||
| Preferred stock, $0.01 par value; 100 shares authorized, zero shares issued and outstanding (historical); shares authorized, shares issued and outstanding (pro forma) |
— | |||||||
| Common stock, $0.01 par value; 100,000,000 shares authorized, 35,969,689 shares issued and outstanding (historical); shares authorized, shares issued and outstanding (pro forma) |
0.4 | |||||||
| Additional paid-in capital |
375.3 | |||||||
| Accumulated deficit |
(18.7 | ) | ||||||
|
|
|
|
|
|||||
| Total stockholders’ equity |
357.0 | |||||||
|
|
|
|
|
|||||
| Total capitalization |
$ | 1,394.9 | $ | |||||
|
|
|
|
|
|||||
The table set forth above is based on the number of shares of our common stock outstanding as of December 31, 2016. The table does not reflect:
| • | shares of our common stock issuable upon the exercise of options outstanding as of December 31, 2016 at a weighted average exercise price of $ per share; and |
| • | shares of common stock reserved for issuance under our share-based compensation plans. |
51
Table of Contents
Unless otherwise indicated, the table set forth above assumes:
| • | no exercise of the underwriters’ option to purchase additional shares; |
| • | an initial public offering price of $ , which is the midpoint of the price range set forth on the cover page of this prospectus; and |
| • | the filing of our Amended Certificate and the adoption of our Amended Bylaws, each of which will become effective prior to the consummation of this Offering. |
This table has not been adjusted to reflect the Stock Split. After the Stock Split is effected, and before the effectiveness of the registration statement of which this prospectus forms a part, the Registrant will update the historical per share data in this table to reflect the Stock Split.
Each $1.00 increase (decrease) in the assumed public offering price of $ per share, which is the midpoint of the price range set forth on the cover page of this prospectus would increase (decrease) each of pro forma additional paid-in capital, total stockholders’ equity and total capitalization by approximately $ million, $ million and $ million, respectively, assuming that the number of shares offered by us, as set forth on the front cover of this prospectus, remains the same. We may also increase or decrease the number of shares we are offering. Each increase of 1.0 million shares in the number of shares offered by us at an assumed public offering price of $ per share, which is the midpoint of the price range set forth on the cover page of this prospectus, would increase each of our pro forma additional paid-in capital, total stockholders’ equity and total capitalization by approximately $ million, $ million and $ million, respectively. Similarly, each decrease of 1.0 million shares in the number of shares offered by us, at an assumed offering price of $ per share, which is the midpoint of the price range set forth on the cover page of this prospectus, would decrease each of our as adjusted additional paid-in capital, total stockholders’ equity and total capitalization by approximately $ million, $ million and $ million, respectively. The pro forma information discussed above is illustrative only and will be adjusted based on the actual public offering price and other terms of this Offering determined at pricing.
52
Table of Contents
If you invest in our common stock, your interest will be diluted to the extent of the difference between the initial public offering price per share of our common stock and the net tangible book value per share of our common stock upon completion of this Offering. Dilution results from the fact that the per share offering price of our common stock is substantially in excess of the book value per share attributable to our existing shareholders.
Our net tangible book deficit as of December 31, 2016 was $1,213.2 million, or $33.73 per share of common stock (without giving effect to the Stock Split). After the Stock Split is effected, and before the effectiveness of the registration statement of which this prospectus forms a part, the Registrant will update the per share data in this section to reflect the Stock Split. Net tangible book value per share represents total tangible assets less total liabilities divided by the number of shares of common stock outstanding.
After giving effect to (i) the sale by us of shares of common stock in this Offering at the initial public offering price of $ per share, which is the midpoint of the price range set forth on the cover page of this prospectus and after deducting estimated underwriting discounts and commissions and estimated offering expenses payable by us; and (ii) the use of proceeds therefrom as set forth under the heading “Use of Proceeds,” as if each had occurred on December 31, 2016, our as adjusted net tangible book value (deficit) as of would have been $ million, or $ per share. This amount represents an immediate dilution of $ per share to new investors, or approximately % of the assumed public offering price of $ per share, which is the midpoint of the price range set forth on the cover page of this prospectus.
Each $1.00 increase (decrease) in the assumed initial public offering price of $ per share, which is the midpoint of the price range set forth on the cover page of this prospectus, would increase (decrease) our as adjusted net tangible book value (deficit) after this Offering by approximately $ per share and increase (decrease) the dilution per share of common stock to new investors by $ per share, assuming the number of shares offered by us, as set forth on the cover page of this prospectus, remains the same and after deducting underwriting discounts and commissions and estimated offering expenses payable by us.
The following table illustrates this dilution on a per share basis:
| Assumed initial public offering price per share of common stock |
$ | |||||||
| Net tangible book deficit per share of common stock as of December 31, 2016 |
$ | |||||||
| Increase in net tangible book value per share attributable to this Offering |
||||||||
|
|
|
|||||||
| As adjusted net tangible book value (deficit) per share after this Offering |
||||||||
|
|
|
|||||||
| Dilution per share to new investors |
$ | |||||||
|
|
|
The following table sets forth, as of December 31, 2016, the total number of shares of common stock owned by existing stockholders and to be owned by new investors, the total consideration paid to us and the average price per share paid by existing stockholders and to be paid by new investors purchasing shares of common stock in this Offering. The calculation below is based on an assumed initial public offering price of $ per share, which is the midpoint of the price range set forth on the cover page of this prospectus, before deducting the estimated underwriting discounts and commissions and estimated offering expenses payable by us in connection with this Offering:
| Shares Purchased | Total Consideration | Average Price per Share |
||||||||||||||||||
| Number | Percent | Amount | Percent | |||||||||||||||||
| ($ in millions) | ||||||||||||||||||||
| Existing stockholders |
% | $ | % | $ | ||||||||||||||||
| New investors in this Offering |
% | $ | % | $ | ||||||||||||||||
|
|
|
|
|
|
|
|
|
|
|
|||||||||||
| Total |
100.0 | % | $ | 100.0 | % | $ | ||||||||||||||
|
|
|
|
|
|
|
|
|
|
|
|||||||||||
53
Table of Contents
A $1.00 increase (decrease) in the assumed initial offering price would increase (decrease) total consideration paid by new investors, total consideration paid by all stockholders and average price per share paid by all stockholders by $ million, $ million and $ per share, respectively. An increase (decrease) of 1.0 million in the number of shares offered by us would increase (decrease) total consideration paid by new investors, total consideration paid by all stockholders and average price per share paid by all stockholders by $ million, $ million and $ per share, respectively.
The tables and calculations above assume no exercise of outstanding options. As of December 31, 2016, there were shares of our common stock issuable upon the exercise of options outstanding at a weighted average exercise price of $ per share. To the extent that the outstanding options are exercised or additional options are granted, there will be further dilution to new investors purchasing common stock in this Offering. See “Description of Capital Stock.”
54
Table of Contents
SELECTED HISTORICAL CONSOLIDATED FINANCIAL DATA
The following table presents our selected historical consolidated financial data for all the periods presented. The selected historical consolidated statements of operations and cash flow data for the six months ended December 31, 2016 and 2015 and the selected historical consolidated balance sheet information as of December 31, 2016 have been derived from our unaudited interim consolidated financial statements, included elsewhere in this prospectus. The selected historical consolidated statements of operations and cash flow data for the fiscal year ended June 30, 2016, for the period from November 20, 2014 to June 30, 2015 (Successor), for the period from July 1, 2014 to February 1, 2015 (Predecessor) and for the fiscal year ended June 30, 2014 and the selected historical consolidated balance sheet information as of June 30, 2016 and 2015 have been derived from our audited historical consolidated financial statements, included elsewhere in this prospectus. The selected historical consolidated statements of operations and cash flow data for the years ended June 30, 2013 and 2012 and the selected historical consolidated balance sheet information as of June 30, 2014, 2013 and 2012 have been derived from our historical audited consolidated financial information, not included in this prospectus.
The unaudited interim selected historical consolidated financial data have been prepared on the same basis as the audited consolidated financial statements and, in the opinion of our management, consist only of normal and recurring adjustments necessary for a fair presentation of the information set forth herein.
On February 2, 2015, the Apollo Funds completed the Presidio Acquisition. Under the terms of the Presidio Acquisition, Presidio Holdings Inc. (the Predecessor) became a wholly owned subsidiary of Presidio, Inc. (the Successor). As a result of the Presidio Acquisition, the financial information for all periods ending on or after February 2, 2015 represent the financial information of the Successor. Periods ending prior to February 2, 2015 represent the financial information of the Predecessor. From November 20, 2014 (its date of inception) to February 1, 2015, the Successor had no operations or activities other than the incurrence of transaction costs related to the Presidio Acquisition.
You should read the following information together with “Risk Factors,” “Use of Proceeds,” “Capitalization” and “Management’s Discussion and Analysis of Financial Condition and Results of Operations” and our historical consolidated financial statements and related notes included elsewhere in this prospectus. Historical results are not necessarily indicative of the results to be expected in the future, and interim financial results are not necessarily indicative of results that may be expected for the full fiscal year.
| Predecessor | Successor | |||||||||||||||||||||||||||||||
| (in millions, except share and per share data) |
Fiscal year ended June 30, |
July 1, 2014 to February 1, 2015 |
November 20, 2014 to June 30, 2015 |
Fiscal year ended June 30, 2016 |
Six months ended December 31, 2015 |
Six months ended December 31, 2016 |
||||||||||||||||||||||||||
| 2012 | 2013 | 2014 | ||||||||||||||||||||||||||||||
| Statement of operations data: |
||||||||||||||||||||||||||||||||
| Revenue |
$ | 1,763.8 | $ | 2,192.4 | $ | 2,266.0 | $ | 1,392.8 | $ | 985.5 | $ | 2,714.9 | $ | 1,374.6 | $ | 1,459.5 | ||||||||||||||||
| Cost of revenue |
1,399.7 | 1,778.8 | 1,812.0 | 1,103.5 | 788.5 | 2,174.3 | 1,104.8 | 1,168.0 | ||||||||||||||||||||||||
|
|
|
|
|
|
|
|
|
|
|
|
|
|
|
|
|
|||||||||||||||||
| Gross margin |
364.1 | 413.6 | 454.0 | 289.3 | 197.0 | 540.6 | 269.8 | 291.5 | ||||||||||||||||||||||||
| Operating expenses |
308.0 | 334.3 | 362.5 | 262.5 | 186.4 | 441.7 | 203.6 | 233.7 | ||||||||||||||||||||||||
|
|
|
|
|
|
|
|
|
|
|
|
|
|
|
|
|
|||||||||||||||||
| Operating income |
56.1 | 79.3 | 91.5 | 26.8 | 10.6 | 98.9 | 66.2 | 57.8 | ||||||||||||||||||||||||
| Interest expense |
32.4 | 33.1 | 34.3 | 21.4 | 46.7 | 81.9 | 39.4 | 41.6 | ||||||||||||||||||||||||
| Loss on disposal of business |
— | — | — | — | — | 6.8 | 6.8 | — | ||||||||||||||||||||||||
| Loss on extinguishment of debt |
— | 2.9 | 2.7 | 7.5 | 0.7 | 9.7 | 0.1 | 0.8 | ||||||||||||||||||||||||
| Other (income) expense, net |
2.2 | (1.9 | ) | (2.4 | ) | (0.2 | ) | 0.1 | 0.1 | 0.2 | 0.1 | |||||||||||||||||||||
|
|
|
|
|
|
|
|
|
|
|
|
|
|
|
|
|
|||||||||||||||||
| Total interest and other (income) expense |
34.6 | 34.1 | 34.6 | 28.7 | 47.5 | 98.5 | 46.5 | 42.5 | ||||||||||||||||||||||||
|
|
|
|
|
|
|
|
|
|
|
|
|
|
|
|
|
|||||||||||||||||
| Income (loss) before income taxes |
21.5 | 45.2 | 56.9 | (1.9 | ) | (36.9 | ) | 0.4 | 19.7 | 15.3 | ||||||||||||||||||||||
| Income tax expense (benefit) |
10.7 | 18.4 | 24.4 | 3.2 | (12.6 | ) | 3.8 | 9.2 | 6.3 | |||||||||||||||||||||||
|
|
|
|
|
|
|
|
|
|
|
|
|
|
|
|
|
|||||||||||||||||
| Net income (loss) |
$ | 10.8 | $ | 26.8 | $ | 32.5 | $ | (5.1 | ) | $ | (24.3 | ) | $ | (3.4 | ) | $ | 10.5 | $ | 9.0 | |||||||||||||
|
|
|
|
|
|
|
|
|
|
|
|
|
|
|
|
|
|||||||||||||||||
55
Table of Contents
| Predecessor | Successor | |||||||||||||||||||||||||||||||
| (in millions, except share and per share data) |
Fiscal year ended June 30, |
July 1, 2014 to February 1, 2015 |
November 20, 2014 to June 30, 2015 |
Fiscal year ended June 30, 2016 |
Six months ended December 31, 2015 |
Six months ended December 31, 2016 |
||||||||||||||||||||||||||
| 2012 | 2013 | 2014 | ||||||||||||||||||||||||||||||
| Earnings (loss) per share: |
||||||||||||||||||||||||||||||||
| Basic |
$ | 0.05 | $ | 0.06 | $ | (0.01 | ) | $ | (0.69 | ) | $ | (0.10 | ) | $ | 0.30 | $ | 0.25 | |||||||||||||||
| Diluted |
$ | 0.05 | $ | 0.06 | $ | (0.01 | ) | $ | (0.69 | ) | $ | (0.10 | ) | $ | 0.29 | $ | 0.24 | |||||||||||||||
| Weighted average shares used to compute net earnings (loss) per share: |
||||||||||||||||||||||||||||||||
| Basic |
560,416,333 | 561,829,775 | 561,886,602 | 35,005,269 | 35,558,981 | 35,264,021 | 35,967,493 | |||||||||||||||||||||||||
| Diluted |
570,097,325 | 572,656,299 | 561,886,602 | 35,005,269 | 35,558,981 | 36,052,159 | 37,312,195 | |||||||||||||||||||||||||
| Statement of cash flows data: |
||||||||||||||||||||||||||||||||
| Net cash provided by (used in) operating activities |
$ | 29.0 | $ | 46.2 | $ | 53.3 | $ | 74.5 | $ | (1.8 | ) | $ | 85.6 | $ | 7.2 | $ | 83.3 | |||||||||||||||
| Net cash used in investing activities |
(186.1 | ) | (65.8 | ) | (74.4 | ) | (71.3 | ) | (678.9 | ) | (322.0 | ) | (16.6 | ) | (62.6 | ) | ||||||||||||||||
| Net borrowings (repayments) on floor plan facility |
(0.5 | ) | 24.6 | 20.5 | (29.0 | ) | 50.8 | 20.9 | 24.9 | (36.4 | ) | |||||||||||||||||||||
| Other financing activities |
139.4 | (6.2 | ) | 0.5 | 24.3 | 718.2 | 160.2 | (4.6 | ) | 28.2 | ||||||||||||||||||||||
|
|
|
|
|
|
|
|
|
|
|
|
|
|
|
|
|
|||||||||||||||||
| Net cash provided by (used in) financing activities |
138.9 | 18.4 | 21.0 | (4.7 | ) | 769.0 | 181.1 | 20.3 | (8.2 | ) | ||||||||||||||||||||||
| Net increase (decrease) in cash and cash equivalents |
$ | (18.2 | ) | $ | (1.2 | ) | $ | (0.1 | ) | $ | (1.5 | ) | $ | 88.3 | $ | (55.3 | ) | $ | 10.9 | $ | 12.5 | |||||||||||
|
|
|
|
|
|
|
|
|
|
|
|
|
|
|
|
|
|||||||||||||||||
| Other financial data: |
||||||||||||||||||||||||||||||||
| Adjusted Revenue (1) |
$ | 1,648.1 | $ | 2,082.6 | $ | 2,149.9 | $ | 1,323.4 | $ | 940.8 | $ | 2,683.7 | $ | 1,342.9 | $ | 1,460.0 | ||||||||||||||||
| Adjusted EBITDA (2) |
$ | 126.9 | $ | 148.9 | $ | 167.0 | $ | 116.2 | $ | 68.6 | $ | 211.1 | $ | 116.6 | $ | 112.9 | ||||||||||||||||
| Adjusted EBITDA margin (2)(3) |
7.7 | % | 7.1 | % | 7.8 | % | 8.8 | % | 7.3 | % | 7.9 | % | 8.7 | % | 7.7 | % | ||||||||||||||||
| Adjusted Net Income (4) |
$ | 55.4 | $ | 73.6 | $ | 81.7 | $ | 58.6 | $ | 13.4 | $ | 81.2 | $ | 47.9 | $ | 46.9 | ||||||||||||||||
| Adjusted Net Income per share: |
||||||||||||||||||||||||||||||||
| Basic |
$ | 0.13 | $ | 0.15 | $ | 0.10 | $ | 0.38 | $ | 2.28 | $ | 1.36 | $ | 1.30 | ||||||||||||||||||
| Diluted |
$ | 0.13 | $ | 0.14 | $ | 0.10 | $ | 0.38 | $ | 2.23 | $ | 1.33 | $ | 1.26 | ||||||||||||||||||
| Weighted average shares used to compute Adjusted Net Income per share: (4) |
||||||||||||||||||||||||||||||||
| Basic |
560,416,333 | 561,829,775 | 561,886,602 | 35,005,269 | 35,558,981 | 35,264,021 | 35,967,493 | |||||||||||||||||||||||||
| Diluted |
570,097,325 | 572,656,299 | 593,353,683 | 35,655,707 | 36,415,101 | 36,052,159 | 37,312,195 | |||||||||||||||||||||||||
| Predecessor | Successor | |||||||||||||||||||||||||||
| As of June 30, |
As of June 30, |
As of December 31, |
||||||||||||||||||||||||||
| (in millions, except per share data) | 2012 | 2013 | 2014 | 2015 | 2016 | 2016 | ||||||||||||||||||||||
| Balance sheet data: |
||||||||||||||||||||||||||||
| Cash and cash equivalents |
$ | 9.8 | $ | 8.6 | $ | 8.5 | $ | 88.3 | $ | 33.0 | $ | 45.5 | ||||||||||||||||
| Total assets |
1,506.6 | 1,505.5 | 1,545.0 | 2,444.4 | 2,623.1 | 2,675.8 | ||||||||||||||||||||||
| Total long-term debt |
446.4 | 413.3 | 618.7 | 933.7 | 1,038.0 | 1,008.1 | ||||||||||||||||||||||
| Total liabilities |
1,214.8 | 1,188.7 | 1,448.5 | 2,108.6 | 2,276.2 | 2,318.8 | ||||||||||||||||||||||
| Total stockholders’ equity |
291.8 | 316.8 | 96.5 | 335.8 | 346.9 | 357.0 | ||||||||||||||||||||||
| Cash dividends declared per common share |
$ | — | $ | — | $ | 0.46 | $ | — | $ | — | $ | — | ||||||||||||||||
56
Table of Contents
| (1) | We define Adjusted Revenue as revenue adjusted to exclude (i) revenue generated by disposed businesses and (ii) noncash purchase accounting adjustments to revenue as a result of our acquisitions. The following table presents a reconciliation of Adjusted Revenue from Revenue. |
| Predecessor | Successor | |||||||||||||||||||||||||||||||
| (in millions) |
Fiscal year ended June 30, |
July 1, 2014 to February 1, 2015 |
November 20, 2014 to June 30, 2015 |
Fiscal year ended June 30, 2016 |
Six months ended December 31, 2015 |
Six months ended December 31, 2016 |
||||||||||||||||||||||||||
| 2012 | 2013 | 2014 | ||||||||||||||||||||||||||||||
| Revenue |
$ | 1,763.8 | $ | 2,192.4 | $ | 2,266.0 | $ | 1,392.8 | $ | 985.5 | $ | 2,714.9 | $ | 1,374.6 | $ | 1,459.5 | ||||||||||||||||
| Adjustments: |
||||||||||||||||||||||||||||||||
| Revenue from disposed business (a) |
(115.7 | ) | (109.8 | ) | (116.1 | ) | (69.4 | ) | (46.0 | ) | (32.8 | ) | (32.8 | ) | — | |||||||||||||||||
| Purchase accounting adjustments (b) |
— | — | — | — | 1.3 | 1.6 | 1.1 | 0.5 | ||||||||||||||||||||||||
|
|
|
|
|
|
|
|
|
|
|
|
|
|
|
|
|
|||||||||||||||||
| Total adjustments |
(115.7 | ) | (109.8 | ) | (116.1 | ) | (69.4 | ) | (44.7 | ) | (31.2 | ) | (31.7 | ) | 0.5 | |||||||||||||||||
|
|
|
|
|
|
|
|
|
|
|
|
|
|
|
|
|
|||||||||||||||||
| Adjusted Revenue |
$ | 1,648.1 | $ | 2,082.6 | $ | 2,149.9 | $ | 1,323.4 | $ | 940.8 | $ | 2,683.7 | $ | 1,342.9 | $ | 1,460.0 | ||||||||||||||||
|
|
|
|
|
|
|
|
|
|
|
|
|
|
|
|
|
|||||||||||||||||
| (a) | “Revenue from disposed business” represents the removal of the historical revenue of Atlantix prior to the sale of the business. |
| (b) | “Purchase accounting adjustments” include the noncash reduction to revenue associated with deferred revenue step down fair value adjustments in connection with purchase accounting. |
| (2) | We define Adjusted EBITDA as net income (loss) plus (i) total depreciation and amortization, (ii) interest and other (income) expense and (iii) income tax expense (benefit), as further adjusted to eliminate noncash share-based compensation expense, purchase accounting adjustments, transaction costs, other costs and earnings from disposed business. The following table presents a reconciliation of Adjusted EBITDA from Net income (loss). |
| Predecessor | Successor | |||||||||||||||||||||||||||||||
| (in millions) |
Fiscal year ended June 30, |
July 1, 2014 to February 1, 2015 |
November 20, 2014 to June 30, 2015 |
Fiscal year ended June 30, 2016 |
Six months ended December 31, 2015 |
Six months ended December 31, 2016 |
||||||||||||||||||||||||||
| 2012 | 2013 | 2014 | ||||||||||||||||||||||||||||||
| Adjusted EBITDA Reconciliation: |
||||||||||||||||||||||||||||||||
| Net income (loss) |
$ | 10.8 | $ | 26.8 | $ | 32.5 | $ | (5.1 | ) | $ | (24.3 | ) | $ | (3.4 | ) | $ | 10.5 | $ | 9.0 | |||||||||||||
| Total depreciation and amortization (a) |
53.5 | 56.8 | 50.6 | 24.9 | 32.1 | 81.7 | 38.0 | 43.6 | ||||||||||||||||||||||||
| Interest and other (income) expense |
34.6 | 34.1 | 34.6 | 28.7 | 47.5 | 98.5 | 46.5 | 42.5 | ||||||||||||||||||||||||
| Income tax expense (benefit) |
10.7 | 18.4 | 24.4 | 3.2 | (12.6 | ) | 3.8 | 9.2 | 6.3 | |||||||||||||||||||||||
|
|
|
|
|
|
|
|
|
|
|
|
|
|
|
|
|
|||||||||||||||||
| EBITDA |
109.6 | 136.1 | 142.1 | 51.7 | 42.7 | 180.6 | 104.2 | 101.4 | ||||||||||||||||||||||||
| Adjustments: |
||||||||||||||||||||||||||||||||
| Share-based compensation expense |
5.1 | 2.8 | 5.5 | 20.1 | 1.0 | 2.2 | 1.2 | 1.0 | ||||||||||||||||||||||||
| Purchase accounting adjustments (b) |
— | — | — | — | 4.9 | 3.9 | 2.2 | 0.6 | ||||||||||||||||||||||||
| Transaction costs (c) |
12.8 | 6.8 | 14.8 | 42.6 | 21.3 | 20.6 | 8.9 | 6.0 | ||||||||||||||||||||||||
| Other costs (d) |
3.4 | 9.6 | 13.0 | 4.5 | 1.9 | 5.6 | 1.9 | 3.9 | ||||||||||||||||||||||||
| Earnings from disposed business (e) |
(4.0 | ) | (6.4 | ) | (8.4 | ) | (2.7 | ) | (3.2 | ) | (1.8 | ) | (1.8 | ) | — | |||||||||||||||||
|
|
|
|
|
|
|
|
|
|
|
|
|
|
|
|
|
|||||||||||||||||
| Total adjustments |
17.3 | 12.8 | 24.9 | 64.5 | 25.9 | 30.5 | 12.4 | 11.5 | ||||||||||||||||||||||||
|
|
|
|
|
|
|
|
|
|
|
|
|
|
|
|
|
|||||||||||||||||
| Adjusted EBITDA |
$ | 126.9 | $ | 148.9 | $ | 167.0 | $ | 116.2 | $ | 68.6 | $ | 211.1 | $ | 116.6 | $ | 112.9 | ||||||||||||||||
|
|
|
|
|
|
|
|
|
|
|
|
|
|
|
|
|
|||||||||||||||||
57
Table of Contents
| (a) | “Total depreciation and amortization” equals the sum of (i) depreciation and amortization within total operating expenses and (ii) depreciation and amortization recorded as part of cost of revenue within our consolidated financial statements. |
| (b) | “Purchase accounting adjustments” include charges associated with noncash adjustments to acquired assets and liabilities in connection with purchase accounting, such as recognition of increased cost of revenue in connection with an inventory step up fair value adjustment, recognition of reduced revenue in connection with a deferred revenue step down fair value adjustment and recognition of increased office rent expense associated with a fair value adjustment to the liabilities associated with deferred rent. |
| (c) | “Transaction costs” (1) of $12.8 million for the fiscal year ended June 30, 2012 includes acquisition-related expenses of $3.4 million related to stay and retention bonuses, $1.6 million related to severance charges, and $7.8 million related to transaction-related legal, accounting and tax fees; (2) of $6.8 million for the fiscal year ended June 30, 2013 includes acquisition-related expenses of $1.9 million related to stay and retention bonuses, $0.2 million related to severance charges, $2.4 million related to transaction-related legal, accounting and tax fees and $2.3 million related to professional fees and expenses associated with debt refinancings; (3) of $14.8 million for the fiscal year ended June 30, 2014 includes acquisition-related expenses of $0.8 million related to stay and retention bonuses, $0.3 million related to severance charges, $0.7 million related to transaction-related legal, accounting and tax fees and $13.0 million related to professional fees and expenses associated with debt refinancings; (4) of $42.6 million for the Predecessor period from July 1, 2014 to February 1, 2015 includes acquisition-related expenses of $0.3 million related to stay and retention bonuses, $0.2 million related to severance charges, $31.2 million related to transaction-related legal, accounting and tax fees in connection with the Presidio Acquisition and $10.9 million related to professional fees and expenses associated with debt refinancings; (5) of $21.3 million for the Successor period from November 20, 2014 to June 30, 2015 includes acquisition-related expenses of $0.6 million related to stay and retention bonuses, $0.6 million related to severance charges, $18.5 million related to transaction-related legal, accounting and tax fees in connection with the Presidio Acquisition and $1.6 million related to professional fees and expenses associated with debt refinancings; (6) of $20.6 million for the fiscal year ended June 30, 2016 includes acquisition-related expenses of $3.0 million related to stay and retention bonuses, $1.1 million related to severance charges, $8.7 million related to transaction-related advisory and diligence fees, $6.0 million related to transaction-related legal, accounting and tax fees and $1.8 million related to professional fees and expenses associated with debt refinancings; (7) of $8.9 million for the six months ended December 31, 2015 includes acquisition-related expenses of $1.0 million related to stay and retention bonuses, $0.9 million related to severance charges, $3.5 million related to transaction-related advisory and diligence fees and $3.5 million related to transaction-related legal, accounting and tax fees; and (8) of $6.0 million for the six months ended December 31, 2016 includes acquisition-related expenses of $2.2 million related to stay and retention bonuses, $3.4 million related to transaction-related advisory and diligence fees and $0.4 million related to transaction-related legal, accounting and tax fees. |
| (d) | “Other costs” (1) of $3.4 million for the fiscal year ended June 30, 2012 includes expenses of $2.4 million related to payments to our former sponsor for advisory and consulting services and $1.0 million related to certain acquisition-related integration and related costs; (2) of $9.6 million for the fiscal year ended June 30, 2013 includes expenses of $0.8 million associated with the integration of previously acquired managed services platforms into one system, certain expenses of $0.4 million related to unusual office start-up development costs, certain unusual legal expenses of $1.6 million, $2.1 million related to payments to our former sponsor for advisory and consulting services and $4.7 million related to certain acquisition-related integration and related costs; (3) of $13.0 million for the fiscal year ended June 30, |
58
Table of Contents
| 2014 includes expenses of $3.7 million associated with the integration of previously acquired managed services platforms into one system, certain expenses of $1.1 million related to unusual office start-up development costs, an unusual and non-recurring loss of $1.7 million related to an Atlantix customer receivable, certain unusual legal expenses of $2.2 million, $2.1 million related to payments to our former sponsor for advisory and consulting services and $2.2 million related to certain acquisition-related integration and related costs; (4) of $4.5 million for the Predecessor period from July 1, 2014 to February 1, 2015 includes expenses of $2.2 million associated with the integration of previously acquired managed services platforms into one system, certain expenses of $0.4 million related to unusual office start-up development costs, $1.6 million related to payments to our former sponsor for advisory and consulting services and $0.3 million related to other non-recurring items; (5) of $1.9 million for the Successor period from November 20, 2014 to June 30, 2015 includes expenses of $1.0 million associated with the integration of previously acquired managed services platforms into one system, $0.7 million related to certain non-recurring costs incurred in the development of our new cloud service offerings and certain unusual legal expenses of $0.2 million; (6) of $5.6 million for the fiscal year ended June 30, 2016 includes expenses of $0.5 million associated with the integration of previously acquired managed services platforms into one system, $3.4 million related to certain non-recurring costs incurred in the development of our new cloud service offerings, certain expenses of $0.5 million related to unusual office start-up development costs and certain unusual legal expenses of $1.2 million; (7) of $1.9 million for the six months ended December 31, 2015 includes expenses of $0.4 million associated with the integration of previously acquired managed services platforms into one system, $1.0 million related to certain non-recurring costs incurred in the development of our new cloud service offerings and certain unusual legal expenses of $0.5 million; and (8) of $3.9 million for the six months ended December 31, 2016 includes $3.6 million related to certain non-recurring costs incurred in the development of our new cloud service offerings and $0.3 million related to severance charges. |
| (e) | “Earnings from disposed business” represents the removal of the historical earnings contribution of Atlantix prior to the sale of the business. |
| (3) | Adjusted EBITDA margin represents the ratio of Adjusted EBITDA to Adjusted Revenue. |
| (4) | For purposes of this table, weighted average shares has not been adjusted to reflect the Stock Split. After the Stock Split is effected, and before the effectiveness of the registration statement of which this prospectus forms a part, the Registrant will update the per share data in this table to reflect the Stock Split. |
59
Table of Contents
| (4) | We define Adjusted Net Income as net income (loss) adjusted to exclude (i) amortization of intangible assets, (ii) amortization of debt issuance costs, (iii) losses recognized on the disposal of business, (iv) losses on extinguishment of debt, (v) noncash share-based compensation expense, (vi) purchase accounting adjustments, (vii) transaction costs, (viii) other costs, (ix) earnings from disposed business and (x) the income tax impact associated with the foregoing items and adjusted for (1) the impact of permanently nondeductible expenses, (2) the impact of tax-deductible goodwill and intangible assets resulting from certain historical acquisitions and (3) the impact of discrete tax items. The following table presents a reconciliation of Adjusted Net Income from Net income (loss). |
| Predecessor | Successor | |||||||||||||||||||||||||||||||
| (in millions) |
Fiscal year ended June 30, |
July 1, 2014 to February 1, 2015 |
November 20, 2014 to June 30, 2015 |
Fiscal year ended June 30, 2016 |
Six months ended December 31, 2015 |
Six months ended December 31, 2016 |
||||||||||||||||||||||||||
| 2012 | 2013 | 2014 | ||||||||||||||||||||||||||||||
| Adjusted Net Income reconciliation: |
||||||||||||||||||||||||||||||||
| Net income (loss) |
$ | 10.8 | $ | 26.8 | $ | 32.5 | $ | (5.1 | ) | $ | (24.3 | ) | $ | (3.4 | ) | $ | 10.5 | $ | 9.0 | |||||||||||||
| Adjustments: |
||||||||||||||||||||||||||||||||
| Amortization of intangible assets |
43.4 | 45.3 | 38.3 | 18.3 | 26.4 | 67.2 | 31.4 | 36.8 | ||||||||||||||||||||||||
| Amortization of debt issuance costs |
4.6 | 4.7 | 4.4 | 2.4 | 2.7 | 7.6 | 3.5 | 3.4 | ||||||||||||||||||||||||
| Loss on disposal of business |
— | — | — | — | — | 6.8 | 6.8 | — | ||||||||||||||||||||||||
| Loss on extinguishment of debt |
— | 2.9 | 2.7 | 7.5 | 0.7 | 9.7 | 0.1 | 0.8 | ||||||||||||||||||||||||
| Share-based compensation expense |
5.1 | 2.8 | 5.5 | 20.1 | 1.0 | 2.2 | 1.2 | 1.0 | ||||||||||||||||||||||||
| Purchase accounting adjustments (a) |
— | — | — | — | 4.9 | 3.9 | 2.2 | 0.6 | ||||||||||||||||||||||||
| Transaction costs (b) |
12.8 | 6.8 | 14.8 | 42.6 | 21.3 | 20.6 | 8.9 | 6.0 | ||||||||||||||||||||||||
| Other costs (c) |
3.4 | 9.6 | 13.0 | 4.5 | 1.9 | 5.6 | 1.9 | 3.9 | ||||||||||||||||||||||||
| Earnings from disposed business (d) |
(4.0 | ) | (6.4 | ) | (8.4 | ) | (2.7 | ) | (3.2 | ) | (1.8 | ) | (1.8 | ) | — | |||||||||||||||||
| Income tax impact of adjustments (e) |
(20.7 | ) | (18.9 | ) | (21.1 | ) | (29.0 | ) | (18.0 | ) | (37.2 | ) | (16.8 | ) | (14.6 | ) | ||||||||||||||||
|
|
|
|
|
|
|
|
|
|
|
|
|
|
|
|
|
|||||||||||||||||
| Total adjustments |
44.6 | 46.8 | 49.2 | 63.7 | 37.7 | 84.6 | 37.4 | 37.9 | ||||||||||||||||||||||||
|
|
|
|
|
|
|
|
|
|
|
|
|
|
|
|
|
|||||||||||||||||
| Adjusted Net Income |
$ | 55.4 | $ | 73.6 | $ | 81.7 | $ | 58.6 | $ | 13.4 | $ | 81.2 | $ | 47.9 | $ | 46.9 | ||||||||||||||||
|
|
|
|
|
|
|
|
|
|
|
|
|
|
|
|
|
|||||||||||||||||
| (a) | “Purchase accounting adjustments” include charges associated with noncash adjustments to acquired assets and liabilities in connection with purchase accounting, such as recognition of increased cost of revenue in connection with an inventory step up fair value adjustment, recognition of reduced revenue in connection with a deferred revenue step down fair value adjustment and recognition of increased office rent expense associated with a fair value adjustment to the liabilities associated with deferred rent. |
| (b) | “Transaction costs” (1) of $12.8 million for the fiscal year ended June 30, 2012 includes acquisition-related expenses of $3.4 million related to stay and retention bonuses, $1.6 million related to severance charges, and $7.8 million related to transaction-related legal, accounting and tax fees; (2) of $6.8 million for the fiscal year ended June 30, 2013 includes acquisition-related expenses of $1.9 million related to stay and retention bonuses, $0.2 million related to severance charges, $2.4 million related to transaction-related legal, accounting and tax fees and $2.3 million related to professional fees and expenses associated with debt refinancings; (3) of $14.8 million for the fiscal year ended June 30, 2014 includes acquisition-related expenses of $0.8 million related to stay and retention bonuses, $0.3 million related to severance charges, $0.7 million related to transaction-related legal, accounting and tax fees and $13.0 million related to professional fees and expenses associated with debt refinancings; (4) of $42.6 million for the Predecessor period from July 1, 2014 to February 1, 2015 includes acquisition-related |
60
Table of Contents
| expenses of $0.3 million related to stay and retention bonuses, $0.2 million related to acquisition-related severance charges, $31.2 million related to transaction-related legal, accounting and tax fees in connection with the Presidio Acquisition and $10.9 million related to professional fees and expenses associated with debt refinancings; (5) of $21.3 million for the Successor period from November 20, 2014 to June 30, 2015 includes acquisition-related expenses of $0.6 million related to stay and retention bonuses, $0.6 million related to severance charges, $18.5 million related to transaction-related legal, accounting and tax fees in connection with the Presidio Acquisition and $1.6 million related to professional fees and expenses associated with debt refinancings; (6) of $20.6 million for the fiscal year ended June 30, 2016 includes acquisition-related expenses of $3.0 million related to stay and retention bonuses, $1.1 million related to severance charges, $8.7 million related to transaction-related advisory and diligence fees, $6.0 million related to transaction-related legal, accounting and tax fees and $1.8 million related to professional fees and expenses associated with debt refinancings; (7) of $8.9 million for the six months ended December 31, 2015 includes acquisition-related expenses of $1.0 million related to stay and retention bonuses, $0.9 million related to severance charges, $3.5 million related to transaction-related advisory and diligence fees and $3.5 million related to transaction-related legal, accounting and tax fees; and (8) of $6.0 million for the six months ended December 31, 2016 includes acquisition-related expenses of $2.2 million related to stay and retention bonuses, $3.4 million related to transaction-related advisory and diligence fees and $0.4 million related to transaction-related legal, accounting and tax fees. |
| (c) | “Other costs” (1) of $3.4 million for the fiscal year ended June 30, 2012 includes expenses of $2.4 million related to payments to our former sponsor for advisory and consulting services and $1.0 million related to certain acquisition-related integration and related costs; (2) of $9.6 million for the fiscal year ended June 30, 2013 includes expenses of $0.8 million associated with the integration of previously acquired managed services platforms into one system, certain expenses of $0.4 million related to unusual office start-up development costs, certain unusual legal expenses of $1.6 million, $2.1 million related to payments to our former sponsor for advisory and consulting services and $4.7 million related to certain acquisition-related integration and related costs; (3) of $13.0 million for the fiscal year ended June 30, 2014 includes expenses of $3.7 million associated with the integration of previously acquired managed services platforms into one system, certain expenses of $1.1 million related to unusual office start-up development costs, an unusual and non-recurring loss of $1.7 million related to an Atlantix customer receivable, certain unusual legal expenses of $2.2 million, $2.1 million related to payments to our former sponsor for advisory and consulting services and $2.2 million related to certain acquisition-related integration and related costs; (4) of $4.5 million for the Predecessor period from July 1, 2014 to February 1, 2015 includes expenses of $2.2 million associated with the integration of previously acquired managed services platforms into one system, certain expenses of $0.4 million related to unusual office start-up development costs, $1.6 million related to payments to our former sponsor for advisory and consulting services and $0.3 million related to other non-recurring items; (5) of $1.9 million for the Successor period from November 20, 2014 to June 30, 2015 includes expenses of $1.0 million associated with the integration of previously acquired managed services platforms into one system, $0.7 million related to certain non-recurring costs incurred in the development of our new cloud service offerings and certain unusual legal expenses of $0.2 million; (6) of $5.6 million for the fiscal year ended June 30, 2016 includes expenses of $0.5 million associated with the integration of previously acquired managed services platforms into one system, $3.4 million related to certain non-recurring costs incurred in the development of our new cloud service offerings, certain expenses of $0.5 million related to unusual office start-up development costs and certain unusual legal expenses of $1.2 million; (7) of $1.9 million for the six months ended December 31, 2015 includes expenses of $0.4 million associated with the integration of previously acquired managed services platforms |
61
Table of Contents
| into one system, $1.0 million related to certain non-recurring costs incurred in the development of our new cloud service offerings and certain unusual legal expenses of $0.5 million; and (8) of $3.9 million for the six months ended December 31, 2016 includes $3.6 million related to certain non-recurring costs incurred in the development of our new cloud service offerings and $0.3 million related to severance charges. |
| (d) | “Earnings from disposed business” represents the removal of the historical earnings contribution of Atlantix prior to the sale of the business. |
| (e) | “Income tax impact of adjustments” includes an estimated tax impact of the adjustments to net income at the Company’s average statutory rate of 39.0%, except for (i) the adjustment of certain transaction costs that are permanently nondeductible for tax purposes and (ii) the impact of tax-deductible goodwill and intangible assets resulting from certain historical acquisitions, and further adjusted for discrete tax items, such as the remeasurement of deferred tax liabilities, due to state rate changes and write off of deferred tax assets resulting from reorganizations. |
62
Table of Contents
UNAUDITED PRO FORMA CONDENSED CONSOLIDATED FINANCIAL INFORMATION
The following unaudited pro forma condensed consolidated financial information and explanatory notes give effect to the completion of this Offering (assuming the issuance and sale by the Company of shares of common stock at an offering price of $ per share, which represents the midpoint of the price range set forth on the cover page of this prospectus, generating estimated net proceeds of $ million after deducting the estimated underwriting discounts and commissions and estimated offering expenses payable by us), further adjusted for the use of the proceeds from this Offering as described in the section entitled “Use of Proceeds” and the resulting capital structure upon consummation of this Offering. The following unaudited pro forma condensed consolidated financial information and explanatory notes do not include the full-year effect of the Netech Acquisition. See “Description of Certain Indebtedness.”
The historical consolidated financial information of the Company as of and for the six months ended December 31, 2016 has been derived from our unaudited interim financial statements included elsewhere in this prospectus. The historical consolidated financial information of the Company for the fiscal year ended June 30, 2016 has been derived from our audited consolidated financial statements included elsewhere in this prospectus.
The unaudited pro forma condensed consolidated balance sheet gives effect to transactions as if they had occurred on December 31, 2016 to the extent they have not been fully reflected in the historical consolidated financial statements. The unaudited pro forma condensed consolidated statement of operations for the six months ended December 31, 2016 gives effect to the transactions described above as if they had occurred on July 1, 2015. The unaudited pro forma condensed consolidated statement of operations for the fiscal year ended June 30, 2016 gives effect to the transactions described above as if they had occurred on July 1, 2015. The unaudited pro forma financial information set forth below is based upon available information and assumptions that we believe are reasonable. The historical financial information has been adjusted to give effect to pro forma events that are (1) directly attributable to the transactions, (2) factually supportable and (3) with respect to the statements of operations, expected to have a continuing impact on the combined results. The unaudited pro forma condensed consolidated financial information is for illustrative and informational purposes only and is not intended to represent or be indicative of what our financial condition or results of operations would have been had the above transactions occurred on the dates indicated. The unaudited pro forma condensed consolidated financial information also should not be considered representative of our future financial condition or results of operations. The unaudited pro forma condensed consolidated financial information should be read in conjunction with the information included under the headings “Selected Historical Consolidated Financial Data,” “Capitalization,” “Management’s Discussion and Analysis of Financial Condition and Results of Operations,” “Use of Proceeds,” “Description of Capital Stock” and the consolidated financial statements and related notes of the Company included elsewhere in this prospectus. All pro forma adjustments and their underlying assumptions are described more fully in the notes to our unaudited pro forma condensed consolidated financial information.
63
Table of Contents
Presidio, Inc.
Unaudited Pro Forma Condensed Consolidated Balance Sheet
As of December 31, 2016
(in millions, except for share and per share data)
| Historical | Adjustments | Pro Forma | ||||||||||||
| Assets |
||||||||||||||
| Current Assets |
||||||||||||||
| Cash and cash equivalents |
$ | 45.5 | (a) | $ | ||||||||||
| Accounts receivable, net |
562.7 | |||||||||||||
| Unbilled accounts receivable |
126.3 | |||||||||||||
| Financing receivables, current portion |
89.1 | |||||||||||||
| Inventory |
40.0 | |||||||||||||
| Prepaid expenses and other current assets |
72.4 | |||||||||||||
|
|
|
|
|
|
|
|||||||||
| Total current assets |
936.0 | |||||||||||||
| Property and equipment, net |
33.5 | |||||||||||||
| Equipment under operating leases, net |
2.2 | |||||||||||||
| Financing receivables, less current portion |
114.0 | |||||||||||||
| Goodwill |
781.5 | |||||||||||||
| Identifiable intangible assets, net |
788.7 | |||||||||||||
| Other assets |
19.9 | |||||||||||||
|
|
|
|
|
|
|
|||||||||
| Total assets |
$ | 2,675.8 | $ | |||||||||||
|
|
|
|
|
|
|
|||||||||
| Liabilities and Stockholders’ Equity |
||||||||||||||
| Current Liabilities |
||||||||||||||
| Current maturities of long-term debt |
$ | 7.4 | $ | |||||||||||
| Accounts payable – trade |
457.7 | |||||||||||||
| Accounts payable – floor plan |
186.9 | |||||||||||||
| Accrued expenses and other current liabilities |
176.0 | (b) | ||||||||||||
| Discounted financing receivables, current portion |
82.8 | |||||||||||||
|
|
|
|
|
|
|
|||||||||
| Total current liabilities |
910.8 | |||||||||||||
| Long-term debt, net of debt issuance costs and current maturities |
1,000.7 | (c) | ||||||||||||
| Discounted financing receivables, less current portion |
103.7 | |||||||||||||
| Deferred income tax liabilities |
278.6 | |||||||||||||
| Other liabilities |
25.0 | |||||||||||||
|
|
|
|
|
|
|
|||||||||
| Total liabilities |
2,318.8 | |||||||||||||
| Stockholders’ Equity |
||||||||||||||
| Preferred stock; $0.01 par value; 100 shares authorized, zero shares issued and outstanding (historical); shares authorized, shares issued and outstanding (pro forma) |
||||||||||||||
| Common stock; $0.01 par value; 100,000,000 shares authorized, 35,969,689 shares issued and outstanding (historical); shares authorized, shares issued and outstanding (pro forma) |
0.4 | (d) | ||||||||||||
| Additional paid-in capital |
375.3 | (d) | ||||||||||||
| Accumulated deficit |
(18.7 | ) | (e) | |||||||||||
|
|
|
|
|
|
|
|||||||||
| Total stockholders’ equity |
357.0 | |||||||||||||
|
|
|
|
|
|
|
|||||||||
| Total liabilities and stockholders’ equity |
$ | 2,675.8 | $ | |||||||||||
|
|
|
|
|
|
|
|||||||||
The accompanying notes are an integral part of this Unaudited Pro Forma Condensed Consolidated balance sheet.
64
Table of Contents
Presidio, Inc.
Unaudited Pro Forma Condensed Consolidated Statement of Operations
Six Months Ended December 31, 2016
(in millions, except for share and per share data)
| Historical | Adjustments | Pro Forma | ||||||||||||||||||
| Revenue |
||||||||||||||||||||
| Product |
$ | 1,238.6 | $ | |||||||||||||||||
| Service |
220.9 | |||||||||||||||||||
|
|
|
|
|
|
|
|||||||||||||||
| Total revenue |
1,459.5 | |||||||||||||||||||
| Cost of revenue |
||||||||||||||||||||
| Product |
991.0 | |||||||||||||||||||
| Service |
177.0 | |||||||||||||||||||
|
|
|
|
|
|
|
|||||||||||||||
| Total cost of revenue |
1,168.0 | |||||||||||||||||||
|
|
|
|
|
|
|
|||||||||||||||
| Gross margin |
291.5 | |||||||||||||||||||
| Operating expenses |
||||||||||||||||||||
| Selling expenses |
134.1 | |||||||||||||||||||
| General and administrative expenses |
52.8 | |||||||||||||||||||
| Transaction costs |
6.0 | (f) | ||||||||||||||||||
| Depreciation and amortization |
40.8 | |||||||||||||||||||
|
|
|
|
|
|
|
|||||||||||||||
| Total operating expenses |
233.7 | |||||||||||||||||||
|
|
|
|
|
|
|
|||||||||||||||
| Operating income |
57.8 | |||||||||||||||||||
| Interest and other (income) expense |
||||||||||||||||||||
| Interest expense |
41.6 | (g) | ||||||||||||||||||
| Loss on extinguishment of debt |
0.8 | (h) | ||||||||||||||||||
| Other (income) expense, net |
0.1 | |||||||||||||||||||
|
|
|
|
|
|
|
|||||||||||||||
| Total interest and other (income) expense |
42.5 | |||||||||||||||||||
|
|
|
|
|
|
|
|||||||||||||||
| Income before income taxes |
15.3 | |||||||||||||||||||
| Income tax expense |
6.3 | (i) | ||||||||||||||||||
|
|
|
|
|
|
|
|||||||||||||||
| Net income |
$ | 9.0 | $ | |||||||||||||||||
|
|
|
|
|
|
|
|||||||||||||||
| Earnings per share |
||||||||||||||||||||
| Basic |
$ | 0.25 | (j) | |||||||||||||||||
| Diluted |
$ | 0.24 | (j) | |||||||||||||||||
| Weighted average shares |
||||||||||||||||||||
| Basic |
35,967,493 | (j) | ||||||||||||||||||
| Diluted |
37,312,195 | (j) | ||||||||||||||||||
The accompanying notes are an integral part of this Unaudited Pro Forma Condensed Consolidated statement of operations.
65
Table of Contents
Presidio, Inc. Unaudited Pro Forma Condensed Consolidated Statement of Operations Fiscal Year Ended June 30, 2016 (in millions, except for share and per share data)
| Historical | Adjustments | Pro Forma | ||||||||||||||||
| Revenue |
||||||||||||||||||
| Product |
$ | 2,319.8 | $ | |||||||||||||||
| Service |
395.1 | |||||||||||||||||
|
|
|
|
|
|
|
|||||||||||||
| Total revenue |
2,714.9 | |||||||||||||||||
| Cost of revenue |
||||||||||||||||||
| Product |
1,866.5 | |||||||||||||||||
| Service |
307.8 | |||||||||||||||||
|
|
|
|
|
|
|
|||||||||||||
| Total cost of revenue |
2,174.3 | |||||||||||||||||
|
|
|
|
|
|
|
|||||||||||||
| Gross margin |
540.6 | |||||||||||||||||
| Operating expenses |
||||||||||||||||||
| Selling expenses |
248.2 | |||||||||||||||||
| General and administrative expenses |
96.9 | |||||||||||||||||
| Transaction costs |
20.6 | (k) | ||||||||||||||||
| Depreciation and amortization |
76.0 | |||||||||||||||||
|
|
|
|
|
|
|
|||||||||||||
| Total operating expenses |
441.7 | |||||||||||||||||
|
|
|
|
|
|
|
|||||||||||||
| Operating income |
98.9 | |||||||||||||||||
| Interest and other (income) expense |
||||||||||||||||||
| Interest expense |
81.9 | (l) | ||||||||||||||||
| Loss on disposal of business |
6.8 | (m) | ||||||||||||||||
| Loss on extinguishment of debt |
9.7 | |||||||||||||||||
| Other (income) expense, net |
0.1 | |||||||||||||||||
|
|
|
|
|
|
|
|||||||||||||
| Total interest and other (income) expense |
98.5 | |||||||||||||||||
|
|
|
|
|
|
|
|||||||||||||
| Income before income taxes |
0.4 | |||||||||||||||||
| Income tax expense |
3.8 | (n) | ||||||||||||||||
|
|
|
|
|
|
|
|||||||||||||
| Net loss |
$ | (3.4 | ) | $ | ||||||||||||||
|
|
|
|
|
|
|
|||||||||||||
| Loss per share |
||||||||||||||||||
| Basic |
$ | (0.10 | ) | (o) | ||||||||||||||
| Diluted |
$ | (0.10 | ) | (o) | ||||||||||||||
| Weighted average shares |
||||||||||||||||||
| Basic |
35,558,981 | (o) | ||||||||||||||||
| Diluted |
35,558,981 | (o) | ||||||||||||||||
The accompanying notes are an integral part of this Unaudited Pro Forma Condensed Consolidated statement of operations.
66
Table of Contents
NOTES TO UNAUDITED PRO FORMA CONDENSED CONSOLIDATED FINANCIAL INFORMATION
Unaudited Pro Forma Condensed Consolidated Balance Sheet
| a) | Reflects the pro forma net adjustment of a $ million increase to cash and cash equivalents to reflect estimated net proceeds of approximately $ million from this Offering and the pro forma net adjustment of a $ million decrease to cash and cash equivalents to reflect the use of proceeds from this Offering including the repurchase of all of the outstanding Subordinated Notes and the redemption of $97.5 million in aggregate principal amount of the Senior Notes, plus, in each case, accrued and unpaid interest. Proceeds are net of fees and expenses. |
| b) | Reflects the pro forma net adjustment of $ million to accrued expenses and other current liabilities for the following items: |
| As of December 31, 2016 |
||||
| Accrued interest (1) |
||||
| Accrued transaction costs (2) |
||||
| Accrued stay bonuses (3) |
||||
| Accrued income taxes (4) |
||||
|
|
|
|||
| Total pro forma adjustment to accrued expenses and other current liabilities |
||||
|
|
|
|||
| (1) | Reflects the payment of accrued interest under indebtedness repurchased repaid or redeemed upon consummation of this Offering. |
| (2) | Reflects the accrual of transaction costs associated with the January 2017. |
| (3) | Reflects the acceleration of stay bonus expense as a result of the consummation of this Offering. |
| (4) | Reflects the pro forma adjustment to accrued income taxes attributable to pro forma adjustments using the Company’s blended federal and state income tax rate in effect at December 31, 2016 of 39.0%. We expect our effective tax rate to vary from these estimated statutory rates in future years. |
| c) | (i) Reflects the pro forma net adjustment of $ million to long-term debt, net of debt issuance costs and current maturities, to reflect the write off of unamortized debt issuance costs associated with the repayment of indebtedness as described in note (a) above and (ii) reflects the pro forma net adjustment of $ million to long-term debt, net of debt issuance costs and current maturities to reflect the repurchase of all of the outstanding Subordinated Notes and the redemption of $97.5 million in aggregate principal amount of the Senior Notes. |
| d) | Reflects the pro forma net adjustment of $ million and $ million to common stock and additional paid-in capital, respectively, to reflect (i) the issuance of shares of common stock in this Offering and the application of $ million in net proceeds to us from the sale of such shares to repay certain indebtedness as described in note (a) above, (ii) the Stock Split, which was effected on , 2017 and (iii) the recognition of share-based compensation for Tranches B and C, associated with the stock options discussed in Note 15 of the historical consolidated financial statements as of and for the fiscal year ended June 30, 2016. |
| e) | Reflects the pro forma adjustments to accumulated deficit for the following items: |
| As of December 31, 2016 |
||||
| Performance-based stock option expense (1) |
||||
| Transaction costs (2) |
||||
| Stay bonus expense (3) |
||||
| Loss on extinguishment of debt (4) |
||||
| Income tax expense (5) |
||||
|
|
|
|||
| Total pro forma adjustment to accumulated deficit |
||||
|
|
|
|||
67
Table of Contents
| (1) | Reflects the pro forma adjustment to accumulated deficit related to the share-based compensation expense for Tranches B and C, associated with the stock options discussed in Note 15 of the historical consolidated financial statements as of and for the fiscal year ended June 30, 2016, which has been recognized in connection with this Offering due to the performance condition being deemed probable. |
| (2) | Reflects the pro forma adjustment to accumulated deficit for transaction costs directly attributable to this Offering and the January 2017 Amendment. |
| (3) | Reflects the pro forma adjustment to accumulated deficit for the acceleration of stay bonuses as a result of this Offering. |
| (4) | Reflects the pro forma adjustment to accumulated deficit associated with the loss on extinguishment of debt resulting from (i) the write off of debt issuance costs described in (c) above and (ii) the recognition of the premium paid on indebtedness to be repurchased, repaid or redeemed with the net proceeds of this Offering. |
| (5) | Reflects the pro forma adjustment to income tax expense attributable to pro forma adjustments using the Company’s blended federal and state income tax rate in effect at December 31, 2016 of 39.0%. We expect our effective tax rate to vary from these estimated statutory tax rates in future years. |
Any decrease in net proceeds from the amount set forth in (a) above would decrease the amount of cash and cash equivalents on our balance sheet. An increase in net proceeds from the amount set forth in (a) above would increase the amount of cash and cash equivalents on our balance sheet.
Unaudited Pro Forma Condensed Consolidated Statements of Operations
As described in (e) above, we expect to recognize certain expenses in connection with the Offering. These expenses include certain non-recurring charges that have not been adjusted for in the unaudited pro forma condensed consolidated statements of operations including (i) $ million of share-based compensation expense for Tranches B and C, associated with the stock options discussed in Note 15 of the historical consolidated financial statements as of and for the fiscal year ended June 30, 2016, (ii) $ million in transaction costs directly attributable to this Offering and the January 2017 Amendment, (iii) $ million of expense associated with the acceleration of stay bonuses as a result of this Offering, and (iv) $ million of loss on extinguishment of debt resulting from (a) the write off of $ million of debt issuance costs and (b) the recognition of the $ million premium paid on the indebtedness to be repurchased, repaid or redeemed with the net proceeds of this Offering.
| f) | Reflects the pro forma adjustment to eliminate transaction costs directly attributable to this Offering for the six months ended December 31, 2016. |
| g) | Reflects the pro forma adjustments to interest expense for the following items: |
| Six months ended December 31, 2016 |
||||
| Decrease attributable to term loan prepayment in December 2016 (1) |
||||
| Decrease attributable to January 2017 Amendment (2) |
||||
| Decrease attributable to Subordinated Notes repurchase and Senior Notes redemption (3) |
||||
|
|
|
|||
| Total pro forma adjustment to interest expense |
||||
|
|
|
|||
| (1) | Reflects the pro forma adjustment to reduce interest expense associated with the $25.0 million voluntary prepayment of outstanding term loans under the February 2015 Credit Agreement made on December 30, 2016. |
| (2) | Reflects the pro forma adjustment to reduce interest expense associated with the reduced interest rate from the January 2017 Amendment. |
68
Table of Contents
| (3) | Reflects the pro forma adjustment to reduce interest expense associated with the repurchase of all of the outstanding Subordinated Notes and redemption of $97.5 million in aggregate principal amount of the Senior Notes upon consummation of this Offering. |
| h) | Reflects the pro forma adjustment to eliminate the $ million to loss on extinguishment of debt associated with the $25.0 million voluntary prepayment of outstanding term loans under the February 2015 Credit Agreement made on December 30, 2016. |
| i) | Reflects the pro forma adjustment to income tax expense computed by applying the Company’s blended U.S. federal and state statutory income tax rates to income before income taxes to the pro forma adjustments. The blended U.S. federal and state statutory income tax rate assumed to be in effect during the six months ended December 31, 2016 was 39.0%. |
| j) | The weighted average shares outstanding used to compute basic and diluted earnings per share have been adjusted to give effect to the issuance of shares of common stock in this Offering, based on an assumed initial public offering price of $ per share, which is the midpoint of the price range set forth on the cover page of this prospectus, as well as Stock Split, which was effected on , 2017. |
| k) | Reflects the pro forma adjustment to eliminate transaction costs directly attributable to this Offering for the fiscal year ended June 30, 2016. |
| l) | Reflects the pro forma adjustments to interest expense for the following items: |
| Fiscal Year Ended June 30, 2016 |
||||
| Decrease attributable to Subordinated Notes repurchase in August 2015 (1) |
||||
| Decrease attributable to the February 2016 Credit Agreement (2) |
||||
| Increase attributable to the February 2016 Incremental Term Loan (3) |
||||
| Increase attributable to the May 2016 Incremental Term Loan (4) |
||||
| Decrease attributable to Senior Notes repurchase in June 2016 (5) |
||||
| Decrease attributable to term loan prepayment in December 2016 (6) |
||||
| Decrease attributable to January 2017 Amendment (7) |
||||
| Decrease attributable to Subordinated Notes repurchase and Senior Notes redemption (8) |
||||
|
|
|
|||
| Total pro forma adjustment to interest expense |
||||
|
|
|
|||
| (1) | Reflects the pro forma adjustment to reduce interest expense associated with the repurchase of $38.2 million in aggregate principal amount of Subordinated Notes in August 2015. |
| (2) | Reflects the pro forma adjustment to eliminate the impact of borrowings under the February 2016 Credit Agreement that were made in February 2016 and repaid in full in May 2016 with the proceeds of the May 2016 Incremental Term Loan. |
| (3) | Reflects the pro forma adjustment to increase interest expense associated with the $25.0 million incremental term loan borrowing in February 2016. |
| (4) | Reflects the pro forma adjustment to increase interest expense associated with the $140.0 million incremental term loan borrowing in May 2016. |
| (5) | Reflects the pro forma adjustment to reduce interest expense associated with the repurchase of $27.6 million in aggregate principal amount of Senior Notes in June 2016. |
| (6) | Reflects the pro forma adjustment to reduce interest expense associated with the $25.0 million voluntary prepayment of outstanding term loans under the February 2015 Credit Agreement made on December 30, 2016. |
| (7) | Reflects the pro forma adjustment to reduce interest expense associated with the reduced interest rate from the January 2017 Amendment. |
69
Table of Contents
| (8) | Reflects the pro forma adjustment to reduce interest expense associated with the repurchase of all of the outstanding Subordinated Notes and the redemption of $97.5 million in aggregate principal amount of the Senior Notes upon consummation of this Offering. |
| m) | Reflects the pro forma adjustments to loss on extinguishment of debt for the following items: |
| Fiscal Year Ended June 30, 2016 |
||||
| August 2015 Repurchase of Subordinated Notes (1) |
||||
| June 2016 Repurchase of Senior Notes (2) |
||||
| February 2016 Credit Facility (3) |
||||
|
|
|
|||
| Total pro forma adjustment to loss on extinguishment of debt |
||||
|
|
|
|||
| (1) | Reflects the pro forma adjustment to eliminate the loss on extinguishment of debt associated with the August 2015 repurchase and retirement of $38.2 million in aggregate principle of Subordinated Notes. |
| (2) | Reflects the pro forma adjustment to eliminate the loss on extinguishment of debt associated with the June 2016 repurchases and retirements of $27.6 million in aggregate principle of Senior Notes. |
| (3) | Reflects the pro forma adjustment to eliminate the loss on extinguishment of debt associated with the repayment of the February 2016 Credit Facility. |
| n) | Reflects the pro forma adjustment to income tax expense computed by applying the Company’s blended U.S. federal and state statutory income tax rates to income before income taxes to the pro forma adjustments. The blended U.S. federal and state statutory income tax rate assumed to be in effect during the fiscal year ended June 30, 2016 was 39.0%. |
| o) | The weighted average shares outstanding used to compute basic and diluted loss per share have been adjusted to give effect to the issuance of shares of common stock in this Offering, based on an assumed initial public offering price of $ per share, which is the midpoint of the price range set forth on the cover page of this prospectus, as well as the Stock Split which was effected on , 2017. |
70
Table of Contents
MANAGEMENT’S DISCUSSION AND ANALYSIS OF FINANCIAL CONDITION AND RESULTS OF OPERATIONS
You should read the following discussion in conjunction with the historical consolidated financial statements of Presidio, Inc. and its subsidiaries and the related notes included elsewhere in this prospectus. This discussion contains forward-looking statements and involves numerous risks and uncertainties, including, but not limited to, those described in the “Risk Factors” section. Our actual results may differ materially from those contained in any forward-looking statements.
Overview
Presidio is a leading provider of IT solutions to the middle market in North America. We enable business transformation through our expertise in IT solutions, with a specific focus on Digital Infrastructure, Cloud and Security solutions. Our solutions are delivered through a broad suite of professional services including strategy, consulting, design and implementation. We complement our professional services with project management, technology acquisition, managed services, maintenance and support to offer a full lifecycle model. Our services-led lifecycle model leads to ongoing client engagement. As of June 30, 2016, we served approximately 7,000 middle-market, large and government organizations across a diverse range of industries.
We develop and maintain our long-term client relationships through a localized direct sales force of over 500 employees based in over 60 offices across the United States as of June 30, 2016. As a strategic partner and trusted advisor to our clients, we provide the expertise necessary to implement new solutions, as well as optimize and better leverage existing IT resources. We provide strategy, consulting, design, customized deployment, integration and lifecycle management through our team of approximately 1,600 engineers as of June 30, 2016, enabling us to architect and manage the ideal IT solutions for our clients. Our local delivery model, combining relationship managers and expert engineering teams, allows us to win and expand our client relationships.
We have three solution areas: (i) Digital Infrastructure, (ii) Cloud and (iii) Security. Within these areas, we offer customers enterprise-class solutions that are critical to driving digital transformation and expanding business capabilities. Examples of our solutions include advanced networking, IoT, data analytics, data center modernization, hybrid and multi-cloud, cyber risk management and enterprise mobility. These solutions are enabled by our expertise in foundational technologies, built upon our investments in network, data center, security, collaboration and mobility.
Digital Infrastructure Solutions: Our enterprise-class Digital Infrastructure solutions enable clients to deploy IT infrastructure that is cloud-flexible, mobile-ready, secure and insight-driven. We also make clients’ existing IT infrastructure more efficient and flexible for emerging technologies. Within Digital Infrastructure, we are focused on networking, collaboration, enterprise mobility, IoT and data analytics. Given the millions of potential configurations across technologies, our clients rely on our expertise to simplify the highly complex IT landscape.
Cloud Solutions: Companies are increasingly turning to us for help with their cloud strategy and adoption. We combine our highly specialized cloud professional services with our deep experience in cloud-managed services, converged infrastructure, server, storage, support and capacity-on-demand economic models to provide a complete lifecycle of cloud infrastructure solutions for our clients. Our proprietary tools, technical expertise and vendor-agnostic approach help our customers accelerate and simplify cloud adoption across the entire IT lifecycle.
Security Solutions: We use a risk-based security consulting methodology to assess, design, implement, manage and maintain information security solutions that protect our customers’ critical business data and protects against loss of client loyalty, corporate reputation and disruptions in ongoing operations. We offer cyber risk management, infrastructure security and managed security solutions to our clients. Through our NGRM, we
71
Table of Contents
provide comprehensive risk assessments, detailed reporting, ongoing reviews, process and program development, and training services. NGRM ensures that identified vulnerabilities are mitigated and business risk has been properly addressed. Because our customers’ infrastructures are constantly changing, our NGRM offering is structured as a recurring service with regular periodic assessments of the current security posture combined with ongoing monitoring and surveillance through our 7x24 Security Operations Centers. Our experience spans all major verticals including retail, education, healthcare, government, banking, pharmaceutical and others. We have expertise with HIPAA, PCI DSS, FISMA, the Sarbanes-Oxley Act and others. We help our clients design and implement information security programs consistent with industry best practices and comply with the regulatory mandates of their specific vertical that are flexible enough to help ensure information security in an ever-changing risk environment. Findings, recommendations and real time security posture status, including our proprietary Risk Management Score, are provided through a 7x24 portal that is accessible by our clients and is updated with the up to date vulnerabilities identified by several industry sources.
We help our clients establish both technical and non-technical security controls and practices to prevent, detect, correct and minimize the risk of loss or damage to information resources, disruption of access to information resources, and unauthorized disclosure of information. In addition to our NGRM program, we offer options for security strategy program development, security awareness training, technology exposure assessments and incident response.
Factors Affecting Our Operating Performance
We believe that the financial performance of our business and our future success are dependent upon many factors, including those highlighted in this section. Our operating performance will depend upon many variables, including the success of our growth strategies and the timing and size of investments and expenditures that we choose to undertake, as well as market growth and other factors that are not within our control.
Macroeconomic environment: Weak economic conditions generally, U.S. federal or other government spending cuts, a rising interest rate environment, uncertain tax and regulatory policies, weakening business confidence or a tightening of credit markets could cause our clients and potential clients to postpone or reduce spending on technology solutions, products or services. Our clients are diverse, including both public and private sector parties, but any long-term, severe or sustained economic downturn may adversely affect all of our clients.
Competitive markets: We believe that we are uniquely positioned to take advantage of the markets in which we operate because of our expertise and specialization. We focus on the middle-market segment of the IT Services market. Since most large-scale IT Service providers focus on larger enterprises and because smaller regional competitors are typically unable to provide end-to-end solutions, we believe the middle market is underpenetrated and underserved. Strategic and investment decisions by our competitors may affect our operating performance.
Delivery of complex technology solutions: Our vendor agnostic approach to the market allows us to develop optimal IT solutions for our clients based on what we view as the best mix of technologies. We deliver our end-to-end solutions through a full lifecycle model, which combines consulting, engineering, managed services, and technology to give us a significant competitive advantage compared to other IT providers. Our ability to effectively manage project engagements, including logistics, product availability, client requirements, engineering resources, and service levels, will affect our financial performance.
Vendor relationships: We are focused on developing and strengthening our relationships with OEMs. We partner with OEMs to deploy product offerings. Pricing and incentive programs are subject to change, and the loss of, change in business relationship with or change in the behavior, including the timing of fulfillment, of any key vendor partners, or the diminished availability of their products, may impact the timing of our sales or could reduce the supply and increase the cost of the products we sell. While we maintain existing relationships with large vendors, there is no guarantee that our vendor partners will continue to develop or produce information technology products that are popular with our clients. We maintain the ability to evolve our vendor relationships as necessary to respond to market trends.
72
Table of Contents
Seasonality: Our results may be affected by slight variances as a result of seasonality we may experience across our business. This seasonality is typically driven by budget cycles and spending patterns across our diverse client base. For example, our local, state and federal government clients operate on an annual budget cycle, most often on the basis of a fiscal year that begins October 1. Our private sector clients operate on an annual budget cycle, most often on the basis of a fiscal year that begins January 1. It is not uncommon to experience a higher level of contract awards, funding actions and overall government and private demand for services in the final months and weeks of the government and private fiscal years, respectively. Consequently, our revenue in the first and second quarters of our fiscal year may be greater than revenue recognized in the third and fourth quarters of our fiscal year.
Components of Results of Operations
There are a number of factors that impact the revenue and margin profile of the solutions we provide, including, but not limited to, solution and technology complexity, technical expertise requiring the combination of products and value-added services provided, as well as other elements that may be specific to a particular engagement.
Revenue and cost of revenue: Revenue from the sale of our solutions is primarily comprised of the sale of third-party products, software and maintenance along with the sale of Company and third-party services. We separately present product revenue and service revenue, along with the associated cost of revenue, in our consolidated statements of operations.
Product revenue: Our product revenue includes:
Revenue for hardware and software: Revenue from the sale of hardware and software products is generally recognized on a gross basis with the selling price to the client recorded as revenue and the acquisition cost of the product recorded as cost of revenue, net of vendor rebates. Revenue is generally recognized when the title and risk of loss are passed to the client. Hardware and software items can be delivered to clients in a variety of ways including as physical products shipped from our warehouse, via drop-shipment by the vendor or supplier, or via electronic delivery for software licenses.
Revenue for maintenance contracts: Revenue from the sale of third-party maintenance contracts is recognized net of the related cost of revenue. In a third-party maintenance contract, all services are provided by our third-party providers and as a result, we are acting as an agent and recognize revenue on a net basis at the date of sale, with revenue being equal to the gross margin on the transaction. As we are under no obligation to perform additional services, revenue is recognized at the time of sale as opposed to over the life of the maintenance agreement.
Revenue from leasing arrangements: Revenue recognition for information technology hardware and software products leased to clients is based on the type of the lease. Each lease is classified as either a direct financing lease, sales-type lease or operating lease. The majority of our leases are sales-type leases. At the inception of a sales-type lease, the present value of the non-cancelable rentals is recorded as revenue and equipment costs, less the present value of the estimated residual values, are recorded in cost of revenue. At the inception of an operating lease, the equipment assigned to the lease is recorded at cost as equipment under operating leases in our consolidated balance sheets and is depreciated on a straight-line basis over its useful life. Monthly payments are recorded as revenue within our consolidated statements of operations, with the depreciation expense associated with the equipment recorded in cost of product revenue.
73
Table of Contents
Service revenue: Our service revenue includes consulting and integration services, project management, managed services and support services.
Revenue for professional services: Revenue for professional services is generally recognized as the services are performed. For time and material service contracts, revenue is recognized at the contractual hourly rates for the hours performed during the period. For fixed price service contracts, revenue is recognized on a proportional performance method based on the labor hours completed compared to the total estimated hours for the scope of work with contract and revenue accrued or deferred as appropriate. Cost of revenue associated with professional services includes the compensation, benefits and other costs associated with our delivery and project management engineering team, as well as costs charged by subcontractors.
Revenue for managed services: Revenue for managed services is generally recognized on a straight-line basis over the term of the arrangement. We may incur upfront costs associated with professional and managed services including, but not limited to, purchasing maintenance arrangements and software licenses. These costs are initially deferred as prepaid expenses or other assets and expensed over the period that services are being provided as cost of revenue. In addition, cost of revenue includes the compensation, benefits and other costs associated with our managed services engineering team, costs charged by subcontractors and depreciation of the software used to deliver our managed services.
Gross margin: Our product gross margin is impacted by the complexity of hardware and software sold in our solutions, as well as the mix of third-party maintenance contracts. As described previously, our third-party maintenance sales are recognized on a net basis, resulting in the gross margin being recognized as revenue. Accordingly, higher attach rates of maintenance contracts to the sale of hardware and more successful renewals of expiring contracts have a significant favorable impact to our gross margin percentage.
Our service gross margin is primarily impacted by our ability to deliver on fixed price professional services engagements within scope, the ability to keep our delivery engineers utilized and the hourly bill rate charged to clients. The complexity of the solutions sold to our clients may require specialized engineering capabilities that can favorably impact the bill rate we charge. Our service revenue also includes third-party services. Generally, a higher mix of professional services delivered by our delivery engineers has a favorable impact on service gross margin. In addition, our managed services gross margins are favorably impacted by our ability to negotiate longer contracts with our clients, as well as renewing contracts that expire at a high rate. Generally, a higher percentage of our overall revenue relates to services sold to our clients when the technology complexity of our solutions increases. Accordingly, our gross margins are favorably impacted by our ability to deliver more complex solutions, which include professional and managed services.
Operating expenses: Our operating expenses include selling expenses, general and administrative expenses, transaction costs, and depreciation and amortization.
Selling expenses are comprised of compensation (including share-based compensation), variable incentive pay and benefits related to our sales personnel along with travel expenses and other employee related costs. Variable incentive pay is largely driven by our gross margin performance. We expect selling expenses to increase as a result of higher gross margin, as well as continued investment in our direct and indirect sales resources.
General and administrative expenses are comprised of compensation (including share-based compensation) and benefits of administrative personnel, including variable incentive pay and other administrative costs such as facilities expenses, professional fees and bad debt expense. We expect general and administrative expenses to increase due to our growth and the incremental costs associated with being a public company. However, on a forward-looking basis, we generally expect general and administrative expenses to decline as a percentage of our total revenue as we realize the benefits of scale.
74
Table of Contents
Transaction costs include acquisition-related expenses (such as stay and retention bonuses), severance charges, advisory and diligence fees, transaction-related legal, accounting, and tax fees, as well as professional fees and related out-of-pocket expenses associated with refinancing of debt and credit agreements. As a result of the transactions described in this prospectus, we expect transaction costs to be higher in the fiscal year ended June 30, 2017.
Depreciation and amortization primarily includes the amortization of acquired intangible assets associated with our acquisitions.
Total interest and other (income) expense: Total interest and other (income) expense primarily includes interest expense associated with our outstanding debt. In addition, we include losses on extinguishment of debt and other noncash gains or losses within total interest and other (income) expense.
History
Known originally as Integrated Solutions, Presidio was capitalized by an investor group in 2003 to address the need for an elite professional services firm that was focused on providing advanced technology solutions to middle-market businesses. Our early focus was to expand our regional presence and skill set expertise through both organic and acquisitive growth. By 2010, we had completed six acquisitions that complemented our core competencies, helping expand Presidio’s presence to 33 offices in 18 states.
On February 2, 2015, the Apollo Funds acquired Presidio Holdings Inc., at which time Presidio Holdings Inc. became a direct wholly owned subsidiary of the Company. We applied the acquisition method of accounting that created a new basis of accounting for the Company as of that date. Our financial results with periods ending prior to February 2, 2015, have been termed those of “Predecessor,” while the financial results with periods ending subsequent to February 2, 2015, have been termed those of “Successor.”10 See Note 1 to the historical consolidated financial statements included elsewhere in this prospectus for additional disclosures.
On November 23, 2015, we acquired certain assets and assumed certain liabilities of Sequoia. The acquisition of Sequoia, a firm with cloud consulting and integration domain expertise, allowed us to provide hybrid cloud strategies and service delivery models for our clients.
On February 1, 2016, we acquired certain assets and assumed certain liabilities of Netech (the “Netech Acquisition”). The acquisition of Netech enables us to further broaden our portfolio of services and solutions and significantly expand our capabilities within the Midwestern United States.
The Netech Acquisition was funded through a combination of a new $150.0 million senior credit facility with a three-year maturity (the “February 2016 Credit Agreement”), an incremental $25.0 million term loan borrowing under our existing senior credit facility, a borrowing under the Receivables Securitization Facility and cash on hand.
On September 22, 2015, we entered into an agreement with a third party for the sale of our Atlantix Global Systems, LLC (“Atlantix”) subsidiary. Pursuant to that agreement, on October 22, 2015, we completed the sale of the Atlantix business to a third party.
| 10 | From November 20, 2014 to February 1, 2015, the Successor had no operations or activities other than the incurrence of transaction costs related to the Presidio Acquisition. See “Basis of Presentation.” |
75
Table of Contents
Key Business Metrics
Our management regularly monitors certain financial measures to track the progress of our business against internal goals and targets. We believe that the most important of these measures include Total Revenue, Adjusted Revenue, Gross Margin, Adjusted EBITDA, Adjusted EBITDA margin, Net income (loss) and Adjusted Net Income.
| Predecessor | Successor | |||||||||||||||||||||||||||
| (in millions) | Fiscal year ended June 30, 2014 |
July 1, 2014 to February 1, 2015 |
November 20, 2014 to June 30, 2015 |
Fiscal year ended June 30, 2016 |
Six months ended December 31, 2015 |
Six months ended December 31, 2016 |
||||||||||||||||||||||
| Total Revenue |
$ | 2,266.0 | $ | 1,392.8 | $ | 985.5 | $ | 2,714.9 | $ | 1,374.6 | $ | 1,459.5 | ||||||||||||||||
| Adjusted Revenue |
$ | 2,149.9 | $ | 1,323.4 | $ | 940.8 | $ | 2,683.7 | $ | 1,342.9 | $ | 1,460.0 | ||||||||||||||||
| Gross margin |
$ | 454.0 | $ | 289.3 | $ | 197.0 | $ | 540.6 | $ | 269.8 | $ | 291.5 | ||||||||||||||||
| Adjusted EBITDA |
$ | 167.0 | $ | 116.2 | $ | 68.6 | $ | 211.1 | $ | 116.6 | $ | 112.9 | ||||||||||||||||
| Adjusted EBITDA margin |
7.8 | % | 8.8 | % | 7.3 | % | 7.9 | % | 8.7 | % | 7.7 | % | ||||||||||||||||
| Net income (loss) |
$ | 32.5 | $ | (5.1 | ) | $ | (24.3 | ) | $ | (3.4 | ) | $ | 10.5 | $ | 9.0 | |||||||||||||
| Adjusted Net Income |
$ | 81.7 | $ | 58.6 | $ | 13.4 | $ | 81.2 | $ | 47.9 | $ | 46.9 | ||||||||||||||||
Adjusted Revenue – Adjusted Revenue is a non-GAAP financial measure. We believe that Adjusted Revenue provides supplemental information with respect to our revenue activity associated with our ongoing operations. We define Adjusted Revenue as Total Revenue adjusted to exclude (i) revenue generated by disposed businesses and (ii) noncash purchase accounting adjustments to revenue as a result of our acquisitions.
The reconciliation of Adjusted Revenue from Revenue for each of the periods presented is as follows:
| Predecessor | Successor | |||||||||||||||||||||||||||
| (in millions) | Fiscal year ended June 30, 2014 |
July 1, 2014 to February 1, 2015 |
November 20, 2014 to June 30, 2015 |
Fiscal year ended June 30, 2016 |
Six months ended December 31, 2015 |
Six months ended December 31, 2016 |
||||||||||||||||||||||
| Revenue |
$ | 2,266.0 | $ | 1,392.8 | $ | 985.5 | $ | 2,714.9 | $ | 1,374.6 | $ | 1,459.5 | ||||||||||||||||
| Adjustments: |
||||||||||||||||||||||||||||
| Revenue from disposed business |
(116.1 | ) | (69.4 | ) | (46.0 | ) | (32.8 | ) | (32.8 | ) | — | |||||||||||||||||
| Purchase accounting adjustments |
— | — | 1.3 | 1.6 | 1.1 | 0.5 | ||||||||||||||||||||||
|
|
|
|
|
|
|
|
|
|
|
|
|
|||||||||||||||||
| Total adjustments |
(116.1 | ) | (69.4 | ) | (44.7 | ) | (31.2 | ) | (31.7 | ) | 0.5 | |||||||||||||||||
|
|
|
|
|
|
|
|
|
|
|
|
|
|||||||||||||||||
| Adjusted Revenue |
$ | 2,149.9 | $ | 1,323.4 | $ | 940.8 | $ | 2,683.7 | $ | 1,342.9 | $ | 1,460.0 | ||||||||||||||||
|
|
|
|
|
|
|
|
|
|
|
|
|
|||||||||||||||||
Adjusted EBITDA – Adjusted EBITDA is a non-GAAP financial measure. We believe Adjusted EBITDA provides helpful information with respect to our operating performance as viewed by management, including a view of our business that is not dependent on (a) the impact of our capitalization structure and (b) items that are not part of our day-to-day operations. We define Adjusted EBITDA as net income (loss) plus (i) total depreciation and amortization, (ii) interest and other (income) expense, and (iii) income tax expense (benefit), as further adjusted to eliminate noncash share-based compensation expense, purchase accounting adjustments, transaction costs, other costs and earnings from disposed business. We define Adjusted EBITDA margin as the ratio of Adjusted EBITDA to Adjusted Revenue.
76
Table of Contents
The reconciliation of Adjusted EBITDA from Net income (loss) for each of the periods presented is as follows:
| Predecessor | Successor | |||||||||||||||||||||||||||
| (in millions) | Fiscal year ended June 30, 2014 |
July 1, 2014 to February 1, 2015 |
November 20, 2014 to June 30, 2015 |
Fiscal year ended June 30, 2016 |
Six months ended December 31, 2015 |
Six months ended December 31, 2016 |
||||||||||||||||||||||
| Adjusted EBITDA Reconciliation: |
||||||||||||||||||||||||||||
| Net income (loss) |
$ | 32.5 | $ | (5.1 | ) | $ | (24.3 | ) | $ | (3.4 | ) | $ | 10.5 | $ | 9.0 | |||||||||||||
| Total depreciation and amortization (1) |
50.6 | 24.9 | 32.1 | 81.7 | 38.0 | 43.6 | ||||||||||||||||||||||
| Interest and other (income) expense |
34.6 | 28.7 | 47.5 | 98.5 | 46.5 | 42.5 | ||||||||||||||||||||||
| Income tax expense (benefit) |
24.4 | 3.2 | (12.6 | ) | 3.8 | 9.2 | 6.3 | |||||||||||||||||||||
|
|
|
|
|
|
|
|
|
|
|
|
|
|||||||||||||||||
| EBITDA |
142.1 | 51.7 | 42.7 | 180.6 | 104.2 | 101.4 | ||||||||||||||||||||||
| Adjustments: |
||||||||||||||||||||||||||||
| Share-based compensation expense |
5.5 | 20.1 | 1.0 | 2.2 | 1.2 | 1.0 | ||||||||||||||||||||||
| Purchase accounting adjustments (2) |
— | — | 4.9 | 3.9 | 2.2 | 0.6 | ||||||||||||||||||||||
| Transaction costs (3) |
14.8 | 42.6 | 21.3 | 20.6 | 8.9 | 6.0 | ||||||||||||||||||||||
| Other costs (4) |
13.0 | 4.5 | 1.9 | 5.6 | 1.9 | 3.9 | ||||||||||||||||||||||
| Earnings from disposed business (5) |
(8.4 | ) | (2.7 | ) | (3.2 | ) | (1.8 | ) | (1.8 | ) | — | |||||||||||||||||
|
|
|
|
|
|
|
|
|
|
|
|
|
|||||||||||||||||
| Total adjustments |
24.9 | 64.5 | 25.9 | 30.5 | 12.4 | 11.5 | ||||||||||||||||||||||
|
|
|
|
|
|
|
|
|
|
|
|
|
|||||||||||||||||
| Adjusted EBITDA |
$ | 167.0 | $ | 116.2 | $ | 68.6 | $ | 211.1 | $ | 116.6 | $ | 112.9 | ||||||||||||||||
|
|
|
|
|
|
|
|
|
|
|
|
|
|||||||||||||||||
| (1) | “Total depreciation and amortization” equals the sum of (i) depreciation and amortization included within total operating expenses and (ii) depreciation and amortization recorded as part of cost of revenue within our consolidated financial statements. |
| (2) | “Purchase accounting adjustments” include charges associated with noncash adjustments to acquired assets and liabilities in connection with purchase accounting, such as recognition of increased cost of revenue in connection with an inventory step up fair value adjustment, recognition of reduced revenue in connection with a deferred revenue step down fair value adjustment and recognition of increased office rent expense associated with a fair value adjustment to the liability associated with deferred rent. |
| (3) | “Transaction costs” (i) of $14.8 million for the fiscal year ended June 30, 2014 includes acquisition-related expenses of $0.8 million related to stay and retention bonuses, $0.3 million related to severance charges, $0.7 million related to transaction-related legal, accounting and tax fees and $13.0 million related to professional fees and expenses associated with debt refinancings; (ii) of $42.6 million for the Predecessor period from July 1, 2014 to February 1, 2015 includes acquisition-related expenses of $0.3 million related to stay and retention bonuses, $0.2 million related to acquisition-related severance charges, $31.2 million related to transaction-related legal, accounting and tax fees in connection with the Presidio Acquisition and $10.9 million related to professional fees and expenses associated with debt refinancings; (iii) of $21.3 million for the Successor period from November 20, 2014 to June 30, 2015 includes acquisition-related expenses of $0.6 million related to stay and retention bonuses, $0.6 million related to severance charges, $18.5 million related to transaction-related legal, accounting and tax fees in connection with the Presidio Acquisition and $1.6 million related to professional fees and expenses |
77
Table of Contents
| associated with debt refinancings; (iv) of $20.6 million for the fiscal year ended June 30, 2016 includes acquisition-related expenses of $3.0 million related to stay and retention bonuses, $1.1 million related to severance charges, $8.7 million related to transaction-related advisory and diligence fees, $6.0 million related to transaction-related legal, accounting and tax fees and $1.8 million related to professional fees and expenses associated with debt refinancings; (v) of $8.9 million for the six months ended December 31, 2015 includes acquisition-related expenses of $1.0 million related to stay and retention bonuses, $0.9 million related to severance charges, $3.5 million related to transaction-related advisory and diligence fees and $3.5 million related to transaction-related legal, accounting and tax fees; and (vi) of $6.0 million for the six months ended December 31, 2016 includes acquisition-related expenses of $2.2 million related to stay and retention bonuses, $3.4 million related to transaction-related advisory and diligence fees and $0.4 million related to transaction-related legal, accounting and tax fees. |
| (4) | “Other costs” (i) of $13.0 million for the fiscal year ended June 30, 2014 includes expenses of $3.7 million associated with the integration of previously acquired managed services platforms into one system, certain expenses of $1.1 million related to unusual office start-up development costs, an unusual and non-recurring loss of $1.7 million related to an Atlantix customer receivable, certain unusual legal expenses of $2.2 million, $2.1 million related to payments to our former sponsor for advisory and consulting services and $2.2 million related to certain acquisition-related integration and related costs; (ii) of $4.5 million for the Predecessor period from July 1, 2014 to February 1, 2015 includes expenses of $2.2 million associated with the integration of previously acquired managed services platforms into one system, certain expenses of $0.4 million related to unusual office start-up development costs, $1.6 million related to payments to our former sponsor for advisory and consulting services and $0.3 million related to other non-recurring items; (iii) of $1.9 million for the Successor period from November 20, 2014 to June 30, 2015 includes expenses of $1.0 million associated with the integration of previously acquired managed services platforms into one system, $0.7 million related to certain non-recurring costs incurred in the development of our new cloud service offerings and certain unusual legal expenses of $0.2 million; (iv) of $5.6 million for the fiscal year ended June 30, 2016 includes expenses of $0.5 million associated with the integration of previously acquired managed services platforms into one system, $3.4 million related to certain non-recurring costs incurred in the development of our new cloud service offerings, certain expenses of $0.5 million related to unusual office start-up development costs and certain unusual legal expenses of $1.2 million; (v) of $1.9 million for the six months ended December 31, 2015 includes expenses of $0.4 million associated with the integration of previously acquired managed services platforms into one system, $1.0 million related to certain non-recurring costs incurred in the development of our new cloud service offerings and certain unusual legal expenses of $0.5 million; and (vi) of $3.9 million for the six months ended December 31, 2016 includes $3.6 million related to certain non-recurring costs incurred in the development of our new cloud service offerings and $0.3 million related to severance charges. |
| (5) | “Earnings from disposed business” represents the removal of the historical earnings contribution of Atlantix prior to the sale of the business. |
Adjusted Net Income – Adjusted Net Income is a non-GAAP measure, which management uses in this prospectus in its evaluation of past performance and prospects for the future. We believe that Adjusted Net Income provides additional information regarding our operating performance while considering the interest expense associated with our outstanding debt, as well as the impact of depreciation on our fixed assets and income taxes. We define Adjusted Net Income as net income (loss) adjusted to exclude (i) amortization of intangible assets, (ii) amortization of debt issuance costs, (iii) losses recognized on the disposal of business, (iv) losses on extinguishment of debt, (v) noncash share-based compensation expense, (vi) purchase accounting adjustments, (vii) transaction costs, (viii) other costs, (ix) earnings from disposed business and (x) the income tax impact associated with the foregoing items and adjusted for (1) the impact of permanently nondeductible expenses, (2) the impact of tax-deductible goodwill and intangible assets resulting from certain historical acquisitions and (3) the impact of discrete tax items.
78
Table of Contents
The reconciliation of Adjusted Net Income from Net income (loss) for each of the periods presented is as follows:
| Predecessor | Successor | |||||||||||||||||||||||||||
| (in millions) | Fiscal year ended June 30, 2014 |
July 1, 2014 to February 1, 2015 |
November 20, 2014 to June 30, 2015 |
Fiscal year ended June 30, 2016 |
Six months ended December 31, 2015 |
Six months ended December 31, 2016 |
||||||||||||||||||||||
| Adjusted Net Income reconciliation: |
||||||||||||||||||||||||||||
| Net income (loss) |
$ | 32.5 | $ | (5.1 | ) | $ | (24.3 | ) | $ | (3.4 | ) | $ | 10.5 | $ | 9.0 | |||||||||||||
| Adjustments: |
||||||||||||||||||||||||||||
| Amortization of intangible assets |
38.3 | 18.3 | 26.4 | 67.2 | 31.4 | 36.8 | ||||||||||||||||||||||
| Amortization of debt issuance costs |
4.4 | 2.4 | 2.7 | 7.6 | 3.5 | 3.4 | ||||||||||||||||||||||
| Loss on disposal of business |
— | — | — | 6.8 | 6.8 | — | ||||||||||||||||||||||
| Loss on extinguishment of debt |
2.7 | 7.5 | 0.7 | 9.7 | 0.1 | 0.8 | ||||||||||||||||||||||
| Share-based compensation expense |
5.5 | 20.1 | 1.0 | 2.2 | 1.2 | 1.0 | ||||||||||||||||||||||
| Purchase accounting adjustments (1) |
— | — | 4.9 | 3.9 | 2.2 | 0.6 | ||||||||||||||||||||||
| Transaction costs (2) |
14.8 | 42.6 | 21.3 | 20.6 | 8.9 | 6.0 | ||||||||||||||||||||||
| Other costs (3) |
13.0 | 4.5 | 1.9 | 5.6 | 1.9 | 3.9 | ||||||||||||||||||||||
| Earnings from disposed business (4) |
(8.4 | ) | (2.7 | ) | (3.2 | ) | (1.8 | ) | (1.8 | ) | — | |||||||||||||||||
| Income tax impact of adjustments (5) |
(21.1 | ) | (29.0 | ) | (18.0 | ) | (37.2 | ) | (16.8 | ) | (14.6 | ) | ||||||||||||||||
|
|
|
|
|
|
|
|
|
|
|
|
|
|||||||||||||||||
| Total adjustments |
49.2 | 63.7 | 37.7 | 84.6 | 37.4 | 37.9 | ||||||||||||||||||||||
|
|
|
|
|
|
|
|
|
|
|
|
|
|||||||||||||||||
| Adjusted Net Income |
$ | 81.7 | $ | 58.6 | $ | 13.4 | $ | 81.2 | $ | 47.9 | $ | 46.9 | ||||||||||||||||
|
|
|
|
|
|
|
|
|
|
|
|
|
|||||||||||||||||
| (1) | “Purchase accounting adjustments” include charges associated with noncash adjustments to acquired assets and liabilities in connection with purchase accounting, such as recognition of increased cost of revenue in connection with an inventory step up fair value adjustment, recognition of reduced revenue in connection with a deferred revenue step down fair value adjustment and recognition of increased office rent expense associated with a fair value adjustment to the liability associated with deferred rent. |
| (2) | “Transaction costs” (i) of $14.8 million for the fiscal year ended June 30, 2014 includes acquisition-related expenses of $0.8 million related to stay and retention bonuses, $0.3 million related to severance charges, $0.7 million related to transaction-related legal, accounting and tax fees and $13.0 million related to professional fees and expenses associated with debt refinancings; (ii) of $42.6 million for the Predecessor period from July 1, 2014 to February 1, 2015 includes acquisition-related expenses of $0.3 million related to stay and retention bonuses, $0.2 million related to severance charges, $31.2 million related to transaction-related legal, accounting and tax fees in connection with the Presidio Acquisition and $10.9 million related to professional fees and expenses associated with debt refinancings; (iii) of $21.3 million for the Successor period from November 20, 2014 to June 30, 2015 includes acquisition-related expenses of $0.6 million related to stay and retention bonuses, $0.6 million related to severance charges, $18.5 million related to transaction-related legal, accounting and tax fees in connection with the Presidio Acquisition and $1.6 million related to professional fees and expenses associated with debt refinancings; (iv) of $20.6 million for the fiscal year ended June 30, 2016 includes acquisition-related expenses of $3.0 million related to stay and retention bonuses, $1.1 million related to severance charges, $8.7 million related to transaction-related advisory and diligence fees, $6.0 million related to transaction-related legal, accounting and tax fees and $1.8 million related to professional fees and expenses associated with debt refinancings; (v) of $8.9 million for the six months ended December 31, 2015 includes acquisition-related expenses of $1.0 million related to stay and retention bonuses, |
79
Table of Contents
| $0.9 million related to severance charges, $3.5 million related to transaction-related advisory and diligence fees and $3.5 million related to transaction-related legal, accounting and tax fees; and (vi) of $6.0 million for the six months ended December 31, 2016 includes acquisition-related expenses of $2.2 million related to stay and retention bonuses, $3.4 million related to transaction-related advisory and diligence fees and $0.4 million related to transaction-related legal, accounting and tax fees. |
| (3) | “Other costs” (i) of $13.0 million for the fiscal year ended June 30, 2014 includes expenses of $3.7 million associated with the integration of previously acquired managed services platforms into one system, certain expenses of $1.1 million related to unusual office start-up development costs, an unusual and non-recurring loss of $1.7 million related to an Atlantix customer receivable, certain unusual legal expenses of $2.2 million, $2.1 million related to payments to our former sponsor for advisory and consulting services and $2.2 million related to certain acquisition-related integration and related costs; (ii) of $4.5 million for the Predecessor period from July 1, 2014 to February 1, 2015 includes expenses of $2.2 million associated with the integration of previously acquired managed services platforms into one system, certain expenses of $0.4 million related to unusual office start-up development costs, $1.6 million related to payments to our former sponsor for advisory and consulting services and $0.3 million related to other non-recurring items; (iii) of $1.9 million for the Successor period from November 20, 2014 to June 30, 2015 includes expenses of $1.0 million associated with the integration of previously acquired managed services platforms into one system, $0.7 million related to certain non-recurring costs incurred in the development of our new cloud service offerings and certain unusual legal expenses of $0.2 million; (iv) of $5.6 million for the fiscal year ended June 30, 2016 includes expenses of $0.5 million associated with the integration of previously acquired managed services platforms into one system, $3.4 million related to certain non-recurring costs incurred in the development of our new cloud service offerings, certain expenses of $0.5 million related to unusual office start-up development costs and certain unusual legal expenses of $1.2 million; (v) of $1.9 million for the six months ended December 31, 2015 includes expenses of $0.4 million associated with the integration of previously acquired managed services platforms into one system, $1.0 million related to certain non-recurring costs incurred in the development of our new cloud service offerings and certain unusual legal expenses of $0.5 million; and (vi) of $3.9 million for the six months ended December 31, 2016 includes $3.6 million related to certain non-recurring costs incurred in the development of our new cloud service offerings and $0.3 million related to severance charges. |
| (4) | “Earnings from disposed business” represents the removal of the historical earnings contribution of Atlantix prior to the sale of the business. |
| (5) | “Income tax impact of adjustments” includes an estimated tax impact of the adjustments to net income at our average statutory rate of 39.0%, except for (i) the adjustment of certain transaction costs that are permanently nondeductible for tax purposes and (ii) the impact of tax-deductible goodwill and intangible assets resulting from certain historical acquisitions, and further adjusted for discrete tax items such as the remeasurement of deferred tax liabilities due to state rate changes and write off of deferred tax assets resulting from reorganizations. |
Basis of Presentation and Results of Operations
In conjunction with the Presidio Acquisition on February 2, 2015 by the Apollo Funds, we have applied the acquisition method of accounting in accordance with Financial Accounting Standards Board (“FASB”) Accounting Standards Codification (“ASC”) Topic 805, Business Combinations, which creates a new basis of accounting as of that date. The consolidated statements of operations and cash flows with periods ending prior to February 2, 2015 are those of the Predecessor, while the consolidated statements of operations and cash flows with periods ending on or subsequent to June 30, 2015 are those of the Successor.11
| 11 | From November 20, 2014 to February 1, 2015, the Successor had no operations or activities other than the incurrence of transaction costs related to the Presidio Acquisition. See “Basis of Presentation.” |
80
Table of Contents
Prior to the Presidio Acquisition, the Successor had no operations or activities other than the incurrence of transaction costs related to the Presidio Acquisition. The consummation of the Presidio Acquisition effectuated a corresponding step-up in basis of accounting as Presidio Holdings Inc. was deemed significant to us. Consequently, the financial statements for all the Successor’s periods are not comparable to those of the Predecessor’s periods presented.
We have presented the results of operations for the Successor fiscal year ended June 30, 2016 and the Predecessor fiscal year ended June 30, 2014 compared to each of the separately presented Predecessor period from July 1, 2014 to February 1, 2015 and Successor period from November 20, 2014 to June 30, 2015. In addition, we have also included supplemental disclosures by comparing our historical periods to the “Pro Forma” fiscal year ended June 30, 2015, which represents the results of the Company for the fiscal year ended June 30, 2015 as if the Presidio Acquisition had occurred on July 1, 2014. We have determined that presenting the discussion and analysis of the results of operations in this manner promotes the overall usefulness of information presented in a manner consistent with how management reviews our performance. This approach may yield results that are not strictly comparable on a period to period basis and may not reflect the actual results we would have achieved if the Presidio Acquisition had occurred at the beginning of the period. Our historical results are not necessarily indicative of results that may be expected for any future period, and interim financial results are not necessarily indicative of results that may be expected for the full fiscal year. The information contained below should therefore be read in conjunction with our historical consolidated financial statements and the related notes included elsewhere in this prospectus.
Each of the unaudited Combined and Pro Forma statements of operations for the fiscal year ended June 30, 2015 should be read in conjunction with all other sections of this “Management’s Discussion and Analysis of Financial Condition and Results of Operations,” as well as our consolidated financial statements and the related notes included elsewhere in this prospectus.
The unaudited pro forma financial information set forth below is based upon available information and assumptions that we believe are reasonable. The historical financial information has been adjusted to give effect to pro forma events that are (1) directly attributable to the transactions, (2) factually supportable and (3) with respect to the statements of operations, expected to have a continuing impact on the combined results. The unaudited pro forma condensed consolidated financial information is for illustrative and informational purposes only and is not intended to represent or be indicative of what our financial condition or results of operations would have been had the Presidio Acquisition occurred on the date indicated. The unaudited pro forma condensed consolidated financial information also should not be considered representative of our future financial condition or results of operations. The unaudited pro forma condensed consolidated financial information should be read in conjunction with the information included under the headings “Selected Historical Consolidated Financial Data,” “Capitalization,” “Use of Proceeds,” “Description of Capital Stock” and the audited consolidated financial statements and related notes of the Company included elsewhere in this prospectus. All pro forma adjustments and their underlying assumptions are described more fully in the notes to our unaudited pro forma condensed consolidated financial information.
81
Table of Contents
Combined Fiscal Year Ended June 30, 2015 and Pro Forma Fiscal Year Ended June 30, 2015
| Predecessor July 1, 2014 to February 1, 2015 |
Successor November 20, 2014 to June 30, 2015 |
Combined fiscal year ended June 30, 2015 |
Adjustments | Pro Forma fiscal year ended June 30, 2015 |
||||||||||||||||||||
| Revenue |
||||||||||||||||||||||||
| Product |
$ | 1,201.4 | $ | 848.0 | $ | 2,049.4 | $ | — | $ | 2,049.4 | ||||||||||||||
| Service |
191.4 | 137.5 | 328.9 | (1.2 | )(a) | 327.7 | ||||||||||||||||||
|
|
|
|
|
|
|
|
|
|
|
|||||||||||||||
| Total revenue |
1,392.8 | 985.5 | 2,378.3 | (1.2 | ) | 2,377.1 | ||||||||||||||||||
| Cost of revenue |
||||||||||||||||||||||||
| Product |
952.9 | 679.9 | 1,632.8 | (3.1 | )(b) | 1,629.7 | ||||||||||||||||||
| Service |
150.6 | 108.6 | 259.2 | — | 259.2 | |||||||||||||||||||
|
|
|
|
|
|
|
|
|
|
|
|||||||||||||||
| Total cost of revenue |
1,103.5 | 788.5 | 1,892.0 | (3.1 | ) | 1,888.9 | ||||||||||||||||||
|
|
|
|
|
|
|
|
|
|
|
|||||||||||||||
| Gross margin |
289.3 | 197.0 | 486.3 | 1.9 | 488.2 | |||||||||||||||||||
| Product gross margin |
248.5 | 168.1 | 416.6 | 419.7 | ||||||||||||||||||||
| Service gross margin |
40.8 | 28.9 | 69.7 | 68.5 | ||||||||||||||||||||
| Product gross margin % |
20.7 | % | 19.8 | % | 20.3 | % | 20.5 | % | ||||||||||||||||
| Service gross margin % |
21.3 | % | 21.0 | % | 21.2 | % | 20.9 | % | ||||||||||||||||
| Total gross margin % |
20.8 | % | 20.0 | % | 20.4 | % | 20.5 | % | ||||||||||||||||
| Operating expenses |
||||||||||||||||||||||||
| Selling expenses |
137.6 | 94.4 | 232.0 | (7.8 | )(c) | 224.2 | ||||||||||||||||||
| General and administrative expenses |
59.9 | 40.5 | 100.4 | (12.2 | )(d) | 88.2 | ||||||||||||||||||
| Transaction costs |
42.6 | 21.3 | 63.9 | (61.3 | )(e) | 2.6 | ||||||||||||||||||
| Depreciation and amortization |
22.4 | 30.2 | 52.6 | 18.8 | (f) | 71.4 | ||||||||||||||||||
|
|
|
|
|
|
|
|
|
|
|
|||||||||||||||
| Total operating expenses |
262.5 | 186.4 | 448.9 | (62.5 | ) | 386.4 | ||||||||||||||||||
|
|
|
|
|
|
|
|
|
|
|
|||||||||||||||
| Selling, general and administrative expenses % of total revenue |
14.2 | % | 13.7 | % | 14.0 | % | 13.1 | % | ||||||||||||||||
| Operating income |
26.8 | 10.6 | 37.4 | 64.4 | 101.8 | |||||||||||||||||||
| Interest and other (income) expense |
||||||||||||||||||||||||
| Interest expense |
21.4 | 46.7 | 68.1 | 13.1 | (g) | 81.2 | ||||||||||||||||||
| Loss on extinguishment of debt |
7.5 | 0.7 | 8.2 | (8.2 | )(h) | — | ||||||||||||||||||
| Other (income) expense, net |
(0.2 | ) | 0.1 | (0.1 | ) | — | (0.1 | ) | ||||||||||||||||
|
|
|
|
|
|
|
|
|
|
|
|||||||||||||||
| Total interest and other (income) expense |
28.7 | 47.5 | 76.2 | 4.9 | 81.1 | |||||||||||||||||||
|
|
|
|
|
|
|
|
|
|
|
|||||||||||||||
| Income (loss) before income taxes |
(1.9 | ) | (36.9 | ) | (38.8 | ) | 59.5 | 20.7 | ||||||||||||||||
| Income tax expense (benefit) |
3.2 | (12.6 | ) | (9.4 | ) | 19.6 | (i) | 10.2 | ||||||||||||||||
|
|
|
|
|
|
|
|
|
|
|
|||||||||||||||
| Net income (loss) |
$ | (5.1 | ) | $ | (24.3 | ) | $ | (29.4 | ) | $ | 39.9 | $ | 10.5 | |||||||||||
|
|
|
|
|
|
|
|
|
|
|
|||||||||||||||
| (a) | Reflects the pro forma adjustment to revenue related to the reduction in fair value of deferred revenue due to the Presidio Acquisition as if it occurred on July 1, 2014. Amortization of this balance is recognized as the incremental cost to fulfill the services are provided under the corresponding contracts. |
| (b) | Reflects the pro forma adjustment to cost of revenue related to the removal of increased cost of revenue resulting from the fair value measurement of inventory balances associated with the Presidio Acquisition. |
82
Table of Contents
| (c) | Reflects the removal of share-based compensation expense due to the acceleration of vesting of share based awards to employees as a result of the Presidio Acquisition. A total of $18.5 million of historical share based compensation expense was recognized as a result of the transaction during the year ended June 30, 2015, of which $7.8 million is included in historical selling expenses. The remaining $10.7 million is included in historical general and administrative expenses for the fiscal year ended June 30, 2015 as detailed in (d) below. This expense is considered to be directly related to the Presidio Acquisition and is not expected to have a continuing impact on the Company; therefore, it has been excluded from the unaudited pro forma condensed consolidated statement of operations. |
| (d) | Reflects the removal of the $10.7 million of share based compensation expense described in footnote (c) above, as well as $1.5 million of historical annual management fees paid to the former owners of the Predecessor. |
| (e) | Reflects the removal of $62.2 million of acquisition related costs included in the historical consolidated financial statements of the Company for the fiscal year ended June 30, 2015 that are directly attributable to the Presidio Acquisition and the recognition of $0.9 million of compensation expense associated with a retention bonus payable to certain employees and members of management which will be paid over thirty months in connection with Presidio Acquisition. |
| (f) | Reflects the pro forma adjustment to amortization expense to reflect incremental amortization expense applicable to intangible assets identified as part of the purchase price allocation associated with the Presidio Acquisition. |
| (g) | Reflects the pro forma adjustment to interest expense associated with the Presidio Acquisition including additional interest expense on term loan borrowings under the February 2015 Credit Agreement, the Senior Notes, the Subordinated Notes, the Receivables Securitization Facility and the revolving credit facility, as well as noncash amortization of the related debt issuance costs. |
| (h) | Reflects the pro forma adjustment to remove $8.2 million of losses on extinguishment of debt associated with the Presidio Acquisition. |
| (i) | The amount of income tax expense attributable to the pro forma adjustments has been computed by applying the Company’s assumed blended U.S. federal and state statutory income tax rate of 39.0% to pro forma income before income taxes adjusted for non-deductible expenses. |
Historical Periods—Results of Operations
| • | Six months ended December 31, 2016 compared to six months ended December 31, 2015; |
| • | Successor fiscal year ended June 30, 2016 compared to Successor period from November 20, 2014 to June 30, 201512 and Predecessor period from July 1, 2014 to February 1, 2015; and |
| • | Successor period from November 20, 2014 to June 30, 201513 and Predecessor period from July 1, 2014 to February 1, 2015 compared to Predecessor fiscal year ended June 30, 2014. |
Supplemental Periods—Results of Operations
| • | Fiscal year ended June 30, 2016, compared to Pro Forma fiscal year ended June 30, 2015; and |
| • | Pro Forma fiscal year ended June 30, 2015, compared to fiscal year ended June 30, 2014. |
| 12 | From November 20, 2014 to February 1, 2015, the Successor had no operations or activities other than the incurrence of transaction costs related to the Presidio Acquisition. See “Basis of Presentation.” |
| 13 | From November 20, 2014 to February 1, 2015, the Successor had no operations or activities other than the incurrence of transaction costs related to the Presidio Acquisition. See “Basis of Presentation.” |
83
Table of Contents
Six Months Ended December 31, 2016 Compared to the Six Months Ended December 31, 2015
| Six months ended December 31, 2015 |
Six months ended December 31, 2016 |
Change |
||||||||||||||
| $ | % | |||||||||||||||
| Revenue |
||||||||||||||||
| Product |
$ | 1,190.4 | $ | 1,238.6 | $ | 48.2 | 4.0 | % | ||||||||
| Service |
184.2 | 220.9 | 36.7 | 19.9 | % | |||||||||||
|
|
|
|
|
|
|
|
|
|||||||||
| Total revenue |
1,374.6 | 1,459.5 | 84.9 | 6.2 | % | |||||||||||
| Cost of revenue |
||||||||||||||||
| Product |
958.4 | 991.0 | 32.6 | 3.4 | % | |||||||||||
| Service |
146.4 | 177.0 | 30.6 | 20.9 | % | |||||||||||
|
|
|
|
|
|
|
|
|
|||||||||
| Total cost of revenue |
1,104.8 | 1,168.0 | 63.2 | 5.7 | % | |||||||||||
|
|
|
|
|
|
|
|
|
|||||||||
| Gross margin |
269.8 | 291.5 | 21.7 | 8.0 | % | |||||||||||
| Product gross margin |
232.0 | 247.6 | 15.6 | 6.7 | % | |||||||||||
| Service gross margin |
37.8 | 43.9 | 6.1 | 16.1 | % | |||||||||||
| Product gross margin % |
19.5 | % | 20.0 | % | 0.5 | % | ||||||||||
| Service gross margin % |
20.5 | % | 19.9 | % | (0.6 | %) | ||||||||||
| Total gross margin % |
19.6 | % | 20.0 | % | 0.4 | % | ||||||||||
| Operating expenses |
||||||||||||||||
| Selling expenses |
114.5 | 134.1 | 19.6 | 17.1 | % | |||||||||||
| General and administrative |
44.9 | 52.8 | 7.9 | 17.6 | % | |||||||||||
| Transaction costs |
8.9 | 6.0 | (2.9 | ) | (32.6 | )% | ||||||||||
| Depreciation and amortization |
35.3 | 40.8 | 5.5 | 15.6 | % | |||||||||||
|
|
|
|
|
|
|
|
|
|||||||||
| Total operating expenses |
203.6 | 233.7 | 30.1 | 14.8 | % | |||||||||||
|
|
|
|
|
|
|
|
|
|||||||||
| Selling, general and administrative expenses |
11.6 | % | 12.8 | % | 1.2 | % | ||||||||||
| Operating income |
66.2 | 57.8 | (8.4 | ) | (12.7 | %) | ||||||||||
| Interest and other (income) expense |
||||||||||||||||
| Interest expense |
39.4 | 41.6 | 2.2 | 5.6 | % | |||||||||||
| Loss on disposal of business |
6.8 | — | (6.8 | ) | (100.0 | %) | ||||||||||
| Loss on extinguishment of debt |
0.1 | 0.8 | 0.7 | 700.0 | % | |||||||||||
| Other (income) expense, net |
0.2 | 0.1 | (0.1 | ) | (50.0 | %) | ||||||||||
|
|
|
|
|
|
|
|
|
|||||||||
| Total interest and other (income) expense |
46.5 | 42.5 | (4.0 | ) | (8.6 | %) | ||||||||||
|
|
|
|
|
|
|
|
|
|||||||||
| Income before income taxes |
19.7 | 15.3 | (4.4 | ) | (22.3 | %) | ||||||||||
| Income tax expense |
9.2 | 6.3 | (2.9 | ) | (31.5 | %) | ||||||||||
|
|
|
|
|
|
|
|
|
|||||||||
| Net income |
$ | 10.5 | $ | 9.0 | $ | (1.5 | ) | (14.3 | %) | |||||||
|
|
|
|
|
|
|
|
|
|||||||||
| Adjusted EBITDA |
$ | 116.6 | $ | 112.9 | $ | (3.7 | ) | (3.2 | %) | |||||||
| Adjusted Net Income |
$ | 47.9 | $ | 46.9 | $ | (1.0 | ) | (2.1 | %) | |||||||
84
Table of Contents
The following table presents a reconciliation of Net income to Adjusted EBITDA for the six months ended December 31, 2016 and the six months ended December 31, 2015.
| Six months ended December 31, 2015 |
Six months ended December 31, 2016 |
|||||||
| Adjusted EBITDA Reconciliation: |
||||||||
| Net income |
$ | 10.5 | $ | 9.0 | ||||
| Total depreciation and amortization (1) |
38.0 | 43.6 | ||||||
| Interest and other (income) expense |
46.5 | 42.5 | ||||||
| Income tax expense |
9.2 | 6.3 | ||||||
|
|
|
|
|
|||||
| EBITDA |
104.2 | 101.4 | ||||||
| Adjustments: |
||||||||
| Share-based compensation expense |
1.2 | 1.0 | ||||||
| Purchase accounting adjustments (2) |
2.2 | 0.6 | ||||||
| Transaction costs (3) |
8.9 | 6.0 | ||||||
| Other costs (4) |
1.9 | 3.9 | ||||||
| Earnings from disposed business (5) |
(1.8 | ) | — | |||||
|
|
|
|
|
|||||
| Total adjustments |
12.4 | 11.5 | ||||||
|
|
|
|
|
|||||
| Adjusted EBITDA |
$ | 116.6 | $ | 112.9 | ||||
|
|
|
|
|
|||||
| (1) | “Total depreciation and amortization” equals the sum of (i) depreciation and amortization included within total operating expenses and (ii) depreciation and amortization recorded as part of cost of revenue within our consolidated financial statements. |
| (2) | “Purchase accounting adjustments” include charges associated with noncash adjustments to acquired assets and liabilities in connection with purchase accounting, such as recognition of increased cost of revenue in connection with an inventory step up fair value adjustment, recognition of reduced revenue in connection with a deferred revenue step down fair value adjustment and recognition of increased office rent expense associated with a fair value adjustment to the liability associated with deferred rent. |
| (3) | “Transaction costs” (1) of $8.9 million for the six months ended December 31, 2015 includes acquisition-related expenses of $1.0 million related to stay and retention bonuses, $0.9 million related to severance charges, $3.5 million related to transaction-related advisory and diligence fees and $3.5 million related to transaction-related legal, accounting and tax fees; and (2) of $6.0 million for the six months ended December 31, 2016 includes acquisition-related expenses of $2.2 million related to stay and retention bonuses, $3.4 million related to transaction-related advisory and diligence fees and $0.4 million related to transaction-related legal, accounting and tax fees. |
| (4) | “Other costs” (1) of $1.9 million for the six months ended December 31, 2015 includes expenses of $0.4 million associated with the integration of previously acquired managed services platforms into one system, $1.0 million related to certain non-recurring costs incurred in the development of our new cloud service offerings and certain unusual legal expenses of $0.5 million; and (2) of $3.9 million for the six months ended December 31, 2016 includes $3.6 million related to certain non-recurring costs incurred in the development of our new cloud service offerings and $0.3 million related to severance charges. |
| (5) | “Earnings from disposed business” represents the removal of the historical earnings contribution of Atlantix prior to the sale of the business. |
85
Table of Contents
The following table presents a reconciliation of Net income to Adjusted Net Income for the six months ended December 31, 2016 and the six months ended December 31, 2015.
| Six months ended December 31, 2015 |
Six months ended December 31, 2016 |
|||||||
| Adjusted Net Income reconciliation: |
||||||||
| Net income |
$ | 10.5 | $ | 9.0 | ||||
| Adjustments: |
||||||||
| Amortization of intangible assets |
31.4 | 36.8 | ||||||
| Amortization of debt issuance costs |
3.5 | 3.4 | ||||||
| Loss on disposal of business |
6.8 | — | ||||||
| Loss on extinguishment of debt |
0.1 | 0.8 | ||||||
| Share-based compensation expense |
1.2 | 1.0 | ||||||
| Purchase accounting adjustments (1) |
2.2 | 0.6 | ||||||
| Transaction costs (2) |
8.9 | 6.0 | ||||||
| Other costs (3) |
1.9 | 3.9 | ||||||
| Earnings from disposed business (4) |
(1.8 | ) | — | |||||
| Income tax impact of adjustments (5) |
(16.8 | ) | (14.6 | ) | ||||
|
|
|
|
|
|||||
| Total adjustments |
37.4 | 37.9 | ||||||
|
|
|
|
|
|||||
| Adjusted Net Income |
$ | 47.9 | $ | 46.9 | ||||
|
|
|
|
|
|||||
| (1) | “Purchase accounting adjustments” include charges associated with noncash adjustments to acquired assets and liabilities in connection with purchase accounting, such as recognition of increased cost of revenue in connection with an inventory step up fair value adjustment, recognition of reduced revenue in connection with a deferred revenue step down fair value adjustment and recognition of increased office rent expense associated with a fair value adjustment to the liability associated with deferred rent. |
| (2) | “Transaction costs” (1) of $8.9 million for the six months ended December 31, 2015 includes acquisition-related expenses of $1.0 million related to stay and retention bonuses, $0.9 million related to severance charges, $3.5 million related to transaction-related advisory and diligence fees and $3.5 million related to transaction-related legal, accounting and tax fees; and (2) of $6.0 million for the six months ended December 31, 2016 includes acquisition-related expenses of $2.2 million related to stay and retention bonuses, $3.4 million related to transaction-related advisory and diligence fees and $0.4 million related to transaction-related legal, accounting and tax fees. |
| (3) | “Other costs” (1) of $1.9 million for the six months ended December 31, 2015 includes expenses of $0.4 million associated with the integration of previously acquired managed services platforms into one system, $1.0 million related to certain non-recurring costs incurred in the development of our new cloud service offerings and certain unusual legal expenses of $0.5 million; and (2) of $3.9 million for the six months ended December 31, 2016 includes $3.6 million related to certain non-recurring costs incurred in the development of our new cloud service offerings and $0.3 million related to severance charges. |
| (4) | “Earnings from disposed business” represents the removal of the historical earnings contribution of Atlantix prior to the sale of the business. |
| (5) | “Income tax impact of adjustments” includes an estimated tax impact of the adjustments to net income at our average statutory rate of 39.0%, except for (i) the adjustment of certain transaction costs that are permanently nondeductible for tax purposes and (ii) the impact of tax-deductible goodwill and intangible assets resulting from certain historical acquisitions, and further adjusted for discrete tax items such as the remeasurement of deferred tax liabilities due to state rate changes and write off of deferred tax assets resulting from reorganizations. |
86
Table of Contents
Revenue
| Six months ended December 31, 2015 |
Six months ended December 31, 2016 |
Change |
||||||||||||||
| $ | % | |||||||||||||||
| Revenue |
||||||||||||||||
| Product |
$ | 1,190.4 | $ | 1,238.6 | $ | 48.2 | 4.0 | % | ||||||||
| Service |
184.2 | 220.9 | 36.7 | 19.9 | % | |||||||||||
|
|
|
|
|
|
|
|
|
|||||||||
| Total revenue |
$ | 1,374.6 | $ | 1,459.5 | $ | 84.9 | 6.2 | % | ||||||||
Total revenue increased $84.9 million, or 6.2%, to $1,459.5 million for the six months ended December 31, 2016, compared to total revenue of $1,374.6 million for the six months ended December 31, 2015. Excluding the $32.8 million of revenue associated with our Atlantix business in the six months ended December 31, 2015, total revenue increased 8.8%. The increase in total revenue resulted from a higher proportion of engineering and consulting services as part of our solutions, as well as from the Netech Acquisition, partly offset by changes in the timing of client engagements at the end of the period.
Revenue from sales of product increased $48.2 million, or 4.0%, to $1,238.6 million for the six months ended December 31, 2016, compared to product revenue of $1,190.4 million for the six months ended December 31, 2015. Excluding the $32.7 million of revenue associated with our Atlantix business in the six months ended December 31, 2015, product revenue increased 7.0%. Higher customer demand for data center and mobility solutions was further enhanced by higher growth in third party support revenue, as well as the addition of Netech.
Revenue from sales of services increased $36.7 million, or 19.9%, to $220.9 million for the six months ended December 31, 2016, compared to service revenue of $184.2 million for the six months ended December 31, 2015, driven by increased demand for our professional, managed, and cloud services in connection with the greater complexity of solutions sold.
| Six months ended December 31, 2015 |
Six months ended December 31, 2016 |
Change |
||||||||||||||
| $ | % | |||||||||||||||
| Revenue |
||||||||||||||||
| Cloud |
$ | 193.7 | $ | 248.1 | $ | 54.4 | 28.1 | % | ||||||||
| Security |
130.0 | 136.5 | 6.5 | 5.0 | % | |||||||||||
| Digital Infrastructure |
1,050.9 | 1,074.9 | 24.0 | 2.3 | % | |||||||||||
|
|
|
|
|
|
|
|
|
|||||||||
| Total revenue |
$ | 1,374.6 | $ | 1,459.5 | $ | 84.9 | 6.2 | % | ||||||||
Cloud revenue increased $54.4 million, or 28.1%, to $248.1 million in the six months ended December 31, 2016, compared to $193.7 million for the six months ended December 31, 2015, a result of strong client demand in all market sectors, particularly with middle-market clients. In the middle market, growth was driven by both healthcare and professional services clients. Large market client growth was driven by demand from professional services and media clients.
Security revenue increased $6.5 million, or 5.0%, to $136.5 million in the six months ended December 31, 2016, compared to $130.0 million in the six months ended December 31, 2015, driven by higher demand from middle-market clients including information technology and education clients.
87
Table of Contents
Digital Infrastructure revenue grew $24.0 million, or 2.3%, from $1,050.9 million in the six months ended December 31, 2015 to $1,074.9 million in the six months ended December 31, 2016. Middle-market education customers as well as healthcare clients experienced continued strong demand for core infrastructure solutions.
Gross Margin
| Six months ended December 31, 2015 |
Six months ended December 31, 2016 |
Change |
||||||||||||||
| $ | % | |||||||||||||||
| Gross Margin |
||||||||||||||||
| Product |
$ | 232.0 | $ | 247.6 | $ | 15.6 | 6.7 | % | ||||||||
| Service |
37.8 | 43.9 | 6.1 | 16.1 | % | |||||||||||
|
|
|
|
|
|
|
|
|
|||||||||
| Gross margin |
$ | 269.8 | $ | 291.5 | $ | 21.7 | 8.0 | % | ||||||||
| Product gross margin % |
19.5 | % | 20.0 | % | 0.5 | % | ||||||||||
| Service gross margin % |
20.5 | % | 19.9 | % | (0.6 | %) | ||||||||||
| Total gross margin % |
19.6 | % | 20.0 | % | 0.4 | % | ||||||||||
Total gross margin increased $21.7 million or 8.0% to $291.5 million for the six months ended December 31, 2016, as compared to $269.8 million for the six months ended December 31, 2015, a result of an increase in total revenue of 6.2% between periods and the sale of higher margin solutions. Excluding the $7.5 million of gross margin associated with our Atlantix business in the six months ended December 31, 2015, gross margin increased 11.1%. As a percentage of total revenue, total gross margin increased 40 basis points to 20.0% for the six months ended December 31, 2016, up from 19.6% of revenue for the six months ended December 31, 2015.
Product gross margin as a percentage of revenue was 20.0% for the six months ended December 31, 2016, an increase of 50 basis points from 19.5% for the six months ended December 31, 2015. The increase in gross margin percentage was due to higher margin product offerings attributable to increased sales of third party support services.
Services gross margin as a percentage of revenue was 19.9% for the six months ended December 31, 2016, a decrease of 60 basis points from 20.5% for the six months ended December 31, 2015. The decrease in gross margin percentage was due to expanded gross margins on engineering, consulting and managed services that were more than offset by $2.9 million of expenses associated with investments in new cloud-related service offerings which negatively impacted the service gross margin percentage. Excluding the expense associated with cloud investments, service gross margins as a percentage of revenue was 21.2% for the six months ended December 31, 2016.
Operating Expenses
| Six months ended December 31, 2015 |
Six months ended December 31, 2016 |
Change |
||||||||||||||
| $ | % | |||||||||||||||
| Operating expenses |
||||||||||||||||
| Selling expenses |
$ | 114.5 | $ | 134.1 | $ | 19.6 | 17.1 | % | ||||||||
| General and administrative |
44.9 | 52.8 | 7.9 | 17.6 | % | |||||||||||
|
|
|
|
|
|
|
|
|
|||||||||
| Selling, general and administrative costs |
159.4 | 186.9 | 27.5 | 17.3 | % | |||||||||||
| Transaction costs |
8.9 | 6.0 | (2.9 | ) | (32.6 | %) | ||||||||||
| Depreciation and amortization |
35.3 | 40.8 | 5.5 | 15.6 | % | |||||||||||
|
|
|
|
|
|
|
|
|
|||||||||
| Total operating expenses |
$ | 203.6 | $ | 233.7 | $ | 30.1 | 14.8 | % | ||||||||
| Selling, general and administrative expenses |
11.6 | % | 12.8 | % | 1.2 | % | ||||||||||
88
Table of Contents
Selling expenses are comprised of compensation, variable incentive pay and benefits related to our sales force along with travel expenses and other employee related costs. General and administrative expenses are comprised of administration compensation and benefits, including variable incentive pay and other administrative costs such as facilities expenses, professional fees and bad debt expense. We define selling, general and administrative expenses (“SG&A”) as the sum of selling expenses and general and administrative expenses. SG&A increased $27.5 million or 17.3% to $186.9 million during the six months ended December 31, 2016, up from $159.4 million for the six months ended December 31, 2015. The growth in SG&A was primarily attributed to (1) $21.9 million of additional expenses associated with Netech’s employees, facilities and other expenses, (2) $8.1 million of expense associated with investment in direct sales and sales support personnel within high-growth solution offerings including cloud and security, and (3) $3.3 million of expense associated with increases in administrative personnel and other administrative expenses partly offset by a reduction of $5.8 million of expense associated with Atlantix. SG&A as a percent of revenue increased 120 basis points to 12.8% of revenue for the six months ended December 31, 2016 compared to 11.6% of revenue for the six months ended December 31, 2015.
Transaction costs primarily relate to professional fees and other costs incurred as a result of transaction-related activities. In the six months ended December 31, 2016, $6.0 million of transaction costs were incurred including acquisition-related expenses of $2.2 million related to stay and retention bonuses, $3.4 million related to transaction-related advisory and diligence fees and $0.4 million related to transaction-related legal, accounting and tax fees.
Depreciation and amortization expense included in operating expenses increased $5.5 million or 15.6% to $40.8 million for the six months ended December 31, 2016, from $35.3 million for the six months ended December 31, 2015, primarily as a result of increased amortization expense associated with acquired intangible assets associated with the Netech Acquisition.
Interest and Other (Income) Expense
| Six months ended December 31, 2015 |
Six months ended December 31, 2016 |
Change |
||||||||||||||
| $ | % | |||||||||||||||
| Interest and other (income) expense |
||||||||||||||||
| Interest expense |
$ | 39.4 | $ | 41.6 | $ | 2.2 | 5.6 | % | ||||||||
| Loss on disposal of business |
6.8 | — | (6.8 | ) | (100.0 | %) | ||||||||||
| Loss on extinguishment of debt |
0.1 | 0.8 | 0.7 | 700.0 | % | |||||||||||
| Other (income) expense, net |
0.2 | 0.1 | (0.1 | ) | (50.0 | %) | ||||||||||
|
|
|
|
|
|
|
|
|
|||||||||
| Total interest and other (income) expense |
$ | 46.5 | $ | 42.5 | $ | (4.0 | ) | (8.6 | %) | |||||||
Interest and other (income) expense decreased $4.0 million or 8.6% to $42.5 million for the six months ended December 31, 2016, from $46.5 million in the six months ended December 31, 2015. The net decrease related to the loss on disposal of business incurred in the six months ended December 31, 2015 that did not reoccur in the current period, partially offset by higher interest expense for the six months ended December 31, 2016 resulting from higher debt balances and a loss on extinguishment of debt associated with a $25.0 million term loan prepayment.
89
Table of Contents
Income Tax Expense
| Six months ended December 31, 2015 |
Six months ended December 31, 2016 |
Change |
||||||||||||||
| $ | % | |||||||||||||||
| Income before income taxes |
$ | 19.7 | $ | 15.3 | $ | (4.4 | ) | (22.3 | %) | |||||||
| Income tax expense |
9.2 | 6.3 | (2.9 | ) | (31.5 | %) | ||||||||||
|
|
|
|
|
|
|
|
|
|||||||||
| Net income |
$ | 10.5 | $ | 9.0 | $ | (1.5 | ) | (14.3 | %) | |||||||
The income tax expense of $6.3 million in the six months ended December 31, 2016 decreased $2.9 million from $9.2 million of income tax expense in the six months ended December 31, 2015 primarily due to a decrease in pre-tax income. The effective tax rate was 41.2% in the six months ended December 31, 2016 compared to 46.7% in the six months ended December 31, 2015, the result of a smaller impact of permanent non-deductible expenses and a slight decrease in state effective tax rate.
Adjusted EBITDA
Adjusted EBITDA decreased $3.7 million or 3.2% to $112.9 million for the six months ended December 31, 2016, from $116.6 million for the six months ended December 31, 2015, reflecting strong revenue and gross margin growth offset by the investments we have made in high-growth areas of our business.
Adjusted Net Income
Adjusted Net Income decreased $1.0 million, or 2.1%, to $46.9 million for the six months ended December 31, 2016, from $47.9 million in the six months ended December 31, 2015, reflecting strong revenue and gross margin growth offset by the investments we have made in high-growth areas of our business.
90
Table of Contents
Successor Fiscal Year Ended June 30, 2016 compared to Successor period from November 20, 2014 to June 30, 201514 and Predecessor period from July 1, 2014 to February 1, 2015
| Predecessor | Successor | |||||||||||||||
| July 1, 2014 to February 1, 2015 |
November 20, 2014 to June 30, 2015 |
Fiscal year ended June 30, 2016 |
||||||||||||||
| Revenue |
||||||||||||||||
| Product |
$ | 1,201.4 | $ | 848.0 | $ | 2,319.8 | ||||||||||
| Service |
191.4 | 137.5 | 395.1 | |||||||||||||
|
|
|
|
|
|
|
|||||||||||
| Total revenue |
1,392.8 | 985.5 | 2,714.9 | |||||||||||||
| Cost of revenue |
||||||||||||||||
| Product |
952.9 | 679.9 | 1,866.5 | |||||||||||||
| Service |
150.6 | 108.6 | 307.8 | |||||||||||||
|
|
|
|
|
|
|
|||||||||||
| Total cost of revenue |
1,103.5 | 788.5 | 2,174.3 | |||||||||||||
|
|
|
|
|
|
|
|||||||||||
| Gross margin |
289.3 | 197.0 | 540.6 | |||||||||||||
| Product gross margin |
248.5 | 168.1 | 453.3 | |||||||||||||
| Service gross margin |
40.8 | 28.9 | 87.3 | |||||||||||||
| Product gross margin % |
20.7 | % | 19.8 | % | 19.5 | % | ||||||||||
| Service gross margin % |
21.3 | % | 21.0 | % | 22.1 | % | ||||||||||
| Total gross margin % |
20.8 | % | 20.0 | % | 19.9 | % | ||||||||||
| Operating expenses |
||||||||||||||||
| Selling expenses |
137.6 | 94.4 | 248.2 | |||||||||||||
| General and administrative |
59.9 | 40.5 | 96.9 | |||||||||||||
| Transaction costs |
42.6 | 21.3 | 20.6 | |||||||||||||
| Depreciation and amortization |
22.4 | 30.2 | 76.0 | |||||||||||||
|
|
|
|
|
|
|
|||||||||||
| Total operating expenses |
262.5 | 186.4 | 441.7 | |||||||||||||
|
|
|
|
|
|
|
|||||||||||
| Selling, general and administrative expenses |
14.2 | % | 13.7 | % | 12.7 | % | ||||||||||
| Operating income |
26.8 | 10.6 | 98.9 | |||||||||||||
| Interest and other (income) expense |
||||||||||||||||
| Interest expense |
21.4 | 46.7 | 81.9 | |||||||||||||
| Loss on disposal of business |
— | — | 6.8 | |||||||||||||
| Loss on extinguishment of debt |
7.5 | 0.7 | 9.7 | |||||||||||||
| Other (income) expense, net |
(0.2 | ) | 0.1 | 0.1 | ||||||||||||
|
|
|
|
|
|
|
|||||||||||
| Total interest and other (income) expense |
28.7 | 47.5 | 98.5 | |||||||||||||
|
|
|
|
|
|
|
|||||||||||
| Income (loss) before income taxes |
(1.9 | ) | (36.9 | ) | 0.4 | |||||||||||
| Income tax expense (benefit) |
3.2 | (12.6 | ) | 3.8 | ||||||||||||
|
|
|
|
|
|
|
|||||||||||
| Net loss |
$ | (5.1 | ) | $ | (24.3 | ) | $ | (3.4 | ) | |||||||
|
|
|
|
|
|
|
|||||||||||
Revenue
| Predecessor | Successor | |||||||||||||||
| July 1, 2014 to February 1, 2015 |
November 20, 2014 to June 30, 2015 |
Fiscal year ended June 30, 2016 |
||||||||||||||
| Revenue |
||||||||||||||||
| Product |
$ | 1,201.4 | $ | 848.0 | $ | 2,319.8 | ||||||||||
| Service |
191.4 | 137.5 | 395.1 | |||||||||||||
|
|
|
|
|
|
|
|||||||||||
| Total revenue |
$ | 1,392.8 |
$ |
985.5 |
|
$ | 2,714.9 | |||||||||
| 14 | From November 20, 2014 to February 1, 2015, the Successor had no operations or activities other than the incurrence of transaction costs related to the Presidio Acquisition. See “Basis of Presentation.” |
91
Table of Contents
Total revenue was $2,714.9 million for the fiscal year ended June 30, 2016, which consisted of product revenue of $2,319.8 million and service revenue of $395.1 million, compared to total revenue of $985.5 million for the Successor period from November 20, 2014 to June 30, 2015, which consisted of product revenue of $848.0 million and service revenue of $137.5 million, and total revenue of $1,392.8 million for the Predecessor period from July 1, 2014 to February 1, 2015, which consisted of product revenue of $1,201.4 million and service revenue of $191.4 million.
| Predecessor | Successor | |||||||||||||||
| July 1, 2014 to February 1, 2015 |
November 20, 2014 to June 30, 2015 |
Fiscal year ended June 30, 2016 |
||||||||||||||
| Revenue by solution area |
||||||||||||||||
| Cloud |
$ | 184.1 | $ | 108.9 | $ | 391.7 | ||||||||||
| Security |
90.5 | 65.8 | 249.4 | |||||||||||||
| Digital Infrastructure |
1,118.2 | 810.8 | 2,073.8 | |||||||||||||
|
|
|
|
|
|
|
|||||||||||
| Total revenue |
$ | 1,392.8 | $ | 985.5 | $ | 2,714.9 | ||||||||||
Total revenue for the fiscal year ended June 30, 2016 consisted of Cloud revenue of $391.7 million, or 14.4% of total revenue, Security revenue of $249.4 million, or 9.2% of total revenue, and Digital Infrastructure revenue of $2,073.8 million, or 76.4% of total revenue. For the Successor period from November 20, 2014 to June 30, 2015, total revenue consisted of Cloud revenue of $108.9 million, or 11.1% of total revenue, Security revenue of $65.8 million, or 6.7% of total revenue, and Digital Infrastructure revenue of $810.8 million, or 82.2% of total revenue. For the Predecessor period from July 1, 2014 to February 1, 2015, total revenue consisted of Cloud revenue of $184.1 million, or 13.2% of total revenue, Security revenue of $90.5 million, or 6.5% of total revenue, and Digital Infrastructure revenue of $1,118.2 million, or 80.3% of total revenue.
Gross Margin
| Predecessor | Successor | |||||||||||||||
| July 1, 2014 to February 1, 2015 |
November 20, 2014 to June 30, 2015 |
Fiscal year ended June 30, 2016 |
||||||||||||||
| Gross margin |
||||||||||||||||
| Product |
$ | 248.5 | $ | 168.1 | $ | 453.3 | ||||||||||
| Service |
40.8 | 28.9 | 87.3 | |||||||||||||
|
|
|
|
|
|
|
|||||||||||
| Gross margin |
$ | 289.3 | $ | 197.0 | $ | 540.6 | ||||||||||
| Product gross margin % |
20.7 | % | 19.8 | % | 19.5 | % | ||||||||||
| Service gross margin % |
21.3 | % | 21.0 | % | 22.1 | % | ||||||||||
| Total gross margin % |
20.8 | % | 20.0 | % | 19.9 | % | ||||||||||
Gross margin for the fiscal year ended June 30, 2016 was $540.6 million, or 19.9% of total revenue, which consisted of product gross margin of $453.3 million, or 19.5% of product revenue, and service gross margin of $87.3 million, or 22.1% of service revenue. The product gross margin percentage was impacted by a lower proportion of third-party support services revenue. The service gross margin percentage included the impact of costs associated with the completion of our customer migration to a unified managed services platform, costs incurred as a result of the expansion of our cloud services capabilities in connection with the Sequoia acquisition and the mix of our professional services.
Gross margin for the Successor period from November 20, 2014 to June 30, 2015 was $197.0 million, or 20.0% of total revenue, which consisted of product gross margin of $168.1 million, or 19.8% of product revenue, and service gross margin of $28.9 million, or 21.0% of service revenue. The product gross margin percentage was impacted by a higher proportion of third-party support services revenue partially offset by lower margin
92
Table of Contents
product offerings sold in the period. The service gross margin percentage was impacted by reduced gross margins on managed services revenue as we transition from multiple services platforms into an integrated managed services offering.
Gross margin for the Predecessor period from July 1, 2014 to February 1, 2015 was $289.3 million, or 20.8% of total revenue, which consisted of product gross margin of $248.5 million, or 20.7% of product revenue, and service gross margin of $40.8 million, or 21.3% of service revenue. The product gross margin percentage was impacted by a higher proportion of third-party support services revenue and higher margin product offerings sold in the period. The service gross margin percentage was impacted by reduced gross margins on managed services revenue as we transition from multiple services platforms into an integrated managed services offering.
Operating Expenses
| Predecessor | Successor | |||||||||||||||
| July 1, 2014 to February 1, 2015 |
November 20, 2014 to June 30, 2015 |
Fiscal year ended June 30, 2016 |
||||||||||||||
| Operating expenses |
||||||||||||||||
| Selling expenses |
$ | 137.6 | $ | 94.4 | $ | 248.2 | ||||||||||
| General and administrative |
59.9 | 40.5 | 96.9 | |||||||||||||
|
|
|
|
|
|
|
|||||||||||
| Selling, general and administrative costs |
197.5 | 134.9 | 345.1 | |||||||||||||
| Transaction costs |
42.6 | 21.3 | 20.6 | |||||||||||||
| Depreciation and amortization |
22.4 | 30.2 | 76.0 | |||||||||||||
|
|
|
|
|
|
|
|||||||||||
| Total operating expenses |
$ | 262.5 | $ | 186.4 | $ | 441.7 | ||||||||||
| Selling, general and administrative expenses |
14.2 | % | 13.7 | % | 12.7 | % | ||||||||||
Selling expenses are composed of compensation, variable incentive pay and benefits related to our sales force along with travel expenses and other employee related costs. General and administrative expenses are composed of compensation and benefits of administrative personnel, including variable incentive pay and other administrative costs such as facilities expenses, professional fees and bad debt expense.
For the fiscal year ended June 30, 2016, SG&A was $345.1 million, or 12.7% of total revenue, which consisted of selling expenses of $248.2 million and general and administrative expenses of $96.9 million. For the Successor period from November 20, 2014 to June 30, 2015, SG&A was $134.9 million, or 13.7% of total revenue, which consisted of selling expenses of $94.4 million and general and administrative expenses of $40.5 million. Selling expenses in the period were driven higher by increased variable incentive pay to our sales force on higher gross margin dollars in the period. For the Predecessor period from July 1, 2014 to February 1, 2015, SG&A was $197.5 million, or 14.2% of total revenue, which consisted of selling expenses of $137.6 million and general and administrative expenses of $59.9 million. Excluding the impact of $20.1 million of share-based compensation, largely due to the acceleration of vesting of share-based awards to employees as a result of the Presidio Acquisition, SG&A was $177.4 million, or 12.7% of total revenue, in the period.
Transaction costs of $20.6 million for the fiscal year ended June 30, 2016 primarily related to professional fees and related expenses incurred as a result of diligence, acquisition and disposition activity, including expenses associated with proposed acquisitions that were not completed, transaction-related costs associated with the acquisitions of Sequoia and Netech and expenses associated with the disposition of Atlantix. Transaction costs of $21.3 million during the Successor period from November 20, 2014 to June 30, 2015 primarily related to professional fees and related costs of the Successor in connection with the Presidio
93
Table of Contents
Acquisition, including legal and accounting due diligence efforts, advisory fees and related expenses. Transaction costs of $42.6 million during the Predecessor period from July 1, 2014 to February 1, 2015, primarily related to professional fees and related costs of the Predecessor in connection with the Presidio Acquisition including success-based advisory and transaction fees, accounting and tax fees, legal fees and other related costs and expenses.
Depreciation and amortization expense included in operating expenses was $76.0 million for the fiscal year ended June 30, 2016, primarily related to the $67.2 million of amortization of intangible assets associated with the Presidio Acquisition, the Netech Acquisition and the Sequoia acquisition compared to $30.2 million during the Successor period from November 20, 2014 to June 30, 2015, primarily related to amortization of intangible assets associated with the Presidio Acquisition, and $22.4 million during the Predecessor period from July 1, 2014 to February 1, 2015, primarily related to the amortization of previously acquired intangible assets.
Interest and Other (Income) Expense
| Predecessor | Successor | |||||||||||||||
| July 1, 2014 to February 1, 2015 |
November 20, 2014 to June 30, 2015 |
Fiscal year ended June 30, 2016 |
||||||||||||||
| Interest and other (income) expense |
||||||||||||||||
| Interest expense |
$ | 21.4 | $ | 46.7 | $ | 81.9 | ||||||||||
| Loss on disposal of business |
— | — | 6.8 | |||||||||||||
| Loss on extinguishment of debt |
7.5 | 0.7 | 9.7 | |||||||||||||
| Other (income) expense, net |
(0.2 | ) | 0.1 | 0.1 | ||||||||||||
|
|
|
|
|
|
|
|||||||||||
| Total interest and other (income) expense |
$ | 28.7 | $ | 47.5 | $ | 98.5 | ||||||||||
Interest and other (income) expense was $98.5 million for the fiscal year ended June 30, 2016, which primarily includes interest expense of $81.9 million associated with debt outstanding in the period. In addition, during the fiscal year ended June 30, 2016, we incurred a $6.8 million loss associated with the disposition of the Atlantix business, as well as $9.7 million in losses on early extinguishment of debt. During the Successor period from November 20, 2014 to June 30, 2015, interest and other (income) expense was $47.5 million, primarily related to interest on debt issued in connection with the Presidio Acquisition. During the Predecessor period from July 1, 2014 to February 1, 2015, interest and other (income) expense was $28.7 million, primarily related to interest associated with Predecessor debt outstanding in the period, along with a $7.5 million loss on extinguishment of debt associated with the Presidio Acquisition.
Income Tax Expense
| Predecessor | Successor | |||||||||||||||
| July 1, 2014 to February 1, 2015 |
November 20, 2014 to June 30, 2015 |
Fiscal year ended June 30, 2016 |
||||||||||||||
| Income (loss) before income taxes |
$ | (1.9 | ) | $ | (36.9 | ) | $ | 0.4 | ||||||||
| Income tax expense (benefit) |
3.2 | (12.6 | ) | 3.8 | ||||||||||||
|
|
|
|
|
|
|
|||||||||||
| Net loss |
$ | (5.1 | ) | $ | (24.3 | ) | $ | (3.4 | ) | |||||||
Income tax expense was $3.8 million for the fiscal year ended June 30, 2016 compared to an income tax benefit of $12.6 million for the Successor period from November 20, 2014 to June 30, 2015 and income tax expense of $3.2 million for the Predecessor period from July 1, 2014 to February 1, 2015. The effective tax rate
94
Table of Contents
was 950.0% for the fiscal year ended June 30, 2016 compared to 34.1% for the Successor period from November 20, 2014 to June 30, 2015 and (168.4)% for the Predecessor period from July 1, 2014 to February 1, 2015. Our effective income tax rate for the fiscal year ended June 30, 2016 was significantly higher than the statutory rate, primarily due to the impact of the nominally small pre-tax income of $0.4 million, unfavorable permanent differences and the impact of the revaluation of deferred tax balances related to the state tax rate change. Our effective tax rate of 34.1% for the Successor period from November 20, 2014 to June 30, 2015 was lower than our statutory rate primarily due to the non-deductibility of certain transaction expenses associated with the Presidio Acquisition and the pre-tax loss in the period. Our effective tax rate of (168.4)% for the Predecessor period from July 1, 2014 to February 1, 2015 was lower than our statutory rate primarily due to the non-deductibility of certain transaction expenses associated with the Presidio Acquisition and the pre-tax loss in the period.
95
Table of Contents
Successor period from November 20, 2014 to June 30, 201515 and Predecessor period from July 1, 2014 to February 1, 2015 compared to Predecessor Fiscal Year Ended June 30, 2014
| Predecessor | Successor | |||||||||||||||
| Fiscal year ended June 30, 2014 |
July 1, 2014 to February 1, 2015 |
November 20, 2014 to June 30, 2015 |
||||||||||||||
| Revenue |
||||||||||||||||
| Product |
$ | 1,945.0 | $ | 1,201.4 | $ | 848.0 | ||||||||||
| Service |
321.0 | 191.4 | 137.5 | |||||||||||||
|
|
|
|
|
|
|
|||||||||||
| Total revenue |
2,266.0 | 1,392.8 | 985.5 | |||||||||||||
| Cost of revenue |
||||||||||||||||
| Product |
1,561.1 | 952.9 | 679.9 | |||||||||||||
| Service |
250.9 | 150.6 | 108.6 | |||||||||||||
|
|
|
|
|
|
|
|||||||||||
| Total cost of revenue |
1,812.0 | 1,103.5 | 788.5 | |||||||||||||
|
|
|
|
|
|
|
|||||||||||
| Gross margin |
454.0 | 289.3 | 197.0 | |||||||||||||
| Product gross margin |
383.9 | 248.5 | 168.1 | |||||||||||||
| Service gross margin |
70.1 | 40.8 | 28.9 | |||||||||||||
| Product gross margin % |
19.7 | % | 20.7 | % | 19.8 | % | ||||||||||
| Service gross margin % |
21.8 | % | 21.3 | % | 21.0 | % | ||||||||||
| Total gross margin % |
20.0 | % | 20.8 | % | 20.0 | % | ||||||||||
| Operating expenses |
||||||||||||||||
| Selling expenses |
211.1 | 137.6 | 94.4 | |||||||||||||
| General and administrative |
90.7 | 59.9 | 40.5 | |||||||||||||
| Transaction costs |
14.8 | 42.6 | 21.3 | |||||||||||||
| Depreciation and amortization |
45.9 | 22.4 | 30.2 | |||||||||||||
|
|
|
|
|
|
|
|||||||||||
| Total operating expenses |
362.5 | 262.5 | 186.4 | |||||||||||||
|
|
|
|
|
|
|
|||||||||||
| Selling, general and administrative expenses |
13.3 | % | 14.2 | % | 13.7 | % | ||||||||||
| Operating income |
91.5 | 26.8 | 10.6 | |||||||||||||
| Interest and other (income) expense |
||||||||||||||||
| Interest expense |
34.3 | 21.4 | 46.7 | |||||||||||||
| Gain on interest rate swap agreements |
(2.2 | ) | — | — | ||||||||||||
| Loss on extinguishment of debt |
2.7 | 7.5 | 0.7 | |||||||||||||
| Other (income) expense, net |
(0.2 | ) | (0.2 | ) | 0.1 | |||||||||||
|
|
|
|
|
|
|
|||||||||||
| Total interest and other (income) expense |
34.6 | 28.7 | 47.5 | |||||||||||||
|
|
|
|
|
|
|
|||||||||||
| Income before income taxes |
56.9 | (1.9 | ) | (36.9 | ) | |||||||||||
| Income tax expense |
24.4 | 3.2 | (12.6 | ) | ||||||||||||
|
|
|
|
|
|
|
|||||||||||
| Net income |
$ | 32.5 | $ | (5.1 | ) | $ | (24.3 | ) | ||||||||
|
|
|
|
|
|
|
|||||||||||
| 15 | From November 20, 2014 to February 1, 2015, the Successor had no operations or activities other than the incurrence of transaction costs related to the Presidio Acquisition. See “Basis of Presentation.” |
96
Table of Contents
Revenue
| Predecessor | Successor | |||||||||||||||
| Fiscal year ended June 30, 2014 |
July 1, 2014 to February 1, 2015 |
November 20, 2014 to June 30, 2015 |
||||||||||||||
| Revenue |
||||||||||||||||
| Product |
$ | 1,945.0 | $ | 1,201.4 | $ | 848.0 | ||||||||||
| Service |
321.0 | 191.4 | 137.5 | |||||||||||||
|
|
|
|
|
|
|
|||||||||||
| Total revenue |
$ | 2,266.0 | $ | 1,392.8 | $ | 985.5 | ||||||||||
Total revenue was $985.5 million for the Successor period from November 20, 2014 to June 30, 2015, which consisted of product revenue of $848.0 million and service revenue of $137.5 million, and total revenue was $1,392.8 million for the Predecessor period from July 1, 2014 to February 1, 2015, which consisted of product revenue of $1,201.4 million and service revenue of $191.4 million, compared to total revenue of $2,266.0 million for the fiscal year ended June 30, 2014, which consisted of product revenue of $1,945.0 million and service revenue of $321.0 million.
| Predecessor | Successor | |||||||||||||||
| Fiscal year ended June 30, 2014 |
July 1, 2014 to February 1, 2015 |
November 20, 2014 to June 30, 2015 |
||||||||||||||
| Revenue by solution area |
||||||||||||||||
| Cloud |
$ | 220.2 | $ | 184.1 | $ | 108.9 | ||||||||||
| Security |
142.0 | 90.5 | 65.8 | |||||||||||||
| Digital Infrastructure |
1,903.8 | 1,118.2 | 810.8 | |||||||||||||
|
|
|
|
|
|
|
|||||||||||
| Total revenue |
$ | 2,266.0 | $ | 1,392.8 | $ | 985.5 | ||||||||||
Total revenue for the Successor period from November 20, 2014 to June 30, 2015 was comprised of Cloud revenue of $108.9 million, or 11.1% of total revenue, Security revenue of $65.8 million, or 6.7% of total revenue, and Digital Infrastructure revenue of $810.8 million, or 82.2% of total revenue. For the Predecessor period from July 1, 2014 to February 1, 2015, total revenue consisted of Cloud revenue of $184.1 million, or 13.2% of total revenue, Security revenue of $90.5 million, or 6.5% of total revenue, and Digital Infrastructure revenue of $1,118.2 million, or 80.3% of total revenue.
For the fiscal year ended June 30, 2014, total revenue was comprised of Cloud revenue of $220.2 million, or 9.7% of total revenue, Security revenue of $142.0 million, or 6.3% of total revenue, and Digital Infrastructure revenue of $1,903.8 million, or 84.0% of total revenue.
Gross Margin
| Predecessor | Successor | |||||||||||||||
| Fiscal year ended June 30, 2014 |
July 1, 2014 to February 1, 2015 |
November 20, 2014 to June 30, 2015 |
||||||||||||||
| Gross margin |
||||||||||||||||
| Product |
$ | 383.9 | $ | 248.5 | $ | 168.1 | ||||||||||
| Service |
70.1 | 40.8 | 28.9 | |||||||||||||
|
|
|
|
|
|
|
|||||||||||
| Gross margin |
$ | 454.0 | $ | 289.3 | $ | 197.0 | ||||||||||
| Product gross margin % |
19.7 | % | 20.7 | % | 19.8 | % | ||||||||||
| Service gross margin % |
21.8 | % | 21.3 | % | 21.0 | % | ||||||||||
| Total gross margin % |
20.0 | % | 20.8 | % | 20.0 | % | ||||||||||
97
Table of Contents
Gross margin for the Successor period from November 20, 2014 to June 30, 2015 was $197.0 million, or 20.0% of total revenue, which consisted of product gross margin of $168.1 million, or 19.8% of product revenue, and service gross margin of $28.9 million, or 21.0% of service revenue. The product gross margin percentage was impacted by a higher proportion of third-party support services revenue, partially offset by lower margin product offerings sold in the period. The service gross margin percentage was impacted by reduced gross margins on managed services revenue as we transition from multiple services platforms into an integrated managed services offering.
Gross margin for the Predecessor period from July 1, 2014 to February 1, 2015 was $289.3 million, or 20.8% of total revenue, which consisted of product gross margin of $248.5 million, or 20.7% of product revenue, and service gross margin of $40.8 million, or 21.3% of service revenue. The product gross margin percentage was impacted by a higher proportion of third-party support services revenue and higher margin product offerings sold in the period. The service gross margin percentage was impacted by reduced gross margins on managed services revenue as we transition from multiple services platforms into an integrated managed services offering.
Gross margin for the fiscal year ended June 30, 2014 was $454.0 million, or 20.0% of total revenue, which was comprised of product gross margin of $383.9 million, or 19.7% of product revenue, and service gross margin of $70.1 million, or 21.8% of service revenue. Product gross margin as a percentage of product revenue was a result of the sale of more complex technology and therefore more profitable projects, which feature unified communications, security and mobility elements. Service gross margin as a percentage of service revenue was a result of a strong utilization (i.e., the number of chargeable hours per person) of our engineers in our 2014 fiscal year, higher billed rates per hour for these services and the investments in additional engineering technicians in our 2013 fiscal year who became more fully utilized in our 2014 fiscal year.
Operating Expenses
| Predecessor | Successor | |||||||||||||
| Fiscal year ended June 30, 2014 |
July 1, 2014 to February 1, 2015 |
November 20, 2014 to June 30, 2015 |
||||||||||||
| Operating expenses |
||||||||||||||
| Selling expenses |
$ | 211.1 | $ | 137.6 | $ | 94.4 | ||||||||
| General and administrative |
90.7 | 59.9 | 40.5 | |||||||||||
|
|
|
|
|
|
|
|||||||||
| Selling, general and administrative costs |
301.8 | 197.5 | 134.9 | |||||||||||
| Transaction costs |
14.8 | 42.6 | 21.3 | |||||||||||
| Depreciation and amortization |
45.9 | 22.4 | 30.2 | |||||||||||
|
|
|
|
|
|
|
|||||||||
| Total operating expenses |
$ | 362.5 | $ | 262.5 | $ | 186.4 | ||||||||
| Selling, general and administrative expenses |
13.3 | % | 14.2 | % | 13.7 | % | ||||||||
Selling expenses are composed of compensation, variable incentive pay and benefits related to our sales force along with travel expenses and other employee related costs. General and administrative expenses are composed of compensation and benefits of administrative personnel, including variable incentive pay and other administrative costs such as facilities expenses, professional fees and bad debt expense.
For the Successor period from November 20, 2014 to June 30, 2015, SG&A was $134.9 million, or 13.7% of total revenue, which consisted of selling expenses of $94.4 million and general and administrative expenses of $40.5 million. Selling expenses in the period were driven higher by increased variable incentive pay to our sales force on higher gross margin dollars. For the Predecessor period from July 1, 2014 to February 1, 2015, SG&A was $197.5 million, or 14.2% of total revenue, which consisted of selling expenses of $137.6 million and general and administrative expenses of $59.9 million. Excluding the impact of $20.1 million of
98
Table of Contents
share-based compensation, largely due to the acceleration of vesting of share-based awards to employees as a result of the Presidio Acquisition, SG&A was $177.4 million, or 12.7% of total revenue, in the period. For the fiscal year ended June 30, 2014, SG&A was $301.8 million, or 13.3% of total revenue, which consisted of selling expenses of $211.1 million and general and administrative expenses of $90.7 million. In the fiscal year 2014, we made an investment in additional sales personnel to support high-growth areas of our business and high variable incentive pay to our sales force occurred due to strong gross margin.
Transaction costs of $21.3 million during the Successor period from November 20, 2014 to June 30, 2015 primarily related to professional fees and related costs of the Successor in connection with the Presidio Acquisition, including legal and accounting due diligence efforts, advisory fees and related expenses. Transaction costs of $42.6 million during the Predecessor period from July 1, 2014 to February 1, 2015 primarily related to professional fees and related costs of the Predecessor in connection with the Presidio Acquisition, including success-based advisory and transaction fees, accounting and tax fees, legal fees and other related costs and expenses. Transaction costs of $14.8 million during the fiscal year ended June 30, 2014 included $13.0 million of professional fees and expenses related to our March 2014 dividend recapitalization financing and $1.8 million of expenses associated with our acquisitions of INX and BlueWater and from our acquisition by American Securities.
Depreciation and amortization expense included in operating expenses was $30.2 million during the Successor period from November 20, 2014 to June 30, 2015, primarily related to amortization of intangible assets associated with the Presidio Acquisition, and $22.4 million during the Predecessor period from July 1, 2014 to February 1, 2015, primarily related to the amortization of previously acquired intangible assets, compared to $45.9 million during the fiscal year ended June 30, 2014, primarily as a result of amortization expenses from our identifiable finite-lived intangible assets arising from the acquisitions of INX and BlueWater, as well as the American Securities transaction in fiscal year ended 2011.
Interest and Other (Income) Expense
| Predecessor | Successor | |||||||||||||
| Fiscal year ended June 30, 2014 |
July 1, 2014 to February 1, 2015 |
November 20, 2014 to June 30, 2015 |
||||||||||||
| Interest and other (income) expense |
||||||||||||||
| Interest expense |
$ | 34.3 | $ | 21.4 | $ | 46.7 | ||||||||
| Gain on interest rate swap agreements |
(2.2 | ) | — | — | ||||||||||
| Loss on extinguishment of debt |
2.7 | 7.5 | 0.7 | |||||||||||
| Other (income) expense, net |
(0.2 | ) | (0.2 | ) | 0.1 | |||||||||
|
|
|
|
|
|
|
|||||||||
| Total interest and other (income) expense |
$ | 34.6 | $ | 28.7 | $ | 47.5 | ||||||||
Interest and other (income) expense during the Successor period from November 20, 2014 to June 30, 2015 was $47.5 million, primarily related to interest on debt issued in connection with the Presidio Acquisition. During the Predecessor period from July 1, 2014 to February 1, 2015, interest and other (income) expense was $28.7 million, primarily related to interest associated with Predecessor debt outstanding in the period, along with a $7.5 million loss on extinguishment of debt associated with the Presidio Acquisition. During the fiscal year
99
Table of Contents
ended June 30, 2014, interest and other (income) expense was $34.6 million, primarily as a result of interest expense from borrowings under our term loan facility.
Income Tax Benefit
| Predecessor | Successor | |||||||||||||
| Fiscal year ended June 30, 2014 |
July 1, 2014 to February 1, 2015 |
November 20, 2014 to June 30, 2015 |
||||||||||||
| Income (loss) before income taxes |
$ | 56.9 | $ | (1.9 | ) | $ | (36.9 | ) | ||||||
| Income tax expense (benefit) |
24.4 | 3.2 | (12.6 | ) | ||||||||||
|
|
|
|
|
|
|
|||||||||
| Net income (loss) |
$ | 32.5 | $ | (5.1 | ) | $ | (24.3 | ) | ||||||
Income tax benefit was $12.6 million for the Successor period from November 20, 2014 to June 30, 2015 and income tax expense was $3.2 million for the Predecessor period July 1, 2014 to February 1, 2015, compared to income tax expense of $24.4 million for the fiscal year ended June 30, 2014. The effective tax rate was 34.1% for the Successor period from November 20, 2014 to June 30, 2015 and (168.4)% for the Predecessor period July 1, 2014 to February 1, 2015, compared to 42.9% for the fiscal year ended June 30, 2014. Our effective tax rate of 34.1% for the Successor period from November 20, 2014 to June 30, 2015 was lower than our statutory rate primarily due to the non-deductibility of certain transaction expenses associated with the Presidio Acquisition and the pre-tax loss in the period. Our effective tax rate of (168.4)% for the Predecessor period July 1, 2014 to February 1, 2015 was lower than our statutory rate primarily due to the non-deductibility of certain transaction expenses associated with the Presidio Acquisition and the pre-tax loss in the period. The effective tax rate of 42.9% for the fiscal year ended June 30, 2014 resulted from additional income tax expense which was due to the true-up of the prior year’s accrued income tax expense to actual.
Supplemental Management’s Discussion and Analysis of Financial Condition and Results of Operations (“Supplemental MD&A”)
We have presented below the Pro Forma fiscal year ended June 30, 2015, which includes pro forma adjustments necessary to reflect the Presidio Acquisition as if it had occurred on July 1, 2014. Prior to the Presidio Acquisition, Successor had no operations or activities other than the incurrence of transaction costs related to the Presidio Acquisition. The following information compares the Successor year ended June 30, 2016 to the Pro Forma year ended June 30, 2015, as well as the Pro Forma year ended June 30, 2015 to the Predecessor year ended June 30, 2014. We believe this Supplemental MD&A provides additional information to the reader about our financial performance, including changes in our revenue, gross margins and profitability in a manner consistent with how management views our performance.
100
Table of Contents
Fiscal Year Ended June 30, 2016 Compared to Pro Forma Fiscal Year Ended June 30, 2015
| Pro Forma fiscal year ended June 30, 2015 |
Fiscal year ended June 30, 2016 |
Change | ||||||||||||||
| $ | % | |||||||||||||||
| Revenue |
||||||||||||||||
| Product |
$ | 2,049.4 | $ | 2,319.8 | $ | 270.4 | 13.2 | % | ||||||||
| Service |
327.7 | 395.1 | 67.4 | 20.6 | % | |||||||||||
|
|
|
|
|
|
|
|
|
|||||||||
| Total revenue |
2,377.1 | 2,714.9 | 337.8 | 14.2 | % | |||||||||||
| Cost of revenue |
||||||||||||||||
| Product |
1,629.7 | 1,866.5 | 236.8 | 14.5 | % | |||||||||||
| Service |
259.2 | 307.8 | 48.6 | 18.8 | % | |||||||||||
|
|
|
|
|
|
|
|
|
|||||||||
| Total cost of revenue |
1,888.9 | 2,174.3 | 285.4 | 15.1 | % | |||||||||||
|
|
|
|
|
|
|
|
|
|||||||||
| Gross margin |
488.2 | 540.6 | 52.4 | 10.7 | % | |||||||||||
| Product gross margin |
419.7 | 453.3 | 33.6 | 8.0 | % | |||||||||||
| Service gross margin |
68.5 | 87.3 | 18.8 | 27.4 | % | |||||||||||
| Product gross margin % |
20.5 | % | 19.5 | % | (1.0 | %) | ||||||||||
| Service gross margin % |
20.9 | % | 22.1 | % | 1.2 | % | ||||||||||
| Total gross margin % |
20.5 | % | 19.9 | % | (0.6 | %) | ||||||||||
| Operating expenses |
||||||||||||||||
| Selling expenses |
224.2 | 248.2 | 24.0 | 10.7 | % | |||||||||||
| General and administrative |
88.2 | 96.9 | 8.7 | 9.9 | % | |||||||||||
| Transaction costs |
2.6 | 20.6 | 18.0 | 692.3 | % | |||||||||||
| Depreciation and amortization |
71.4 | 76.0 | 4.6 | 6.4 | % | |||||||||||
|
|
|
|
|
|
|
|
|
|||||||||
| Total operating expenses |
386.4 | 441.7 | 55.3 | 14.3 | % | |||||||||||
|
|
|
|
|
|
|
|
|
|||||||||
| Selling, general and administrative expenses % of total revenue |
13.1 | % | 12.7 | % | (0.4 | %) | ||||||||||
| Operating income |
101.8 | 98.9 | (2.9 | ) | (2.8 | )% | ||||||||||
| Interest and other (income) expense |
||||||||||||||||
| Interest expense |
81.2 | 81.9 | 0.7 | 0.9 | % | |||||||||||
| Loss on disposal of business |
— | 6.8 | 6.8 | n.m. | ||||||||||||
| Loss on extinguishment of debt |
— | 9.7 | 9.7 | n.m. | ||||||||||||
| Other (income) expense, net |
(0.1 | ) | 0.1 | 0.2 | (200.0 | %) | ||||||||||
|
|
|
|
|
|
|
|
|
|||||||||
| Total interest and other (income) expense |
81.1 | 98.5 | 17.4 | 21.5 | % | |||||||||||
|
|
|
|
|
|
|
|
|
|||||||||
| Income (loss) before income taxes |
20.7 | 0.4 | (20.3 | ) | (98.1 | %) | ||||||||||
| Income tax expense (benefit) |
10.2 | 3.8 | (6.4 | ) | (62.7 | %) | ||||||||||
|
|
|
|
|
|
|
|
|
|||||||||
| Net income (loss) |
$ | 10.5 | $ | (3.4 | ) | $ | (13.9 | ) | n.m. | |||||||
|
|
|
|
|
|
|
|
|
|||||||||
| Adjusted EBITDA |
$ | 184.8 | $ | 211.1 | $ | 26.3 | 14.2 | % | ||||||||
| Adjusted Net Income |
$ | 63.8 | $ | 81.2 | $ | 17.4 | 27.3 | % | ||||||||
n.m. – not meaningful
101
Table of Contents
The following table presents a reconciliation of Net income (loss) to Adjusted EBITDA for the fiscal year ended June 30, 2016 and the Pro Forma fiscal year ended June 30, 2015.
| Pro Forma fiscal year ended June 30, 2015 |
Fiscal year ended June 30, 2016 |
|||||||
| Adjusted EBITDA Reconciliation: |
||||||||
| Net income (loss) |
$ | 10.5 | $ | (3.4 | ) | |||
| Total depreciation and amortization (1) |
75.8 | 81.7 | ||||||
| Interest and other (income) expense |
81.1 | 98.5 | ||||||
| Income tax expense |
10.2 | 3.8 | ||||||
|
|
|
|
|
|||||
| EBITDA |
177.6 | 180.6 | ||||||
| Adjustments: |
||||||||
| Share-based compensation expense |
2.6 | 2.2 | ||||||
| Purchase accounting adjustments (2) |
3.0 | 3.9 | ||||||
| Transaction costs (3) |
2.6 | 20.6 | ||||||
| Other costs (4) |
4.9 | 5.6 | ||||||
| Earnings from disposed business (5) |
(5.9 | ) | (1.8 | ) | ||||
|
|
|
|
|
|||||
| Total adjustments |
7.2 | 30.5 | ||||||
|
|
|
|
|
|||||
| Adjusted EBITDA |
$ | 184.8 | $ | 211.1 | ||||
|
|
|
|
|
|||||
| (1) | “Total depreciation and amortization” equals the sum of (i) depreciation and amortization included within total operating expenses and (ii) depreciation and amortization recorded as part of cost of revenue within our consolidated financial statements. |
| (2) | “Purchase accounting adjustments” include charges associated with noncash adjustments to acquired assets and liabilities in connection with purchase accounting, such as recognition of increased cost of revenue in connection with an inventory step up fair value adjustment, recognition of reduced revenue in connection with a deferred revenue step down fair value adjustment and recognition of increased office rent expense associated with a fair value adjustment to the liability associated with deferred rent. |
| (3) | “Transaction costs” (i) of $2.6 million for the Pro Forma fiscal year ended June 30, 2015 includes acquisition-related expenses of $1.8 million related to stay and retention bonuses and $0.8 million related to severance charges; and (ii) of $20.6 million for the fiscal year ended June 30, 2016 includes acquisition-related expenses of $3.0 million related to stay and retention bonuses, $1.1 million related to severance charges, $8.7 million related to transaction-related advisory and diligence fees, $6.0 million related to transaction-related legal, accounting and tax fees and $1.8 million related to professional fees and expenses associated with debt refinancings. |
| (4) | “Other costs” (i) of $4.9 million for the Pro Forma fiscal year ended June 30, 2015 includes expenses of $3.2 million associated with the integration of previously acquired managed services platforms into one system, $0.7 million related to certain non-recurring costs incurred in the development of our new cloud service offerings, certain expenses of $0.4 million related to unusual office start-up development costs, certain unusual legal expenses of $0.2 million, $0.1 million related to payments to our former sponsor for advisory and consulting services and $0.3 million related to other non-recurring items; and (ii) of $5.6 million for the fiscal year ended June 30, 2016 includes expenses of $0.5 million associated with the integration of previously acquired managed services platforms into one system, $3.4 million related to certain non-recurring costs incurred in the development of our new cloud service offerings, certain expenses of $0.5 million related to unusual office start-up development costs and certain unusual legal expenses of $1.2 million. |
| (5) | “Earnings from disposed business” represents the removal of the historical earnings contribution of Atlantix prior to the sale of the business. |
102
Table of Contents
The following table presents a reconciliation of Net income (loss) to Adjusted Net Income for the fiscal year ended June 30, 2016 and the Pro Forma fiscal year ended June 30, 2015.
| Pro Forma fiscal year ended June 30, 2015 |
Fiscal year ended June 30, 2016 |
|||||||
| (in millions) | ||||||||
| Adjusted Net Income reconciliation: |
||||||||
| Net income (loss) |
$ | 10.5 | $ | (3.4 | ) | |||
| Adjustments: |
||||||||
| Amortization of intangible assets |
63.5 | 67.2 | ||||||
| Amortization of debt issuance costs |
6.5 | 7.6 | ||||||
| Loss on disposal of business |
— | 6.8 | ||||||
| Loss on extinguishment of debt |
— | 9.7 | ||||||
| Share-based compensation expense |
2.6 | 2.2 | ||||||
| Purchase accounting adjustments (1) |
3.0 | 3.9 | ||||||
| Transaction costs (2) |
2.6 | 20.6 | ||||||
| Other costs (3) |
4.9 | 5.6 | ||||||
| Earnings from disposed business (4) |
(5.9 | ) | (1.8 | ) | ||||
| Income tax impact of adjustments (5) |
(23.9 | ) | (37.2 | ) | ||||
|
|
|
|
|
|||||
| Total adjustments |
53.3 | 84.6 | ||||||
|
|
|
|
|
|||||
| Adjusted Net Income |
$ | 63.8 | $ | 81.2 | ||||
|
|
|
|
|
|||||
| (1) | “Purchase accounting adjustments” include charges associated with noncash adjustments to acquired assets and liabilities in connection with purchase accounting, such as recognition of increased cost of revenue in connection with an inventory step up fair value adjustment, recognition of reduced revenue in connection with a deferred revenue step down fair value adjustment and recognition of increased office rent expense associated with a fair value adjustment to the liability associated with deferred rent. |
| (2) | “Transaction costs” (i) of $2.6 million for the Pro Forma fiscal year ended June 30, 2015 includes acquisition-related expenses of $1.8 million related to stay and retention bonuses and $0.8 million related to severance charges; and (ii) of $20.6 million for the fiscal year ended June 30, 2016 includes acquisition-related expenses of $3.0 million related to stay and retention bonuses, $1.1 million related to severance charges, $8.7 million related to transaction-related advisory and diligence fees, $6.0 million related to transaction-related legal, accounting and tax fees and $1.8 million related to professional fees and expenses associated with debt refinancings. |
| (3) | “Other costs” (i) of $4.9 million for the Pro Forma fiscal year ended June 30, 2015 includes expenses of $3.2 million associated with the integration of previously acquired managed services platforms into one system, $0.7 million related to certain non-recurring costs incurred in the development of our new cloud service offerings, certain expenses of $0.4 million related to unusual office start-up development costs, certain unusual legal expenses of $0.2 million, $0.1 million related to payments to our former sponsor for advisory and consulting services and $0.3 million related to other non-recurring items; and (ii) of $5.6 million for the fiscal year ended June 30, 2016 includes expenses of $0.5 million associated with the integration of previously acquired managed services platforms into one system, $3.4 million related to certain non-recurring costs incurred in the development of our new cloud service offerings, certain expenses of $0.5 million related to unusual office start-up development costs and certain unusual legal expenses of $1.2 million. |
| (4) | “Earnings from disposed business” represents the removal of the historical earnings contribution of Atlantix prior to the sale of the business. |
103
Table of Contents
| (5) | “Income tax impact of adjustments” includes an estimated tax impact of the adjustments to net income at our average statutory rate of 39.0%, except for (i) the adjustment of certain transaction costs that are permanently nondeductible for tax purposes and (ii) the impact of tax-deductible goodwill and intangible assets resulting from certain historical acquisitions, and further adjusted for discrete tax items such as the remeasurement of deferred tax liabilities due to state rate changes and write off of deferred tax assets resulting from reorganizations. |
Revenue
| Pro Forma fiscal year ended June 30, 2015 |
Fiscal year ended June 30, 2016 |
Change | ||||||||||||||
| $ | % | |||||||||||||||
| Revenue |
||||||||||||||||
| Product |
$ | 2,049.4 | $ | 2,319.8 | $ | 270.4 | 13.2 | % | ||||||||
| Service |
327.7 | 395.1 | 67.4 | 20.6 | % | |||||||||||
|
|
|
|
|
|
|
|
|
|||||||||
| Total revenue |
$ | 2,377.1 | $ | 2,714.9 | $ | 337.8 | $ | 14.2 | % | |||||||
Total revenue increased $337.8 million, or 14.2%, to $2,714.9 million for the fiscal year ended June 30, 2016, compared to total revenue of $2,377.1 million for the Pro Forma fiscal year ended June 30, 2015. Growth in IT spending was driven by the demand associated with the cloud, security and IoT megatrends and, increasingly, the desire of our customers to integrate people, process and technology into their digital business models. We experienced increased growth, particularly in security solutions to all market segments including middle-market customers, government sector and large customers. The increase in total revenue was also a result of our ability to deliver innovative solutions to our customers through multi-vendor, multi-technology solutions.
Revenue from sales of product increased $270.4 million, or 13.2%, to $2,319.8 million for the fiscal year ended June 30, 2016, compared to $2,049.4 million for the Pro Forma fiscal year ended June 30, 2015, a result of strong customer demand for networking infrastructure, data center, security and IoT solutions.
Revenue from sales of services increased $67.4 million, or 20.6%, to $395.1 million for the fiscal year ended June 30, 2016, as compared to $327.7 million for the Pro Forma fiscal year ended June 30, 2015, a result of growth of our professional services business driven by increased complexity of solutions sold to our customers. The shift to more complex solution sales resulted in a $58.1 million increase in service revenue associated with a 7.7% increase in utilized hours of our engineers and a 4.4% increase in the hourly bill rate charged to our customers.
| Pro Forma fiscal year ended June 30, 2015 |
Fiscal year ended June 30, 2016 |
Change | ||||||||||||||
| $ | % | |||||||||||||||
| Revenue by solution area |
||||||||||||||||
| Cloud |
$ | 293.0 | $ | 391.7 | $ | 98.7 | 33.7 | % | ||||||||
| Security |
156.3 | 249.4 | 93.1 | 59.6 | % | |||||||||||
| Digital Infrastructure |
1,927.8 | 2,073.8 | 146.0 | 7.6 | % | |||||||||||
|
|
|
|
|
|
|
|
|
|||||||||
| Total revenue |
$ | 2,377.1 | $ | 2,714.9 | $ | 337.8 | 14.2 | % | ||||||||
Cloud revenue increased $98.7 million, or 33.7%, to $391.7 million in the fiscal year ended June 30, 2016, compared to $293.0 million for the Pro Forma fiscal year ended June 30, 2015, a result of higher client demand with middle-market customers, slightly offset by reduced demand with large and government clients. Among our middle-market customers, growth was driven by both healthcare and financial services customers.
Security revenue increased $93.1 million, or 59.6%, to $249.4 million in the fiscal year ended June 30, 2016, compared to $156.3 million in the Pro Forma fiscal year ended June 30, 2015, driven by strong growth
104
Table of Contents
from all of our client markets. Among our middle-market customers, healthcare clients experienced the largest growth along with strong growth from financial services clients, while in the government market continued focus on public safety by both the U.S. federal government and state and local government clients contributed to strong growth. In the large customer market, growth was led by financial services as well as professional service clients.
Digital Infrastructure grew $146.0 million, or 7.6%, to $2,073.8 million in the fiscal year ended June 30, 2016, compared to $1,927.8 million in the Pro Forma fiscal year ended June 30, 2015, due to increasingly complex business technologies supported by core infrastructure which drove demand for our solutions across all client segments, particularly in the government sector enabling our growth to exceed overall North America IT spend. Government sector market growth was driven by state and local government clients as well as sales to the U.S. federal government.
Gross Margin
| Pro forma fiscal year ended June 30, 2015 |
Fiscal year ended June 30, 2016 |
Change | ||||||||||||||
| $ | % | |||||||||||||||
| Gross margin |
||||||||||||||||
| Product gross margin |
$ | 419.7 | $ | 453.3 | $ | 33.6 | 8.0 | % | ||||||||
| Service gross margin |
68.5 | 87.3 | 18.8 | 27.4 | % | |||||||||||
|
|
|
|
|
|
|
|
|
|||||||||
| Gross margin |
$ | 488.2 | $ | 540.6 | $ | 52.4 | 10.7 | % | ||||||||
| Product gross margin % |
20.5 | % | 19.5 | % | (1.0 | %) | ||||||||||
| Service gross margin % |
20.9 | % | 22.1 | % | 1.2 | % | ||||||||||
| Total gross margin % |
20.5 | % | 19.9 | % | (0.6 | %) | ||||||||||
Total gross margin increased $52.4 million, or 10.7%, to $540.6 million for the fiscal year ended June 30, 2016, as compared to $488.2 million for the Pro Forma fiscal year ended June 30, 2015, primarily a result of an increase in total revenue of 14.2% between periods. As a percentage of total revenue, total gross margin decreased 60 basis points to 19.9% for the fiscal year ended June 30, 2016, down from 20.5% of revenue for the Pro Forma fiscal year ended June 30, 2015. The decrease in our total gross margin percentage resulted from lower product gross margins, partially offset by both the higher proportion of services revenue and expanding gross margins in our professional services and managed services business.
Product gross margin as a percentage of product revenue was 19.5% for the fiscal year ended June 30, 2016, a decrease of 100 basis points from 20.5% for the Pro Forma fiscal year ended June 30, 2015. The decrease in gross margin percentage was due to a lower proportion of net sales of third-party support services within product revenue.
Service gross margin as a percentage of services revenue increased 120 basis points from 20.9% for the Pro Forma fiscal year ended June 30, 2015, to 22.1% for the fiscal year ended June 30, 2016, resulting from increased efficiency in professional services revenue performed by internal engineering resources as well as the completion of migration of our clients to a unified managed services platform.
105
Table of Contents
Operating Expenses
| Pro Forma fiscal year ended June 30, 2015 |
Fiscal year ended June 30, 2016 |
Change | ||||||||||||||
| $ | % | |||||||||||||||
| Operating expenses |
||||||||||||||||
| Selling expenses |
$ | 224.2 | $ | 248.2 | $ | 24.0 | 10.7 | % | ||||||||
| General and administrative |
88.2 | 96.9 | 8.7 | 9.9 | % | |||||||||||
|
|
|
|
|
|
|
|
|
|||||||||
| Selling, general and administrative costs |
312.4 | 345.1 | 32.7 | 10.5 | % | |||||||||||
| Transaction costs |
2.6 | 20.6 | 18.0 | 692.3 | % | |||||||||||
| Depreciation and amortization |
71.4 | 76.0 | 4.6 | 6.4 | % | |||||||||||
|
|
|
|
|
|
|
|
|
|||||||||
| Total operating expenses |
$ | 386.4 | $ | 441.7 | $ | 55.3 | 14.3 | % | ||||||||
| Selling, general and administrative expenses |
13.1 | % | 12.7 | % | (0.4 | %) | ||||||||||
SG&A increased $32.7 million, or 10.5%, to $345.1 million, or 12.7% of total revenue, during the fiscal year ended June 30, 2016, up from $312.4 million, or 13.1% of total revenue, for the Pro Forma fiscal year ended June 30, 2015.
The increase is primarily attributable to investment in our pre-sales engineering talent and outside sales representatives, partially offset by more efficient variable incentive pay plans, as well as the addition of general and administrative personnel to support the increased growth in the business.
Transaction costs primarily relate to professional fees and other costs associated with acquisition and disposition related activities. Transaction costs were $20.6 million in the fiscal year ended June 30, 2016, resulting from diligence, acquisitions and dispositions, including the Atlantix and Netech transactions. Transaction costs were $2.6 million in the Pro Forma fiscal year ended June 30, 2015 primarily associated with acquisition-related stay and retention bonus expense and severance charges.
Depreciation and amortization expense included in operating expenses increased $4.6 million, or 6.4%, to $76.0 million for the fiscal year ended June 30, 2016, from $71.4 million for the Pro Forma fiscal year ended June 30, 2015, primarily as a result of increased amortization expense associated with acquired intangible assets associated with the Netech Acquisition.
Interest and Other (Income) Expense
| Pro Forma fiscal year ended June 30, 2015 |
Fiscal year ended June 30, 2016 |
Change | ||||||||||||||
| $ | % | |||||||||||||||
| Interest and other (income) expense |
||||||||||||||||
| Interest expense |
$ | 81.2 | $ | 81.9 | $ | 0.7 | 0.9 | % | ||||||||
| Loss on disposal of business |
— | 6.8 | 6.8 | n.m. | ||||||||||||
| Loss on extinguishment of debt |
— | 9.7 | 9.7 | n.m. | ||||||||||||
| Other (income) expense, net |
(0.1 | ) | 0.1 | 0.2 | (200.0 | %) | ||||||||||
|
|
|
|
|
|
|
|
|
|||||||||
| Total interest and other (income) expense |
$ | 81.1 | $ | 98.5 | $ | 17.4 | 21.5 | % | ||||||||
Interest and other (income) expense increased $17.4 million, or 21.5%, to $98.5 million for the fiscal year ended June 30, 2016, from $81.1 million in the Pro Forma fiscal year ended June 30, 2015. The net increase
106
Table of Contents
was primarily the result of the $6.8 million loss on the disposal of Atlantix in the fiscal year ended June 30, 2016, as well as $9.7 million in losses on early extinguishment of debt in connection with refinancing activity during the fiscal year ended June 30, 2016.
Income Tax Expense
| Pro Forma fiscal year ended June 30, 2015 |
Fiscal year ended June 30, 2016 |
Change | ||||||||||||||
| $ | % | |||||||||||||||
| Income before income taxes |
$ | 20.7 | $ | 0.4 | $ | (20.3 | ) | (98.1 | %) | |||||||
| Income tax expense |
10.2 | 3.8 | (6.4 | ) | (62.7 | %) | ||||||||||
|
|
|
|
|
|
|
|
|
|||||||||
| Net income (loss) |
$ | 10.5 | $ | (3.4 | ) | $ | (13.9 | ) | n.m. | |||||||
n.m. – not meaningful
Income tax expense of $3.8 million was recognized for the fiscal year ended June 30, 2016, compared to income tax expense of $10.2 million for the Pro Forma fiscal year ended June 30, 2015. The effective tax rate for the fiscal year ended June 30, 2016 was 950.0%, a result of low nominal pre-tax income and nondeductible transaction-related expenses in the period.
Adjusted EBITDA
Adjusted EBITDA increased $26.3 million, or 14.2%, to $211.1 million for the fiscal year ended June 30, 2016, from $184.8 million for the Pro Forma fiscal year ended June 30, 2015, resulting from 14.2% total revenue growth in the period.
Adjusted Net Income
Adjusted Net Income increased $17.4 million, or 27.3%, to $81.2 million for the fiscal year ended June 30, 2016, from $63.8 million for the Pro Forma fiscal year ended June 30, 2015, resulting from the revenue and gross margin growth in the period.
107
Table of Contents
Pro Forma Fiscal Year Ended June 30, 2015 Compared to Fiscal Year Ended June 30, 2014
| Fiscal year ended June 30, 2014 |
Pro Forma fiscal year ended June 30, 2015 |
Change | ||||||||||||||
| $ | % | |||||||||||||||
| Revenue |
||||||||||||||||
| Product |
$ | 1,945.0 | $ | 2,049.4 | $ | 104.4 | 5.4 | % | ||||||||
| Service |
321.0 | 327.7 | 6.7 | 2.1 | % | |||||||||||
|
|
|
|
|
|
|
|
|
|||||||||
| Total revenue |
2,266.0 | 2,377.1 | 111.1 | 4.9 | % | |||||||||||
| Cost of revenue |
||||||||||||||||
| Product |
1,561.1 | 1,629.7 | 68.6 | 4.4 | % | |||||||||||
| Service |
250.9 | 259.2 | 8.3 | 3.3 | % | |||||||||||
|
|
|
|
|
|
|
|
|
|||||||||
| Total cost of revenue |
1,812.0 | 1,888.9 | 76.9 | 4.2 | % | |||||||||||
|
|
|
|
|
|
|
|
|
|||||||||
| Gross margin |
454.0 | 488.2 | 34.2 | 7.5 | % | |||||||||||
| Product gross margin |
383.9 | 419.7 | 35.8 | 9.3 | % | |||||||||||
| Service gross margin |
70.1 | 68.5 | (1.6 | ) | (2.3 | %) | ||||||||||
| Product gross margin % |
19.7 | % | 20.5 | % | 0.8 | % | ||||||||||
| Service gross margin % |
21.8 | % | 20.9 | % | (0.9 | %) | ||||||||||
| Total gross margin % |
20.0 | % | 20.5 | % | 0.5 | % | ||||||||||
| Operating expenses |
||||||||||||||||
| Selling expenses |
211.1 | 224.2 | 13.1 | 6.2 | % | |||||||||||
| General and administrative |
90.7 | 88.2 | (2.5 | ) | (2.8 | %) | ||||||||||
| Transaction costs |
14.8 | 2.6 | (12.2 | ) | (82.4 | %) | ||||||||||
| Depreciation and amortization |
45.9 | 71.4 | 25.5 | 55.6 | % | |||||||||||
|
|
|
|
|
|
|
|
|
|||||||||
| Total operating expenses |
362.5 | 386.4 | 23.9 | 6.6 | % | |||||||||||
|
|
|
|
|
|
|
|
|
|||||||||
| Selling, general and administrative expenses |
13.3 | % | 13.1 | % | (0.2 | %) | ||||||||||
| Operating income |
91.5 | 101.8 | 10.3 | 11.3 | % | |||||||||||
| Interest and other (income) expense |
||||||||||||||||
| Interest expense |
34.3 | 81.2 | 46.9 | 136.7 | % | |||||||||||
| Gain on interest rate swap agreements |
(2.2 | ) | — | 2.2 | (100.0 | %) | ||||||||||
| Loss on extinguishment of debt |
2.7 | — | (2.7 | ) | (100.0 | %) | ||||||||||
| Other (income) expense, net |
(0.2 | ) | (0.1 | ) | 0.1 | (50.0 | %) | |||||||||
|
|
|
|
|
|
|
|
|
|||||||||
| Total interest and other (income) expense |
34.6 | 81.1 | 46.5 | 134.4 | % | |||||||||||
|
|
|
|
|
|
|
|
|
|||||||||
| Income before income taxes |
56.9 | 20.7 | (36.2 | ) | (63.6 | %) | ||||||||||
| Income tax expense |
24.4 | 10.2 | (14.2 | ) | (58.2 | %) | ||||||||||
|
|
|
|
|
|
|
|
|
|||||||||
| Net income |
$ | 32.5 | $ | 10.5 | $ | (22.0 | ) | (67.7 | %) | |||||||
|
|
|
|
|
|
|
|
|
|||||||||
| Adjusted EBITDA |
$ | 167.0 | $ | 184.8 | $ | 17.8 | 10.7 | % | ||||||||
| Adjusted Net Income |
$ | 81.7 | $ | 63.8 | $ | (17.9 | ) | (21.9 | %) | |||||||
108
Table of Contents
The following table presents a reconciliation of Net income to Adjusted EBITDA for the Pro Forma fiscal year ended June 30, 2015 and the fiscal year ended June 30, 2014.
| Fiscal year ended June 30, 2014 |
Pro Forma fiscal year ended June 30, 2015 |
|||||||
| Adjusted EBITDA reconciliation: |
||||||||
| Net income |
$ | 32.5 | $ | 10.5 | ||||
| Total depreciation and amortization (1) |
50.6 | 75.8 | ||||||
| Interest and other (income) expense |
34.6 | 81.1 | ||||||
| Income tax expense |
24.4 | 10.2 | ||||||
|
|
|
|
|
|||||
| EBITDA |
142.1 | 177.6 | ||||||
| Adjustments: |
||||||||
| Share-based compensation expense |
5.5 | 2.6 | ||||||
| Purchase accounting adjustments (2) |
— | 3.0 | ||||||
| Transaction costs (3) |
14.8 | 2.6 | ||||||
| Other costs (4) |
13.0 | 4.9 | ||||||
| Earnings from disposed business (5) |
(8.4 | ) | (5.9 | ) | ||||
|
|
|
|
|
|||||
| Total adjustments |
24.9 | 7.2 | ||||||
|
|
|
|
|
|||||
| Adjusted EBITDA |
$ | 167.0 | $ | 184.8 | ||||
|
|
|
|
|
|||||
| (1) | “Total depreciation and amortization” equals the sum of (i) depreciation and amortization included within total operating expenses and (ii) depreciation and amortization recorded as part of cost of revenue within our consolidated financial statements. |
| (2) | “Purchase accounting adjustments” include charges associated with noncash adjustments to acquired assets and liabilities in connection with purchase accounting, such as recognition of increased cost of revenue in connection with an inventory step up fair value adjustment, recognition of reduced revenue in connection with a deferred revenue step down fair value adjustment and recognition of increased office rent expense associated with a fair value adjustment to the liability associated with deferred rent. |
| (3) | “Transaction costs” (i) of $14.8 million for the fiscal year ended June 30, 2014 includes acquisition-related expenses of $0.8 million related to stay and retention bonuses, $0.3 million related to severance charges, $0.7 million related to transaction-related legal, accounting and tax fees and $13.0 million related to professional fees and expenses associated with debt refinancings; and (ii) of $2.6 million for the Pro Forma fiscal year ended June 30, 2015 includes acquisition-related expenses of $1.8 million related to stay and retention bonuses and $0.8 million related to severance charges. |
| (4) | “Other costs” (i) of $13.0 million for the fiscal year ended June 30, 2014 includes expenses of $3.7 million associated with the integration of previously acquired managed services platforms into one system, certain expenses of $1.1 million related to unusual office start-up development costs, an unusual and non-recurring loss of $1.7 million related to an Atlantix customer receivable, certain unusual legal expenses of $2.2 million, $2.1 million related to payments to our former sponsor for advisory and consulting services and $2.2 million related to certain acquisition-related integration and related costs; and (ii) of $4.9 million for the Pro Forma fiscal year ended June 30, 2015 includes expenses of $3.2 million associated with the integration of previously acquired managed services platforms into one system, $0.7 million related to certain non-recurring costs incurred in the development of our new cloud service offerings, certain expenses of $0.4 million related to unusual office start-up development costs, certain unusual legal expenses of $0.2 million, $0.1 million related to payments to our former sponsor for advisory and consulting services and $0.3 million related to other non-recurring items. |
| (5) | “Earnings from disposed business” represents the removal of the historical earnings contribution of Atlantix prior to the sale of the business. |
109
Table of Contents
The following table presents a reconciliation of Net income to Adjusted Net Income for the Pro Forma fiscal year ended June 30, 2015 and the fiscal year ended June 30, 2014.
| (in millions) | Fiscal year ended June 30, 2014 |
Pro Forma fiscal year ended June 30, 2015 |
||||||
| Adjusted Net Income reconciliation: |
||||||||
| Net income |
$ | 32.5 | $ | 10.5 | ||||
| Adjustments: |
||||||||
| Amortization of intangible assets |
38.3 | 63.5 | ||||||
| Amortization of debt issuance costs |
4.4 | 6.5 | ||||||
| Loss on extinguishment of debt |
2.7 | — | ||||||
| Share-based compensation expense |
5.5 | 2.6 | ||||||
| Purchase accounting adjustments (1) |
— | 3.0 | ||||||
| Transaction costs (2) |
14.8 | 2.6 | ||||||
| Other costs (3) |
13.0 | 4.9 | ||||||
| Earnings from disposed business (4) |
(8.4 | ) | (5.9 | ) | ||||
| Income tax impact of adjustments (5) |
(21.1 | ) | (23.9 | ) | ||||
|
|
|
|
|
|||||
| Total adjustments |
49.2 | 53.3 | ||||||
|
|
|
|
|
|||||
| Adjusted Net Income |
$ | 81.7 | $ | 63.8 | ||||
|
|
|
|
|
|||||
| (1) | “Purchase accounting adjustments” includes charges associated with noncash adjustments to acquired assets and liabilities in connection with purchase accounting, such as recognition of increased cost of revenue in connection with an inventory step up fair value adjustment, recognition of reduced revenue in connection with a deferred revenue step down fair value adjustment and recognition of increased office rent expense associated with a fair value adjustment to the liabilities associated with deferred rent. |
| (2) | “Transaction costs” (i) of $14.8 million for the fiscal year ended June 30, 2014 includes acquisition-related expenses of $0.8 million related to stay and retention bonuses, $0.3 million related to severance charges, $0.7 million related to transaction-related legal, accounting and tax fees and $13.0 million related to professional fees and expenses associated with debt refinancings; and (ii) of $2.6 million for the Pro Forma fiscal year ended June 30, 2015 includes acquisition-related expenses of $1.8 million related to stay and retention bonuses and $0.8 million related to severance charges. |
| (3) | “Other costs” (i) of $13.0 million for the fiscal year ended June 30, 2014 includes expenses of $3.7 million associated with the integration of previously acquired managed services platforms into one system, certain expenses of $1.1 million related to unusual office start-up development costs, an unusual and non-recurring loss of $1.7 million related to an Atlantix customer receivable, certain unusual legal expenses of $2.2 million, $2.1 million related to payments to our former sponsor for advisory and consulting services and $2.2 million related to certain acquisition-related integration and related costs; and (ii) of $4.9 million for the Pro Forma fiscal year ended June 30, 2015 includes expenses of $3.2 million associated with the integration of previously acquired managed services platforms into one system, $0.7 million related to certain non-recurring costs incurred in the development of our new cloud service offerings, certain expenses of $0.4 million related to unusual office start-up development costs, certain unusual legal expenses of $0.2 million, $0.1 million related to payments to our former sponsor for advisory and consulting services and $0.3 million related to other non-recurring items. |
| (4) | “Earnings from disposed business” represents the removal of the historical earnings contribution of Atlantix prior to the sale of the business. |
| (5) | “Income tax impact of adjustments” includes an estimated tax impact of the adjustments to net income at the Company’s average statutory rate of 39.0%, except for (i) the adjustment of certain transaction costs that are permanently nondeductible for tax purposes and (ii) the impact of tax-deductible |
110
Table of Contents
| goodwill and intangible assets resulting from certain historical acquisitions, and further adjusted for discrete tax items such as the remeasurement of deferred tax liabilities due to state rate changes and write off of deferred tax assets resulting from reorganizations. |
Revenue
| Fiscal year ended June 30, 2014 |
Pro Forma fiscal year ended June 30, 2015 |
Change |
||||||||||||||
| $ | % | |||||||||||||||
| Revenue |
||||||||||||||||
| Product |
$ | 1,945.0 | $ | 2,049.4 | $ | 104.4 | 5.4 | % | ||||||||
| Service |
321.0 | 327.7 | 6.7 | 2.1 | % | |||||||||||
|
|
|
|
|
|
|
|
|
|||||||||
| Total revenue |
$ | 2,266.0 | $ | 2,377.1 | $ | 111.1 | 4.9 | % | ||||||||
Total revenue increased $111.1 million, or 4.9%, to $2,377.1 million in our Pro Forma fiscal year ended June 30, 2015, compared to total revenue of $2,266.0 million in our fiscal year ended June 30, 2014. The increase in total revenue was the result of our ability to deliver innovative solutions to our customers and the breadth of our product and service offerings.
Revenue from sales of product increased $104.4 million, or 5.4%, to $2,049.4 million in our Pro Forma 2015 fiscal year, compared to $1,945.0 million in our 2014 fiscal year. The increase in product revenue was the result of higher customer demand for the technologies that are most important to our clients’ business, including unified communications and network solutions, data center including hybrid cloud and security technologies. Third-party support services contract revenue also increased in our Pro Forma 2015 fiscal year compared to the prior year, driven by higher volume of contracts sold which resulted from higher third-party support services attach rates on new hardware sales and from increased renewals on expiring third-party support services contracts.
Revenue from sales of services increased $6.7 million, or 2.1%, to $327.7 million in our Pro Forma 2015 fiscal year, as compared to $321.0 million in our 2014 fiscal year. The increase in service revenue was the result of growth of our professional services business due to the increased complexity of solutions sold to our customers, slightly offset by suppressed growth in our managed services business as we completed the integration of multiple service platforms, which resulted in a decline of $0.2 million. The shift to more complex solution sales resulted in a $6.9 million increase in service revenue attributable to a 5.1% increase in utilized hours of our engineers in our professional services business.
| Fiscal year ended June 30, 2014 |
Pro Forma fiscal year ended June 30, 2015 |
Change |
||||||||||||||
| $ | % | |||||||||||||||
| Revenue by solution area |
||||||||||||||||
| Cloud |
$ | 220.2 | $ | 293.0 | $ | 72.8 | 33.1 | % | ||||||||
| Security |
142.0 | 156.3 | 14.3 | 10.1 | % | |||||||||||
| Digital Infrastructure |
1,903.8 | 1,927.8 | 24.0 | 1.3 | % | |||||||||||
|
|
|
|
|
|
|
|
|
|||||||||
| Total revenue |
$ | 2,266.0 | $ | 2,377.1 | $ | 111.1 | 4.9 | % | ||||||||
Cloud revenue increased $72.8 million, or 33.1%, to $293.0 million in our Pro Forma 2015 fiscal year, compared to $220.2 million in our 2014 fiscal year. The increase in Cloud revenue was the result of growth in all market sectors, primarily driven by the government and middle-market sectors. We benefitted from the ongoing evolution of cloud computing, as our clients relied on us and our cloud management solutions to help them develop and implement a cloud strategy. The growth in the government market was driven by the U.S. federal government. In the middle-market, growth was driven by financial services and professional service customers.
111
Table of Contents
Security revenue increased $14.3 million, or 10.1%, to $156.3 million in our Pro Forma 2015 fiscal year, compared to $142.0 million in our 2014 fiscal year. The increase in Security revenue was driven by continued investment from middle-market clients and large clients. In the middle market, retail and professional service clients drove the growth in our Pro Forma 2015 fiscal year. In the large client market, manufacturing and transportation as well as energy clients and utilities clients comprised a majority of the growth during our Pro Forma 2015 fiscal year.
Digital Infrastructure revenue increased $24.0 million, or 1.3%, $1,927.8 million in our Pro Forma 2015 fiscal year compared to $1,903.8 million in our 2014 fiscal year. The increase in Digital Infrastructure revenue was driven by growth in large sector clients including financial services, healthcare, and manufacturing and transportation.
| Fiscal year ended June 30, 2014 |
Pro Forma fiscal year ended June 30, 2015 |
Change |
||||||||||||||
| $ | % | |||||||||||||||
| Gross margin |
||||||||||||||||
| Product |
$ | 383.9 | $ | 419.7 | $ | 35.8 | 9.3 | % | ||||||||
| Service |
70.1 | 68.5 | (1.6 | ) | (2.3 | %) | ||||||||||
|
|
|
|
|
|
|
|
|
|||||||||
| Gross margin |
$ | 454.0 | $ | 488.2 | $ | 34.2 | 7.5 | % | ||||||||
| Product gross margin % |
19.7 | % | 20.5 | % | 0.8 | % | ||||||||||
| Service gross margin % |
21.8 | % | 20.9 | % | (0.9 | %) | ||||||||||
| Total gross margin % |
20.0 | % | 20.5 | % | 0.5 | % | ||||||||||
Gross Margin
Total gross margin increased $34.2 million, or 7.5%, to $488.2 million in our Pro Forma 2015 fiscal year, as compared to $454.0 million in our 2014 fiscal year. The increase in gross margin was primarily due to the increase in total revenue between periods, in addition to a favorable mix of products and services sold with a higher proportion of our revenue being from higher margin products and services. As a percentage of revenue, total gross margin increased 50 basis points to 20.5% in our Pro Forma 2015 fiscal year, from 20.0% of total revenue in our 2014 fiscal year. The increase in our gross margin percentage was caused by improved product margins based on the sale of more complex technologies and from enhanced revenue mix driven by a shift in sales to higher margin product offerings as compared to the prior year.
Product gross margin as a percentage of revenue was 20.5% in our Pro Forma 2015 fiscal year, an increase of 80 basis points from 19.7% in our 2014 fiscal year. This increase was due to the sale of more complex technology and therefore more profitable projects, which featured collaboration and security solutions.
Service gross margin as a percentage of revenue decreased by 90 basis points from 21.8% in our 2014 fiscal year to 20.9% in our Pro Forma 2015 fiscal year as a result of a decline in managed services gross margins as we completed the migration of clients to a unified platform, partially offset by improved utilization (i.e., an increase in the number of chargeable hours) of our engineers in our Pro Forma 2015 fiscal year compared to our 2014 fiscal year.
112
Table of Contents
Operating Expenses
| Fiscal year ended June 30, 2014 |
Pro Forma fiscal year ended June 30, 2015 |
Change |
||||||||||||||
| $ | % | |||||||||||||||
| Operating expenses |
||||||||||||||||
| Selling expenses |
$ | 211.1 | $ | 224.2 | $ | 13.1 | 6.2 | % | ||||||||
| General and administrative |
90.7 | 88.2 | (2.5 | ) | (2.8 | %) | ||||||||||
|
|
|
|
|
|
|
|
|
|||||||||
| Selling, general and administrative costs |
301.8 | 312.4 | 10.6 | 3.5 | % | |||||||||||
| Transaction costs |
14.8 | 2.6 | (12.2 | ) | (82.4 | %) | ||||||||||
| Depreciation and amortization |
45.9 | 71.4 | 25.5 | 55.6 | % | |||||||||||
|
|
|
|
|
|
|
|
|
|||||||||
| Total operating expenses |
$ | 362.5 | $ | 386.4 | $ | 23.9 | 6.6 | % | ||||||||
| Selling, general and administrative expenses |
13.3 | % | 13.1 | % | (0.2 | %) | ||||||||||
SG&A increased $10.6 million, or 3.5%, to $312.4 million in our Pro Forma 2015 fiscal year, from $301.8 million in our 2014 fiscal year. The increase in SG&A is primarily due to the hiring of additional sales personnel to support future growth in our business along with an increase in variable incentive pay to our sales force due to the increase in gross margin.
This increase included $14.5 million of costs associated with the hiring of additional sales personnel during our Pro Forma 2015 fiscal year to support future growth in our business, along with an increase in variable incentive pay to our sales force due to the increase in gross margin. SG&A as a percent of revenue improved from 13.3% in our 2014 fiscal year to 13.1% in our Pro Forma 2015 fiscal year.
Transaction costs includes the recognition of transaction expenses primarily associated with the Presidio Acquisition, along with expenses associated with historical acquisitions. We recognized $2.6 million of transaction expenses in our Pro Forma 2015 fiscal year associated with acquisition-related stay and retention bonus expense and severance charges, compared to transaction costs of $14.8 million in our 2014 fiscal year which included $1.8 million of expenses associated with the historical acquisitions of BlueWater and INX and $13.0 million of expenses that we incurred related to our debt refinancing in our 2014 fiscal year. In March 2014, in connection with the payment of an extraordinary dividend to our former sponsor and shareholders, we replaced our then-existing $385.0 million term loan with a new $650.0 million term loan, decreased the available size of the Receivables Securitization Facility and extended the maturities of our revolving credit and securitization arrangements.
Depreciation and amortization expense included in operating expenses increased $25.5 million, or 55.6%, to $71.4 million in our Pro Forma 2015 fiscal year, from $45.9 million in our 2014 fiscal year, as a result of the identification and valuation of finite-lived intangible assets, and resulting amortization expenses associated with the Presidio Acquisition.
113
Table of Contents
Interest and Other (Income) Expense
| Fiscal year ended June 30, 2014 |
Pro Forma fiscal year ended June 30, 2015 |
Change |
||||||||||||||
| $ | % | |||||||||||||||
| Interest and other (income) expense |
||||||||||||||||
| Interest expense |
$ | 34.3 | $ | 81.2 | $ | 46.9 | 136.7 | % | ||||||||
| Gain on interest rate swap agreements |
(2.2 | ) | — | 2.2 | (100.0 | %) | ||||||||||
| Loss on extinguishment of debt |
2.7 | — | (2.7 | ) | (100.0 | %) | ||||||||||
| Other (income) expense, net |
(0.2 | ) | (0.1 | ) | 0.1 | (50.0 | %) | |||||||||
|
|
|
|
|
|
|
|
|
|||||||||
| Total interest and other (income) expense |
$ | 34.6 | $ | 81.1 | $ | 46.5 | 134.4 | % | ||||||||
Interest and other (income) expense increased $46.5 million, or 134.4%, to $81.1 million in our Pro Forma 2015 fiscal year from $34.6 million in our 2014 fiscal year. The net increase was primarily the result of an additional $46.9 million of interest expense recognized in our Pro Forma 2015 fiscal year. The increase in interest expense primarily relates to interest on the Senior Notes and the Subordinated Notes issued in connection with the Presidio Acquisition in our Pro Forma 2015 fiscal year, along with additional interest expense on the term loan facility issued in connection with the Presidio Acquisition.
Income Tax Expense (Benefit)
| Fiscal year ended June 30, 2014 |
Pro Forma fiscal year ended June 30, 2015 |
Change |
||||||||||||||
| $ | % | |||||||||||||||
| Income before income taxes |
$ | 56.9 | $ | 20.7 | $ | (36.2 | ) | (63.6 | %) | |||||||
| Income tax expense |
24.4 | 10.2 | (14.2 | ) | (58.2 | %) | ||||||||||
|
|
|
|
|
|
|
|
|
|||||||||
| Net income |
$ | 32.5 | $ | 10.5 | $ | (22.0 | ) | (67.7 | %) | |||||||
Income tax expense decreased $14.2 million, or 58.2%, to $10.2 million in our Pro Forma 2015 fiscal year from $24.4 million in our 2014 fiscal year. The change primarily relates to a $36.2 million decrease in pre-tax income in our Pro Forma 2015 fiscal year compared to our 2014 fiscal year, resulting in a 6.4% increase in our effective tax rate from 42.9% in our 2014 fiscal year to 49.3% in our Pro Forma 2015 fiscal year. The primary driver of the increase in the effective tax rate is the non-deductibility of certain expenses in relation to lower nominal pre-tax income in our Pro Forma 2015 fiscal year.
Adjusted EBITDA
Adjusted EBITDA increased $17.8 million, or 10.7%, to $184.8 million in our Pro Forma 2015 fiscal year, from $167.0 million in our 2014 fiscal year. The increase was a result of top-line revenue growth, enhanced revenue mix of higher margin product offerings, the sale of more complex technology solutions and improved gross margin and controlled SG&A in our Pro Forma 2015 fiscal year as compared with our 2014 fiscal year.
Adjusted Net Income
Adjusted Net Income decreased $17.9 million, or 21.9%, to $63.8 million in the Pro Forma year ended June 30, 2015, from $81.7 million in the year ended June 30, 2014 as a result of the increase in revenue and gross margin being more than offset by higher interest expense incurred as a result of the Presidio Acquisition.
114
Table of Contents
Liquidity and Capital Resources
Following this Offering, we may opportunistically raise debt capital, subject to market and other conditions, to refinance our existing capital structure at a lower all in cost of capital. Additionally, as part of our growth strategies, we may also raise debt capital for strategic alternatives and general corporate purposes.
Overview
We finance our operations and capital expenditures through a combination of internally generated cash from operations and from borrowings under our various debt facilities. We believe that our current sources of funds will be sufficient to fund our cash operating requirements for at least the next year. In addition, we believe that, despite the uncertainty of future macroeconomic conditions, we have adequate sources of liquidity and funding available to meet our long-term needs. These long-term needs primarily include meeting debt service requirements, working capital requirements and capital expenditures. We may also pursue strategic acquisition opportunities that may impact our future cash requirements.
There are a number of factors that may negatively impact our available sources of funds in the future including the ability to generate cash from operations and borrow on debt facilities. The amount of cash generated from operations is dependent upon factors such as the successful execution of our business strategies and general economic conditions. The amount of cash available for borrowings under our various debt facilities is dependent on our ability to maintain sufficient collateral and general financial conditions in the marketplace.
Historical Sources and Uses of Cash
The following table summarizes our sources and uses of cash over the periods indicated:
| Predecessor | Successor | |||||||||||||||||||||||
| (in millions) | Fiscal year ended June 30, 2014 |
July 1, 2014 to February 1, 2015 |
November 20, 2014 to June 30, 2015 |
Fiscal year ended June 30, 2016 |
Six months ended December 31, 2015 |
Six months ended December 31, 2016 |
||||||||||||||||||
| Net cash provided by (used in) |
||||||||||||||||||||||||
| Operating activities |
$ | 53.3 | $ | 74.5 | $ | (1.8 | ) | $ | 85.6 | $ | 7.2 | $ | 83.3 | |||||||||||
|
|
|
|
|
|
|
|
|
|
|
|
|
|||||||||||||
| Investing activities |
(74.4 | ) | (71.3 | ) | (678.9 | ) | (322.0 | ) | (16.6 | ) | (62.6 | ) | ||||||||||||
|
|
|
|
|
|
|
|
|
|
|
|
|
|||||||||||||
| Net borrowings (repayments) on floor plan facility |
20.5 | (29.0 | ) | 50.8 | 20.9 | 24.9 |
|
(36.4 |
) | |||||||||||||||
| Other financing activities |
0.5 | 24.3 | 718.2 | 160.2 | (4.6 | ) |
|
28.2 |
| |||||||||||||||
|
|
|
|
|
|
|
|
|
|
|
|
|
|||||||||||||
| Financing activities |
21.0 | (4.7 | ) | 769.0 | 181.1 | 20.3 |
|
(8.2 |
) | |||||||||||||||
|
|
|
|
|
|
|
|
|
|
|
|
|
|||||||||||||
| Net increase (decrease) in cash and cash equivalents |
$ | (0.1 | ) | $ | (1.5 | ) | $ | 88.3 | $ | (55.3 | ) | $ | 10.9 | $ | 12.5 | |||||||||
|
|
|
|
|
|
|
|
|
|
|
|
|
|||||||||||||
Operating Activities
Net cash flows from operating activities consist of net income (loss) adjusted for noncash items, such as: depreciation and amortization of property and equipment and intangible assets, deferred income taxes, share-based compensation, losses on extinguishments of debt or disposals of businesses and for changes in net working capital assets and liabilities. The cash impact of changes in deferred income taxes primarily relates to temporary differences between the carrying amounts of assets and liabilities for financial reporting purposes and the
115
Table of Contents
amounts used for income tax purposes. Generally, the most significant factor relates to nondeductible book amortization expense associated with intangible assets. The timing between the conversion of our billed and unbilled receivables into cash from our customers and disbursements to our vendors is the primarily driver of changes in our working capital.
Our net cash provided by (used in) operating activities for our historical periods includes the impact of tax-deductible goodwill and intangible assets resulting from certain historical acquisitions. The reductions in current tax expense associated with the tax-deductible goodwill and intangible assets were:
| Predecessor | Successor | |||||||||||||||||||||||
| (in millions) | Fiscal year ended June 30, 2014 |
July 1, 2014 to February 1, 2015 |
November 20, 2014 to June 30, 2015 |
Fiscal year ended June 30, 2016 |
Six months ended December 31, 2015 |
Six months ended December 31, 2016 |
||||||||||||||||||
| Impact of tax deductible goodwill and intangible assets |
$ | 6.1 | $ | 3.5 | $ | 2.5 | $ | 8.6 | $ | 3.2 | $ | 6.0 | ||||||||||||
Six months ended December 31, 2016: Net cash provided by operating activities for the six months ended December 31, 2016 was $83.3 million. This was primarily attributed to net income of $9.0 million adjusted for: $36.8 million of intangible amortization expense, $6.8 million of total property and equipment depreciation expense, a $9.3 million deferred income tax benefit and a $34.9 million decrease in our working capital components. The net decrease in our working capital components was primarily driven by lower disbursements for accounts payable – trade and accrued expenses in the period associated with our purchases from vendors, partially offset by an increase in unbilled and accounts receivable.
Six months ended December 31, 2015: Net cash provided by operating activities for the six months ended December 31, 2015 was $7.2 million. This was primarily attributed to net income of $10.5 million adjusted for: $31.4 million of intangible amortization expense, $6.6 million for total property and equipment depreciation expense, a $11.4 million deferred income tax benefit and a $6.8 million loss on disposal of business unit offset by a net $40.3 million increase in working capital. The net increase in our working capital components was primarily driven by the net impact of higher unbilled and accounts receivable compared to lower disbursements for accounts payable – trade and accrued expenses in the period.
Fiscal year ended June 30, 2016: Net cash provided by operating activities for the fiscal year ended June 30, 2016 was $85.6 million. This was attributed to a net loss of $3.4 million adjusted for: $67.2 million of intangible amortization expense, $14.5 million of total property and equipment depreciation expense, $9.2 million noncash loss on extinguishment of debt, $6.8 million noncash loss on disposition of the Atlantix business, $7.6 million of amortization of deferred issuance costs, offset by a $19.6 million deferred income tax benefit. In addition, operating cash flows were favorably impacted by a net $4.6 million decrease in our working capital components. The net decrease in our working capital components was primarily driven by the increase in accounts payable and accrued expenses associated with our purchases from vendors exceeding the increase in outstanding customer receivables associated with revenue growth.
November 20, 2014 – June 30, 2015: Net cash used by operating activities for the period from November 20, 2014 to June 30, 2015 was $1.8 million. This was attributed to a net loss of $24.3 million adjusted for: $26.4 million of intangible amortization expense, $5.7 million of total property and equipment depreciation expense and $2.7 million of amortization of deferred issuance costs, offset by a $13.0 million deferred income tax benefit. In addition, operating cash flows were favorably impacted by a net $0.6 million decrease in our working capital components. The net decrease in our working capital components was primarily driven by a decrease in prepaid income taxes and an increase in accrued interest associated with debt from the Presidio Acquisition, offset by a net increase in cash collections of receivables and payments of accrued expenses and trade payables.
116
Table of Contents
July 1, 2014 – February 1, 2015: Net cash provided by operating activities during the period from July 1, 2014 to February 1, 2015 was $74.5 million. This was primarily attributed to a net loss of $5.1 million adjusted for: $18.3 million of intangible amortization expense, $6.6 million of total property and equipment depreciation expense, $20.1 million of share-based compensation expense and $3.5 million of deferred income tax expenses. In addition, operating cash flows were favorably impacted by a net $33.2 million decrease in our working capital components. The net decrease in our working capital components was primarily driven by the net impact of higher cash collections of receivables compared to the disbursements for accounts payable and accrued expenses in the period.
Fiscal year ended June 30, 2014: Net cash provided by operating activities for the fiscal year ended June 30, 2014 was $53.3 million. This was primarily attributed to net income of $32.5 million adjusted for $38.3 million of intangible amortization expense, $12.3 million of total property and equipment depreciation expense, partially offset by a net $26.9 million increase in our primary working capital components to support our continued growth. The net increase in our working capital components was primarily driven by the net impact of lower cash collections of receivables compared to higher disbursements for accounts payable and accrued expenses in the period.
Investing Activities
Net cash flows from investing activities consist of the cash flows associated with acquisitions and/or dispositions, leasing activities and capital expenditures. During the periods presented all purchases of property and equipment were of a normal recurring nature. With respect to our leasing activities, we reduce our financial exposure and increase liquidity by partnering with various third-party lenders and discounting the customer lease financing receivables. This results in us carrying both a lease asset and an offsetting financial liability to the lenders on our balance sheet. Accordingly, the investment in leased assets appears in our investing activities and the funding we receive from third-party lenders is recognized in our financing activities, discussed below.
Six months ended December 31, 2016: Net cash used in investing activities for the six months ended December 31, 2016 was $62.6 million. Cash was primarily used for additional investments in discounted client equipment leases of $63.9 million in support of our business and the purchase of property and equipment of $6.7 million, partially offset by proceeds received from our leasing assets of $7.7 million.
Six months ended December 31, 2015: Net cash used in investing activities for the six months ended December 31, 2015 was $16.6 million. Cash was primarily used for additional investments in discounted client equipment leases of $39.7 million in support of our business and the purchase of property and equipment of $5.5 million. Cash was also used in the acquisition of businesses of $11.2 million for the acquisition of Sequoia, offset by cash provided by the disposition of businesses of $37.6 million for the Atlantix business unit disposal.
Fiscal year ended June 30, 2016: Net cash used in investing activities for the fiscal year ended June 30, 2016 was $322.0 million. This use of cash was primarily the result of $251.3 million used to acquire the Sequoia and Netech businesses, offset by $36.3 million of cash proceeds received from the disposition of Atlantix. Cash was also used for additional investments in sales-type and direct financing leases in support of our business of $95.4 million and the purchases of property and equipment of $16.4 million.
November 20, 2014 – June 30, 2015: Net cash used in investing activities for the period from November 20, 2014 to June 30, 2015 was $678.9 million. This use of cash was primarily the result of the Presidio Acquisition. Other factors impacting net cash uses of investment activities included investments in discounted client equipment leases of $33.6 million in support of our business and the purchase of property and equipment of $5.4 million for use in our operations, partially offset by proceeds received from our leasing assets of $5.8 million.
July 1, 2014 – February 1, 2015: Net cash used in investing activities for the period from July 1, 2014 to February 1, 2015 was $71.3 million. Cash was primarily used for additional investments in discounted client
117
Table of Contents
equipment leases of $76.0 million in support of our business and the purchase of property and equipment of $8.6 million, partially offset by proceeds received from our leasing assets of $14.0 million.
Fiscal year ended June 30, 2014: Net cash used in investing activities for the fiscal year ended June 30, 2014 was $74.4 million. Cash was primarily used for additional investments in discounted client equipment leases of $70.8 million in support of our business and the purchase of property and equipment of $9.3 million, partially offset by proceeds received from our leasing assets of $6.9 million.
Financing Activities
Net cash flows from financing activities is primarily associated with cash activity associated with our capitalization, including debt and equity activity, cash flow associated with discounting client leases and activity on our accounts payable floor plan facility.
Six months ended December 31, 2016: Net cash used in financing activities for the six months ended December 31, 2016 was $8.2 million, comprised of $36.4 million of net borrowings on the accounts payable floor plan facility and $28.2 million of other financing activities. The $28.2 million of other financing activities was primarily the result of $66.1 million in proceeds from discounting financing receivables, partly offset by repayments of $5.0 million on the Receivables Securitization Facility, $28.7 million on the term loans, which included a $25.0 million voluntary prepayment, and $4.3 million of retirements of discounted financing receivables.
Six months ended December 31, 2015: Net cash provided by financing activities for the six months ended December 31, 2015 was $20.3 million, comprised of $24.9 million of net borrowings on the accounts payable floor plan facility that was offset by $4.6 million of other financing activities. The $4.6 million of other financing activities was primarily the result of $36.7 million in proceeds from discounting financing receivables, offset by $37.4 million used to repurchase Subordinated Notes held by an unaffiliated third party.
Fiscal year ended June 30, 2016: Net cash provided by financing activities for the fiscal year ended June 30, 2016 was $181.1 million consisted of $20.9 million of net borrowings on the accounts payable floor plan facility and $160.2 million of other financing activities. The other financing activities was primarily the result of net borrowings on term loans of $150.4 million to fund the Sequoia and Netech acquisitions, offset by $65.8 million of cash outflows associate with repayments of the Senior Notes and the Subordinated Notes. Additional cash provided by financing activities includes $86.4 million in proceeds from discounting financing receivables, offset by $10.3 million of payments for future consideration associated with prior acquisitions.
November 20, 2014 – June 30, 2015: Net cash provided by financing activities for the period from November 20, 2014 to June 30, 2015 was $769.0 million, comprised of $50.8 million of net borrowings on the accounts payable floor plan facility and $718.2 million, of other financing activities. The other financing activities was primarily the result of borrowings on a new term loan of $582.0 million, Senior Notes of $250.0 million and Subordinated Notes of $150.0 million and proceeds of contributed capital of $337.8 million all of which were associated with the Presidio Acquisition. These proceeds were partially offset by $574.8 million in repayments on an old term loan, net repayments on the Receivables Securitization Facility of $40.0 million and the payment of deferred financing costs of $27.1 million; all of which were associated with the Presidio Acquisition. Additional financing was received from advances secured by discounted leases of $44.6 million.
July 1, 2014 – February 1, 2015: Net cash used by financing activities for the period from July 1, 2014 to February 1, 2015 was $4.7 million consisted of $29.0 million in net repayments on the accounts payable floor plan facility, mostly offset by $24.3 million provided by other financing activities. The other financing activities were primarily the result of proceeds from advances secured by discounted leases of $65.6 million and net borrowings on the Receivables Securitization Facility of $40.0 million, partially offset by repayments of term loans of $80.0 million.
118
Table of Contents
Fiscal year ended June 30, 2014: Net cash provided by financing activities for fiscal year June 30, 2014 was $21.0 million consisted of $20.5 million of net borrowings on the accounts payable floor plan facility and $0.5 million of other financing activities. The other financing activities was primarily the result of net proceeds on borrowings on term loans of $243.2 million and proceeds from advances secured by discounted leases of $74.5 million, mostly offset by the payment of dividends of $258.7 million and net repayments on the Receivables Securitization Facility of $44.2 million.
Liquidity
We generally fund our short- and long-term liquidity needs through the use of cash flows from operations, utilization of the extended payment terms on our accounts payable-floor plan facility and the available credit on our revolving credit facility, accounts receivable securitization facility and long-term debt.
Our management regularly monitors certain liquidity measures to monitor performance. We believe that the most important of those measures include net debt, net working capital ratio and available liquidity.
| (in millions) | June 30, 2015 | June 30, 2016 | December 31, 2016 | |||||||||
| Net debt |
$ | 885.3 | $ | 1,038.6 | $ | 992.4 | ||||||
| Net working capital ratio |
0.99 | x | 0.99 | x | 0.99 | x | ||||||
| Available liquidity |
$ | 318.4 | $ | 277.5 | $ | 284.5 | ||||||
Net debt – We have a substantial amount of indebtedness, largely related to the capitalization of the Company in connection with the Presidio Acquisition. We believe net debt provides information about the utilization of our cash flows to de-lever our company. We define net debt as the total principal of debt outstanding, excluding discounts and issuance costs less cash and cash equivalents. The following table presents our calculation of net debt as of December 31, 2016 and June 30, 2016 and 2015:
| (in millions) | June 30, 2015 | June 30, 2016 | December 31, 2016 | |||||||||
| Total long-term debt, net of debt issuance costs |
$ | 933.7 | $ | 1,038.0 | $ | 1,008.1 | ||||||
| Unamortized debt issuance costs |
39.9 | 33.6 | 29.8 | |||||||||
| Cash and cash equivalents |
(88.3 | ) | (33.0 | ) | (45.5 | ) | ||||||
|
|
|
|
|
|
|
|||||||
| Net debt |
$ | 885.3 | $ | 1,038.6 | $ | 992.4 | ||||||
|
|
|
|
|
|
|
|||||||
Net working capital ratio – We experience periodic changes in our net working capital, defined as current assets from our consolidated balance sheet minus current liabilities from our consolidated balance sheet excluding cash and cash equivalents and current maturities of long-term debt. We define net working capital ratio as our current assets excluding cash and cash equivalents divided by current liabilities excluding current maturities of long-term debt.
Available liquidity – As previously discussed, we fund our short-term cash flow requirements through a combination of cash on hand, cash flows generated from operations and revolving credit facilities. We calculate our available liquidity as a sum of cash and cash equivalents from our consolidated balance sheet plus the amount available and unutilized on our revolving and accounts receivable securitization facilities.
119
Table of Contents
The following table presents amounts outstanding under our primary sources of liquidity as of December 31, 2016 and June 30, 2016 and 2015:
| (in millions) | June 30, 2015 | June 30, 2016 | December 31, 2016 | |||||||||
| Cash and cash equivalents |
$ | 88.3 | $ | 33.0 | $ | 45.5 | ||||||
| Accounts payable—floor plan facility |
$ | 161.9 | $ | 223.3 | $ | 186.9 | ||||||
| Revolving credit facility |
$ | — | $ | — | $ | — | ||||||
| Receivables Securitization Facility |
— | 5.0 | — | |||||||||
| Term loan facility, due February 2022 |
573.6 | 732.3 | 703.6 | |||||||||
| Senior Notes, 10.25% due February 2023 |
250.0 | 222.5 | 222.5 | |||||||||
| Subordinated Notes, 10.25% due February 2023 |
150.0 | 111.8 | 111.8 | |||||||||
|
|
|
|
|
|
|
|||||||
| Total long-term debt |
$ | 973.6 | $ | 1,071.6 | $ | 1,037.9 | ||||||
|
|
|
|
|
|
|
|||||||
Cash Flow From Operations: We have historically generated positive cash flows from operations. This source of cash has historically provided sufficient funding for operations, managing working capital needs and servicing of long-term debt. We believe that, despite the uncertainty of future macroeconomic conditions, cash flow from operations will continue to provide us with an adequate source of funding for use in meeting our short-term liquidity needs.
Accounts Payable – Floor Plan Facility: We have an agreement with a financial institution that provides our indirect wholly owned subsidiary with funding for discretionary inventory purchases from approved vendors. Payables are due within 90 days and are non-interest bearing provided they are paid when due. We use the extended payment terms of this facility to reduce the working capital needs associated with the timing of vendor payments and the collection of customer receivables. In accordance with the agreement, the financial institution has been granted a senior security interest in the indirect wholly owned subsidiary’s inventory purchased under the agreement and accounts receivable arising from the sale thereof. Payments on the facility are also guaranteed by Presidio LLC and subsidiaries. As of December 31 and June 30, 2016, the aggregate availability for purchases under the floor plan facility is the lesser of $325.0 million or the liquidation value of the pledged assets. The balances outstanding under the accounts payable – floor plan facility were $186.9 million and $223.3 million as of December 31 and June 30, 2016, respectively.
Receivables Securitization Facility: We maintain an accounts receivables securitization facility which provides us with short-term liquidity needs (“Receivables Securitization Facility”). The Receivables Securitization Facility agreement is with our wholly owned non-operating subsidiary, Presidio Capital Funding, LLC (“PCF”). To obtain accounts receivable for use in the Receivables Securitization Facility, PCF purchases the receivables of PNS and Atlantix on a continuous basis and then grants, without recourse, a senior undivided interest in the pooled receivables to the administrative agent of the facility, PNC Bank, while maintaining a subordinated undivided interest in any over-collateralization of the pooled receivables. Presidio LLC services the receivables for PCF at market rates and accordingly, no servicing asset or liability has been recorded. Upon and after the sale or contribution of the accounts receivables to PCF, such accounts receivables are legally assets of PCF and, as such, are not available to our creditors or its other subsidiaries. As a result of its disposition in October 2015, Atlantix ceased to be an originator under the Receivables Securitization Facility.
The committed amount of the Receivables Securitization Facility is $250.0 million and the maturity date is February 2, 2018. The borrowing capacity on the facility is subject to a borrowing limit that is based on eligible receivables, as defined in the securitization agreements. Interest is calculated daily but payable monthly based on a Eurodollar borrowing rate plus a utilized program fee of 1.40%. We also incur a commitment fee of 0.50% or 0.40%, depending on utilization. At December 31 and June 30, 2016, the interest rates were 2.17% and 1.87%, respectively, and the commitment fee was 0.50%, as of December 31 and June 30, 2016.
Accounts receivables purchased by PCF are subject to the satisfaction of customary conditions, including the absence of a termination event and the accuracy of representations and warranties. The obligations
120
Table of Contents
under the facility are secured by PCF’s right, title and interest in the pool of receivables and certain related assets. The facility requires that Presidio LLC comply with a minimum fixed charge coverage ratio of 1.0 to 1.0 if its excess liquidity, as defined in the facility, falls below $35.0 million for at least five consecutive days. We were in compliance with this covenant as of both December 31 and June 30, 2016.
There were no borrowings outstanding under the facility as of December 31, 2016 and $5.0 million outstanding under the facility as of June 30, 2016. We had $190.5 million and $196.0 million available under the facility based on the collateral available as of December 31 and June 30, 2016, respectively.
February 2015 Credit Facility: On February 2, 2015, Presidio LLC and PNS as borrowers (the “Borrowers”), entered into a senior secured financing facility (the “February 2015 Credit Agreement”), which provided a term loan (“February 2015 Term Loan”) and a revolving credit facility (“February 2015 Revolver”) (collectively referred to as the “February 2015 Credit Facilities”).
The terms of the February 2015 Credit Agreement were amended on May 19, 2015 pursuant to Incremental Assumption Agreement and Amendment No. 1 to, among other things, lower the applicable margin on term loan borrowings. On February 1, 2016, pursuant to Incremental Assumption Agreement and Amendment No. 2, the Borrowers entered into an incremental $25.0 million term loan borrowing. On May 27, 2016, the Borrowers entered into the Incremental Assumption Agreement and Amendment No. 3 (the “May 2016 Amendment”) for an incremental $140.0 million term loan borrowing. On December 30, 2016, the Borrowers made a $25.0 million voluntary prepayment of outstanding term loans under the February 2015 Credit Agreement; after giving effect to the prepayment, $703.6 million in aggregate principal amount of term loans remained outstanding under the February 2015 Credit Agreement. The terms of the February 2015 Credit Agreement were further amended on January 19, 2017 pursuant to the Incremental Assumption Agreement and Amendment No. 4 (the “January 2017 Amendment”) to, among other things, lower the applicable margin on term loan borrowings.
In accordance with the terms of the February 2015 Credit Agreement, the Borrowers may request one or more incremental term loan facilities and/or increase commitments under the February 2015 Revolver in an aggregate amount of up to the sum of $125.0 million plus additional amounts so long as, (i) in the case of loans under additional credit facilities secured by liens (other than to the extent such liens are expressly subordinated in writing to the liens on the collateral securing the February 2015 Credit Agreement), the consolidated net first lien secured leverage ratio would be no greater than 3.25 to 1.00 and (ii) in the case of loans under additional credit facilities that would not be included in the computation of the consolidated net first lien secured leverage ratio, the consolidated net secured leverage ratio would be no greater than 4.25 to 1.00, subject to certain conditions and receipt of commitments by existing or additional lenders.
The Borrowers may voluntarily repay outstanding loans under the February 2015 Credit Agreement at any time, without prepayment premium or penalty except in connection with a repricing event, subject to customary “breakage” costs with respect to LIBOR rate loans.
All obligations under the February 2015 Credit Agreement are unconditionally guaranteed by the Borrowers and each of their existing and future direct and indirect, wholly owned domestic subsidiaries, subject to certain exceptions. The obligations are secured by substantially all assets of the Borrowers and each guarantor, subject to certain exceptions. The February 2015 Credit Agreement is subject to an inter-creditor agreement with the accounts payable—floor plan facility that provides that certain security interests in assets securing the February 2015 Credit Agreement shall be subordinate to the security interests on the collateral securing the obligations under the accounts payable—floor plan facility described above.
The February 2015 Credit Agreement contains certain customary affirmative covenants, negative covenants and events of default. The negative covenants in the February 2015 Credit Agreement include, among
121
Table of Contents
other things, limitations (subject in each case to exceptions) on the ability of the Borrowers, the guarantors and their restricted subsidiaries to:
| • | incur additional debt or issue certain preferred shares; |
| • | create liens on certain assets; |
| • | make certain loans or investments (including acquisitions); |
| • | pay dividends on or make distributions in respect of capital stock or make other restricted payments; |
| • | consolidate, merge, sell or otherwise dispose of all or substantially all of our assets; |
| • | sell assets; |
| • | enter into certain transactions with affiliates; |
| • | enter into sale-leaseback transactions; |
| • | change lines of business; |
| • | restrict dividends from our subsidiaries or restrict liens; |
| • | change our fiscal year; and |
| • | modify the terms of certain debt or organizational agreements. |
February 2015 Term Loan: Borrowings under the February 2015 Term Loan bear interest at a rate equal to, at the Borrowers’ option, either:
| (a) | the LIBOR rate determined by reference to the costs of funds for Eurodollar deposits for the interest period relevant to such borrowing, adjusted for certain additional costs, subject to a 1.00% floor in the case of term loans; or |
| (b) | the base rate determined by reference to the highest of: |
| (i) | the federal funds rate plus 0.50%, |
| (ii) | the prime rate, or |
| (iii) | the one-month adjusted LIBOR plus 1.00%, |
in each case, plus an applicable margin. The applicable margin for term loans was originally 5.25% in the case of LIBOR rate borrowings and 4.25% in the case of base rate borrowings prior to the May 19, 2015 amendment which lowered the rates to 4.25% and 3.25%, respectively. After giving effect to the January 2017 Amendment, the applicable margin for term loans is 3.50% in the case of LIBOR rate borrowings and 2.50% in the case of base rate borrowings. From and after the date that Presidio Holdings Inc. delivers a certificate to the administrative agent certifying that a qualified initial public offering (defined as an underwritten public offering of the equity interests of Presidio LLC or a parent entity (including Presidio, Inc.) which generates gross cash proceeds of at least $50 million) has occurred and that the Net Total Leverage Ratio (as defined in the February 2015 Credit Agreement) calculated on a pro forma basis is less than 4.00 to 1.00, the applicable margin for term loans under the February 2015 Credit Agreement will be reduced by an additional 0.25%.
122
Table of Contents
The February 2015 Term Loan amortizes 1.00% per annum, payable quarterly on the principal balance outstanding after the effectiveness of the January 2017 Amendment, with the balance paid at maturity.
In addition to the required scheduled quarterly payments on the February 2015 Term Loan, the February 2015 Credit Agreement requires the Borrowers to prepay outstanding term loan borrowings, subject to certain exceptions, with:
| • | 75% (which percentage will be reduced to 50% if the consolidated net first lien secured leverage ratio is less than or equal to 3.00 to 1.00, reduced to 25% if the consolidated net first lien secured leverage ratio is less than or equal to 2.50 to 1.00 and reduced to 0% if the consolidated net first lien secured leverage ratio is less than or equal to 2.00 to 1.00) of the Borrowers’ annual excess cash flow, as defined under the February 2015 Credit Agreement, beginning in our fiscal year ended June 30, 2016; |
| • | 100% of the net cash proceeds of all non-ordinary course asset sales, other dispositions of property or certain casualty events, in each case subject to certain exceptions and provided that we may (a) reinvest within twelve months or (b) commit to reinvest those proceeds within 12 months and so reinvest such proceeds within 18 months in assets to be used in the business, or certain other permitted investments; and |
| • | 100% of the net cash proceeds of any issuance or incurrence of debt, other than proceeds from debt permitted under the February 2015 Credit Agreement. |
For the year ended June 30, 2016, there were no prepayments required based on the Borrower’s calculation of annual excess cash flow. On December 30, 2016, the Borrowers made a $25.0 million voluntary prepayment of outstanding term loans under the February 2015 Credit Agreement; after giving effect to the prepayment, $703.6 million in aggregate principal amount of term loans remained outstanding under the February 2015 Credit Agreement.
February 2015 Revolver: The February 2015 Revolver provides a $50.0 million borrowing capacity with a $25.0 million sublimit available for letters of credit and a swingline loan sub-facility, maturing February 2, 2020. Borrowings under the February 2015 Revolver bear interest at a rate equal to, at the Borrower’s option, either:
| (a) | the LIBOR rate determined by reference to the costs of funds for Eurodollar deposits for the interest period relevant to such borrowing, adjusted for certain additional costs, subject to a 1.00% floor in the case of term loans; or |
| (b) | the base rate determined by reference to the highest of: |
| (i) | the federal funds rate plus 0.50%, |
| (ii) | the prime rate, or |
| (iii) | the one-month adjusted LIBOR plus 1.00%, |
in each case, plus an applicable margin. The applicable margin for revolving loans is 4.25% in the case of LIBOR rate borrowings and 3.25% in the case of base rate borrowings (with margins for revolving loans subject to certain reductions based on a net first lien leverage ratio).
In addition to paying interest on outstanding principal under the February 2015 Revolver, the Borrowers are required to pay a commitment fee equal to 0.50% (subject to a step down to 0.375% based on a net first lien
123
Table of Contents
leverage ratio) in respect of the unutilized commitments under the facility. The Borrowers are also required to pay customary agency fees as well as letter of credit participation fees computed at a rate per annum equal to the applicable margin for LIBOR rate borrowings on the dollar equivalent of the daily stated amount of outstanding letters of credit, plus such letter of credit issuer’s customary documentary and processing fees and charges and customary fronting fees.
All borrowings under the February 2015 Revolver are subject to the satisfaction of customary conditions, including the absence of a default and the accuracy of representations and warranties.
The February 2015 Revolver requires that Presidio Holdings, after an initial grace period and subject to a testing threshold, comply on a quarterly basis with a maximum first lien net senior secured leverage ratio. The testing threshold is met if, at the end of any applicable fiscal quarter, the sum of outstanding exposure under the February 2015 Revolver exceeds 30% of the outstanding commitments under the revolving credit facility at such time.
As of each of December 31, 2016 and June 30, 2016, there were no outstanding borrowings on the February 2015 Revolver and there were $1.5 million in letters of credit outstanding. We are in compliance with the covenants and have $48.5 million available for borrowings under the facility.
Senior Notes and Subordinated Notes: In conjunction with the Presidio Acquisition on February 2, 2015, Presidio Holdings issued the Senior Notes in an aggregate principal amount of $250.0 million and the Subordinated Notes in an aggregate amount of $150.0 million, each of which will mature on February 15, 2023. Interest on the Notes of each series accrues at a rate of 10.25% per annum, which is payable semiannually in cash on February 15 and August 15 of each year, commencing August 15, 2015. The Notes are fully and unconditionally guaranteed, jointly and severally, by Presidio Holdings’ present and future direct or indirect wholly owned material domestic subsidiaries that guarantee or are directly liable in respect of the senior facilities or certain other future credit facilities or future capital markets indebtedness.
On August 28, 2015, Presidio Holdings repurchased from an unaffiliated third party and subsequently retired $38.2 million of the Subordinated Notes and on June 9, 2016 and June 14, 2016, Presidio Holdings repurchased from an unaffiliated third party and subsequently retired $2.0 million of Senior Notes and $25.6 million of Senior Notes, respectively.
As of each of December 31 and June 30, 2016, an alternative investment vehicle formed by the limited partners of the Apollo Funds owned substantially all of the economic interests in the Subordinated Notes pursuant to certain derivative arrangements entered into with Deutsche Bank AG, who is the holder of 100% of the Subordinated Notes.
The Senior Notes and the related guarantees are senior unsecured obligations of Presidio Holdings and the guarantors, respectively. The Subordinated Notes and the related guarantees are senior subordinated obligations of Presidio Holdings and the guarantors, respectively.
Prior to February 15, 2018, Presidio Holdings may redeem some or all of the Notes at a redemption price equal to 100% of the principal amount of the notes plus accrued and unpaid interest, plus an applicable make-whole premium. On or after February 15, 2018, Presidio Holdings may redeem some or all of the Notes at certain specified redemption prices, plus accrued and unpaid interest. Additionally, on or prior to February 15, 2018, Presidio Holdings may redeem up to 40% of the aggregate principal amount of each series of Notes with the net proceeds of specified equity offerings at specified redemption prices, provided that at least 50% of the initial principal amount of the applicable series of Notes remains outstanding.
The indentures governing the Notes limit, among other things, Presidio Holdings and the guarantor subsidiaries’ ability to:
| • | incur or guarantee additional indebtedness; |
124
Table of Contents
| • | pay dividends or distributions on, or redeem or repurchase, capital stock and make other restricted payments; |
| • | make investments; |
| • | consummate certain asset sales; |
| • | engage in transactions with affiliates; |
| • | grant or assume liens; and |
| • | consolidate, merge or transfer all or substantially all of Presidio Holdings’ assets. |
Most of the restrictive covenants will cease to apply for so long as the Notes are rated investment grade by both Standard & Poor’s and Moody’s. The indentures governing the Notes also contain customary events of default.
Contractual Obligations
The following table presents a summary of our contractual obligations as of June 30, 2016 (in millions):
| Payments Due by Period | ||||||||||||||||||||
| Total | <1 year | 1-3 years | 4-5 years | >5 years | ||||||||||||||||
| Receivables Securitization Facility (1) |
$ | 5.0 | $ | — | $ | 5.0 | $ | — | $ | — | ||||||||||
| Term loan facility (1) |
732.3 | 7.4 | 14.8 | 14.8 | 695.3 | |||||||||||||||
| Senior Notes (1) |
222.5 | — | — | — | 222.5 | |||||||||||||||
| Subordinated Notes (1) |
111.8 | — | — | — | 111.8 | |||||||||||||||
| Interest on term loan facility, Receivables Securitization Facility and Notes (2) |
438.2 | 73.2 | 145.0 | 143.4 | 76.6 | |||||||||||||||
| Operating leases (3) |
49.5 | 11.4 | 16.7 | 11.4 | 10.0 | |||||||||||||||
|
|
|
|
|
|
|
|
|
|
|
|||||||||||
| Total |
$ | 1,559.3 | $ | 92.0 | $ | 181.5 | $ | 169.6 | $ | 1,116.2 | ||||||||||
|
|
|
|
|
|
|
|
|
|
|
|||||||||||
| (1) | Includes future principal on long-term borrowings through scheduled maturity dates. |
| (2) | Interest payments for the variable rate term loan and Receivables Securitization Facility were calculated using interest rates as of June 30, 2016. Interest on the Notes was calculated using the stated interest rates. Excluded from these amounts are the amortization of debt issuance and other costs related to indebtedness. |
| (3) | Includes the minimum lease payments for non-cancelable operating leases used in our operations. Excluded from these amounts are applicable taxes, insurance and common area maintenance charges which we are obligated to pay per the terms of our lease agreements. |
Purchase obligations are defined as an agreement to purchase goods or services which is enforceable and legally binding and specify all significant terms, including fixed or minimum quantities to be purchased, fixed minimum or variable price provisions and approximate timing of the transaction. Purchase orders and authorizations that we issue involve no firm commitment from either party and as such are excluded from the above table. We have no enforceable and legally binding purchase obligations.
Commitments and Contingencies
In the normal course of business, we are subject to certain claims and assessments that arise in the ordinary course of business. We record a liability when we believe that it is both probable that a loss has been
125
Table of Contents
incurred and the amount can be reasonably estimated. Significant judgment is required to determine the outcome and the estimated amount of a loss related to such matters. Management believes that there are no claims or assessments outstanding which would materially affect our consolidated results of operations or our financial position.
On July 14, 2015, we received a subpoena from the Office of Inspector General for the General Services Administration (“GSA”) seeking various records relating to GSA contracting activity by us during the period beginning in April 2005 through the present. The subpoena is part of an ongoing law enforcement investigation being conducted by the GSA and requests a broad range of documents relating to business conduct in the GSA Multiple Award Schedule program. We are fully cooperating with the Inspector General in connection with the subpoena.
On March 11, 2016, we received a subpoena from the Office of Treasury Inspector General for Tax Administration for the Department of the Treasury seeking various records from January 1, 2014 through the present, relating our contracts with the Internal Revenue Service as well as our interactions with other parties named in the subpoena who were involved in such contracts. We are fully cooperating with the Treasury Inspector General in connection with the subpoena.
As these matters are ongoing, we are unable to determine their likely outcome and are unable to reasonably estimate a range of loss, if any, at this time. Accordingly, no provision for these matters has been recorded.
Off-Balance Sheet Arrangements
We have $1.5 million of outstanding letters of credit on our revolver facility as of each of December 31 and June 30, 2016. We have no other off-balance sheet arrangements that have or are reasonably likely to have a material current or future effect on our financial condition, changes in financial condition, revenue or expenses, results of operations, liquidity, capital expenditures or capital resources.
Dividends
We do not currently anticipate paying dividends on common stock. Any declaration and payment of future dividends to holders of common stock will be at the discretion of the Board of Directors and will depend on many factors, including our financial condition, earnings, capital requirements, level of indebtedness, statutory and contractual restrictions applying to the payment of dividends and other considerations that the Board of Directors deems relevant. Presidio, Inc., as a holding company, has no direct operations and our ability to pay dividends is limited to our available cash on hand and any funds received from subsidiaries. The terms of the indebtedness may restrict Presidio, Inc.’s ability to pay dividends, or may restrict the subsidiaries from paying dividends to Presidio, Inc. Under Delaware law, dividends may be payable only out of surplus, which is net assets minus liabilities and capital, or, if there is no surplus, out of net profits for the fiscal year in which the dividend is declared and/or the preceding fiscal year.
Critical Accounting Policies and Estimates
The preparation of financial statements in accordance with generally accepted accounting principles in the United States requires management to make use of certain estimates and assumptions that affect the reported amounts of assets and liabilities and disclosure of contingent assets and liabilities at the date of the financial statements and the reported amounts of revenue and expenses during the reported periods. We base our estimates on historical experience and on various other assumptions that we believe are reasonable under the circumstances, the results of which form the basis for making judgments about carrying values of assets and liabilities that are not readily apparent from other sources. Actual results could differ from those estimates.
126
Table of Contents
In Note 1 to the audited historical consolidated financial statements included elsewhere in this prospectus, we include a discussion of the significant accounting policies used in the preparation of our consolidated financial statements. We believe that the following items are the most critical accounting policies and estimates that involved significant judgment as we prepared our financial statements. We consider an accounting policy or estimate to be critical if the policy or estimate requires assumptions to be made that were uncertain at the time they were made and if changes in these assumptions could have a material impact on our financial condition or results of operations.
Revenue Recognition
Revenue from our solutions is primarily composed of the sale of third-party products, software and third-party support services. Revenue is recognized when all of the following criteria have been met:
| • | Persuasive evidence of an arrangement exists. Contracts and customer purchase orders are generally used to determine the existence of an arrangement. |
| • | Delivery has occurred. Shipping documents and client acceptance, when applicable, are used to verify delivery. |
| • | The fee is fixed or determinable. We assess whether the fee is fixed or determinable based on the payment terms associated with the transaction and whether the sales price is subject to refund or adjustment. |
| • | Collectability is reasonably assured. We assess collectability based primarily on the creditworthiness of the customer as determined by credit checks and analysis, as well as the customer’s payment history. |
As a provider of solutions that use third-party products, software and third-party support services, we consider the principal versus agent accounting guidance to determine if revenue should be recognized gross or net of the associated costs. Applying the principal versus agent accounting guidance is a matter of judgment based on the consideration of several factors and indicators.
To meet our customers’ needs, we will enter into arrangements that may consist of a combination of deliverables including third-party hardware, third-party software and third-party support service contracts along with services delivered by us and/or third-parties. These types of arrangements may contain multiple revenue-generating activities or elements where delivery or performance may occur at different times or over different periods of time as discussed in the policies below. For arrangements that contain multiple elements, the total consideration of the arrangement is allocated to the deliverables that qualify as separate units of accounting. Generally, each of the above items qualifies as separate units of accounting since they provide stand-alone value to the customer and the delivery or performance of any undelivered items is considered probable and substantially in our control. The allocation of the arrangement consideration to the separate units of accounting is based on the relative selling price of each deliverable. The relative selling price is determined based on an assessment of the cost plus a reasonable margin. The identification of the deliverables, the separate units of accounting, the estimated selling prices and the allocation of the arrangement require management estimates and judgment. We use historical sales and profitability data in making these estimates and judgments. Additionally, with the exception of our managed service offerings that are delivered over a period up to five years, the majority of our sales are completed within a relatively short time period that reduces the significance of those estimates and judgments that span across reporting periods. The allocation of the arrangement consideration to the deliverables is determined at the inception of the arrangement.
Product Revenue
Revenue for hardware and software: Revenue for the sale of hardware and software products are generally recognized on a gross basis with the sales price to the customer recorded as revenue and the acquisition
127
Table of Contents
cost of the revenue recorded as cost of sales, net of vendor rebates. Revenue is generally recognized when the title and risk of loss are passed to the customer. Hardware and software items can be delivered to customers in a variety of ways including as physical products shipped from our warehouse, via drop-shipment by the vendor or supplier, or via electronic delivery for software licenses. We maintain an estimate for sales returns and credit losses based on historical experience as described below. Our vendor partners provide warranties to our customers on equipment sold and as such we have not estimated a warranty reserve or deferred revenue for potential warranty work.
Revenue for maintenance contracts: Revenue for the sale of third-party maintenance contracts is recognized net of the related cost of revenue. In a third-party maintenance contract, all services are provided by our third-party providers and as a result, we concluded that we are acting as an agent and recognize revenue on a net basis at the date of sale with revenue being equal to the gross margin on the transaction. As we are under no obligation to perform additional services, revenue is recognized at the time of sale as opposed to over the life of the maintenance agreement.
Revenue from leasing arrangements: Revenue recognition for information technology products leased to customers is based on the type of the lease. Each lease is classified as either a direct financing lease, sales-type lease, or operating lease. If a lease meets one or more of the four criteria listed below and both the collectability of the minimum lease payments is reasonably predictable and there are no material uncertainties surrounding the amount of unreimbursable costs yet to be incurred, the lease is classified as either a sales-type or direct financing lease; otherwise, it is classified as an operating lease:
| • | the lease transfers ownership of the property to the lessee by the end of the lease term; |
| • | the lease contains a bargain purchase option; |
| • | the lease is equal to 75% or more of the estimated economic life of the leased property; or |
| • | the present value at the beginning of the lease term of the minimum lease payments equals or exceeds 90% of the fair value of the leased property at the inception of the lease. |
Interest earned on direct financing leases is recognized over the term of the lease using the effective interest method. Revenue on sales-type leases is recognized at the inception of the lease at the present value of the minimum lease payments using the discount rate implicit in the lease, with the earned interest being recognized over the term of the lease using the effective interest method. Minimum lease payments comprise the rental payments that the lessee is obligated to make, excluding contingent rentals and any guarantee by the lessee to pay executory costs. Revenue from operating leases is recognized ratably on a straight-line basis over the term of the lease agreement. Revenue from the sale of the residual asset at the end of a lease term is recognized at the date of sale.
The interest income from direct financing and sales-type leases and the revenue recognized from sales-type leases, operating leases and residual asset sales are presented as product revenue in the consolidated statements of operations.
At the inception of direct financing and sales-type leases, the net investment in leases is recorded which consists of the minimum lease payments, the initial direct costs applicable for direct financing leases, the unguaranteed residual value of the leased asset and the unearned interest income.
We generally assign the customer lease payments to a financial institution along with a first priority security interest in the leased equipment (“discounting”). These assignments do not qualify for sale accounting in accordance with ASC 860, Transfers and Servicing, and as such are not derecognized from the balance sheet and instead reported as collateralized borrowings. Accordingly, the related assets remain on our balance sheet and
128
Table of Contents
continue to be reported and accounted for as if the sale or assignment had not occurred. The majority of our assigned lease payments are on a nonrecourse basis with the financial institutions. At the time the lease is discounted, we receive a cash payment from the financial institution equal to the present value of the lease payments discounted at a fixed interest rate. A related liability is established equal to this cash payment received. The asset and liability are both decreased over the term of the lease as payments are received by the financial institution from the lessee. The typical term of our leases and the discounting arrangements is between two and five years.
Sales-type leases: At the inception of the lease, the present value of the non-cancelable rentals is recorded as revenue. Equipment costs, less the present value of the estimated residual values, are recorded in cost of revenue. The difference between the present value of the non-cancelable rentals and the minimum lease payments receivable and the difference between the present value of the estimated residual values and the future value of residuals are recorded as unearned income, which is amortized to revenue over the lease term on an effective interest rate method.
Direct financing leases: At the inception of a lease, the difference between the cost of the equipment and the present value of the non-cancelable rentals are recorded as unearned income, which is amortized to income over the lease term on an effective interest rate method.
Residual values: Residual values represent management’s estimates of the fair market or realizable values of equipment under leases at the maturity of the leases. Estimating the fair market or realizable value of equipment at a point in the future involves management judgment. Management bases its estimates on historical experience, market values for similar but aged equipment and estimated depreciation factors. Management reviews the residual values and they are reduced as necessary to reflect any decrease in the estimate of fair market or realizable values. Residual values are evaluated on a quarterly basis and any impairment, other than temporary, is recorded in the period in which the impairment is determined. The resulting reduction in the net investment in leases is recognized as a loss in the period in which the estimate is changed. No upward revision of residual value is made subsequent to the inception of the lease.
Operating leases: At the inception of a lease, the equipment assigned to the lease is recorded at cost as equipment under operating leases in our consolidated balance sheets and is depreciated on a straight-line basis over its useful life. Estimating the useful life of equipment requires management judgment. Management bases its estimates on historical experience and industry trends for similar products in the marketplace. Monthly payments are recorded as revenue within our consolidated statements of operations, with the depreciation expense associated with the equipment recorded in cost of product revenue.
Service Revenue
Revenue for services: Revenue for professional services and cloud services is generally recognized as the services are performed. For time and material service contracts revenue is recognized at the contractual hourly rates for the hours performed during the period. For fixed price service contracts revenue is recognized on a proportional performance method. Milestone payments are recognized against the labor hours completed compared to the total estimated hours for the scope of work with contract and revenue accrued or deferred as appropriate. Estimating the proportional performance on a contract requires management judgment. Management bases its estimates on the scope of work being performed, our historical experience performing similar work and the risks and uncertainties surrounding that work. These estimates are adjusted throughout the performance of the contract as work is completed. Our actual results have not differed materially from our estimates and we do not believe it is reasonably likely that the estimates and related assumptions will change materially in the foreseeable future. Revenue for managed services is generally recognized on a straight-line basis over the term of the arrangement. We may incur upfront costs associated with professional and managed services including, but not limited to, purchasing maintenance arrangements and software licenses. These costs are initially deferred as prepaid expenses or other assets and expensed over the period that services are being provided.
129
Table of Contents
Provision for Sales Returns and Credit Losses
Accounts receivable are carried at the original invoice amount less a provision for credit losses. Management determines the provision for credit losses by reviewing all outstanding amounts to identify troubled accounts, using historical experience applied to the aging of accounts and considering current economic conditions that may affect a customer’s ability to pay. Accounts receivable are written off when deemed uncollectible. Recoveries of accounts receivable previously written off are recorded when received.
A provision for sales returns is maintained for potential future product returns. A corresponding provision is maintained for those product returns that we are able to return to our vendors or original equipment manufacturers. These provisions are also based on an evaluation of historical trends in product return rates and are presented in accounts receivable and product revenue.
Provision for credit losses are maintained for potentially uncollectible accounts, unbilled and financing receivables. The provisions are increased for potential credit losses, which increases expenses and decreased by subsequent recoveries. The provisions for credit losses are decreased by write offs and reductions to the provision for potential credit losses. Accounts are either written off or written down when the loss is both probable and determinable. Management’s determination of the adequacy of the provision for credit losses for accounts receivable, unbilled receivables and financing receivables is based on the age of the receivable balance, the customer’s credit quality rating, an evaluation of historical credit losses, current economic conditions and other relevant factors.
Goodwill and Intangible Assets
Goodwill and intangible assets are generally acquired in conjunction with a business combination using the acquisition method of accounting. The acquisition method requires that the total purchase price of the acquired entity be allocated to the assets acquired and liabilities assumed based on their fair values at the acquisition date. The assets acquired include the analysis and recognition of intangible assets such as customer relationships, trade names and contractual rights and the liabilities assumed include contractual commitments and contingencies. Any premium paid over the fair value of the net assets and liabilities acquired is recorded as goodwill. Determining the fair value of the assets and liabilities acquired involves significant estimates and judgments by management. Management typically engages a third-party valuation specialist to assist in the identification and valuation of these assets and liabilities. Valuing the assets and liabilities of a business generally involves the use of the market approach, income approach and cost approach.
Finite-lived Intangible Assets
Finite-lived intangible assets such as customer relationships assets and developed technology are amortized over their estimated useful lives, generally on a straight-line basis for periods ranging from one to ten years. Estimating the useful life of finite-lived intangible assets requires management judgment. Management bases its judgment on historical experience and the assumptions and inputs used in initially valuing the assets. Assumptions and inputs used in determining customer relationships and trade name values include estimating future cash flows, profitability, discount rates and a customer attrition rate. The useful life of developed technology is based on management’s estimate of market trends. Finite-lived intangible assets are reviewed for impairment or obsolescence whenever events or circumstances indicate that the carrying amount of the asset may not be recoverable. Recoverability of intangible assets is measured by a comparison of the carrying amount of the asset to the future undiscounted net cash flows expected to be generated by that asset. If the asset is considered to be impaired, the impairment to be recognized is measured by the amount by which the carrying amount of the asset exceeds the estimated fair value. No impairment of finite-lived intangible assets was recognized for any of the periods presented.
130
Table of Contents
Goodwill and Indefinite-lived Intangible Assets
We test goodwill for impairment at least annually on March 31 of each year for each reporting unit. The impairment assessment considers qualitative factors to determine whether it is more likely than not that the fair value of a reporting unit is less than its carrying value. In performing this qualitative assessment, we assess relevant events and circumstances that may impact the fair value and the carrying amount of each of reporting unit. Factors that are considered include, but are not limited to, the following: (1) macroeconomic conditions; (2) industry and market conditions; (3) overall financial performance and expected financial performance; (4) other entity specific events, such as changes in management or key personnel; and (5) events affecting our reporting units, such as a change in the composition of net assets or any expected dispositions.
If after assessing the qualitative factors, we determine that it is more likely than not that the fair value of a reporting unit is less than its carrying value, then we perform a two-step impairment test. The first step compares the fair value of a reporting unit with its carrying amount, including goodwill. If the carrying amount of a reporting unit exceeds its fair value, the second step compares the implied fair value of the reporting unit goodwill with the carrying amount of that goodwill to determine the amount of impairment loss. The fair value of a reporting unit is determined by using a combination of a discounted cash flow approach and a market approach. The significant estimates and assumptions utilized in the fair value estimate include revenue and margin projections, working capital requirements, capital expenditures, terminal growth rates, discount rates and the selection of peer company multiples.
We performed impairment assessments as of March 31, 2016 and 2015. Given the close proximity of the March 31, 2015 annual goodwill impairment test to the date of the Presidio Acquisition, the fair values of the reporting units approximated the carrying values and no indicators of impairment were noted. As of March 31, 2016, our estimated fair value exceeded our carrying value by a range of 25.8% to 33.0%. A range of fair values were considered using varying assumptions in the discounted cash flow valuation model for the purposes of assessing the sensitivity of the results. On a qualitative basis, no economic, industry or our company-specific indicators were noted which would have led us to believe that it is more likely than not that goodwill was impaired since March 31, 2016.
Similar to goodwill, indefinite-lived intangible assets other than goodwill are assessed annually on March 31, or more frequently if indicated, for impairment. The impairment assessment first considers qualitative factors to determine whether events and circumstances indicate that it is more likely than not that an indefinite-lived intangible asset is impaired including, but not limited to, the following: (1) the performance of the underlying business related to each trade name, (2) the use of the trade names to market to customers and transact with vendors and (3) the expectation that the trade names will continue to be used going forward. If after assessing the qualitative factors, we determine that it is more likely than not that the fair value of an indefinite-lived intangible asset is less than its carrying value, then we will write-down the value of the intangible asset to its fair value. The fair value of an indefinite-lived intangible asset is determined using the relief from royalty method. The significant estimates and assumptions utilized in the fair value estimates include revenue projections, the royalty rate and the weighted average cost of capital.
No impairment of goodwill or indefinite-lived intangible assets was recognized for any of the periods presented.
Share-based Compensation
We measure and recognize share-based compensation expense for all share-based awards made to employees and directors using fair value based methods over the requisite service period adjusted for estimated forfeiture rates based on historical experience. The cost of equity-classified awards is based on the grant date fair value calculated using a Black-Scholes or Monte Carlo valuation model, depending on the nature and classification of the award. The costs of liability-classified awards was based on the intrinsic value of the awards at each reporting date. All liability-classified awards were settled in conjunction with the Presidio Acquisition.
131
Table of Contents
Share-based compensation expense for awards with a service only condition is recognized over the employee’s requisite service period using a graded vesting method. For awards with a performance condition that affects vesting, the performance condition is not considered in determining the award’s grant date fair value; however, the conditions are considered when estimating the quantity of awards that are expected to vest. No compensation expense is recorded for awards with performance conditions until the performance condition is determined to be probable of achievement. Estimating when a performance condition is probable of achievement requires management judgment. Management considers all available factors and available information in making this determination including, measurement against the performance condition, historical results, volatility, remaining contractual period of the awards and future forecasts and market outlook. For awards with a market condition that affects vesting, the market condition is considered in determining the award’s grant date fair value. Compensation expense for awards with a market condition are recognized straight-line over the derived or implied service period. For awards with both a performance and market condition, the market condition is incorporated into the fair value of the award, while the performance condition impacts the timing of the expense recognition.
In the case of modifications of awards, additional share-based compensation expense is based on the excess, if any, of the fair value of the modified award over the fair value of the original award immediately before its terms are modified.
Share-based compensation expense is classified as selling expenses or general and administrative expenses consistent with other compensation expense associated with the award recipient.
Assumptions used in the Black-Scholes and Monte Carlo valuation models to calculate the fair value of the awards includes the expected life, volatility, risk-free rate and dividend yield. We use the simplified method in estimating the expected life of service based awards because we do not have sufficient historical exercise data to provide a reasonable basis to estimate future exercise patterns. The expected stock price volatility is based on the average of the historical volatility of public companies in industries similar to our industry. The risk-free interest rate is based on U.S. Treasury yields in effect at the time of grant over the expected term of the option. We do not use a dividend yield as we have not historically paid dividends.
We did not grant any stock options during the Predecessor period from July 1, 2014 to February 1, 2015. During the Successor period from November 20, 2014 to December 31, 201616 the following options were granted:
| Grant Date |
Estimated Stock Value |
Tranche A (Service Based) |
Tranche B & C (Performance Based) |
Exercise Price | ||||||||||||
| March 11, 2015 |
$ | 10.00 | 1,636,750 | 1,629,250 | $ | 10.00 | ||||||||||
| May 5, 2015 |
$ | 10.00 | 5,000 | 5,000 | $ | 10.00 | ||||||||||
| June 5, 2015 |
$ | 10.00 | 15,000 | 15,000 | $ | 10.00 | ||||||||||
| October 1, 2015 |
$ | 12.58 | 9,937 | 9,936 | $ | 12.58 | ||||||||||
| November 1, 2015 |
$ | 12.58 | 7,500 | 7,500 | $ | 12.58 | ||||||||||
| November 24, 2015 |
$ | 17.50 | 28,862 | 28,853 | $ | 17.50 | ||||||||||
| February 1, 2016 |
$ | 17.50 | 113,148 | 113,137 | $ | 17.50 | ||||||||||
| February 26, 2016 |
$ | 17.50 | 57,754 | 57,749 | $ | 17.50 | ||||||||||
| May 19, 2016 |
$ | 17.50 | 27,499 | 20,001 | $ | 17.50 | ||||||||||
| August 10, 2016 |
$ | 17.50 | 17,856 | 17,858 | $ | 17.50 | ||||||||||
| November 11, 2016 |
$ | 21.96 | 11,157 | 11,157 | $ | 21.96 | ||||||||||
| December 12, 2016 |
$ | 21.96 | 5,693 | 5,692 | $ | 21.96 | ||||||||||
|
|
|
|
|
|||||||||||||
| 1,936,156 | 1,921,133 | |||||||||||||||
|
|
|
|
|
|||||||||||||
The estimated stock value used in the fair value calculation of the stock options granted on March 11, 2015 was determined based on the common stock value agreed to between two unrelated third parties, namely
| 16 | From November 20, 2014 to February 1, 2015, the Successor had no operations or activities other than the incurrence of transaction costs related to the Presidio Acquisition. See “Basis of Presentation.” |
132
Table of Contents
affiliates of American Securities and the Apollo Group, based on the terms of the acquisition of Presidio Holdings by the Apollo Funds on February 2, 2015. As the grant of the stock options was near the time of the acquisition and our operations and structure remained unchanged during that time, management believes this value best represents the fair value of our common stock in the absence of having a quoted market price on an active exchange. For the stock options granted May 5, 2015 and June 5, 2015, management continued to estimate the stock value used in the fair value calculation at $10.00 per share. Management’s estimate was based on similar factors as those considered for the March 11, 2015 grant, as well as a sensitivity analysis and materiality assessment.
For the stock options granted between June 30, 2015 and December 31, 2016, the fair value of our common stock was determined by our Board of Directors, with input from management and in consideration of the American Institute of Certified Public Accountants Accounting and Valuation Guide, Valuation of Privately-Held-Company Equity Securities Issued as Compensation. In the absence of a public trading market for our common stock estimating the fair value of our common stock requires significant judgment and consideration of numerous objective and subjective factors, including:
| • | Our historical and projected operating and financial results; |
| • | Current business conditions and performance; |
| • | Business risks in our operating strategy; |
| • | Trends and developments in our industry; |
| • | Our stage of development; |
| • | The market performance of comparable publicly traded companies; |
| • | Lack of marketability for our common stock; |
| • | The likelihood of achieving a liquidity event for our common stock, such as an initial public offering or sale of the company in the prevailing market conditions; |
| • | The U.S. and global capital market conditions; and |
| • | Management and board experience. |
In valuing our common stock, our board of directors contemporaneously determined the equity value of our business using a combination of a market approach valuation method of comparable companies and an income approach valuation method using a discounted cash flow. The market approach estimates equity value based on a comparison of our company to comparable public companies in similar lines of business. From comparable companies, a representative market value multiple is determined that is applied to our results of operations to estimate the value of our company. In our valuations, the multiple of the comparative companies was determined based on EBITDA. To determine our peer group of companies, we considered companies that were similar to us in size, stage of life cycle and financial leverage. The income approach involves applying an appropriate risk-adjusted discount rate to projected cash flows based on forecasted revenue and costs. The estimated values from the market approach and income approach were then discounted by a non-marketability factor due to the fact that stockholders of private companies do not have access to trading markets similar to stockholders of publicly traded companies, which impact liquidity.
In the case of certain grants issued in between valuation dates, management considered the amount of time between the valuation date and the grant date to determine whether or not to use the latest common stock valuation.
133
Table of Contents
There is inherent uncertainty in estimating the fair value of our common stock and if we had made different assumptions, the fair value of the underlying common stock and amount of our share-based compensation expense, net income (loss) and earnings (loss) per share would have been different.
We believe the increase in the value of our common stock from the Presidio Acquisition to the fair values estimated as of December 31, 2016 was attributed to the overall increase in equity markets and other company-specific factors, including increased performance and expected increase in liquidity from having our shares traded in the public market.
Following the closing of this Offering, the fair value per share of our common stock for purposes of determining share-based compensation expense will be the closing price of our common stock as reported on the NASDAQ on the applicable grant date and estimates regarding the fair value of our common stock will not be necessary. For purposes of this section, estimated stock value and exercise price has not been adjusted to reflect the Stock Split. After the Stock Split is effected, and before the effectiveness of the registration statement of which this prospectus forms a part, the Registrant will update the estimated stock value and exercise price in this section to reflect the Stock Split.
Income Taxes
Deferred taxes are calculated using the liability method whereby deferred tax assets are recognized for deductible temporary differences and operating loss and tax credit carry-forwards and deferred tax liabilities are recognized for taxable temporary differences. Temporary differences are the differences between the reported amounts of assets and liabilities and their tax bases. Deferred tax assets are reduced by a valuation allowance when, in the opinion of management, it is more likely than not that some portion or all of the deferred tax assets will not be realized. The assessment of future realization of deferred tax assets requires management judgment. Based on management’s forecast of future operations, no valuation allowance has been recorded for any of our deferred tax assets as we believe we will generate sufficient taxable income in the future to realize these benefits. Deferred tax assets and liabilities are presented based on the tax rates currently in effect and adjusted for changes in tax laws and rates on the date of enactment.
We evaluate our tax positions under a more-likely-than-not recognition threshold and measurement analysis before they can be recognized for financial statement reporting. Identifying and evaluating the likely outcome of tax positions requires management judgment. Uncertain tax positions have been classified as current or noncurrent income tax liabilities based on the expectation of whether they will be paid in the next 12 months. Our policy for interest and penalties related to income tax exposures is to recognize interest and penalties as a component of the income taxes on continuing operations in our consolidated statements of operations.
Recent Accounting Pronouncements
See the information set forth in Note 1 (Recent Accounting Pronouncements Not Yet Adopted) to the historical consolidated financial statements included elsewhere in this prospectus.
Impact of Inflation
Inflation has not had a material impact on our operating results. We generally have been able to pass along price increases to our customers, though certain economic factors and technological advances in recent years have tended to place downward pressure on pricing.
Quantitative and Qualitative Disclosure About Market Risk
Interest Rate Risk
Our market risks relate primarily to changes in interest rates. The interest rates on borrowings under our term loans are floating and, therefore, are subject to fluctuations. Currently the applicable interest rate is based on a floor, however if interest rates rise in the future with the base rate increasing above the floor, our interest expense will increase. To manage this risk, we may enter into interest rate swaps to add stability to interest expense and to manage our exposure to interest rate fluctuations.
134
Table of Contents
Company Overview
Presidio is a leading provider of IT solutions to the middle market in North America. We enable business transformation through our expertise in IT solutions, with a specific focus on Digital Infrastructure, Cloud and Security solutions. Our solutions are delivered through a broad suite of professional services, including strategy, consulting, design and implementation. We complement our professional services with project management, technology acquisition, managed services, maintenance and support to offer a full lifecycle model. Our services-led, lifecycle model leads to ongoing client engagement. As of June 30, 2016, we serve approximately 7,000 middle-market, large and government organizations across a diverse range of industries.
We have three solution areas: (i) Digital Infrastructure, (ii) Cloud and (iii) Security. Through our increasing focus on cloud and security, we believe we are well positioned to benefit from the rapid growth in demand for these technologies and expect our business mix to continue shifting toward them. Within our three solutions areas, we offer customers enterprise-class solutions that are critical to driving digital transformation and expanding business capabilities. Examples of our solutions include advanced networking, IoT, data analytics, data center modernization, hybrid and multi-cloud, cyber risk management and enterprise mobility. These solutions are enabled by our expertise in foundational technologies, built upon our investments in network, data center, security, collaboration and mobility.
The middle market is a highly attractive segment of the IT Services market. We believe we are the leading middle-market provider of IT solutions and are differentiated by our strategic focus on this attractive segment. The increasing potential and complexity of emerging technologies and digital transformation are creating more demand for our solutions and services. As a trusted solutions provider, our clients rely on us for IT investment decisions. We simplify IT for them by building solutions utilizing what we view as the best possible technologies. Customers in the middle market are usually large enough to have substantial technology needs but typically have fewer IT resources and lack the broad expertise required to develop the necessary solutions as compared to larger companies. Since many large-scale IT Services providers focus on larger enterprises, and because many resellers are unable to provide end-to-end solutions, we believe the middle market has remained underpenetrated and underserved.
We develop and maintain our long-term client relationships through a localized direct sales force of over 500 employees based in over 60 offices across the United States as of June 30, 2016. As a strategic partner and trusted advisor to our clients, we provide the expertise to implement new solutions, as well as optimize and better leverage existing IT resources. We provide strategy, consulting, design, customized deployment, integration and lifecycle management through our team of approximately 1,600 engineers as of June 30, 2016, enabling us to architect and manage the ideal IT solutions for our clients. Our local delivery model, combining relationship managers and expert engineering teams, allows us to win, retain and expand our client relationships.
Our client base is diversified across individual customers and industry verticals. In our fiscal year ended June 30, 2016, only 19% of our revenue was attributable to our top 25 clients by revenue and no industry vertical accounted for more than 20% of our revenue. Among the verticals that we serve, healthcare, professional services, financial services, governments and education are our largest categories. We believe that our diversified business profile is a key driver of our ability to generate growth across different economic and technology cycles.
Our strategic focus on the middle-market and high-growth solutions areas has enabled us to achieve 11% annualized growth in our revenue from our fiscal year ended June 30, 2012 to our fiscal year ended June 30, 2016. Over the same period, we have significantly outpaced the overall IT market growth rate, according to Gartner. We believe that we are well positioned for continued success as IT becomes more transformative and complex, driving demand for our solutions.
135
Table of Contents
Our revenue was $1,393 million for the Predecessor period beginning July 1, 2014 and ending February 1, 2015 and $985 million for the Successor period beginning November 20, 2014 and ending June 30, 2015. From November 20, 2014 to February 1, 2015, the Successor had no operations or activities other than the incurrence of transaction costs related to the Presidio Acquisition. Our revenue for our Combined fiscal year ended June 30, 2015 was $2,378 million and increased 14.2% to $2,715 million in our fiscal year ended June 30, 2016. In our fiscal year ended June 30, 2016, our net loss was $3.4 million. In the same period, Adjusted EBITDA and Adjusted Net Income were $211.1 million and $81.2 million, respectively. Adjusted EBITDA and Adjusted Net Income are non-GAAP financial measures. See “Non-GAAP Financial Measures” and footnotes 2 and 4 under “Prospectus Summary—Summary Historical and Pro Forma Financial Information” for the definitions of Adjusted EBITDA and Adjusted Net Income, the reasons for their inclusion and a reconciliation to net income.
As of December 31, 2016, our backlog orders believed to be firm was approximately $517 million, compared to approximately $410 million as of December 31, 2015. Our backlog orders believed to be firm represents executed but unfulfilled client orders that we expect to result in actual revenue in future periods. The actual realization and timing of any of this revenue is subject to various contingencies, many of which are beyond our control, and such realization may never occur or may change because an order could be reduced, modified or terminated early. Due to these uncertainties, we estimate that approximately $196 million of our backlog orders believed to be firm as of December 31, 2016 will not be fulfilled within the current fiscal year.
Market Overview
We operate in the large and growing North American IT market. According to Gartner, the overall North American IT market is expected to grow to $1.3 trillion by 2020, representing a 2.6% CAGR from 2015, and the IT Services sub-market is expected to grow by 5.3% over the same period, to $497 billion. Our primary focus is on the attractive middle market of the overall North American IT market, which, according to Gartner, is projected to grow from $226 billion in 2015 to $293 billion in 2020, representing a 5.3% CAGR. The middle market is one of the fastest growing segments of the overall North American IT market in part because its companies often employ smaller internal IT teams that do not have the broad expertise required to keep pace with increasingly complex IT environments and constant technology changes. Industry dynamics continue to favor services-led solutions providers, as businesses increasingly rely on us to advise them on complex IT projects, enabling them to better focus on their core capabilities and enhance productivity.
| North America IT Spend by Category17 | North America IT Spend by Company Size |
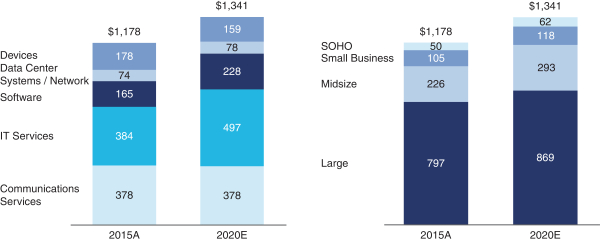
| 17 | See Gartner note (1) in the section titled “Market, Industry and Other Data.” |
136
Table of Contents
While we primarily focus our operations on the U.S. middle market, we have generated sales in and have operations in Canada, the only other country included in Gartner’s North American IT market measurements. Our sales in Canada generated approximately 0.3% of our revenue in the fiscal year ended June 30, 2016. Our total sales outside the United States represented approximately 2% of our total revenue for each of the fiscal years ended June 30, 2016, June 30, 2015, and June 30, 2014, and the growth rates of the overall North American IT market and the IT Services sub-market generally indicate a growing market for our business.
We believe that growth in IT spending will continue to be driven by the adoption of new technologies and market-related trends in cloud, security and IoT and the desire to integrate people, process and technology into digital business models. These trends reflect expanding IT complexity that organizations must manage to remain competitive; however, many middle-market companies lack the resources to design, integrate and manage full life cycle solutions across multiple technology silos to capitalize on these new technologies. A recent survey by Gartner18 predicted that the four biggest drivers of increased IT budget spend would be in the areas of analytics, infrastructure and datacenter, security and cloud, all of which are areas addressed by our core solutions.
Because of our strategic focus on high-growth solutions areas, our North American TAM is expected to grow at a 9% CAGR from $154 billion in 2015 to $232 billion in 2020, according to Gartner and management estimates.19
| Digital Infrastructure TAM | Cloud TAM | Security TAM |
Specific components of our TAM are as follows:
| • | Digital Infrastructure solutions: Gartner and management estimate that our addressable enterprise-class infrastructure market was $125 billion in 2015 and is projected to grow at a 5% CAGR through 2020. Gartner defines infrastructure solutions as infrastructure services, infrastructure consulting, network services, data center outsourcing, enterprise network outsourcing, data center systems support and network systems support, as well as IoT implementation and consulting. Gartner defines enterprise-class as “the ability of a given tool or product to handle complex processes or services.” We believe key emerging trends driving this growth include increased infrastructure requirements for cloud (public, private and multi) usage including integration of SaaS applications into environments, low-latency requirements, SDN, IoT-connected devices and data management strategies supporting data analytics. We enable businesses to capitalize on these emerging trends by designing and deploying new solutions and by refreshing and replacing their inflexible or under-provisioned existing networks and infrastructure. |
| 18 | See Gartner note (2) in the section titled “Market, Industry and Other Data.” |
| 19 | See Gartner note (3) in the section titled “Market, Industry and Other Data.” |
137
Table of Contents
| • | Cloud solutions: Over the past several years, the SaaS, PaaS and IaaS markets have provided a viable complement to traditional on premise, enterprise-class infrastructure solutions. Clients are deploying multi-cloud solutions that drive increased demand for private clouds, networking, storage and virtualization, as well as public-cloud integration. Gartner estimates that the North American cloud infrastructure opportunity was approximately $10 billion in 2015 and is projected to grow at a CAGR of more than 35% through 2020. Gartner defines cloud solutions as cloud computing services. |
| • | Security solutions: The information security market has been driven by an increase in threats and targeted attacks over the last several years. This is due to the substantial increase in sophistication of attacks (including organized crime and state-sponsored entities) and client adoption of new technologies such as cloud computing and IoT that have created new security exposures for businesses. Security attacks have affected nearly every organization, making security a top priority for senior management teams and boards of directors. Despite years of effort and an estimated tens of billions of dollars spent annually,20 we believe that most organizations are still not sufficiently protected against cyberattacks. Additionally, heightened sensitivity around data security has introduced new regulation and contractual requirements in a number of the industries we serve. According to Gartner and management estimates, the North American security market was $19 billion in 2015, with a projected CAGR of more than 10% through 2020.21 Gartner defines security solutions as consulting, hardware support, implementation and IT outsourcing. |
We believe that we are well positioned within the fragmented North American IT Services market - where no individual company has over 5% market share, according to Gartner.22 We have become a trusted advisor to our middle-market clients by providing enterprise-class, vendor-agnostic and end-to-end solutions through our national team of engineers and strong local relationships. We believe that our value proposition will allow us to take market share because local and regional service providers lack our scale, technology expertise and end-to-end solution capabilities and the larger national and global firms do not have the focus, local relationships and organizational structure to provide solutions to the middle market.
Our Solutions
We consider ourselves to be a leading provider of end-to-end and innovative IT solutions across our three solution areas: (i) Digital Infrastructure, (ii) Cloud and (iii) Security. Due to the accelerated growth and adoption of cloud and security solutions, as seen in Gartner’s projected growth in our total addressable markets, we expect Cloud and Security to continue to drive a mix shift in our revenue base over time.
(Percentage of fiscal 2016 revenue)
| Digital Infrastructure | Cloud | Security |
| 20 | See Gartner note (4) in the section titled “Market, Industry and Other Data.” |
| 21 | See Gartner note (4) in the section titled “Market, Industry and Other Data.” |
| 22 | See Gartner note (5) in the section titled “Market, Industry and Other Data.” |
138
Table of Contents
At the core of our solutions is our services expertise, which combines professional services, project management and technology acquisition, as well as managed, maintenance and support services across our clients’ IT lifecycle. Our offerings are focused on five core foundational IT technologies: network, data center, security, collaboration and mobility. We enable our clients to capitalize on technology advances, simplify IT complexity and optimize existing environments, which drives business transformation through new applications, user experiences and revenue models. As a services-led organization, we work with our clients to understand their unique business challenges and opportunities. Once a client’s needs have been identified, a team of Presidio engineers designs a vendor-agnostic IT solution tailored to the client’s objectives and then acquires the technology and implements the solution. As part of our full lifecycle model, we also provide managed, maintenance and support services to our clients.
Across each of our solution areas, we focus on building expertise in the emerging trends and leading-edge technologies that matter most to our clients. Specifically, in Digital Infrastructure, we have deployed next-generation, converged network and data center technologies to support the increasing demands of multi-channel client interaction and an increasingly mobile workforce. In Cloud, we have developed solutions that allow us to deploy hybrid and multi-cloud environments and software-defined infrastructure, in an automated and orchestrated fashion, giving our clients agility and powerful governance over their application environments. In Security, we have developed strong capabilities in risk assessment, gap remediation, proactive risk management and incident response.
139
Table of Contents
Digital Infrastructure Solutions: Our enterprise-class Digital Infrastructure solutions enable clients to deploy IT infrastructure that is cloud-flexible, mobile-ready, secure and insight-driven. We also make clients’ existing IT infrastructure more efficient and flexible for emerging technologies. Within Digital Infrastructure, we are focused on networking, collaboration, enterprise mobility, IoT and data analytics. In networking, we are designing and deploying the intelligent interconnectivity that will enable our customers to take advantage of the advances in IT, including cloud and data analytics. In collaboration, we help our clients create environments that allow for faster decision-making by integrating all their critical business and communications applications into a unified solution. Our solutions are mobile-ready, as we extend our clients’ local and wide area networks by enabling reliable, secure and scalable access to all types of mobile devices. In IoT, we are helping our clients move from traditional manual processes to automated machine-to-machine connectivity, enabling enhanced efficiency, powerful data insights and integration of historically non-IT assets into the IT environment. Given the millions of potential configurations across technologies, our clients rely on our expertise to simplify the highly complex IT landscape.
| Digital Infrastructure Representative Client – Huntsville, TX School District | ||

|
Situation: The Huntsville, TX School District serves 6,300 students spread across 644 square miles of bus routes. That means some students spend up to 3 hours riding the bus every day on top of school and studying, leaving little room for anything else. Drawing on our extensive experience with K-12 education clients, along with our Internet of Things (IoT) Connected Bus architecture, Presidio developed a holistic solution that integrates hardware, software, data and connectivity. | |

|
Solution and Benefits: We deployed 3G/4G connectivity on school buses for connection to Android based tablets for student ridership, turn-by-turn navigation, driver information and designed the associated App. In addition to live telematics, tracking is provided through Automatic Vehicle Location (AVL) via GPS with geo-fencing. Students can use Wi-Fi-enabled tablets to study on the bus ride, more than doubling their discretionary time. A special App notifies parents when their children enter or exit the bus while real-time video feeds improve security. Telematics enable the fleet manager to monitor the vehicle and driver, reducing maintenance costs and optimizing routes. Fulfilling its mission to put digital resources in the classroom and support the child’s need to learn anywhere, anytime, “any path, any pace,” Huntsville is using technology to improve the quality of education as well as transportation. | |
| Digital Infrastructure Representative Client – Hofstra University | ||
|
|
Situation: Hofstra University, a nationally recognized institution with the motto “pride and purpose,” is adding new schools and increasing its academic selectivity. It is the only university to host three consecutive U.S. presidential debates. But the 2016 debate was different; instead of the usual 12 months, the University had only eight weeks to prepare after the original host withdrew. Presidio was called in to program manage, design and deliver a secure data network to accommodate 4,000 members of the media. | |
|
|
Solution and Benefits: With more media needing more bandwidth, demands on the network were higher than ever due to coverage by social media platforms like Facebook and Twitter, and Wi-Fi-enabled video cameras streaming the event. Presidio delivered this network and also ensured it complied with stringent security guidelines. CNN, Fox News Channel, MSNBC, Bloomberg and Telemundo International erected stages around the Student Center, broadcasting live from campus as early as two days before the debate in addition to several hundred media outlets broadcasting and filing stories simultaneously. Media coverage of the debate set a record with 80 million viewers worldwide with Hofstra ranking 12th in Google search terms related to the debate. According to the University, interest in and visits to the University rose, students were more engaged and registered to vote and through debate-related events, advocacy activity was at an all-time high. | |
140
Table of Contents
Cloud Solutions: We have found that businesses are increasingly required to deliver new products and services to market in shortened time frames by leveraging technology to transform the rate at which they can innovate. Part of this transformation is the proliferation and adoption of the cloud. As a result, companies are increasingly turning to us for help with their cloud strategy and adoption. A recent survey by Gartner23 indicated that 71% of organizations currently deploy or plan to deploy cloud services by the end of 2017. Through our acquisition of Sequoia and our organic investments, we provide cloud enablement and migration services as well as private, hybrid and multi-cloud solutions, including data center modernization, managed cloud, orchestration and automation and operational support to our clients. We combine our highly specialized cloud professional services with our deep experience in cloud-managed services, converged infrastructure, server, storage, support and capacity-on-demand economic models to provide a complete lifecycle of cloud infrastructure solutions for our clients. Our proprietary tools, technical expertise and vendor-agnostic approach help our clients accelerate and simplify cloud adoption across the entire IT lifecycle.
Security Solutions: We use a risk-based security consulting methodology to assess, design, implement, manage and maintain information security solutions that protect our customers’ critical business data and protects against loss of client loyalty, corporate reputation and disruptions in ongoing operations. We offer cyber risk management, infrastructure security and managed security solutions to our clients. Through our NGRM, we provide comprehensive risk assessments, detailed reporting, ongoing reviews, process and program development, and training services. NGRM ensures that identified vulnerabilities are mitigated and business risk has been properly addressed. Because our customers’ infrastructures are constantly changing, our NGRM offering is structured as a recurring service with regular periodic assessments of the current security posture combined with ongoing monitoring and surveillance through our 7x24 Security Operations Centers. Our experience spans all major verticals including retail, education, healthcare, government, banking, pharmaceutical and others. We have expertise with HIPAA, PCI DSS, FISMA, Sarbanes-Oxley Act and others. We help our clients design and implement information security programs consistent with industry best practices and comply with the regulatory mandates of their specific vertical that are flexible enough to help ensure information security in an ever-changing risk environment. Findings, recommendations and real time security posture status, including our proprietary Risk Management Score, are provided through a 7x24 portal that is accessible by our clients and is updated with the up to date vulnerabilities identified by several industry sources.
We help our clients establish both technical and non-technical security controls and practices to prevent, detect, correct and minimize the risk of loss or damage to information resources, disruption of access to information resources, and unauthorized disclosure of information. In addition to our NGRM program, we offer options for security strategy program development, security awareness training, technology exposure assessments and incident response.
| Security Representative Client – Head Injury Association | ||
|
|
Situation: The Head Injury Association (HIA) strives to ensure that traumatic brain injury survivors receive the medical rehabilitation and social services needed to live with dignity within their communities. When a ransomware attack brought their daily in-center and at-home programs for individuals with disabilities to a standstill, they turned to Presidio for help. | |

|
Solution and Benefits: We determined the root cause of the attack and restored HIA’s data environment in a week, saving them a significant ransomware payment and getting daily operations back to usual. As a custodian of client medical records, the organization also needed help complying with HIPAA security regulations. HIA engaged Presidio to address broader security issues and protect against future cyberattacks. Using Presidio Cyber Risk Management, a next generation approach, we provide ongoing security architecture, compromise assessment, governance risk compliance, threat analytics and incident response. HIA also uses Presidio Managed Security Services to monitor their network, data center and environment 24/7. | |
| 23 | See Gartner note (6) in the section titled “Market, Industry and Other Data.” |
141
Table of Contents
We offer our end-to-end solutions through our full lifecycle model. Our lifecycle approach is delivered through professional services, which includes strategy and consulting, solutions design, testing and configuration and custom deployment, as well as project management and technology acquisition, managed services and maintenance and support. Once a solution has been designed and agreed upon, our engineers provide expert implementation and integration of the customized solution into the client’s IT environment. As part of deployment, we stage and test solutions before installing them and then coordinate resources and manage timelines to make sure we deliver according to our client’s exact specifications. Once a solution has been deployed, we provide managed maintenance and support services to ensure our clients IT environments are operating according to plan. As part of our ongoing support, we help our clients identify areas where they can further strengthen their IT solutions.
| Presidio’s Lifecycle Model | ||
Our ability to provide a full lifecycle of services creates multiple ongoing touch points with our clients, which we believe drives deep client relationships and high satisfaction because we are able to serve as the single source for their IT solutions needs.
Our Go-to-market Approach
Our approach is to deliver engineering and services-led solutions to best meet our clients’ evolving IT needs. We have built an innovative and flexible organization with a proven history of identifying and capitalizing on disruptive technologies and market transitions. As of June 30, 2016, we have over 500 direct sales professionals and a team of approximately 1,600 engineers across more than 60 offices nationally who we believe provide high-quality, consistent service to our clients. Our model is focused on developing long-standing, deep relationships through local touch-points, combined with strong technical expertise and the ability to provide an end-to-end solution to solve our clients’ complex IT needs. Our relationships with our clients extend beyond
142
Table of Contents
the solutions we provide to include full lifecycle services such as managed services, maintenance and support, which drive our ongoing client engagement. Our service-led model resulted in 92% of our revenue for our fiscal year ended June 30, 2016 coming from clients that purchased our services. We believe the differentiated combination of our national scale, local reach, technology expertise, end-to-end solution capabilities and full lifecycle services separates us from other providers in the market.
Our vendor-agnostic approach to the market allows us to develop optimal solutions based on what we view as the best mix of technologies. Our best-of-breed philosophy is a significant differentiator versus reseller and fulfillment models. Rather than responding to simple procurement requests, we advise clients on solutions that drive business transformation. We then design the solutions with what we view as the best technologies available.
To cater to certain clients’ desires to lower capital expenditures, we offer flexible consumption models. For example, we have the ability to deliver our full range of IT solutions in an ITaaS model. This provides clients with the option to consume technology “as a service,” accessing and paying for technology as it is consumed.
Our Clients
As of June 30, 2016, our client base consists of approximately 7,000 large, middle-market and government organizations in North America, and we support a number of U.S. multinational clients who deploy IT solutions globally, delivering solutions in approximately 100 countries. 70% of our revenue for our fiscal year ended June 30, 2016 came from our core middle-market client base, which we define as companies with less than $10 billion in annual revenue. We have developed our business model to fit the specific needs of the middle-market companies that (i) are large enough to have consistent, regular IT spend; (ii) have complex requirements and often require access to scale and expertise across multiple technology areas; (iii) are overlooked by the large service providers; and (iv) are underserved by resellers and regional providers that lack the necessary scale and technical expertise.
Our clients operate across a diverse array of industries, including healthcare, professional services, financial services, education, manufacturing, state and local government, media, federal government, energy and retail. As a result of our broad client base, we benefit from low client concentration, with our top 25 clients representing 19% of our revenue for our fiscal year ended June 30, 2016 (measured by revenue generated by client).
(Percentage of Fiscal 2016 Revenue)
| Clients by Type | Client Verticals by Revenue | Client Concentration |
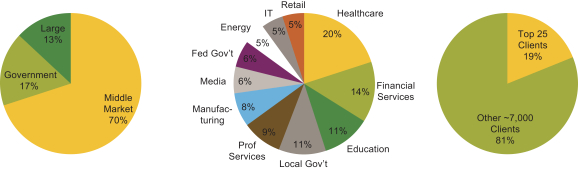
143
Table of Contents
Our Competitive Strengths
Leading Provider of IT Solutions to the Middle Market
We focus on serving the attractive middle-market segment of the IT Services market. The middle market is one of the fastest growing segments of the overall IT Services market. We believe this is due to the strong demand for IT expertise in the segment, the massive number of companies in the segment and significant under-penetration in the segment. We believe we have created a compelling brand and reputation as a leading provider of enterprise-class IT solutions. We have a differentiated combination of national scale, local reach, technology expertise, end-to-end solution capabilities and full lifecycle services that we believe separates us from other providers in the market. Our ability to provide end-to-end solutions and solve complex needs has allowed us to become a partner of choice for our middle-market clients.
End-to-end Enterprise-class Solutions
We deliver our end-to-end solutions through a full lifecycle model, which combines consulting, engineering, managed services and technology to give us a significant competitive advantage compared to other IT providers. We believe that businesses are increasingly seeking a single provider of integrated multi-vendor, multi-technology solutions for their complex and mission-critical IT needs. Our ability to take a client’s high-level vision and distill it into a tangible IT roadmap is a key differentiator for our company; it requires a high degree of investment and technical know-how across technologies that would be difficult and costly to replicate. Our solutions enhance the technology capabilities that our clients believe are most important to their businesses by empowering enhanced productivity and expanded offerings to their clients. With our clients, our lifecycle approach allows for ongoing engagement across new projects and upgrades, as well as ongoing managed services and support. This service-led model resulted in 92% of our revenue for our fiscal year ended June 30, 2016 coming from clients that purchased our services.
Cutting-edge Technology Capabilities with a Proven Record of Capitalizing on Technological Shifts
We believe that our flexible business model has enabled us to stay at the forefront of technology trends and develop a strong track record of growing across technology innovation cycles. We actively make organic and inorganic investments in the future of IT solutions, including multi-cloud, IoT, security and managed services. Recent examples of solutions developed for clients include our connected-vehicle solutions, Presidio Managed Cloud and our proprietary NGRM security offering. To ensure our clients have access to a wide range of technologies and best-of-breed solutions, we have developed strong relationships with over 500 OEMs as of June 30, 2016. We partner with leading IT providers, such as Cisco, Citrix, Dell, EMC, F5, NetApp and VMware, as well as with emerging OEMs who specialize in next-generation technology such as Arista, FireEye, Nutanix, Palo Alto and Pure. We also partner with cloud service providers, such as Amazon Web Services and Microsoft Azure, to help our clients capitalize on public and multi-cloud environments.
National Scale with Local Relationships Driven by an Industry-leading Team of Engineers
While we operate on a national scale, our go-to-market approach is highly localized, helping to ensure a high degree of connectivity and continuity with our clients. Our solutions capability is powered by our services-led organization with specialized expertise across over 60 offices in the United States and over 2,800 employees nationally (in each case, as of June 30, 2016) to provide a high degree of connectivity with our clients. We deploy our end-to-end IT solutions through our team of approximately 1,600 engineers as of June 30, 2016, providing our middle-market client base with expertise that is difficult to replicate in-house. Our productive sales force, combined with our strong consulting capabilities, drive what we believe is our industry-leading engineer-to-sales-person ratio. We believe that the talent, experience and credibility of our engineering team help make us a preferred provider for advanced IT solutions.
144
Table of Contents
The following map shows our office locations, which we believe demonstrates our broad geographic reach.
| Presidio’s Geographic Footprint | ||
Broad and Loyal Client Base
As of June 30, 2016, we have approximately 7,000 clients primarily in the middle market and government segments. In addition, we also serve clients that have grown beyond the middle market, as well as targeted large enterprises. Our clients span a number of large and economically important verticals, including financial services, healthcare, professional services, retail, media and education, as well as local and federal government. Our broad client base provides us a diversified and reoccurring revenue opportunity that helps us grow across economic and technology cycles. Our high-touch, lifecycle approach has resulted in strong client satisfaction as demonstrated by our NPS of 49 in 2014, 59 in 2015 and 65 in 2016, which compares very favorably to the Tech Vendor NPS Benchmark, 2016 (B2B) average score of 30 according to Temkin Group. This positive client satisfaction helps drive our long-term and expanding client relationships. Since 2014, we have grown the number of clients to whom we have sold solutions across all three of our solutions areas from approximately 900 to approximately 1,600. Our relationship with our top 25 clients averages over six years. Our clients are loyal and continue to rely on us for services and new solutions, as evidenced by the fact that clients comprising 95% of our fiscal 2013 revenue made repeat purchases during our 2014 to 2016 fiscal years. We have grown the number of clients that produced more than $100,000 of revenue from approximately 1,900 in fiscal 2014 to 2,150 in fiscal 2016.
Strong Domain Expertise
Our engineers develop custom solutions for clients within specific technologies and verticals and drive them across our national network. We have expertise in digital infrastructure, cloud and security solutions, and we have a deep understanding of the emerging trends, technologies and best practices. Our extensive experience with a broad set of technologies allows us to create differentiated and best-in-class solutions, which we expect to be increasingly important as IT solutions become more multi-vendor and tailored for clients. Across our national platform, we develop insights into the specific IT challenges facing our clients, which provide us with a
145
Table of Contents
significant advantage in developing superior solutions and winning new clients. We are able to leverage this domain expertise within and across verticals and technologies. Our ability to replicate and scale our knowledge and practices greatly enhances our efficiency and the quality of our solutions. Through our proprietary iConnect internal intranet, Presidio engineering and sales teams are able to access prior work product including successful proposals, scopes of work, design and as-built drawings, configurations and technical training. By leveraging this knowledge base, our professionals are able to quickly and efficiently respond to new opportunities with validated technical details based on previous work for that client or another of a similar size or in a similar vertical.
Our Growth Strategies
Expand and Deepen Relationships with Existing Clients
We have a long history of expanding revenue from existing clients by selling additional solutions based on their evolving needs. Our sales force and consulting teams grew our revenue per existing client (exclusive of Netech) from $382,000 in our fiscal year ended June 30, 2014 to $459,000 in our fiscal year ended June 30, 2016 by expanding the breadth of technical solutions we provide and further penetrating our client base. We believe increasing complexity in the market combined, with our end-to-end IT solutions and our high-touch, lifecycle approach, position us for continued growth. This approach has resulted in strong client satisfaction and increasing client engagement that we believe will enable us to continue expanding our revenue per client as our clients leverage our expertise to adopt emerging technologies. As middle-market businesses embrace cloud capabilities and enhance digital security, we believe we are well positioned to capture increased spend from our existing client relationships.
Develop New Client Relationships
We believe the diverse and fragmented nature of the North American IT Services market provides us with a significant opportunity to further grow our client base. We have developed domain expertise managing complex technologies and vertical specific-challenges, which makes us a compelling choice for potential clients looking for an IT solutions partner. Our efforts to develop new client relationships are supported by our existing referenceable client base. With our technological capabilities and proven record of success with clients, we are well positioned to acquire more clients as the need grows for consulting, deployment, integration and managed services. We also conduct highly coordinated marketing and sales activities using the strength of the Presidio brand to win new clients and penetrate highly localized markets. In these markets, we are well positioned against smaller regional IT providers who lack the resources to invest in increasingly advanced IT solutions.
Develop and Offer New Services and Solutions
We focus on providing our clients with the highest quality, optimal solutions for their complex IT needs. We have developed innovative solutions for our clients across technology cycles and are currently developing and providing solutions based on emerging IT trends. Digital Infrastructure, Cloud and Security are some of the fastest growing areas of IT spend and we are focused on developing and deploying new solutions to serve these markets. For example, we have a proprietary connected-vehicle solution, Presidio Managed Cloud and NGRM security offering that help solve complex IT problems associated with these trends. Through our national team of engineers, we maintain institutional knowledge and services capabilities that are adaptable, scalable and transferrable. We are constantly improving our offerings and developing new services and solutions for our clients, which we expect to drive incremental growth from existing and new clients.
Further Penetrate the North American Market
We have been expanding our geographic footprint in North America organically and inorganically and see new opportunities in several major regions. We take a deliberate and strategic approach to deciding which markets to pursue and consider a number of factors. Our expertise and solutions are scalable from region to
146
Table of Contents
region, so as we continue to expand we expect to take market share and create opportunities in new markets. For example, through organic investment in the Great Lakes region we generated a revenue CAGR of 36% from fiscal year 2012 to fiscal year 2016 in that region. Over that time period, we expanded our sales organization in key markets in Chicago, Indianapolis, Detroit, Cincinnati and Cleveland, and at the same time we made investments in engineering personnel to support our expanded activities in the region.
Pursue Strategic Acquisitions
We expect to continue to consider strategic acquisitions that can increase our technology expertise and geographic presence. We believe that our M&A strategy enhances and augments all of our growth avenues, including gaining capabilities, cross-selling to our existing clients and entering new markets and verticals. Since 2004, we have acquired and successfully integrated ten companies, capitalizing on our scale, client relationships and vendor partnerships to drive margin expansion post-acquisition. In 2015, we acquired Sequoia, a consulting, integration and services company headquartered in California, which provides us with improved cloud consulting and integration capabilities. Most recently, in 2016, we acquired Netech Corporation, an IT solutions provider headquartered in Michigan, which provides us with 11 offices to penetrate significant opportunities in the Midwestern United States. We have been successful at integrating our acquisitions and at retaining key management talent. These acquisitions are complementary with new office openings and the organic expansion of our presence in existing geographic markets. We expect to continue to selectively pursue acquisition opportunities within the highly fragmented IT solutions market, with a focus on enhancing our solutions offerings and geographic presence.
Our Competition
We believe we are the only national, vendor-agnostic IT Services company that provides advanced end-to-end solutions through local high-touch relationships to the middle market. We believe we are competitively differentiated by our broad range of capabilities that we combine to offer best-in-class solutions to the middle market. We incorporate high-value services including strategy and consulting, design, implementation, optimization, and managed services, as well as technology expertise and strong vendor relationships. Across our solutions, we compete with companies such as Accenture, CDW, Deloitte, IBM, and Optiv. We categorize our competitors as:
| • | Large Service Providers: Global service providers have scale and consulting capabilities but are not middle-market focused and generally do not provide all aspects of the IT value chain. We combine the scale, talent, technical expertise, and high-value services of the large service providers with end-to-end solution capabilities and a strategic middle-market focus. |
| • | Local and Regional Providers: Though local and regional providers often have strong local relationships, many of them have historically been focused on one or two IT areas. As IT complexity has increased, these providers have attempted to transition from a siloed approach toward a multi-technology and multi-vendor approach. However, the relatively small scale of local and regional providers makes investments across multiple, integrated technology stacks financially prohibitive and, as a result, these competitors are increasingly getting left behind as they lack the professional and managed services capabilities in digital infrastructure, cloud, IoT, and cybersecurity. Also, lack of capability and financial scale often excludes these providers from executing on larger, multi-geography projects and relationships and developing advanced services. |
| • | Boutique Specialists: Many boutique specialists focus in one distinct solution area rather than developing deep capabilities across the full range of IT challenges facing clients today. These firms are also typically sub-scale in terms of geographic coverage limiting their abilities to service larger, multi-location/multi-national customers. Our technical know-how across technologies and vendors, combined with our scale and broad client base, gives us the ability to deliver end-to-end offerings to |
147
Table of Contents
| much larger and more diverse end markets. As technologies continue to grow in complexity and interdependency, these providers will struggle to service client’s needs. |
| • | Resellers: Rather than focusing principally on product resale, we focus on consulting, solution delivery, and ongoing services that allow us to develop long-lasting client relationships. Our lifecycle engagement model focuses on a holistic approach that includes high-value services and end-to-end solutions. |
Our History
Since our founding in 2004, the hallmarks of our culture have centered around client service and collaboration. Our business model has been defined by delivering engineering- and services-led solutions using a cost-effective, localized model that leverages a powerful OEM vendor ecosystem. This formula has driven our internal organic growth while at the same time setting the criteria for identifying acquisition opportunities. From our 2012 fiscal year to our 2016 fiscal year, we have grown our revenue from $1.76 billion to $2.71 billion, representing an 11% CAGR, which is significantly faster than U.S. IT spending and U.S. real GDP, which have grown at 2.1% and 1.9%, respectively, over the same periods, according to Gartner24 and the Bureau of Economic Analysis, respectively.25
We are led by Chief Executive Officer Bob Cagnazzi, Chief Financial Officer Paul Fletcher, Chief Operating Officer Dave Hart and Chief Technology Officer Vinu Thomas. They are joined by a management team with an extensive track record of performance and execution, drawing on approximately 280 collective years of experience in the North American IT solutions markets. Our senior leadership team is backed by a deep bench of management and technology talent that we believe provides us with a pipeline of future leaders and innovators.
Under this team’s leadership, we have entered new geographies and adjacent technologies and achieved above-market growth. Presidio has grown into a national business with the scale and capability to serve a diverse set of end markets and technology challenges. We believe that the depth and extensive industry experience of our management team will serve to provide solid leadership for continued growth and profitability.
Acquisitions
We have a long and successful track record of growing and improving our business and retaining key personnel through strategic tuck-in acquisitions. Since 2004, we have made ten strategic acquisitions. We acquire assets to improve our technology expertise and expand our geographic footprint. Recent examples include:
| • | In 2016, we acquired Netech to expand our reach in the U.S. Midwest / Great Lakes region; |
| • | In 2015, we acquired Sequoia to improve our highly specialized cloud professional services; |
| • | In 2012, we acquired BlueWater Communications to expand our portfolio of advanced IT solutions and managed services; and |
| • | In 2011, we acquired INX to broaden our portfolio of services and solutions and to significantly expand our footprint across the United States. |
Through this experience we have created specific methodologies and processes related to the identification and integration of targets.
| 24 | See Gartner notes (1) and (7) in the section titled “Market, Industry and Other Data.” |
| 25 | Source: Bureau of Economic Analysis – U.S. Department of Commerce, “NIPA Tables.” |
148
Table of Contents
Our Sponsor
Aegis LP is the beneficial owner of most of our common stock. See “Principal Stockholders.” Aegis GP is the general partner of Aegis LP and Apollo VIII, Apollo Overseas VIII, Apollo Overseas Delaware and Apollo Overseas Delaware 892 are members of Aegis GP. Apollo VIII serves as the investment manager of the Equity Funds and as the non-member manager of Aegis GP. Apollo Management is the sole member and manager of Apollo VIII and Apollo Management GP is the general partner of Apollo Management. Management Holdings is the sole member and manager of Apollo Management GP and Management Holdings GP is the general partner of Management Holdings. Leon Black, Joshua Harris and Marc Rowan are the managers, as well as executive officers, of Management Holdings GP. The address of each of the entities and individuals, respectively, listed in this paragraph is 9 West 57th Street, New York, New York 10019.
Founded in 1990, Apollo is a leading global alternative investment manager with offices in New York, Los Angeles, Houston, Chicago, Bethesda, Toronto, London, Frankfurt, Madrid, Luxembourg, Mumbai, Delhi, Singapore, Hong Kong and Shanghai. As of December 31, 2016, Apollo had assets under management of approximately $192 billion in private equity, credit and real estate funds, invested across a core group of nine industries in which Apollo has considerable knowledge and resources. For more information about Apollo, please visit www.agm.com. Information contained on Apollo’s website is not intended to form a part of or be incorporated by reference into this prospectus.
Facilities
We lease all of our properties, which function primarily as regional sales and engineering offices. As of December 31, 2016, we leased space in 69 buildings across the United States. We believe that our current facilities are adequate to meet our ongoing needs and that, if we require additional space, we will be able to obtain additional facilities on commercially reasonable terms.
Intellectual Property
The PRESIDIO® trademark and certain variations thereof are registered or are the subject of pending trademark applications in the U.S. We believe our trademarks have significant value and are important factors in our marketing programs. In addition, we own registrations for domain names, including presidio.com and certain other domains, for certain of our primary trademarks.
We also have pending U.S. patent applications related to our cloud management solution known as Presidio Managed Cloud. No patents have issued from these applications yet and the likelihood of receiving patent protection based on these applications is not yet clear. Once issued, a patent generally has a term of 20 years from the date the application for the patent is filed. Seeking patent protection is part our strategy for competitively differentiating our hybrid cloud solution, but patent protection is not essential to our company as a whole or to our Presidio Managed Cloud business.
Government Contracts
We provide IT services to various government agencies, including federal, state and local government entities. For the fiscal year ended June 30, 2016, 11% of our revenue came from sales to state and local governments and 6% of our revenue was derived from sales to the federal government. Our government contracts are terminable at any time at the convenience of the contracting agency or group purchasing organization. As such, our relationships with public sector clients are susceptible to government budget, procurement and other policies.
149
Table of Contents
Governmental, Legal and Regulatory Matters
We are involved in various legal actions and proceedings arising in the ordinary course of business, including claims with respect to employment, contract, intellectual property infringement and indemnification matters. Though it is not possible to predict the outcome of these matters with certainty, we do not expect the results of any of these actions to have a material effect on our business, financial condition or results of operations.
We provide information technology services to various government agencies, including federal, state and local government entities, as well as international and intergovernmental agencies. Sales to such public sector clients are highly regulated. Any noncompliance with contract provisions, government procurement regulations or other applicable laws or regulations – including, but not limited to, the False Claims Act and the Foreign Corrupt Practices Act – could result in civil, criminal and administrative liability, such as substantial monetary fines or damages, the termination of government contracts or other public sector client contracts and suspension, debarment or ineligibility from doing business with the government and with other clients in the public sector. Because of our significant sales to public sector clients, we are subject to audit by federal, state and local authorities, and from time to time we receive subpoenas and other requests for information from various government authorities.
On July 14, 2015, we received a subpoena from the Office of Inspector General for the GSA seeking various records relating to GSA contracting activity by us during the period beginning in April 2005 through the present. The subpoena is part of an ongoing law enforcement investigation being conducted by the GSA and requests a broad range of documents relating to business conducted in the GSA Multiple Award Schedule program. We are fully cooperating with the Inspector General in connection with the subpoena.
On March 11, 2016, we received a subpoena from the Office of Treasury Inspector General for Tax Administration for the Department of the Treasury seeking various records from January 1, 2014 through the present, relating to Company contracts with the Internal Revenue Service as well as the Company’s interactions with other parties named in the subpoena who were involved in such contracts. We are fully cooperating with the Treasury Inspector General in connection with the subpoena.
As these matters are ongoing, the Company is unable to determine their likely outcome and is unable to reasonably estimate a range of loss, if any, at this time. Accordingly, no provision for these matters has been recorded.
Employees
Our employees are core to our business and we leverage their long-standing, deep client relationships and strong technical expertise to deliver complex end-to-end solutions to best meet our clients’ needs. As of December 31, 2016, we had over 2,800 employees, of which approximately 1,600 were technical engineers. We believe that our employee base, which has an average age of 42 as of December 31, 2016, is well-educated and has a substantial amount of professional experience that serves our clients and mentors the newest generation in our workforce. Our core values of teamwork, execution excellence, integrity and forward thinking are the foundation of our collaborative team-oriented culture. Presidio is not unionized and none of our employees are currently covered under collective bargaining agreements. We believe our relations with our employees are good and we have never experienced a material work stoppage.
150
Table of Contents
Directors and Executive Officers
The following table provides information regarding our executive officers and directors:
| Name |
Age | Title | ||
| Robert Cagnazzi (1), (2), (5) |
57 | Chief Executive Officer and Director | ||
| Paul Fletcher |
57 | Executive Vice President, Chief Financial Officer and Assistant Secretary | ||
| David Hart |
49 | Executive Vice President and Chief Operating Officer | ||
| Elliot Brecher |
51 | Senior Vice President, General Counsel and Secretary | ||
| Vinu Thomas |
40 | Chief Technology Officer | ||
| Giovanni Visentin (3) |
54 | Director and Chairman of the Board | ||
| Christopher L. Edson (1), (2), (4), (5) |
33 | Director | ||
| Salim Hirji |
27 | Director | ||
| Dr. Steven Lerner (4) |
62 | Director | ||
| Matthew H. Nord (1), (2), (5) |
37 | Director | ||
| Pankaj Patel (3) |
63 | Director | ||
| Todd H. Siegel (4) |
46 | Director | ||
| Joseph Trost (3), (4) |
59 | Director | ||
| (1) | Member of the Compensation Committee. |
| (2) | Member of the Nominating and Corporate Governance Committee. |
| (3) | Member of the Innovation and Technology Committee. |
| (4) | Member of the Audit Committee. |
| (5) | Member of the Executive Committee. |
Executive Officers
Robert Cagnazzi has served as the Chief Executive Officer of the Company since February 29, 2012. Previously, he founded Bluewater Communications LLC in 2006 and served as Chief Executive Officer until the company was acquired by Presidio in 2012. Prior to that, he served as Chief Executive Officer of North America at Dimension Data Holdings PLC from 2001 to 2006.
Paul Fletcher has served as Executive Vice President and Chief Financial Officer of the Company since August 2007. Mr. Fletcher served as the Senior Vice President and Chief Financial Officer of Trex Company Inc. from July 2003 to September 2007 and as its Principal Accounting Officer until September 2007. He also served at Trex Company as Vice President of Finance from October 2001 to December 2002. Prior to that, he has held various executive positions at AMX, LLC, Excel Telecommunications Inc. and Lomas Financial Corporation. Mr. Fletcher served as a director of Vul Corporation from September 2011 to July 2013.
David Hart has served as Chief Operating Officer of the Company since June 2013 and, until 2015, also served as Chief Technology Officer. He joined the Company in 2005 when the Company acquired Networked Information Systems (“NIS”), where he led sales engineering, professional and managed services delivery and project management services from NIS’s founding in 1999. Prior to NIS, Mr. Hart was Vice President of Engineering at Aztec Technology Partners and at its predecessor, Bay State Computer Group.
151
Table of Contents
Elliot Brecher has served as Senior Vice President and General Counsel of the Company since July 2015. Prior to joining us, from 2013 he was General Counsel of Amber Road, Inc., a New York Stock Exchange listed provider of cloud-based global trade management solutions delivered using a SaaS model. He served as Senior Vice President and General Counsel of Insight Communications Company, Inc., a Midwest-based cable operator, from 2000 until its sale to Time Warner Cable, Inc. in 2012. From 1994 until joining Insight, he was associated with the law firm Cooperman Levitt Winikoff Lester & Newman, P.C., where he became a partner in 1996. Prior to that, he was associated with the law firm Rosenman & Colin LLP.
Vinu Thomas has served as Chief Technology Officer of the Company since February 2016 and is responsible for guiding Presidio’s technology strategy, solution and service offerings, vendor and product management and industry thought leadership. He has built Presidio’s technology teams around networking, mobility, data center and collaboration, while also working on strategic initiatives and investments that include cloud, cyber security, data analytics and virtual desktop infrastructure (VDU). He was previously Vice President of Solutions for our Tristate Area and has a total of 20 years of experience in systems integration, practice building and engineering.
Directors
The Company’s Board of Directors has nine members.
Giovanni Visentin currently serves as the Chairman of the Board of Directors of the Company. He is also the Executive Chairman and Chief Executive Officer of Novitex Enterprise Solutions (“Novitex”). In his role, he is responsible for developing and overseeing the corporate direction and strategy for the company. He was named CEO in October 2013 following the acquisition of Pitney Bowes Management Services by funds affiliated with Apollo Global Management. Before Novitex, he was Executive Vice President and General Manager of HP Enterprise Services, which was responsible for developing and selling technology infrastructure, applications and business services to clients. Prior to HP, he worked at IBM, where he most recently served as General Manager of Integrated Technology Services for North America. He graduated from Concordia University in Montreal, Canada, with a Bachelor of Commerce. He is fluent in English, Italian and French. Mr. Visentin’s extensive experience in business qualifies him to serve on our Board of Directors. Mr. Visentin joined the Board of Directors on February 2, 2015.
Robert Cagnazzi has served as the Chief Executive Officer of the Company since February 29, 2012.
Previously, he founded Bluewater Communications LLC in 2006 and served as Chief Executive Officer until the
company was acquired by Presidio in 2012. Prior to that, he served as Chief Executive Officer of North America at Dimension Data Holdings PLC from 2001 to 2006. Mr. Cagnazzi’s experience as our Chief Executive Officer qualifies him to serve on our Board of Directors. Mr. Cagnazzi joined the board of directors of Predecessor on February 29, 2012, in connection with Predecessor’s acquisition of Bluewater Communications LLC, and continued as a member of the Board of Directors following the Presidio Acquisition on February 12, 2015.
Christopher L. Edson is currently a principal at Apollo Global Management, which he joined in 2008. From 2005 to 2008, Mr. Edson was a member of the Financial Institutions Investment Banking Group of Goldman Sachs in both New York and Chicago. Mr. Edson serves on several boards of directors, including Presidio Holdings Inc., MidCap Financial Holdings, LLC, Diamond Resorts International, Inc., Novitex Holdings, Inc. and Regional Care Hospital Partners Holdings, Inc. During the past five years, Mr. Edson has also served as a director of Athene Group, Ltd., and SourceHOV Holdings, Inc. Mr. Edson graduated with a B.S. in Finance from Indiana University. Between his work at Apollo and his prior experience in investment banking, Mr. Edson has approximately 12 years of experience analyzing, financing and investing in public and private companies. Mr. Edson’s extensive experience in business and finance qualifies him to serve on our Board of Directors. Mr. Edson joined the board of directors of Successor upon its formation on November 20, 2014, and continued as a member of the Board of Directors following the Presidio Acquisition on February 2, 2015.
Salim Hirji is an associate at Apollo Global Management, LLC having joined Apollo in 2013. Prior to that time, Mr. Hirji was a member of the Financial Institutions Investment Banking Group of Goldman, Sachs & Co. Mr. Hirji graduated summa cum laude with a B.A. in Economics and Political Science from Columbia
152
Table of Contents
University. Between his work at Apollo and his prior experience in investment banking, Mr. Hirji has approximately 6 years of experience analyzing, financing, and investing in public and private companies. Mr. Hirji’s extensive experience in business and finance qualify him to serve on our Board. Mr. Hirji joined the Board of Directors on February 10, 2017.
Dr. Steven Lerner joined Presidio as a director in 2017. Dr. Lerner is a director of Yadkin Bank and Yadkin Financial Corporation, which he joined as a director in July 2014 following the merger of VantageSouth Bancshares, Inc. and Piedmont Community Bank Holdings, Inc. with Yadkin Financial Corporation. Prior to the merger, Dr. Lerner served as a director of VantageSouth Bancshares, Inc. since November 2011, and as Vice Chairman of Piedmont Community Bank Holdings, Inc. since he co-founded the company in 2009. He has served as the Chairman of FGI Research, a provider of online market research services, since he founded the company in 1981. From 2000-2012, Dr. Lerner served as Chairman of Capstrat, Inc., a strategic marketing communication firm, and he was Chairman of Yankelovich, Inc., a consumer research firm, from 2000-2008. Dr. Lerner has spent the last 30 years helping small and medium sized businesses maximize their potential. He has been involved in the formation of a number of companies including Blue Hill Group, and Sterling Cellular prior to its sale in 1993. Dr. Lerner serves on the board of advisors of Bandwidth.com, a provider of next generation communications services. Dr. Lerner served as a member of the University of North Carolina at Chapel Hill board of trustees until July 2015. Dr. Lerner’s extensive business experience, as well as his extensive experience in the information technology sector, qualify him to serve on our Board of Directors. Dr. Lerner served on the board of directors of Predecessor from March 2012 until the Presidio Acquisition, and joined the Company’s Board of Directors on February 10, 2017.
Matthew H. Nord is a Senior Partner at Apollo, having joined in 2003. Prior to that time, Mr. Nord was a member of the Investment Banking division of Salomon Smith Barney Inc. Mr. Nord serves on the boards of directors of ADT, Presidio, Inc., Novitex Enterprise Solutions and RegionalCare Hospital Partners. Mr. Nord also serves on the Board of Trustees of Montefiore Health System and on the Board of Overseers of the University of Pennsylvania’s School of Design. Mr. Nord previously served on the boards of directors of Affinion Group, Constellium NV, EVERTEC, Hughes Telematics, MidCap Financial, Mobile Satellite Ventures, Noranda Aluminum and SourceHOV. Mr. Nord graduated summa cum laude with a BS in Economics from the University of Pennsylvania’s Wharton School of Business. Between his work at Apollo and his prior experience in investment banking, Mr. Nord has extensive experience analyzing, financing and investing in public and private companies, which qualifies him to serve on our Board of Directors. Mr. Nord joined the board of directors of Successor upon its formation on November 20, 2014, and continued as a member of the Board of Directors following the Presidio Acquisition on February 2, 2015.
Pankaj Patel served as Executive Vice President and Chief Development Officer at Cisco Systems, Inc., a worldwide leader in IT, from June 2012 to July 2016, creating solutions built on intelligent networks that were designed to solve customers’ challenges. Mr. Patel served as executive advisor to the CEO from July 31, 2016 until his retirement on October 28, 2016. Mr. Patel reported to the CEO as the Engineering head of the company’s product and solution portfolio and drove the business and technology strategy across Cisco’s Routing, Switching, Wireless, Security, Mobility, Video, Collaboration, Data Center and Cloud offerings, where his responsibilities included defining priorities and investment allocation of research and development funds. Prior to Cisco, Mr. Patel launched and ran a successful startup business. Mr. Patel’s extensive business experience, as well as his extensive experience in the North American IT market, qualify him to serve on our Board of Directors. Mr. Patel joined the Board of Directors on May 19, 2016.
Todd H. Siegel was appointed Chief Executive Officer of Affinion Group Holdings, Inc. and a director of Affinion Group Holdings, Inc. (“Affinion”) as of September 20, 2012. Mr. Siegel was formerly Chief Financial Officer of Affinion from November 2008 to September 2012 and served as an Executive Vice President from October 17, 2005. Mr. Siegel also served as General Counsel of Affinion from October 17, 2005 to February 16, 2009. Mr. Siegel joined Affinion in November 1999 as a member of the Legal Department of the Membership Division of Cendant. Before that, he served as General Counsel of Trilegiant starting in July 2003
153
Table of Contents
and Cendant Marketing Group starting in January 2004. From 1997 to 1999, Mr. Siegel was a corporate associate at Skadden, Arps, Slate, Meagher and Flom, LLP. From 1992 until 1994, he was employed as a certified public accountant with Ernst & Young. Mr. Siegel’s extensive experience in business and finance qualifies him to serve on our Board of Directors. Mr. Siegel joined the Board of Directors on February 2, 2015.
Joseph Trost has served as the Chief Operating Officer of Novitex Enterprise Solutions since October 2013. His focus is on enhancing the customer experience and optimizing operational efficiency. He has previously held several management positions at IBM and most recently served as the Vice President for ITS Service Delivery from June 2011. He graduated summa cum laude from Marist College and holds a Bachelor of Science degree in Business Administration. Mr. Trost’s extensive experience in business qualifies him to serve on our Board of Directors. Mr. Trost joined the Board of Directors on February 2, 2015.
Composition of Board of Directors
Upon completion of this Offering, we expect that our Board of Directors will have nine directors. We intend to avail ourselves of the “controlled company” exception under the NASDAQ rules, which eliminates the requirements that we have a majority of independent directors on our board of directors and that we have Compensation and Nominating and Corporate Governance Committees composed entirely of independent directors. We will be required, however, to have an Audit Committee with one independent director during the 90-day period beginning on the date of effectiveness of the registration statement filed with the SEC in connection with this Offering and of which this prospectus is part. After such 90-day period and until one year from the date of effectiveness of the registration statement, we will be required to have a majority of independent directors on our Audit Committee. Thereafter, we will be required to have an Audit Committee composed entirely of independent directors.
Our Board of Directors has determined that each of Pankaj Patel, Dr. Steven Lerner and Todd H. Siegel is “independent” under the rules of the NASDAQ. Our Board of Directors has also determined that each of Dr. Steven Lerner and Todd H. Siegel satisfies the independence standards for the Audit Committee established by the SEC and the rules of the NASDAQ.
If at any time we cease to be a “controlled company” under the NASDAQ rules, the Board of Directors will take all action necessary to comply with the NASDAQ rules, including appointing a majority of independent directors to the Board of Directors and establishing certain committees composed entirely of independent directors, subject to a permitted “phase-in” period.
Upon completion of this Offering, we intend to divide our Board of Directors into three classes. The members of each class will serve staggered, three-year terms (other than with respect to the initial terms of the Class I and Class II directors, which will be one and two years, respectively). Upon the expiration of the term of a class of directors, directors in that class will be elected for three-year terms at the annual meeting of stockholders in the year in which their term expires. Upon consummation of this Offering:
| • | Giovanni Visentin, Todd H. Siegel and Joseph Trost will be Class I directors, whose initial terms will expire at the 2017 annual meeting of stockholders; |
| • | Christopher L. Edson, Salim Hirji and Dr. Steven Lerner will be Class II directors, whose initial terms will expire at the 2018 annual meeting of stockholders; and |
| • | Robert Cagnazzi, Matthew H. Nord and Pankaj Patel will be Class III directors, whose initial terms will expire at the 2019 annual meeting of stockholders. |
Any additional directorships resulting from an increase in the number of directors will be distributed among the three classes so that, as nearly as possible, each class will consist of one-third of our directors. This classification of our Board of Directors may have the effect of delaying or preventing changes in control.
154
Table of Contents
At each annual meeting following completion of this Offering, our stockholders will elect the successors to our directors. Our executive officers and key employees serve at the discretion of our Board of Directors. Directors may be removed only for cause and then by the affirmative vote of a majority of the voting power entitled to vote for the election of directors.
Board Committees
Our Board of Directors has a Compensation Committee, an Innovation and Technology Committee, an Audit Committee, a Nominating and Corporate Governance Committee and an Executive Committee. The charters for each of our committees will be available, free of charge, on our website, http://www.Presidio.com.
Audit Committee
Upon completion of this Offering, our Audit Committee will consist of Joseph Trost, Todd H. Siegel, Christopher L. Edson and Dr. Steven Lerner. Our Board of Directors has determined that each of Dr. Steven Lerner and Todd H. Siegel satisfies the requirements for independence and financial literacy under the rules and regulations of the NASDAQ and the SEC. Our Board of Directors has also determined that Todd H. Siegel qualifies as an Audit Committee financial expert as defined under SEC rules and regulations and satisfies the financial sophistication requirements of the NASDAQ.
The principal duties and responsibilities of our Audit Committee are to oversee and monitor the following:
| • | the annual appointment of auditors, including the independence, qualifications and performance of our auditors and the scope of audit and non-audit assignments and related fees; |
| • | the accounting principles we use in financial reporting; |
| • | our financial reporting process and internal auditing and control procedures; |
| • | our risk management policies; |
| • | the integrity of our financial statements; and |
| • | our compliance with legal, ethical and regulatory matters. |
Compensation Committee
Upon completion of this Offering, our Compensation Committee will consist of Robert Cagnazzi, Matthew H. Nord and Christopher L. Edson. The principal duties and responsibilities of our Compensation Committee are the following:
| • | approval and recommendation to our Board of Directors of all compensation plans for our CEO, all of our employees and those of our subsidiaries who report directly to the CEO and other executive officers, as well as all compensation for our Board of Directors; |
| • | approval and authorization of grants under our or our subsidiaries’ incentive plans, including all equity plans and long-term incentive plans; and |
| • | the preparation of any report on executive compensation required by SEC rules and regulations, if any. |
155
Table of Contents
Innovation and Technology Committee
Upon completion of this Offering, our Innovation and Technology Committee will consist of Giovanni Visentin, Pankaj Patel and Joseph Trost. The principal duties and responsibilities of our Innovation and Technology Committee are the following:
| • | To review and make recommendations to the Board on major strategies and other subjects relating to: |
| • | the Company’s approach to technical and commercial innovation; |
| • | the long-term strategic goals of the Company’s internal and commercial technology investments; |
| • | the Company’s technology position in a competitive environment; |
| • | the innovation and technology acquisition process to assure accelerated business growth and response to emerging technology threats and opportunities through contracts, grants, collaborative efforts, strategic alliances, mergers and acquisitions; |
| • | the management and leverage of intellectual property; |
| • | the formal projects and actions being taken to drive and enable technology innovation; and |
| • | measurement and tracking systems important to successful innovation. |
Nominating and Corporate Governance Committee
Prior to the completion of this Offering, our Board of Directors will appoint Robert Cagnazzi, Christopher Edson and Matthew H. Nord to serve on the Nominating and Corporate Governance Committee. The principal duties and responsibilities of our Nominating and Corporate Governance Committee will be the following:
| • | implementation and review of criteria for membership on our Board of Directors and its committees; |
| • | recommendation of proposed nominees for election to our Board of Directors and membership on its committees; and |
| • | recommendations to our Board of Directors regarding governance and related matters. |
Executive Committee
Upon completion of this Offering, our Executive Committee will consist of Matthew H. Nord, Christopher L. Edson and Robert Cagnazzi. The Executive Committee generally may exercise all of the powers of the Board of Directors when the Board of Directors is not in session, other than (1) approving any action that, pursuant to applicable law, would require the submission to stockholders of such action for stockholder approval, (2) the declaration of dividends, (3) the creation or filling of vacancies on the Board of Directors, (4) the adoption, amendment or repeal of the Amended Bylaws, (5) the amendment or repeal of any resolution of the Board of Directors that by its terms limits amendment or repeal exclusively to the Board of Directors, (6) any action where the Amended Certificate, the Amended Bylaws, the listing standards of the NASDAQ or applicable law require participation by the full Board of Directors or another committee of the Board of Directors, (7) the
156
Table of Contents
issuance of debt or equity securities in excess of $75 million and (8) the filing by the Company of a voluntary petition seeking to take advantage of any bankruptcy, reorganization, insolvency, readjustment of debt, dissolution or liquidation law or statute.
Compensation Committee Interlocks and Insider Participation
During the fiscal year ended June 30, 2016, our compensation committee consisted of Matthew Nord, Christopher L. Edson and Robert Cagnazzi. Mr. Cagnazzi serves as our Chief Executive Officer. None of the other members of our compensation committee serves or has served as one of our officers or employees. During the fiscal year ended June 30, 2016, none of our executive officers served as a member of the board of directors or compensation committee, or other committee serving an equivalent function, of any entity that has one or more executive officers who serve as members of our board of directors or our compensation committee.
During the fiscal year ended June 30, 2016, none of our executive officers served as members of the board of directors, or compensation committee or other committee serving an equivalent function of entities that had one or more executive officers who serve as members of our board of directors or our Compensation Committee.
Code of Ethics
We have a Code of Business Conduct and Ethics that applies to all employees, including our Chief Executive Officer and senior financial officers. These standards are designed to deter wrongdoing and to promote the highest ethical, moral and legal conduct of all employees. Our Code of Business Conduct and Ethics is posted on our website and can be obtained, free of charge, at our Corporate Headquarters in our Human Resources Department.
157
Table of Contents
COMPENSATION DISCUSSION AND ANALYSIS
This Compensation Discussion and Analysis provides information regarding the objectives and elements of our compensation philosophy, policies, and practices with respect to the compensation of our principal executive officer, our principal financial officer, and our three other most highly compensated executive officers, whom we collectively refer to as our “named executive officers,” for our fiscal year ended June 30, 2016, which we refer to as “fiscal 2016.” Our named executive officers for fiscal 2016 were:
| • | Robert Cagnazzi, our Chief Executive Officer; |
| • | Paul Fletcher, our Executive Vice President and Chief Financial Officer; |
| • | David Hart, our Executive Vice President and Chief Operating Officer; |
| • | Elliot Brecher, our Senior Vice President and General Counsel (who commenced employment with the Company on July 27, 2015); and |
| • | Vinu Thomas, our Chief Technology Officer (who commenced serving as an executive officer on February 1, 2016). |
Compensation Philosophy and Objectives
Upon completion of this Offering, the Compensation Committee of our Board of Directors will review and approve the compensation of our named executive officers and oversee and administer our executive compensation programs and initiatives. As we gain experience as a public company, we expect that the specific direction, emphasis, and components of our executive compensation program will continue to evolve. Accordingly, the compensation paid to our named executive officers during fiscal 2016 is not necessarily indicative of how we will compensate our named executive officers after this Offering.
We have strived to create an executive compensation program that balances short- and long-term payments and awards, cash payments and equity awards, and fixed and contingent payments, and that rewards our named executive officers in ways that we believe are most appropriate to motivate them. Our executive compensation program is designed to:
| • | attract and retain talented and experienced executives in our industry; |
| • | reward executives whose knowledge, skills, and performance are critical to our success; |
| • | align the interests of our executives and stockholders by motivating executives to increase stockholder value and rewarding executives when stockholder value increases; |
| • | ensure fairness among the executive management team by recognizing the contributions each executive makes to our success; |
| • | foster a shared commitment among executives by aligning their individual goals with the goals of the executive management team and the Company; and |
| • | compensate our executives in a manner that incentivizes them to manage our business to meet our long-range objectives. |
To achieve these objectives, we expect to implement new compensation plans and maintain our current compensation plans to tie a substantial portion of the executives’ overall compensation to key strategic financial and operational goals. We seek to ensure that all incentives are aligned with our stated compensation philosophy of providing compensation commensurate with performance.
158
Table of Contents
Setting Compensation
Role of Our Board of Directors, Compensation Committee, and Named Executive Officers
Prior to this Offering, we were a privately held company. As a result, most, if not all, of our prior compensation policies and determinations, including those made for fiscal 2016, have been the product of negotiations between the named executive officers and our Board of Directors.
Following the completion of this Offering, the Compensation Committee will oversee and administer our executive compensation arrangements, including the Presidio, Inc. Amended and Restated 2015 Long-Term Incentive Plan (which we refer to as our “2015 Plan”), the Presidio, Inc. 2017 Long-Term Incentive Plan (which we refer to as our “2017 Plan”), and our Presidio, Inc. Executive Bonus Plan (which we refer to as our “Bonus Plan”). The 2015 Plan is described in the section of this prospectus entitled “—Elements of Compensation—Long-Term Equity-Based Compensation,” and the 2017 Plan and the Bonus Plan are described in the section of this prospectus titled “—Compensation Program Following the Offering.”
The Compensation Committee (excluding Mr. Cagnazzi) will meet outside the presence of all of our executive officers, including our named executive officers, to consider appropriate compensation for our Chief Executive Officer. For all other named executive officers, the Compensation Committee will meet outside the presence of all executive officers, except our Chief Executive Officer. We expect that following this Offering, our Chief Executive Officer will review annually each other named executive officer’s performance with the Compensation Committee and recommend appropriate base salary, cash performance awards and grants of long-term equity incentive awards for all other executive officers. Based upon the recommendations of our Chief Executive Officer and in consideration of the principles and objectives described above, the Compensation Committee will approve the annual compensation packages of our named executive officers other than our Chief Executive Officer. We also expect that the Compensation Committee will annually analyze our Chief Executive Officer’s performance and determine his base salary, cash performance awards, and grants of long-term equity incentive awards based on its assessment of his performance with input from any consultants engaged by the Compensation Committee.
Role of Compensation Consultant
We did not engage a compensation consultant in determining pay actions in advance of fiscal 2016. In March 2016, however, we hired Semler Brossy Consulting Group, LLC to assist with an evaluation of our current compensation practices in anticipation of this Offering, to identify a peer group for the Company, and to assess our pay levels relative to our peer group.
Benchmarking
The Board of Directors does not currently use benchmarking or peer group analysis in making compensation decisions. Following the completion of this Offering, however, our Compensation Committee intends to use peer group analysis to assess competitive pay levels and, as described above, we have engaged Semler Brossy Consulting Group, LLC to assist with this analysis.
Risk Management
We have determined that any risks arising from our compensation programs and policies are not reasonably likely to have a material adverse effect on the Company. The Company’s compensation programs and policies mitigate risk by combining performance-based, long-term compensation elements with payouts that are highly correlated to the value delivered to stockholders. The combination of performance measures for annual bonuses and the equity compensation programs for executive officers, as well as the multiyear vesting schedules for equity awards and certain cash bonuses, encourages employees to maintain both a short- and a long-term view with respect to Company performance.
159
Table of Contents
Elements of Compensation
Our current executive compensation program consists of the following components:
| • | base salary; |
| • | annual cash incentive awards linked to our overall performance; |
| • | long-term equity-based compensation; |
| • | other executive benefits and perquisites; and |
| • | employment agreements, which contain severance benefits. |
In fiscal 2016, we also provided certain of our named executive officers with discretionary annual bonuses and discretionary bonuses related to the completion of certain acquisition and disposition transactions.
We combine these elements to formulate compensation packages that provide competitive pay, reward the achievement of financial, operational, and strategic objectives, and align the interests of our executive officers and other senior personnel with those of our stockholders.
Base Salary
Our named executive officers’ base salaries depend on their position within the Company and its subsidiaries, the scope of their responsibilities, the period during which they have been performing those responsibilities, and their overall performance. Base salaries are reviewed annually and are generally adjusted from time to time to realign salaries with market levels after taking into account individual responsibilities, performance, and experience.
Annual Cash Incentive Awards
Our named executive officers are hired to lead and grow our organization and as such we believe that a significant portion of our named executive officers’ compensation should be tied to our overall performance. We maintain an annual incentive cash bonus program for senior management (which we refer to as the “management incentive plan”), which emphasizes pay-for-performance by providing our named executive officers with the opportunity to earn an annual bonus based on company and individual performance goals established by our Board of Directors with respect to each fiscal year.
For fiscal 2016, our Board of Directors established company performance goals relating to revenue, EBITDA, and EBITDA margin, as measured on a quarterly basis. In addition, for Messrs. Fletcher, Hart, and Brecher, the Board of Directors also established individual performance goals. Mr. Thomas was not a participant in our management incentive plan during fiscal 2016, as he did not commence serving as an executive officer until February 2016.
For each of our named executive officers (other than Mr. Thomas), the target and maximum bonus opportunity under our management incentive plan, as well as the portion of their annual bonus attributable to company and individual performance goals is set forth below.
| Name |
Target Bonus ($) |
Maximum Bonus ($) |
Company Performance (%) |
Individual Performance (%) |
||||||||||||
| Robert Cagnazzi |
600,000 | 1,416,000 | 100 | — | ||||||||||||
| Paul Fletcher |
390,000 | 735,000 | 65 | 35 | ||||||||||||
| David Hart |
300,000 | 504,000 | 50 | 50 | ||||||||||||
| Elliot Brecher |
97,500 | 124,000 | 20 | 80 | ||||||||||||
160
Table of Contents
For fiscal 2016, the company performance component for each named executive officer (other than Mr. Thomas) consisted of the following metrics: revenue, which was weighted at 40%; EBITDA, which was weighted at 48%; and EBITDA margin, which was weighted at 12%. Based on our results for fiscal 2016, our Board of Directors determined that company performance was achieved at 45.9% of target. In addition, our Board of Directors determined that for Messrs. Fletcher, Hart, and Brecher, individual performance goals were satisfied at 100% of target, 62.5% of target, and 100% of target, respectively.
Based on the applicable levels of achievement described above, payments to our named executive officers (other than Mr. Thomas) under the management incentive plan for fiscal 2016 were as follows:
| Name | Target Bonus (Company Goals) ($) |
Actual Bonus (Company Goals) ($) |
Target Bonus (Individual Goals) ($) |
Actual Bonus (Individual Goals) ($) |
Total Actual Bonus ($) |
|||||||||||||||
| Robert Cagnazzi |
600,000 | 275,296 | — | — | 275,296 | |||||||||||||||
| Paul Fletcher |
253,500 | 116,313 | 136,500 | 136,500 | 252,813 | |||||||||||||||
| David Hart |
150,000 | 68,824 | 150,000 | 93,750 | 162,574 | |||||||||||||||
| Elliot Brecher |
19,500 | 8,947 | 78,000 | 78,000 | 86,947 | |||||||||||||||
The annual bonus for Mr. Thomas was determined based on a holistic evaluation of his performance during fiscal 2016. For fiscal 2016, the Company determined the annual bonus payable to Mr. Thomas to be $70,000.
In addition to the bonuses payable under the management incentive plan, our Board of Directors also determined that Messrs. Cagnazzi, Fletcher, Hart, and Brecher should be awarded discretionary bonuses for fiscal 2016 based on the Board of Director’s overall assessment of the Company’s performance during the fiscal year. The incremental discretionary annual bonuses awarded to such named executive officers were as follows: Mr. Cagnazzi—$123,335; Mr. Fletcher—$73,234; Mr. Hart—$43,334; and Mr. Brecher—$5,634.
Long-Term Equity-Based Compensation
Our Board of Directors believes that equity-based compensation is an important component of our executive compensation program and that providing a significant portion of our executive officers’ total compensation package in equity-based compensation aligns the incentives of our executives with the interests of our stockholders and with our long-term corporate success. Additionally, our Board of Directors believes that equity-based compensation awards enable us to attract, motivate, retain, and adequately compensate executive talent.
To that end, we have awarded equity-based compensation in the form of stock options to align our executives’ interests with the interests of our stockholders. Our Board of Directors believe equity awards provide executives with a significant long-term interest in our success by rewarding the creation of stockholder value over time.
2015 Plan
In connection with the closing of the Presidio Acquisition, we adopted the 2015 Plan, which permits us to grant stock options, rights to purchase shares, restricted stock, restricted stock units, and other stock-based rights to employees and directors of, or consultants to, us or any of our subsidiaries. The 2015 Plan is administered by our Board of Directors or by the Compensation Committee. Under the 2015 Plan, shares of our common stock were reserved for issuance as of , 2017 (as adjusted to reflect the Stock Split). Prior to the completion of this Offering, we intend to amend and restate the 2015 Plan to provide that, among other things, no additional awards will be granted under the 2015 Plan following consummation of this Offering.
161
Table of Contents
As discussed below, we have awarded stock options to members of our management, including our named executive officers. Our Board of Directors, however, has not established any formal program or practice regarding the amount or timing of equity award grants to our employees. Under the 2015 Plan, the exercise price for option awards will not be less than the fair market value of our common stock on the date of grant. After the consummation of this Offering, we expect that the fair market value of a share of our common stock will be determined for this purpose by reference to the public trading price of a share of our common stock on the date of grant of the option (e.g., using a weighted average or closing price).
Our Board of Directors believes that the granting of awards under the 2015 Plan promotes, on a short- and long-term basis, an enhanced personal interest for our executives and an alignment of those interests with the goals and strategies of the Company and the interests of our stockholders. The Compensation Committee also believes that the equity grants provide not only financial rewards to such executives for achieving company goals but also provide additional incentives for executives to remain with the Company.
In connection with the closing of the Presidio Acquisition, Messrs. Cagnazzi, Fletcher, and Hart were each granted stock options under our 2015 Plan. The exercise price per share of common stock subject to these options was $10.00 (or $ , as adjusted to reflect the Stock Split) on the date of grant, the same price as paid by Apollo in connection with the Presidio Acquisition. Mr. Brecher was granted stock options under our 2015 Plan in October 2015 in connection with his commencement of employment with the Company, which had an exercise price per share of $12.58 (or $ , as adjusted to reflect the Stock Split), and Mr. Thomas was granted options under our 2015 Plan in February 2016 in connection with his promotion to the position of Chief Technology Officer, which had an exercise price per share of $17.50 (or $ , as adjusted to reflect the Stock Split).
Generally, one-half of the options granted under our 2015 Plan are subject to time-based vesting criteria and one-half of the options are subject to specified performance- and market-based vesting criteria. Specifically, the time-based options will vest in five equal installments on each of the first five anniversaries of the grant date, subject to the executive’s continued service. The time-based options will also fully vest on a change in control transaction. The performance- and market-based options are divided into two equal tranches that vest based upon the achievement of certain targets related to multiple of invested capital received by funds managed by Apollo with respect to its investment in the Company, subject to the executive’s continued service. Upon a change in control, any performance- and market-based options that have not vested prior to, and do not vest upon, such change in control, will be converted into time-based options that vest in equal annual installments on each anniversary of the change in control during the remainder of the option term, subject to the executive’s continued service.
The maximum term of these options is ten years following the date of grant. Subject to certain exceptions set forth in the applicable award agreement, unvested options will automatically expire upon the date of a grantee’s termination of employment. Vested options will generally expire one year following the termination of a grantee’s employment due to death or disability and 90 days following the termination of a grantee’s employment for any other reason (other than for cause). All options (vested and unvested) will be forfeited upon a termination of the grantee’s employment for cause.
The combination of time-based and performance- and market-based vesting of the options is designed to compensate executives for long-term commitment to us, while motivating sustained increases in our financial performance and helping ensure the stockholders have received an appropriate return on their invested capital.
Shares of Company common stock acquired under the 2015 Plan are subject to registration and repurchase rights set forth in a stockholders agreement. In connection with this Offering, we will enter into the Amended Management Stockholders Agreement to remove certain restrictions on repurchase rights and certain restrictions on transfer rights that automatically terminated upon a qualified initial public offering. See “Certain Relationships and Related Party Transactions—Amended Management Stockholders Agreement.”
162
Table of Contents
2017 Plan
Prior to the completion of this Offering, we intend to adopt the 2017 Plan, which will be a long-term incentive plan that is a more suitable plan for a public company. Following the adoption of the 2017 Plan, no additional grants will be made under our 2015 Plan.
Initial Option Grants
Upon the completion of this Offering, we intend to grant option grants under the 2017 Plan to certain employees, including certain named executive officers, with a grant date fair value of approximately $10 million. The terms of such initial option grants to certain named executive offers are expected to be as follows:
| • | The options will vest in four equal installments on each of the first four anniversaries of the grant date, subject to the named executive officer’s continued service through such vesting date. |
| • | Upon a termination without cause, a resignation with good reason, or a termination of employment due to death and disability, any options that would have become vested within two years of the named executive officer’s termination of employment will vest. |
| • | Upon the named executive officer’s retirement, the named executive officer will become vested such that the total number of options that are vested is equal to the excess, if any, of (1) the product of (a) the total number of shares subject to the option award, multiplied by (b) a fraction, the numerator of which is the number of days between the grant date and the date of retirement and the denominator of which is the number of days between the grant date and the fourth anniversary of the grant date, over (2) any options previously exercised by the named executive officer prior to his retirement. |
| • | Vested options will be forfeited upon a termination without cause, remain exercisable for one year following the named executive officer’s death or disability, remain exercisable for three years upon the named executive officer’s retirement, and remain exercisable for 90 days following any other termination of employment. |
| • | In the event of a change in control in which the acquiror of the Company assumes the options, the options will vest in full upon a termination without cause, resignation for good reason, death or disability during the two years following a change in control. |
Employment Agreements
As described below under “—Employment Agreements with Named Executive Officers,” we have entered into employment agreements and offer letters with each of our named executive officers. Prior to the completion of this Offering, we intend to enter into employment agreements with certain named executive officers that will supersede their employment agreements and offer letters that are currently in effect (which new employment agreements we refer to as “2017 employment agreements”). Pursuant to the 2017 employment agreements, certain named executive officers will be eligible to receive severance payments that are triggered by an involuntary termination of employment under certain specified circumstances. Our current offer letters and employment agreements, and our 2017 employment agreements, are designed to encourage and reinforce the continued attention and dedication of our named executive officers to their assigned duties without undue concern regarding their job security.
163
Table of Contents
Limited Benefits and Perquisites
We provide the following benefits to our executive officers on the same basis as other eligible employees:
| • | health, dental, vision, life, and disability insurance; |
| • | a qualified 401(k) savings plan (which includes a fixed matching contribution equal to 25% of the employee’s elective deferrals on up to 6% of compensation, and which permits the Company to make an additional discretionary matching contribution, in each case, subject to limitations under the Internal Revenue Code of 1986, as amended (the “Code”)); and |
| • | vacation, personal holidays, and sick days. |
We believe these benefits are generally consistent with those offered by other companies and specifically with those companies with which we compete for employees.
Transaction-Related Bonuses
In connection with the closings of the Netech Acquisition, the Sequoia acquisition, and the disposition of the Atlantix business, we paid certain of our named executive officers discretionary transaction bonuses to reward their extraordinary efforts related to such transactions. Messrs. Cagnazzi and Fletcher were each awarded transaction bonuses of $280,000 and Messrs. Hart and Brecher were each awarded transaction bonuses of $140,000.
In addition, certain of our executive officers also received transaction-related amounts during fiscal 2016 in respect of certain equity that they had previously held in the Predecessor and certain equity-based programs of the Predecessor in which they participated prior to the closing of the Presidio Acquisition as follows: Mr. Cagnazzi—$181,136; Mr. Fletcher—$207,843; Mr. Hart—$84,933; and Mr. Thomas—$4,595.
Stay Bonuses
In connection with the Presidio Acquisition, in March 2015, we granted certain named executive officers retention bonuses (referred to as “stay bonuses”) to promote retention and facilitate a smooth transition. Messrs. Fletcher and Hart are each eligible to earn a stay bonus in the amount of $270,000, and the stay bonuses vest as follows:
| • | 50% will vest on the earlier of (a) August 2, 2017 and (b) the date on which a qualified public offering or change in control (each as defined in the applicable stay bonus agreement) occurs, subject to the named executive officer’s continued employment through such date; but if the named executive officer is terminated without cause prior to either such date, such portion of the stay bonus will vest on the termination date and be paid on the earlier of (i) August 2, 2017 and (ii) the date of a change in control of the Company. |
| • | 50% will vest on the date on which a qualified public offering or change in control occurs, subject to the named executive officer’s continued employment through such date; but if the named executive officer is terminated without cause prior to such date, such portion of the stay bonus will vest on the termination date and be paid on a change in control of the Company or qualified public offering, so long as either such event occurs before February 2, 2025. |
The completion of this Offering will constitute a qualified public offering for purposes of these agreements and accordingly, we expect that the stay bonuses will vest in full and be paid in accordance with their terms at such time. The stay bonus agreements would otherwise expire, to the extent unpaid, on February 2, 2025.
164
Table of Contents
Compensation Program Following this Offering
We believe that, following this Offering, we will have more flexibility in designing compensation programs to attract, motivate, and retain our executives, including permitting us to regularly compensate executives with non-cash compensation reflective of our stock performance in relation to a comparator group in the form of publicly traded equity. Accordingly, as described above, we expect to adopt the 2017 Plan to be a more suitable plan for a public company as described in “—2017 Long-Term Incentive Plan” below, and adopt the Bonus Plan in connection with the Offering as described in “—Executive Bonus Plan” below.
Prior to the completion of this Offering, we also intend to enter into an amended and restated employment agreement with certain named executive officers, the terms of which are described in “—Employment Agreements with Named Executive Officers.” It is also anticipated that our current named executive officers will hold substantially similar positions following this Offering.
While we are still in the process of determining specific details of the compensation program that will take effect following this Offering, it is anticipated that our compensation program following this Offering will be based on the same principles and designed to achieve the same objectives as our current compensation program.
2017 Long-Term Incentive Plan
In connection with the consummation of this Offering, we intend to adopt the 2017 Plan. The following is a description of the material terms of the 2017 Plan.
Purpose
The purposes of the 2017 Plan are to further the growth and success of the Company and to reward and incentivize the outstanding performance of our key employees, directors, consultants, and other service providers by aligning their interests with those of stockholders through equity-based compensation and enhanced opportunities for ownership of shares of our common stock.
Administration
The 2017 Plan will be administered by our Board of Directors and/or the Compensation Committee, or such other committee of our Board of Directors as the Board of Directors may from time to time designate (the committee administering the 2017 Plan is referred to in this section as the “committee”). Among other things, the committee will have the authority to select individuals to whom awards may be granted, to determine the type of awards, to determine the terms and conditions of any such awards, to interpret the terms and provisions of the 2017 Plan and awards granted thereunder, and to otherwise administer the plan.
Eligibility
Persons who serve or agree to serve as employees of, directors of, consultants to, or other service providers of the Company on the date of the grant will be eligible to be granted awards under the 2017 Plan.
Shares Available
Subject to adjustment, the 2017 Plan authorizes the issuance of up to shares of common stock (as adjusted to reflect the Stock Split) pursuant to the grant or exercise of incentive stock options, nonqualified stock options, stock appreciation rights, restricted stock, restricted stock units, and other equity-based awards. The maximum number of shares of common stock that may be delivered pursuant to incentive stock options will be shares of common stock (as adjusted to reflect the Stock Split). In addition, no participant may be granted stock options or stock appreciation rights covering in excess of shares (as adjusted to reflect the Stock Split), restricted stock, restricted stock units, or performance stock units covering in excess of shares (as adjusted to reflect the Stock Split), or other long-term incentive awards covering in excess of
165
Table of Contents
shares (as adjusted to reflect the Stock Split), in each such case, during any given fiscal year of the Company. Furthermore, no non-employee director may be granted awards under the 2017 Plan that have a grant date fair value in excess of $500,000 in any given fiscal year.
If any award is forfeited or if any stock option or stock appreciation right granted under the 2017 Plan terminates without being exercised, or if any shares of common stock are not actually issued pursuant to an equity award granted under the 2017 Plan, shares of common stock subject to such awards will be available for subsequent distribution of awards under the 2017 Plan. If the option price of any stock option granted under the 2017 Plan will be satisfied by delivering shares of common stock to us (by actual delivery or attestation), only the number of shares of common stock issued net of the shares of common stock delivered or attested to will be deemed delivered for purposes of determining the maximum number of shares of common stock available for delivery under the 2017 Plan. To the extent any shares are not delivered to a participant because such shares are used to satisfy any applicable tax-withholding obligation, such shares will not be deemed to have been delivered for purposes of determining the maximum number of shares of common stock available for delivery under the 2017 Plan.
Change in Capitalization or Change in Control
In the event of certain extraordinary corporate transactions, the committee or our Board of Directors may make such substitutions or adjustments as it deems appropriate and equitable to (1) the aggregate number and kind of shares or other securities reserved for issuance and delivery under the 2017 Plan; (2) the various maximum limitations set forth in the 2017 Plan; (3) the number and kind of shares or other securities subject to outstanding awards; and (4) the exercise price of outstanding stock options and stock appreciation rights, among others.
The committee may, in its discretion, provide for the acceleration of vesting or exercisability of awards either (a) upon a change in control of the Company, (b) upon a specified date following a change in control of the Company, or (c) upon specified terminations of employment following a change in control of the Company. The committee may provide for such treatment as a term of an award or may provide for such treatment following the granting of an award.
Types of Awards
As indicated above, several types of awards will be available for grant under the 2017 Plan. A summary of the types of awards available under the 2017 Plan is set forth below.
Stock Options and Stock Appreciation Rights. Stock options granted under the 2017 Plan may either be incentive stock options or nonqualified stock options. Stock appreciation rights granted under the plan may either be granted alone or in tandem with a stock option. The exercise price of stock options and stock appreciation rights cannot be less than 100% of the fair market value of the stock underlying the stock options or stock appreciation rights on the date of grant. Optionees may pay the exercise price in cash or, if approved by the committee, in common stock (valued at its fair market value on the date of exercise) or a combination thereof, or by “cashless exercise” through a broker or by withholding shares otherwise receivable on exercise. The term of stock options and stock appreciation rights will be as determined by the committee, but such awards may not have a term longer than ten years from the date of grant. The committee will determine the vesting and exercise schedule of stock options and stock appreciation rights and the extent to which they will be exercisable after the award holder’s employment terminates. Generally, and subject to the terms of the applicable award agreement, unvested stock options and stock appreciation rights will terminate upon the termination of employment and vested stock options and stock appreciation rights will remain exercisable for 90 days after the award holder’s termination for any other reason. Vested stock options and stock appreciation rights also will terminate upon the award holder’s termination for cause (as defined in the 2017 Plan). Stock options and stock appreciation rights are transferable only by will or by the laws of descent and distribution, or pursuant to a qualified domestic
166
Table of Contents
relations order or, in the case of nonqualified stock options or stock appreciation rights, as otherwise expressly permitted by the committee including, if so permitted, pursuant to a transfer to the participant’s family members, to a charitable organization, whether directly or indirectly, or by means of a trust or partnership or otherwise.
Restricted Stock. Restricted stock may be granted with such restriction periods as the committee may designate. The committee may provide at the time of grant that the vesting of restricted stock will be contingent upon the achievement of applicable performance goals and/or continued service. The terms and conditions of restricted stock awards (including any applicable performance goals) need not be the same with respect to each participant. During the restriction period, the committee may require that the stock certificates evidencing restricted shares be held by the Company. Restricted stock may not be sold, assigned, transferred, pledged, or otherwise encumbered, and will be forfeited upon termination of employment, unless otherwise provided by the committee. Other than such restrictions on transfer and any other restrictions the committee may impose, the participant will have all the rights of a stockholder with respect to the restricted stock award.
Restricted Stock Units. The committee may grant restricted stock units payable in cash or shares of our common stock, conditioned upon continued service and/or the attainment of performance goals determined by the committee. The terms and conditions of restricted stock unit awards (including any applicable performance goals) need not be the same with respect to each participant.
Other Long-Term Incentive Awards. Under the 2017 Plan, the committee will be able to grant other types of equity-based awards based upon our common stock, including unrestricted stock, convertible debentures, and dividend equivalent rights. In addition, the committee may also grant other long-term incentive awards that are solely dollar-denominated, either alone or in conjunction with other awards granted under the 2017 Plan. The maximum value of the property, including cash, that may be paid or distributed to any participant pursuant to a grant of any such long-term incentive award in any one calendar year is $10 million.
Non-Transferability
The 2017 Plan will provide that awards generally will not be assignable or otherwise transferable, except by will, by designation of a beneficiary, by the laws of descent and distribution, or to the extent otherwise permitted by the committee.
Duration of the Plan
We intend that the 2017 Plan will have a term of ten years from the date of its adoption by our Board of Directors.
Amendment and Discontinuance
The Board of Directors may amend, alter, or discontinue the 2017 Plan, but no amendment, alteration, or discontinuance may materially impair the rights of an equity award previously granted under the 2017 Plan without the award holder’s consent. Amendments to the 2017 Plan require stockholder approval to the extent such approval is required by applicable law or the listing standards of any applicable exchange.
Employee Stock Purchase Plan
In connection with the consummation of this Offering, we intend to adopt the Presidio, Inc. Employee Stock Purchase Plan (which we refer to as our “ESPP”). The ESPP will become effective the day before the date that the registration statement of which this prospectus is part is declared effective by the SEC. The ESPP will initially reserve and authorize the issuance of up to a total of shares of our common stock (as adjusted to reflect the Stock Split) to participating employees, with such number of shares subject to adjustment for stock splits, stock dividends, or other changes in our capital stock, and certain corporate transactions. No participant
167
Table of Contents
may purchase more than shares of our common stock (as adjusted to reflect the Stock Split) during any offering period under the ESPP, but in any event, under applicable tax rules, an employee may purchase no more than $25,000 worth of shares of our common stock, valued at the start of the offering period, under the ESPP for each calendar year in which a purchase right is outstanding.
Generally, all of our employees (including those of our consolidated subsidiaries, other than those subsidiaries excluded from participation by our board of directors or our Compensation Committee) who have been employed for at least 90 days are eligible to participate in the ESPP, but no employee may participate in an offering period if the employee owns 5% or more of the total combined voting power or value of our stock or the stock of any of our subsidiaries.
The ESPP permits employees to purchase our common stock through payroll deductions during quarterly offerings periods, with the first offering period beginning April 1, 2017, or during such other offering periods as the Compensation Committee may determine. Participants may authorize payroll deductions of a specific percentage of compensation between 1% and 15%, with such deductions being accumulated for quarterly purchase periods beginning on the first business day of each offering period and ending on the last business day of each offering period.
Under the terms of the ESPP, the purchase price per share will equal 95% of the fair market value of a share of our common stock on the last business day of each offering period, although the Compensation Committee has discretion to change the purchase price with respect to future offering periods. In no event can the purchase price per share be less than the lesser of (a) 85% of the fair market value of a share of our common stock on the first day of the applicable offering period or (b) 85% of the fair market value of a share of our common stock on the last day of the applicable offering period.
The accumulated contributions of any employee who is not a participant in the ESPP on the last day of a purchase period will be refunded. An employee’s rights under the ESPP terminate upon voluntary withdrawal from the plan or when the employee ceases employment with us for any reason.
The ESPP will be administered by the Compensation Committee or a designee of the Compensation Committee. The ESPP may be amended or terminated by our board of directors or the Compensation Committee but may not be amended without prior stockholder approval to the extent required by Section 423 of the Code. The ESPP will automatically terminate on the earlier to occur of the date that the share reserve referenced above is depleted and the 10-year anniversary of the date the ESPP was adopted by our board of directors.
Executive Bonus Plan
In connection with the consummation of this Offering, we intend to adopt the Bonus Plan. The Bonus Plan is intended to provide an incentive for superior work and to motivate eligible executives of the Company toward even greater achievement and business results, to tie their goals and interests to those of ours and our stockholders, and to enable us to attract and retain highly qualified executives. Under the Bonus Plan, we may pay bonuses (including discretionary bonuses) to key executives, including executive officers, based upon such terms and conditions as our Board of Directors or Compensation Committee may in its discretion determine. The Bonus Plan will be administered by our Board of Directors and/or the Compensation Committee. We may amend or terminate the Bonus Plan at any time in our sole discretion. Any amendments to the Bonus Plan will require stockholder approval only to the extent required by applicable law, rule, or regulation.
168
Table of Contents
EXECUTIVE COMPENSATION
Summary Compensation Table for Fiscal 2016
The following summary compensation table sets forth the total compensation paid, awarded to, or earned during fiscal 2016 by our named executive officers.
| Name and Principal |
Year | Salary ($) |
Bonus ($) (1) |
Stock Awards ($) |
Option Awards ($) (2) |
Non-Equity Incentive Plan Compensation ($) (3) |
Change in Pension Value and Nonqualified Deferred Compensation Earnings ($) |
All Other Compensation ($) (4) |
Total ($) |
|||||||||||||||||||||||||||
| Robert Cagnazzi, Chief Executive Officer |
2016 | 600,000 | 584,471 | — | — | 275,296 | — | — | 1,459,767 | |||||||||||||||||||||||||||
| Paul Fletcher, Executive Vice President and Chief Financial Officer |
2016 | 600,000 | 561,077 | — | — | 252,813 | — | 7,875 | 1,421,765 | |||||||||||||||||||||||||||
| David Hart, Executive Vice President and Chief Operating Officer |
2016 | 600,000 | 268,267 | — | — | 162,574 | — | 7,762 | 1,038,602 | |||||||||||||||||||||||||||
| Elliot Brecher, Senior Vice President and General Counsel (5) |
2016 | 293,750 | 145,634 | — | 79,743 | 86,947 | — | 5,850 | 611,924 | |||||||||||||||||||||||||||
| Vinu Thomas, Chief Technology Officer (6) |
2016 | 244,618 | 74,595 | — | 114,912 | — | — | 7,291 | 441,416 | |||||||||||||||||||||||||||
| (1) | The amount included in this column consists of (a) a discretionary bonus paid in connection with the completion of the Netech Acquisition, the Sequoia acquisition and the disposition of the Atlantix business during fiscal 2016 (Mr. Cagnazzi—$280,000; Mr. Fletcher—$280,000; Mr. Hart—$140,000; and Mr. Brecher—$140,000); (b) certain transaction-related amounts payable with respect to the completion of the Presidio Acquisition (Mr. Cagnazzi—$181,136; Mr. Fletcher—$207,843; Mr. Hart—$84,933; and Mr. Thomas—$4,595); and (c) a discretionary bonus paid with respect to fiscal 2016 performance (Mr. Cagnazzi—$123,335; Mr. Fletcher—$73,234; Mr. Hart—$43,334; Mr. Brecher—$5,634; and Mr. Thomas—$70,000). |
| (2) | Represents the aggregate grant date fair values of options granted during fiscal 2016, computed in accordance with FASB ASC Topic 718. For a discussion of valuation assumptions used in calculating the amounts for fiscal 2016, see Note 15 to the historical consolidated financial statements included elsewhere in this prospectus. |
| (3) | Represents the total bonus payments received by each of our named executive officers under their respective incentive plans. See “—Annual Cash Incentive Awards.” |
| (4) | The amount included in the column consists of matching contributions made under the Company’s 401(k) plan. |
169
Table of Contents
| (5) | Mr. Brecher commenced employment with the Company on July 27, 2015. |
| (6) | Mr. Thomas commenced service as an executive officer on February 1, 2016. |
Grants of Plan-Based Awards During Fiscal 2016
The table below provides information regarding equity and non-equity awards granted to the Company’s named executives during fiscal 2016.
| Name |
Grant Date |
Estimated Possible Payouts under Non-Equity Incentive Plan Awards (1) |
All Other Option Awards: Number of Securities underlying Options (#) (2) (3) |
Exercise Price or Base Price of Option Awards ($/Sh) (3) |
Grant Date Fair Value of Stock and Option Awards ($) |
|||||||||||||||||||||||
| Threshold ($) |
Target ($) |
Maximum ($) |
||||||||||||||||||||||||||
| Robert Cagnazzi |
— | 600,000 | 1,416,000 | |||||||||||||||||||||||||
| Paul Fletcher |
— | 390,000 | 735,000 | |||||||||||||||||||||||||
| David Hart |
— | 300,000 | 504,000 | |||||||||||||||||||||||||
| Elliot Brecher |
10/1/2015 | — | 97,500 | 124,000 | 19,873 | 12.58 | 79,743 | |||||||||||||||||||||
| Vinu Thomas |
2/26/2016 | 17,500 | 17.50 | 114,912 | ||||||||||||||||||||||||
| (1) | Amounts represent the minimum, target, and maximum payment level under incentive plan applicable to the particular named executive officer. If threshold level is not attained, no bonus is paid under the applicable incentive plan. |
| (2) | Represents stock options that vest (a) as to 50% of the options, in five equal installments on each of the first five anniversaries of the grant date, and (b) as to 50% of the options, based on the achievement of certain targets related to multiple of invested capital. See “—Long-Term Equity-Based Compensation.” |
| (3) | This data does not currently reflect the Stock Split. After the Stock Split is effected, and before the effectiveness of the registration statement of which this prospectus forms a part, the Registrant will update this data to reflect the Stock Split. |
Employment Agreements with Named Executive Officers
We have entered into employment agreements with each of Messrs. Cagnazzi and Fletcher and offer letters with Messrs. Hart, Brecher and Thomas (referred to herein as “current employment agreements” and “current offer letters,” as applicable).
Each of the current employment agreements remains in effect for a specified term and the current offer letters have no defined term. Mr. Cagnazzi’s current employment agreement is subject to automatic one-year renewals unless either party provides 90 days’ written notice of non-renewal. Mr. Fletcher’s current employment agreement renews for successive 18-month periods on each monthly anniversary of September 30, unless the agreement is earlier terminated by either party.
Pursuant to their respective current employment agreements and offer letters, Messrs. Cagnazzi, Fletcher, Brecher and Thomas are entitled to a base salary and are eligible for participation in the Company’s benefit plans and compensation arrangements made available to employees generally. Messrs. Cagnazzi, Fletcher and Brecher are also eligible to receive a target annual bonus (100%, 50% and 35%, respectively) and Mr. Thomas is eligible to receive a discretionary annual bonus based on performance. The named executive officers currently each receive annual base salaries of $600,000 for each of Messrs. Cagnazzi, Fletcher and Hart, $400,000 for Mr. Thomas and $340,000 for Mr. Brecher. The current employment agreements and offer letters with Messrs. Cagnazzi, Fletcher and Hart also provide for payments and benefits upon certain qualifying terminations of employment, as described in more detail under “—Termination and Change of Control Arrangements” and “—Potential Payments upon Termination or Change in Control in Fiscal 2016.”
As noted in “—Elements of Compensation—Employment Agreements,” prior to the completion of this Offering, we intend to enter into the 2017 employment agreements, which will supersede certain employment
170
Table of Contents
agreements and offer letters that are currently in effect. The 2017 employment agreements will each remain in effect for a three-year term, subject to automatic one-year renewals unless either party provides 90 days’ written notice of non-renewal. In addition, pursuant to the 2017 employment agreements, the applicable named executive officers will be eligible to receive the same annual base salary and target annual bonus as currently in effect. Certain named executive officers will also be entitled to payments and benefits upon certain qualifying terminations of employment under the 2017 employment agreements, as described in more detail under “—Termination and Change in Control Arrangements.”
Outstanding Equity Awards at Fiscal 2016 Year-End
The following table provides information regarding outstanding equity awards held by each of our named executive officers on June 30, 2016.
| Option Awards | ||||||||||||||||
| Name |
Number of Securities Underlying Unexercised Options Exercisable (#) |
Number of Securities Underlying Unexercised Options Unexercisable (#) (6) |
Option Exercise Price ($) (6) |
Option Expiration Date |
||||||||||||
| Robert Cagnazzi |
20,000 | 180,000 | (1) | 10.00 | 3/11/2025 | |||||||||||
| 347,964 | — | 2.863 | 3/15/2022 | |||||||||||||
| Paul Fletcher |
16,200 | 145,800 | (2) | 10.00 | 3/11/2025 | |||||||||||
| 61,220 | — | 1.53 | 10/10/2021 | |||||||||||||
| 2,353 | — | 1.53 | 7/15/2021 | |||||||||||||
| 58,323 | — | 1.53 | 3/31/2021 | |||||||||||||
| David Hart |
16,200 | 145,800 | (2) | 10.00 | 3/11/2025 | |||||||||||
| Elliot Brecher |
— | 19,873 | (3) | 12.58 | 10/1/2025 | |||||||||||
| Vinu Thomas |
1,750 | 15,750 | (4) | 10.00 | 3/11/2025 | |||||||||||
| — | 17,500 | (5) | 17.50 | 2/26/2026 | ||||||||||||
| (1) | Unvested options vest as follows: (i) with respect to 20,000 options on March 11 of each of 2017, 2018, 2019, and 2020, subject to continued employment; and (ii) as to 100,000 options upon achievement of certain targets related to multiple of invested capital, subject to continued employment. |
| (2) | Unvested options vest as follows: (i) with respect to 16,200 options on March 11 of each of 2017, 2018, 2019, and 2020, subject to continued employment; and (ii) as to 81,000 options upon achievement of certain targets related to multiple of invested capital, subject to continued employment. |
| (3) | Unvested options vest as follows: (i) 1,987 options vested on October 1, 2016, (ii) with respect to 1,987 options on October 1 of each of 2017 and 2018, subject to continued employment, (iii) with respect to 1,988 options on October 1 of each of 2019 and 2020, subject to continued employment; and (iv) as to 9,936 options upon achievement of certain targets related to multiple of invested capital, subject to continued employment. |
| (4) | Unvested options vest as follows: (i) with respect to 1,750 options on March 11 of each of 2017, 2018, 2019, and 2020, subject to continued employment; and (ii) as to 8,750 options upon achievement of certain targets related to multiple of invested capital, subject to continued employment. |
| (5) | Unvested options vest as follows: (i) with respect to 1,750 options on February 26 of each of 2017, 2018, 2019, 2020, and 2021, subject to continued employment; and (ii) as to 8,750 options upon achievement of certain targets related to multiple of invested capital, subject to continued employment. |
| (6) | The data in this table, including the notes thereto, does not currently reflect the Stock Split. After the Stock Split is effected, and before the effectiveness of the registration statement of which this prospectus forms a part, the Registrant will update this table, including the notes thereto, to reflect the Stock Split. |
171
Table of Contents
Options Exercised and Stock Vested During Fiscal 2016
None of our named executive officers exercised options or held stock awards that vested during fiscal 2016.
Pension Benefits During Fiscal 2016
None of our named executive officers participate in defined benefit pension plans.
Nonqualified Deferred Compensation During Fiscal 2016
None of our named executive officers participate in nonqualified deferred compensation plans.
Termination and Change in Control Arrangements
Each of our named executive officers is eligible to receive payments and benefits upon certain qualifying terminations of employment and/or upon a change in control of the Company, as described below.
Option Awards
As described under “—Elements of Compensation—Long-Term Equity-Based Compensation—2015 Plan,” under our 2015 Plan, unvested time-based options will become fully vested upon the occurrence of a change in control of the Company.
Current Employment Agreements and Current Offer Letters
The current employment agreements and offer letters with each named executive officer that provide for severance payments and benefits upon certain qualifying terminations of employment are described below.
Robert Cagnazzi. If Mr. Cagnazzi is terminated by the Company without cause or he resigns with good reason, he would be entitled to (1) a pro-rated target annual bonus, paid no later than the release effective date, (2) reimbursement for COBRA premiums for himself and his dependents for up to 12 months and (3) 12 months’ base salary paid in equal installments in accordance with the Company’s payroll practices beginning on the first regular payroll date after the release effective date. Mr. Cagnazzi’s severance payments are contingent upon his execution of an agreement releasing the Company from liabilities relating to his employment by the Company and his compliance with the restrictive covenants in his non-competition agreement. Prior to the completion of this Offering, we intend to enter into an amended and restated employment agreement with Mr. Cagnazzi, which will supersede his current employment agreement and will provide for severance payments and benefits upon certain qualifying terminations of employment as described below under “—2017 Employment Agreements.”
Paul Fletcher. If Mr. Fletcher’s employment is terminated without cause or Mr. Fletcher resigns following a fundamental change in his employment, he would be entitled to receive (1) 18 months’ base salary, paid in equal installments on each semi-annual anniversary of his termination date, with the first payment made within 10 days following his termination date, (2) continuation of Company paid medical, dental and disability benefits for six months, with additional monthly cash payments in an amount sufficient to cover any taxes on such premiums and additional cash payments (or, if the Company cannot continue to provide for such continuation, the Company will coordinate in good faith to provide him with substantially equivalent coverage on a similar cost basis to the Company) and (3) an amount equal to his annual bonus paid in respect of the last completed fiscal year prior to his termination, paid in equal monthly installments over 12 months.
If Mr. Fletcher’s employment is terminated due to his death or disability, he would be entitled to receive (1) one year’s base salary paid in a lump sum within 10 days following his termination of employment, (2) the continuation of Company paid medical, dental, disability and life insurance benefits (provided to his beneficiaries following his death) under the Company plans for one year, plus additional monthly cash payments in an amount
172
Table of Contents
sufficient to cover any taxes on such premiums and additional cash payments (or, if the Company cannot continue to provide for such continuation, the Company will coordinate in good faith to provide him with substantially equivalent coverage on a similar cost basis to the Company) and (3) an amount equal to his annual bonus paid in respect of the last completed fiscal year prior to his termination, paid in equal monthly installments over 12 months. Prior to the completion of this Offering, we may amend and restate Mr. Fletcher’s current employment agreement, which would supersede his current employment agreement, but in all events he will continue to be eligible to receive severance payments and benefits upon certain qualifying terminations of employment pursuant to the terms of his current employment agreement.
David Hart. If Mr. Hart’s employment is terminated by the Company without cause, his employment agreement provides for the payment of his then-existing base salary for a period of 12 months; provided, however, that any payments in respect of Mr. Hart’s equity interests in the Company or its affiliates shall be reduced by the amount of such severance payments. Prior to the completion of this Offering, we intend to enter into an employment agreement with Mr. Hart, which will supersede his current offer letter and will provide for severance payments and benefits upon certain qualifying terminations of employment as described below under “—2017 Employment Agreements.”
Vinu Thomas and Elliot Brecher. Messrs. Thomas and Brecher are not eligible for severance payments or benefits pursuant to their current offer letters and the Company does not maintain a broad-based severance plan. Prior to the completion of this Offering, we intend to enter into employment agreements with each of Mr. Thomas and Mr. Brecher, which will supersede their current offer letters and will provide for severance payments and benefits upon certain qualifying terminations of employment as described below under “—2017 Employment Agreements.”
2017 Employment Agreements
Prior to the completion of this Offering, we intend to enter into 2017 employment agreements with Messrs. Cagnazzi, Hart, Thomas and Brecher, which will supersede their current employment agreements and current offer letters and will provide for severance payments and benefits upon certain qualifying terminations of employment as described below.
Upon a termination without cause or a resignation with good reason or a non-renewal of the named executive officer’s 2017 employment agreement, each such named executive officer would be entitled to (1) an amount equal to a multiple (2.0 for Mr. Cagnazzi (2.5 if such termination of employment occurs during the two-year period following a change in control) and 1.5 for Messrs. Hart and Thomas) of the sum of (a) his annual base salary in effect immediately prior to such termination of employment and (b) his annual bonus earned for the fiscal year prior to such termination of employment (or, if such termination of employment occurs during the two-year period following a change in control, his target annual bonus in effect immediately prior to the change in control), paid over a period of months (24 for Mr. Cagnazzi (30 if such termination of employment occurs during the two-year period following a change in control) and 18 for Messrs. Thomas and Hart) following such termination of employment, (2) a prorated annual bonus for the fiscal year in which such termination of employment occurs, based on actual performance and paid at the time the Company pays annual bonuses to executive officers for such fiscal year, and (3) a lump sum cash payment equal to the cost of the monthly premiums for medical and dental coverage for a period of months (24 for Mr. Cagnazzi (30 if such termination of employment occurs during the two-year period following a change in control) and 18 for Messrs. Thomas and Hart).
Upon a termination without cause or a resignation with good reason or a non-renewal of Mr. Brecher’s employment, Mr. Brecher would be entitled to (1) an amount equal to his annual base salary in effect immediately prior to such termination of employment, and, if such termination of employment occurs during the two-year period following a change in control, his target annual bonus, paid in equal installments over a 12-month period following such termination of employment, (2) a prorated annual bonus for the fiscal year in which such termination of employment occurs, based on actual performance and paid at the time the Company pays annual bonuses to executive officers for such fiscal year, and (3) a lump sum cash payment equal to the cost of the monthly premiums for medical and dental coverage for a period of 12 months.
173
Table of Contents
Upon a termination without cause or a resignation with good reason or a non-renewal of such named executive officer’s employment agreement during the six-month period prior to a change in control but after the date a definitive transaction agreement is executed that contemplates such change in control, such named executive officer’s employment will be deemed to have terminated upon the change in control and the amount of any severance that would have been payable had the named executive officer been terminated as of the date of the change in control will be paid in equal installments over the balance of the severance period.
Upon a termination of employment due to death or disability, each such named executive officer would be entitled to (1) a prorated annual bonus for the fiscal year in which such termination of employment occurs, based on actual performance and paid at the time the Company pays annual bonuses to executive officers for such fiscal year and (2) a lump sum cash payment equal to the cost of the monthly premiums for medical and dental coverage for a period of months (24 for Mr. Cagnazzi, 18 for Messrs. Thomas and Hart and 12 for Mr. Brecher).
Upon a retirement, each such executive officer would be entitled to a prorated annual bonus for the fiscal year in which such termination of employment occurs, based on actual performance and paid at the time the Company pays annual bonuses to executive officers for such fiscal year.
Stay Bonus Agreements
As described above under “—Elements of Compensation—Stay Bonuses,” if Mr. Hart’s or Mr. Fletcher’s employment is terminated without cause, their stay bonuses will vest and will be paid 50% on the earlier of August 2, 2017 and a change in control and 50% on the first to occur of a change in control or a qualified public offering; however, any unpaid portion of the stay bonus will be forfeited if a change in control or qualified public offering has not occurred by February 2, 2025. This completion of this Offering will constitute a qualified public offering for purposes of these agreements and accordingly, we expect that the stay bonuses will vest in full and be paid in accordance with their terms at such time.
Potential Payments upon Termination or Change in Control in Fiscal 2016
The following table sets forth potential payments to each of our named executive officers in the event of the listed events, calculated under the assumption that the executive officer’s employment terminated on June 30, 2016, the last day of our most recently completed fiscal year. The following table does not include payments pursuant to contracts, agreements, plans or arrangements that do not discriminate in scope, terms or operation, in favor of executive officers and that are generally available to all salaried employees. The following table includes payments and benefits under the current employment agreements and current offer letters, which were in effect as of June 30, 2016.
| Name |
Termination without Cause ($) |
Resignation with Good Reason ($) |
Change in Control ($) | Death or Disability ($) |
||||||||||||
| Robert Cagnazzi |
||||||||||||||||
| Cash Severance (1) |
1,200,000 | 1,200,000 | — | — | ||||||||||||
| Continuation Medical/Welfare Benefits (2) |
16,744 | 16,744 | — | — | ||||||||||||
| Accelerated Vesting of Options (3) |
— | — | 600,000 | — | ||||||||||||
| Paul Fletcher |
||||||||||||||||
| Cash Severance (4) |
1,327,719 | 1,327,719 | — | 1,027,719 | ||||||||||||
| Continuation Medical/Welfare Benefits (2) |
8,336 | 8,336 | — | 16,671 | ||||||||||||
| Accelerated Vesting of Options (3) |
— | — | 486,000 | — | ||||||||||||
| Stay Bonus (5) |
270,000 | — | 270,000 | — | ||||||||||||
| David Hart |
||||||||||||||||
| Cash Severance (6) |
600,000 | — | — | — | ||||||||||||
| Accelerated Vesting of Options (3) |
— | — | 486,000 | — | ||||||||||||
| Stay Bonus (5) |
270,000 | — | 270,000 | — | ||||||||||||
| Elliot Brecher |
||||||||||||||||
| Accelerated Vesting of Options (3) |
— | — | 48,890 | — | ||||||||||||
| Vinu Thomas |
||||||||||||||||
| Accelerated Vesting of Options (3) |
— | — | 52,500 | — | ||||||||||||
174
Table of Contents
| (1) | These amounts represent 12 months of salary continuation payments and a pro-rated target bonus. |
| (2) | These amounts represent (a) the continuation of the health and welfare benefits in which each named executive officer was enrolled on June 30, 2016, assuming that the executive officer continues to participate in these plans for 12 months (six months for Mr. Fletcher upon a termination without cause or resignation with good reason) and (b) for Mr. Fletcher, the amount of the additional cash payment to which he would be entitled, assuming such benefits are taxable. |
| (3) | These amounts reflect the intrinsic value of unvested time-based options held by each of our named executive officers as of June 30, 2016 that would accelerate upon a change in control of the Company. These amounts are based on a price per share of $17.50 (or $ , as adjusted to reflect the Stock Split), the fair market value of a share of our common stock on June 30, 2016. |
| (4) | These amounts represent (a) upon a termination without cause or resignation with good reason, 18 months’ base salary (12 months’ upon a termination of employment by reason of death or disability) and (b) an amount equal to the bonus paid to Mr. Fletcher in respect of the year prior to his termination. |
| (5) | These amounts reflect the amount of each named executive officer’s stay bonus that would have vested upon their termination without cause on June 30, 2016, assuming that a change in control or qualified public offering occurs prior to February 2, 2025 and the executive officer receives 100% of his stay bonus. |
| (6) | This amount represents 12 months’ base salary. |
175
Table of Contents
DIRECTOR COMPENSATION
During fiscal 2016, each of our non-employee directors during that year (other than Matthew Nord and Christopher Edson) received an annual retainer of $50,000, $2,000 for each meeting of the Board of Directors attended in person, and $1,000 for each meeting of the Board of Directors attended telephonically. The Chairman of the Board also received an additional annual retainer of $50,000. In addition, directors (other than Mr. Edson) serving on the Audit Committee received an additional annual retainer of $10,000 (in the case of the Chairman) or $5,000 (in the case of other members), and members of the Audit Committee and the Innovation and Technology Committee received $2,000 for each committee meeting attended in person, and $1,000 for each committee meeting attended telephonically.
The following table sets forth certain information regarding the compensation for each non-employee director of the Company during fiscal 2016.
| Name |
Fees Earned or Paid in Cash ($) |
Option Awards ($) (1)(2) |
Total ($) | |||||||||
| Christopher Edson |
— | — | — | |||||||||
| Matthew Nord |
— | — | — | |||||||||
| Pankaj Patel |
6,250 | 46,194 | 52,444 | |||||||||
| Todd Siegel |
81,000 | — | 81,000 | |||||||||
| Joseph Trost |
74,000 | — | 74,000 | |||||||||
| Giovanni Visentin |
112,000 | — | 112,000 | |||||||||
| (1) | Represents the aggregate grant date fair values of options granted during fiscal 2016, computed in accordance with FASB ASC Topic 718. For a discussion of valuation assumptions used in calculating the amounts for fiscal 2016, see Note 15 to our historical consolidated financial statements included elsewhere in this prospectus. |
| (2) | As of June 30, 2016, Mr. Patel held options to purchase 7,500 shares having an exercise price of $17.50 per share, which options vest in three equal installments on each of the first three anniversaries of the grant date, subject to continued service; and Mr. Siegel held options to purchase 7,500 shares having an exercise price of $10.00 per share, which options vest in three equal installments on each of the first three anniversaries of the grant date, subject to continued service. This data does not currently reflect the Stock Split. After the Stock Split is effected, and before the effectiveness of the registration statement of which this prospectus forms a part, the Registrant will update this data to reflect the Stock Split. |
In connection with our appointment of Mr. Patel and Dr. Lerner to our board of directors, we entered into a letter agreement with each such director that sets forth the board fee schedule described above and provides for a grant of 7,500 options (in the case of Mr. Patel, upon his appointment, and in the case of Dr. Lerner, upon consummation of this Offering). This data does not currently reflect the Stock Split. After the Stock Split is effected, and before the effectiveness of the registration statement of which this prospectus forms a part, the Registrant will update this data to reflect the Stock Split.
Following the completion of this Offering, our compensation for non-employee directors will remain the same, except that Salim Hirji will continue to receive no compensation, and except that members of the Audit Committee (excluding Mr. Edson) will receive an annual retainer of $12,500 and the chairman of the Audit Committee will receive an annual retainer of $25,000, in addition to the meeting attendance fees.
176
Table of Contents
The following table sets forth certain information, as of January 31, 2017, regarding the beneficial ownership of the common stock of Presidio, Inc. with respect to:
| • | each person that is a beneficial owner of more than 5% of our outstanding common stock; |
| • | each director and each executive officer named in the summary compensation table; and |
| • | all directors and executive officers as a group. |
The amounts and percentages of common stock beneficially owned are reported on the basis of regulations of the SEC governing the determination of beneficial ownership of securities. Under the rules of the SEC, a person is deemed to be a “beneficial owner” of a security if that person has or shares voting power, which includes the power to vote or direct the voting of such security, or investment power, which includes the power to dispose of or to direct the disposition of such security. A person is also deemed a beneficial owner of any securities of which that person has a right to acquire beneficial ownership within 60 days. Securities that can be so acquired are deemed to be outstanding for purposes of computing such person’s ownership percentage, but not for purposes of computing any other person’s percentage. Under these rules, more than one person may be deemed beneficial owner of the same securities and a person may be deemed to be a beneficial owner of securities as to which such person has no economic interest. Except as otherwise indicated in these footnotes, each of the beneficial owners has, to our knowledge, sole voting and investment power with respect to the indicated shares of common stock. In addition, except as otherwise indicated in these footnotes, the address of each of the directors and executive officers of the Company is c/o One Penn Plaza, Suite 2832, New York, New York 10119. The below beneficial ownership information include shares of common stock issuable upon the exercise of options within 60 days of January 31, 2017.
The historical data below does not currently reflect the Stock Split. After the Stock Split is effected, and before the effectiveness of the registration statement of which this prospectus forms a part, the Registrant will update this data to reflect the Stock Split.
| Beneficially Owned Before Offering |
Beneficially Owned After Offering |
|||||||||||||||
| Name of Beneficial Owner |
Number of Shares |
Percent of Shares |
Number of Shares |
Percent of Shares |
||||||||||||
| Beneficial owners of more than 5% of our outstanding common stock: |
||||||||||||||||
| AP VIII Aegis Holdings, L.P. (1) |
33,500,000 | 93.1% | ||||||||||||||
| Directors and named executive officers: |
||||||||||||||||
| Elliot Brecher (2) |
1,987 | * | ||||||||||||||
| Robert Cagnazzi (3) |
655,706 | 1.8% | ||||||||||||||
| Christopher L. Edson |
— | * | ||||||||||||||
| Paul Fletcher (2) |
154,296 | * | ||||||||||||||
| David Hart (4) |
137,895 | * | ||||||||||||||
| Salim Hirji |
— | * | ||||||||||||||
| Steven Lerner |
— | * | ||||||||||||||
| Matthew H. Nord |
— | * | ||||||||||||||
| Pankaj Patel |
— | * | ||||||||||||||
| Todd H. Siegel (2) |
5,000 | * | ||||||||||||||
| Vinu Thomas (2) |
5,250 | * | ||||||||||||||
| Joseph Trost (5) |
75,000 | * | ||||||||||||||
| Giovanni Visentin (6) |
200,000 | * | ||||||||||||||
| All directors and executive officers as a group |
||||||||||||||||
| * | Less than 1% of common stock outstanding. |
177
Table of Contents
| (1) | The amount reported includes shares held of record by Aegis LP. Aegis GP is the general partner of Aegis LP, and Apollo VIII, Apollo Overseas VIII, Apollo Overseas Delaware and Apollo Overseas Delaware 892 (collectively, the “Equity Funds”) are members of Aegis GP. Apollo VIII serves as the investment manager of the Equity Funds and as the nonmember manager of Aegis GP. Apollo Management is the sole member and manager of Apollo VIII, and Apollo Management GP is the general partner of Apollo Management. Management Holdings is the sole member and manager of Apollo Management GP, and Management Holdings GP is the general partner of Management Holdings. Leon Black, Joshua Harris and Marc Rowan are the managers, as well as executive officers, of Management Holdings GP. The address of each of the entities and individuals, respectively, listed in this footnote is 9 West 57th Street, New York, New York 10019. |
| (2) | Represents shares of common stock that may be acquired upon the exercise of stock options that have vested or will vest within 60 days of January 31, 2017. |
| (3) | Consists of 267,742 shares of common stock held of record by The Brizo Limited Partnership and options to purchase an aggregate of 387,964 shares of common stock (representing that portion of options to purchase an aggregate of 547,964 shares of common stock that may be acquired upon the exercise of stock options that have vested or will vest within 60 days of January 31, 2017). Robert Cagnazzi is the President of KBLAG LTD., which is the general partner of The Brizo Limited Partnership. |
| (4) | Consists of 105,495 shares of common stock and options to purchase an aggregate of 32,400 shares of common stock (representing that portion of options to purchase an aggregate of 162,000 shares of common stock that may be acquired upon the exercise of stock options that have vested or will vest within 60 days of January 31, 2017). |
| (5) | Mr. Trost is party to an agreement with Aegis LP, the Apollo entity which holds the majority of our Common Stock, which provides Mr. Trost with a minority profits interest in the return to Aegis LP on its investment in our company, above the initial investment cost at the time Aegis LP acquired the Predecessor. These profits interests are subject to additional vesting requirements. |
| (6) | Mr. Visentin is party to an agreement with Aegis LP, the Apollo entity which holds the majority of our Common Stock, which provides Mr. Visentin with a minority profits interest in the return to Aegis LP on its investment in our company, above the initial investment cost at the time Aegis LP acquired the Predecessor. These profits interests are subject to additional vesting requirements. |
178
Table of Contents
CERTAIN RELATIONSHIPS AND RELATED PARTY TRANSACTIONS
Apollo Stockholders Agreement
We will enter into the Apollo Stockholders Agreement with Aegis LP, the Apollo Fund that is the beneficial owner of most of our common stock, in connection with this Offering that will provide that, except as otherwise required by applicable law, if the Apollo Funds hold (a) at least 50% of our outstanding common stock, they will have the right to designate up to five nominees to our Board of Directors, (b) at least 30% but less than 50% of our outstanding common stock, they will have the right to designate up to four nominees to our Board of Directors, (c) at least 20% but less than 30% of our outstanding common stock, they will have the right to designate up to three nominees to our Board of Directors and (d) at least 10% but less than 20% of our outstanding common stock, they will have the right to designate two nominees to our Board of Directors. The Apollo Stockholders Agreement will also provide that if the size of our Board of Directors is increased or decreased at any time, the nomination rights of the Apollo Funds will be proportionately increased or decreased, respectively, and rounded up to the nearest whole number.
Under the Apollo Stockholders Agreement, the approval of a majority of the members of our board of directors, which must include the approval of a majority of the directors nominated by the Apollo Funds, will be required under certain circumstances. These include, as to us and, to the extent applicable, each of our subsidiaries:
| • | amending, modifing or repealing any provision of our Amended Certificate or Amended Bylaws in a manner that disproportionately adversely affects the Apollo Funds; |
| • | issuing additional equity interests of the Company, other than (a) any award under any stockholder-approved equity compensation plan, (b) any award under an equity compensation plan approved by a majority of the directors nominated or designated by the Apollo Funds or (c) any intra-company issuance among us and our wholly owned subsidiaries; |
| • | merging or consolidating with or into any other entity, or transfering (by lease, assignment, sale or otherwise) all or substantially all of our and our subsidiaries’ assets, taken as a whole, to another entity, or entering into or agreeing to undertake any transaction that would constitute a “Change of Control” as defined in our or our subsidiaries’ principal credit facilities or note indentures (other than transactions between us and a subsidiary); |
| • | other than in the ordinary course of business with vendors, customers and suppliers, entering into any (a) acquisition by us or any of our subsidiaries of the equity interests or assets of any Person, or the acquisition by us or any of our subsidiaries of any business, properties, assets, or persons or (b) disposition of our assets or the assets of any of our subsidiaries or the shares or other equity interests of any of our subsidiaries, in each case where the amount of consideration for any such acquisition or disposition exceeds $100 million in any single transaction, or an aggregate amount of $200 million in any series of transactions during a calendar year; |
| • | incurring financial indebtedness, in a single transaction or a series of related transactions, aggregating to more than $75 million, subject to certain exceptions; |
| • | terminating our Chief Executive Officer or designate a new Chief Executive Officer; or |
| • | changing the size of our Board of Directors. |
179
Table of Contents
These approval rights will terminate at such time as the Apollo Funds no longer beneficially own at least 30% of our outstanding common stock.
Amended Management Stockholders Agreement
The Company, Aegis LP, the Apollo Fund that is the beneficial owner of most of our common stock, and certain of our employees who invested in the Company in connection with the Presidio Acquisition are parties to a securityholders agreement, which will be amended and restated as the Amended Management Stockholders Agreement in connection with the consummation of this Offering. Pursuant to the Amended Management Stockholders Agreement, following this Offering, Aegis LP and certain of its affiliates will have certain demand registration rights for shares of our common stock held by them. In addition, under the Management Stockholders Agreement, Aegis LP, certain of its affiliates and the Management Holders have piggyback and other registration rights with respect to shares of our common stock held by them. Furthermore, under the Amended Management Stockholders Agreement, we will agree to indemnify (A) each party to the Amended Management Stockholders Agreement and their respective officers, directors, employees, representatives and each person who controls such party, (B) Aegis LP and its officers, managers, employees, representatives and affiliates and (C) any portfolio company of the Apollo Group against losses, claims, damages, liabilities and expenses caused by any untrue or alleged untrue statement of a material fact contained in any registration statement or prospectus or any omission or alleged omission to state therein a material fact required to be stated therein or necessary to make the statements therein not misleading, except insofar as the same may be caused by or contained in any information furnished in writing to our Company by such party set forth in (A), (B) or (C) above for use therein.
Management Fees
Neither Apollo Global Management, LLC nor any Apollo Fund charges our Company any management fee. No management fees were paid by us to Apollo Global Management, LLC or any Apollo Fund since the Presidio Acquisition.
Office Lease Agreement
The Company is party to a lease agreement with an entity owned by Christopher Cagnazzi, our President of the Presidio Tri State region, and Robert Cagnazzi, our Chief Executive Officer and Director, for office space located at 110 Parkway Drive South, Hauppauge, New York, which will expire on December 31, 2019. The current monthly rent under the lease is $25,645.00 and is subject to a 3% annual escalation.
Participation of Apollo Global Securities, LLC in this Offering
Apollo Global Securities, LLC is an affiliate of the Apollo Funds and an underwriter in this offering and will receive a portion of the discounts and commissions paid to the underwriters in this offering. See “Underwriting (Conflicts of Interest).”
Other Related Party Transactions
An alternative investment vehicle formed by the limited partners of the Apollo Funds owns substantially all of the economic interests in the Subordinated Notes pursuant to certain derivative arrangements entered into with Deutsche Bank AG. As such, we presently anticipate that any portion of the proceeds of this Offering used by the Company to repurchase the Subordinated Notes would be paid, directly or indirectly, to such alternative investment vehicle (net of any amounts owed by such alternative investment vehicle to Deutsche Bank AG pursuant to such derivative arrangements). See “Use of Proceeds.”
On February 15, 2017, we entered into a Notes Purchase Agreement with Deutsche Bank AG, who is the holder of 100% of our outstanding Subordinated Notes, pursuant to which we agreed to use the net proceeds
180
Table of Contents
of this Offering to repurchase, and Deutsche Bank AG agreed to sell to us, all of the outstanding Subordinated Notes held by Deutsche Bank AG (or, to the extent the net proceeds are not sufficient to repurchase all Subordinated Notes, a lesser amount) at the Subordinated Notes Repurchase Price. Following the repurchase by us of the Subordinated Notes, we anticipate that any such Subordinated Notes would be cancelled.
In April 2016, we paid affiliates of Apollo $0.5 million in financing and placement fees in connection with the February 2016 Credit Agreement.
We recorded revenue to parties affiliated with Apollo or our directors of $2.0 million for the fiscal year ended June 30, 2016 and $0.3 million for the Combined fiscal year ended June 30, 2015. As of June 30, 2016, the outstanding receivables associated with parties affiliated with Apollo or our directors were $0.2 million and, as of June 30, 2015, the outstanding receivables were less than $0.1 million. We recorded revenue to parties affiliated with Apollo or our directors of $2.1 million and $1.2 million for the six months ended December 31, 2016 and 2015. As of December 31, 2016, the outstanding receivables associated with parties affiliated with Apollo or our directors were $1.8 million.
David Hart, who serves as the Company’s Chief Operating Officer, serves on the board of directors of Atlantix, which until it was sold in October 2015 was a wholly owned subsidiary of the Company.
At issuance, we held the $25.0 million term loan borrowing issued by Presidio Holdings under the Incremental Assumption Agreement and Amendment No. 2 to the Company’s February 2015 Credit Agreement, which was incurred in connection with the Netech Acquisition. As of June 30, 2016, we had sold such holdings of the debt to an unaffiliated third party for a loss of $0.1 million as a result of the sale.
Funding of the Netech Acquisition also included a $150.0 million February 2016 Credit Agreement, which included $5.5 million of the term loans held by members of management. In May 2016, the term loans held by members of management were repaid in connection with the refinancing of the February 2016 Credit Agreement.
During the fiscal year ended June 30, 2014, we repaid $3.0 million on the note payable to a former shareholder that was issued in connection with the repurchase of the former shareholder’s common stock. As of June 30, 2014, the note was paid in full.
During the Predecessor periods, we incurred management fees to our former owners. Management fees were $1.5 million for the period ended February 1, 2015 and $2.0 million for the fiscal year ended June 30, 2014. Additionally, we incurred $12.7 million of consulting fees in the period ended February 1, 2015 to our former owners associated with the Presidio Acquisition.
On May 19, 2015, in connection with the May 2015 Amendment, we paid certain fees totaling approximately $82,000 to Apollo Global Securities, LLC, an affiliate of Apollo, for certain engagement and co-manager services provided in connection with such amendment.
On May 27, 2016, in connection with the May 2016 Amendment, we paid certain fees totaling approximately $152,000 to Apollo Global Securities, LLC, an affiliate of Apollo, for certain manager services provided in connection with such amendment.
On January 19, 2017, in connection with the January 2017 Amendment, we paid certain fees totaling approximately $60,000 to Apollo Global Securities, LLC, an affiliate of Apollo, for certain engagement and co-manager services provided in connection with such refinancing.
181
Table of Contents
Apollo Directors
One of our directors, Matthew Nord, is a senior partner of Apollo Global Management, LLC, which he joined in 2003. One of our directors, Christopher Edson, is a principal of Apollo Global Management, LLC, which he joined in 2008. One of our directors, Salim Hirji, is an associate of Apollo Global Management, LLC, which he joined in 2013. Information with respect to director compensation is set forth in this prospectus, under “Compensation Discussion and Analysis—Director Compensation.”
Review and Approval of Related Party Transactions
Upon consummation of this Offering, we intend to adopt a formal written policy for the review, approval or ratification of transactions with related persons.
Indemnification Agreements
In connection with the completion of this Offering, we expect to enter into indemnification agreements with each of our directors and certain of our officers. We expect that these indemnification agreements will provide the directors and officers with contractual rights to indemnification and expense advancement that are, in some cases, broader than the specific indemnification provisions contained under Delaware law. We believe that these indemnification agreements will be, in form and substance, substantially similar to those commonly entered into in transactions of like size and complexity sponsored by private equity firms.
182
Table of Contents
DESCRIPTION OF CERTAIN INDEBTEDNESS
The following summary of the material terms of certain financing arrangements does not purport to be complete and is subject to, and qualified in its entirety by reference to, the underlying documents.
February 2015 Credit Agreement
General
On February 2, 2015, certain of our wholly owned domestic subsidiaries entered into the February 2015 Credit Agreement, which initially provided for senior secured financing of $650 million. The borrowers under the February 2015 Credit Agreement are Presidio LLC (f/k/a Presidio, Inc.) (“Presidio LLC”) and Presidio Networked Solutions LLC (f/k/a Presidio Networked Solutions, Inc.) (“PNS” and, together with Presidio LLC, the “February 2015 Credit Agreement Borrowers”). The February 2015 Credit Agreement originally consisted of:
| • | the term loan facility, in an aggregate principal amount of $600 million, maturing on February 2, 2022; and |
| • | the revolving credit facility, in an aggregate principal amount of up to $50 million, maturing on February 2, 2020, which includes both a letter of credit sub-facility and a swingline loan sub-facility. |
On May 19, 2015, the February 2015 Credit Agreement Borrowers entered into an amendment to the February 2015 Credit Agreement to, among other things, reduce the interest rate on the term loan facility. Concurrently with the amendment, the February 2015 Credit Agreement Borrowers made a $25 million voluntary prepayment of outstanding term loans under the February 2015 Credit Agreement.
On February 1, 2016, in connection with the Netech Acquisition, the February 2015 Credit Agreement Borrowers entered into a second amendment to the February 2015 Credit Agreement to, among other things, provide for an incremental term loan facility made by the Company, as lender, to the Borrowers in an aggregate principal amount of $25 million (“February 2016 Incremental Term Loan”). The February 2016 Incremental Term Loan was funded by the Company at par and otherwise has the same terms as the previously outstanding term loans under the February 2015 Credit Agreement. The initial lender under the February 2016 Incremental Term Loan was Presidio, Inc. (f/k/a Aegis Holdings, Inc.). Prior to the date hereof, Presidio, Inc. sold the $25 million February 2016 Incremental Term Loan to unaffiliated purchasers.
On May 27, 2016, the February 2015 Credit Agreement Borrowers entered into a third amendment to the February 2015 Credit Agreement to, among other things, provide for an incremental term loan facility made to the Borrowers in an aggregate principal amount of $140 million (the “May 2016 Incremental Term Loan”). The May 2016 Incremental Term Loan was funded at 99.5% of the aggregate principal amount thereof and otherwise has the same terms as the previously outstanding term loans under the February 2015 Credit Agreement. The proceeds of the May 2016 Incremental Term Loan were used, together with cash on hand, to refinance in full a separate term loan credit agreement which the Company had entered into in connection with the Netech Acquisition (the “February 2016 Credit Agreement”).
On December 30, 2016, the February 2015 Credit Agreement Borrowers made a $25.0 million voluntary prepayment of outstanding term loans under the February 2015 Credit Agreement; after giving effect to the prepayment, $703.6 million in aggregate principal amount of term loans remained outstanding under the February 2015 Credit Agreement.
183
Table of Contents
As of December 31, 2016, the outstanding principal amount of the term loan facility under the February 2015 Credit Agreement was $703.6 million and there were no outstanding borrowings under the revolving facility.
On January 19, 2017, the February 2015 Credit Agreement Borrowers entered into the January 2017 Amendment to, among other things, reduce the interest rate on all term loans outstanding under the February 2015 Credit Agreement.
The February 2015 Credit Agreement Borrowers may request one or more incremental term loan facilities and/or increase commitments under the revolving facility in an aggregate amount of up to the sum of (x) $100 million plus (y) such additional amount so long as, (i) in the case of loans under additional credit facilities secured by liens (other than to the extent such liens are expressly subordinated in writing to the liens on the collateral securing the February 2015 Credit Agreement), the consolidated net first lien secured leverage ratio would be no greater than 3.25 to 1.00 and (ii) in the case of loans under additional credit facilities that would not be included in the computation of the consolidated net first lien secured leverage ratio, the consolidated net secured leverage ratio would be no greater than 4.25 to 1.00, subject to certain conditions and receipt of commitments by existing or additional lenders.
All borrowings under the revolving credit facility of the February 2015 Credit Agreement are subject to the satisfaction of customary conditions, including the absence of a default or event of default and the accuracy of representations and warranties.
Interest Rates and Fees
Borrowings under the February 2015 Credit Agreement bear interest at a rate equal to, at the applicable February 2015 Credit Agreement Borrowers’ option, either (a) a LIBOR rate determined by reference to the costs of funds for Eurodollar deposits for the interest period relevant to such borrowing, adjusted for certain additional costs, subject to a 1.00% floor in the case of term loans, plus a margin of 3.50%, or (b) a base rate determined by reference to the highest of (i) the federal funds rate plus 0.50%, (ii) the prime rate determined by Credit Suisse AG and (iii) the one-month adjusted LIBOR plus 1.00%, in each case, plus a margin of 2.50%. From and after the date that Presidio Holdings Inc. delivers a certificate to the administrative agent certifying that a qualified initial public offering (defined as an underwritten public offering of the equity interests of Presidio LLC or a parent entity (including Presidio, Inc.) which generates gross cash proceeds of at least $50 million) has occurred and that the Net Total Leverage Ratio (as defined in the February 2015 Credit Agreement) calculated on a pro forma basis is less than 4.00 to 1.00, the applicable margin for term loans under the February 2015 Credit Agreement will be reduced by an additional 0.25%.
In addition to paying interest on outstanding principal under the February 2015 Credit Agreement, the February 2015 Credit Agreement Borrowers are required to pay a commitment fee ranging from 0.50% to 0.375%, depending on the net first lien leverage ratio, to the lenders under the revolving credit facility in respect of the unutilized commitments thereunder. They are also required to pay customary agency fees as well as letter of credit participation fees computed at a rate per annum equal to the applicable margin for LIBOR rate borrowings on the dollar equivalent of the daily stated amount of outstanding letters of credit, such letter of credit issuer’s customary documentary and processing fees and charges and customary fronting fees.
Amortization and Prepayments
The February 2015 Credit Agreement requires amortization of 1.00% per annum, payable quarterly on the principal amount of term loans outstanding immediately after the effectiveness of the January 2017 Amendment, with the balance paid at maturity.
184
Table of Contents
In addition, the February 2015 Credit Agreement requires the February 2015 Credit Agreement Borrowers to prepay outstanding term loan borrowings, subject to certain exceptions, with:
| • | 75% (which percentage is reduced to 50% if the consolidated net first lien secured leverage ratio is less than or equal to 3.00 to 1.00, reduced to 25% if the consolidated net first lien secured leverage ratio is less than or equal to 2.50 to 1.00 and reduced to 0% if the consolidated net first lien secured leverage ratio is less than or equal to 2.00 to 1.00) of the Borrowers’ annual excess cash flow, as defined under the February 2015 Credit Agreement; |
| • | 100% of the net cash proceeds of all non-ordinary course asset sales, other dispositions of property or certain casualty events, in each case subject to certain exceptions, including, without limitation, a minimum threshold, and provided that we may (a) reinvest within 12 months, or (b) commit to reinvest those proceeds within 12 months and so reinvest such proceeds within six months following the end of such 12-month period in assets to be used in our business, or certain other permitted investments; and |
| • | 100% of the net cash proceeds of any issuance or incurrence of debt, other than proceeds from debt permitted under the February 2015 Credit Agreement. |
The February 2015 Credit Agreement Borrowers may voluntarily repay outstanding loans under the February 2015 Credit Agreement at any time, without prepayment premium or penalty except in connection with a repricing event as described below, subject to customary “breakage” costs with respect to LIBOR rate loans.
Collateral and Guarantors
All obligations under the February 2015 Credit Agreement are unconditionally guaranteed by the February 2015 Credit Agreement Borrowers, Presidio Holdings Inc., Presidio IS LLC and each of existing and future wholly owned domestic subsidiaries of Presidio Holdings Inc., subject to certain exceptions. The obligations are secured by substantially all assets of the February 2015 Credit Agreement Borrowers and those of each guarantor, including capital stock of the February 2015 Credit Agreement Borrowers and the subsidiary guarantors and 65% of the capital stock of the first-tier foreign subsidiaries that are not subsidiary guarantors, in each case subject to certain exceptions. Such security interests consist of a first-priority lien with respect to the collateral, subject to certain exceptions including that such security interests, pursuant to an intercreditor agreement, be subordinate to the security interests on the collateral securing the obligations under the CPC Facility.
Restrictive Covenants and Other Matters
The revolving credit facility requires that we, subject to a testing threshold, comply on a quarterly basis with a maximum first lien net senior secured leverage ratio. The testing threshold is satisfied at any time when the sum of outstanding exposure under the revolver exceeds 30% of the outstanding commitments under the revolving credit facility at such time.
The February 2015 Credit Agreement contains certain customary affirmative covenants and events of default. The negative covenants in the February 2015 Credit Agreement include, among other things, limitations (subject in each case to exceptions) on our ability to:
| • | incur additional debt or issue certain preferred shares; |
| • | create liens on certain assets; |
| • | make certain loans or investments (including acquisitions); |
| • | pay dividends on or make distributions in respect of capital stock or make other restricted payments; |
185
Table of Contents
| • | consolidate, merge, sell or otherwise dispose of all or substantially all of our assets; |
| • | sell assets; |
| • | enter into certain transactions with affiliates; |
| • | enter into sale-leaseback transactions; |
| • | change our lines of business; |
| • | restrict dividends from our subsidiaries or restrict liens; |
| • | change our fiscal year; and |
| • | modify the terms of certain debt or organizational agreements. |
Securitization Facility
Presidio maintains the Receivables Securitization Facility whereby PNS sells its trade receivables on a continuous basis to PCF. PCF then grants, without recourse, a senior undivided interest in the pooled receivables to the administrative agent of the facility, PNC Bank, National Association, in exchange for cash, while maintaining a subordinated undivided interest in any over-collateralization of the pooled receivables. Presidio LLC services the receivables for PCF at market rates. Upon and after the sale or contribution of the accounts receivables to PCF, such accounts receivables are legally assets of PCF and, as such, are not available to our creditors or our other subsidiaries.
As of the date hereof, the committed amount of the Receivables Securitization Facility is $250 million and the maturity date is February 2, 2018. The Receivables Securitization Facility provides for borrowing capacity subject to a borrowing limit that is based on eligible receivables, as defined in the securitization agreements. Interest is calculated daily but payable monthly based on a Eurodollar borrowing rate plus a utilized program fee of 1.40%. The Company also incurs a commitment fee of 0.50% or 0.40%, depending on utilization.
As of December 31, 2016, there was no outstanding principal on the Receivables Securitization Facility.
Each purchase is subject to the satisfaction of customary conditions, including the absence of a termination event and the accuracy of representations and warranties.
The obligations under the Receivables Securitization Facility are secured by PCF’s right, title and interest in the pool of receivables and certain related assets.
The Receivables Securitization Facility requires that Presidio LLC comply with a minimum fixed charge coverage ratio of 1.0 to 1.0 if its excess liquidity, as defined in the Receivables Securitization Facility, falls below $35 million.
The Receivables Securitization Facility contains certain customary affirmative covenants and termination events for facilities of this nature.
Senior Notes and Subordinated Notes
General
On February 2, 2015, Presidio Holdings issued the Senior Notes in an initial aggregate principal amount of $250 million and the Subordinated Notes in an initial aggregate amount of $150 million. Each of the Senior Notes and the Subordinated Notes will mature on February 15, 2023.
186
Table of Contents
In August 2015, Presidio Holdings repurchased from an unaffiliated third party approximately $38.2 million of the Subordinated Notes held by unaffiliated third parties. In June 2016, Presidio Holdings repurchased from an unaffiliated third party an aggregate of approximately $27.6 million of the Senior Notes.
As of December 31, 2016, the aggregate principal amount of outstanding Senior Notes was $222.5 million, and the aggregate principal amount of outstanding Subordinated Notes was $111.8 million.
An alternative investment vehicle formed by the limited partners of the Apollo Funds owns substantially all of the economic interests in the Subordinated Notes pursuant to certain derivative arrangements entered into with Deutsche Bank AG, who is the holder of 100% of the outstanding Subordinated Notes.
We intend to use the net proceeds of this Offering to repurchase all of our Subordinated Notes and to redeem a portion of our Senior Notes as described under “Use of Proceeds.”
On February 15, 2017, we entered into a Notes Purchase Agreement with Deutsche Bank AG, who is the holder of 100% of our outstanding Subordinated Notes, pursuant to which we agreed to use the net proceeds of this Offering to repurchase, and Deutsche Bank AG agreed to sell to us, all of the outstanding Subordinated Notes held by Deutsche Bank AG (or, to the extent the net proceeds are not sufficient to repurchase all Subordinated Notes, a lesser amount) at the Subordinated Notes Repurchase Price. Following the repurchase by us of the Subordinated Notes, we anticipate that any such Subordinated Notes would be cancelled.
Interest Rates and Fees
Interest on the Notes of each series accrues at a rate of 10.25% per annum, which is payable semiannually in cash to holders of record at the close of business on the February 1 or August 1 immediately preceding the interest payment date on February 15 and August 15 of each year, commencing August 15, 2015.
Optional Redemption
Prior to February 15, 2018, Presidio Holdings may redeem some or all of the Notes at a redemption price equal to 100% of the principal amount of such notes plus accrued and unpaid interest, plus an applicable make-whole premium. On or after February 15, 2018, Presidio Holdings may redeem some or all of the Notes at certain specified redemption prices, plus accrued and unpaid interest.
In addition, on or prior to February 15, 2018, Presidio Holdings may redeem in the aggregate up to 40.0% of the original aggregate principal amount of the Notes of each series with the net cash proceeds of any equity offering at a redemption price of 110.25%, plus accrued and unpaid interest, provided that at least 50.0% of the original aggregate principal amount of the Notes of the applicable series remains outstanding after such redemption and provided that such redemption occur within 90 days of the date on which such equity offering is consummated, upon not less than 30 or more than 60 days’ notice.
Guarantors and Ranking
The Notes are fully and unconditionally guaranteed, jointly and severally, by Presidio Holdings’s present and future direct or indirect wholly owned material domestic subsidiaries that guarantee or are directly liable in respect of the February 2015 Credit Agreement or certain other future credit facilities or future capital markets indebtedness.
The Senior Notes are unsubordinated, unsecured of Presidio Holdings and the guarantors, respectively. The Subordinated Notes are unsecured and are subordinated in right of payment to all existing and future senior debt of Presidio Holdings and the guarantors, meaning that the holders of senior debt, including the Senior Notes and February 2015 Credit Agreement, are entitled to payment in full, including post-filing interest in a bankruptcy, before the holders of the Subordinated Notes are entitled to receive any payments.
187
Table of Contents
Restrictive Covenants and Other Matters
The indentures governing the Notes contain certain customary affirmative covenants and events of default. The applicable negative covenants include, among other things, limitations (subject in each case to exceptions) on our ability to:
| • | incur or guarantee additional indebtedness; |
| • | pay dividends or distributions on, or redeem or repurchase, capital stock and make other restricted payments; |
| • | make investments; |
| • | consummate certain asset sales; |
| • | engage in transactions with affiliates; |
| • | grant or assume liens; and |
| • | consolidate, merge or transfer all or substantially all of the assets of Presidio Holdings. |
Most of the restrictive covenants will cease to apply for so long as the Notes are rated investment grade by both Standard & Poor’s and Moody’s.
Upon the occurrence of a change of control, Presidio Holdings is required to offer to repurchase all of the existing Notes at a purchase price in cash equal to 101% of the principal amount thereof, plus accrued and unpaid interest, if any, to the date of repurchase.
188
Table of Contents
The following is a description of the material terms of our Amended Certificate and Amended Bylaws, except as otherwise indicated by reference to our current certificate of incorporation and current bylaws and of specific provisions of Delaware law.
General
We will amend and restate our certificate of incorporation, to be effective upon consummation of this Offering, at which time our capital stock will consist of a total of million authorized shares, of which million shares, par value $0.01 per share, will be designated as common stock and million shares, par value $0.01 per share, will be designated as preferred stock. Immediately following the completion of this Offering, we will have shares of common stock outstanding. There will be no shares of preferred stock outstanding immediately following this Offering.
Common Stock
Voting rights. Holders of common stock will be entitled to one vote per share on all matters to be voted upon by the stockholders. The holders of common stock will not have cumulative voting rights in the election of directors.
Dividend rights. Holders of common stock will be entitled to ratably receive dividends if, as and when dividends are declared from time to time by our Board of Directors out of funds legally available for that purpose, after payment of dividends required to be paid on outstanding preferred stock, as described below, if any. Under Delaware law, we can only pay dividends either out of “surplus” or the current or immediately preceding year’s net profits. Surplus is defined as the excess, if any, at any given time, of the total assets of a corporation over its total liabilities and statutory capital. The value of a corporation’s assets can be measured in a number of ways and may not necessarily equal their book value.
Liquidation rights. Upon liquidation, dissolution or winding-up, the holders of common stock will be entitled to receive ratably the assets available for distribution to the stockholders after payment of liabilities and accrued but unpaid dividends and liquidation preferences on any outstanding preferred stock.
Other matters. The common stock will have no preemptive or conversion rights. There will be no redemption or sinking fund provisions applicable to the common stock. All outstanding shares of our common stock will be fully paid and non-assessable and the shares of our common stock offered in this Offering, upon payment and delivery in accordance with the underwriting agreement, will be fully paid and non-assessable.
Preferred Stock
Pursuant to our Amended Certificate, shares of preferred stock will be issuable from time to time, in one or more series, with the designations of the series, the voting rights of the shares of the series (if any), the powers, preferences and relative participation, optional or other special rights (if any) and any qualifications, limitations or restrictions thereof as our Board of Directors from time to time may adopt by resolution (and without further stockholder approval), subject to certain limitations. Each series will consist of that number of shares as will be stated and expressed in the certificate of designations providing for the issuance of the stock of the series. The Board may authorize the issuance of preferred stock with voting or conversion rights that could adversely affect the voting power or other rights of the holders of common stock. The issuance of preferred stock, while providing flexibility in connection with possible future financings and acquisitions and other corporate purposes, could, under certain circumstances, have the effect of delaying, deferring or preventing a change in control of us and might affect the market price of our common stock. See “—Certain Corporate Antitakeover Provisions.” We have no current plans to issue any shares of preferred stock following the consummation of this Offering.
189
Table of Contents
Composition of the Board of Directors; Election and Removal of Directors
In accordance with our Amended Certificate and our Amended Bylaws, the number of directors comprising our Board of Directors will be determined from time to time by our Board of Directors, and only a majority of the Board of Directors may fix the number of directors. However, the number of directors shall never be less than one nor more than fifteen. Our Amended Certificate will provide that stockholders will be able to remove directors only for cause and then only by the affirmative vote of a majority of the voting power entitled to vote for the election of directors. We intend to avail ourselves of the “controlled company” exceptions under the governance rules of the NASDAQ, which may exempt us from certain requirements, including the requirements that we have a majority of independent directors on our Board of Directors and that we have Compensation and Nominating and Corporate Governance Committees composed entirely of independent directors. We will, however, remain subject to the requirement that we have an Audit Committee composed entirely of independent members.
The Apollo Stockholders Agreement that we will enter into in connection with this Offering will provide that, except as otherwise required by applicable law, if the Apollo Funds hold (a) at least 50% of our outstanding common stock, they will have the right to designate up to five nominees to our Board of Directors, (b) at least 30% but less than 50% of our outstanding common stock, they will have the right to designate up to four nominees to our Board of Directors, (c) at least 20% but less than 30% of our outstanding common stock, they will have the right to designate up to three nominees to our Board of Directors and (d) at least 10% but less than 20% of our outstanding common stock, they will have the right to designate two nominees to our Board of Directors. The Apollo Stockholders Agreement will also provide that if the size of our Board of Directors is increased or decreased at any time, the nomination rights of the Apollo Funds will be proportionately increased or decreased respectively, and rounded up to the nearest whole number.
Upon completion of this Offering, we expect that our Board of Directors will have nine directors. Our Amended Bylaws will provide that our Board of Directors is divided into three classes of directors, with the classes to be as nearly equal in number as possible. As a result, approximately one-third of our Board of Directors will be elected at the annual meeting of stockholders, with such elections decided by plurality vote. The classification of directors will have the effect of making it more difficult for stockholders to change the composition of our Board of Directors. Each director will hold office until his successor is duly elected and qualified or until his earlier death, disqualification, resignation or removal. Any vacancies on our Board of Directors, including by reason of an increase in the authorized number of directors, may be filled only by the affirmative vote of a majority of the remaining directors, although less than a quorum, or by a sole remaining director, except as provided in the Apollo Stockholders Agreement, as described above. Directors so chosen shall hold office for a term expiring at the annual meeting of stockholders at which the term of office of the class to which they have been appointed expires and until their successors are duly elected and shall qualify, unless sooner displaced. Our Amended Certificate will provide that stockholders do not have the right to cumulative voting in the election of directors. At any meeting of our Board of Directors, except as otherwise required by law, a majority of the total number of directors that the company would have if there were no vacancies will constitute a quorum for all purposes.
Upon completion of this Offering, our Amended Bylaws will provide that, subject to applicable law and the rights of the holders of any series of preferred stock, any director, or the entire Board of Directors, may be removed from office at any time, but only for cause and only by the affirmative vote of holders of shares entitled to cast at least a majority of the votes entitled to be cast generally in the election of directors.
Special Meetings of Stockholders
Our Amended Bylaws will provide that special meetings of stockholders may be called by the Board of
Directors, the Chairman, the Chief Executive Officer or by stockholders, individually or collectively, holding
more than 50.1% of the Company’s outstanding shares; provided that, once the Apollo Funds hold less than
190
Table of Contents
50.1% of the Company’s outstanding shares, special meetings of stockholders may be called only by the Board of
Directors, the chairman of the Board of Directors or the Chief Executive Officer. Only proposals included in the
Company’s notice or otherwise brought before the meeting by or at the direction of the Board may be considered at such special meetings.
Antitakeover Effects of Section 203 of the DGCL
We have elected not to opt out of Section 203 of the DGCL. However, our Amended Certificate, which will become effective on the consummation of this offering, will include a provision that will exempt us from the provisions of the DGCL with respect to combinations between any members of the Apollo Group (including any portfolio company thereof) , on the one hand, and us, on the other.
In general, Section 203 of the DGCL prevents an “interested stockholder” (as defined in the DGCL) from engaging in a “business combination” (as defined in the DGCL) with us for three years following the date that person becomes an interested stockholder, unless one or more of the following occurs:
| • | before that person became an interested stockholder, our Board of Directors approved the transaction in which the interested stockholder became an interested stockholder or approved the business combination; |
| • | upon consummation of the transaction that resulted in the interested stockholder becoming an interested stockholder, the interested stockholder owned at least 85% of our voting stock outstanding at the time the transaction commenced, excluding for purposes of determining the voting stock outstanding (but not the outstanding voting stock owned by the interested stockholder) stock held by directors who are also officers of our Company and by employee stock plans that do not provide employees with the right to determine confidentially whether shares held under the plan will be tendered in a tender or exchange offer; or |
| • | following the transaction in which that person became an interested stockholder, the business combination is approved by our Board of Directors and authorized at a meeting of stockholders by the affirmative vote of the holders of at least 66 2/3% of our outstanding voting stock not owned by the interested stockholder. |
In general, a “business combination” is defined to include mergers, asset sales and other transactions resulting in financial benefit to a stockholder and an “interested stockholder” is a person who, together with affiliates and associates, owns (or within three years, did own) 15% or more of a corporation’s voting stock. The DGCL generally defines “interested stockholder” as any person who, together with affiliates and associates, is the owner of 15% or more of our outstanding voting stock or is our affiliate or associate and was the owner of 15% or more of our outstanding voting stock at any time within the three-year period immediately before the date of determination. The statute could prohibit or delay mergers or other takeover or change in control attempts and, accordingly, may discourage attempts to acquire us even though such a transaction may offer our stockholders the opportunity to sell their stock at a price above the prevailing market price.
The provisions of the DGCL, our Amended Certificate and our Amended Bylaws could have the effect of discouraging others from attempting hostile takeovers and, as a consequence, they may also inhibit temporary fluctuations in the market price of our common stock that often result from actual or rumored hostile takeover attempts. These provisions may also have the effect of preventing changes in our management. It is possible that these provisions could make it more difficult to accomplish transactions that stockholders may otherwise deem to be in their best interests.
191
Table of Contents
Certain Corporate Antitakeover Provisions
Certain provisions in our Amended Certificate and Amended Bylaws summarized below may be deemed to have an antitakeover effect and may delay, deter or prevent a tender offer or takeover attempt that a stockholder might consider to be in its best interests, including attempts that might result in a premium being paid over the market price for the shares held by stockholders.
Preferred Stock
Our Amended Certificate will contain provisions that will permit our Board of Directors to issue, without any further vote or action by the stockholders, shares of preferred stock in one or more series and, with respect to each such series, to fix the number of shares constituting the series and the designation of the series, the voting rights (if any) of the shares of the series and the powers, preferences and relative participation, optional and other special rights, if any and any qualifications, limitations or restrictions of the shares of such series. See “—Preferred Stock.”
Classified Board; Number of Directors
Our Amended Certificate and Amended Bylaws will provide that our Board of Directors is divided into three classes of directors, with the classes to be as nearly equal in number as possible and the number of directors on our Board of Directors may be fixed only by the majority of our Board of Directors, as described above in “—Composition of the Board of Directors; Election and Removal of Directors.”
Removal of Director; Vacancies
Our Amended Certificate will provide that stockholders will be able to remove directors only for cause and then only by the affirmative vote of a majority of the voting power entitled to vote for the election of directors. Vacancies on our Board of Directors may be filled by a majority of our Board of Directors then in office, although less than a quorum.
No Cumulative Voting
Our Amended Certificate will provide that stockholders do not have the right to cumulative voting in the election of directors.
Stockholder Action by Written Consent; Calling of Special Meetings of Stockholders
Our Amended Certificate will permit stockholder action without a meeting by consent. However, if the Apollo Funds hold less than 50.1% of the Company’s outstanding voting shares, our Amended Certificate will not permit stockholder action by written consent unless such written consent is unanimous.
Our Amended Bylaws will provide that special meetings of stockholders may be called by the Board of Directors, the Chairman, the Chief Executive Officer or by stockholders, individually or collectively, holding more than 50.1% of the Company’s outstanding shares; provided that, once the Apollo Funds hold less than 50.1% of the Company’s outstanding shares, special meetings of stockholders may be called only by the Board of Directors, the chairman of the Board of Directors or the Chief Executive Officer. Only proposals included in the Company’s notice or otherwise brought before the meeting by or at the direction of the Board may be considered at such special meetings.
Advance Notice Requirements for Stockholders’ Proposals and Director Nominations
Our Amended Bylaws will provide that stockholders seeking to bring business before an annual meeting of stockholders, or to nominate candidates for election as directors at an annual meeting of stockholders, must
192
Table of Contents
provide timely notice thereof in writing. To be timely, a stockholder’s notice generally will have to be delivered to and received at our principal executive offices not less than ninety days nor more than 120 days prior to the first anniversary of the preceding year’s annual meeting; provided that, if the date of such meeting is advanced more than thirty days prior to, or delayed by more than sixty days after, the anniversary of the preceding year’s annual meeting of our stockholders, a stockholder’s notice to be timely will have to be so delivered not earlier than the close of business on the 120th day prior to such meeting and not later than the close of business on the later of the 90th day prior to such meeting or, if the first public announcement of the date of such meeting is less than 100 days prior to the date of such meeting, the 10th day following the day on which public announcement of the date of such meeting is first made. Our Amended Bylaws will also specify certain requirements as to the form and content of a stockholder’s notice. These provisions may preclude stockholders from bringing matters before an annual meeting of stockholders or from making nominations for directors at an annual meeting of stockholders.
Exclusive Jurisdiction
Our Amended Certificate and Amended Bylaws will provide that, unless we consent to the selection of an alternative forum, the Court of Chancery of the State of Delaware shall be the sole and exclusive forum for any derivative action or proceeding brought on our behalf, any action asserting a claim of breach of fiduciary duty owed by any of our directors, officers, or other employees to us or to our stockholders, any action asserting a claim arising pursuant to the DGCL, or any action asserting a claim governed by the internal affairs doctrine.
Corporate Opportunity
Our Amended Certificate will provide that no officer or director of the Company who is also an officer, director, employee, managing director or other affiliate of any member of the Apollo Group will be liable to us or our stockholders for breach of any fiduciary duty by reason of the fact that any such individual pursues or acquires a corporate opportunity for its own account or the account of an affiliate, as applicable, instead of us, directs a corporate opportunity to any member of the Apollo Group, as applicable, instead of us or does not communicate information regarding a corporate opportunity to us.
This provision may not be modified without Apollo’s written consent until such time as a member of the Apollo Group no longer owns any of the outstanding shares of common stock of the Company.
Amendment of Our Certificate of Incorporation
Our Amended Certificate will provide that at any time the Apollo Group controls at least 50.1% of the voting power of our outstanding common stock, our Amended Certificate can be amended with the affirmative vote of a majority of the outstanding stock entitled to vote thereon. At any other time, our Amended Certificate will provide that our Amended Certificate can be amended by the affirmative vote of at least two thirds of the outstanding stock entitled to vote thereon. Apollo’s prior written consent is required for any amendment, modification or repeal of the provisions discussed above regarding the ability of Apollo-related directors to direct or communicate corporate opportunities to Apollo. Additionally, pursuant to the Apollo Stockholders Agreement, for so long as the Apollo Funds hold at least 30% of our outstanding common stock, our Amended Certificate cannot be amended in a manner that disproportionately adversely affects the Apollo Funds without the approval of at least a majority of the directors nominated by the Apollo Funds to our Board of Directors pursuant to the Apollo Stockholders Agreement. For more information, see “Certain Relationships and Related Party Transactions—Apollo Stockholders Agreement.”
Amendment of Our Bylaws
Our Amended Bylaws will provide that, except as provided in the Apollo Stockholders Agreement that we have agreed to enter into in connection with the consummation of this Offering, they can be amended by the vote of a majority of the shares present in person or represented by proxy at a meeting of stockholders and
193
Table of Contents
entitled to vote or by the vote of a majority of the Board of Directors. Additionally, pursuant to the Apollo Stockholders Agreement, for so long as the Apollo Funds hold at least 30% of our outstanding common stock, our Amended Bylaws cannot be amended in a manner that disproportionately adversely affects the Apollo Funds without the approval of at least a majority of the directors nominated by the Apollo Funds to our Board of Directors pursuant to the Apollo Stockholders Agreement. For more information, see “Certain Relationships and Related Party Transactions—Apollo Stockholders Agreement.”
Limitation of Liability and Indemnification
Section 145 of the DGCL provides, in general, that a corporation incorporated under the laws of the State of Delaware, such as the Company, may indemnify any person who was or is a party or is threatened to be made a party to any threatened, pending or completed action, suit or proceeding (other than a derivative action by or in the right of the corporation) by reason of the fact that such person is or was a director, officer, employee or agent of the corporation, or is or was serving at the request of the corporation as a director, officer, employee or agent of another enterprise, against expenses (including attorneys’ fees), judgments, fines and amounts paid in settlement actually and reasonably incurred by such person in connection with such action, suit or proceeding if such person acted in good faith and in a manner such person reasonably believed to be in or not opposed to the best interests of the corporation and, with respect to any criminal action or proceeding, had no reasonable cause to believe such person’s conduct was unlawful. In the case of a derivative action, a Delaware corporation may indemnify any such person against expenses (including attorneys’ fees) actually and reasonably incurred by such person in connection with the defense or settlement of such action or suit if such person acted in good faith and in a manner such person reasonably believed to be in or not opposed to the best interests of the corporation, except that no indemnification will be made in respect of any claim, issue or matter as to which such person shall have been adjudged to be liable to the corporation unless and only to the extent that the Court of Chancery of the State of Delaware or any other court in which such action was brought determines such person is fairly and reasonably entitled to indemnity for such expenses.
Our Amended Certificate will provide that directors of the Company shall not be personally liable to the Company or our stockholders for monetary damages for breach of fiduciary duty as a director, except for liability (a) for any breach of the director’s duty of loyalty to the Company or our stockholders, (b) for acts or omissions not in good faith or which involve intentional misconduct or a knowing violation of law, (c) under Section 174 of the DGCL, relating to prohibited dividends or distributions or the repurchase or redemption of stock or (d) for any transaction from which the director derives an improper personal benefit. Our Amended Bylaws will also contain provisions to indemnify any employee to the fullest extent permitted by the DGCL.
Accordingly, if any of the personnel described in the foregoing paragraph is immune or exculpated from, or indemnified against, liability in connection with actions he has taken but which actions impede our performance, our and our stockholders’ ability to recover damages from that person will be limited.
Further, the Company shall, to the fullest extent permitted by the DGCL in effect from time to time, indemnify any person who is or was a director or officer of the Company from and against any expenses, judgments, fines and amounts paid in settlement actually and/or reasonably incurred in connection with the matters referred to in or covered by Section 145 of the DGCL without requiring a preliminary determination of the ultimate entitlement to indemnification and shall pay or reimburse reasonable expenses in advance of final disposition of a proceeding.
Our Board of Directors may take such action as it deems necessary to carry out these indemnification provisions, including adopting procedures for determining and enforcing indemnification rights and purchasing insurance policies. Our Board of Directors may also adopt bylaws, resolutions or contracts implementing indemnification arrangements as may be permitted by law. Neither the amendment nor the repeal of these indemnification provisions, nor the adoption of any provision of our Amended Certificate inconsistent with these indemnification provisions, will eliminate or reduce any rights to indemnification relating to the status of any director or any activities prior to such amendment, repeal or adoption.
194
Table of Contents
We intend to enter into separate indemnification agreements with each of our directors and executive officers, which may be broader than the specific indemnification provisions contained in Delaware law. These indemnification agreements may require us to, among other things, indemnify our directors and officers against liabilities that may arise by reason of their status or service as directors or officers, other than liabilities arising from willful misconduct. These indemnification agreements may also require us to advance any expenses incurred by the directors or officers as a result of any proceeding against them as to which they could be indemnified and to obtain directors’ and officers’ insurance, if available on reasonable terms.
Currently, to our knowledge, there is no pending litigation or proceeding involving any of our directors, officers, employees or agents in which indemnification by us is sought, nor are we aware of any threatened litigation or proceeding that may result in a claim for indemnification.
We believe these provisions will assist in attracting and retaining qualified individuals to serve as directors.
Listing
We have applied to list our shares of common stock on the NASDAQ under the symbol “PSDO.”
Transfer Agent and Registrar
The transfer agent and registrar for our common stock will be Broadridge Corporate Issuer Solutions, Inc.
195
Table of Contents
SHARES ELIGIBLE FOR FUTURE SALE
Prior to this Offering, there has been no public market for our common stock and no predictions can be made about the effect, if any, that market sales of shares of our common stock or the availability of such shares for sale will have on the market price prevailing from time to time. Nevertheless, the actual sale of, or the perceived potential for the sale of, our common stock in the public market may have an adverse impact on the market price for the common stock and could impair our ability to raise capital through future sales of our securities. See “Risk Factors—Risks Related to an Investment in Our Common Stock and this Offering—Future sales or the possibility of future sales of a substantial amount of our common stock may depress the price of shares of our common stock.”
Sale of Restricted Shares
Upon completion of this Offering, we will have an aggregate of shares of our common stock outstanding. Of these shares, the shares of our common stock to be sold in this Offering will be freely tradable without restriction or further registration under the Securities Act, except for any shares which may be acquired by any of our “affiliates” as that term is defined in Rule 144 under the Securities Act, which will be subject to the resale limitations of Rule 144. The remaining shares of our common stock outstanding will be restricted securities, as that term is defined in Rule 144 and may in the future be sold without restriction under the Securities Act to the extent permitted by Rule 144 or any applicable exemption under the Securities Act.
Equity Incentive Plans
We intend to file one or more registration statements on Form S-8 under the Securities Act following this Offering to register our shares of common stock that are issuable pursuant to our Amended and Restated 2015 Long-Term Incentive Plan, our 2017 Long-Term Incentive Plan, and our Employee Stock Purchase Plan. These registration statements are expected to become effective upon filing. Shares covered by these registration statements will then be eligible for sale in the public markets, subject to any applicable lock-up agreements and to Rule 144 limitations applicable to affiliates.
Lock-up Agreements
In addition to the limits placed on the sale of shares of our common stock by operation of Rule 144 and other provisions of the Securities Act, (i) our executive officers and directors have agreed, subject to certain limited exceptions, not to sell or otherwise transfer or encumber any shares of our common stock or securities convertible into common stock owned by them at the completion of this Offering or thereafter acquired by them for a period of days after the date of this prospectus, without the prior written consent of J.P. Morgan Securities LLC and Citigroup Global Markets Inc., (ii) the Apollo Funds have agreed, subject to certain limited exceptions, not to sell or otherwise transfer or encumber any shares of our common stock or securities convertible into common stock owned by the Apollo Funds at the completion of this Offering or thereafter acquired by the Apollo Funds for a period of days after the date of this prospectus, without the prior written consent of J.P. Morgan Securities LLC and Citigroup Global Markets Inc. and (iii) we have agreed that we will not offer, sell, contract to sell, pledge or otherwise dispose of, directly or indirectly, enter into any swap or other arrangement that transfers to another, in whole or in part, any of the economic consequences of the ownership of, or file with the SEC a registration statement under the Securities Act relating to, any shares of our common stock or securities convertible into or exchangeable or exercisable for any shares of our common stock for a period of days after the date of this prospectus, without the prior written consent of J.P. Morgan Securities LLC and Citigroup Global Markets Inc., subject to certain limited exceptions set forth in “Underwriting (Conflicts of Interest).”
196
Table of Contents
Rule 144
In general, under Rule 144 as currently in effect, beginning 90 days after the completion of this Offering, a person (or persons whose common stock is required to be aggregated), who is an affiliate and who has beneficially owned our common stock for at least six months, is entitled to sell in any three-month period a number of shares that does not exceed the greater of:
| • | 1% of the number of shares then outstanding, which will equal approximately shares immediately after completion of this Offering; and |
| • | the average weekly trading volume in our shares on the NASDAQ during the four calendar weeks preceding the filing of a notice on Form 144 with respect to such a sale, subject to restrictions. |
A person (or persons whose shares are aggregated) who is deemed to be an affiliate of ours and who has beneficially owned restricted securities within the meaning of Rule 144 for at least six months would be entitled to sell within any three-month period a number of shares that does not exceed the greater of 1% of the then-outstanding shares of our common stock or the average weekly trading volume of our common stock during the four calendar weeks preceding such sale. Such sales are also subject to certain manner of sales provisions, notice requirements and the availability of current public information about us.
Rule 701
In general, under Rule 701 of the Securities Act, any of our directors, officers, employees, consultants or advisors who purchased shares of stock from us in connection with a compensatory stock or option plan or other written agreement before the effective date of this Offering, or who purchased shares of stock from us after that date upon the exercise of options granted before that date, are eligible to resell such shares of stock 90 days after the effective date of this Offering in reliance upon Rule 144. If such person is not an affiliate, such sale may be made subject only to the manner of sale provisions of Rule 144. If such a person is an affiliate, such sale may be made under Rule 144 without compliance with its six-month minimum holding period, but subject to the other Rule 144 restrictions described above.
197
Table of Contents
CERTAIN MATERIAL UNITED STATES FEDERAL INCOME
TAX CONSIDERATIONS FOR NON-U.S. HOLDERS
The following is a general discussion of certain material U.S. federal income tax considerations with respect to the ownership and disposition of shares of our common stock applicable to non-U.S. holders who acquire such shares in this Offering. This discussion is based on current provisions of the Internal Revenue Code, U.S. Treasury regulations promulgated thereunder and administrative rulings and court decisions in effect as of the date hereof, all of which are subject to change at any time, possibly with retroactive effect.
For purposes of this discussion, the term “non-U.S. holder” means a beneficial owner of our common stock that is not, for U.S. federal income tax purposes, a partnership or any of the following:
| • | a citizen or resident of the United States; |
| • | a corporation, or other entity taxable as a corporation for U.S. federal income tax purposes, created or organized in the United States or under the laws of the United States, any state thereof or the District of Columbia; |
| • | an estate, the income of which is includible in gross income for U.S. federal income tax purposes regardless of its source; or |
| • | a trust if (1) a court within the United States is able to exercise primary supervision over the administration of the trust and one or more U.S. persons have the authority to control all substantial decisions of the trust, or (2) it has a valid election in effect under applicable U.S. Treasury regulations to be treated as a U.S. person for U.S. federal income tax purposes. |
If an entity or arrangement treated as a partnership for U.S. federal income tax purposes holds shares of our common stock, the tax treatment of a person treated as a partner generally will depend on the status of the partner and the activities of the partnership. Persons that for U.S. federal income tax purposes are treated as a partner in a partnership holding shares of our common stock should consult their tax advisors.
This discussion assumes that a non-U.S. holder holds shares of our common stock as a capital asset within the meaning of Section 1221 of the Code (generally, property held for investment). This discussion does not address all aspects of U.S. federal income taxation that may be important to a non-U.S. holder in light of that holder’s particular circumstances or that may be applicable to holders subject to special treatment under U.S. federal income tax law (including, for example, financial institutions, brokers or dealers in securities, “controlled foreign corporations,” “passive foreign investment companies,” traders in securities that elect mark-to-market treatment, insurance companies, tax-exempt entities, holders who acquired our common stock pursuant to the exercise of employee stock options or otherwise as compensation, entities or arrangements treated as partnerships for U.S. federal income tax purposes, holders liable for the alternative minimum tax, certain former citizens or former long-term residents of the United States and holders who hold our common stock as part of a hedge, straddle, constructive sale or conversion transaction). In addition, this discussion does not address U.S. federal tax laws other than those pertaining to the U.S. federal income tax, nor does it address any aspects of the unearned income Medicare contribution tax pursuant to the Health Care and Education Reconciliation Act of 2010, any U.S. federal estate and gift taxes, or any U.S. state, local or non-U.S. taxes. Accordingly, prospective investors should consult with their own tax advisors regarding the U.S. federal, state, local, non-U.S. income and other tax considerations of acquiring, holding and disposing of shares of our common stock.
THIS SUMMARY IS FOR GENERAL INFORMATION ONLY AND IS NOT INTENDED TO CONSTITUTE A COMPLETE DESCRIPTION OF ALL TAX CONSEQUENCES RELATING TO THE OWNERSHIP AND DISPOSITION OF OUR COMMON STOCK. WE RECOMMEND THAT PROSPECTIVE HOLDERS OF OUR COMMON STOCK CONSULT WITH THEIR TAX ADVISORS
198
Table of Contents
REGARDING THE TAX CONSEQUENCES TO THEM (INCLUDING THE APPLICATION AND EFFECT OF ANY FEDERAL, STATE, LOCAL, NON-U.S. INCOME AND OTHER TAX LAWS) OF THE OWNERSHIP AND DISPOSITION OF OUR COMMON STOCK.
Dividends
In general, any distributions we make to a non-U.S. holder with respect to its shares of our common stock that constitute dividends for U.S. federal income tax purposes will be subject to U.S. withholding tax at a rate of 30% of the gross amount (or a reduced rate prescribed by an applicable income tax treaty) unless the dividends are effectively connected with a trade or business carried on by the non-U.S. holder within the United States (and, if an income tax treaty applies, are attributable to a permanent establishment of the non-U.S. holder within the United States). A distribution will constitute a dividend for U.S. federal income tax purposes to the extent of our current or accumulated earnings and profits as determined for U.S. federal income tax purposes. Any distribution not constituting a dividend will be treated as first reducing the adjusted basis in the non-U.S. holder’s shares of our common stock and, to the extent it exceeds the adjusted basis in the non-U.S. holder’s shares of our common stock, as gain from the sale or exchange of such shares. Any such gain will be subject to the treatment described below under “—Gain on Sale or Other Disposition of our Common Stock.”
Subject to the discussion below regarding “—Foreign Account Tax Compliance,” dividends effectively connected with a U.S. trade or business (and, if an income tax treaty applies, attributable to a U.S. permanent establishment) of a non-U.S. holder generally will not be subject to U.S. withholding tax if the non-U.S. holder complies with applicable certification and disclosure requirements. Instead, such dividends generally will be subject to U.S. federal income tax on a net income basis, in the same manner as if the non-U.S. holder were a resident of the United States. A non-U.S. holder that is a corporation may be subject to an additional “branch profits tax” at a rate of 30% (or such lower rate as may be specified by an applicable income tax treaty) on its “effectively connected earnings and profits,” subject to certain adjustments.
Gain on Sale or Other Disposition of Our Common Stock
In general, a non-U.S. holder will not be subject to U.S. federal income or, subject to the discussion below under the headings “Information Reporting and Backup Withholding” and “Foreign Account Tax Compliance,” withholding tax on any gain realized upon the sale or other disposition of our common stock unless:
| • | the gain is effectively connected with a trade or business carried on by the non-U.S. holder within the United States and, if required by an applicable income tax treaty, is attributable to a U.S. permanent establishment of the non-U.S. holder; |
| • | the non-U.S. holder is an individual and is present in the United States for 183 days or more in the taxable year of disposition and certain other conditions are satisfied; or |
| • | we are or have been a U.S. real property holding corporation (a “USRPHC”) for U.S. federal income tax purposes at any time within the shorter of the five-year period ending on the date of the disposition and the non-U.S. holder’s holding period and certain other conditions are satisfied. We believe that we currently are not and we do not anticipate becoming, a USRPHC. |
Gain that is effectively connected with the conduct of a trade or business in the United States generally will be subject to U.S. federal income tax, net of certain deductions, at regular U.S. federal income tax rates. If the non-U.S. holder is a foreign corporation, the branch profits tax described above also may apply to such effectively connected gain. An individual non-U.S. holder who is subject to U.S. federal income tax because the non-U.S. holder was present in the United States for 183 days or more during the year of sale or other disposition of our common stock will generally be subject to a flat 30% tax on the gain derived from such sale or other disposition, which may be offset by U.S. source capital losses, provided the Non-U.S. Holder has timely filed U.S. federal income tax returns with respect to such losses.
199
Table of Contents
Information Reporting and Backup Withholding
We must report annually to the Internal Revenue Service and to each non-U.S. holder the amount of dividends paid to and the tax withheld with respect to, each non-U.S. holder. These reporting requirements apply regardless of whether withholding was reduced or eliminated by an applicable tax treaty. Copies of this information also may be made available under the provisions of a specific treaty or agreement with the tax authorities in the country in which the non-U.S. holder resides or is established.
U.S. backup withholding tax (currently, at a rate of 28%) is imposed on certain payments to persons that fail to furnish the information required under the U.S. information reporting rules. Dividends paid to a non-U.S. holder generally will be exempt from backup withholding if the non-U.S. holder provides a properly executed IRS Form W-8BEN or W-8BEN-E, or otherwise establishes an exemption.
Under U.S. Treasury regulations, the payment of proceeds from the disposition of our common stock by a non-U.S. holder effected at a U.S. office of a broker generally will be subject to information reporting and backup withholding, unless the beneficial owner, under penalties of perjury, certifies, among other things, its status as a non-U.S. holder or otherwise establishes an exemption. The payment of proceeds from the disposition of our common stock by a non-U.S. holder effected at a non-U.S. office of a broker generally will not be subject to backup withholding and information reporting, except in the case of proceeds from a disposition of our common stock by a non-U.S. holder effected at a non-U.S. office of a broker that is:
| • | a U.S. person; |
| • | a “controlled foreign corporation” for U.S. federal income tax purposes; |
| • | a foreign person 50% or more of whose gross income from certain periods is effectively connected with a U.S. trade or business; or |
| • | a foreign partnership if at any time during its tax year (a) one or more of its partners are U.S. persons who, in the aggregate, hold more than 50% of the income or capital interests of the partnership, or (b) the foreign partnership is engaged in a U.S. trade or business. |
Information reporting will apply unless the broker has documentary evidence in its files that the owner is a non-U.S. holder and certain other conditions are satisfied, or the beneficial owner otherwise establishes an exemption (and the broker has no knowledge or reason to know to the contrary). Backup withholding will apply if the sale is subject to information reporting and the broker has actual knowledge that the owner is a U.S. person.
Backup withholding is not an additional tax. Any amounts withheld under the backup withholding rules from a payment to a non-U.S. holder generally can be refunded or credited against the non-U.S. holder’s U.S. federal income tax liability, if any, provided that the required information is furnished to the Internal Revenue Service in a timely manner. Non-U.S. holders should consult their tax advisors regarding the application of the information reporting and backup withholding rules to them.
Foreign Account Tax Compliance
Under Sections 1471 through 1474 of the Code and the Treasury regulations and administrative guidance promulgated thereunder (collectively, “FATCA”), a U.S. federal withholding tax of 30% generally is imposed on any dividends paid on our common stock and a U.S. federal withholding tax of 30% generally will be imposed on gross proceeds from the disposition of our common stock (beginning January 1, 2019) paid to (i) a “foreign financial institution” (as specifically defined under FATCA) unless such institution enters into an agreement with the U.S. tax authorities to withhold on certain payments and to collect and provide to the U.S. tax authorities substantial information regarding U.S. account holders of such institution (which includes certain
200
Table of Contents
equity and debt holders of such institution, as well as certain account holders that are foreign entities with U.S. owners) and (ii) certain other foreign entities unless such entity provides the withholding agent with a certification identifying its direct and indirect “substantial U.S. owners” (as defined under FATCA) or, alternatively, provides a certification that no such owners exist and, in either case, complies with certain other requirements. The withholding tax described above will not apply if the foreign financial institution or non-financial foreign entity otherwise qualifies for an exemption from the rules and properly certifies its exempt status to a withholding agent or is deemed to be in compliance with FATCA. Application of FATCA tax does not depend on whether the payment otherwise would be exempt from U.S. federal withholding tax under the other exemptions described above. Under certain circumstances, a non-U.S. holder might be eligible for refunds or credits of such taxes. Foreign financial institutions and non-financial foreign entities located in jurisdictions that have an intergovernmental agreement with the United States governing FATCA may be subject to different rules. Prospective non-U.S. holders should consult with their tax advisors regarding the possible implications of FATCA on their investment in our common stock.
201
Table of Contents
UNDERWRITING (CONFLICTS OF INTEREST)
We are offering the shares of common stock described in this prospectus through a number of underwriters. J.P. Morgan Securities LLC and Citigroup Global Markets Inc. are acting as representatives of the underwriters. We have entered into an underwriting agreement with the underwriters. Subject to the terms and conditions of the underwriting agreement, we have agreed to sell to the underwriters and each underwriter has severally agreed to purchase, at the public offering price less the underwriting discounts and commissions set forth on the cover page of this prospectus, the number of shares of common stock listed next to its name in the following table:
| Name |
Number of Shares |
|||
| J.P. Morgan Securities LLC |
||||
| Citigroup Global Markets Inc. |
||||
| Barclays Capital Inc. |
||||
| RBC Capital Markets, LLC |
||||
| Credit Suisse Securities (USA) LLC |
||||
| Goldman, Sachs & Co. |
||||
| Wells Fargo Securities, LLC |
||||
| Evercore Group L.L.C. |
||||
| Guggenheim Securities, LLC |
||||
| Apollo Global Securities, LLC |
||||
| LionTree Advisors LLC |
||||
|
|
|
|||
| Total |
||||
|
|
|
|||
The underwriters are committed to purchase all the shares of common stock offered by us if they purchase any shares. The underwriting agreement also provides that if an underwriter defaults, the purchase commitments of non-defaulting underwriters may also be increased or this Offering may be terminated.
The underwriters propose to offer the shares of common stock directly to the public at the initial public offering price set forth on the cover page of this prospectus and to certain dealers at that price less a concession not in excess of $ per share. After the initial offering of the shares to the public, the offering price and other selling terms may be changed by the underwriters. Sales of shares made outside of the United States may be made by affiliates of the underwriters.
The underwriters have an option to buy up to additional shares of common stock from us to cover sales of shares by the underwriters which exceed the number of shares specified in the table above. The underwriters have 30 days from the date of this prospectus to exercise this option to purchase additional shares. If any shares are purchased with this option to purchase additional shares, the underwriters will purchase shares in approximately the same proportion as shown in the table above. If any additional shares of common stock are purchased, the underwriters will offer the additional shares on the same terms as those on which the shares are being offered.
202
Table of Contents
The underwriting fee is equal to the public offering price per share of common stock less the amount paid by the underwriters to us per share of common stock. The underwriting fee is $ per share. The following table shows the per share and total underwriting discounts and commissions to be paid to the underwriters assuming both no exercise and full exercise of the underwriters’ option to purchase additional shares.
| Without option to purchase additional shares exercise |
With full option to purchase additional shares exercise |
|||||||
| Per Share |
$ | $ | ||||||
| Total |
$ | $ | ||||||
We estimate that the total expenses of this Offering, including registration, filing and listing fees, printing fees and legal and accounting expenses, but excluding the underwriting discounts and commissions, will be approximately $ . We have also agreed to reimburse the underwriters for certain of their expenses in an amount up to $ .
The underwriters have agreed to reimburse us for certain expenses incurred by us in connection with this Offering upon closing of this Offering.
A prospectus in electronic format may be made available on the web sites maintained by one or more underwriters, or selling group members, if any, participating in this Offering. The underwriters may agree to allocate a number of shares to underwriters and selling group members for sale to their online brokerage account holders. Internet distributions will be allocated by the representatives to underwriters and selling group members that may make Internet distributions on the same basis as other allocations.
We have agreed that we will not (i) offer, pledge, announce the intention to sell, sell, contract to sell, sell any option or contract to purchase, purchase any option or contract to sell, grant any option, right or warrant to purchase or otherwise dispose of, directly or indirectly, or file with the SEC a registration statement under the Securities Act relating to, any shares of our common stock or securities convertible into or exchangeable or exercisable for any shares of our common stock, or publicly disclose the intention to make any offer, sale, pledge, disposition or filing, or (ii) enter into any swap or other arrangement that transfers all or a portion of the economic consequences associated with the ownership of any shares of common stock or any such other securities (regardless of whether any of these transactions are to be settled by the delivery of shares of common stock or such other securities, in cash or otherwise), in each case without the prior written consent of J.P. Morgan Securities LLC and Citigroup Global Markets Inc. for a period of days after the date of this prospectus, other than the shares of our common stock to be sold hereunder and certain other exceptions.
Our directors and executive officers and certain of our shareholders have entered into lock-up agreements with the underwriters prior to the commencement of this Offering pursuant to which each of these persons or entities, with limited exceptions, for a period of days after the date of this prospectus, may not, without the prior written consent of J.P. Morgan Securities LLC and Citigroup Global Markets Inc., (1) offer, pledge, announce the intention to sell, sell, contract to sell, sell any option or contract to purchase, purchase any option or contract to sell, grant any option, right or warrant to purchase, or otherwise transfer or dispose of, directly or indirectly, any shares of our common stock or any securities convertible into or exercisable or exchangeable for our common stock (including, without limitation, common stock or such other securities which may be deemed to be beneficially owned by such directors, executive officers, managers and members in accordance with the rules and regulations of the SEC and securities which may be issued upon exercise of a stock option or warrant) or (2) enter into any swap or other agreement that transfers, in whole or in part, any of the economic consequences of ownership of the common stock or such other securities, whether any such transaction described in clause (1) or (2) above is to be settled by delivery of common stock or such other securities, in cash or otherwise, or (3) make any demand for or exercise any right with respect to the registration of any shares of our common stock or any security convertible into or exercisable or exchangeable for our common stock.
203
Table of Contents
We have agreed to indemnify the underwriters against certain liabilities, including liabilities under the Securities Act of 1933.
We have applied to have our common stock approved for listing/quotation on the NASDAQ under the symbol “PSDO.”
In connection with this Offering, the underwriters may engage in stabilizing transactions, which involves making bids for, purchasing and selling shares of common stock in the open market for the purpose of preventing or retarding a decline in the market price of the common stock while this Offering is in progress. These stabilizing transactions may include making short sales of the common stock, which involves the sale by the underwriters of a greater number of shares of common stock than they are required to purchase in this Offering and purchasing shares of common stock on the open market to cover positions created by short sales. Short sales may be “covered” shorts, which are short positions in an amount not greater than the underwriters’ option to purchase additional shares referred to above, or may be “naked” shorts, which are short positions in excess of that amount. The underwriters may close out any covered short position either by exercising their option to purchase additional shares, in whole or in part, or by purchasing shares in the open market. In making this determination, the underwriters will consider, among other things, the price of shares available for purchase in the open market compared to the price at which the underwriters may purchase shares through the option to purchase additional shares. A naked short position is more likely to be created if the underwriters are concerned that there may be downward pressure on the price of the common stock in the open market that could adversely affect investors who purchase in this Offering. To the extent that the underwriters create a naked short position, they will purchase shares in the open market to cover the position.
These activities may have the effect of raising or maintaining the market price of the common stock or preventing or retarding a decline in the market price of the common stock and, as a result, the price of the common stock may be higher than the price that otherwise might exist in the open market. If the underwriters commence these activities, they may discontinue them at any time. The underwriters may carry out these transactions on the NASDAQ, in the over-the-counter market or otherwise.
Prior to this Offering, there has been no public market for our common stock. The initial public offering price will be determined by negotiations between us and the representatives of the underwriters. In determining the initial public offering price, we and the representatives of the underwriters expect to consider a number of factors including:
| • | the information set forth in this prospectus and otherwise available to the representatives; |
| • | our prospects and the history and prospects for the industry in which we compete; |
| • | an assessment of our management; |
| • | our prospects for future earnings; |
| • | the general condition of the securities markets at the time of this Offering; |
| • | the recent market prices of and demand for, publicly traded common stock of generally comparable companies; and |
| • | other factors deemed relevant by the underwriters and us. |
Neither we nor the underwriters can assure investors that an active trading market will develop for our shares of common stock, or that the shares will trade in the public market at or above the initial public offering price.
204
Table of Contents
Other than in the United States, no action has been taken by us or the underwriters that would permit a public offering of the securities offered by this prospectus in any jurisdiction where action for that purpose is required. The securities offered by this prospectus may not be offered or sold, directly or indirectly, nor may this prospectus or any other offering material or advertisements in connection with the offer and sale of any such securities be distributed or published in any jurisdiction, except under circumstances that will result in compliance with the applicable rules and regulations of that jurisdiction. Persons into whose possession this prospectus comes are advised to inform themselves about and to observe any restrictions relating to this Offering and the distribution of this prospectus. This prospectus does not constitute an offer to sell or a solicitation of an offer to buy any securities offered by this prospectus in any jurisdiction in which such an offer or a solicitation is unlawful.
Notice to Prospective Investors in Canada
The shares may be sold only to purchasers purchasing, or deemed to be purchasing, as principal, that are accredited investors, as defined in National Instrument 45-106 Prospectus Exemptions or subsection 73.3(1) of the Securities Act (Ontario) and are permitted clients, as defined in National Instrument 31-103 Registration Requirements, Exemptions and Ongoing Registrant Obligations. Any resale of the shares must be made in accordance with an exemption from, or in a transaction not subject to, the prospectus requirements of applicable securities laws.
Securities legislation in certain provinces or territories of Canada may provide a purchaser with remedies for rescission or damages if this prospectus (including any amendment thereto) contains a misrepresentation, provided that the remedies for rescission or damages are exercised by the purchaser within the time limit prescribed by the securities legislation of the purchaser’s province or territory. The purchaser should refer to any applicable provisions of the securities legislation of the purchaser’s province or territory for particulars of these rights or consult with a legal advisor.
Pursuant to section 3A.3 of National Instrument 33-105 Underwriting Conflicts (“NI 33-105”), the underwriters are not required to comply with the disclosure requirements of NI 33-105 regarding underwriter conflicts of interest in connection with this Offering.
Notice to Prospective Investors in the European Economic Area
In relation to each Member State of the European Economic Area (each, a “Relevant Member State”), no offer of shares may be made to the public in that Relevant Member State other than:
| A. | to any legal entity which is a qualified investor as defined in the Prospectus Directive; |
| B. | to fewer than 100 or, if the Relevant Member State has implemented the relevant provision of the 2010 PD Amending Directive, 150, natural or legal persons (other than qualified investors as defined in the Prospectus Directive), as permitted under the Prospectus Directive, subject to obtaining the prior consent of the representatives; or |
| C. | in any other circumstances falling within Article 3(2) of the Prospectus Directive, |
provided that no such offer of shares shall require the Company or the representatives to publish a prospectus pursuant to Article 3 of the Prospectus Directive or supplement a prospectus pursuant to Article 16 of the Prospectus Directive.
Each person in a Relevant Member State who initially acquires any shares or to whom any offer is made will be deemed to have represented, acknowledged and agreed that it is a “qualified investor” within the meaning of the law in that Relevant Member State implementing Article 2(1)(e) of the Prospectus Directive. In the case of
205
Table of Contents
any shares being offered to a financial intermediary as that term is used in Article 3(2) of the Prospectus Directive, each such financial intermediary will be deemed to have represented, acknowledged and agreed that the shares acquired by it in the offer have not been acquired on a non-discretionary basis on behalf of, nor have they been acquired with a view to their offer or resale to, persons in circumstances which may give rise to an offer of any shares to the public other than their offer or resale in a Relevant Member State to qualified investors as so defined or in circumstances in which the prior consent of the representatives has been obtained to each such proposed offer or resale.
The Company, the representatives and their affiliates will rely upon the truth and accuracy of the foregoing representations, acknowledgements and agreements.
This prospectus has been prepared on the basis that any offer of shares in any Relevant Member State will be made pursuant to an exemption under the Prospectus Directive from the requirement to publish a prospectus for offers of shares. Accordingly any person making or intending to make an offer in that Relevant Member State of shares which are the subject of this Offering contemplated in this prospectus may only do so in circumstances in which no obligation arises for the Company or any of the underwriters to publish a prospectus pursuant to Article 3 of the Prospectus Directive in relation to such offer. Neither the Company nor the underwriters have authorized, nor do they authorize, the making of any offer of shares in circumstances in which an obligation arises for the Company or the underwriters to publish a prospectus for such offer.
For the purpose of the above provisions, the expression “an offer to the public” in relation to any shares in any Relevant Member State means the communication in any form and by any means of sufficient information on the terms of the offer and the shares to be offered so as to enable an investor to decide to purchase or subscribe the shares, as the same may be varied in the Relevant Member State by any measure implementing the Prospectus Directive in the Relevant Member State and the expression “Prospectus Directive” means Directive 2003/71/EC (including the 2010 PD Amending Directive, to the extent implemented in the Relevant Member States) and includes any relevant implementing measure in the Relevant Member State and the expression “2010 PD Amending Directive” means Directive 2010/73/EU.
Notice to Prospective Investors in the United Kingdom
In addition, in the United Kingdom, this document is being distributed only to and is directed only at and any offer subsequently made may only be directed at persons who are “qualified investors” (as defined in the Prospectus Directive) (i) who have professional experience in matters relating to investments falling within Article 19(5) of the Financial Services and Markets Act 2000 (Financial Promotion) Order 2005, as amended (the “Order”) and/or (ii) who are high net worth companies (or persons to whom it may otherwise be lawfully communicated) falling within Article 49(2)(a) to (d) of the Order (all such persons together being referred to as “relevant persons”).
Any person in the United Kingdom that is not a relevant person should not act or rely on the information included in this document or use it as basis for taking any action. In the United Kingdom, any investment or investment activity that this document relates to may be made or taken exclusively by relevant persons. Any person in the United Kingdom that is not a relevant person should not act or rely on this document or any of its contents.
Notice to Prospective Investors in Switzerland
The shares may not be publicly offered in Switzerland and will not be listed on the SIX Swiss Exchange (“SIX”) or on any other stock exchange or regulated trading facility in Switzerland. This document does not constitute a prospectus within the meaning of and has been prepared without regard to the disclosure standards for issuance prospectuses under art. 652a or art. 1156 of the Swiss Code of Obligations or the disclosure standards for listing prospectuses under art. 27 ff. of the SIX Listing Rules or the listing rules of any other stock
206
Table of Contents
exchange or regulated trading facility in Switzerland. Neither this document nor any other offering or marketing material relating to the shares or this Offering may be publicly distributed or otherwise made publicly available in Switzerland.
Neither this document nor any other offering or marketing material relating to this Offering, the Company, the shares have been or will be filed with or approved by any Swiss regulatory authority. In particular, this document will not be filed with and the offer of shares will not be supervised by, the Swiss Financial Market Supervisory Authority FINMA (FINMA) and the offer of shares has not been and will not be authorized under the Swiss Federal Act on Collective Investment Schemes (“CISA”). The investor protection afforded to acquirers of interests in collective investment schemes under the CISA does not extend to acquirers of shares.
Notice to Prospective Investors in France
Neither this prospectus nor any other offering material relating to the shares described in this prospectus has been submitted to the clearance procedures of the Autorité des Marchés Financiers or of the competent authority of another member state of the European Economic Area and notified to the Autorité des Marchés Financiers. The shares have not been offered or sold and will not be offered or sold, directly or indirectly, to the public in France. Neither this prospectus nor any other offering material relating to the shares has been or will be:
| • | released, issued, distributed or caused to be released, issued or distributed to the public in France; or |
| • | used in connection with any offer for subscription or sale of the shares to the public in France. |
Such offers, sales and distributions will be made in France only:
| • | to qualified investors (investisseurs qualifiés) and/or to a restricted circle of investors (cercle restreint d’investisseurs), in each case investing for their own account, all as defined in and in accordance with articles L.411-2, D.411-1, D.411-2, D.734-1, D.744-1, D.754-1 and D.764-1 of the French Code monétaire et financier; |
| • | to investment services providers authorized to engage in portfolio management on behalf of third parties; or |
| • | in a transaction that, in accordance with article L.411-2-II-1°-or-2°-or 3° of the French Code monétaire et financier and article 211-2 of the General Regulations (Règlement Général) of the Autorité des Marchés Financiers, does not constitute a public offer (appel public à l’épargne). |
The shares may be resold directly or indirectly, only in compliance with articles L.411-1, L.411-2, L.412-1 and L.621-8 through L.621-8-3 of the French Code monétaire et financier.
Notice to Prospective Investors in Hong Kong
The shares may not be offered or sold in Hong Kong by means of any document other than (i) in circumstances which do not constitute an offer to the public within the meaning of the Companies Ordinance (Cap. 32, Laws of Hong Kong), or (ii) to “professional investors” within the meaning of the Securities and Futures Ordinance (Cap. 571, Laws of Hong Kong) and any rules made thereunder, or (iii) in other circumstances which do not result in the document being a “prospectus” within the meaning of the Companies Ordinance (Cap. 32, Laws of Hong Kong) and no advertisement, invitation or document relating to the shares may be issued or may be in the possession of any person for the purpose of issue (in each case whether in Hong Kong or elsewhere), which is directed at, or the contents of which are likely to be accessed or read by, the public in Hong Kong (except if permitted to do so under the laws of Hong Kong) other than with respect to shares which are or are intended to be disposed of only to persons outside of Hong Kong or only to “professional investors” within the meaning of the Securities and Futures Ordinance (Cap. 571, Laws of Hong Kong) and any rules made thereunder.
207
Table of Contents
Notice to Prospective Investors in Japan
The shares offered in this prospectus have not been and will not be registered under the Financial Instruments and Exchange Law of Japan. The shares have not been offered or sold and will not be offered or sold, directly or indirectly, in Japan or to or for the account of any resident of Japan (including any corporation or other entity organized under the laws of Japan), except (i) pursuant to an exemption from the registration requirements of the Financial Instruments and Exchange Law and (ii) in compliance with any other applicable requirements of Japanese law.
Notice to Prospective Investors in Singapore
This prospectus has not been registered as a prospectus with the Monetary Authority of Singapore. Accordingly, this prospectus and any other document or material in connection with the offer or sale, or invitation for subscription or purchase, of the shares may not be circulated or distributed, nor may the shares be offered or sold, or be made the subject of an invitation for subscription or purchase, whether directly or indirectly, to persons in Singapore other than (i) to an institutional investor under Section 274 of the Securities and Futures Act, Chapter 289 of Singapore (the “SFA”), (ii) to a relevant person pursuant to Section 275(1), or any person pursuant to Section 275(1A) and in accordance with the conditions specified in Section 275 of the SFA or (iii) otherwise pursuant to and in accordance with the conditions of, any other applicable provision of the SFA, in each case subject to compliance with conditions set forth in the SFA.
Where the shares are subscribed or purchased under Section 275 of the SFA by a relevant person that is:
| • | a corporation (which is not an accredited investor (as defined in Section 4A of the SFA)) the sole business of which is to hold investments and the entire share capital of which is owned by one or more individuals, each of whom is an accredited investor; or |
| • | a trust (where the trustee is not an accredited investor) whose sole purpose is to hold investments and each beneficiary of the trust is an individual who is an accredited investor, |
shares, debentures and units of shares and debentures of that corporation or the beneficiaries’ rights and interest (howsoever described) in that trust shall not be transferred within six months after that corporation or that trust has acquired the shares pursuant to an offer made under Section 275 of the SFA except:
| • | to an institutional investor (for corporations, under Section 274 of the SFA) or to a relevant person defined in Section 275(2) of the SFA, or to any person pursuant to an offer that is made on terms that such shares, debentures and units of shares and debentures of that corporation or such rights and interest in that trust are acquired at a consideration of not less than S$200,000 (or its equivalent in a foreign currency) for each transaction, whether such amount is to be paid for in cash or by exchange of securities or other assets and further for corporations, in accordance with the conditions specified in Section 275 of the SFA; |
| • | where no consideration is or will be given for the transfer; or |
| • | where the transfer is by operation of law. |
Conflicts of Interest
The Apollo Funds own in excess of 10% of our issued and outstanding ordinary shares. An alternative investment vehicle formed by the limited partners of the Apollo Funds owns substantially all of the economic interests in the Subordinated Notes pursuant to certain derivative arrangements entered into with Deutsche Bank AG and, therefore, will receive in excess of 5% of the net proceeds of this Offering. Because the Apollo Funds
208
Table of Contents
are affiliated with Apollo Global Securities, LLC, an underwriter on this Offering, Apollo Global Securities, LLC is deemed to have a “conflict of interest under FINRA Rule 5121. Accordingly, this Offering will be conducted in compliance with FINRA Rule 5121. Pursuant to that rule, the appointment of a “qualified independent underwriter” is not required in connection with this Offering as the members primarily responsible for managing the public offering do not have conflict of interest, are not affiliates of any member that has conflict of interest and meet the requirements of paragraph (f)(12)(E) of FINRA Rule 5121. Apollo Global Securities, LLC will not confirm any sales to any account over which it exercises discretionary authority without the specific written approval of the account holder. See “Principal Stockholders” and “Use of Proceeds” for additional information.
Other Relationships
Certain of the underwriters and their affiliates have provided in the past to us and our affiliates and may provide from time to time in the future certain commercial banking, financial advisory, investment banking and other services for us and such affiliates in the ordinary course of their business, for which they have received and may continue to receive customary fees and commissions. Affiliates of Citigroup Global Markets Inc., Barclays Capital Inc., RBC Capital Markets, LLC, Credit Suisse Securities (USA) LLC and Goldman, Sachs & Co. are lenders and/or agents under and/or served as joint lead arrangers and joint bookrunners under the February 2015 Credit Facilities; Citigroup Global Markets Inc., Barclays Capital Inc., RBC Capital Markets, LLC, Credit Suisse Securities (USA) LLC and Goldman, Sachs & Co. were initial purchasers of the Notes; and affiliates of Wells Fargo Securities, LLC are party to the CPC Facility. In addition, from time to time, certain of the underwriters and their affiliates may effect transactions for their own account or the account of customers and hold on behalf of themselves or their customers, long or short positions in our debt or equity securities or loans and may do so in the future.
209
Table of Contents
Wachtell, Lipton, Rosen & Katz, New York, New York, will pass upon for us the validity of the shares of our common stock offered hereby. The underwriters have been represented by Latham & Watkins LLP, New York, New York.
The consolidated financial statements of Presidio, Inc. as of June 30, 2016 and 2015 and for the year ended June 30, 2016 (Successor) and for the periods from November 20, 2014 to June 30, 2015 (Successor) and July 1, 2014 to February 1, 2015 (Predecessor) and for the year ended June 30, 2014 (Predecessor) have been audited by RSM US LLP, an independent public accounting firm, as stated in its report appearing herein and are included in reliance upon such report given on the authority of such firm as experts in accounting and auditing.
Certain statistical and market data contained herein have been derived from and included herein in reliance upon, the market research report prepared by Gartner, Inc., an independent provider of research and analysis on the global IT industry, commissioned by the Company and issued on May 10, 2016 and upon the authority of said firm as experts with respect to the matters covered by its report.
None of the experts named above own any registered or beneficial interest, direct or indirect, in any securities or other property of the Company or any of our associates or affiliates.
We have filed with the SEC a registration statement on Form S-1 under the Securities Act relating to the common stock that includes important business and financial information about us that is not included in or delivered with this prospectus. If we have made references in this prospectus to any contracts, agreements or other documents and also filed any of those contracts, agreements or other documents as exhibits to the registration statement, you should read the relevant exhibit for a more complete understanding of the document or the matter involved. The SEC maintains a website that contains reports, proxy and information statements and other information regarding issuers that file with the SEC. The website address is http://www.sec.gov/edgar.shtml.
You may obtain copies of the information and documents incorporated by reference in this prospectus at no charge by writing or telephoning us at the following address or telephone number:
Presidio, Inc. One Penn Plaza, Suite 2832 New York, New York 10119 (212) 652-5700 Attention: Investor Relations
We also maintain a website at http://www.Presidio.com. We will, as soon as reasonably practicable after the electronic filing of our annual report on Form 10-K, quarterly reports on Form 10-Q, current reports on Form 8-K and amendments to those reports (if applicable), make available such reports free of charge on our website. Our website and the information contained therein or connected thereto shall not be deemed to be incorporated into this prospectus or the registration statement of which this prospectus forms a part and you should not rely on any such information in making your decision whether to purchase our securities.
210
Table of Contents
Index to Consolidated Financial Statements
| Audited Consolidated Financial Statements | ||||
| F-2 | ||||
| Consolidated Balance Sheets – As of June 30, 2016 and June 30, 2015 |
F-3 | |||
| F-4 | ||||
| F-5 | ||||
| F-7 | ||||
| F-8 | ||||
| F-58 | ||||
| F-63 | ||||
| Unaudited Interim Consolidated Financial Statements |
||||
| Consolidated Balance Sheets – As of December 31, 2016 and June 30, 2016 |
F-64 | |||
| Consolidated Statements of Operations – For the six months ended December 31, 2016 and 2015 |
F-65 | |||
| Consolidated Statements of Cash Flows – For the six months ended December 31, 2016 and 2015 |
F-66 | |||
| F-67 | ||||
| F-68 | ||||
F-1
Table of Contents
Report of Independent Registered Public Accounting Firm
To the Board of Directors and Stockholders
Presidio, Inc.
We have audited the accompanying consolidated balance sheets of Presidio, Inc. and subsidiaries (the Company) as of June 30, 2016 and 2015, and the related consolidated statements of operations, changes in stockholders’ equity, and cash flows for the year ended June 30, 2016 (Successor), the period from November 20, 2014 through June 30, 2015 (Successor), the period from July 1, 2014 through February 1, 2015 (Predecessor) and the year ended June 30, 2014 (Predecessor). Our audits also included the accompanying financial statement schedules of Presidio, Inc. These financial statements and financial statement schedules are (Schedule I and Schedule II) the responsibility of the Company’s management. Our responsibility is to express an opinion on these financial statements and financial statement schedules based on our audits.
We conducted our audits in accordance with the standards of the Public Company Accounting Oversight Board (United States). Those standards require that we plan and perform the audit to obtain reasonable assurance about whether the financial statements are free of material misstatement. An audit includes examining, on a test basis, evidence supporting the amounts and disclosures in the financial statements. An audit also includes assessing the accounting principles used and significant estimates made by management, as well as evaluating the overall financial statement presentation. We believe that our audits provide a reasonable basis for our opinion.
In our opinion, the consolidated financial statements referred to above present fairly, in all material respects, the financial position of Presidio, Inc. and subsidiaries as of June 30, 2016 and 2015, and the results of their operations and their cash flows for the year ended June 30, 2016 (Successor), the period from November 20, 2014 through June 30, 2015 (Successor), the period from July 1, 2014 through February 1, 2015 (Predecessor), and the year ended June 30, 2014 (Predecessor), in conformity with U.S generally accepted accounting principles. Also, in our opinion, the related financial statement schedules, when considered in relation to the basic consolidated financial statements taken as a whole, present fairly, in all material respects, the information set forth therein.
/s/ RSM US LLP
McLean, Virginia
September 26, 2016
F-2
Table of Contents
Presidio, Inc.
(in millions, except share data)
| As of June 30, 2015 |
As of June 30, 2016 |
|||||||
| Assets |
||||||||
| Current Assets |
||||||||
| Cash and cash equivalents |
$ | 88.3 | $ | 33.0 | ||||
| Accounts receivable, net |
439.7 | 503.0 | ||||||
| Unbilled accounts receivable, net |
99.1 | 135.7 | ||||||
| Financing receivables, current portion |
69.1 | 83.1 | ||||||
| Inventory |
42.3 | 48.3 | ||||||
| Prepaid expenses and other current assets |
72.8 | 68.2 | ||||||
| Deferred income tax assets |
18.3 | — | ||||||
|
|
|
|
|
|||||
| Total current assets |
829.6 | 871.3 | ||||||
| Property and equipment, net |
29.5 | 32.9 | ||||||
| Equipment under operating leases, net |
3.5 | 2.9 | ||||||
| Financing receivables, less current portion |
99.0 | 102.0 | ||||||
| Goodwill |
662.5 | 781.5 | ||||||
| Identifiable intangible assets, net |
811.1 | 825.5 | ||||||
| Other assets |
9.2 | 7.0 | ||||||
|
|
|
|
|
|||||
| Total assets |
$ | 2,444.4 | $ | 2,623.1 | ||||
|
|
|
|
|
|||||
| Liabilities and Stockholders’ Equity |
||||||||
| Current Liabilities |
||||||||
| Current maturities of long-term debt |
$ | 5.8 | $ | 7.4 | ||||
| Accounts payable – trade |
360.4 | 382.3 | ||||||
| Accounts payable – floor plan |
161.9 | 223.3 | ||||||
| Accrued expenses and other current liabilities |
162.8 | 167.1 | ||||||
| Discounted financing receivables, current portion |
65.9 | 75.3 | ||||||
|
|
|
|
|
|||||
| Total current liabilities |
756.8 | 855.4 | ||||||
| Long-term debt, net of debt issuance costs and current maturities |
927.9 | 1,030.6 | ||||||
| Discounted financing receivables, less current portion |
91.1 | 87.1 | ||||||
| Deferred income tax liabilities |
325.9 | 288.0 | ||||||
| Other liabilities |
6.9 | 15.1 | ||||||
|
|
|
|
|
|||||
| Total liabilities |
2,108.6 | 2,276.2 | ||||||
| Commitments and contingencies (Note 13) |
||||||||
| Stockholders’ Equity |
||||||||
| Preferred stock; $0.01 par value; 100 shares authorized, zero shares issued and outstanding at June 30, 2016 and June 30, 2015 |
— | — | ||||||
| Common stock; $0.01 par value; 100,000,000 shares authorized, 35,961,418 shares issued and outstanding at June 30, 2016; $0.01 par value; 100,000,000 shares authorized, 35,245,974 shares issued and outstanding at June 30, 2015 |
0.4 | 0.4 | ||||||
| Additional paid-in capital |
359.7 | 374.2 | ||||||
| Accumulated deficit |
(24.3 | ) | (27.7 | ) | ||||
|
|
|
|
|
|||||
| Total stockholders’ equity |
335.8 | 346.9 | ||||||
|
|
|
|
|
|||||
| Total liabilities and stockholders’ equity |
$ | 2,444.4 | $ | 2,623.1 | ||||
|
|
|
|
|
|||||
See Notes to the Consolidated Financial Statements.
F-3
Table of Contents
Presidio, Inc.
Consolidated Statements of Operations
(in millions, except share data)
| Predecessor | Successor | |||||||||||||||||||
| Year ended June 30, 2014 |
July 1, 2014 to February 1, 2015 |
November 20, 2014 to June 30, 2015 |
Year ended June 30, 2016 |
|||||||||||||||||
| Revenue |
||||||||||||||||||||
| Product |
$ | 1,945.0 | $ | 1,201.4 | $ | 848.0 | $ | 2,319.8 | ||||||||||||
| Service |
321.0 | 191.4 | 137.5 | 395.1 | ||||||||||||||||
|
|
|
|
|
|
|
|
|
|||||||||||||
| Total revenue |
2,266.0 | 1,392.8 | 985.5 | 2,714.9 | ||||||||||||||||
| Cost of revenue |
||||||||||||||||||||
| Product |
1,561.1 | 952.9 | 679.9 | 1,866.5 | ||||||||||||||||
| Service |
250.9 | 150.6 | 108.6 | 307.8 | ||||||||||||||||
|
|
|
|
|
|
|
|
|
|||||||||||||
| Total cost of revenue |
1,812.0 | 1,103.5 | 788.5 | 2,174.3 | ||||||||||||||||
|
|
|
|
|
|
|
|
|
|||||||||||||
| Gross margin |
454.0 | 289.3 | 197.0 | 540.6 | ||||||||||||||||
| Operating expenses |
||||||||||||||||||||
| Selling expenses |
211.1 | 137.6 | 94.4 | 248.2 | ||||||||||||||||
| General and administrative expenses |
90.7 | 59.9 | 40.5 | 96.9 | ||||||||||||||||
| Transaction costs |
14.8 | 42.6 | 21.3 | 20.6 | ||||||||||||||||
| Depreciation and amortization |
45.9 | 22.4 | 30.2 | 76.0 | ||||||||||||||||
|
|
|
|
|
|
|
|
|
|||||||||||||
| Total operating expenses |
362.5 | 262.5 | 186.4 | 441.7 | ||||||||||||||||
|
|
|
|
|
|
|
|
|
|||||||||||||
| Operating income |
91.5 | 26.8 | 10.6 | 98.9 | ||||||||||||||||
| Interest and other (income) expense |
||||||||||||||||||||
| Interest expense |
34.3 | 21.4 | 46.7 | 81.9 | ||||||||||||||||
| Gain on interest rate swap agreements |
(2.2 | ) | — | — | — | |||||||||||||||
| Loss on disposal of business |
— | — | — | 6.8 | ||||||||||||||||
| Loss on extinguishment of debt |
2.7 | 7.5 | 0.7 | 9.7 | ||||||||||||||||
| Other (income) expense, net |
(0.2 | ) | (0.2 | ) | 0.1 | 0.1 | ||||||||||||||
|
|
|
|
|
|
|
|
|
|||||||||||||
| Total interest and other (income) expense |
34.6 | 28.7 | 47.5 | 98.5 | ||||||||||||||||
|
|
|
|
|
|
|
|
|
|||||||||||||
| Income (loss) before income taxes |
56.9 | (1.9 | ) | (36.9 | ) | 0.4 | ||||||||||||||
| Income tax expense (benefit) |
24.4 | 3.2 | (12.6 | ) | 3.8 | |||||||||||||||
|
|
|
|
|
|
|
|
|
|||||||||||||
| Net income (loss) |
$ | 32.5 | $ | (5.1 | ) | $ | (24.3 | ) | $ | (3.4 | ) | |||||||||
|
|
|
|
|
|
|
|
|
|||||||||||||
| Earnings (loss) per share: |
||||||||||||||||||||
| Basic |
$ | 0.06 | $ | (0.01 | ) | $ | (0.69 | ) | $ | (0.10 | ) | |||||||||
| Diluted |
$ | 0.06 | $ | (0.01 | ) | $ | (0.69 | ) | $ | (0.10 | ) | |||||||||
See Notes to the Consolidated Financial Statements.
F-4
Table of Contents
Presidio, Inc.
Consolidated Statements of Cash Flows
(in millions)
| Predecessor | Successor | |||||||||||||||
| Year ended June 30, 2014 |
July 1, 2014 to February 1, 2015 |
November 20, 2014 to June 30, 2015 |
Year ended June 30, 2016 |
|||||||||||||
| Cash flows from operating activities: |
||||||||||||||||
| Net income (loss) |
$ | 32.5 | $ | (5.1 | ) | $ | (24.3 | ) | $ | (3.4 | ) | |||||
| Adjustments to reconcile net income (loss) to net cash provided by (used in) operating activities: |
||||||||||||||||
| Amortization of intangible assets |
38.3 | 18.3 | 26.4 | 67.2 | ||||||||||||
| Depreciation of property and equipment in operating expenses |
7.6 | 4.1 | 3.8 | 8.8 | ||||||||||||
| Depreciation of property and equipment in cost of revenue |
4.7 | 2.5 | 1.9 | 5.7 | ||||||||||||
| Provision for sales returns and credit losses |
3.1 | 1.1 | 0.2 | 1.5 | ||||||||||||
| Amortization of debt issuance costs |
4.4 | 2.4 | 2.7 | 7.6 | ||||||||||||
| Gain on interest rate swap agreement |
(2.2 | ) | — | — | — | |||||||||||
| Loss on disposal of business |
— | — | — | 6.8 | ||||||||||||
| Loss on extinguishment of debt |
2.7 | 7.5 | 0.5 | 9.2 | ||||||||||||
| Noncash lease income |
(6.5 | ) | (5.9 | ) | (2.0 | ) | (5.0 | ) | ||||||||
| Share-based compensation expense |
5.5 | 20.1 | 1.0 | 2.2 | ||||||||||||
| Deferred income tax expense (benefit) |
(11.7 | ) | 3.5 | (13.0 | ) | (19.6 | ) | |||||||||
| Excess tax benefits on share-based compensation |
(0.1 | ) | (7.5 | ) | — | — | ||||||||||
| Other |
1.9 | 0.3 | 0.4 | — | ||||||||||||
| Change in assets and liabilities, net of acquisitions and dispositions: |
||||||||||||||||
| Unbilled and accounts receivable |
(47.7 | ) | (40.5 | ) | 6.4 | (37.6 | ) | |||||||||
| Inventory |
(0.8 | ) | 8.7 | (13.0 | ) | (4.5 | ) | |||||||||
| Prepaid expenses and other assets |
(16.9 | ) | (12.0 | ) | 10.3 | 13.5 | ||||||||||
| Accounts payable – trade |
6.2 | 56.4 | (13.9 | ) | 21.7 | |||||||||||
| Accrued expenses and other liabilities |
32.3 | 20.6 | 10.8 | 11.5 | ||||||||||||
|
|
|
|
|
|
|
|
|
|||||||||
| Net cash provided by (used in) operating activities |
53.3 | 74.5 | (1.8 | ) | 85.6 | |||||||||||
|
|
|
|
|
|
|
|
|
|||||||||
| Cash flows from investing activities: |
||||||||||||||||
| Acquisitions of businesses, net of cash and cash equivalents acquired |
— | — | (645.8 | ) | (251.3 | ) | ||||||||||
| Proceeds from disposition of business |
— | — | — | 36.3 | ||||||||||||
| Additions of equipment under sales-type and direct financing leases |
(70.8 | ) | (76.0 | ) | (33.6 | ) | (95.4 | ) | ||||||||
| Proceeds from collection of financing receivables |
6.9 | 14.0 | 5.8 | 6.5 | ||||||||||||
| Additions to equipment under operating leases |
(2.7 | ) | (1.3 | ) | (0.2 | ) | (2.7 | ) | ||||||||
| Proceeds from disposition of equipment under operating leases |
1.5 | 0.6 | 0.3 | 1.0 | ||||||||||||
| Purchases of property and equipment |
(9.3 | ) | (8.6 | ) | (5.4 | ) | (16.4 | ) | ||||||||
|
|
|
|
|
|
|
|
|
|||||||||
| Net cash used in investing activities |
(74.4 | ) | (71.3 | ) | (678.9 | ) | (322.0 | ) | ||||||||
|
|
|
|
|
|
|
|
|
|||||||||
F-5
Table of Contents
Presidio, Inc.
Consolidated Statements of Cash Flows (Continued)
(in millions)
| Predecessor | Successor | |||||||||||||||
| Year ended June 30, 2014 |
July 1, 2014 to February 1, 2015 |
November 20, 2014 to June 30, 2015 |
Year ended June 30, 2016 |
|||||||||||||
| Cash flows from financing activities: |
||||||||||||||||
| Proceeds from the issuance of common stock |
0.1 | — | 337.8 | — | ||||||||||||
| Repurchases of common stock |
— | — | — | (0.1 | ) | |||||||||||
| Repayments of note payable to former shareholder |
(3.0 | ) | — | — | — | |||||||||||
| Dividends |
(258.7 | ) | — | — | — | |||||||||||
| Payments of future consideration on acquisitions |
(4.3 | ) | (5.6 | ) | — | (10.3 | ) | |||||||||
| Excess tax benefits on share-based compensation |
0.1 | 7.5 | — | — | ||||||||||||
| Deferred financing costs |
(0.4 | ) | — | (27.1 | ) | (1.2 | ) | |||||||||
| Proceeds from the discounting of financing receivables |
74.5 | 65.6 | 44.6 | 86.4 | ||||||||||||
| Retirements of discounted financing receivables |
(6.8 | ) | (3.2 | ) | (4.3 | ) | (4.2 | ) | ||||||||
| Net (repayments) borrowings on the Receivables Securitization Facility |
(44.2 | ) | 40.0 | (40.0 | ) | 5.0 | ||||||||||
| Borrowings of senior and subordinated notes |
— | — | 400.0 | — | ||||||||||||
| Repayments of senior and subordinated notes |
— | — | — | (65.8 | ) | |||||||||||
| Borrowings of term loans, net of original issue discount |
646.9 | — | 582.0 | 306.6 | ||||||||||||
| Repayments of term loans |
(403.7 | ) | (80.0 | ) | (574.8 | ) | (156.2 | ) | ||||||||
| Net borrowings (repayments) on floor plan facility |
20.5 | (29.0 | ) | 50.8 | 20.9 | |||||||||||
|
|
|
|
|
|
|
|
|
|||||||||
| Net cash provided by (used in) financing activities |
21.0 | (4.7 | ) | 769.0 | 181.1 | |||||||||||
|
|
|
|
|
|
|
|
|
|||||||||
| Net increase (decrease) in cash and cash equivalents |
(0.1 | ) | (1.5 | ) | 88.3 | (55.3 | ) | |||||||||
| Cash and cash equivalents: |
||||||||||||||||
| Beginning of the period |
8.6 | 8.5 | — | 88.3 | ||||||||||||
|
|
|
|
|
|
|
|
|
|||||||||
| End of the period |
$ | 8.5 | $ | 7.0 | $ | 88.3 | $ | 33.0 | ||||||||
|
|
|
|
|
|
|
|
|
|||||||||
| Supplemental disclosures of cash flow information |
||||||||||||||||
| Cash paid (received) during the period for: |
||||||||||||||||
| Interest |
$ | 27.5 | $ | 24.7 | $ | 26.1 | $ | 74.0 | ||||||||
| Income taxes, net of refunds |
$ | 26.1 | $ | 14.6 | $ | (6.4 | ) | $ | 23.7 | |||||||
| Reduction of discounted lease assets and liabilities |
$ | 53.1 | $ | 40.1 | $ | 26.1 | $ | 82.8 | ||||||||
See Notes to the Consolidated Financial Statements.
F-6
Table of Contents
Presidio, Inc.
Consolidated Statements of Stockholders’ Equity
(in millions, except share data)
| Preferred stock | Common stock | Additional paid-in capital |
Accumulated earnings (deficit) |
Total | ||||||||||||||||||||||||
| Predecessor |
Shares | Amount | Shares | Amount | ||||||||||||||||||||||||
| Balance, June 30, 2013 |
— | $ | — | 561,493,999 | $ | 5.6 | $ | 276.3 | $ | 34.9 | $ | 316.8 | ||||||||||||||||
| Common stock issued for share-based awards |
— | — | 390,476 | — | 0.1 | — | 0.1 | |||||||||||||||||||||
| Net income |
— | — | — | — | — | 32.5 | 32.5 | |||||||||||||||||||||
| Dividends |
— | — | — | — | (198.3 | ) | (60.4 | ) | (258.7 | ) | ||||||||||||||||||
| Excess tax benefits on share-based awards |
— | — | — | — | 0.1 | — | 0.1 | |||||||||||||||||||||
| Share-based compensation expense |
— | — | — | — | 5.7 | — | 5.7 | |||||||||||||||||||||
|
|
|
|
|
|
|
|
|
|
|
|
|
|
|
|||||||||||||||
| Balance, June 30, 2014 |
— | — | 561,884,475 | 5.6 | 83.9 | 7.0 | 96.5 | |||||||||||||||||||||
| Common stock issued for share-based awards |
— | — | 53,757 | — | — | — | — | |||||||||||||||||||||
| Net loss |
— | — | — | — | — | (5.1 | ) | (5.1 | ) | |||||||||||||||||||
| Excess tax benefits on share-based awards |
— | — | — | — | 7.5 | — | 7.5 | |||||||||||||||||||||
| Share-based compensation expense |
— | — | — | — | 17.3 | — | 17.3 | |||||||||||||||||||||
|
|
|
|
|
|
|
|
|
|
|
|
|
|
|
|||||||||||||||
| Balance, February 1, 2015 |
— | $ | — | 561,938,232 | $ | 5.6 | $ | 108.7 | $ | 1.9 | $ | 116.2 | ||||||||||||||||
|
|
|
|
|
|
|
|
|
|
|
|
|
|
|
|||||||||||||||
| Successor |
||||||||||||||||||||||||||||
| Balance, November 20, 2014 |
— | $ | — | — | $ | — | $ | — | $ | — | $ | — | ||||||||||||||||
| Common stock issued for cash |
— | — | 33,780,000 | 0.3 | 337.5 | — | 337.8 | |||||||||||||||||||||
| Common stock issued for acquisitions |
— | — | 1,465,974 | 0.1 | 21.2 | — | 21.3 | |||||||||||||||||||||
| Net loss |
— | — | — | — | — | (24.3 | ) | (24.3 | ) | |||||||||||||||||||
| Share-based compensation expense |
— | — | — | — | 1.0 | — | 1.0 | |||||||||||||||||||||
|
|
|
|
|
|
|
|
|
|
|
|
|
|
|
|||||||||||||||
| Balance, June 30, 2015 |
— | — | 35,245,974 | 0.4 | 359.7 | (24.3 | ) | 335.8 | ||||||||||||||||||||
| Common stock issued for share-based awards |
— | — | 11,928 | — | — | — | — | |||||||||||||||||||||
| Common stock issued for acquisitions |
— | — | 708,516 | — | 12.4 | — | 12.4 | |||||||||||||||||||||
| Repurchase of common stock |
— | — | (5,000 | ) | — | (0.1 | ) | — | (0.1 | ) | ||||||||||||||||||
| Net loss |
— | — | — | — | — | (3.4 | ) | (3.4 | ) | |||||||||||||||||||
| Share-based compensation expense |
— | — | — | — | 2.2 | — | 2.2 | |||||||||||||||||||||
|
|
|
|
|
|
|
|
|
|
|
|
|
|
|
|||||||||||||||
| Balance, June 30, 2016 |
— | $ | — | 35,961,418 | $ | 0.4 | $ | 374.2 | $ | (27.7 | ) | $ | 346.9 | |||||||||||||||
|
|
|
|
|
|
|
|
|
|
|
|
|
|
|
|||||||||||||||
See Notes to the Consolidated Financial Statements.
F-7
Table of Contents
Presidio, Inc.
Notes to Consolidated Financial Statements
Note 1. Nature of Business and Significant Accounting Policies
Description of the Company
Presidio, Inc., formerly named Aegis Holdings, Inc. (“Aegis”), is a Delaware corporation that was incorporated on November 20, 2014 by certain investment funds affiliated with or managed by Apollo Global Management, LLC and its subsidiaries, including Apollo Investment Fund VIII, L.P., along with their parallel investment funds (the “Apollo Funds”) to complete the acquisition of Presidio Holdings Inc. (“Presidio Holdings”). Presidio Holdings is a holding company for its wholly owned subsidiary, Presidio LLC, and its operating subsidiaries, which are described below. Prior to its acquisition of Presidio Holdings on February 2, 2015 (the “Presidio Acquisition” as discussed in Note 2), Presidio, Inc. had no operations or activity other than acquisition related costs. Subsequent to the Presidio Acquisition, Presidio, Inc. became the holding company and derives all of its operating income and cash flows from Presidio Holdings and its subsidiaries. For periods as of or ended prior to February 2, 2015, references to the “Company,” “we” or “our” refer to Presidio Holdings and its subsidiaries and for periods as of or ended subsequent to February 2, 2015 these references refer to Presidio, Inc. and its subsidiaries.
Nature of Business
The Company, through its operating subsidiaries, is a leading provider of comprehensive information technology (“IT”) solutions in North America. The Company offers consulting, IT design and optimization and IT-as-a-service solutions to its customers. The Company’s revenue from solutions consists of the resale of hardware and related software and third-party maintenance agreements, which is reported as product revenue, and the sale of professional, cloud and managed services, which is reported as service revenue. The Company implements IT solutions for its customers on a national and international basis, although the Company’s principal markets are located in the continental United States. For the periods presented, the Company operated primarily through two indirect, wholly owned subsidiaries of Presidio LLC:
| • | Presidio Networked Solutions LLC (“PNS”), a leading provider of life-cycle based IT solutions and services. The PNS business includes the operations of Presidio Networked Solutions Group LLC (“PNSG”), Presidio Infrastructure Solutions LLC (“PIS”) and Presidio Technology Capital, LLC (“PTC”), an IT infrastructure leasing company. |
| • | Atlantix Global Systems, LLC (“Atlantix”), a leading remarketer of used and new IT infrastructure systems, providing customers with a full IT life-cycle management process. |
As discussed in Note 3, on October 22, 2015, the Company sold the Atlantix business to a third party.
Presidio Holdings is a direct, wholly owned subsidiary of the Company that is a guarantor of certain indebtedness and a borrower of other indebtedness as described in Note 11. The Company also has an indirect, wholly owned, non-operating subsidiary, Presidio Capital Funding LLC (“PCF”), which is utilized for the Receivables Securitization Facility described in Note 11.
Basis of Presentation
The accompanying consolidated financial statements have been prepared in conformity with accounting principles generally accepted in the United States of America (“U.S. GAAP”). All financial information presented in the financial statements and notes herein is presented in millions except for share and per share information and percentages.
In conjunction with the Presidio Acquisition on February 2, 2015 by the Apollo Funds, the Company has applied the acquisition method of accounting, which created a new basis of accounting as of that date. The Company’s financial results with periods ending prior to February 2, 2015 have been termed the predecessor entity
F-8
Table of Contents
Presidio, Inc.
Notes to Consolidated Financial Statements (Continued)
(“Predecessor”), while the financial results with periods ending subsequent to February 2, 2015 have been termed the successor entity (“Successor”).
As a result of applying the acquisition method of accounting on February 2, 2015, the Predecessor and Successor entities have different bases of accounting and, as a result, these periods are not comparable to one another. The significant differences in the consolidated statements of operations and cash flows include depreciation and amortization of certain tangible and intangible assets recorded at fair value as of February 2, 2015, along with certain transaction expenses related to the Presidio Acquisition and interest expense associated with debt. The significant differences in the consolidated balance sheet include fair value adjustments to certain assets and liabilities made as of February 2, 2015, and adjustments to debt and equity associated with the post-acquisition capital structure.
In management’s opinion, all adjustments necessary for a fair presentation of the results of operations, financial position and cash flows for the periods shown have been made. With the exception of acquisition related accounting, all other adjustments are of a normal recurring nature.
Principles of Consolidation
The Company’s consolidated financial statements include the accounts of the Successor or Predecessor, as applicable, and its subsidiaries. All significant intercompany accounts and transactions have been eliminated in consolidation.
Use of Estimates
The preparation of the Company’s consolidated financial statements requires management to make estimates and assumptions that affect the reported amounts of assets and liabilities, disclosure of contingent assets and liabilities at the date of the financial statements and reported amounts of revenue and expenses during the reporting period. Estimates are used when accounting for items and matters including, but not limited to, revenue recognition, asset residual values, vendor rebates and consideration, goodwill, identifiable intangibles, measurement of income tax assets and liabilities and provisions for doubtful accounts, credit losses, inventory obsolescence and other contingencies. Actual results could differ from management’s estimates.
Significant Accounting Policies
A summary of the Company’s significant accounting policies is as follows:
Revenue Recognition
Revenue is primarily comprised of the sale of third-party products, software and maintenance and the sale of Company and third-party services. Revenue is recognized when all of the following criteria have been met:
| • | Persuasive evidence of an arrangement exists. Contracts and customer purchase orders are generally used to determine the existence of an arrangement. |
| • | Delivery has occurred. Shipping documents and customer acceptance, when applicable, are used to verify delivery. |
| • | The fee is fixed or determinable. The Company assesses whether the fee is fixed or determinable based on the payment terms associated with the transaction and whether the sales price is subject to refund or adjustment. |
F-9
Table of Contents
Presidio, Inc.
Notes to Consolidated Financial Statements (Continued)
| • | Collectability is reasonably assured. The Company assesses collectability based primarily on the creditworthiness of the customer as determined by credit checks and analysis, as well as the customer’s payment history. |
As a provider of third-party products, software, maintenance and services, the Company considers the principal versus agent accounting guidance to determine if the Company is the primary obligor in the arrangement and if revenue should be recognized gross or net of the associated costs. Applying the principal versus agent accounting guidance is a matter of judgment based on the consideration of several factors and indicators.
To meet its customers’ needs, the Company will enter into arrangements that may consist of a combination of deliverables including third-party hardware, third-party software and third-party support service contracts along with services delivered by the Company and/or third-parties. These types of arrangements may contain multiple revenue-generating activities or elements where delivery or performance may occur at different times or over different periods of time as discussed in the policies below. For arrangements that contain multiple elements, the total consideration of the arrangement is allocated to the deliverables which qualify as separate units of accounting. Generally, each of the above items qualifies as separate units of accounting since they provide stand-alone value to the customer and the delivery or performance of any undelivered items is considered probable and substantially in our control. The allocation of the arrangement consideration to the separate units of accounting is based on the relative selling price of each deliverable. The relative selling price is determined based on an assessment of the cost plus a reasonable margin. The identification of the deliverables, the separate units of accounting, the estimated selling prices and the allocation of the arrangement require management estimates and judgment.
Product Revenue
Revenue for hardware and software – Revenue from the sale of hardware and software products is generally recognized on a gross basis with the sales price to the customer recorded as revenue and the acquisition cost of the product recorded as cost of revenue, net of vendor rebates. Revenue is recognized when the title and risk of loss are passed to the customer. Hardware and software items can be delivered to customers in a variety of ways including as physical products shipped via drop-shipment by the vendor or supplier, shipped from our warehouse or via electronic delivery for software licenses. The Company maintains an estimate for sales returns and credit losses based on historical experience. The Company’s vendor partners provide warranties to our customers on equipment sold.
Revenue for maintenance contracts – Revenue from the sale of third-party maintenance contracts is recognized net of the related cost of revenue. In a third-party maintenance contract, all services are provided by third-party providers and as a result, the Company concluded that it is acting as an agent and recognizes revenue on a net basis at the date of sale with revenue being equal to the gross margin on the transaction. As the Company is under no obligation to perform additional services, revenue is recognized at the time of sale as opposed to over the life of the maintenance agreement.
Revenue from leasing arrangements – Revenue from information technology products leased to customers is based on the type of lease entered into with each customer. Each lease is classified as either a direct financing lease, sales-type lease or operating lease. If a lease meets one or more of the four criteria listed below and both the collectability of the minimum lease payments is reasonably predictable and there are no material uncertainties surrounding the amount of unreimbursable costs yet to be incurred, the lease is classified as either a sales-type or direct financing lease; otherwise, it is classified as an operating lease:
| • | the lease transfers ownership of the property to the lessee by the end of the lease term; |
| • | the lease contains a bargain purchase option; |
F-10
Table of Contents
Presidio, Inc.
Notes to Consolidated Financial Statements (Continued)
| • | the lease is equal to 75% or more of the estimated economic life of the leased property; or |
| • | the present value at the beginning of the lease term of the minimum lease payments equals or exceeds 90% of the fair value of the leased property at the inception of the lease. |
Interest earned on direct financing leases is recognized over the term of the lease using the effective interest method. Revenue on sales-type leases is recognized at the inception of the lease at the present value of the minimum lease payments using the discount rate implicit in the lease, with the earned interest being recognized over the term of the lease using the effective interest method. Minimum lease payments comprise the rental payments that the lessee is obligated to make, excluding contingent rentals and any guarantee by the lessee to pay executory costs. Revenue from operating leases is recognized ratably on a straight-line basis over the term of the lease agreement. Revenue from the sale of the residual asset at the end of a lease term is recognized at the date of sale.
The interest income from direct financing and sales-type leases and the revenue recognized from sales-type leases, operating leases and residual asset sales are presented as product revenue in the consolidated statements of operations.
For additional information on the accounting treatment of leases, see the Financing Receivables and Operating Leases policies described in this footnote below as well as Note 6.
Sales taxes – The Company records sales and use taxes collected from customers for remittance to governmental authorities on a net basis within the Company’s consolidated statements of operations.
Shipping and freight – Shipping and freight costs billed to customers are recognized within revenue with the related shipping and freight costs incurred by the Company recorded as a cost of revenue.
Service Revenue
Revenue for Services – Revenue from professional services and cloud services is recognized as the services are performed. For time and material service contracts revenue is recognized at the contractual hourly rates for the labor hours performed during the period. For fixed price service contracts revenue is recognized on a proportional performance basis. Milestone payments are recognized against the labor hours completed compared to the total estimated hours for the scope of work with contract and revenue accrued or deferred as appropriate. Revenue for managed services is recognized on a straight-line basis over the term of the arrangement. The Company may incur upfront costs associated with professional and managed services, including, but not limited to, purchasing maintenance arrangements and software licenses. These costs are initially deferred as prepaid expenses or other assets and expensed over the period that services are being provided.
Cash and Cash Equivalents
The Company considers all highly liquid investments purchased with an original maturity of less than three months at the date of purchase to be cash equivalents. The Company’s cash management program utilizes zero balance accounts and overnight money market investments. The Company does not have any compensating balance requirements.
Accounts Receivable
Accounts receivable are carried at the original invoice amount less a provision for credit losses. Management determines the provision for credit losses by reviewing all outstanding amounts to identify troubled accounts, using historical experience applied to the aging of accounts, and considering current economic conditions that
F-11
Table of Contents
Presidio, Inc.
Notes to Consolidated Financial Statements (Continued)
may affect a customer’s ability to pay. Accounts receivable are written off when deemed uncollectible. Recoveries of accounts receivable previously written off are recorded when received.
Billed accounts receivable are generally due within 30 days of the date of the invoice and typically do not bear interest. Any interest income received on accounts receivable is recorded as received or when collectability is reasonably assured.
Unbilled Accounts Receivable
Unbilled accounts receivable represent the revenue that has been earned but not yet billed to the customer as of the balance sheet date, less a provision for credit losses. Unbilled accounts receivable typically are comprised of receivables for hardware and software products delivered but not yet invoiced as a result of bill in full provisions, maintenance contract sales that are being billed over the contract term to customers, and revenue on professional service contracts in which revenue has been recognized in accordance with a proportional performance method but invoicing milestones have not yet been achieved. Management determines the provision for credit losses by reviewing unbilled amounts to identify troubled accounts, using historical experience and considering economic conditions that may affect a customer’s ability to pay. Unbilled receivables are written off when deemed uncollectible.
Inventory
Inventory primarily consists of finished goods valued at the lower of cost or market, with cost determined on the first-in, first-out method (“FIFO”). The Company decreases the value of inventory for a lower of cost or market provision equal to the difference between the cost of inventory and the estimated market value, based upon an aging analysis of the inventory on hand, specifically known inventory-related risks, and assumptions about future demand and market conditions.
Property and Equipment
Property and equipment are stated at cost less accumulated depreciation, with the exception that property and equipment acquired in an acquisition are recorded at estimated fair value on the date of the acquisition. Depreciation is computed using the straight-line method over the estimated useful lives of the assets. Estimated useful lives of three to seven years are used for equipment, software and furniture and fixtures and 20 years for buildings. Depreciation and amortization of leasehold improvements are computed using the shorter of the estimated useful life or the remaining lease term.
Depreciation of certain equipment, software and other property utilized directly in product revenue generation is recorded in cost of product revenue in the Company’s consolidated statements of operations. Similarly, depreciation expense associated with equipment and software directly utilized in support of cloud and managed services contracts is included in cost of service revenue within the Company’s consolidated statements of operations. All other depreciation and amortization are recorded in depreciation and amortization within operating expenses in the Company’s consolidated statements of operations.
Debt Issuance Costs
Debt issuance costs arising from the Company’s borrowings and credit agreements are amortized using the effective interest rate method over the term of the related debt financing (see Note 11). Debt issuance costs associated with non-revolving credit facilities are presented on a net basis along with the associated debt obligation in the consolidated balance sheets. Debt issuance costs associated with revolving credit facilities are presented net of accumulated amortization within other assets in the consolidated balance sheets.
F-12
Table of Contents
Presidio, Inc.
Notes to Consolidated Financial Statements (Continued)
Impairment of Long-lived Assets
The Company reviews its long-lived assets for impairment whenever events or circumstances indicate that the carrying amount of an asset or asset group may not be recoverable. Recoverability of long-lived assets is measured by a comparison of the carrying amount of the asset or asset group to the future undiscounted net cash flows expected to be generated by that asset or asset group. If such asset(s) are considered to be impaired, the impairment loss is measured as the amount by which the carrying amount of the asset(s) exceeds their estimated fair value. Assets to be disposed of are reported at the lower of the carrying amount or fair value, less cost to sell.
Identifiable Intangible Assets, Net
Finite-lived intangible assets such as customer relationships assets, developed technology, trade names and non-competes are amortized over their estimated useful lives, generally on a straight-line basis. Finite-lived intangible assets are reviewed for impairment or obsolescence whenever events or circumstances indicate that the carrying amount of the asset may not be recoverable. Recoverability of intangible assets is measured by a comparison of the carrying amount of the asset to the future undiscounted net cash flows expected to be generated by that asset. If the asset is considered to be impaired, the impairment loss is measured as the amount by which the carrying amount of the asset exceeds the estimated fair value.
Goodwill and Other Indefinite-lived Intangibles
The Company records goodwill when the purchase price of a business acquisition exceeds the estimated fair value of net identified tangible and intangible assets acquired. Goodwill is assigned to a reporting unit on the acquisition date and assessed for impairment at least annually, or more frequently when events or changes in circumstances indicate that the fair value of a reporting unit has more likely than not declined below its carrying value. In accordance with ASC Topic 805, Business Combinations, if, at the time of issuance of any consolidated financial statements, the Company has not yet finalized the acquisition method of accounting and calculation of goodwill, the corresponding consolidated financial statements are prepared using provisional amounts. Upon finalizing the acquisition method of accounting, the Company applies any adjustments to the provisional amounts in the period in which the adjustments are determined.
The Company assesses goodwill for impairment at least annually on March 31 of each year for each reporting unit. The impairment assessment considers qualitative factors to determine whether it is more likely than not that the fair value of a reporting unit is less than its carrying value. In performing this qualitative assessment, the Company assesses relevant events and circumstances that may impact the fair value and the carrying amount of each reporting unit. Factors that are considered include, but are not limited to, the following: (i) macroeconomic conditions; (ii) industry and market conditions; (iii) overall financial performance and expected financial performance; (iv) other entity specific events, such as changes in management or key personnel; and (v) events affecting the Company’s reporting units, such as a change in the composition of net assets or any expected dispositions.
If after assessing the qualitative factors the Company determines that it is more likely than not that the fair value of a reporting unit is less than its carrying value, then the Company performs a two-step impairment test. The first step compares the fair value of a reporting unit with its carrying amount, including goodwill. If the carrying amount of a reporting unit exceeds its fair value, the second step compares the implied fair value of the reporting unit goodwill with the carrying amount of that goodwill to determine the amount of impairment loss. The fair value of a reporting unit is determined by using a combination of a discounted cash flow approach and a market approach. The significant estimates and assumptions utilized in the fair value estimate include revenue and margin projections, working capital requirements, capital expenditures, terminal growth rates, discount rates and the selection of peer company multiples.
F-13
Table of Contents
Presidio, Inc.
Notes to Consolidated Financial Statements (Continued)
Similar to goodwill, indefinite-lived intangible assets other than goodwill are assessed annually on March 31, or more frequently if indicated, for impairment. The impairment assessment first considers qualitative factors to determine whether events and circumstances indicate that it is more likely than not that an indefinite-lived intangible asset is impaired, including, but not limited to, the following: (i) the performance of the underlying business related to each trade name; (ii) the use of the trade names to market to customers and transact with vendors; and (iii) the expectation that the trade names will continue to be used going forward. If after assessing the qualitative factors the Company determines that it is more likely than not that the fair value of an indefinite-lived intangible asset is less than its carrying value, then the Company will write down the value of the intangible asset to its fair value. The fair value of an indefinite-lived intangible asset is determined using the relief from royalty method. The significant estimates and assumptions utilized in the fair value estimates include revenue projections, the royalty rate and the weighted average cost of capital.
See Note 8 for additional information about the accounting for goodwill and indefinite-lived intangible assets, including the results of the Company’s impairment assessments.
Financing Receivables and Operating Leases
The Company is a lessor of IT equipment to customers. The Company’s lease transactions are classified at the inception of the lease as either direct financing leases, sales-type leases or operating leases. At the inception of direct financing and sales-type leases, the net investment in leases is recorded, which consists of the minimum lease payments, the initial direct costs applicable for direct financing leases, the unguaranteed residual value of the leased asset and the unearned interest income.
The Company generally assigns the customer lease payments to a financial institution along with a first priority security interest in the leased equipment (“discounting”). These assignments do not qualify for sale accounting in accordance with ASC 860, Transfers and Servicing, and as such are not derecognized from the consolidated balance sheets and instead reported as collateralized borrowings. Accordingly, the related assets remain on the Company’s balance sheets and continue to be reported and accounted for as if the sale or assignment had not occurred. The majority of our assigned lease payments are on a nonrecourse basis with the financial institutions. At the time the lease is discounted, the Company receives a cash payment from the financial institution equal to the present value of the lease payments discounted at a fixed interest rate. A related liability is established equal to this cash payment received. The asset and liability are both decreased over the term of the lease as payments are received by the financial institution from the lessee. The typical term of our leases and the discounting arrangements is between two and five years.
Sales-type leases – At the inception of the lease, the present value of the non-cancelable rentals is recorded as product revenue. Equipment costs, less the present value of the estimated residual values, are recorded in cost of product revenue. The difference between the present value of the non-cancelable rentals and the minimum lease payments receivable and the difference between the present value of the estimated residual values and the future value of residuals are recorded as unearned income, which is amortized to product revenue over the lease term using the effective interest rate method.
Direct financing leases – At the inception of a lease, the difference between the cost of the equipment and the present value of the non-cancelable rentals is recorded as unearned income, which is amortized to product revenue over the lease term using an effective interest rate method.
Residual values – Residual values represent management’s estimates of the fair market or realizable values of equipment under leases at the maturity of the leases. Management reviews the residual values and they are
F-14
Table of Contents
Presidio, Inc.
Notes to Consolidated Financial Statements (Continued)
reduced as necessary to reflect any decrease in the estimated fair market or realizable values. Residual values are evaluated on a quarterly basis and any impairment, other than temporary, is recorded in the period in which the impairment is determined. The resulting reduction in the net investment in leases is recognized as a loss in the period in which the estimate is changed. No upward revision of residual value is made subsequent to the inception of the lease.
Operating leases – At the inception of a lease, the equipment assigned to the lease is recorded at cost as equipment under operating leases in the Company’s consolidated balance sheets and is depreciated on a straight-line basis over its useful life. Monthly payments from customers are recorded as part of product revenue, with the depreciation expense associated with the equipment recorded in cost of product revenue within the Company’s consolidated statements of operations.
Provision for Sales Returns and Credit Losses
A provision for sales returns is maintained for potential future product returns. A corresponding provision is maintained for those product returns that the Company is able to return to our vendors or original equipment manufacturers. These provisions are based on an evaluation of historical trends in product return rates and are presented net as a reduction in accounts receivable and product revenue.
Provision for credit losses is maintained for potentially uncollectible accounts and unbilled and financing receivables. The provisions are increased for potential credit losses, which increases expenses, and decreased by subsequent recoveries. The provisions for credit losses are decreased by write-offs and reductions to the provision for potential credit losses. Accounts are either written off or written down when the loss is both probable and determinable. Management’s determination of the adequacy of the provision for credit losses for accounts receivable, unbilled receivables and financing receivables is based on the age of the receivable balance, the customer’s credit quality rating, an evaluation of historical credit losses, current economic conditions and other relevant factors.
Income Taxes
Deferred taxes are calculated using the liability method, whereby deferred tax assets are recognized for deductible temporary differences and operating loss and tax credit carry-forwards, and deferred tax liabilities are recognized for taxable temporary differences. Temporary differences are the differences between the reported amounts of assets and liabilities in the Company’s consolidated balance sheets and their tax bases. Deferred tax assets are reduced by a valuation allowance when, in the opinion of management, it is more likely than not that some portion or all of the deferred tax assets will not be realized. Deferred tax assets and liabilities are presented based on the tax rates currently in effect and adjusted for changes in tax laws and rates on the date of enactment. In accordance with the Company’s prospective adoption of ASU 2015-17, Income Taxes (Topic 740): Balance Sheet Classification of Deferred Taxes, during the year ended June 30, 2016, deferred tax assets and liabilities are classified as noncurrent and presented net in the consolidated balance sheet as of June 30, 2016.
The Company evaluates its tax positions under a more-likely-than-not recognition threshold and measurement analysis before they can be recognized for financial statement reporting. Uncertain tax positions have been classified as current or non-current income tax liabilities based on the expectation of whether they will be paid in the next fiscal year. The Company recognizes interest and penalties related to income tax exposures as a component of income tax expense (benefit) in the Company’s consolidated statements of operations.
F-15
Table of Contents
Presidio, Inc.
Notes to Consolidated Financial Statements (Continued)
Share-based Compensation
The Company measures and recognizes share-based compensation expense for all share-based awards made to employees and directors using fair value based methods over the requisite service period adjusted for estimated forfeiture rates based on historical experience. The cost of equity-classified awards is based on the grant-date fair value calculated using a Black-Scholes or Monte Carlo valuation model, depending on the nature and classification of the award. The cost of liability-classified awards was based on the intrinsic value of the awards at each reporting date. All liability-classified awards were settled in conjunction with the Presidio Acquisition discussed in Note 2.
Share-based compensation expense for awards with a service-only condition is recognized over the employee’s requisite service period using a graded vesting method. For awards with a performance condition that affects vesting, the performance condition is not considered in determining the award’s grant-date fair value; however, the conditions are considered when estimating the quantity of awards that is expected to vest. No compensation expense is recorded for awards with performance conditions until the performance condition is determined to be probable of achievement. For awards with a market condition that affects vesting, the market condition is considered in determining the award’s grant-date fair value. Compensation expense for awards with a market condition is recognized straight-line over the derived or implied service period. For awards with both performance and market conditions, the market condition is incorporated into the fair value of the award, while the performance condition impacts the timing of expense recognition.
In the case of modifications of awards, additional share-based compensation expense is based on the excess, if any, of the fair value of the modified award over the fair value of the original award immediately before its terms are modified.
Share-based compensation expense is classified as selling expenses or general and administrative expenses consistent with other compensation expense associated with the award recipient.
The Company uses the simplified method in estimating the expected life of its service-only condition awards because the Company does not have sufficient historical exercise data to provide a reasonable basis to estimate future exercise patterns.
Other Comprehensive Income (Loss)
The Company did not have any components of other comprehensive income (loss) for any of the periods presented.
Earnings (Loss) Per Share
Basic earnings (loss) per share is computed using the weighted-average number of shares of common stock outstanding during the period. Diluted earnings (loss) per share is computed using the weighted-average number of shares of common stock and dilutive potential shares of common stock outstanding during the period. Dilutive potential shares of common stock outstanding includes the dilutive effect of vested and unvested in-the-money service-only condition stock options. Stock options with performance conditions are not included in the dilutive potential shares of common stock outstanding until the performance condition is met. The dilutive effect of such equity-classified awards is calculated based on the average share price for each period using the treasury stock method. Under the treasury stock method, the amount the employee must pay for exercising stock options, the amount of compensation cost for future service that the Company has not yet recognized and the amount of excess tax benefits that would be recorded in additional paid-in capital when the award becomes deductible are collectively assumed to be used to repurchase shares.
F-16
Table of Contents
Presidio, Inc.
Notes to Consolidated Financial Statements (Continued)
Partner Incentive Program Consideration
The Company receives payments and credits from vendors for various programs, including rebates, volume incentive programs and shared marketing expense programs. Each program varies in length and has varying conditions or achievement targets that determine the amount of consideration the Company is eligible for. The Company estimates and recognizes the amount of partner incentive program consideration earned when it is probable and reasonably estimable using the information available or historical data. Such partner incentive program consideration is recognized as a reduction of cost of revenue with respect to rebates, volume incentive programs and similar programs or as a reduction to operating expenses with respect to shared marketing expense programs.
Business Combinations
The Company accounts for business combinations and acquisitions using the acquisition method. The acquisition method requires that the total purchase price of the acquired entity be allocated to the assets acquired and liabilities assumed based on their fair values at the acquisition date. The assets acquired include the analysis and recognition of intangible assets such as customer relationships, trade names, developed technology and contractual rights and the liabilities assumed include contractual commitments and contingencies.
Any premium paid over the fair value of the net assets and liabilities acquired is recorded as goodwill in connection with a business combination. The results of operations for an acquired entity are included in the consolidated financial statements from the date of acquisition.
Fair Value Measurements
Fair value is defined under U.S. GAAP as the price that would be received to sell an asset or paid to transfer a liability in the principal or most advantageous market for the asset or liability in an orderly transaction between market participants at the measurement date. U.S. GAAP also provides a fair value hierarchy for valuation inputs to prioritize the inputs into three levels based on the extent to which inputs used in measuring fair value are observable in the market. Each fair value measurement is reported in one of the three levels, which is determined by the lowest level input that is significant to the fair value measurement in its entirety. These levels are:
| Level 1: | Quoted prices (unadjusted) in active markets for identical assets or liabilities that the reporting entity has the ability to access at the measurement date; |
| Level 2: | Inputs other than quoted prices included within Level 1 that are observable for the asset or liability, either directly or indirectly; and |
| Level 3: | Unobservable inputs for the asset or liability. |
For those financial instruments with no quoted market prices available, fair value is estimated using present value calculations or other valuation methods, as well as management’s best judgment with respect to current economic conditions, including discount rates and estimates of future cash flows.
The Company did not elect the fair value measurement option for any of its financial assets or liabilities.
Derivative Instruments
The Company may periodically use interest rate swap and cap agreements to reduce the impact of interest rate changes on its long-term debt.
All derivative instruments that are not clearly and closely related to the economic characteristics and risks of the host contract are recognized in the Company’s consolidated balance sheets at their fair value and have been
F-17
Table of Contents
Presidio, Inc.
Notes to Consolidated Financial Statements (Continued)
appropriately classified as current or non-current assets and liabilities. The Company did not elect hedge accounting for its derivative instruments, and as a result, changes in the fair value were recorded within the Company’s consolidated statements of operations within general and administrative expenses along with the periodic settlements on the variable rate asset or liability.
Reportable Segments
Segment information is presented in accordance with a “management approach.” The “management approach” is based on the way that the Company’s chief operating decision-maker reviews operating segment information for use in making decisions, allocating resources and assessing performance. An operating segment is a component of the Company (i) that engages in business activities from which it may earn revenue and incur expense, (ii) whose operating results are regularly reviewed by the Company’s chief operating decision maker to make decisions about resources to be allocated to the segment and assess its performance and (iii) for which discrete financial information is available.
Recent Accounting Pronouncements Not Yet Adopted
In August 2016, the FASB issued ASU 2016-15, Statement of Cash Flows (Topic 230): Classification of Certain Receipts and Cash Payments, to address diversity in practice regarding the presentation of eight specific cash flow situations. These situations include, but are not limited to, debt prepayment and debt extinguishment costs and contingent consideration payments made after a business combination. The standard has an effective date for fiscal years beginning after December 15, 2017, and interim periods within those fiscal years, with early adoption permitted. The Company is currently evaluating the impact that the standard will have on the consolidated financial statements.
In May 2016, the FASB issued ASU 2016-12, Revenue from Contracts with Customers (Topic 606): Narrow-scope Improvements and Practical Expedients, which provides additional guidance around certain areas of the new revenue recognition standard (ASU 2014-09). These areas include, but are not limited to, assessing the collectability criterion, presentation of sales taxes and accounting for noncash consideration. The standard has an effective date concurrent with the effective date of ASU 2014-09, described below. The Company is currently evaluating the impact that the standard will have on the consolidated financial statements.
In April 2016, the FASB issued ASU 2016-10, Revenue from Contracts with Customers (Topic 606): Identifying Performance Obligations and Licensing, which enhances the guidance around identifying performance obligations in customer contracts of the new revenue recognition standard (ASU 2014-09). The standard has an effective date concurrent with the effective date of ASU 2014-09, described below. The Company is currently evaluating the impact that the standard will have on the consolidated financial statements.
In March 2016, the FASB issued ASU 2016-09, Compensation – Stock Compensation (Topic 718): Improvements to Employee Share-Based Payment Accounting, which provides areas for simplification in the accounting for share-based payment transactions. Areas included for simplification include, but are not limited to, accounting for income taxes, classification of excess tax benefits on the statement of cash flows, forfeitures and minimum statutory withholding. The standard has an effective date for fiscal years beginning after December 15, 2016 and interim periods within those fiscal years, with early adoption permitted. The Company is currently evaluating the impact that the standard will have on the consolidated financial statements.
In March 2016, the FASB issued ASU 2016-08, Revenue from Contracts with Customers (Topic 606): Principal versus Agent Considerations (Reporting Revenue Gross versus Net), which clarifies the implementation guidance
F-18
Table of Contents
Presidio, Inc.
Notes to Consolidated Financial Statements (Continued)
on principal versus agent considerations of the new revenue standard (ASU 2014-09). The standard has an effective date concurrent with the effective date of ASU 2014-09, described below. The Company is currently evaluating the impact that the standard will have on the consolidated financial statements.
In February 2016, the FASB issued ASU 2016-02, Leases (Topic 842), which changes the accounting for leases in order to increase transparency and comparability among organizations by recognizing lease assets and lease liabilities on the balance sheet and disclosing key information about leasing arrangements. The standard has an effective date for fiscal years beginning after December 15, 2018 and interim periods within those fiscal years, with early adoption permitted. The Company is currently evaluating the impact that the standard will have on the consolidated financial statements.
In July 2015, the FASB issued ASU 2015-11, Inventory (Topic 330): Simplifying the Measurement of Inventory, which restricts the valuation of inventory to the lower of cost or net realizable value, which is the estimated selling price in the ordinary course of business less reasonably predictable costs of completion, disposal and transportation. The standard has an effective date for fiscal years beginning after December 15, 2016 and interim periods within those fiscal years, with early adoption permitted. The Company is currently evaluating the impact of the standard but it is not expected that this standard will have a material impact on its consolidated financial statements.
In August 2014, the FASB issued ASU 2014-15, Going Concern, which sets forth guidance regarding management’s responsibility to evaluate whether there is substantial doubt about an organization’s ability to continue as a going concern and provide related footnote disclosures. This standard defines the term “substantial doubt,” requires management to perform an evaluation every reporting period and provides principles for considering the mitigating effects of management’s plans. The standard is effective for fiscal years beginning after December 15, 2016, and interim periods beginning after December 15, 2016, with early adoption permitted. The Company’s adoption of this guidance is not expected to have a material impact on the Company’s consolidated financial statements.
In May 2014, the FASB issued ASU 2014-09, Revenue from Contracts with Customers (Topic 606), which outlines a single, comprehensive model for accounting for revenue from contracts with customers, to be applied retrospectively. The standard had an effective date for fiscal years beginning after December 15, 2016, and interim periods within that fiscal year. However, in August 2015, the FASB issued ASU 2015-14, Revenue from Contracts with Customers (Topic 606), which delayed implementation of this standard for one year with the effective date for fiscal years beginning after December 15, 2017 and interim periods within that fiscal year. The Company is currently evaluating the impact that the standard will have on the consolidated financial statements.
Note 2. Acquisitions
Netech Corporation
On February 1, 2016, pursuant to an asset purchase agreement dated as of December 31, 2015, a wholly owned subsidiary of the Company acquired certain assets and assumed certain liabilities of the Netech Corporation (“Netech Acquisition”) comprising the Netech business (“Netech”). Total consideration was $250.5 million, which included $240.1 million paid in cash, of which $0.6 million is due back to the Company from escrow as of June 30, 2016, associated with the final post-closing net working capital as of the closing date, and $11.0 million paid in 628,571 shares of the Company’s common stock. In the absence of a public trading market for our common stock at the time of the acquisition, the value of the common stock provided as consideration was determined contemporaneously using a combination of the market approach valuation method of comparable companies and an income approach valuation method based on discounted cash flows. The Netech Acquisition
F-19
Table of Contents
Presidio, Inc.
Notes to Consolidated Financial Statements (Continued)
enables the Company to further broaden its portfolio of services and solutions and significantly expand its capabilities within the midwestern United States.
The Netech Acquisition was funded through the combination of a new $150.0 million senior credit facility, an incremental $25.0 million term loan borrowing under the Company’s existing senior credit facility, a borrowing under the Company’s accounts receivable securitization facility and available cash on hand. Refer to Note 11 for a further discussion of the credit facility borrowings.
In accordance with the acquisition method, the acquired assets and assumed liabilities of the Netech business have been recognized at fair value as of February 1, 2016. The fair values assigned to the assets and liabilities were derived using a combination of the income approach, the market approach and the cost approach. The significant estimates that were used in calculating the fair values include useful lives, estimated selling prices, disposal costs, costs to complete and reasonable profit. The fair values assigned to intangible assets were determined through the use of the relief from royalty method and the excess earnings method. The goodwill recognized from the transaction is primarily associated with Netech’s specialized and technical workforce, its positioning in the marketplace, potential synergies and the Company’s belief in its potential for continued growth. The Netech Acquisition was a taxable transaction, and as a result, the goodwill and acquired intangible assets are deductible for income tax purposes.
The following table summarizes the purchase price allocation for the Netech Acquisition (in millions):
| Computation of purchase price: |
||||
| Cash paid to sellers |
$ | 240.1 | ||
| Receivable due from escrow |
(0.6 | ) | ||
| Fair value of equity consideration |
11.0 | |||
|
|
|
|||
| Total consideration |
$ | 250.5 | ||
|
|
|
|||
| Allocation of purchase price: |
||||
| Fair value of assets acquired |
||||
| Accounts receivable |
$ | 70.2 | ||
| Unbilled accounts receivable |
7.5 | |||
| Inventory |
9.0 | |||
| Prepaid expenses and other current assets |
5.0 | |||
| Property and equipment |
2.3 | |||
| Goodwill |
108.2 | |||
| Identifiable intangibles assets |
107.0 | |||
| Other assets |
2.4 | |||
| Fair value of liabilities assumed |
||||
| Accounts payable – trade |
(2.3 | ) | ||
| Accounts payable – floor plan |
(40.5 | ) | ||
| Accrued expenses and other current liabilities |
(18.3 | ) | ||
|
|
|
|||
| Total net assets acquired |
$ | 250.5 | ||
|
|
|
Gross contractual receivables acquired were $70.4 million of accounts receivable and $7.5 million of unbilled receivables.
The Company incurred $4.5 million of acquisition related costs during the year ended June 30, 2016 associated with the Netech Acquisition, which are presented as part of transaction costs in the consolidated statements of operations.
F-20
Table of Contents
Presidio, Inc.
Notes to Consolidated Financial Statements (Continued)
Sequoia Worldwide LLC
On November 23, 2015, the Company acquired certain assets and assumed certain liabilities of Sequoia Worldwide LLC (“Sequoia”) for total consideration of approximately $12.6 million, which included $11.2 million paid in cash and $1.4 million paid in 79,945 shares of the Company’s common stock. In the absence of a public trading market for our common stock at the time of acquisition, the value of the common stock provided as consideration was determined contemporaneously using a market approach valuation method of comparable companies. The acquisition of Sequoia, a firm with deep cloud consulting and integration domain expertise, allows the Company to provide hybrid cloud strategies and service delivery models for our clients.
The fair values assigned to intangible assets were determined through the use of the relief from royalty method and the excess earnings method. The goodwill recognized from the transaction is primarily associated with Sequoia’s specialized and technical workforce. The acquisition of Sequoia was a taxable transaction and as a result, the goodwill and acquired intangible assets are deductible for income tax purposes. Transaction costs associated with the acquisition were immaterial.
The following table summarizes the purchase price allocation for the Sequoia acquisition (in millions):
| Computation of purchase price: |
||||
| Cash paid to sellers |
$ | 11.2 | ||
| Fair value of equity consideration |
1.4 | |||
|
|
|
|||
| Total consideration |
$ | 12.6 | ||
|
|
|
|||
| Allocation of purchase price: |
||||
| Assets assumed |
$ | 0.1 | ||
| Purchased identifiable intangible assets |
1.0 | |||
| Goodwill |
11.5 | |||
|
|
|
|||
| Total net assets acquired |
$ | 12.6 | ||
|
|
|
Presidio Holdings Inc.
As previously discussed, on February 2, 2015, Presidio, Inc. acquired Presidio Holdings. The acquisition was pursuant to an agreement and plan of merger dated as of November 26, 2014, by and between Presidio Holdings, Presidio, Inc., Aegis Merger Sub, Inc., a Delaware corporation and wholly owned subsidiary of Aegis Holdings, Inc. (“Merger Sub”), and AS Presidio Holdings, LLC, a Delaware limited liability company, solely as Securityholder Representative (the “Merger Agreement”). In accordance with the terms of the Merger Agreement, Merger Sub merged with and into Presidio Holdings, with Presidio Holdings surviving as a wholly owned subsidiary of Presidio, Inc.
As part of the Presidio Acquisition, Presidio, Inc. entered into rollover agreements related to Presidio Holdings common stock and outstanding stock options in Presidio Holdings that were held by certain members of management of Presidio Holdings (the “Rollover”). Pursuant to these rollover agreements, 15,564,968 shares of the common stock of Presidio Holdings were exchanged for 1,465,974 shares of common stock of Presidio, Inc. and 9,400,028 options to acquire common stock of Presidio Holdings were exchanged for 885,344 options to acquire common stock of Presidio, Inc. The shares and options that were exchanged had an aggregate fair value of approximately $14.7 million and $6.5 million, respectively. The fair value of the shares and options exchanged was based on the value per share as determined by the total consideration provided to equity holders as part of the Presidio Acquisition.
F-21
Table of Contents
Presidio, Inc.
Notes to Consolidated Financial Statements (Continued)
The cash consideration paid in the Presidio Acquisition was $652.5 million, exclusive of cash acquired, cash paid for the repayment of Presidio LLC’s existing term loan and revolving credit facility and the repayment of the accounts receivable securitization facility. Additionally, Presidio Holdings’ former shareholders were eligible to receive an additional $7.5 million of merger consideration (the “hold-back amount”), subject to certain adjustments for indemnification obligations under the Merger Agreement, and an estimated $3.4 million of income tax refunds, as determined in conjunction with the Merger Agreement. The $7.5 million hold-back was payable one year after the closing of the Presidio Acquisition and the estimated income tax refunds are payable as received by the Company. These amounts were recognized at fair value as an acquisition-related liability in the consolidated balance sheet. The fair values of the hold-back and tax refunds were based on the present value of expected future payments as of the acquisition date. During the year ended June 30, 2016, the Company paid $10.3 million associated with the hold-back and income tax refunds. As of June 30, 2016, the Company has a $0.3 million acquisition-related liability recorded in the consolidated balance sheet associated with income tax refunds not yet received. The difference between the amounts initial estimated as due to the former shareholders for income tax refunds and the amounts actually paid or accrued as of June 30, 2016 was recorded as a measurement period adjustment to goodwill during the year ended June 30, 2016.
As further described in Note 11, on February 2, 2015, concurrent with the closing of the Presidio Acquisition, the Company also entered into the following financing transactions:
| • | Presidio LLC, as borrower, obtained a new $650.0 million credit facility, which includes (1) a five-year $50.0 million senior secured revolving credit facility that remained undrawn at the closing of the Presidio Acquisition and (2) a seven-year $600.0 million senior secured term loan credit facility. The credit facilities are guaranteed by, and secured by the assets of, Presidio LLC and its subsidiaries, subject to certain exceptions. Presidio LLC’s wholly owned subsidiary, PNS, is a co-borrower of the Senior Facilities. |
| • | The existing term loan and revolver facilities were repaid and the commitments thereunder were terminated as of the closing of the Presidio Acquisition. |
| • | The existing $150.0 million accounts receivable securitization facility was upsized to a three-year $200.0 million facility. Additionally, concurrent with the closing of the Presidio Acquisition, $40.0 million was repaid on the accounts receivable securitization facility. |
| • | Merger Sub, which was merged into Presidio Holdings in the Presidio Acquisition, issued $400.0 million aggregate principal amount of notes, which included $250.0 million in aggregate principal amount of 10.25% senior notes due 2023 and $150.0 million in aggregate principal amount of 10.25% senior subordinated notes due 2023. Concurrent with the closing of the Presidio Acquisition, Presidio Holdings assumed all of the obligations of Merger Sub under the senior notes, the senior subordinated notes and the related indentures by operation of law. |
As a result of the Presidio Acquisition, the assets and liabilities of Presidio Holdings have been recognized at fair value as of February 2, 2015; this primarily impacted non-current assets and liabilities. The fair values assigned to tangible assets and liabilities were derived using a combination of the income approach, the market approach and the cost approach. The significant estimates that were used in calculating the fair value of the tangible assets and liabilities include replacement cost, useful lives, estimated selling prices, disposal costs, costs to complete and reasonable profit. The fair value assigned to intangible assets was determined through the use of the relief from royalty method, the excess earnings method and the replacement cost method. The goodwill recognized from this transaction is primarily associated with the Presidio Holdings’ specialized and technical workforce, its positioning in the marketplace and the belief in its potential for continued growth.
F-22
Table of Contents
Presidio, Inc.
Notes to Consolidated Financial Statements (Continued)
The Presidio Acquisition was a non-taxable transaction and as a result, the goodwill, acquired intangible assets and other fair value adjustments are nondeductible for income tax purposes. Accordingly, deferred tax assets and liabilities have been established for the fair value adjustments with the exception of goodwill, for which a deferred tax liability is prohibited from recognition.
For the period ended June 30, 2015 and the period ended February 1, 2015, the Company incurred $18.5 million and $42.1 million of acquisition-related costs, respectively. These costs were associated with the Presidio Acquisition and are presented as part of transaction costs in the consolidated statements of operations.
The following table summarizes the purchase price allocation for the Presidio Acquisition (in millions):
| Computation of purchase price: |
||||
| Cash paid to sellers |
$ | 652.5 | ||
| Fair value of management equity rolled forward |
21.2 | |||
| Fair value of consideration to be paid in the future |
10.8 | |||
|
|
|
|||
| Total consideration |
$ | 684.5 | ||
|
|
|
|||
| Allocation of purchase price: |
||||
| Fair value of assets acquired |
||||
| Cash and cash equivalents |
$ | 7.0 | ||
| Accounts receivable |
439.7 | |||
| Unbilled accounts receivable |
105.7 | |||
| Financing receivables |
162.5 | |||
| Inventory |
29.2 | |||
| Deferred income tax assets |
10.2 | |||
| Prepaid expenses and other current assets |
75.0 | |||
| Property and equipment |
28.2 | |||
| Equipment under operating leases |
4.5 | |||
| Goodwill |
662.2 | |||
| Identifiable intangibles assets |
837.5 | |||
| Other assets |
15.8 | |||
| Fair value of liabilities assumed |
||||
| Accounts payable – trade |
(375.1 | ) | ||
| Accounts payable – floor plan |
(111.1 | ) | ||
| Accrued expenses and other current liabilities |
(115.0 | ) | ||
| Discounted financing receivables |
(140.3 | ) | ||
| Long-term indebtedness |
(588.4 | ) | ||
| Deferred income tax liabilities |
(329.7 | ) | ||
| Other liabilities |
(33.4 | ) | ||
|
|
|
|||
| Total net assets acquired |
$ | 684.5 | ||
|
|
|
Gross contractual receivables acquired were $446.2 million of accounts receivable, $105.7 million of unbilled receivables, $33.8 million of other receivables and $163.2 million of financing receivables.
The above purchase price allocation table is exclusive of $0.7 million in immaterial measurement period adjustments recorded during the year ended June 30, 2016. In accordance with the Company’s adoption of ASU 2015-16, Business Combinations (Topic 805): Simplifying the Accounting for Measurement Period Adjustments,
F-23
Table of Contents
Presidio, Inc.
Notes to Consolidated Financial Statements (Continued)
the $0.7 million of measurement period adjustments were recorded in the reporting period they were determined. There was no effect to the Company’s consolidated statement of operations for the year ended June 30, 2016 or the period ended June 30, 2015 as a result of the measurement period adjustments.
The following table provides unaudited supplemental pro forma results of operations for the years ended June 30, 2015 and 2014 (in millions):
| Year ended June 30, | ||||||||
| (unaudited) | 2014 | 2015 | ||||||
| Total revenue |
$ | 2,263.5 | $ | 2,379.4 | ||||
| Net income (loss) |
$ | (81.3 | ) | $ | 12.6 | |||
These results have been derived from our historical consolidated financial statements and have been prepared to give effect to the Presidio Acquisition, assuming that the Presidio Acquisition occurred on July 1, 2013. The unaudited pro forma information presented is for informational purposes only and is not necessarily indicative of the operating results that would have occurred had the Presidio Acquisition been consummated at the beginning of the respective period, nor is it necessarily indicative of future operating results.
The 2015 supplemental pro forma net income (loss) was adjusted to exclude $62.2 million ($41.6 million, net of pro forma income tax impact) of acquisition-related costs and $41.5 million ($25.3 million, net of pro forma income tax impact) of non-recurring expenses and adjusted to include an additional $40.8 million ($24.9 million, net of pro forma income tax impact) of recurring expenses associated with reflecting the Presidio Acquisition as occurring on July 1, 2013.
The 2014 supplemental pro forma net income (loss) was adjusted to include $62.2 million ($41.6 million, net of pro forma income tax impact) of acquisition-related costs, $41.5 million ($25.3 million, net of pro forma income tax impact) of non-recurring expenses and $77.1 million ($46.9 million, net of pro forma income tax impact) of recurring expenses associated with reflecting the Presidio Acquisition as occurring on July 1, 2013.
The $41.5 million ($25.3 million, net of pro forma income tax impact) of non-recurring expenses consists primarily of $8.2 million related to loss on extinguishment of debt, $18.5 million related to share-based compensation expense, $3.1 million of expenses related to revaluation of existing inventory and $11.7 million related to one-time interest expenses related to the acquisition of Presidio Holdings. The adjustments related to recurring expenses primarily relate to increased interest expense associated with pro forma debt and increased amortization expense associated with acquired intangible assets. The pro forma results do not include any anticipated synergies or other anticipated benefits of the Presidio Acquisition.
Other Acquisitions
On March 13, 2015, the Company acquired certain assets and certain liabilities of an immaterial business for $0.4 million. The acquisition resulted in a $0.3 million increase in goodwill.
Note 3. Disposition of Business
On October 22, 2015, the Company completed the sale of the Atlantix business to a third party for $36.3 million in net proceeds resulting in a $6.8 million loss on the disposal presented within interest and other (income) expense in the consolidated statement of operations. Based on qualitative and quantitative considerations,
F-24
Table of Contents
Presidio, Inc.
Notes to Consolidated Financial Statements (Continued)
Atlantix was not considered to be a discontinued operation for financial reporting purposes. The carrying amounts of the assets and liabilities included as part of the disposal were as follows (in millions):
| Carrying amount of assets disposed |
||||
| Accounts receivable, net |
$ | 13.4 | ||
| Inventory |
7.4 | |||
| Prepaid expenses and other current assets |
1.1 | |||
| Property and equipment |
7.0 | |||
| Equipment under operating leases, net |
0.3 | |||
| Identifiable intangible assets, net |
26.4 | |||
| Carrying amount of liabilities disposed |
||||
| Accounts payable – trade |
(3.2 | ) | ||
| Accrued expenses and other current liabilities |
(9.3 | ) | ||
|
|
|
|||
| Net assets disposed |
$ | 43.1 | ||
|
|
|
Note 4. Accounts and Unbilled Receivables
Accounts receivable consisted of the following (in millions):
| June 30, 2015 |
June 30, 2016 |
|||||||
| Gross accounts receivable |
$ | 443.5 | $ | 505.6 | ||||
| Provision for sales returns and credit losses |
(3.8 | ) | (2.6 | ) | ||||
|
|
|
|
|
|||||
| Total accounts receivable, net |
$ | 439.7 | $ | 503.0 | ||||
|
|
|
|
|
|||||
Unbilled receivables consisted of the following (in millions):
| June 30, 2015 |
June 30, 2016 |
|||||||
| Gross unbilled receivables |
$ | 99.1 | $ | 136.9 | ||||
| Provision for sales returns and credit losses |
— | (1.2 | ) | |||||
|
|
|
|
|
|||||
| Total unbilled receivables, net |
$ | 99.1 | $ | 135.7 | ||||
|
|
|
|
|
|||||
Note 5. Prepaid Expenses and Other Current Assets
Prepaid expenses and other current assets consisted of the following (in millions):
| June 30, 2015 |
June 30, 2016 |
|||||||
| Partner incentive program receivable |
$ | 29.1 | $ | 27.3 | ||||
| Prepaid income taxes |
11.1 | 10.4 | ||||||
| Deferred product costs |
5.2 | 5.3 | ||||||
| Other prepaid expenses and other current assets |
27.4 | 25.2 | ||||||
|
|
|
|
|
|||||
| Total prepaid expenses and other current assets |
$ | 72.8 | $ | 68.2 | ||||
|
|
|
|
|
|||||
F-25
Table of Contents
Presidio, Inc.
Notes to Consolidated Financial Statements (Continued)
Note 6. Financing Receivables and Operating Leases
The Company records the lease receivables related to discounted sales-type or direct financing leases as financing receivables, and the related liability resulting from discounting customer payment streams as discounted financing receivables, in the Company’s consolidated balance sheets. Discounted customer payment streams are typically collateralized by a security interest in the underlying assets being leased. At June 30, 2016 and 2015, the interest rates on discounted leases ranged from 2.0% to 9.8% and 1.9% to 10.8%, respectively.
Financing receivables – The assets and related liabilities for discounted and not discounted sales-type and direct financing leases to financial institutions were as follows (in millions):
| June 30, 2015 |
Discounted to financial institutions |
Not discounted to financial institutions |
Total | |||||||||
| Minimum lease payments |
$ | 162.7 | $ | 7.3 | $ | 170.0 | ||||||
| Estimated net residual values |
— | 8.1 | 8.1 | |||||||||
| Unearned income |
(7.9 | ) | (1.2 | ) | (9.1 | ) | ||||||
| Provision for credit losses |
— | (0.9 | ) | (0.9 | ) | |||||||
|
|
|
|
|
|
|
|||||||
| Total, net |
$ | 154.8 | $ | 13.3 | $ | 168.1 | ||||||
|
|
|
|
|
|
|
|||||||
| Reported as: |
||||||||||||
| Current |
$ | 64.6 | $ | 4.5 | $ | 69.1 | ||||||
| Long-term |
90.2 | 8.8 | 99.0 | |||||||||
|
|
|
|
|
|
|
|||||||
| Total, net |
$ | 154.8 | $ | 13.3 | $ | 168.1 | ||||||
|
|
|
|
|
|
|
|||||||
| Discounted financing receivables: |
||||||||||||
| Nonrecourse |
$ | 153.3 | $ | — | $ | 153.3 | ||||||
| Recourse |
0.7 | — | 0.7 | |||||||||
|
|
|
|
|
|
|
|||||||
| Total |
$ | 154.0 | $ | — | $ | 154.0 | ||||||
|
|
|
|
|
|
|
|||||||
| Reported as: |
||||||||||||
| Current |
$ | 64.4 | $ | — | $ | 64.4 | ||||||
| Long-term |
89.6 | — | 89.6 | |||||||||
|
|
|
|
|
|
|
|||||||
| Total |
$ | 154.0 | $ | — | $ | 154.0 | ||||||
|
|
|
|
|
|
|
|||||||
| June 30, 2016 |
||||||||||||
| Minimum lease payments |
$ | 168.5 | $ | 18.4 | $ | 186.9 | ||||||
| Estimated net residual values |
— | 7.9 | 7.9 | |||||||||
| Unearned income |
(7.4 | ) | (1.6 | ) | (9.0 | ) | ||||||
| Provision for credit losses |
— | (0.7 | ) | (0.7 | ) | |||||||
|
|
|
|
|
|
|
|||||||
| Total, net |
$ | 161.1 | $ | 24.0 | $ | 185.1 | ||||||
|
|
|
|
|
|
|
|||||||
| Reported as: |
||||||||||||
| Current |
$ | 74.4 | $ | 8.7 | $ | 83.1 | ||||||
| Long-term |
86.7 | 15.3 | 102.0 | |||||||||
|
|
|
|
|
|
|
|||||||
| Total, net |
$ | 161.1 | $ | 24.0 | $ | 185.1 | ||||||
|
|
|
|
|
|
|
|||||||
| Discounted financing receivables: |
||||||||||||
| Nonrecourse |
$ | 159.2 | $ | — | $ | 159.2 | ||||||
| Recourse |
1.0 | — | 1.0 | |||||||||
|
|
|
|
|
|
|
|||||||
| Total |
$ | 160.2 | $ | — | $ | 160.2 | ||||||
|
|
|
|
|
|
|
|||||||
F-26
Table of Contents
Presidio, Inc.
Notes to Consolidated Financial Statements (Continued)
| June 30, 2016 |
Discounted to financial institutions |
Not discounted to financial institutions |
Total | |||||||||
| Reported as: |
||||||||||||
| Current |
$ | 73.9 | $ | — | $ | 73.9 | ||||||
| Long-term |
86.3 | — | 86.3 | |||||||||
|
|
|
|
|
|
|
|||||||
| Total |
$ | 160.2 | $ | — | $ | 160.2 | ||||||
|
|
|
|
|
|
|
|||||||
The discounted financing receivables associated with sales-type and direct financing type leases are presented in the consolidated balance sheets together with the discounted financing receivables associated with operating leases, which is discussed below.
Minimum lease payments for discounted and non-discounted sales-type and direct financing leases to be received from or paid to financial institutions were as follows (in millions):
| Years ending June 30, |
||||
| 2017 |
$ | 84.8 | ||
| 2018 |
55.6 | |||
| 2019 |
30.4 | |||
| 2020 |
11.2 | |||
| 2021 |
4.9 | |||
| 2022 and thereafter |
— | |||
|
|
|
|||
| Total |
$ | 186.9 | ||
|
|
|
|||
Operating leases – Equipment under operating leases and accumulated depreciation was as follows (in millions):
| June 30, 2015 |
June 30, 2016 |
|||||||
| Equipment under operating leases |
$ | 4.5 | $ | 5.6 | ||||
| Accumulated depreciation |
(1.0 | ) | (2.7 | ) | ||||
|
|
|
|
|
|||||
| Total equipment under operating leases, net |
$ | 3.5 | $ | 2.9 | ||||
|
|
|
|
|
|||||
Depreciation and amortization expense associated with equipment under operating leases that is included in cost of product revenue within the Company’s consolidated statements of operations was $2.5 million for the year ended June 30, 2016, $1.2 million for the period ended June 30, 2015, $2.0 million for the period ended February 1, 2015, and $4.3 million for the year ended June 30, 2014.
Liabilities for discounted operating leases to financial institutions was follows (in millions):
| June 30, 2015 |
June 30, 2016 |
|||||||
| Discounted operating leases: |
||||||||
| Current |
$ | 1.5 | $ | 1.4 | ||||
| Noncurrent |
1.5 | 0.8 | ||||||
|
|
|
|
|
|||||
| Total |
$ | 3.0 | $ | 2.2 | ||||
|
|
|
|
|
|||||
F-27
Table of Contents
Presidio, Inc.
Notes to Consolidated Financial Statements (Continued)
The discounted financing receivables associated with operating leases are presented in the consolidated balance sheets together with the discounted financing receivables associated with sales-type and direct financing type leases which are discussed above.
The minimum lease payments related to operating leases discounted or non-discounted to be paid to financial institutions were as follows (in millions):
| Years ending June 30, |
||||
| 2017 |
$ | 1.4 | ||
| 2018 |
0.6 | |||
| 2019 |
0.2 | |||
| 2020 |
— | |||
| 2021 |
— | |||
| 2022 and thereafter |
— | |||
|
|
|
|||
| Total |
$ | 2.2 | ||
|
|
|
|||
Note 7. Property and Equipment
Property and equipment and accumulated depreciation and amortization was as follows (in millions):
| Estimated useful lives |
June 30, 2015 | June 30, 2016 | ||||||||||
| Furniture and fixtures |
3 to 7 years | $ | 3.3 | $ | 4.7 | |||||||
| Equipment |
3 to 7 years | 12.9 | 18.1 | |||||||||
| Software |
3 years | 9.4 | 14.4 | |||||||||
| Leasehold improvements |
|
Life of lease |
|
3.1 | 11.2 | |||||||
| Building |
20 years | 4.1 | — | |||||||||
| Land |
— | 1.2 | — | |||||||||
|
|
|
|
|
|||||||||
| Total property and equipment |
34.0 | 48.4 | ||||||||||
| Accumulated depreciation and amortization |
(4.5 | ) | (15.5 | ) | ||||||||
|
|
|
|
|
|||||||||
| Total property and equipment, net |
$ | 29.5 | $ | 32.9 | ||||||||
|
|
|
|
|
|||||||||
Depreciation and amortization associated with property and equipment that is included in depreciation and amortization within the Company’s consolidated statement of operations was $8.8 million for the year ended June 30, 2016, $3.8 million for the period ended June 30, 2015, $4.1 million for the period ended February 1, 2015 and $7.6 million for the year ended June 30, 2014.
Depreciation and amortization expense associated with property and equipment directly utilized in support of managed services and managed cloud contracts that is included in cost of service revenue within the Company’s consolidated statement of operations was $3.2 million for the year ended June 30, 2016, $0.7 million for the period ended June 30, 2015, $0.5 million for the period ended February 1, 2015, and $0.4 million for the year ended June 30, 2014.
As noted in Note 2, we acquired property and equipment with a fair value of $2.3 million as of February 1, 2016 pursuant to the Netech Acquisition.
F-28
Table of Contents
Presidio, Inc.
Notes to Consolidated Financial Statements (Continued)
The land and building assets were disposed as part of the disposal of the Atlantix business discussed in Note 3.
Note 8. Goodwill and Identifiable Intangible Assets
Goodwill
Goodwill consisted of the following (in millions):
| PNS | Atlantix | |||||||||||||||||||
| Predecessor |
Gross carrying value |
Accumulated impairment charges |
Gross carrying value |
Accumulated impairment charges |
Total, net | |||||||||||||||
| Balance, June 30, 2013 |
$ | 544.2 | $ | — | $ | 12.7 | $ | — | $ | 556.9 | ||||||||||
| Acquisitions |
— | — | — | — | — | |||||||||||||||
| Impairment charges |
— | — | — | — | — | |||||||||||||||
|
|
|
|
|
|
|
|
|
|
|
|||||||||||
| Balance, June 30, 2014 |
544.2 | — | 12.7 | — | 556.9 | |||||||||||||||
| Acquisitions |
— | — | — | — | — | |||||||||||||||
| Impairment charges |
— | — | — | — | — | |||||||||||||||
|
|
|
|
|
|
|
|
|
|
|
|||||||||||
| Balance, February 1, 2015 |
$ | 544.2 | $ | — | $ | 12.7 | $ | — | $ | 556.9 | ||||||||||
|
|
|
|
|
|
|
|
|
|
|
|||||||||||
| Successor |
||||||||||||||||||||
| Balance, November 20, 2014 |
$ | — | $ | — | $ | — | $ | — | $ | — | ||||||||||
| Acquisitions |
662.5 | — | — | — | 662.5 | |||||||||||||||
| Impairment charges |
— | — | — | — | — | |||||||||||||||
|
|
|
|
|
|
|
|
|
|
|
|||||||||||
| Balance, June 30, 2015 |
662.5 | — | — | — | 662.5 | |||||||||||||||
| Acquisitions |
119.7 | — | — | — | 119.7 | |||||||||||||||
| Measurement period adjustments |
(0.7 | ) | — | — | — | (0.7 | ) | |||||||||||||
| Impairment charges |
— | — | — | — | — | |||||||||||||||
|
|
|
|
|
|
|
|
|
|
|
|||||||||||
| Balance, June 30, 2016 |
$ | 781.5 | $ | — | $ | — | $ | — | $ | 781.5 | ||||||||||
|
|
|
|
|
|
|
|
|
|
|
|||||||||||
As of June 30, 2015, the $662.5 million of goodwill was comprised of $662.2 million associated with the Presidio Acquisition and $0.3 million associated with an immaterial acquisition. For the year ended June 30, 2016, goodwill increased by $119.7 million in connection with new acquisitions, of which $108.2 million was associated with the Netech Acquisition and $11.5 million was associated with the Sequoia acquisition. Additionally, during the year ended June 30, 2016, goodwill decreased by $0.7 million associated with measurement period adjustments to the Presidio Acquisition.
The Company performed an assessment as of March 31, 2016 and 2015 to determine whether it was more likely than not that the fair value of the Company’s reporting units was less than their carrying amounts. Based on the results of these assessments, the Company determined that it was not more likely than not that the fair value of the reporting units was less than their carrying amounts. As a result, the Company concluded that no impairment of its goodwill existed at either date. The Company did not identify or record any impairment losses related to its goodwill during any of the periods presented.
F-29
Table of Contents
Presidio, Inc.
Notes to Consolidated Financial Statements (Continued)
Identifiable Intangible Assets
Identifiable intangible assets consisted of the following (in millions):
| June 30, 2015 |
Range of life (years) |
Gross amount |
Accumulated amortization |
Total, net |
||||||||||||
| Finite-lived intangible assets: |
||||||||||||||||
| Customer relationships |
10 | $ | 623.0 | $ | (25.9 | ) | $ | 597.1 | ||||||||
| Developed technology |
5 | 2.9 | (0.2 | ) | 2.7 | |||||||||||
| Non-compete agreements |
1 | 0.6 | (0.3 | ) | 0.3 | |||||||||||
| Indefinite-lived intangible assets: |
||||||||||||||||
| Trade names |
Indefinite | 211.0 | — | 211.0 | ||||||||||||
|
|
|
|
|
|
|
|||||||||||
| Total intangible assets |
$ | 837.5 | $ | (26.4 | ) | $ | 811.1 | |||||||||
|
|
|
|
|
|
|
|||||||||||
| June 30, 2016 |
||||||||||||||||
| Finite-lived intangible assets: |
||||||||||||||||
| Customer relationships |
5 – 10 | $ | 703.2 | $ | (89.4 | ) | $ | 613.8 | ||||||||
| Developed technology |
5 | 3.6 | (0.9 | ) | 2.7 | |||||||||||
| Non-compete agreements |
1 | 0.6 | (0.6 | ) | — | |||||||||||
| Trade names |
2 | 5.1 | (1.1 | ) | 4.0 | |||||||||||
| Indefinite-lived intangible assets: |
||||||||||||||||
| Trade names |
Indefinite | 205.0 | — | 205.0 | ||||||||||||
|
|
|
|
|
|
|
|||||||||||
| Total intangible assets |
$ | 917.5 | $ | (92.0 | ) | $ | 825.5 | |||||||||
|
|
|
|
|
|
|
|||||||||||
Amortization associated with intangible assets was $67.2 million for the year ended June 30, 2016, $26.4 million for the period ended June 30, 2015, $18.3 million for the period ended February 1, 2015 and $38.3 million for the year ended June 30, 2014. The weighted-average remaining useful life of the finite-lived intangible assets was 8.7 years as of June 30, 2016.
In conjunction with the acquisitions discussed in Note 2, the Company recorded $102.2 million of gross customer relationships, $5.1 million of trade names and $0.7 million of developed technology intangible assets. As part of the disposal of Atlantix discussed in Note 3, the Company disposed of $6.0 million of trade names and $22.0 million of customer relationships on a gross basis.
The Company performed an assessment as of March 31, 2016 and 2015 on each of the indefinite-lived trade names to determine whether it was more likely than not that the fair value of the trade names was less than their carrying amounts. Based on the results of these assessments, the Company determined that it was not more likely than not that the fair value of its trade names was less than their carrying amount. As a result, the Company concluded that no impairment of its trade names existed at either date. The Company did not identify or record any impairment losses related to its trade names during any of the periods presented.
F-30
Table of Contents
Presidio, Inc.
Notes to Consolidated Financial Statements (Continued)
Based on the finite-lived intangible assets recorded at June 30, 2016, the annual amortization expense is expected to be as follows (in millions):
| Years ending June 30, |
||||
| 2017 |
$ | 73.6 | ||
| 2018 |
72.5 | |||
| 2019 |
71.1 | |||
| 2020 |
70.8 | |||
| 2021 |
70.4 | |||
| 2022 and thereafter |
262.1 | |||
|
|
|
|||
| Total |
$ | 620.5 | ||
|
|
|
|||
Note 9. Accounts Payable – Floor Plan
The accounts payable – floor plan balances on the consolidated balance sheets relate to an agreement with a financial institution that provides an indirect wholly owned subsidiary of the Company with funding for discretionary inventory purchases from approved vendors. Payables are due within 90 days and are non-interest bearing provided they are paid when due. In accordance with the agreement, the financial institution has been granted a senior security interest in the indirect wholly owned subsidiary’s inventory purchased under the agreement and accounts receivable arising from the sale thereof. Payments on the facility are guaranteed by Presidio, LLC and subsidiaries. As of June 30, 2016, the aggregate availability for purchases under the floor plan is the lesser of $325.0 million or the liquidation value of the pledged assets. The balances outstanding under the accounts payable – floor plan facility were $223.3 million and $161.9 million as of June 30, 2016 and 2015, respectively.
Note 10. Accrued Expenses and Other Current Liabilities
Accrued expenses and other current liabilities consisted of the following (in millions):
| June 30, 2015 |
June 30, 2016 |
|||||||
| Accrued compensation |
$ | 52.3 | $ | 66.1 | ||||
| Accrued interest |
20.6 | 21.4 | ||||||
| Accrued equipment purchases/vendor expenses |
29.7 | 27.5 | ||||||
| Accrued income taxes |
0.3 | — | ||||||
| Accrued non-income taxes |
15.3 | 12.2 | ||||||
| Customer deposits, current portion |
10.1 | 8.8 | ||||||
| Acquisition-related liabilities |
10.9 | 0.3 | ||||||
| Unearned revenue |
23.6 | 30.8 | ||||||
|
|
|
|
|
|||||
| Total accrued expenses and other current liabilities |
$ | 162.8 | $ | 167.1 | ||||
|
|
|
|
|
|||||
The reduction in acquisition-related liabilities is associated with the Company’s payment of a hold-back and certain tax refunds which were due to Presidio Holdings’ former shareholders in accordance with the Presidio Acquisition.
F-31
Table of Contents
Presidio, Inc.
Notes to Consolidated Financial Statements (Continued)
Note 11. Long-term Debt and Credit Agreements
Long-term debt consisted of the following (in millions):
| June 30, 2015 |
June 30, 2016 |
|||||||
| Revolving credit facility |
$ | — | $ | — | ||||
| Receivable securitization facility |
— | 5.0 | ||||||
| Term loan facility, due February 2022 |
573.6 | 732.3 | ||||||
| Senior notes, 10.25% due February 2023 |
250.0 | 222.5 | ||||||
| Senior subordinated notes, 10.25% due February 2023 |
150.0 | 111.8 | ||||||
|
|
|
|
|
|||||
| Total long-term debt |
973.6 | 1,071.6 | ||||||
| Unamortized debt issuance costs |
(39.9 | ) | (33.6 | ) | ||||
|
|
|
|
|
|||||
| Total long-term debt, net of debt issuance costs |
$ | 933.7 | $ | 1,038.0 | ||||
|
|
|
|
|
|||||
| Reported as: |
||||||||
| Current |
$ | 5.8 | $ | 7.4 | ||||
| Long-term |
927.9 | 1,030.6 | ||||||
|
|
|
|
|
|||||
| Total long-term debt, net of debt issuance costs |
$ | 933.7 | $ | 1,038.0 | ||||
|
|
|
|
|
|||||
February 2016 Credit Facility
On February 1, 2016, as part of the Netech Acquisition discussed in Note 2, Presidio LLC, PNS and PIS, three wholly owned subsidiaries of the Company, entered into a senior secured credit facility (the “February 2016 Credit Facility”) which provided a $150.0 million term loan (“February 2016 Term Loan”) with a three year maturity.
The February 2016 Term Loan had a maturity date of February 2, 2019, with interest accruing at a rate of 7.00% per annum from February 2, 2016 to January 31, 2017, 10.00% per annum from February 1, 2017 to January 31, 2018 and 12.00% per annum from February 1, 2018 to January 31, 2019. Interest payments were payable quarterly and there were no mandatory principal payments prior to maturity. The February 2016 Term Loan could be prepaid at any time without penalty. The facility was issued at 95.0% of par, resulting in the recording of $7.5 million of original issuance discount. The Company incurred approximately $0.9 million of deferred financing fees associated with issuing the debt.
On March 31, 2016, the Company prepaid $15.0 million of the February 2016 Term Loan and, accordingly, recorded a $0.8 million loss on extinguishment of debt in the consolidated statement of operations associated with a write off of unamortized debt issuance costs.
On April 25, 2016, the Company prepaid an additional $20.0 million of the February 2016 Term Loan and, accordingly, recorded a $1.0 million loss on extinguishment of debt in the consolidated statement of operations.
On May 27, 2016, the Company entered into the May 2016 Amendment to the February 2015 Credit Facility, as described below. The proceeds of the incremental borrowing under the May 2016 Amendment were used to, among other things, repay the remaining $115.0 million outstanding on the February 2016 Term Loan, resulting in the termination of the February 2016 Credit Facility. Accordingly, the Company recorded an additional $5.8 million loss on extinguishment of debt in the consolidated statement of operations in connection with the remaining unamortized debt issuance costs on this facility.
F-32
Table of Contents
Presidio, Inc.
Notes to Consolidated Financial Statements (Continued)
February 2015 Credit Facilities
On February 2, 2015, Presidio LLC and PNS (the “Borrowers”), two wholly owned subsidiaries of the Company, entered into a senior secured credit facility (the “February 2015 Credit Agreement”) which provided a $600.0 million term loan (“February 2015 Term Loan”) with a seven year maturity and a $50.0 million revolving credit facility (“February 2015 Revolver”) with a five year maturity (collectively referred to as the “February 2015 Credit Facilities”).
On May 19, 2015, the terms of the February 2015 Credit Agreement were amended pursuant to Incremental Assumption Agreement and Amendment No. 1 (the “May 2015 Amendment”) to, among other things, lower the applicable margin on term loan borrowings.
On February 1, 2016, as part of the Netech Acquisition discussed in Note 2, the Borrowers entered into Incremental Assumption Agreement and Amendment No. 2 to the February 2015 Credit Agreement for an incremental $25.0 million term loan borrowing. The $25.0 million incremental term loan under the credit facility is subject to the same terms and conditions as the then-existing term loans under the February 2015 Credit Agreement.
On May 27, 2016, the Borrowers entered into Incremental Assumption Agreement and Amendment No. 3 (the “May 2016 Amendment”) to the February 2015 Credit Agreement for an incremental $140.0 million term loan borrowing. The proceeds of the incremental term loan were used to, among other things, repay in full the remaining $115.0 million outstanding on the February 2016 Credit Facility discussed above. The $140.0 million incremental term loan under the credit facility is subject to the same terms and conditions as the then-existing term loans under the February 2015 Credit Agreement.
In accordance with the terms of the February 2015 Credit Agreement, the Borrowers may request one or more incremental term loan facilities and/or increase commitments under the February 2015 Revolver in an aggregate amount of up to the sum of $125.0 million plus additional amounts so long as, (i) in the case of loans under additional credit facilities secured by liens (other than to the extent such liens are expressly subordinated in writing to the liens on the collateral securing the February 2015 Credit Agreement), the consolidated net first lien secured leverage ratio would be no greater than 3.25 to 1.00 and (ii) in the case of loans under additional credit facilities that would not be included in the computation of the consolidated net first lien secured leverage ratio, the consolidated net secured leverage ratio would be no greater than 4.25 to 1.00, subject to certain conditions and receipt of commitments by existing or additional lenders.
The Borrowers may voluntarily repay outstanding loans under the February 2015 Credit Agreement at any time without prepayment premium or penalty except in connection with a repricing event, subject to customary “breakage” costs with respect to LIBOR rate loans.
All obligations under the February 2015 Credit Agreement are unconditionally guaranteed by Presidio Holdings and each of its existing and future direct and indirect, wholly owned domestic subsidiaries, subject to certain exceptions. The obligations are secured by substantially all assets of the Borrowers and each guarantor, including capital stock of the Borrowers and subsidiary guarantors, in each case subject to certain exceptions. The February 2015 Credit Agreement is subject to an intercreditor agreement with the accounts payable – floor plan that provides that certain security interests in assets securing the February 2015 Credit Agreement shall be subordinate to the security interests on the collateral securing the obligations under the accounts payable – floor plan described in Note 9.
The February 2015 Credit Agreement contains certain customary affirmative covenants, negative covenants and events of default. The negative covenants in the February 2015 Credit Agreement include, among other things,
F-33
Table of Contents
Presidio, Inc.
Notes to Consolidated Financial Statements (Continued)
limitations (subject in each case to exceptions) on the ability of the Borrowers, the guarantors and their restricted subsidiaries to:
| • | incur additional debt or issue certain preferred shares; |
| • | create liens on certain assets; |
| • | make certain loans or investments (including acquisitions); |
| • | pay dividends on or make distributions in respect of capital stock or make other restricted payments; |
| • | consolidate, merge, sell or otherwise dispose of all or substantially all of their assets; |
| • | sell assets; |
| • | enter into certain transactions with affiliates; |
| • | enter into sale-leaseback transactions; |
| • | change lines of business; |
| • | restrict dividends from their subsidiaries or restrict liens; |
| • | change their fiscal year; and |
| • | modify the terms of certain debt or organizational agreements. |
February 2015 Term Loan – Borrowings under the February 2015 Term Loan bear interest at a rate equal to, at the Borrowers’ option, either:
| (a) | the LIBOR rate determined by reference to the cost of funds for Eurodollar deposits for the interest period relevant to such borrowing, adjusted for certain additional costs, subject to a 1.00% floor in the case of term loans; or |
| (b) | the base rate determined by reference to the highest of: |
| (i) | the federal funds rate plus 0.50%, |
| (ii) | the prime rate, or |
| (iii) | one-month adjusted LIBOR plus 1.00%, plus an applicable margin. |
The applicable margin for term loans was 5.25% in the case of LIBOR rate borrowings and 4.25% in the case of base rate borrowings prior to the May 2015 Amendment and 4.25% in the case of LIBOR rate borrowings and 3.25% in the case of base rate borrowings after the May 2015 Amendment.
The February 2015 Term Loan amortizes at a rate of 1.00% per annum, payable quarterly on the principal balance of the borrowing, with the balance paid at maturity.
In addition to the required scheduled quarterly payments on the February 2015 Term Loan, the February 2015 Credit Agreement requires the Borrowers to prepay outstanding term loan borrowings, subject to certain exceptions, with:
| • | 75% (which percentage will be reduced to 50% if the consolidated net first lien secured leverage ratio is less than or equal to 3.00 to 1.00, reduced to 25% if the consolidated net first lien secured leverage ratio is less than or equal to 2.50 to 1.00, and reduced to 0% if the consolidated net first lien secured leverage ratio is less than or equal to 2.00 to 1.00) of the Borrowers’ annual excess cash flow, as defined under the February 2015 Credit Agreement, beginning in the fiscal year ended June 30, 2016; |
F-34
Table of Contents
Presidio, Inc.
Notes to Consolidated Financial Statements (Continued)
| • | 100% of the net cash proceeds of all non-ordinary course asset sales, other dispositions of property or certain casualty events, in each case subject to certain exceptions and provided that the Company may (a) reinvest within 12 months or (b) commit to reinvest those proceeds within 12 months and so reinvest such proceeds within 18 months in assets to be used in the business, or certain other permitted investments; and |
| • | 100% of the net cash proceeds of any issuance or incurrence of debt, other than proceeds from debt permitted under the February 2015 Credit Agreement. |
For the year ended June 30, 2016, there are no additional prepayments required based on the Borrowers’ calculation of the annual excess cash flow.
The February 2015 Term Loan was originally a $600.0 million term loan with a seven year maturity of February 2, 2022. The borrowing was issued at 97.0% of par, resulting in an original issue discount of $18.0 million. The Company incurred $15.0 million of deferred financing costs associated with the original term loan, resulting in total deferred issuance costs of $33.0 million.
Concurrently with the May 2015 Amendment, the Company made a $25.0 million voluntary prepayment on the February 2015 Term Loan, reducing the principal balance on the February 2015 Term Loan to $575.0 million. The May 2015 Amendment constituted a repricing event under the February 2015 Credit Agreement, requiring the Borrowers to pay a fee to the lenders equal to 1.00% of the principal amount of the term loan after giving effect to the voluntary prepayment. Accordingly, $5.7 million was paid and expensed in the period ended June 30, 2015 and presented as a component of interest expense in the Company’s consolidated statements of operations. Additionally, the Company wrote off $0.5 million in debt issuance costs associated with modification accounting and recorded a $0.7 million loss on the extinguishment of debt, which included part of the repricing penalty, in the Company’s consolidated statements of operations.
The $25.0 million borrowing entered into pursuant to Incremental Assumption Agreement and Amendment No. 2 to the February 2015 Credit Agreement was issued at par. In accordance with debt modification accounting, the Company recorded an additional $0.2 million in deferred issuance costs associated with the amendment.
The $140.0 million borrowing entered into pursuant to the May 2016 Amendment was issued at 99.5% of par, resulting in $0.7 million of original issue discount. In accordance with debt modification accounting, the Company recorded an additional $0.1 million in deferred issuance costs associated with the amendment.
February 2015 Revolver – The February 2015 Revolver provides a $50.0 million revolving credit facility with a $25.0 million sublimit available for letters of credit and a swingline loan sub facility maturing February 2, 2020.
Borrowings under the February 2015 Revolver bear interest at a rate equal to, at the Borrowers’ option, either:
| (a) | the LIBOR rate determined by reference to the cost of funds for Eurodollar deposits for the interest period relevant to such borrowing, adjusted for certain additional costs, subject to a 1.00% floor in the case of term loans; or |
| (b) | the base rate determined by reference to the highest of: |
| (i) | the federal funds rate plus 0.50%, |
| (ii) | the prime rate, or |
| (iii) | one-month adjusted LIBOR plus 1.00%, plus an applicable margin. |
F-35
Table of Contents
Presidio, Inc.
Notes to Consolidated Financial Statements (Continued)
The applicable margin for revolving loans is 4.25% in the case of LIBOR rate borrowings and 3.25% in the case of base rate borrowings (with margins for revolving loans subject to certain reductions based on a net first lien leverage ratio).
In addition to paying interest on outstanding principal under the February 2015 Revolver, the Borrowers are required to pay a commitment fee equal to 0.50% (subject to a step-down to 0.375% based on achievement of a specified net first lien leverage ratio) in respect of the unutilized commitments under the facility. The Borrowers are also required to pay customary agency fees as well as letter of credit participation fees computed at a rate per annum equal to the applicable margin for LIBOR rate borrowings on the dollar equivalent of the daily stated amount of outstanding letters of credit, plus such letter of credit issuer’s customary documentary and processing fees and charges and customary fronting fees.
All borrowings under the February 2015 Revolver are subject to the satisfaction of customary conditions, including the absence of a default and the accuracy of representations and warranties.
The February 2015 Revolver requires that Presidio Holdings, after an initial grace period and subject to a testing threshold, comply on a quarterly basis with a maximum first lien net senior secured leverage ratio. The testing threshold is met if, at the end of any applicable fiscal quarter, the sum of outstanding exposure under the February 2015 Revolver exceeds 30% of the outstanding commitments under the revolving credit facility at such time.
In conjunction with entering into the February 2015 Credit Agreement, the Company incurred $1.3 million in deferred financing costs associated with the February 2015 Revolver.
As of June 30, 2016 and 2015, there were no outstanding borrowings on the February 2015 Revolver and there were $1.5 million in letters of credit outstanding. The Company is in compliance with the covenants and had $48.5 million available for borrowings under the facility.
March 2011 Credit Facilities
On March 31, 2011, Presidio LLC and PNS, as borrowers (the “Borrowers”), entered into a senior secured financing facility (“March 2011 Credit Agreement”). The March 2011 Credit Agreement was comprised of a $325.0 million term loan (“March 2011 Term Loan”) and a $22.0 million revolving credit facility (“March 2011 Revolver”) (collectively, the “March 2011 Credit Facilities”).
The terms of the March 2011 Credit Facility were subsequently amended on November 22, 2011, December 30, 2011, February 29, 2012, August 9, 2012 and March 26, 2014 prior to being fully repaid with the commitments thereunder terminated on February 2, 2015 as part of the Presidio Acquisition described in Note 2.
In accordance with the March 2011 Credit Agreement, Presidio Holdings was subject to certain limitations such as sale of assets, loans, advances, investments, additional indebtedness, liens and leases, change in business operations, change of control, and limitations on mergers and acquisitions and dividends. Presidio Holdings was also subject to certain financial covenants, which include a total debt to adjusted EBITDA ratio and an interest coverage ratio. The March 2011 Credit Facilities permitted up to the greater of $175.0 million or 150.0% of consolidated EBITDA, as defined therein, for the accounts payable – floor plan arrangement described in Note 9.
March 2011 Term Loan –The March 2011 Term Loan was originally issued as a $325.0 million term loan with a maturity of March 31, 2017. The December 30, 2011 and February 29, 2012 amendments resulted, among other things, in the issuance of incremental term loan borrowings. The August 9, 2012 amendment, among other
F-36
Table of Contents
Presidio, Inc.
Notes to Consolidated Financial Statements (Continued)
things, modified the interest rate of term loan borrowings and increased the principal of the term loan to $385.0 million and left the maturity unchanged. The March 26, 2014 amendment related to a dividend recapitalization and increased the principal of the term loan to $650.0 million and left the maturity unchanged.
Interest under the March 2011 Term Loan was subject to periodic election by the Company of borrowings as a base rate loan or a Eurodollar loan.
| • | For base rate loans, interest was payable quarterly at a fluctuating per annum rate equal to the sum of a benchmark rate, as determined as the highest of (i) the prime rate, (ii) the federal funds open rate plus 0.5%, or (iii) the daily LIBOR rate plus 1.00%, plus a margin of 4.50% (the 4.50% margin was reduced to 3.50% as a result of the August 9, 2012 amendment and again reduced to 3.00% as a result of the March 26, 2014 amendment). |
| • | For Eurodollar loans, interest was payable periodically at the London Interbank Offered Rate (LIBOR), subject to a LIBOR floor of 1.75% (the 1.75% LIBOR floor was reduced to 1.25% as part of the August 9, 2012 amendment and again reduced to 1.00% as part of the March 26, 2014 amendment), plus a margin of 5.50% (the 5.50% margin was reduced to 4.50% as part of the August 9, 2012 amendment and again reduced to 4.00% as part of the March 26, 2014 amendment). |
Interest on the March 2011 Term Loan was at a rate of 5.00% as of June 30, 2014.
The March 2011 Term Loan amortized quarterly at 2.50% per quarter until the August 9, 2012 amendment, which reduced the amortization to 0.25% quarterly for the first eight quarters subsequent to the amendment, and 1.25% per quarter thereafter. The March 26, 2014 amendment required quarterly amortization of 0.25% per quarter for the first two quarters beginning June 30, 2014 and then 1.25% per quarter thereafter.
The March 2011 Term Loan was secured by a lien on all assets with the exception of certain assets of a subsidiary of the Company which are subordinated to the collateral under the accounts payable – floor plan arrangement described in Note 9.
In accordance with modification accounting, the March 26, 2014 amendment to the March 2011 Credit Facilities resulted in $3.4 million of additional debt issuance costs and a $2.7 million loss on extinguishment of debt associated during the year ended June 30, 2014. The $3.4 million in debt issuance costs was comprised of $1.6 million of deferred financing costs and $1.8 million in original issue discount associated with $296.0 million of the $650.0 million term loan being issued at par and the remaining $354.0 million issued at 99.5% of par.
As described above and in Note 2, as part of the Presidio Acquisition, the March 2011 Credit Facilities were extinguished and replaced with the February 2015 Credit Facilities. As a result, the remaining $7.5 million of debt issuance costs associated with the March 2011 Term Loan were expensed during the period ended February 1, 2015 as a loss on the extinguishment of debt in the Company’s consolidated statement of operations.
March 2011 Revolver – The March 2011 Revolver was originally a $22.0 million revolving credit facility with a sublimit of $22.0 million available for letters of credit and a maturity of March 31, 2014. The December 30, 2011 amendment increased the facility to $42.0 million with a sublimit of $25.0 million available for letters of credit. The August 9, 2012 amendment increased the facility to $52.5 million and extended the maturity to August 9, 2015, with no change in the sublimit. The March 26, 2014 amendment extended the maturity to March 31, 2017 with no changes to the available funding under the facility or sublimit.
The March 2011 Revolver had no scheduled repayments; until maturity, Presidio Holdings was permitted to borrow, repay and re-borrow as long as the outstanding balance and commitments for letters of credit did not exceed the limit.
F-37
Table of Contents
Presidio, Inc.
Notes to Consolidated Financial Statements (Continued)
Interest under the March 2011 Revolver was subject to periodic election of borrowings as a base rate loan or a Eurodollar loan.
| • | For base rate loans, interest was payable quarterly at a fluctuating per annum rate equal to the sum of a benchmark rate, as determined as the highest of (i) the prime rate, (ii) the federal funds open rate plus 0.5%, or (iii) the daily LIBOR rate plus 1.00%, plus a margin of 0.75% to 2.50%. |
| • | For Eurodollar loans, interest was payable periodically at the London Interbank Offered Rate (LIBOR) plus a margin of 1.75% to 3.50%. |
The margin on the March 2011 Revolver was reset quarterly based on Presidio Holdings’ ratio of total debt to adjusted EBITDA.
The Company also incurred a commitment fee based on Presidio Holdings’ ratio of total debt to adjusted EBITDA of 0.25% to 0.60% on the average unused balance.
Senior and Senior Subordinated Notes
In conjunction with the Presidio Acquisition described in Note 2, on February 2, 2015, Presidio Holdings issued a series of senior notes (“Senior Notes”) in an aggregate principal amount of $250.0 million, and a series of senior subordinated notes (“Senior Subordinated Notes”) in an aggregate amount of $150.0 million (collectively referred to as the “Notes”), each of which will mature on February 15, 2023. The Company incurred $16.0 million of financing costs associated with the issuance of the Notes, of which $10.0 million was recorded as debt issuance costs and $6.0 million of bridge financing commitment fees that were not utilized by the Company was expensed as interest expense in the consolidated statement of operations in the period ending June 30, 2015. The Notes were issued at par with no original issue discount. Interest on the Notes accrues at a rate of 10.25% per annum and is payable semi-annually in cash on February 15 and August 15 of each year, commencing August 15, 2015. The Notes are fully and unconditionally guaranteed, jointly and severally, by Presidio Holdings’ present and future direct or indirect wholly owned material domestic subsidiaries that guarantee or are directly liable in respect of the senior facilities or certain other future credit facilities or future capital markets indebtedness.
On August 28, 2015, Presidio Holdings repurchased from an unaffiliated third party and subsequently retired $38.2 million of its Senior Subordinated Notes for $37.4 million (98.0% of par). As a result of the retirement of this debt, the Company recorded a $0.1 million loss on extinguishment of debt, net of a $0.9 million write off of debt issuance costs.
On June 9, 2016 and June 14, 2016, Presidio Holdings repurchased from an unaffiliated third party and subsequently retired $2.0 million of Senior Notes at 101.5% of par value and $25.6 million of Senior Notes at 104.75% of par value, respectively. As a result of the retirement of this debt, the Company recorded a $1.8 million loss on extinguishment of debt, of which $0.6 million was associated with the write off of debt issuance costs.
The Senior Notes and the related guarantees are senior unsecured obligations of Presidio Holdings and the guarantors, respectively. The Senior Subordinated Notes and the related guarantees are senior subordinated obligations of Presidio Holdings and the guarantors, respectively.
Prior to February 15, 2018, Presidio Holdings may redeem some or all of the Notes at a redemption price equal to 100% of the principal amount of the Notes plus accrued and unpaid interest, plus an applicable make-whole premium. On or after February 15, 2018, Presidio Holdings may redeem some or all of the Notes at certain
F-38
Table of Contents
Presidio, Inc.
Notes to Consolidated Financial Statements (Continued)
specified redemption prices, plus accrued and unpaid interest. Additionally, on or prior to February 15, 2018, Presidio Holdings may redeem up to 40% of the aggregate principal amount of each series of Notes with the net proceeds of specified equity offerings at specified redemption prices, provided that at least 50% of the initial principal amount of each series of Notes remains outstanding.
The indentures governing the Notes limit, among other things, Presidio Holdings’, and its guarantor subsidiaries’ ability to:
| • | incur or guarantee additional indebtedness; |
| • | pay dividends or distributions on, or redeem or repurchase, capital stock and make other restricted payments; |
| • | make investments; |
| • | consummate certain asset sales; |
| • | engage in transactions with affiliates, including the Company; |
| • | grant or assume liens; and |
| • | consolidate, merge or transfer all or substantially all of Presidio Holdings’ assets. |
Most of the restrictive covenants will cease to apply for so long as the Notes are rated investment grade by both Standard & Poor’s and Moody’s. The indentures governing the Notes also contain customary events of default.
Receivables Securitization Facility
The Company maintains an accounts receivable securitization facility (“Receivables Securitization Facility”) originally issued in April 2008 whereby each of PNS and Atlantix sells its trade receivables on a continuous basis to a wholly owned non-operating subsidiary of the Company, Presidio Capital Funding, LLC (“PCF”). PCF then grants, without recourse, a senior undivided security interest in the pooled receivables to the administrative agent of the facility, PNC Bank, while maintaining a subordinated undivided security interest in any over-collateralization of the pooled receivables. Presidio LLC services the receivables for PCF at market rates, and accordingly, no servicing asset or liability has been recorded. Upon and after the sale or contribution of the accounts receivable to PCF, such accounts receivable are legally assets of PCF and, as such, are not available to creditors of the Company or its other subsidiaries.
The Receivables Securitization Facility provides for borrowing capacity subject to a borrowing limit that is based on eligible receivables, as defined in the securitization agreements. Interest is calculated daily but payable monthly based on a Eurodollar borrowing rate plus a utilized program fee of 1.40%. The Company also incurs a commitment fee of 0.50% or 0.40%, depending on utilization. At June 30, 2016, the interest rate was 1.87% and the commitment fee was 0.50%.
In connection with the Presidio Acquisition described in Note 2, the committed amount of the Receivables Securitization Facility was increased from $150.0 million to $200.0 million, and the maturity date was extended from March 31, 2017 to the date three years after the closing of the Presidio Acquisition, which is February 2, 2018. The February 2, 2015 amendment to the Receivables Securitization Facility resulted in $0.8 million of additional debt issuance costs.
On February 8, 2016, the Receivables Securitization Facility was amended to increase the commitment amount from $200.0 million to $250.0 million. All other terms and conditions remained unchanged. The Company incurred $0.1 million in deferred financing costs associated with the February 8, 2016 amendment.
F-39
Table of Contents
Presidio, Inc.
Notes to Consolidated Financial Statements (Continued)
Accounts receivable purchased by PCF are subject to the satisfaction of customary conditions, including the absence of a termination event and the accuracy of representations and warranties. The obligations under the Receivables Securitization Facility are secured by PCF’s right, title and interest in the pool of receivables and certain related assets. The facility requires that Presidio LLC comply with a minimum fixed charge coverage ratio of 1.0 to 1.0 if its excess liquidity, as defined in the facility, falls below $35.0 million for at least five consecutive days. The Company was in compliance with this covenant as of June 30, 2016.
As of June 30, 2016, there was $5.0 million outstanding under the Receivables Securitization Facility. As of June 30, 2015, there were no outstanding borrowings under the facility. The Company had $196.0 million and $181.6 million available under the Receivables Securitization Facility based on the collateral available as of June 30, 2016 and 2015, respectively.
Debt Issuance Costs
The Company amortizes original issue discount and deferred financing costs (debt issuance cost) using the effective interest method over the life of the related debt instrument, and such amortization is included in interest expense in the consolidated statements of operations.
The following table presents the debt issuance costs for the periods presented (in millions):
| Other Assets |
Long-Term Debt | |||||||||||||||||||||||||||
| Revolving credit facilities |
Term loan, due March 2017 |
Term loan, due February 2019 |
Term loan facility, due February 2022 |
Senior notes |
Senior subordinated notes |
Total | ||||||||||||||||||||||
| Predecessor |
||||||||||||||||||||||||||||
| Balance, June 30, 2013 |
$ | 1.4 | $ | 13.1 | $ | — | $ | — | $ | — | $ | — | $ | 14.5 | ||||||||||||||
| Additions |
0.3 | 3.1 | — | — | — | — | 3.4 | |||||||||||||||||||||
| Extinguishments |
— | (2.7 | ) | — | — | — | — | (2.7 | ) | |||||||||||||||||||
| Amortization |
(0.6 | ) | (3.8 | ) | — | — | — | — | (4.4 | ) | ||||||||||||||||||
|
|
|
|
|
|
|
|
|
|
|
|
|
|
|
|||||||||||||||
| Balance, June 30, 2014 |
1.1 | 9.7 | — | — | — | — | 10.8 | |||||||||||||||||||||
| Additions |
— | — | — | — | — | — | — | |||||||||||||||||||||
| Extinguishments |
— | (7.5 | ) | — | — | — | — | (7.5 | ) | |||||||||||||||||||
| Amortization |
(0.2 | ) | (2.2 | ) | — | — | — | — | (2.4 | ) | ||||||||||||||||||
|
|
|
|
|
|
|
|
|
|
|
|
|
|
|
|||||||||||||||
| Balance, February 1, 2015 |
$ | 0.9 | $ | — | $ | — | $ | — | $ | — | $ | — | $ | 0.9 | ||||||||||||||
|
|
|
|
|
|
|
|
|
|
|
|
|
|
|
|||||||||||||||
|
|
||||||||||||||||||||||||||||
| Successor |
||||||||||||||||||||||||||||
| Balance, November 20, 2014 |
$ | — | $ | — | $ | — | $ | — | $ | — | $ | — | $ | — | ||||||||||||||
| Presidio Acquisition |
0.9 | — | — | — | — | — | 0.9 | |||||||||||||||||||||
| Additions |
2.1 | — | — | 33.0 | 6.3 | 3.7 | 45.1 | |||||||||||||||||||||
| Extinguishments |
— | — | — | (0.5 | ) | — | — | (0.5 | ) | |||||||||||||||||||
| Amortization |
(0.1 | ) | — | — | (2.1 | ) | (0.3 | ) | (0.2 | ) | (2.7 | ) | ||||||||||||||||
|
|
|
|
|
|
|
|
|
|
|
|
|
|
|
|||||||||||||||
| Balance, June 30, 2015 |
2.9 | — | — | 30.4 | 6.0 | 3.5 | 42.8 | |||||||||||||||||||||
| Additions |
0.1 | — | 8.4 | 1.0 | — | — | 9.5 | |||||||||||||||||||||
| Extinguishments |
— | — | (7.7 | ) | — | (0.6 | ) | (0.9 | ) | (9.2 | ) | |||||||||||||||||
| Amortization |
(1.1 | ) | — | (0.7 | ) | (4.7 | ) | (0.8 | ) | (0.3 | ) | (7.6 | ) | |||||||||||||||
|
|
|
|
|
|
|
|
|
|
|
|
|
|
|
|||||||||||||||
| Balance, June 30, 2016 |
$ | 1.9 | $ | — | $ | — | $ | 26.7 | $ | 4.6 | $ | 2.3 | $ | 35.5 | ||||||||||||||
|
|
|
|
|
|
|
|
|
|
|
|
|
|
|
|||||||||||||||
F-40
Table of Contents
Presidio, Inc.
Notes to Consolidated Financial Statements (Continued)
Long-Term Debt Maturities
As of June 30, 2016, the maturities of long-term debt were as follows:
| Years ending June 30, |
||||
| 2017 |
$ | 7.4 | ||
| 2018 |
12.4 | |||
| 2019 |
7.4 | |||
| 2020 |
7.4 | |||
| 2021 |
7.4 | |||
| 2022 and thereafter |
1,029.6 | |||
|
|
|
|||
| Total |
$ | 1,071.6 | ||
|
|
|
|||
Interest Rate Swaps
During the year ended June 30, 2014, the Company had two interest rate swap agreements that expired. Prior to expiration, each interest rate swap effectively converted the interest rate on a portion of the Company’s debt from floating rate to fixed rate. The forward interest rate swaps had a notional amount and fixed LIBOR rate, respectively, of $125.0 million at 2.12% for the period between September 17, 2012 through March 16, 2014, and $50.0 million at 1.58% for the period between December 24, 2012 and June 23, 2014.
For the year ended June 30, 2014 there are mark-to-market gains of $2.2 million relating to the change in fair value of an interest rate swap agreement.
During the periods ended subsequent to June 30, 2014, the Company did not have any outstanding interest rate swap agreements.
Note Payable to Former Shareholder
During the year ended June 30, 2014, the Company repaid $3.0 million on the note payable to a former shareholder of Presidio Holdings that was issued in connection with the repurchase of the former shareholder’s common stock. As of June 30, 2014, the note was paid in full.
Note 12. Fair Value Measurements
For certain of the Company’s financial instruments, including cash and cash equivalents, accounts and unbilled receivables, accounts payable – trade, accounts payable – floor plan, and other accrued liabilities, the carrying amount approximates fair value due to the short-term maturities of these instruments. Additionally, the Company’s financing receivables and acquisition-related liabilities were measured at their respective fair values upon initial recognition.
F-41
Table of Contents
Presidio, Inc.
Notes to Consolidated Financial Statements (Continued)
The fair value hierarchy for our financial assets and liabilities measured at fair value was as follows (in millions):
| Fair Value Measurement | ||||||||||||||||
| June 30, 2015 |
Carrying value | Level 1 | Level 2 | Level 3 | ||||||||||||
| Liabilities: |
||||||||||||||||
| Term loan |
$ | 573.6 | $ | — | $ | 575.3 | $ | — | ||||||||
| Senior notes |
250.0 | — | 258.3 | — | ||||||||||||
| Senior subordinated notes |
150.0 | — | 132.6 | — | ||||||||||||
|
|
|
|
|
|
|
|
|
|||||||||
| Total |
$ | 973.6 | $ | — | $ | 966.2 | $ | — | ||||||||
|
|
|
|
|
|
|
|
|
|||||||||
| Fair Value Measurement | ||||||||||||||||
| June 30, 2016 |
Carrying value | Level 1 | Level 2 | Level 3 | ||||||||||||
| Liabilities: |
||||||||||||||||
| Receivables securitization facility |
$ | 5.0 | $ | — | $ | — | $ | 5.0 | ||||||||
| Term loan |
732.3 | — | 714.0 | — | ||||||||||||
| Senior notes |
222.5 | — | 227.6 | — | ||||||||||||
| Senior subordinated notes |
111.8 | — | 115.7 | — | ||||||||||||
|
|
|
|
|
|
|
|
|
|||||||||
| Total |
$ | 1,071.6 | $ | — | $ | 1,057.3 | $ | 5.0 | ||||||||
|
|
|
|
|
|
|
|
|
|||||||||
The fair value of the Company’s term loans, senior notes and senior subordinated notes is estimated based on quoted market prices for the debt, which is traded in over-the-counter secondary markets that are not considered active. The carrying value of the Company’s term loans, senior notes and senior subordinated notes excludes unamortized debt issuance costs.
For certain of the Company’s nonfinancial assets, including goodwill, intangible assets and property and equipment, the Company may be required to assess the fair values of these assets, on a recurring or nonrecurring basis, and record an impairment if the carrying value exceeds the fair value. In determining the fair value of these assets, the Company may use a combination of valuation methods which include Level 3 inputs. For the periods presented, there were no impairments charges. See Notes 1 and 8 for additional information regarding the Company’s determination of fair value regarding goodwill and indefinite-lived intangible assets.
In conjunction with the acquisitions discussed in Note 2, the Company used a combination of valuation methods which include Level 3 inputs in determining the fair values of the assets and liabilities acquired as well as the fair value of the consideration transferred, which included equity and equity instruments.
Note 13. Commitments and Contingencies
Operating leases – The Company leases office space in approximately 67 locations under operating leases which were generally five to seven years in duration at lease inception, with an average remaining life of 2.9 years at June 30, 2016. Total rent expense charged to operations was $9.0 million for the year ended June 30, 2016, $3.8 million for the period ended June 30, 2015, $5.4 million for the period ended February 1, 2015 and $9.2 million for the year ended June 30, 2014.
F-42
Table of Contents
Presidio, Inc.
Notes to Consolidated Financial Statements (Continued)
Future minimum rental payments required under the leases are as follows (in millions):
| Years ending June 30, |
||||
| 2017 |
$ | 10.0 | ||
| 2018 |
8.4 | |||
| 2019 |
7.5 | |||
| 2020 |
6.4 | |||
| 2021 |
5.0 | |||
| 2022 and thereafter |
10.0 | |||
|
|
|
|||
| Total |
$ | 47.3 | ||
|
|
|
|||
Claims and assessments – In the normal course of business, the Company is subject to certain claims and assessments that arise in the ordinary course of business. The Company records a liability when the Company believes that it is both probable that a loss has been incurred and the amount can be reasonably estimated. Significant judgment is required to determine the outcome and the estimated amount of a loss related to such matters. Management believes that there are no claims or assessments outstanding which would materially affect the consolidated results of operations or financial position of the Company.
On July 14, 2015, the Company received a subpoena from the Office of Inspector General for the General Services Administration (“GSA”) seeking various records relating to GSA contracting activity by us during the period beginning in April 2005 through the present. The subpoena is part of an ongoing law enforcement investigation being conducted by the GSA and requests a broad range of documents relating to business conduct in the GSA Multiple Award Schedule program. The Company is fully cooperating with the Inspector General in connection with the subpoena.
On March 11, 2016, the Company received a subpoena from the Office of Treasury Inspector General for Tax Administration for the Department of the Treasury seeking various records from January 1, 2014 through the present relating to Company contracts with the Internal Revenue Service, as well as the Company’s interactions with other parties named in the subpoena who were involved in such contracts. The Company is fully cooperating with the Treasury Inspector General in connection with the subpoena.
As these matters are ongoing, the Company is unable to determine their likely outcome and is unable to reasonably estimate a range of loss, if any, at this time. Accordingly, no provision for these matters has been recorded.
Note 14. Stockholders’ Equity
In accordance with the terms of the credit agreements and the notes indentures, Presidio Holdings has certain limitations on its ability to declare and pay dividends. These limitations include restrictions on the transfer of cash and/or other property between Presidio LLC, Presidio Holdings and Presidio, Inc.
All dividends declared are subject to Board approval and will depend on the Company’s results of operations, financial condition, business prospects, capital requirements, contractual restrictions, potential indebtedness the Company may incur, restrictions imposed by applicable law, tax considerations and other factors that the Company’s Board of Directors deems relevant.
During the year ended June 30, 2014, Presidio Holdings completed a dividend recapitalization by amending its legacy credit agreement and declaring a special, one-time $0.46 per share dividend payable to shareholders of
F-43
Table of Contents
Presidio, Inc.
Notes to Consolidated Financial Statements (Continued)
record on March 21, 2014. The dividends paid exceeded the Company’s retained earnings balance at the time of declaration and as a result, the excess was recorded as a reduction to additional paid-in capital.
Note 15. Share-based Compensation
On February 2, 2015, concurrent with the Presidio Acquisition discussed in Note 2, the Company adopted the Presidio, Inc. Long-Term Incentive Plan (“Presidio LTIP”) under which employees, directors and officers of the Company may be granted equity interests in Presidio, Inc. in the form of incentive and nonqualified stock options, stock appreciation rights, restricted stock and other stock-based awards. This plan was effective during the periods after the Presidio Acquisition, and as of June 30, 2016, the only awards issued and outstanding under the plan are nonqualified stock options.
Prior to the Presidio Acquisition, for the period ended February 1, 2015 and the year ended June 30, 2014, the Company’s incentive plan was the Presidio Holdings Inc. Long-Term Incentive Plan (“Presidio Holdings LTIP”). During that time, the Company had authorized, issued and outstanding nonqualified stock options and stock appreciation rights (“SARs”).
The purpose of both plans is to align the economic interests of the employees, directors and officers with the interests of the stockholders by including equity as a component of pay and to attract, motivate and retain experienced and knowledgeable employees.
Presidio, Inc. LTIP (Successor)
The nonqualified stock options issued under the Presidio LTIP are comprised of newly issued options and fully vested options that were rolled over from the Presidio Holdings LTIP at the time of the Presidio Acquisition (the “Rolled options”). As of June 30, 2016, 5,143,509 nonqualified stock options had been authorized to be issued and 4,418,144 were issued and outstanding, including 866,411 Rolled options that were fully vested.
The newly issued options are primarily issued proportionally as 50% Tranche A options, 25% Tranche B options and 25% Tranche C options.
The Tranche A options are service-based options and vest in equal installments on each of the first five anniversaries of the grant date, subject to the employee’s continued employment or the director’s continued service with the Company through these dates.
The Tranche B and Tranche C options are performance- and market-based options, with vesting being contingent upon the achievement of certain market conditions by the Apollo funds in cash pursuant to a liquidity event, subject to the employee’s continued employment with the Company through the date of achievement.
In the event of a change in control, any Tranche A options that have not previously vested shall become fully vested and exercisable at the time of such change in control, subject to the employee’s continued employment with the Company through this date. Any Tranche B and Tranche C options that have not vested prior to, or become vested at the time of, a change in control shall be converted into time-vesting options that vest in equal annual installments on each anniversary of the change in control occurring during the remainder of the option term, subject to the employee’s continued employment with the Company through these dates. In the event of an initial public offering, all options shall remain outstanding and continue to vest in accordance with their original vesting terms.
F-44
Table of Contents
Presidio, Inc.
Notes to Consolidated Financial Statements (Continued)
Presidio Holdings Inc. LTIP (Predecessor)
The nonqualified stock options of the Predecessor were comprised of core options and performance options, as well as options rolled over from a previous equity incentive plan (the “Predecessor Rolled options”). The Predecessor Rolled options were fully vested as of March 31, 2011. The core options contained only a service element and vested and became exercisable in equal installments on each of the first five anniversaries of the grant. The vesting of the performance options was contingent upon both a change of control and the achievement of an internal rate of return and return on investment.
The SARs of the Predecessor were comprised of performance SARs and SARs rolled over from a previous equity incentive plan (the “Predecessor Rolled SARs”). The Predecessor Rolled SARs were fully vested at March 31, 2011. The performance SARs had the same performance conditions as the nonqualified stock options, with the exception that the SARs could only be settled in cash. Due to the required cash settlement, the SARs were liability classified.
Both the nonqualified stock options and SARs were exercisable over a ten-year period from the grant date.
During the period ended February 1, 2015, a change of control became probable and all outstanding, unvested core and performance awards were accelerated to 100% vested as of February 1, 2015. The acceleration of all outstanding awards included the recognition of expense associated with the performance awards which had previously not had expense recognized due to the performance condition not being considered probable of achievement. The accelerated compensation expense included grant date expense and incremental share-based compensation cost that resulted from the modification of awards associated with the dividend recapitalization discussed below.
Certain Predecessor options were rolled into the new Presidio LTIP as a result of the acquisition, and incremental compensation expense of $0.4 million was recognized in the period ended June 30, 2015 as a result of the difference in fair value as determined using a Black-Scholes model. The 7,933,856 vested core options and 1,466,172 vested performance options from the Predecessor entity which were rolled were exchanged for 885,344 vested options of the Successor entity in a manner that held each employee’s intrinsic value constant.
During the year ended June 30, 2014, the Company completed a dividend recapitalization by amending its credit agreement and declaring a special, one-time dividend payable to shareholders of record on March 21, 2014. In conjunction with the dividend recapitalization, the Company modified the strike price for the majority of the outstanding awards in an equity restructuring to keep the intrinsic value of the awards consistent before and after the dividend. The strike price of the awards was the only feature that was modified.
All employees holding outstanding awards at the time of the dividend recapitalization were impacted by the modification. Certain outstanding awards could not have their strike price modified (based on consideration of Section 409A of the Internal Revenue Code), and as a result, the Company made a special payment of $6.3 million to the respective award holders that was recognized in transaction costs within the Company’s consolidated statement of operations for the year ended June 30, 2014.
Furthermore, there were other outstanding awards for which the strike price could be partially adjusted, but could not be adjusted for the full value of the dividend due to Section 409A of the Internal Revenue Code. As a result, the holders of these awards received the right to receive a change of control payment for the difference. Due to the Presidio Acquisition, the Company recognized $3.4 million of compensation expense presented within transaction costs in the consolidated statement of operations for the period ended February 1, 2015. The incremental share-based compensation cost related to the modification of core awards recognized was
F-45
Table of Contents
Presidio, Inc.
Notes to Consolidated Financial Statements (Continued)
$2.9 million and $3.9 million through February 1, 2015 and June 30, 2014, respectively. The incremental share-based compensation cost related to the modification of performance awards recognized was $5.7 million on February 1, 2015.
Nonqualified Option Activity
A summary of the nonqualified stock option activity was as follows:
| Core & Rolled options outstanding | ||||||||||||||||||||||||||||||||||||
| Total outstanding options | Vested (exercisable) options | Nonvested options | ||||||||||||||||||||||||||||||||||
| Weighted-average | Weighted-average | Weighted-average | ||||||||||||||||||||||||||||||||||
| Predecessor |
Number of options |
Exercise price |
Fair value |
Number of options |
Exercise price |
Fair value |
Number of options |
Exercise price |
Fair value |
|||||||||||||||||||||||||||
| Balance, June 30, 2013 |
42,664,395 | $ | 0.57 | $ | 0.24 | 18,701,668 | $ | 0.50 | $ | 0.18 | 23,962,727 | $ | 0.61 | $ | 0.28 | |||||||||||||||||||||
| Granted |
929,998 | 1.10 | 0.42 | — | — | — | 929,998 | 1.10 | 0.42 | |||||||||||||||||||||||||||
| Vested |
— | — | — | 7,224,332 | 0.43 | 0.37 | (7,224,332 | ) | 0.43 | 0.37 | ||||||||||||||||||||||||||
| Exercised |
(350,539 | ) | 0.20 | 0.34 | (350,539 | ) | 0.20 | 0.34 | — | — | — | |||||||||||||||||||||||||
| Forfeited |
(2,103,127 | ) | 0.73 | 0.30 | (615,345 | ) | 0.73 | 0.18 | (1,487,782 | ) | 0.73 | 0.35 | ||||||||||||||||||||||||
| Expired |
— | — | — | — | — | — | — | — | — | |||||||||||||||||||||||||||
|
|
|
|
|
|
|
|
|
|
|
|
|
|
|
|
|
|
|
|||||||||||||||||||
| Balance, June 30, 2014 |
41,140,727 | 0.30 | 0.41 | 24,960,116 | 0.32 | 0.33 | 16,180,611 | 0.27 | 0.52 | |||||||||||||||||||||||||||
| Granted |
— | — | — | — | — | — | — | — | — | |||||||||||||||||||||||||||
| Vested |
— | — | — | 16,164,611 | 0.27 | 0.52 | (16,164,611 | ) | 0.27 | 0.52 | ||||||||||||||||||||||||||
| Exercised |
(101,770 | ) | 0.16 | 0.49 | (101,770 | ) | 0.16 | 0.49 | — | — | — | |||||||||||||||||||||||||
| Forfeited |
(20,000 | ) | 0.59 | 0.48 | (4,000 | ) | 0.59 | 0.48 | (16,000 | ) | 0.59 | 0.48 | ||||||||||||||||||||||||
| Expired |
— | — | — | — | — | — | — | — | — | |||||||||||||||||||||||||||
| Settled(1) |
(33,085,101 | ) | 0.32 | 0.37 | (33,085,101 | ) | 0.32 | 0.37 | — | — | — | |||||||||||||||||||||||||
| Rolled(1) |
(7,933,856 | ) | 0.23 | 0.55 | (7,933,856 | ) | 0.23 | 0.55 | — | — | — | |||||||||||||||||||||||||
|
|
|
|
|
|
|
|
|
|
|
|
|
|
|
|
|
|
|
|||||||||||||||||||
| Balance, February 1, 2015 |
— | $ | — | $ | — | — | $ | — | $ | — | — | $ | — | $ | — | |||||||||||||||||||||
|
|
|
|
|
|
|
|
|
|
|
|
|
|
|
|
|
|
|
|||||||||||||||||||
|
|
|
|
|
|
|
|
|
|
|
|
|
|
|
|
|
|
|
|||||||||||||||||||
| Tranche A & Rolled options outstanding | ||||||||||||||||||||||||||||||||||||
| Total outstanding options | Vested (exercisable) options | Nonvested options | ||||||||||||||||||||||||||||||||||
| Weighted-average | Weighted-average | Weighted-average | ||||||||||||||||||||||||||||||||||
| Successor |
Number of options |
Exercise price |
Fair value |
Number of options |
Exercise price |
Fair value |
Number of options |
Exercise price |
Fair value |
|||||||||||||||||||||||||||
| Balance, November 20, 2014 |
— | $ | — | $ | — | — | $ | — | $ | — | — | $ | — | $ | — | |||||||||||||||||||||
| Rolled(1) |
885,344 | 2.60 | 7.77 | 885,344 | 2.60 | 7.77 | — | — | — | |||||||||||||||||||||||||||
| Granted |
1,656,750 | 10.00 | 3.24 | 1,656,750 | 10.00 | 3.24 | ||||||||||||||||||||||||||||||
| Exercised |
— | — | — | — | — | — | — | — | — | |||||||||||||||||||||||||||
| Forfeited |
(5,000 | ) | 10.00 | 3.24 | — | — | — | (5,000 | ) | 10.00 | 3.24 | |||||||||||||||||||||||||
| Expired |
— | — | — | — | — | — | — | — | — | |||||||||||||||||||||||||||
|
|
|
|
|
|
|
|
|
|
|
|
|
|
|
|
|
|
|
|||||||||||||||||||
| Balance, June 30, 2015 |
2,537,094 | 7.42 | 4.82 | 885,344 | 2.60 | 7.77 | 1,651,750 | 10.00 | 3.24 | |||||||||||||||||||||||||||
| Granted |
244,700 | 17.15 | 6.05 | — | — | — | 244,700 | 17.15 | 6.05 | |||||||||||||||||||||||||||
| Vested |
— | — | — | 329,250 | 10.00 | 3.24 | (329,250 | ) | 10.00 | 3.24 | ||||||||||||||||||||||||||
| Exercised |
(11,928 | ) | 2.86 | 7.48 | (11,928 | ) | 2.86 | 7.48 | — | — | — | |||||||||||||||||||||||||
| Forfeited |
(119,078 | ) | 10.37 | 3.73 | (7,005 | ) | 2.86 | 7.48 | (112,073 | ) | 10.84 | 3.50 | ||||||||||||||||||||||||
| Expired |
— | — | — | — | — | — | — | — | — | |||||||||||||||||||||||||||
|
|
|
|
|
|
|
|
|
|
|
|
|
|
|
|
|
|
|
|||||||||||||||||||
| Balance, June 30, 2016 |
2,650,788 | $ | 8.20 | $ | 4.97 | 1,195,661 | $ | 4.63 | $ | 6.53 | 1,455,127 | $ | 11.14 | $ | 3.69 | |||||||||||||||||||||
|
|
|
|
|
|
|
|
|
|
|
|
|
|
|
|
|
|
|
|||||||||||||||||||
F-46
Table of Contents
Presidio, Inc.
Notes to Consolidated Financial Statements (Continued)
| Performance options outstanding | ||||||||||||||||||||||||||||||||||||
| Total outstanding options | Vested (exercisable) options | Nonvested options | ||||||||||||||||||||||||||||||||||
| Weighted-average | Weighted-average | Weighted-average | ||||||||||||||||||||||||||||||||||
| Predecessor |
Number of options |
Exercise price |
Fair value |
Number of options |
Exercise price |
Fair value |
Number of options |
Exercise price |
Fair value |
|||||||||||||||||||||||||||
| Balance, June 30, 2013 |
24,806,448 | $ | 0.60 | $ | 0.29 | — | $ | — | $ | — | 24,806,448 | $ | 0.60 | $ | 0.29 | |||||||||||||||||||||
| Granted |
480,001 | 0.66 | 0.64 | — | — | — | 480,001 | 0.66 | 0.64 | |||||||||||||||||||||||||||
| Vested |
— | — | — | — | — | — | — | — | — | |||||||||||||||||||||||||||
| Exercised |
— | — | — | — | — | — | — | — | — | |||||||||||||||||||||||||||
| Forfeited |
(890,762 | ) | 0.50 | 0.29 | — | — | — | (890,762 | ) | 0.50 | 0.29 | |||||||||||||||||||||||||
| Expired |
— | — | — | — | — | — | — | — | — | |||||||||||||||||||||||||||
|
|
|
|
|
|
|
|
|
|
|
|
|
|
|
|
|
|
|
|||||||||||||||||||
| Balance, June 30, 2014 |
24,395,687 | 0.22 | 0.53 | — | — | — | 24,395,687 | 0.22 | 0.53 | |||||||||||||||||||||||||||
| Granted |
— | — | — | — | — | — | — | — | — | |||||||||||||||||||||||||||
| Vested |
— | — | — | 23,671,078 | 0.22 | 0.53 | (23,671,078 | ) | 0.22 | 0.53 | ||||||||||||||||||||||||||
| Exercised |
— | — | — | — | — | — | — | — | — | |||||||||||||||||||||||||||
| Forfeited |
(724,609 | ) | 0.25 | 0.53 | — | — | — | (724,609 | ) | 0.25 | 0.53 | |||||||||||||||||||||||||
| Expired |
— | — | — | — | — | — | — | — | — | |||||||||||||||||||||||||||
| Settled(1) |
(22,204,906 | ) | 0.22 | 0.53 | (22,204,906 | ) | 0.22 | 0.53 | — | — | — | |||||||||||||||||||||||||
| Rolled(1) |
(1,466,172 | ) | 0.33 | 0.55 | (1,466,172 | ) | 0.33 | 0.55 | — | — | — | |||||||||||||||||||||||||
|
|
|
|
|
|
|
|
|
|
|
|
|
|
|
|
|
|
|
|||||||||||||||||||
| Balance, February 1, 2015 |
— | $ | — | $ | — | — | $ | — | $ | — | — | $ | — | $ | — | |||||||||||||||||||||
|
|
|
|
|
|
|
|
|
|
|
|
|
|
|
|
|
|
|
|||||||||||||||||||
|
|
|
|
|
|
|
|
|
|
|
|
|
|
|
|
|
|
|
|||||||||||||||||||
| Tranche B & C options outstanding | ||||||||||||||||||||||||||||||||||||
| Total outstanding options | Vested (exercisable) options | Nonvested options | ||||||||||||||||||||||||||||||||||
| Weighted-average | Weighted-average | Weighted-average | ||||||||||||||||||||||||||||||||||
| Successor |
Number of options |
Exercise price |
Fair value |
Number of options |
Exercise price |
Fair value |
Number of options |
Exercise price |
Fair value |
|||||||||||||||||||||||||||
| Balance, November 20, 2014 |
— | $ | — | $ | — | — | $ | — | $ | — | — | $ | — | $ | — | |||||||||||||||||||||
| Granted |
1,649,250 | 10.00 | 3.80 | — | — | — | 1,649,250 | 10.00 | 3.80 | |||||||||||||||||||||||||||
| Exercised |
— | — | — | — | — | — | — | — | — | |||||||||||||||||||||||||||
| Forfeited |
(5,000 | ) | 10.00 | 3.80 | — | — | — | (5,000 | ) | 10.00 | 3.80 | |||||||||||||||||||||||||
| Expired |
— | — | — | — | — | — | — | — | — | |||||||||||||||||||||||||||
|
|
|
|
|
|
|
|
|
|
|
|
|
|
|
|
|
|
|
|||||||||||||||||||
| Balance, June 30, 2015 |
1,644,250 | 10.00 | 3.80 | — | — | — | 1,644,250 | 10.00 | 3.80 | |||||||||||||||||||||||||||
| Granted |
237,176 | 17.14 | 6.18 | — | — | — | 237,176 | 17.14 | 6.18 | |||||||||||||||||||||||||||
| Vested |
— | — | — | — | — | — | — | — | — | |||||||||||||||||||||||||||
| Exercised |
— | — | — | — | — | — | — | — | — | |||||||||||||||||||||||||||
| Forfeited |
(114,070 | ) | 10.83 | 4.09 | — | — | — | (114,070 | ) | 10.83 | 4.09 | |||||||||||||||||||||||||
| Expired |
— | — | — | — | — | — | — | — | — | |||||||||||||||||||||||||||
|
|
|
|
|
|
|
|
|
|
|
|
|
|
|
|
|
|
|
|||||||||||||||||||
| Balance, June 30, 2016 |
1,767,356 | $ | 10.90 | $ | 4.11 | — | $ | — | $ | — | 1,767,356 | $ | 10.90 | $ | 4.11 | |||||||||||||||||||||
|
|
|
|
|
|
|
|
|
|
|
|
|
|
|
|
|
|
|
|||||||||||||||||||
| (1) | In conjunction with the Presidio Acquisition, certain employees rolled the value of their vested Predecessor stock options into vested Successor stock options. For those employees that did not roll their stock options, the outstanding stock options were cancelled in exchange for a cash payment equal to their intrinsic value at the acquisition price. |
F-47
Table of Contents
Presidio, Inc.
Notes to Consolidated Financial Statements (Continued)
Vested and Expected to Vest
A summary of nonqualified stock options that are vested or expected to vest was as follows:
| Number of options |
Weighted- average exercise price |
Intrinsic value (in millions) |
Weighted- average remaining contract term (in years) |
|||||||||||||
| Predecessor |
||||||||||||||||
| Balance, June 30, 2014 |
37,437,735 | $ | 0.31 | $ | 15.6 | 6.6 | ||||||||||
| Balance, February 1, 2015 |
— | — | — | — | ||||||||||||
| Successor |
||||||||||||||||
| Balance, June 30, 2015 |
2,179,533 | $ | 6.99 | $ | 6.5 | 9.6 | ||||||||||
| Balance, June 30, 2016 |
2,492,485 | 8.01 | 23.6 | 7.7 | ||||||||||||
Intrinsic Values
A summary of the intrinsic values of nonqualified stock options was as follows (in millions):
| Core & Rolled options outstanding | Performance options outstanding |
|||||||||||||||||||
| Predecessor |
Exercised during the period ended |
Total outstanding options |
Vested (exercisable) options |
Nonvested options |
Nonvested options |
|||||||||||||||
| June 30, 2014 |
$ | 0.3 | $ | 27.8 | $ | 16.4 | $ | 11.4 | $ | 18.4 | ||||||||||
| February 1, 2015 |
0.1 | — | — | — | — | |||||||||||||||
| Tranche A & Rolled options outstanding | Tranche B & C options outstanding |
|||||||||||||||||||
| Successor |
Exercised during the period ended |
Total outstanding options |
Vested (exercisable) options |
Nonvested options |
Nonvested options |
|||||||||||||||
| June 30, 2015 |
$ | — | $ | 6.5 | $ | 6.5 | $ | — | $ | — | ||||||||||
| June 30, 2016 |
0.2 | 24.6 | 15.4 | 9.2 | 11.7 | |||||||||||||||
Fair Value Assumptions
The weighted-average assumptions used in the Black-Scholes and Monte Carlo valuations to calculate the fair value of the awards granted during the periods were as follows:
| Predecessor | Successor | |||||||||||||||
| Year ended June 30, 2014 |
July 1, 2014 to February 1, 2015 |
November 20, 2014 to June 30, 2015 |
Year ended June 30, 2016 |
|||||||||||||
| Nonqualified stock options: |
||||||||||||||||
| Expected life (in years)(2) |
6.5 | N/A | (1) | 6.5 | 6.5 | |||||||||||
| Expected volatility |
43.4 | % | N/A | (1) | 28.3 | % | 32.2 | % | ||||||||
| Average risk-free interest rate |
2.0 | % | N/A | (1) | 1.9 | % | 1.8 | % | ||||||||
| Dividend yield |
0.0 | % | N/A | (1) | 0.0 | % | 0.0 | % | ||||||||
| (1) | There were no grants issued during the period from July 1, 2014 to February 1, 2015. |
F-48
Table of Contents
Presidio, Inc.
Notes to Consolidated Financial Statements (Continued)
| (2) | The expected life assumption for the Tranche B and C awards used in the Monte Carlo simulation varied based on the outcomes of each scenario performed. |
The expected stock price volatility is based on the average of the historical volatility of public companies in industries similar to the Company. The risk-free interest rate is based on U.S. Treasury yields in effect at the time of grant over the expected term of the option. The Company has insufficient historical data regarding the expected life of options and therefore uses the simplified method to calculate the expected life.
Stock Appreciation Rights
There were no grants, exercises, forfeitures or cancellations during the year ended June 30, 2016 or the periods ended June 30, 2015 and February 1, 2015. All SARs outstanding were cash settled on February 1, 2015 in conjunction with the Presidio Acquisition.
During the year ended June 30, 2014, the Company granted 7,214,500 SARs at a weighted-average exercise price of $0.63. There were no exercises, forfeitures or cancellations during the year ended June 30, 2014.
Share-Based Compensation Expense
The following table summarizes the share-based compensation expense and realized tax benefits upon exercise as follows (in millions):
| Predecessor | Successor | |||||||||||||||
| Year ended June 30, 2014 |
July 1, 2014 to February 1, 2015 |
November 20, 2014 to June 30, 2015 |
Year ended June 30, 2016 |
|||||||||||||
| Nonqualified stock options |
$ | 5.7 | $ | 17.3 | $ | 1.0 | $ | 2.2 | ||||||||
| Stock appreciation rights |
(0.2 | ) | 2.8 | — | — | |||||||||||
|
|
|
|
|
|
|
|
|
|||||||||
| Total |
$ | 5.5 | $ | 20.1 | $ | 1.0 | $ | 2.2 | ||||||||
|
|
|
|
|
|
|
|
|
|||||||||
| Selling expenses |
$ | 2.3 | $ | 8.5 | $ | 0.4 | $ | 0.9 | ||||||||
| General and administrative expenses |
3.2 | 11.6 | 0.6 | 1.3 | ||||||||||||
|
|
|
|
|
|
|
|
|
|||||||||
| Total |
$ | 5.5 | $ | 20.1 | $ | 1.0 | $ | 2.2 | ||||||||
|
|
|
|
|
|
|
|
|
|||||||||
| Tax benefits realized |
$ | 0.2 | $ | 19.5 | $ | — | $ | 0.1 | ||||||||
|
|
|
|
|
|
|
|
|
|||||||||
As of June 30, 2016, there was $3.6 million of unrecognized compensation costs related to Tranche A options which is expected to be recognized as expense over a weighted-average period of 4.0 years. As of June 30, 2016, there was $7.3 million of unrecognized compensation costs related to Tranche B and C options which will be recognized when the achievement of the performance condition is deemed probable.
F-49
Table of Contents
Presidio, Inc.
Notes to Consolidated Financial Statements (Continued)
Note 16. Earnings (Loss) Per Share
The following is a reconciliation of the weighted-average number of shares used to compute basic and diluted net earnings (loss) per share (in millions, except for share and per share data):
| Predecessor | Successor | |||||||||||||||
| Year ended June 30, 2014 |
July 1, 2014 to February 1, 2015 |
November 20, 2014 to June 30, 2015 |
Year ended June 30, 2016 |
|||||||||||||
| Numerator: |
||||||||||||||||
| Earnings (loss) |
$ | 32.5 | $ | (5.1 | ) | $ | (24.3 | ) | $ | (3.4 | ) | |||||
| Denominator: |
||||||||||||||||
| Weighted-average shares – basic |
561,829,775 | 561,886,602 | 35,005,269 | 35,558,981 | ||||||||||||
| Effect of dilutive securities: |
||||||||||||||||
| Stock options |
10,826,524 | — | — | — | ||||||||||||
|
|
|
|
|
|
|
|
|
|||||||||
| Weighted-average shares – diluted |
572,656,299 | 561,886,602 | 35,005,269 | 35,558,981 | ||||||||||||
|
|
|
|
|
|
|
|
|
|||||||||
| Earnings (loss) per share: |
||||||||||||||||
| Basic |
$ | 0.06 | $ | (0.01 | ) | $ | (0.69 | ) | $ | (0.10 | ) | |||||
| Diluted |
$ | 0.06 | $ | (0.01 | ) | $ | (0.69 | ) | $ | (0.10 | ) | |||||
Potentially dilutive securities that have been excluded from the computation of diluted weighted-average shares of common stock outstanding because their inclusion would have been anti-dilutive consists of the following:
| Predecessor | Successor | |||||||||||||||
| Year ended June 30, 2014 |
July 1, 2014 to February 1, 2015 |
November 20, 2014 to June 30, 2015 |
Year ended June 30, 2016 |
|||||||||||||
| Stock options excluded from EPS because of anti-dilution |
242,307 | 64,811,805 | 2,537,094 | 2,650,788 | ||||||||||||
| Stock options excluded from EPS because performance condition had not been met |
24,395,687 | — | 1,644,250 | 1,767,356 | ||||||||||||
|
|
|
|
|
|
|
|
|
|||||||||
| Total stock options excluded from EPS |
24,637,994 | 64,811,805 | 4,181,344 | 4,418,144 | ||||||||||||
|
|
|
|
|
|
|
|
|
|||||||||
Note 17. Income Taxes
The following table summarizes the expense (benefit) for income taxes (in millions):
| Predecessor | Successor | |||||||||||||||
| Year ended June 30, 2014 |
July 1, 2014 to February 1, 2015 |
November 20, 2014 to June 30, 2015 |
Year ended June 30, 2016 |
|||||||||||||
| Current: |
||||||||||||||||
| Federal |
$ | 30.8 | $ | (1.7 | ) | $ | (0.2 | ) | $ | 18.4 | ||||||
| State |
5.3 | 1.4 | 0.6 | 5.0 | ||||||||||||
| Deferred: |
||||||||||||||||
| Federal |
(12.2 | ) | 4.4 | (11.4 | ) | (17.4 | ) | |||||||||
| State |
0.5 | (0.9 | ) | (1.6 | ) | (2.2 | ) | |||||||||
|
|
|
|
|
|
|
|
|
|||||||||
| Total income tax expense (benefit) |
$ | 24.4 | $ | 3.2 | $ | (12.6 | ) | $ | 3.8 | |||||||
|
|
|
|
|
|
|
|
|
|||||||||
F-50
Table of Contents
Presidio, Inc.
Notes to Consolidated Financial Statements (Continued)
The difference between the tax provision at the statutory federal income tax rate and the effective rate on income was as follows:
| Predecessor | Successor | |||||||||||||||||||
| Year ended June 30, 2014 |
July 1, 2014 to February 1, 2015 |
November 20, 2014 to June 30, 2015 |
Year ended June 30, 2016 |
|||||||||||||||||
| Statutory federal income tax rate |
35.0 | % | 35.0 | % | 35.0 | % | 35.0 | % | ||||||||||||
| Increase (decrease) in rate resulting from: |
||||||||||||||||||||
| State taxes, net of federal benefits |
4.5 | (7.1 | ) | 2.3 | 175.0 | |||||||||||||||
| Permanent adjustments |
1.1 | (187.1 | ) | (4.4 | ) | 250.0 | ||||||||||||||
| State tax rate change on deferred items |
— | — | — | 340.0 | ||||||||||||||||
| Provision to return adjustments |
1.5 | (5.8 | ) | — | 125.0 | |||||||||||||||
| Uncertain tax positions |
0.8 | (3.4 | ) | 1.2 | 25.0 | |||||||||||||||
|
|
|
|
|
|
|
|
|
|||||||||||||
| Effective tax rate |
42.9 | % | (168.4 | )% | 34.1 | % | 950.0 | % | ||||||||||||
|
|
|
|
|
|
|
|
|
|||||||||||||
The Company’s effective income tax rate for the year ended June 30, 2016 was higher than the statutory rate primarily due to the impact on the nominally small pre-tax income of unfavorable permanent differences and the impact of the revaluation of deferred tax balances related to the state tax rate change.
The Company’s effective income tax rate for the period ended June 30, 2015 was lower than the statutory rate primarily due to the impact on the pre-tax loss of unfavorable permanent differences for the recognition of certain expenses in the Successor financial statements associated with the Presidio Acquisition as described in Note 2.
The Company’s effective income tax rate for the period ended February 1, 2015 was lower than the statutory rate primarily due to the impact on the pre-tax loss of unfavorable permanent differences for the recognition of certain expenses in the Predecessor financial statements associated with the Presidio Acquisition. The impact of the permanent differences created income tax expense in relation to the short period pre-tax loss.
The Company’s effective income tax rate for the year ended June 30, 2014 was higher than statutory primarily due to the unfavorable permanent differences and the impact of provision to return adjustments.
F-51
Table of Contents
Presidio, Inc.
Notes to Consolidated Financial Statements (Continued)
Deferred income taxes reflect the net effects of temporary differences between the carrying amounts of assets and liabilities for financial reporting purposes and the amounts used for income tax purposes. The significant components of the Company’s deferred tax assets (liabilities) were as follows (in millions):
| June 30, 2015 | June 30, 2016 | |||||||||||
| Current | Non-current | Non-current(1) | ||||||||||
| Deferred tax assets: |
||||||||||||
| Accrued expenses |
$ | 13.9 | $ | — | $ | 20.5 | ||||||
| Bad debt |
0.9 | — | 1.2 | |||||||||
| Share-based compensation |
— | 2.7 | 3.8 | |||||||||
| Acquisition related |
— | 4.4 | 4.6 | |||||||||
| Net operating losses |
3.7 | — | 0.1 | |||||||||
| Other |
— | 1.2 | — | |||||||||
|
|
|
|
|
|
|
|||||||
| Total deferred tax assets |
18.5 | 8.3 | 30.2 | |||||||||
| Deferred tax liabilities: |
||||||||||||
| Intangibles |
— | (296.3 | ) | (272.2 | ) | |||||||
| Leases |
— | (26.1 | ) | (33.3 | ) | |||||||
| Debt issuance costs |
— | (11.2 | ) | (8.4 | ) | |||||||
| Depreciation |
— | (0.6 | ) | (4.1 | ) | |||||||
| Other |
(0.2 | ) | — | (0.2 | ) | |||||||
|
|
|
|
|
|
|
|||||||
| Total deferred tax liabilities |
(0.2 | ) | (334.2 | ) | (318.2 | ) | ||||||
|
|
|
|
|
|
|
|||||||
| Total net deferred tax assets (liabilities) |
$ | 18.3 | $ | (325.9 | ) | $ | (288.0 | ) | ||||
|
|
|
|
|
|
|
|||||||
| (1) | During the year ended June 30, 2016, the Company adopted ASU 2015-17, Income Taxes (Topic 740): Balance Sheet Classification of Deferred Taxes, which requires that deferred tax liabilities and assets be classified as non-current in a classified statement of financial position. The Company adopted this standard on a prospective basis and as a result, prior period financial statements have not been revised. |
The Company believes that it is more likely than not, based on the weight of available evidence, that the deferred tax assets as shown will be realized when future taxable income is generated through the reversal of existing taxable temporary differences and income that is expected to be generated by businesses that have a history of generating taxable income. As of June 30, 2016 and 2015, no valuation allowances have been recorded against the deferred tax assets.
The Company records a liability for uncertain tax positions if it is not more likely than not that the position will be sustained in an audit, including resolution of related appeals or litigation, if any. For positions that are more likely than not to be sustained, the liability recorded is measured as the largest benefit amount that is more than 50% likely to be realized upon ultimate settlement. As of June 30, 2016 and June 30, 2015, the Company had unrecognized tax benefits including interest and penalties of $1.6 million and $1.8 million, respectively. The $0.2 million net decrease in the liability is attributed to the statute of limitations expiring on certain state income tax returns offset by an increase in other uncertain tax positions. As of June 30, 2016, the Company believes that it is reasonably possible that the total amounts of unrecognized tax benefits will decrease by approximately $0.4 million within the next 12 months related to statutes of limitations on certain federal and state income tax returns expiring. The liability for uncertain tax positions is presented within other liabilities in the consolidated balance sheets.
F-52
Table of Contents
Presidio, Inc.
Notes to Consolidated Financial Statements (Continued)
A reconciliation of the beginning and ending amount of gross unrecognized tax benefits excluding interest and penalties is as follows (in millions):
| Predecessor | Successor | |||||||||||||||
| Year ended June 30, 2014 |
July 1, 2014 to February 1, 2015 |
November 20, 2014 to June 30, 2015 |
Year ended June 30, 2016 |
|||||||||||||
| Balance, beginning of period |
$ | 0.3 | $ | 2.4 | $ | — | $ | 1.5 | ||||||||
| Increases for tax positions taken on acquired entities |
— | — | 2.4 | — | ||||||||||||
| Increases for tax positions taken in current period |
0.6 | — | — | — | ||||||||||||
| Increases for tax positions taken in a previous period |
2.5 | — | — | 0.3 | ||||||||||||
| Expiration of statute of limitations |
(1.0 | ) | — | (0.9 | ) | (0.5 | ) | |||||||||
|
|
|
|
|
|
|
|
|
|||||||||
| Balance, end of period |
$ | 2.4 | $ | 2.4 | $ | 1.5 | $ | 1.3 | ||||||||
|
|
|
|
|
|
|
|
|
|||||||||
Interest and penalties recognized as part of income taxes from continuing operations was a net benefit of less than $0.1 million for the year ended June 30, 2016 as a result of the lapse of statute of limitations on uncertain tax positions. The total interest and penalties benefit was $0.3 million for the period ended June 30, 2015. Total interest and penalties expense was $0.2 million and $0.1 million for the period ended February 1, 2015 and for the year ended June 30, 2014, respectively. The cumulative interest and penalties recorded on the Company’s consolidated balance sheets was $0.3 million as of June 30, 2016 and 2015.
The Company files a consolidated federal income tax return and various consolidated state income tax returns. The Company’s federal and material state income tax years remain open to examination for the year ended June 30, 2013. Various state and local income tax returns are under examination by taxing authorities. We do not believe that the outcome of any examination will have a material impact on our financial statements.
Note 18. Major Customers and Suppliers
The Company’s revenue is derived from arrangements with enterprise, commercial, service provider, state and U.S. government customers. No customer accounted for more than 10% of the Company’s revenue during the year ended June 30, 2016, the period ended June 30, 2015, the period ended February 1, 2015 or the year ended June 30, 2014. All accounts receivable are made on an unsecured basis and no customer balance comprised more than 10% of accounts receivable as of June 30, 2016 or 2015.
The Company’s solutions include products and services purchased directly and indirectly from manufacturers. Our purchases from a single manufacturer comprised approximately 67% of our purchases from all manufacturers for the year ended June 30, 2016, and 66%, 63% and 65% of the purchases for the period ended June 30, 2015, the period ended February 1, 2015 and the year ended June 30, 2014, respectively. No other manufacturers accounted for a significant concentration of the Company’s purchases during these periods.
Note 19. Related Party Transactions
Apollo Global Management, LLC (together with its subsidiaries, “Apollo”) is a leading alternative investment management firm which owns and operates businesses across a variety of industries. The Company recorded revenue to parties affiliated with Apollo of $2.0 million for the year ended June 30, 2016 and $0.3 million for the period ended June 30, 2015. As of June 30, 2016 the outstanding receivables associated with parties affiliated with Apollo were $0.2 million and as of June 30, 2015 the outstanding receivables were less than $0.1 million.
F-53
Table of Contents
Presidio, Inc.
Notes to Consolidated Financial Statements (Continued)
As of June 30, 2016 and 2015, an alternative investment vehicle formed by the limited partners of the Apollo Funds owned substantially all of the economic interests in the Subordinated Notes pursuant to certain derivative arrangements entered into with Deutsche Bank AG, who is the holder of 100% of the Senior Subordinated Notes.
At issuance of the February 2016 Credit Facility, members of the Company’s management held $5.5 million of the $150.0 million term loan borrowing. This debt was fully repaid with the credit facility terminated at June 30, 2016. In issuing the credit facility, the Company incurred $0.5 million in deferred financing fees associated with an affiliate of Apollo.
At issuance, Presidio, Inc. held the $25.0 million term loan borrowing issued by Presidio Holdings under the Incremental Assumption Agreement and Amendment No. 2 to the Company’s February 2015 Credit Agreement. As of June 30, 2016, Presidio, Inc. had sold its holdings of the debt to an unaffiliated third party for a loss of $0.1 million as a result of the sale.
Also discussed in Note 11, during the year ended June 30, 2014, the Company repaid $3.0 million on the note payable to a former shareholder that was issued in connection with the repurchase of the former shareholder’s common stock. As of June 30, 2014, the note was paid in full.
The Company leases an office that is owned by members of the Company’s management. The office location was carried over from a prior acquisition and the Company has continued to renew the lease. Rent expense for the office was $0.3 million for the year ended June 30, 2016, $0.1 million for the period ended June 30, 2015, $0.2 million for the period ended February 1, 2015 and $0.3 million for the year ended June 30, 2014.
During the Predecessor periods, the Company incurred management fees to its former owners. Management fees were $1.5 million for the period ended February 1, 2015 and $2.0 million for the year ended June 30, 2014. Additionally, the Company incurred $12.7 million of consulting fees in the period ended February 1, 2015 to its former owners associated with the Presidio Acquisition. This expense is presented as transaction costs within the statement of operations.
Note 20. Retirement Plan
The Company sponsors a defined contribution 401(k) plan covering substantially all employees of the Company who are age 21 or older and are not classified as excluded employees (which classification includes union employees, leased employees and certain nonresident aliens). Participants can elect to contribute a specific percentage or dollar amount and have that amount deposited into the plan as an elective deferral. All employee deferrals and Company contributions are subject to IRS limitations.
The Company provides a fixed matching contribution equal to 25% of the employee’s elective deferrals on up to 6% of compensation. In addition to the fixed matching contribution, the Company may make an additional discretionary contribution equal to a uniform percentage or dollar amount of the employee’s elective deferral. The annual discretionary matching contribution is based on Company performance and may be an additional 25% on up to 6% of compensation. Employment on the last day of the year is required to receive the annual discretionary match and it is typically funded approximately ten months following the end of the calendar year to which it relates.
Employer contributions in the plan generally vest equally over a five-year period based on plan years in which an employee works at least 1,000 hours.
F-54
Table of Contents
Presidio, Inc.
Notes to Consolidated Financial Statements (Continued)
Total employer contribution expense was $6.1 million for the year ended June 30, 2016, $2.9 million for the period ended June 30, 2015, $3.2 million for the period ended February 1, 2015 and $4.9 million for the year ended June 30, 2014.
Note 21. Segment Information
During the periods presented the Company had two reportable segments: PNS focused on providing IT infrastructure solutions and services to customers and Atlantix focused on remarketing used and new IT infrastructure. As discussed in Note 3, on October 22, 2015, the Company sold the Atlantix business to a third party. Subsequent to the sale, the Company operates as a single reportable segment.
The Company’s chief operating decision-maker (“CODM”) primarily allocates resources and evaluates performance of the Company’s operating segments based on total revenue and Adjusted EBITDA (a non-GAAP measure). We define Adjusted EBITDA as net income plus (i) depreciation and amortization, (ii) interest and other expense, net and (iii) income tax expense (benefit), as further adjusted to eliminate share-based compensation expense, noncash items related to purchase accounting adjustments, costs associated with non-recurring transactions and other items.
We believe Adjusted EBITDA provides users of these consolidated financial statements with the financial measure of operating results of the Company’s ongoing operations unaffected by our capital structure, noncash expenses, and non-recurring items utilized by the CODM. However, Adjusted EBITDA is not a measure of financial performance under accounting principles generally accepted in the United States (“U.S. GAAP”), and Adjusted EBITDA may not be comparable to similarly titled measures of other companies.
Segment information for total assets and capital expenditures is not used in measuring segment performance or allocating resources between segments and as such has not been presented.
F-55
Table of Contents
Presidio, Inc.
Notes to Consolidated Financial Statements (Continued)
Information regarding the Company’s segments was as follows (in millions):
| Predecessor | Successor | |||||||||||||||||||
| Year ended June 30, 2014 |
July 1, 2014 to February 1, 2015 |
November 20, 2014 to June 30, 2015 |
Year ended June 30, 2016 |
|||||||||||||||||
| Revenue by segment: |
||||||||||||||||||||
| PNS |
$ | 2,149.9 | $ | 1,323.4 | $ | 939.6 | $ | 2,682.2 | ||||||||||||
| Atlantix |
116.1 | 69.4 | 45.9 | 32.7 | ||||||||||||||||
|
|
|
|
|
|
|
|
|
|||||||||||||
| Total revenue |
$ | 2,266.0 | $ | 1,392.8 | $ | 985.5 | $ | 2,714.9 | ||||||||||||
|
|
|
|
|
|
|
|
|
|||||||||||||
| Adjusted EBITDA by segment: |
||||||||||||||||||||
| PNS |
$ | 170.0 | $ | 118.8 | $ | 73.4 | $ | 216.3 | ||||||||||||
| Atlantix |
8.4 | 2.7 | 3.2 | 1.8 | ||||||||||||||||
| Corporate |
(3.0 | ) | (2.6 | ) | (4.8 | ) | (5.2 | ) | ||||||||||||
|
|
|
|
|
|
|
|
|
|||||||||||||
| Subtotal |
175.4 | 118.9 | 71.8 | 212.9 | ||||||||||||||||
| Earnings from disposed business |
(8.4 | ) | (2.7 | ) | (3.2 | ) | (1.8 | ) | ||||||||||||
|
|
|
|
|
|
|
|
|
|||||||||||||
| Total Adjusted EBITDA |
$ | 167.0 | $ | 116.2 | $ | 68.6 | $ | 211.1 | ||||||||||||
|
|
|
|
|
|
|
|
|
|||||||||||||
| Reconciling items: |
||||||||||||||||||||
| Total depreciation and amortization |
$ | (50.6 | ) | $ | (24.9 | ) | $ | (32.1 | ) | $ | (81.7 | ) | ||||||||
| Interest and other (income) expense |
(34.6 | ) | (28.7 | ) | (47.5 | ) | (98.5 | ) | ||||||||||||
| Income tax benefit (expense) |
(24.4 | ) | (3.2 | ) | 12.6 | (3.8 | ) | |||||||||||||
| Share-based compensation expense |
(5.5 | ) | (20.1 | ) | (1.0 | ) | (2.2 | ) | ||||||||||||
| Earnings from disposed business |
8.4 | 2.7 | 3.2 | 1.8 | ||||||||||||||||
| Purchase accounting adjustments |
— | — | (4.9 | ) | (3.9 | ) | ||||||||||||||
| Transaction costs |
(14.8 | ) | (42.6 | ) | (21.3 | ) | (20.6 | ) | ||||||||||||
| Other costs |
(13.0 | ) | (4.5 | ) | (1.9 | ) | (5.6 | ) | ||||||||||||
|
|
|
|
|
|
|
|
|
|||||||||||||
| Net income (loss) |
$ | 32.5 | $ | (5.1 | ) | $ | (24.3 | ) | $ | (3.4 | ) | |||||||||
|
|
|
|
|
|
|
|
|
|||||||||||||
In addition to the PNS and Atlantix segments, the CODM separately reviews centralized corporate functions such as accounting, information technology, marketing, legal and human resources that are not allocated to the operating segments and are instead presented as “Corporate” in the table above.
All significant intercompany transactions have been eliminated from the results above with only total revenue from external sales being presented.
Geographic Areas
Revenue earned by the Company from customers outside of the United States is not material for any of the periods presented. Additionally, the Company does not have long-lived assets outside of the United States.
F-56
Table of Contents
Presidio, Inc.
Notes to Consolidated Financial Statements (Continued)
Revenue by Solution Area
The following table presents total revenue by solution area (in millions):
| Predecessor | Successor | |||||||||||||||||||
| Year ended June 30, 2014 |
July 1, 2014 to February 1, 2015 |
November 20, 2014 to June 30, 2015 |
Year ended June 30, 2016 |
|||||||||||||||||
| Revenue by solution area: |
||||||||||||||||||||
| Cloud |
$ | 220.2 | $ | 184.1 | $ | 108.9 | $ | 391.7 | ||||||||||||
| Security |
142.0 | 90.5 | 65.8 | 249.4 | ||||||||||||||||
| Digital Infrastructure |
1,903.8 | 1,118.2 | 810.8 | 2,073.8 | ||||||||||||||||
|
|
|
|
|
|
|
|
|
|||||||||||||
| Total revenue |
$ | 2,266.0 | $ | 1,392.8 | $ | 985.5 | $ | 2,714.9 | ||||||||||||
|
|
|
|
|
|
|
|
|
|||||||||||||
The type of solution sold by the Company to its customers is based upon internal classifications.
F-57
Table of Contents
Presidio, Inc.
Schedule I – Parent Company Financial Information
Unconsolidated Condensed Balance Sheets
(in millions, except for share and per share data)
| As of June 30, 2015 |
As of June 30, 2016 |
|||||||
| Assets |
||||||||
| Current Assets |
||||||||
| Cash and cash equivalents |
$ | 26.0 | $ | 26.1 | ||||
| Prepaid expenses and other current assets |
1.2 | 0.9 | ||||||
|
|
|
|
|
|||||
| Total current assets |
27.2 | 27.0 | ||||||
| Deferred income tax assets |
2.8 | 3.0 | ||||||
| Investment in subsidiaries |
305.8 | 317.1 | ||||||
|
|
|
|
|
|||||
| Total assets |
$ | 335.8 | $ | 347.1 | ||||
|
|
|
|
|
|||||
| Liabilities and Stockholders’ Equity |
||||||||
| Current Liabilities |
||||||||
| Accrued expenses and other current liabilities |
$ | — | $ | 0.2 | ||||
|
|
|
|
|
|||||
| Total current liabilities |
— | 0.2 | ||||||
|
|
|
|
|
|||||
| Total liabilities |
— | 0.2 | ||||||
| Stockholders’ Equity |
||||||||
| Preferred stock; |
||||||||
| $0.01 par value; 100 shares authorized, zero shares issued and outstanding at June 30, 2016 and June 30, 2015 |
— | — | ||||||
| Common stock; |
||||||||
| $0.01 par value; 100,000,000 shares authorized, 35,961,418 shares issued and outstanding at June 30, 2016; $0.01 par value; 100,000,000 shares authorized, 35,245,974 shares issued and outstanding at June 30, 2015 |
0.4 | 0.4 | ||||||
| Additional paid-in capital |
359.7 | 374.2 | ||||||
| Accumulated deficit |
(24.3 | ) | (27.7 | ) | ||||
|
|
|
|
|
|||||
| Total stockholders’ equity |
335.8 | 346.9 | ||||||
|
|
|
|
|
|||||
| Total liabilities and stockholders’ equity |
$ | 335.8 | $ | 347.1 | ||||
|
|
|
|
|
|||||
The accompanying notes to Schedule I are an integral part of these financial statements.
F-58
Table of Contents
Presidio, Inc.
Schedule I – Parent Company Financial Information
Unconsolidated Condensed Statements of Operations
(in millions)
| November 20, 2014 to June 30, 2015 |
Year ended June 30, 2016 |
|||||||
| Operating expenses |
||||||||
| General and administrative expenses |
$ | — | $ | 0.3 | ||||
| Transaction costs |
13.7 | — | ||||||
|
|
|
|
|
|||||
| Total operating expenses |
13.7 | 0.3 | ||||||
|
|
|
|
|
|||||
| Operating loss |
(13.7 | ) | (0.3 | ) | ||||
| Interest and other (income) expense |
||||||||
| Unrealized loss on equity investment in subsidiaries |
14.6 | 3.2 | ||||||
| Other (income) expense, net |
— | (0.3 | ) | |||||
|
|
|
|
|
|||||
| Total other expense |
14.6 | 2.9 | ||||||
|
|
|
|
|
|||||
| Loss before income taxes |
(28.3 | ) | (3.2 | ) | ||||
| Income tax (benefit) expense |
(4.0 | ) | 0.2 | |||||
|
|
|
|
|
|||||
| Net loss |
$ | (24.3 | ) | $ | (3.4 | ) | ||
|
|
|
|
|
|||||
The accompanying notes to Schedule I are an integral part of these financial statements.
F-59
Table of Contents
Presidio, Inc.
Schedule I – Parent Company Financial Information
Unconsolidated Condensed Statements of Cash Flows
(in millions)
| November 20, 2014 to June 30, 2015 |
Year ended June 30, 2016 |
|||||||
| Net cash provided by operating activities |
$ | — | $ | 0.3 | ||||
| Cash flows from investing activities: |
||||||||
| Cash paid for investment in subsidiary |
(311.8 | ) | — | |||||
| Purchases of debt investment in subsidiary |
— | (25.0 | ) | |||||
| Proceeds from sale of debt investment in subsidiary |
— | 24.9 | ||||||
|
|
|
|
|
|||||
| Net cash used in investing activities |
(311.8 | ) | (0.1 | ) | ||||
|
|
|
|
|
|||||
| Cash flows from financing activities: |
||||||||
| Proceeds from issuance of common stock |
337.8 | — | ||||||
| Repurchases of common stock |
— | (0.1 | ) | |||||
|
|
|
|
|
|||||
| Net cash (used in) provided by financing activities |
337.8 | (0.1 | ) | |||||
|
|
|
|
|
|||||
| Net increase in cash and cash equivalents |
26.0 | 0.1 | ||||||
| Cash and cash equivalents, beginning of the period |
— | 26.0 | ||||||
|
|
|
|
|
|||||
| Cash and cash equivalents, end of the period |
$ | 26.0 | $ | 26.1 | ||||
|
|
|
|
|
|||||
The accompanying notes to Schedule I are an integral part of these financial statements.
F-60
Table of Contents
Presidio, Inc.
Schedule I – Parent Company Financial Information
Notes to the Unconsolidated Condensed Financial Statements
Note 1. Nature of Business and Significant Accounting Policies
Description of the Company
Presidio, Inc., formerly named Aegis Holdings, Inc. (“Aegis”), is a Delaware corporation that was incorporated on November 20, 2014 by certain investment funds affiliated with or managed by Apollo Global Management, LLC, including Apollo Investment Fund VIII, L.P., along with their parallel investment funds (the “Apollo Funds”) to complete the acquisition of Presidio Holdings Inc. (“Presidio Holdings”). Presidio, Inc. is a holding company with direct ownership of a single wholly owned subsidiary, Presidio Holdings. Presidio Holdings, through its operating subsidiaries, conducts operations and generates income and cash flows, while Presidio, Inc. conducts no separate operations on a standalone basis.
Basis of Presentation
Pursuant to the terms of the credit agreements discussed in Note 11 of the consolidated financial statements, Presidio Holdings and its subsidiaries have restrictions on their ability to, among other things, incur additional indebtedness, make distributions to Presidio, Inc., or make certain intercompany loans and advances. As a result of these restrictions, these parent company financial statements have been prepared in accordance with Rule 12-04 of Regulation S-X, since the restricted net assets of Presidio, Inc.’s subsidiaries (as defined in Rule 4-08(e)(3) of Regulation S-X) exceeds 25% of the Company’s consolidated net assets as of June 30, 2015. All financial information presented in the financial statements and notes herein is presented in millions except for share and per share information and percentages.
Principles of Consolidation
On a standalone basis, Presidio, Inc. records its investment in Presidio Holdings under the equity method of accounting. Under the equity method, the investment in subsidiaries is stated at cost plus any contributions and its equity share in undistributed net income (loss) of the subsidiaries minus any dividends received. Presidio, Inc.’s share of net income (loss) of its unconsolidated subsidiaries is included in net income (loss) on equity investment in subsidiaries in the statements of operations. Intercompany balances and transactions have not been eliminated. The accompanying financial information should be read in conjunction with the consolidated financial statements and related notes included in this filing.
Significant Accounting Policies
The accounting policies used in the preparation of the parent financial statements are generally consistent with those used in the preparation of the consolidated financial statements of the Company.
In conjunction with the acquisition of Presidio Holdings, Presidio, Inc. has applied the acquisition method of accounting in accordance with Financial Accounting Standards Board (“FASB”) Accounting Standards Codification (“ASC”) Topic 805, Business Combinations, and has also elected the application of push-down accounting. As a result, the fair value adjustments and goodwill recognized from the transactions are recorded in the financial statements of its subsidiaries and presented as part of Presidio, Inc.’s investment in subsidiaries on the balance sheet.
As discussed in Note 17 of the annual consolidated financial statements, Presidio, Inc. and its subsidiaries file a consolidated federal income tax return and various consolidated state income tax returns. Taxes are allocated to the members of the consolidated return, based on an estimate of the amounts that would be reported if the
F-61
Table of Contents
Presidio, Inc.
Schedule I – Parent Company Financial Information
Notes to the Unconsolidated Condensed Financial Statements (Continued)
members were separately filing their tax returns. As a result, for the year ended June 30, 2016 and the period ended June 30, 2015, Presidio, Inc.’s income tax benefit and deferred tax assets excludes any taxes associated with Presidio, Inc.’s investment in its subsidiaries.
Presidio, Inc. does not currently anticipate paying dividends on common stock. Any declaration and payment of future dividends to holders of common stock will be at the discretion of the Board of Directors and will depend on many factors, including Presidio Inc.’s financial condition, earnings, capital requirements, level of indebtedness, statutory and contractual restrictions applying to the payment of dividends and other considerations that the Board of Directors deems relevant. Presidio, Inc., as a holding company, has no direct operations and its ability to pay dividends is limited to its available cash on hand and any funds received from subsidiaries. The terms of the indebtedness may restrict Presidio, Inc.’s ability to pay dividends, or may restrict the subsidiaries from paying dividends to Presidio, Inc. Under Delaware law, dividends may be payable only out of surplus, which is net assets minus liabilities and capital, or, if there is no surplus, out of net profits for the fiscal year in which the dividend is declared and/or the preceding fiscal year.
F-62
Table of Contents
Presidio, Inc.
Schedule II — Valuation and Qualifying Accounts
(in millions)
| Additions | ||||||||||||||||||||
| Predecessor |
Balance at beginning of period |
Charged to costs and expenses |
Charged to other accounts |
Credits and deductions |
Balance at end of period |
|||||||||||||||
| Year ended June 30, 2014 |
||||||||||||||||||||
| Provision for sales returns and credit losses |
$ | 5.0 | $ | 3.1 | $ | — | $ | (1.0 | ) | $ | 7.1 | |||||||||
| Provision for inventory obsolescence |
1.0 | — | — | — | 1.0 | |||||||||||||||
| Provision for residual value and credit losses on financing receivables |
2.1 | — | — | (0.3 | ) | 1.8 | ||||||||||||||
| Period from July 1, 2014 to February 1, 2015 |
||||||||||||||||||||
| Provision for sales returns and credit losses |
$ | 7.1 | $ | 1.1 | $ | — | $ | (1.7 | ) | $ | 6.5 | |||||||||
| Provision for inventory obsolescence |
1.0 | — | — | — | 1.0 | |||||||||||||||
| Provision for residual value and credit losses on financing receivables |
1.8 | 0.3 | — | (0.1 | ) | 2.0 | ||||||||||||||
| Successor |
||||||||||||||||||||
| Period from November 20, 2014 to June 30, 2015 |
||||||||||||||||||||
| Provision for sales returns and credit losses |
$ | — | $ | 0.2 | $ | 3.6 | $ | — | $ | 3.8 | ||||||||||
| Provision for inventory obsolescence |
— | — | — | — | — | |||||||||||||||
| Provision for residual value and credit losses on financing receivables |
— | — | 2.0 | — | 2.0 | |||||||||||||||
| Year ended June 30, 2016 |
||||||||||||||||||||
| Provision for sales returns and credit losses |
$ | 3.8 | $ | 1.9 | $ | — | $ | (1.9 | ) | $ | 3.8 | |||||||||
| Provision for inventory obsolescence |
— | 0.1 | — | — | 0.1 | |||||||||||||||
| Provision for residual value and credit losses on financing receivables |
2.0 | — | — | (0.3 | ) | 1.7 | ||||||||||||||
F-63
Table of Contents
Presidio, Inc.
(in millions, except share data)
(unaudited)
| As of June 30, 2016 |
As of December 31, 2016 |
|||||||
| Assets |
||||||||
| Current Assets |
||||||||
| Cash and cash equivalents |
$ | 33.0 | $ | 45.5 | ||||
| Accounts receivable, net |
503.0 | 562.7 | ||||||
| Unbilled accounts receivable, net |
135.7 | 126.3 | ||||||
| Financing receivables, current portion |
83.1 | 89.1 | ||||||
| Inventory |
48.3 | 40.0 | ||||||
| Prepaid expenses and other current assets |
68.2 | 72.4 | ||||||
|
|
|
|
|
|||||
| Total current assets |
871.3 | 936.0 | ||||||
| Property and equipment, net |
32.9 | 33.5 | ||||||
| Equipment under operating leases, net |
2.9 | 2.2 | ||||||
| Financing receivables, less current portion |
102.0 | 114.0 | ||||||
| Goodwill |
781.5 | 781.5 | ||||||
| Identifiable intangible assets, net |
825.5 | 788.7 | ||||||
| Other assets |
7.0 | 19.9 | ||||||
|
|
|
|
|
|||||
| Total assets |
$ | 2,623.1 | $ | 2,675.8 | ||||
|
|
|
|
|
|||||
| Liabilities and Stockholders’ Equity |
||||||||
| Current Liabilities |
||||||||
| Current maturities of long-term debt |
$ | 7.4 | $ | 7.4 | ||||
| Accounts payable – trade |
382.3 | 457.7 | ||||||
| Accounts payable – floor plan |
223.3 | 186.9 | ||||||
| Accrued expenses and other current liabilities |
167.1 | 176.0 | ||||||
| Discounted financing receivables, current portion |
75.3 | 82.8 | ||||||
|
|
|
|
|
|||||
| Total current liabilities |
855.4 | 910.8 | ||||||
| Long-term debt, net of debt issuance costs and current maturities |
1,030.6 | 1,000.7 | ||||||
| Discounted financing receivables, less current portion |
87.1 | 103.7 | ||||||
| Deferred income tax liabilities |
288.0 | 278.6 | ||||||
| Other liabilities |
15.1 | 25.0 | ||||||
|
|
|
|
|
|||||
| Total liabilities |
2,276.2 | 2,318.8 | ||||||
| Commitments and contingencies (Note 11) |
||||||||
| Stockholders’ Equity |
||||||||
| Preferred stock: |
||||||||
| $0.01 par value, 100 shares authorized; zero shares issued and outstanding at December 31, 2016 and June 30, 2016 |
— | — | ||||||
| Common stock: |
||||||||
| $0.01 par value, 100,000,000 shares authorized; 35,969,689 and 35,961,418 shares issued and outstanding at December 31, 2016 and June 30, 2016, respectively |
0.4 | 0.4 | ||||||
| Additional paid-in capital |
374.2 | 375.3 | ||||||
| Accumulated deficit |
(27.7 | ) | (18.7 | ) | ||||
|
|
|
|
|
|||||
| Total stockholders’ equity |
346.9 | 357.0 | ||||||
|
|
|
|
|
|||||
| Total liabilities and stockholders’ equity |
$ | 2,623.1 | $ | 2,675.8 | ||||
|
|
|
|
|
|||||
See Notes to the Consolidated Financial Statements.
F-64
Table of Contents
Presidio, Inc.
Consolidated Statements of Operations
(in millions, except share data)
(unaudited)
| Six months ended December 31, 2015 |
Six months ended December 31, 2016 |
|||||||
| Revenue |
||||||||
| Product |
$ | 1,190.4 | $ | 1,238.6 | ||||
| Service |
184.2 | 220.9 | ||||||
|
|
|
|
|
|||||
| Total revenue |
1,374.6 | 1,459.5 | ||||||
| Cost of revenue |
||||||||
| Product |
958.4 | 991.0 | ||||||
| Service |
146.4 | 177.0 | ||||||
|
|
|
|
|
|||||
| Total cost of revenue |
1,104.8 | 1,168.0 | ||||||
|
|
|
|
|
|||||
| Gross margin |
269.8 | 291.5 | ||||||
| Operating expenses |
||||||||
| Selling expenses |
114.5 | 134.1 | ||||||
| General and administrative expenses |
44.9 | 52.8 | ||||||
| Transaction costs |
8.9 | 6.0 | ||||||
| Depreciation and amortization |
35.3 | 40.8 | ||||||
|
|
|
|
|
|||||
| Total operating expenses |
203.6 | 233.7 | ||||||
|
|
|
|
|
|||||
| Operating income |
66.2 | 57.8 | ||||||
| Interest and other (income) expense |
||||||||
| Interest expense |
39.4 | 41.6 | ||||||
| Loss on disposal of business |
6.8 | — | ||||||
| Loss on extinguishment of debt |
0.1 | 0.8 | ||||||
| Other (income) expense, net |
0.2 | 0.1 | ||||||
|
|
|
|
|
|||||
| Total interest and other (income) expense |
46.5 | 42.5 | ||||||
|
|
|
|
|
|||||
| Income before income taxes |
19.7 | 15.3 | ||||||
| Income tax expense |
9.2 | 6.3 | ||||||
|
|
|
|
|
|||||
| Net income |
$ | 10.5 | $ | 9.0 | ||||
|
|
|
|
|
|||||
| Earnings per share: |
||||||||
| Basic |
$ | 0.30 | $ | 0.25 | ||||
| Diluted |
$ | 0.29 | $ | 0.24 | ||||
See Notes to the Consolidated Financial Statements.
F-65
Table of Contents
Presidio, Inc.
Consolidated Statements of Cash Flows
(in millions)
(unaudited)
| Six months ended December 31, 2015 |
Six months ended December 31, 2016 |
|||||||
| Cash flows from operating activities: |
||||||||
| Net income |
$ | 10.5 | $ | 9.0 | ||||
| Adjustments to reconcile net income to net cash provided by operating activities: |
||||||||
| Amortization of intangible assets |
31.4 | 36.8 | ||||||
| Depreciation of property and equipment in operating expenses |
3.9 | 4.0 | ||||||
| Depreciation of property and equipment in cost of revenue |
2.7 | 2.8 | ||||||
| Provision for sales returns and credit losses |
0.4 | 1.4 | ||||||
| Amortization of debt issuance costs |
3.5 | 3.4 | ||||||
| Loss on extinguishment of debt |
0.1 | 0.8 | ||||||
| Loss on disposal of business |
6.8 | — | ||||||
| Noncash lease income |
(1.4 | ) | (1.7 | ) | ||||
| Share-based compensation expense |
1.2 | 1.0 | ||||||
| Deferred income tax benefit |
(11.4 | ) | (9.3 | ) | ||||
| Other |
(0.2 | ) | 0.2 | |||||
| Change in assets and liabilities, net of acquisitions and dispositions: |
||||||||
| Unbilled and accounts receivable |
(103.6 | ) | (49.1 | ) | ||||
| Inventory |
(7.1 | ) | 8.3 | |||||
| Prepaid expenses and other assets |
16.1 | (18.1 | ) | |||||
| Accounts payable – trade |
40.0 | 75.3 | ||||||
| Accrued expenses and other liabilities |
14.3 | 18.5 | ||||||
|
|
|
|
|
|||||
| Net cash provided by operating activities |
7.2 | 83.3 | ||||||
|
|
|
|
|
|||||
| Cash flows from investing activities: |
||||||||
| Acquisition of businesses, net of cash and cash equivalents acquired |
(11.2 | ) | — | |||||
| Proceeds from collection of escrow related to acquisition of business |
— | 0.6 | ||||||
| Proceeds from disposition of business |
37.6 | — | ||||||
| Additions of equipment under sales-type and direct financing leases |
(39.7 | ) | (63.9 | ) | ||||
| Proceeds from collection of financing receivables |
3.7 | 7.7 | ||||||
| Additions to equipment under operating leases |
(2.3 | ) | (0.8 | ) | ||||
| Proceeds from disposition of equipment under operating leases |
0.8 | 0.5 | ||||||
| Purchases of property and equipment |
(5.5 | ) | (6.7 | ) | ||||
|
|
|
|
|
|||||
| Net cash used in investing activities |
(16.6 | ) | (62.6 | ) | ||||
|
|
|
|
|
|||||
| Cash flows from financing activities: |
||||||||
| Proceeds from the issuance of common stock |
— | 0.1 | ||||||
| Proceeds from the discounting of financing receivables |
36.7 | 66.1 | ||||||
| Retirements of discounted financing receivables |
(1.0 | ) | (4.3 | ) | ||||
| Net repayments on the receivables securitization facility |
— | (5.0 | ) | |||||
| Repayments of senior and subordinated notes |
(37.4 | ) | — | |||||
| Repayments of term loans |
(2.9 | ) | (28.7 | ) | ||||
| Net borrowings on floor plan facility |
24.9 | (36.4 | ) | |||||
|
|
|
|
|
|||||
| Net cash provided by (used in) financing activities |
20.3 | (8.2 | ) | |||||
|
|
|
|
|
|||||
| Net increase in cash and cash equivalents |
10.9 | 12.5 | ||||||
| Cash and cash equivalents: |
||||||||
| Beginning of the period |
88.3 | 33.0 | ||||||
|
|
|
|
|
|||||
| End of the period |
$ | 99.2 | $ | 45.5 | ||||
|
|
|
|
|
|||||
| Supplemental disclosures of cash flow information |
||||||||
| Cash paid during the period for: |
||||||||
| Interest |
$ | 34.6 | $ | 37.4 | ||||
| Income taxes, net of refunds |
$ | 15.0 | $ | 1.7 | ||||
| Reduction of discounted lease assets and liabilities |
$ | 40.7 | $ | 43.6 | ||||
See Notes to the Consolidated Financial Statements.
F-66
Table of Contents
Presidio, Inc.
Consolidated Statements of Stockholders’ Equity
(in millions, except share data)
(unaudited)
| Preferred stock | Common stock | Additional paid-in capital |
Accumulated deficit |
Total | ||||||||||||||||||||||||
| Shares | Amount | Shares | Amount | |||||||||||||||||||||||||
| Balance, June 30, 2015 |
— | $ | — | 35,245,974 | $ | 0.4 | $ | 359.7 | $ | (24.3 | ) | $ | 335.8 | |||||||||||||||
| Common stock issued for share-based awards |
— | — | 11,928 | — | — | — | — | |||||||||||||||||||||
| Equity consideration in acquisitions |
— | — | 79,945 | — | 1.4 | — | 1.4 | |||||||||||||||||||||
| Net income |
— | — | — | — | — | 10.5 | 10.5 | |||||||||||||||||||||
| Share-based compensation expense |
— | — | — | — | 1.2 | — | 1.2 | |||||||||||||||||||||
|
|
|
|
|
|
|
|
|
|
|
|
|
|
|
|||||||||||||||
| Balance, December 31, 2015 |
— | $ | — | 35,337,847 | $ | 0.4 | $ | 362.3 | $ | (13.8 | ) | $ | 348.9 | |||||||||||||||
|
|
|
|
|
|
|
|
|
|
|
|
|
|
|
|||||||||||||||
| Balance, June 30, 2016 |
— | $ | — | 35,961,418 | $ | 0.4 | $ | 374.2 | $ | (27.7 | ) | $ | 346.9 | |||||||||||||||
| Common stock issued for share-based awards |
— | — | 8,271 | — | 0.1 | — | 0.1 | |||||||||||||||||||||
| Net income |
— | — | — | — | — | 9.0 | 9.0 | |||||||||||||||||||||
| Share-based compensation expense |
— | — | — | — | 1.0 | — | 1.0 | |||||||||||||||||||||
|
|
|
|
|
|
|
|
|
|
|
|
|
|
|
|||||||||||||||
| Balance, December 31, 2016 |
— | $ | — | 35,969,689 | $ | 0.4 | $ | 375.3 | $ | (18.7 | ) | $ | 357.0 | |||||||||||||||
|
|
|
|
|
|
|
|
|
|
|
|
|
|
|
|||||||||||||||
See Notes to the Consolidated Financial Statements.
F-67
Table of Contents
Notes to Consolidated Financial Statements
(unaudited)
Note 1. Nature of Business and Significant Accounting Policies
Description of the Company
Presidio, Inc. (the “Company,” “we” or “our”), formerly known as Aegis Holdings, Inc., a Delaware corporation, is a holding company for its wholly owned subsidiary, Presidio Holdings Inc., and its operating subsidiaries, which are described below.
Nature of Business
The Company, through its subsidiaries, is a leading provider of comprehensive information technology (“IT”) solutions in North America. The Company offers consulting, IT design and optimization and IT-as-a-service solutions to our customers. The Company’s revenue from solutions consists of the resale of hardware and related software and third-party maintenance agreements, which is reported as product revenue, and the sale of professional, cloud and managed services, which is reported as service revenue. The Company implements IT solutions for its customers on a national and international basis, although the Company’s principal markets are located in the continental United States. The Company operates primarily through two indirect wholly owned subsidiaries of Presidio LLC:
| • | Presidio Networked Solutions LLC (“PNS”), a leading provider of lifecycle-based IT solutions and services. The PNS business includes the operations of Presidio Networked Solutions Group LLC (“PNSG”) and Presidio Infrastructure Solutions LLC (“PIS”). On January 3, 2017, PIS was merged with and into PNSG with PNSG being the surviving entity. |
| • | Presidio Technology Capital, LLC (“PTC”), an IT infrastructure leasing company. |
The Company also has an indirect wholly owned non-operating subsidiary, Presidio Capital Funding LLC (“PCF”), which is utilized for the receivables securitization facility.
Basis of Presentation
The accompanying consolidated financial statements have been prepared in conformity with accounting principles generally accepted in the United States of America (“U.S. GAAP”) for interim reporting periods. The consolidated financial statements do not include all disclosures normally made in annual financial statements. These consolidated financial statements should be read in conjunction with the audited consolidated financial statements for the fiscal year ended June 30, 2016. All financial information presented in the financial statements and notes herein is presented in millions except for share and per share information and percentages.
In management’s opinion, all adjustments necessary for a fair presentation of the results of operations, financial position and cash flows for the periods shown have been made. All other adjustments are of a normal recurring nature.
The Company has evaluated subsequent events through the issue date of these consolidated financial statements.
Principles of Consolidation
The Company’s consolidated financial statements include the accounts of Presidio, Inc. and its subsidiaries. All significant intercompany accounts and transactions have been eliminated in consolidation.
F-68
Table of Contents
Presidio, Inc.
Notes to Consolidated Financial Statements
(unaudited)
Use of Estimates
The preparation of the Company’s consolidated financial statements requires management to make estimates and assumptions that affect the reported amounts of assets and liabilities, disclosure of contingent assets and liabilities at the date of the consolidated financial statements, and reported amounts of revenue and expenses during the reporting period. Estimates are used when accounting for items and matters, including, but not limited to, revenue recognition, asset residual values, partner incentive rebate programs, goodwill, identifiable intangible assets, measurement of income tax assets and liabilities, and provisions for doubtful accounts, credit losses, inventory obsolescence and other contingencies. Actual results could differ from management’s estimates.
Other Comprehensive Income (Loss)
The Company did not have any components of other comprehensive income (loss) for any of the periods presented.
Recent Accounting Pronouncements Adopted During the Period
In March 2016, the Financial Accounting Standards Board (the “FASB”) issued Accounting Standard Update (“ASU”) 2016-09, Compensation – Stock Compensation (Topic 718): Improvements to Employee Share-Based Payment Accounting, which provides areas for simplification in the accounting for share-based payment transactions. Areas included for simplification include, but are not limited to, accounting for income taxes, classification of excess tax benefits on the statement of cash flows, forfeitures, and minimum statutory withholding. The standard has an effective date for public companies for annual periods beginning after December 15, 2016 and interim periods within these annual periods, with early adoption permitted. The Company elected to early adopt this standard in the second quarter ended December 31, 2016. Early adoption of this standard requires that adjustments be reflected back to the beginning of the fiscal year. Adopting this standard had an immaterial impact on the Company’s consolidated financial statements.
Recent Accounting Pronouncements Not Yet Adopted
The Company is still evaluating the impact of the additional accounting pronouncements not yet adopted as of June 30, 2016.
Note 2. Acquisitions
Netech Corporation
During the six months ended December 31, 2016, the Company collected the $0.6 million that was due back to the Company from escrow accounts as a result of final post-closing purchase price adjustments related to the net working capital as of the closing date of February 1, 2016.
F-69
Table of Contents
Presidio, Inc.
Notes to Consolidated Financial Statements
(unaudited)
Note 3. Prepaid Expenses and Other Current Assets
Prepaid expenses and other current assets consist of the following (in millions):
| June 30, 2016 |
December 31, 2016 |
|||||||
| Partner incentive program receivable |
$ | 27.3 | $ | 25.7 | ||||
| Prepaid income taxes |
10.4 | 0.7 | ||||||
| Deferred product costs |
5.3 | 28.7 | ||||||
| Other prepaid expenses and other current assets |
25.2 | 17.3 | ||||||
|
|
|
|
|
|||||
| Total prepaid expenses and other current assets |
$ | 68.2 | $ | 72.4 | ||||
|
|
|
|
|
|||||
Note 4. Financing Receivables and Operating Leases
The Company records the lease receivables related to discounted sales-type or direct financing leases as financing receivables, and the related liability resulting from discounting customer payment streams as discounted financing receivables, in the Company’s consolidated balance sheets. Discounted customer payment streams are typically collateralized by a security interest in the underlying assets being leased.
Financing receivable – The assets and related liabilities for discounted and not discounted sales-type and direct financing leases to financial institutions were as follows (in millions):
| June 30, 2016 |
Discounted to financial institutions |
Not discounted to financial institutions |
Total | |||||||||
| Minimum lease payments |
$ | 168.5 | $ | 18.4 | $ | 186.9 | ||||||
| Estimated net residual values |
— | 7.9 | 7.9 | |||||||||
| Unearned income |
(7.4 | ) | (1.6 | ) | (9.0 | ) | ||||||
| Provision for credit losses |
— | (0.7 | ) | (0.7 | ) | |||||||
|
|
|
|
|
|
|
|||||||
| Total, net |
$ | 161.1 | $ | 24.0 | $ | 185.1 | ||||||
|
|
|
|
|
|
|
|||||||
| Reported as: |
||||||||||||
| Current |
$ | 74.4 | $ | 8.7 | $ | 83.1 | ||||||
| Long-term |
86.7 | 15.3 | 102.0 | |||||||||
|
|
|
|
|
|
|
|||||||
| Total, net |
$ | 161.1 | $ | 24.0 | $ | 185.1 | ||||||
|
|
|
|
|
|
|
|||||||
| Discounted financing receivables: |
||||||||||||
| Nonrecourse |
$ | 159.2 | $ | — | $ | 159.2 | ||||||
| Recourse |
1.0 | — | 1.0 | |||||||||
|
|
|
|
|
|
|
|||||||
| Total |
$ | 160.2 | $ | — | $ | 160.2 | ||||||
|
|
|
|
|
|
|
|||||||
| Reported as: |
||||||||||||
| Current |
$ | 73.9 | $ | — | $ | 73.9 | ||||||
| Long-term |
86.3 | — | 86.3 | |||||||||
|
|
|
|
|
|
|
|||||||
| Total |
$ | 160.2 | $ | — | $ | 160.2 | ||||||
|
|
|
|
|
|
|
|||||||
F-70
Table of Contents
Presidio, Inc.
Notes to Consolidated Financial Statements
(unaudited)
| December 31, 2016 |
Discounted to financial institutions |
Not discounted to financial institutions |
Total | |||||||||
| Minimum lease payments |
$ | 200.6 | $ | 5.7 | $ | 206.3 | ||||||
| Estimated net residual values |
— | 7.8 | 7.8 | |||||||||
| Unearned income |
(9.4 | ) | (0.9 | ) | (10.3 | ) | ||||||
| Provision for credit losses |
— | (0.7 | ) | (0.7 | ) | |||||||
|
|
|
|
|
|
|
|||||||
| Total, net |
$ | 191.2 | $ | 11.9 | $ | 203.1 | ||||||
|
|
|
|
|
|
|
|||||||
| Reported as: |
||||||||||||
| Current |
$ | 83.7 | $ | 5.4 | $ | 89.1 | ||||||
| Long-term |
107.5 | 6.5 | 114.0 | |||||||||
|
|
|
|
|
|
|
|||||||
| Total, net |
$ | 191.2 | $ | 11.9 | $ | 203.1 | ||||||
|
|
|
|
|
|
|
|||||||
| Discounted financing receivables: |
||||||||||||
| Nonrecourse |
$ | 185.1 | $ | — | $ | 185.1 | ||||||
| Recourse |
— | — | — | |||||||||
|
|
|
|
|
|
|
|||||||
| Total |
$ | 185.1 | $ | — | $ | 185.1 | ||||||
|
|
|
|
|
|
|
|||||||
| Reported as: |
||||||||||||
| Current |
$ | 81.8 | $ | — | $ | 81.8 | ||||||
| Long-term |
103.3 | — | 103.3 | |||||||||
|
|
|
|
|
|
|
|||||||
| Total |
$ | 185.1 | $ | — | $ | 185.1 | ||||||
|
|
|
|
|
|
|
|||||||
The discounted financing receivables associated with sales-type and direct financing type leases are presented in the consolidated balance sheets together with the discounted financing receivables associated with operating leases, which is discussed below.
Operating leases – Equipment under operating leases and accumulated depreciation were as follows (in millions):
| June 30, 2016 |
December 31, 2016 |
|||||||
| Equipment under operating leases |
$ | 5.6 | $ | 5.9 | ||||
| Accumulated depreciation |
(2.7 | ) | (3.7 | ) | ||||
|
|
|
|
|
|||||
| Total equipment under operating leases, net |
$ | 2.9 | $ | 2.2 | ||||
|
|
|
|
|
|||||
Depreciation expense associated with equipment under operating leases that is included in cost of product revenue within the Company’s consolidated statements of operations was $1.0 million and $1.3 million for the six months ended December 31, 2016 and 2015, respectively.
Liabilities for discounted operating leases to financial institutions were as follows (in millions):
| June 30, 2016 |
December 31, 2016 |
|||||||
| Discounted operating leases: |
||||||||
| Current |
$ | 1.4 | $ | 1.0 | ||||
| Noncurrent |
0.8 | 0.4 | ||||||
|
|
|
|
|
|||||
| Total |
$ | 2.2 | $ | 1.4 | ||||
|
|
|
|
|
|||||
F-71
Table of Contents
Presidio, Inc.
Notes to Consolidated Financial Statements
(unaudited)
The discounted financing receivables associated with operating leases are presented in the consolidated balance sheets together with the discounted financing receivables associated with sales-type and direct financing type leases which are discussed above.
Note 5. Property and Equipment
Property and equipment and accumulated depreciation and amortization were as follows (in millions):
| Estimated useful lives |
June 30, 2016 | December 31, 2016 | ||||||||||
| Furniture and fixtures |
3 to 7 years | $ | 4.7 | $ | 4.9 | |||||||
| Equipment |
3 to 7 years | 18.1 | 21.1 | |||||||||
| Software |
3 years | 14.4 | 15.9 | |||||||||
| Leasehold improvements |
Life of lease | 11.2 | 13.2 | |||||||||
|
|
|
|
|
|||||||||
| Total property and equipment |
48.4 | 55.1 | ||||||||||
| Accumulated depreciation and amortization |
(15.5 | ) | (21.6 | ) | ||||||||
|
|
|
|
|
|||||||||
| Total property and equipment, net |
$ | 32.9 | $ | 33.5 | ||||||||
|
|
|
|
|
|||||||||
Depreciation and amortization associated with property and equipment that is included in depreciation and amortization within the Company’s consolidated statements of operations was $4.0 million and $3.9 million for the six months ended December 31, 2016 and 2015, respectively.
Depreciation and amortization expense associated with property and equipment directly utilized in support of managed services and managed cloud contracts that is included in cost of service revenue within the Company’s consolidated statements of operations was $1.8 million and $1.4 million for the six months ended December 31, 2016 and 2015, respectively.
Note 6. Goodwill and Identifiable Intangible Assets
Goodwill
There were no changes to the goodwill balance during the period from June 30, 2016 to December 31, 2016. From June 30, 2016 through the date of the consolidated financial statements, no significant events have occurred that would lead us to believe that goodwill is more likely than not impaired.
Identifiable Intangible Assets
Identifiable intangible assets consisted of the following (in millions):
| June 30, 2016 |
Range of life (years) |
Gross amount | Accumulated amortization |
Total, net | ||||||||||||
| Finite-lived intangible assets: |
||||||||||||||||
| Customer relationships |
5 – 10 | $ | 703.2 | $ | (89.4 | ) | $ | 613.8 | ||||||||
| Developed technology |
5 | 3.6 | (0.9 | ) | 2.7 | |||||||||||
| Non-compete agreements |
1 | 0.6 | (0.6 | ) | — | |||||||||||
| Trade names |
2 | 5.1 | (1.1 | ) | 4.0 | |||||||||||
| Indefinite-lived intangible assets: |
||||||||||||||||
| Trade names |
Indefinite | 205.0 | — | 205.0 | ||||||||||||
|
|
|
|
|
|
|
|||||||||||
| Total intangible assets |
$ | 917.5 | $ | (92.0 | ) | $ | 825.5 | |||||||||
|
|
|
|
|
|
|
|||||||||||
F-72
Table of Contents
Presidio, Inc.
Notes to Consolidated Financial Statements
(unaudited)
| December 31, 2016 |
Range of life (years) |
Gross amount | Accumulated amortization |
Total, net | ||||||||||||
| Finite-lived intangible assets: |
||||||||||||||||
| Customer relationships |
5 – 10 | $ | 703.2 | $ | (124.7 | ) | $ | 578.5 | ||||||||
| Developed technology |
5 | 3.6 | (1.2 | ) | 2.4 | |||||||||||
| Noncompete agreements |
1 | 0.6 | (0.6 | ) | — | |||||||||||
| Trade names |
2 | 5.1 | (2.3 | ) | 2.8 | |||||||||||
| Indefinite-lived intangible assets: |
||||||||||||||||
| Trade names |
Indefinite | 205.0 | — | 205.0 | ||||||||||||
|
|
|
|
|
|
|
|||||||||||
| Total intangible assets |
$ | 917.5 | $ | (128.8 | ) | $ | 788.7 | |||||||||
|
|
|
|
|
|
|
|||||||||||
Amortization associated with intangible assets was $36.8 million and $31.4 million for the six months ended December 31, 2016 and 2015, respectively. The weighted-average remaining useful life of the finite-lived intangible assets was 8.2 years and 8.7 years as of December 31, 2016 and June 30, 2016, respectively.
From June 30, 2016 through the date of the consolidated financial statements, no significant events have occurred that would lead us to believe that the indefinite-lived trade names were more likely than not impaired.
Based on the finite-lived intangible assets recorded at December 31, 2016, the future amortization expense is expected to be as follows (in millions):
| Years ending June 30, |
||||
| 2017 (remaining six months) |
$ | 36.8 | ||
| 2018 |
72.5 | |||
| 2019 |
71.1 | |||
| 2020 |
70.8 | |||
| 2021 |
70.4 | |||
| 2022 and thereafter |
262.1 | |||
|
|
|
|||
| Total |
$ | 583.7 | ||
|
|
|
|||
Note 7. Accounts Payable – Floor Plan
The accounts payable – floor plan balances on the consolidated balance sheets relate to an agreement with a financial institution that provides an indirect wholly owned subsidiary of the Company with funding for discretionary inventory purchases from approved vendors. Payables are due within 90 days and are noninterest bearing, provided they are paid when due. In accordance with the agreement, the financial institution has been granted a senior security interest in the indirect wholly owned subsidiary’s inventory purchased under the agreement and accounts receivable arising from the sale thereof. Payments on the facility are guaranteed by Presidio, LLC and subsidiaries. As of December 31, 2016 and June 30, 2016, the aggregate availability for purchases under the floor plan is the lesser of $325.0 million or the liquidation value of the pledged assets. The balances outstanding under the accounts payable - floor plan facility were $186.9 million and $223.3 million as of December 31, 2016 and June 30, 2016, respectively.
F-73
Table of Contents
Presidio, Inc.
Notes to Consolidated Financial Statements
(unaudited)
Note 8. Accrued Expenses and Other Current Liabilities
Accrued expenses and other current liabilities consist of the following (in millions):
| June 30, 2016 |
December 31, 2016 |
|||||||
| Accrued compensation |
$ | 66.1 | $ | 62.4 | ||||
| Accrued interest |
21.4 | 22.4 | ||||||
| Accrued equipment purchases/vendor expenses |
27.5 | 31.3 | ||||||
| Accrued income taxes |
— | 4.0 | ||||||
| Accrued non-income taxes |
12.2 | 13.7 | ||||||
| Customer deposits, current portion |
8.8 | 8.3 | ||||||
| Unearned revenue |
30.8 | 30.6 | ||||||
| Other accrued expenses and current liabilities |
0.3 | 3.3 | ||||||
|
|
|
|
|
|||||
| Total accrued expenses and other current liabilities |
$ | 167.1 | $ | 176.0 | ||||
|
|
|
|
|
|||||
Note 9. Long-Term Debt and Credit Agreements
Long-term debt consisted of the following (in millions):
| June 30, 2016 |
December 31, 2016 |
|||||||
| Revolving credit facility |
$ | — | $ | — | ||||
| Receivables securitization loan |
5.0 | — | ||||||
| Term loan facility, due February 2022 |
732.3 | 703.6 | ||||||
| Senior notes, 10.25% due February 2023 |
222.5 | 222.5 | ||||||
| Senior subordinated notes, 10.25% due February 2023 |
111.8 | 111.8 | ||||||
|
|
|
|
|
|||||
| Total long-term debt |
1,071.6 | 1,037.9 | ||||||
| Unamortized debt issuance costs |
(33.6 | ) | (29.8 | ) | ||||
|
|
|
|
|
|||||
| Total long-term debt, net of debt issuance costs |
$ | 1,038.0 | $ | 1,008.1 | ||||
|
|
|
|
|
|||||
| Reported as: |
||||||||
| Current |
$ | 7.4 | $ | 7.4 | ||||
| Long-term |
1,030.6 | 1,000.7 | ||||||
|
|
|
|
|
|||||
| Total long-term debt, net of debt issuance costs |
$ | 1,038.0 | $ | 1,008.1 | ||||
|
|
|
|
|
|||||
As of December 31, 2016, there were no outstanding borrowings on the revolving credit facility and there were $1.5 million in letters of credit outstanding. The Company was in compliance with the covenants and had $48.5 million available for borrowings under the facility as of December 31, 2016.
As of December 31, 2016, there were no outstanding borrowings under the receivables securitization facility. The Company had $190.5 million available under the receivables securitization facility based on the collateral available as of December 31, 2016.
On December 30, 2016, the Company made a $25.0 million voluntary prepayment on the term loan, resulting in a $0.8 million loss on extinguishment of debt in the Company’s consolidated statement of operations associated with the write-off of debt issuance costs.
F-74
Table of Contents
Presidio, Inc.
Notes to Consolidated Financial Statements
(unaudited)
Note 10. Fair Value Measurements
For certain of the Company’s financial instruments, including cash and cash equivalents, accounts and unbilled receivables, accounts payable – trade, accounts payable – floor plan, and other accrued liabilities, the carrying amount approximates fair value due to the short-term maturities of these instruments. Additionally, the Company’s financing receivables, and acquisition-related liabilities were measured at their respective fair values upon initial recognition.
The fair value hierarchy for the Company’s financial assets and liabilities measured at fair value were as follows (in millions):
| Fair value measurement | ||||||||||||||||
| June 30, 2016 |
Carrying value | Level 1 | Level 2 | Level 3 | ||||||||||||
| Receivable securitization facility |
$ | 5.0 | $ | — | $ | — | $ | 5.0 | ||||||||
| Term loan |
732.3 | — | 714.0 | — | ||||||||||||
| Senior notes |
222.5 | — | 227.6 | — | ||||||||||||
| Senior subordinated notes |
111.8 | — | 115.7 | — | ||||||||||||
|
|
|
|
|
|
|
|
|
|||||||||
| Total |
$ | 1,071.6 | $ | — | $ | 1,057.3 | $ | 5.0 | ||||||||
|
|
|
|
|
|
|
|
|
|||||||||
| Fair value measurement | ||||||||||||||||
| December 31, 2016 |
Carrying value | Level 1 | Level 2 | Level 3 | ||||||||||||
| Term loan |
$ | 703.6 | $ | — | $ | 711.6 | $ | — | ||||||||
| Senior notes |
222.5 | — | 245.3 | — | ||||||||||||
| Senior subordinated notes |
111.8 | — | 120.3 | — | ||||||||||||
|
|
|
|
|
|
|
|
|
|||||||||
| Total |
$ | 1,037.9 | $ | — | $ | 1,077.2 | $ | — | ||||||||
|
|
|
|
|
|
|
|
|
|||||||||
The fair value of the Company’s term loans, senior notes and senior subordinated notes are estimated based on quoted market prices for the debt which is traded in over-the-counter secondary markets that are not considered active. The carrying value of the Company’s term loans, senior notes and senior subordinated notes excludes unamortized deferred financing costs and original issue discounts.
For certain of the Company’s nonfinancial assets, including goodwill, intangible assets, and property and equipment the Company may be required to assess the fair values of these assets, on a recurring or nonrecurring basis, and record an impairment if the carrying value exceeds the fair value. In determining the fair value of these assets, the Company may use a combination of valuation methods which include Level 3 inputs. For the periods presented, there were no impairments charges.
Note 11. Commitments and Contingencies
Claims and assessments – In the normal course of business, the Company is subject to certain claims and assessments that arise in the ordinary course of business. The Company records a liability when the Company believes that it is both probable that a loss has been incurred, and the amount can be reasonably estimated. Significant judgment is required to determine the outcome and the estimated amount of a loss related to such matters. Management believes that there are no claims or assessments outstanding which would materially affect the consolidated results of operations or financial position of the Company.
F-75
Table of Contents
Presidio, Inc.
Notes to Consolidated Financial Statements
(unaudited)
On July 14, 2015, the Company received a subpoena from the Office of Inspector General for the General Services Administration (“GSA”) seeking various records relating to GSA contracting activity by us during the period beginning in April 2005 through the present. The subpoena is part of an ongoing law enforcement investigation being conducted by the GSA and requests a broad range of documents relating to business conduct in the GSA Multiple Award Schedule program. The Company is fully cooperating with the Inspector General in connection with the subpoena.
On March 11, 2016, the Company received a subpoena from the Office of Treasury Inspector General for Tax Administration for the Department of the Treasury seeking various records from January 1, 2014 through the present, relating to Company contracts with the Internal Revenue Service as well as the Company’s interactions with other parties named in the subpoena who were involved in such contracts. The Company is fully cooperating with the Treasury Inspector General in connection with the subpoena.
As these matters are ongoing, the Company is unable to determine their likely outcome and is unable to reasonably estimate a range of loss, if any, at this time. Accordingly, no provision for these matters has been recorded.
Note 12. Earnings Per Share
The following is a reconciliation of the weighted-average number of shares used to compute basic and diluted earnings per share (“EPS”) (in millions except for share and per share data):
| Six months ended December 31, 2015 |
Six months ended December 31, 2016 |
|||||||
| Numerator: |
||||||||
| Earnings |
$ | 10.5 | $ | 9.0 | ||||
| Denominator: |
||||||||
| Weighted-average shares – basic |
35,264,021 | 35,967,493 | ||||||
| Effect of dilutive securities: |
||||||||
| Stock options |
788,138 | 1,344,702 | ||||||
|
|
|
|
|
|||||
| Weighted-average shares – diluted |
36,052,159 | 37,312,195 | ||||||
|
|
|
|
|
|||||
| Earnings per share: |
||||||||
| Basic |
$ | 0.30 | $ | 0.25 | ||||
| Diluted |
$ | 0.29 | $ | 0.24 | ||||
Potentially dilutive securities that have been excluded from the computation of diluted weighted-average common shares outstanding because their inclusion would have been anti-dilutive consist of the following:
| Six months ended December 31, 2015 |
Six months ended December 31, 2016 |
|||||||
| Stock options excluded from EPS because of anti-dilution |
28,862 | 241,110 | ||||||
| Stock options excluded from EPS because performance condition has not been met |
1,638,039 | 1,751,777 | ||||||
|
|
|
|
|
|||||
| Total stock options excluded from EPS |
1,666,901 | 1,992,887 | ||||||
|
|
|
|
|
|||||
F-76
Table of Contents
Presidio, Inc.
Notes to Consolidated Financial Statements
(unaudited)
Note 13. Related Party Transactions
Apollo Global Management, LLC (together with its subsidiaries, “Apollo”) is a leading alternative investment management firm which owns and operates businesses across a variety of industries. The Company recorded revenue to parties affiliated with Apollo or its directors of $2.1 million and $1.2 million for the six months ended December 31, 2016 and 2015, respectively. As of December 31, 2016 and June 30, 2016, the outstanding receivables associated with parties affiliated with Apollo or its directors were $1.8 million and $0.2 million, respectively.
As of December 31, 2016 and June 30, 2016, an alternative investment vehicle formed by the limited partners of the Apollo Funds owned substantially all of the economic interests in the Subordinated Notes pursuant to certain derivative arrangements entered into with Deutsche Bank AG, who is the holder of 100% of the Senior Subordinated Notes.
The Company leases an office that is owned by members of the Company’s management. The office location was carried over from a prior acquisition and the Company has continued to renew the lease. Rent expense for the office was $0.2 million and $0.2 million for the six months ended December 31, 2016 and 2015, respectively.
Note 14. Segment Information
Since October 22, 2015, the Company has operated as one reportable segment, the PNS segment. The change in reportable segments was made in connection with the sale of the Company’s other reportable segment, the Atlantix segment, to an unaffiliated third party on October 22, 2015.
Geographic Areas
Revenue earned by the Company from customers outside of the United States is not material for any of the periods presented. Additionally, the Company does not have long-lived assets outside of the United States.
Revenue by Solution Area
The following table presents total revenue by solution area (in millions):
| Six months ended December 31, 2015 |
Six months ended December 31, 2016 |
|||||||
| Cloud |
$ | 193.7 | $ | 248.1 | ||||
| Security |
130.0 | 136.5 | ||||||
| Digital Infrastructure |
1,050.9 | 1,074.9 | ||||||
|
|
|
|
|
|||||
| Total revenue |
$ | 1,374.6 | $ | 1,459.5 | ||||
|
|
|
|
|
|||||
The type of solution sold by the Company to its customers is based upon internal classifications.
Note 15. Subsequent Events
On January 19, 2017, the terms of the February 2015 Credit Agreement were amended pursuant to Incremental Assumption Agreement and Amendment No. 4 (the “January 2017 Amendment”) to, among other things, lower the applicable margin for all term loans outstanding under the February 2015 Credit Agreement to 3.50% in the case of LIBOR rate borrowings and 2.50% in the case of base rate borrowings. In addition, the January 2017 Amendment provides that from and after the date that Presidio Holdings Inc. delivers a certificate to the
F-77
Table of Contents
Presidio, Inc.
Notes to Consolidated Financial Statements
(unaudited)
Administrative Agent certifying that (i) a qualifying initial public offering has occurred and (ii) as of the date of such certificate, the net total leverage ratio, calculated on a pro forma basis, is less than 4.00 to 1.00, the applicable margin for term loans outstanding under the February 2015 Credit Agreement will be reduced by an additional 0.25%. In addition, the January 2017 Amendment reset the amortization payments at a rate of 1.00% per annum, payable quarterly on the principal amount of term loans outstanding as of the date of the January 2017 Amendment, which principal amount was $703.6 million.
F-78
Table of Contents

Table of Contents
shares
Common stock
Prospectus
| J.P. Morgan | Citigroup | |
| Barclays | RBC Capital Markets |
| Credit Suisse | Goldman, Sachs & Co. | Wells Fargo Securities | Evercore ISI |
| Guggenheim Securities | Apollo Global Securities | LionTree |
Prospectus dated , .
Until (the 25th day after the date of this prospectus), all dealers effecting transactions in these securities, whether or not participating in this Offering, may be required to deliver a prospectus. This is in addition to the dealers’ obligation to deliver a prospectus when acting as underwriters and with respect to their unsold allotments or subscriptions.
Table of Contents
PART II
INFORMATION NOT REQUIRED IN PROSPECTUS
Item 13. Other Expenses of Issuance and Distribution.
The following table sets forth the costs and expenses, other than underwriting discounts and commissions, payable by Presidio in connection with the issuance and distribution of the securities being registered. All amounts are estimates, except the SEC registration, Financial Industry Regulatory Authority, Inc. and stock exchange filing and listing fees. All expenses below are payable by the Registrant.
| SEC registration fee |
$ | 11,590 | ||
| NASDAQ filing fee and listing fee |
25,000 | |||
| Transfer agent and registrar fees |
4,500 | |||
| Printing and engraving expenses |
* | |||
| Legal and accounting fees and expenses |
* | |||
| Financial Industry Regulatory Authority, Inc. filing fee |
15,500 | |||
|
|
|
|||
| Total |
$ | * | ||
|
|
|
| * | To be filed by amendment. |
Item 14. Indemnification of Directors and Officers.
The Registrant is a Delaware corporation.
Section 145(a) of the DGCL provides that a Delaware corporation may indemnify any person who was or is a party or is threatened to be made a party to any threatened, pending or completed action, suit or proceeding, whether civil, criminal, administrative or investigative (other than an action by or in the right of the corporation) by reason of the fact that he is or was a director, officer, employee or agent of the corporation or is or was serving at the request of the corporation as a director, officer, employee or agent of another corporation, partnership, joint venture, trust or other enterprise, against expenses, judgments, fines and amounts paid in settlement actually and reasonably incurred by him in connection with such action, suit or proceeding if he acted in good faith and in a manner he reasonably believed to be in or not opposed to the best interests of the corporation, and, with respect to any criminal action or proceeding, had no cause to believe his conduct was unlawful.
Section 145(b) of the DGCL provides that a Delaware corporation may indemnify any person who was or is a party or is threatened to be made a party to any threatened, pending or completed action or suit by or in the right of the corporation to procure a judgment in its favor by reason of the fact that such person acted in any of the capacities set forth above, against expenses actually and reasonably incurred by him in connection with the defense or settlement of such action or suit if he acted under similar standards, except that no indemnification may be made in respect of any claim, issue or matter as to which such person shall have been adjudged to be liable to the corporation unless and only to the extent that the court in which such action or suit was brought shall determine that despite the adjudication of liability, such person is fairly and reasonably entitled to be indemnified for such expenses which the court shall deem proper.
Section 145 of the DGCL further provides that to the extent a director or officer of a corporation has been successful in the defense of any action, suit or proceeding referred to in subsections (a) and (b) or in the defense of any claim, issue, or matter therein, he shall be indemnified against any expenses actually and reasonably incurred by him in connection therewith; that indemnification provided for by Section 145 shall not be deemed exclusive of any other rights to which the indemnified party may be entitled; and that the corporation may purchase and maintain insurance on behalf of a director, officer, employee or agent of the corporation against any liability asserted against him or incurred by him in any such capacity or arising out of his status as
II-1
Table of Contents
such whether or not the corporation would have the power to indemnify him against such liabilities under Section 145.
Our Amended Certificate provides for the indemnification of directors and officers to the fullest extent permitted by the DGCL. Our Amended Certificate also provides that, in any action initiated by a person seeking indemnification, we shall bear the burden of proof that the person is not entitled to indemnification.
Section 102(b)(7) of the DGCL provides that a Delaware corporation may, with certain limitations, set forth in its certificate of incorporation a provision eliminating or limiting the personal liability of a director to the corporation or its stockholders for monetary damages for breach of a fiduciary duty as a director; provided that such provision shall not eliminate or limit the liability of a director (i) for any breach of the director’s duty of loyalty to the registrant or its stockholders, (ii) for acts or omissions not in good faith or which involve intentional misconduct or a knowing violation of law, (iii) under Section 174 of the DGCL or (iv) for any transaction from which the director derived an improper personal benefit. Our Amended Certificate includes such a provision.
Section 145(g) of the DGCL provides that a Delaware corporation has the power to purchase and maintain insurance on behalf of any director, officer, employee or other agent of the corporation or, if serving in such capacity at the request of the corporation, of another enterprise, against any liability asserted against such person and incurred by such person in any such capacity, or arising out of such person’s status as such, whether or not the corporation has the power to indemnify such person against such liability under the DGCL. Our Amended Certificate permits us to maintain insurance, at our expense, to protect us or any directors or officers of the company or another corporation, partnership, joint venture, trust or other enterprise against any such expense, liability or loss, whether or not we would have the power to indemnify such person against such expense, liability or loss under the DGCL.
The underwriting agreement to be filed as Exhibit 1.1 to this registration statement contains certain provisions pursuant to which certain officers, directors and control persons of the Registrant may be entitled to be indemnified by the underwriters named therein.
Item 15. Recent Sales of Unregistered Securities.
Set forth below in chronological order is certain information regarding securities issued by the Registrant during the three years preceding the filing of this registration statement in transactions that were not registered under the Securities Act, including the consideration, if any, received by the Registrant for such issuances. None of these transactions involved any underwriters or any public offerings. Each of these transactions was exempt from registration under the Securities Act pursuant to Section 4(2) of the Securities Act or Regulation D or Rule 701 promulgated thereunder, as transactions by an issuer not involving a public offering. With respect to each transaction listed below, no general solicitation was made by either the Registrant or any person acting on its behalf; the recipient of our securities agreed that the securities would be subject to the standard restrictions applicable to a private placement of securities under applicable state and federal securities laws; and appropriate legends were affixed to the certificates issued in such transactions.
The data in this Item 15 does not currently reflect the Stock Split. After the Stock Split is effected, and before the effectiveness of the registration statement of which this prospectus forms a part, the Registrant will update the data in this Item 15 to reflect the Stock Split.
Management Rollover
Upon the closing of our acquisition by certain investment funds affiliated with or managed by Apollo Global Management, LLC and its subsidiaries, including Apollo Investment Fund VIII, L.P., along with their parallel investment funds, certain employees and officers were offered the opportunity to exchange (1) shares of Presidio Holdings, Inc., a Delaware corporation, common stock for shares of our common stock and/or (2) options to purchase Presidio Holdings, Inc., a Delaware corporation, common stock for options to purchase
II-2
Table of Contents
our common stock. As a result, on February 2, 2015, certain employees and officers received 1,465,974 shares and 885,344 options to purchase our common stock, as follows:
| • | 405,595 options to purchase our common stock with an exercise price of $1.53; |
| • | 396,986 options to purchase our common stock with an exercise price of $2.86; |
| • | 55,452 options to purchase our common stock with an exercise price of $6.26; and |
| • | 27,311 options to purchase our common stock with an exercise price of $7.64. |
Common Stock Purchased and Stock Options Granted Pursuant to Employee Benefit Plans
During the three years preceding the date of this filing, certain of our current and former officers, directors and employees purchased an aggregate of 302,699 shares of our common stock pursuant to the equity plans then in effect:
| • | On June 10, 2015, 275,000 shares were purchased by two of our directors at a price of $10.00 per share. |
| • | On June 15, 2015, 5,000 shares were purchased by an employee at a price of $10.00 per share. |
| • | On December 15, 2015, 11,928 shares were purchased by an employee who exercised stock options with an exercise price of $2.86 per share. |
| • | On July 12, 2016, 3,588 shares were purchased by an employee who exercised stock options with an exercise price of $1.53 per share. |
| • | On July 12, 2016, 1,883 shares were purchased by an employee who exercised stock options with an exercise price of $6.26 per share. |
| • | On October 31, 2016, 300 shares were purchased by an employee who exercised stock options with an exercise price of $10.00 per share. |
| • | On November 1, 2016, 2,500 shares were purchased by an employee who exercised stock options with an exercise price of $10.00 per share. |
| • | On January 18, 2017, 2,500 shares were purchased by an employee who exercised stock options with an exercise price of $10.00 per share. |
In addition, during the same period, we granted certain of our directors, officers and employees the following options relating to shares of our common stock pursuant to the equity plans then in effect:
| • | On March 11, 2015, 3,266,000 options with an exercise price of $10.00 per share. |
| • | On May 5, 2015, 10,000 options with an exercise price of $10.00 per share. |
| • | On June 5, 2015, 30,000 options with an exercise price of $10.00 per share. |
| • | On October 1, 2015, 19,873 options with an exercise price of $12.58 per share. |
| • | On November 1, 2015, 15,000 options with an exercise price of $12.58 per share. |
| • | On February 26, 2016, 115,503 options with an exercise price of $17.50 per share. |
| • | On May 19, 2016, 47,500 options with an exercise price of $17.50 per share. |
| • | On August 10, 2016, 35,714 options with an exercise price of $17.50 per share. |
| • | On November 11, 2016, 22,314 options with an exercise price of $21.96 per share. |
| • | On December 12, 2016, 11,385 options with an exercise price of $21.96 per share. |
II-3
Table of Contents
Common Stock Purchased and Stock Options Granted Pursuant to Acquisitions
Upon closing of our acquisition of Sequoia Worldwide LLC and Netech Corporation, certain officers and employees of the target companies received as part of the purchase price an aggregate of 708,516 shares of our common stock. In addition, at closing, we granted certain officers and directors of these companies the following options relating to shares of our common stock:
| • | On November 24, 2015, 57,715 options with an exercise price of $17.50 per share were granted to certain employees of Sequoia Worldwide LLC. |
| • | On February 1, 2016, 226,285 options with an exercise price of $17.50 per share were granted to certain employees of Netech Corporation. |
Senior Notes
On February 2, 2015, we sold $250,000,000 of 10.25% Senior Notes due 2023 to certain initial purchasers pursuant to a Purchase Agreement dated January 30, 2015. This issuance was covered by the exemption in Section 4(a)(2) of the Securities Act. The notes are guaranteed by certain of our subsidiaries and are unsecured.
Senior Subordinated Notes
On February 2, 2015, we sold $150,000,000 of 10.25% Senior Subordinated Notes due 2023 to certain initial purchasers pursuant to a Purchase Agreement dated January 30, 2015. This issuance was covered by the exemption in Section 4(a)(2) of the Securities Act. Such notes are guaranteed by certain of our subsidiaries and are unsecured.
Item 16. Exhibits, Financial Statements and Financial Statement Schedules.
| (a) | Exhibits |
The list of exhibits is set forth under “Exhibit Index” at the end of this registration statement and is incorporated herein by reference.
| (b) | Financial statement schedules |
See the Index to Financial Statements included on page F-1 for a list of the financial statements included in this registration statement. All schedules not identified above have been omitted because they are not required, are inapplicable, or the information is included in the consolidated financial statements or notes contained in this registration statement.
Item 17. Undertakings.
The undersigned registrant hereby undertakes to provide to the underwriters at the closing specified in the underwriting agreement certificates in such denominations and registered in such names as required by the underwriters to permit prompt delivery to each purchaser. Insofar as indemnification for liabilities arising under the Securities Act may be permitted to directors, officers and controlling persons of the registrant pursuant to the foregoing provisions, or otherwise, the registrant has been advised that in the opinion of the Securities and Exchange Commission, such indemnification is against public policy as expressed in the Securities Act, and is, therefore, unenforceable. In the event that a claim for indemnification against such liabilities (other than the payment by the registrant of expenses incurred or paid by a director, officer or controlling person of the registrant in the successful defense of any action, suit or proceeding) is asserted by such director, officer or controlling person in connection with the securities being registered, the registrant will, unless in the opinion of its counsel the matter has been settled by controlling precedent, submit to a court of appropriate jurisdiction the question of whether such indemnification is against public policy as expressed in the Securities Act and will be governed by the final adjudication of such issue.
II-4
Table of Contents
The undersigned registrant hereby undertakes that:
| (i) | for purposes of determining any liability under the Securities Act, the information omitted from the form of prospectus filed as part of this registration statement in reliance upon Rule 430A and contained in a form of prospectus filed by the registrant pursuant to Rule 424(b)(1) or (4) or 497(h) under the Securities Act shall be deemed to be part of this registration statement as of the time it was declared effective; and |
| (ii) | for the purpose of determining any liability under the Securities Act, each post-effective amendment that contains a form of prospectus shall be deemed to be a new registration statement relating to the securities offered therein, and the offering of such securities at that time shall be deemed to be the initial bona fide offering thereof. |
II-5
Table of Contents
Signatures
Pursuant to the requirements of the Securities Act of 1933, the registrant has duly caused this registration statement to be signed on its behalf by the undersigned, thereunto duly authorized, in the City of New York, State of New York, on the 15 day of February, 2017.
| PRESIDIO, INC. | ||||
| By: | /s/ Robert Cagnazzi | |||
| Name: | Robert Cagnazzi | |||
| Title: | Chief Executive Officer | |||
Each person whose signature appears below constitutes and appoints Robert Cagnazzi, Dave Hart and Elliot Brecher and each of them, his or her true and lawful attorneys-in-fact and agents, each with full power of substitution and resubstitution, severally, for him or her and in his or her name, place and stead, in any and all capacities, to sign any and all amendments (including post-effective amendments) to this Registration Statement, and to file the same, with all exhibits thereto and other documents in connection therewith, with the Securities and Exchange Commission, granting unto said attorneys-in-fact and agents, and each of them, full power and authority to do and perform each and every act and thing requisite and necessary to be done in and about the premises, as fully to all intents and purposes as he or she might or could do in person, hereby ratifying and confirming all that said attorneys-in-fact and agents, or any of them or their or his substitute or substitutes, may lawfully do or cause to be done by virtue hereof.
Pursuant to the requirements of the Securities Act of 1933, this registration statement has been signed below by the following persons in the capacities and on the dates indicated below.
| Signature |
Title |
Date | ||
| /s/ Robert Cagnazzi Robert Cagnazzi |
Chief Executive Officer and Director (Principal Executive Officer) |
February 15, 2017 | ||
| /s/ Paul Fletcher Paul Fletcher |
Executive Vice President and Chief Financial Officer (Principal Financial Officer and Principal Accounting Officer) | February 15, 2017 | ||
| * Matthew H. Nord |
Director |
February 15, 2017 | ||
| * Christopher L. Edson |
Director | February 15, 2017 | ||
| * Giovanni Visentin |
Director and Chairman of the Board | February 15, 2017 | ||
II-6
Table of Contents
| Signature |
Title |
Date | ||
| * Joseph Trost |
Director | February 15, 2017 | ||
| * Todd H. Siegel |
Director | February 15, 2017 | ||
| * Pankaj Patel |
Director | February 15, 2017 | ||
| /s/ Salim Hirji Salim Hirji |
Director | February 15, 2017 | ||
| /s/ Steven Lerner Steven Lerner |
Director | February 15, 2017 | ||
| * By: | /s/ Robert Cagnazzi | |
| Robert Cagnazzi, as Attorney-in-Fact | ||
II-7
Table of Contents
Index to Exhibits
| Exhibit |
Description of Exhibit | |
| 1.1* | Form of Underwriting Agreement. | |
| 3.1 | Form of Amended and Restated Certificate of Incorporation of Presidio, Inc. | |
| 3.2 | Form of Amended and Restated Bylaws of Presidio, Inc. | |
| 4.1** | Indenture governing the 10.25% Senior Notes due 2023, dated as of February 2, 2015 (the “Senior Notes Indenture”), among Presidio Holdings Inc., as Issuer (the “Senior Notes Issuer”), the Subsidiary Guarantors party thereto from time to time, and Wilmington Trust, National Association, as Trustee. | |
| 4.2** | Indenture governing the 10.25% Senior Subordinated Notes due 2023, dated as of February 2, 2015 (the “Subordinated Notes Indenture”), among Presidio Holdings Inc., as Issuer (the “Subordinated Notes Issuer”), the Subsidiary Guarantors party thereto from time to time, and Wilmington Trust, National Association, as Trustee. | |
| 4.3** | First Supplemental Indenture, dated as of January 12, 2016, among the Senior Notes Issuer, Presidio Infrastructure Solutions LLC, as a New Subsidiary Guarantor, and Wilmington Trust, National Association, as Trustee, under the Senior Notes Indenture. | |
| 4.4** | First Supplemental Indenture, dated as of January 12, 2016, among the Subordinated Notes Issuer, Presidio Infrastructure Solutions LLC, as a New Subsidiary Guarantor, and Wilmington Trust, National Association, as Trustee, under the Subordinated Notes Indenture. | |
| 4.5** | Form of common stock certificate of Presidio, Inc. | |
| 4.6 | Form of Amended Management Stockholders Agreement. | |
| 4.7 | Form of Apollo Stockholders Agreement. | |
| 5.1** | Form of Opinion of Wachtell, Lipton, Rosen & Katz. | |
| 10.1** | Credit Agreement, dated as of February 2, 2015, among Presidio Holdings Inc., as Holdings, Presidio IS LLC, as Intermediate Holdings, Presidio LLC, as Company and a Borrower, Presidio Networked Solutions LLC, as a Borrower, the Lenders Party Thereto, and Credit Suisse AG, Cayman Islands Branch, as Administrative Agent. | |
| 10.2** | Incremental Assumption Agreement and Amendment No. 1, dated as of May 19, 2015, among Presidio Holdings Inc., Presidio IS LLC, Presidio LLC, Presidio Networked Solutions LLC, the Subsidiary Loan Parties Party Thereto, the Refinancing Term Lender Party Thereto, and Credit Suisse AG, Cayman Islands Branch, as Administrative Agent. | |
| 10.3** | Incremental Assumption Agreement and Amendment No. 2, dated as of February 1, 2016, among Presidio Holdings Inc., Presidio IS LLC, Presidio LLC, Presidio Networked Solutions LLC, the Subsidiary Loan Parties Party Thereto, the Incremental Term Lender Party Thereto, and Credit Suisse AG, Cayman Islands Branch, as Administrative Agent. | |
| 10.4** | Incremental Assumption Agreement and Amendment No. 3, dated as of May 27, 2016, among Presidio Holdings Inc., Presidio IS LLC, Presidio LLC, Presidio Networked Solutions LLC, the Subsidiary Loan Parties Party Thereto and Credit Suisse AG, Cayman Islands Branch, as Incremental Term Lender and as Administrative Agent. | |
II-8
Table of Contents
| Exhibit |
Description of Exhibit | |
| 10.5** | Second Amended and Restated Receivables Purchase Agreement, dated as of February 2, 2015, among Presidio Capital Funding LLC, as Seller, Presidio LLC, as Servicer, the Sub-Servicers Party Thereto, and PNC Bank, National Association, as Administrator. | |
| 10.6** | Amendment No. 1 to the Second Amended and Restated Receivables Purchase Agreement and Reaffirmation of Performance Guaranty, dated as of February 8, 2016, among Presidio Capital Funding LLC, as Seller, Presidio LLC, as Servicer, Presidio Networked Solutions LLC, as Sub-Servicer, Presidio IS LLC, as Performance Guarantor and PNC Bank, National Association, as Administrator. | |
| 10.7** | Third Amended and Restated Credit Agreement, dated February 28, 2014, between Castle Pines Capital LLC and Presidio Networked Solutions Group, LLC (f/k/a INX LLC and as successor to Bluewater Communications Group LLC). | |
| 10.8** | First Amendment to the Third Amended and Restated Credit Agreement, dated March 26, 2014, between Castle Pines Capital LLC and Presidio Networked Solutions Group, LLC (f/k/a INX LLC and as successor to Bluewater Communications Group LLC). | |
| 10.9** | Acknowledgement and Second Amendment to the Third Amended and Restated Credit Agreement, dated November 25, 2014, between Castle Pines Capital LLC and Presidio Networked Solutions Group, LLC. | |
| 10.10** | Third Amendment to the Third Amended and Restated Credit Agreement, dated February 1, 2016, among Presidio Networked Solutions Group, LLC, Presidio Infrastructure Solutions LLC and Castle Pines Capital LLC. | |
| 10.11+ | Systems Integrator Agreement by and between Cisco Systems, Inc. and Presidio Networked Solutions LLC (f/k/a The Presidio Corporation) dated as of May 14, 2002 (as amended on June 3, 2002, July 12, 2006, April 23, 2007, March 28, 2008, February 10, 2009, March 14, 2011, January 25, 2012, March 1, 2012, March 15, 2013 April 16, 2013, May 17, 2013, July 30, 2013, September 12, 2013, December 13, 2013, February 20, 2014, March 10, 2014, February 26, 2016, May 3, 2016, July 1, 2016, August 5, 2016, September 8, 2016, November 8, 2016, January 10, 2017 and February 7, 2017) (with addendums dated as of October 13, 2011, December 21, 2012, May 2, 2013 and February 3, 2014). | |
| 10.12** | Lease by and between 4C Realty, LLC and Presidio Networked Solutions LLC, dated September 17, 2014. | |
| 10.13** | Incremental Assumption Agreement and Amendment No. 4, dated as of January 19, 2017, among Presidio Holdings Inc., Presidio IS LLC, Presidio LLC, Presidio Networked Solutions LLC, the Subsidiary Loan Parties Party Thereto and Credit Suisse AG, Cayman Islands Branch, as Refinancing Term Lender and as Administrative Agent. | |
| 10.14** | Form of Indemnification Agreement. | |
| 10.15 | Form of Presidio, Inc. Amended and Restated 2015 Long-Term Incentive Plan. | |
| 10.16 | Form of Rollover Option Agreement under the Amended and Restated 2015 Long-Term Incentive Plan. | |
II-9
Table of Contents
| Exhibit |
Description of Exhibit | |
| 10.17 | Form of Option Agreement under the Amended and Restated 2015 Long-Term Incentive Plan. | |
| 10.18 | Form of Presidio, Inc. Executive Bonus Plan. | |
| 10.19 | Form of Presidio, Inc. 2017 Long-Term Incentive Plan. | |
| 10.20 | Form of Option Award Certificate under the 2017 Long-Term Incentive Plan. | |
| 10.21 | Form of Amended and Restated Employment Agreement, by and between Presidio, Inc. and Robert Cagnazzi. | |
| 10.22 | Employment Agreement, by and between Presidio, Inc. and Paul Fletcher dated as of September 30, 2010. | |
| 10.23 | Form of Employment Agreement, by and between Presidio, Inc. and David Hart. | |
| 10.24 | Form of Employment Agreement, by and between Presidio, Inc. and Elliot Brecher. | |
| 10.25 | Form of Employment Agreement, by and between Presidio, Inc. and Vinu Thomas. | |
| 10.26 | Form of Presidio, Inc. Employee Stock Purchase Plan. | |
| 10.27 | Form of Stay Bonus Agreement. | |
| 10.28 | Letter to Dr. Steven Lerner, dated as of February 6, 2017. | |
| 10.29 | Notes Purchase Agreement, by and among Presidio, Inc. and Deutsche Bank AG, London Branch, dated as of February 15, 2017. | |
| 10.30 | Letter to Pankaj Patel, dated as of May 16, 2016. | |
| 21.1** | Subsidiaries of Presidio, Inc. | |
| 23.1** | Consent of Wachtell, Lipton, Rosen & Katz (contained in Exhibit 5.1). | |
| 23.2 | Consent of RSM US LLP. | |
| 23.3 | Consent of Gartner, Inc. | |
| 24.1 | Power of Attorney (included in signature pages). | |
| * | To be filed by amendment. |
| ** | Previously filed. |
| + | Portions of this exhibit have been omitted pursuant to a confidential treatment request. This information has been filed separately with the SEC. |
II-10