Attached files
| file | filename |
|---|---|
| 8-K - FORM 8-K - PG&E Corp | d269863d8k.htm |
| EX-99.1 - EX-99.1 - PG&E Corp | d269863dex991.htm |
Exhibit 99.2

PG&E PG&E Corporation®
FOURTH
QUARTER EARNINGS CALL
February 16, 2017
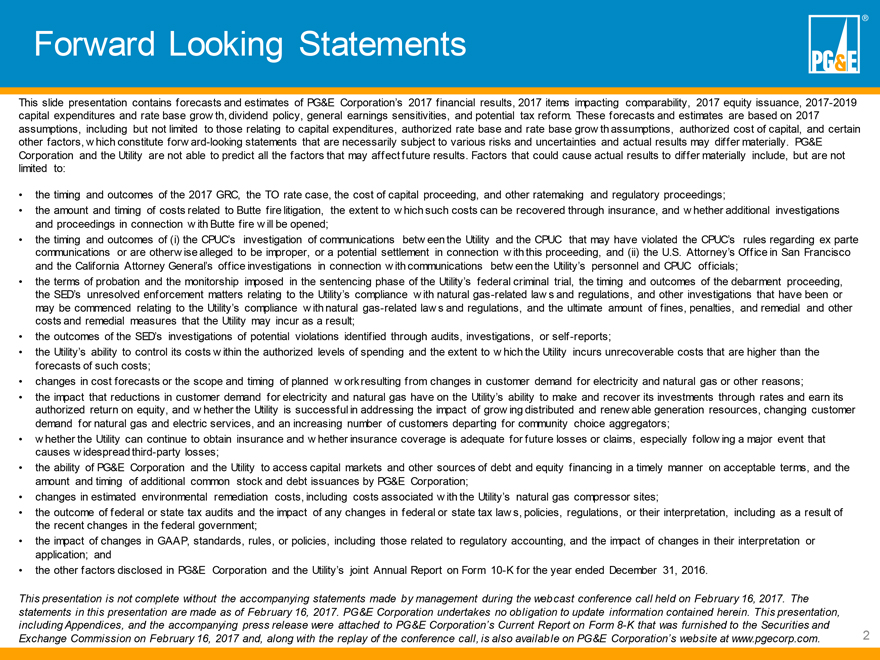
Forward Looking Statements PG&E®
This
slide presentation contains forecasts and estimates of PG&E Corporation’s 2017 financial results, 2017 items impacting comparability, 2017 equity issuance, 2017-2019 capital expenditures and rate base growth, dividend policy, general
earnings sensitivities, and potential tax reform. These forecasts and estimates are based on 2017 assumptions, including but not limited to those relating to capital expenditures, authorized rate base and rate base growth assumptions, authorized
cost of capital, and certain other factors, which constitute forward-looking statements that are necessarily subject to various risks and uncertainties and actual results may differ materially. PG&E Corporation and the Utility are not able to
predict all the factors that may affect future results. Factors that could cause actual results to differ materially include, but are not limited to:
the timing and outcomes
of the 2017 GRC, the TO rate case, the cost of capital proceeding, and other ratemaking and regulatory proceedings;
the amount and timing of costs related to Butte fire
litigation, the extent to which such costs can be recovered through insurance, and whether additional investigations and proceedings in connection with Butte fire will be opened;
the timing and outcomes of (i) the CPUC’s investigation of communications between the Utility and the CPUC that may have violated the CPUC’s rules regarding ex parte
communications or are otherwise alleged to be improper, or a potential settlement in connection with this proceeding, and (ii) the U.S. Attorney’s Office in San Francisco and the California Attorney General’s office investigations in
connection with communications between the Utility’s personnel and CPUC officials;
the terms of probation and the monitorship imposed in the sentencing phase of the
Utility’s federal criminal trial, the timing and outcomes of the debarment proceeding, the SED’s unresolved enforcement matters relating to the Utility’s compliance with natural gas-related law
s and regulations, and other investigations that have been or may be commenced relating to the Utility’s compliance with natural gas-related law s and regulations, and the ultimate amount of fines,
penalties, and remedial and other costs and remedial measures that the Utility may incur as a result;
the outcomes of the SED’s investigations of potential violations
identified through audits, investigations, or self -reports;
the Utility’s ability to control its costs within the authorized levels of spending and the extent to which
the Utility incurs unrecoverable costs that are higher than the forecasts of such costs;
changes in cost forecasts or the scope and timing of planned work resulting from
changes in customer demand for electricity and natural gas or other reasons;
the impact that reductions in customer demand for electricity and natural gas have on the
Utility’s ability to make and recover its investments through rates and earn its authorized return on equity, and whether the Utility is successful in addressing the impact of growing distributed and renew able generation resources, changing
customer demand for natural gas and electric services, and an increasing number of customers departing for community choice aggregators;
whether the Utility can continue to
obtain insurance and whether insurance coverage is adequate for future losses or claims, especially following a major event that causes widespread third-party losses;
the
ability of PG&E Corporation and the Utility to access capital markets and other sources of debt and equity financing in a timely manner on acceptable terms, and the amount and timing of additional common stock and debt issuances by PG&E
Corporation;
changes in estimated environmental remediation costs, including costs associated with the Utility’s natural gas compressor sites;
the outcome of federal or state tax audits and the impact of any changes in federal or state tax law s, policies, regulations, or their interpretation, including as a result of the recent
changes in the federal government;
the impact of changes in GAAP, standards, rules, or policies, including those related to regulatory accounting, and the impact of changes
in their interpretation or application; and
the other factors disclosed in PG&E Corporation and the Utility’s joint Annual Report on Form 10-K for the year ended December 31, 2016.
This presentation is not complete without the accompanying statements made by management
during the webcast conference call held on February 16, 2017. The statements in this presentation are made as of February 16, 2017. PG&E Corporation undertakes no obligation to update information contained herein. This presentation,
including Appendices, and the accompanying press release were attached to PG&E Corporation’s Current Report on Form 8-K that was furnished to the Securities and Exchange Commission on
February 16, 2017 and, along with the replay of the conference call, is also available on PG&E Corporation’s website at www.pgecorp.com. 2
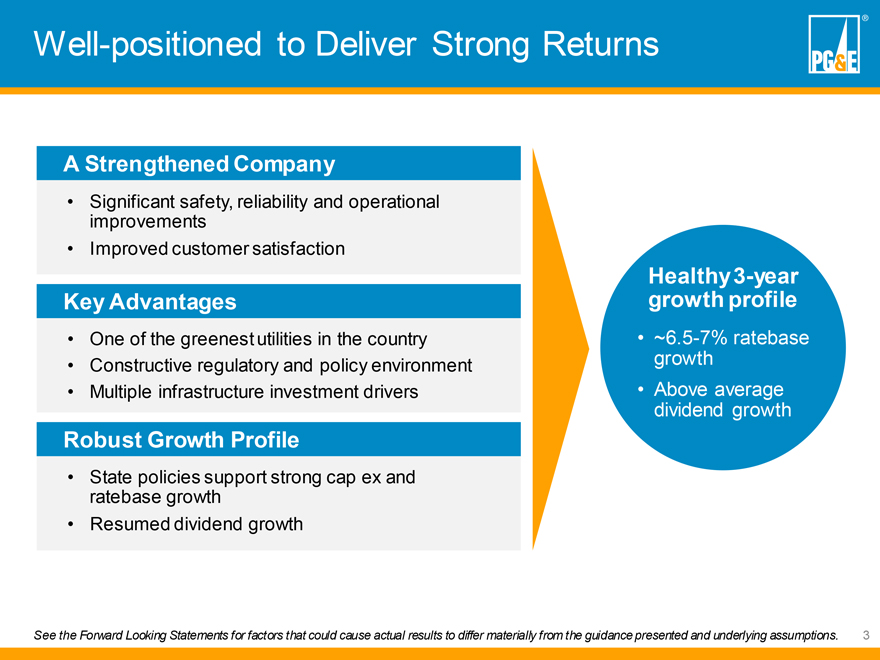
Well-positioned to Deliver Strong Returns
PG&E®
A Strengthened Company
Significant safety, reliability and operational improvements
Improved customer satisfaction
Key Advantages
One of the greenest utilities in the country
Constructive regulatory and policy environment
Multiple infrastructure investment drivers
Robust Growth Profile
State policies support strong cap ex and ratebase growth
Resumed dividend growth
Healthy 3-year growth profile
~6.5-7% ratebase growth
Above average dividend growth
See the Forward Looking Statements for factors that could cause actual results to differ materially from the guidance presented and underlying assumptions. 3
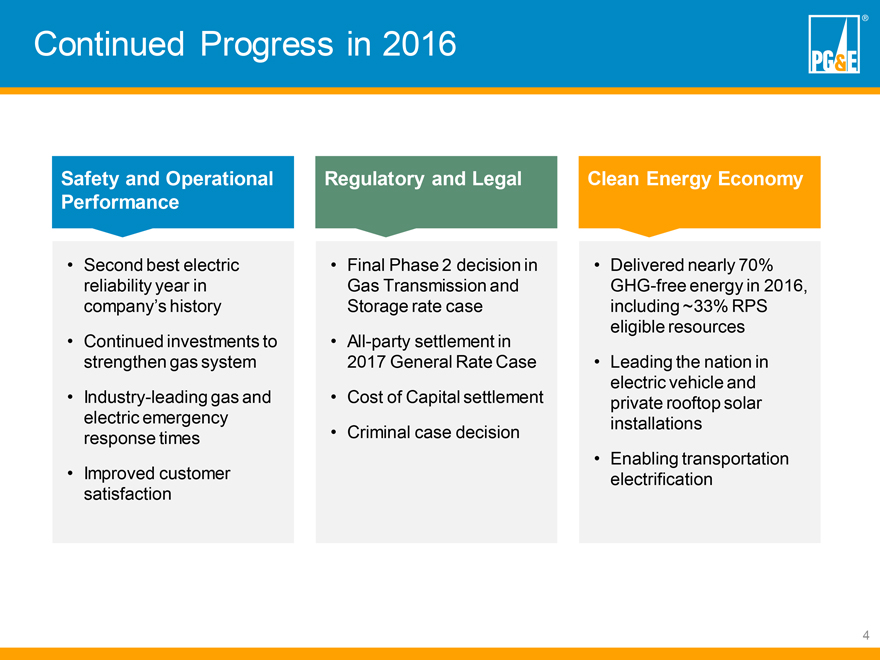
Continued Progress in 2016 Safety and Operational Performance Second best electric reliability year in company’s history Continued investments to strengthen gas system Industry-leading gas and electric emergency response times Improved customer satisfaction Regulatory and Legal Final Phase 2 decision in Gas Transmission and Storage rate case All-party settlement in 2017 General Rate Case Cost of Capital settlement Criminal case decision Clean Energy Economy Delivered nearly 70% GHG-free energy in 2016, including ~33% RPS eligible resources Leading the nation in electric vehicle and private rooftop solar installations Enabling transportation electrification 4
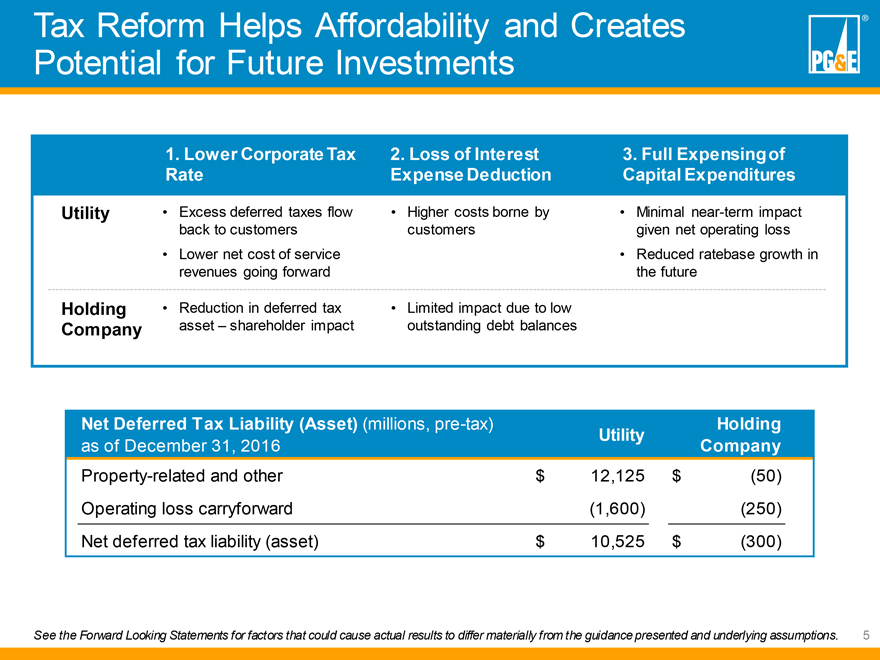
Tax Reform Helps Affordability and Creates Potential for Future Investments Utility Holding Company 1. Lower Corporate Tax Rate • Excess deferred taxes flow back to customers • Lower net cost of service revenues going forward • Reduction in deferred tax asset – shareholder impact 2. Loss of Interest Expense Deduction • Higher costs borne by customers • Limited impact due to low outstanding debt balances 3. Full Expensing of Capital Expenditures • Minimal near-term impact given net operating loss • Reduced ratebase growth in the future Net Deferred Tax Liability (Asset) (millions, pre-tax) as of December 31, 2016 Property-related and other Operating loss carryforward Net deferred tax liability (asset) Utility $ 12,125 (1,600) $ 10,525 Holding Company $ (50) (250) $ (300) See the Forward Looking Statements for factors that could cause actual results to differ materially from the guidance presented and underlying assumptions. 5
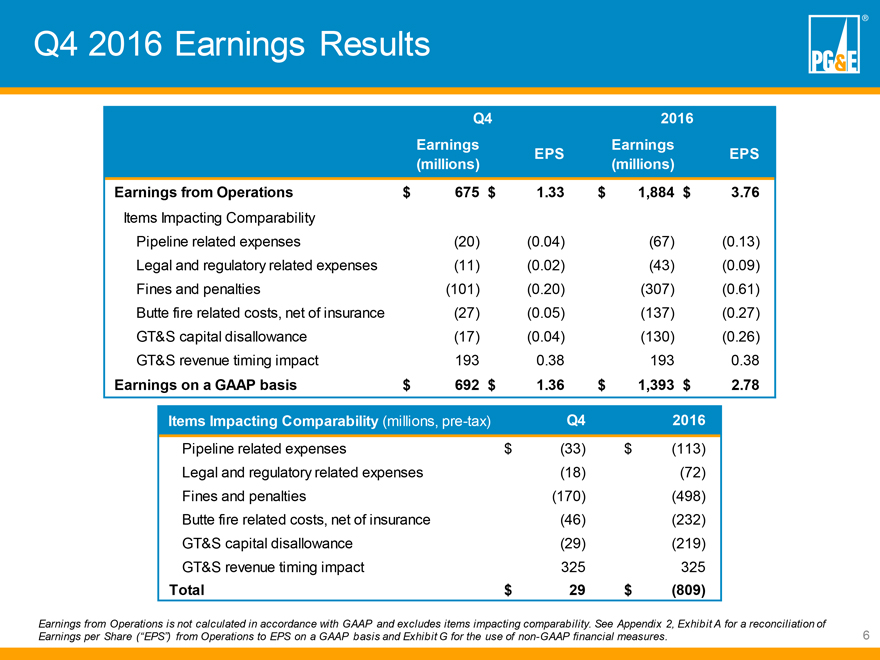
Q4 2016 Earnings Results PG&E®
Q4
2016
Earnings EPS Earnings EPS
(millions) (millions)
Earnings from Operations $675 $1.33 $1,884 $3.76
Items Impacting Comparability
Pipeline related expenses (20) (0.04) (67) (0.13)
Legal and regulatory related expenses (11) (0.02) (43) (0.09)
Fines and penalties (101) (0.20) (307) (0.61)
Butte fire related costs, net of insurance (27)
(0.05) (137) (0.27)
GT&S capital disallowance (17) (0.04) (130) (0.26)
GT&S revenue
timing impact 193 0.38 193 0.38
Earnings on a GAAP basis $692 $1.36 $1,393 $2.78
Items Impacting
Comparability (millions, pre-tax) Q4 2016
Pipeline related expenses $(33) $(113)
Legal and regulatory related expenses (18) (72)
Fines and penalties (170) (498)
Butte fire related costs, net of insurance (46) (232)
GT&S capital disallowance (29) (219)
GT&S revenue timing impact 325 325
Total $29 $(809)
Earnings from Operations is not calculated in accordance with GAAP and excludes items impacting comparability. See Appendix 2, Exhibit A for a reconciliation of Earnings per Share
(“EPS”) from Operations to EPS on a GAAP basis and Exhibit G for the use of non-GAAP financial measures.6
Q4 2016: Quarter over Quarter Comparison PG&E®
Earnings per Share from Operations
$1.60
$1.40 $0.06 $0.05 $0.05 ($0.01)
$1.20 $0.20
$1.00 $0.48
$0.80 $1.33
$0.60
$0.40 $0.50
$0.20
$0.00
Q4 2015 EPS from Operations Timing of 2015 GT&S revenue collection Timing of taxes
Nuclear Refueling Outage Growth in rate Miscellaneous base earnings Increase in shares outstanding Q4 2016 EPS from Operations
Earnings from Operations is not calculated in
accordance with GAAP and excludes items impacting comparability. See Appendix 2, Exhibit A for a reconciliation of Earnings per Share (“EPS”) from Operations to EPS on a GAAP basis and Exhibit G for the use of non-GAAP financial measures. 7
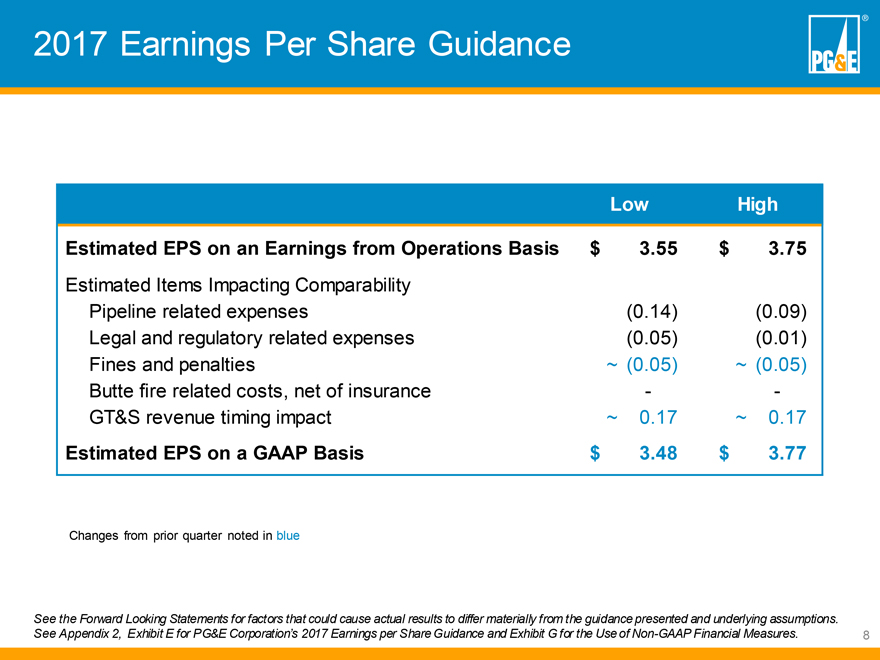
2017 Earnings Per Share Guidance PG&E®
Low High
Estimated EPS on an Earnings from Operations Basis $3.55 $3.75
Estimated Items Impacting Comparability
Pipeline related expenses (0.14) (0.09)
Legal and regulatory related expenses (0.05) (0.01)
Fines and penalties ~ (0.05) ~ (0.05)
Butte fire related costs, net of insurance - -
GT&S revenue timing impact ~ 0.17 ~
0.17
Estimated EPS on a GAAP Basis $3.48 $3.77
Changes from prior quarter noted in blue
See the Forward Looking Statements for factors that could cause actual results to differ materially from the guidance presented and underlying assumptions. See Appendix 2,
Exhibit E for PG&E Corporation’s 2017 Earnings per Share Guidance and Exhibit G for the Use of Non-GAAP Financial Measures. 8
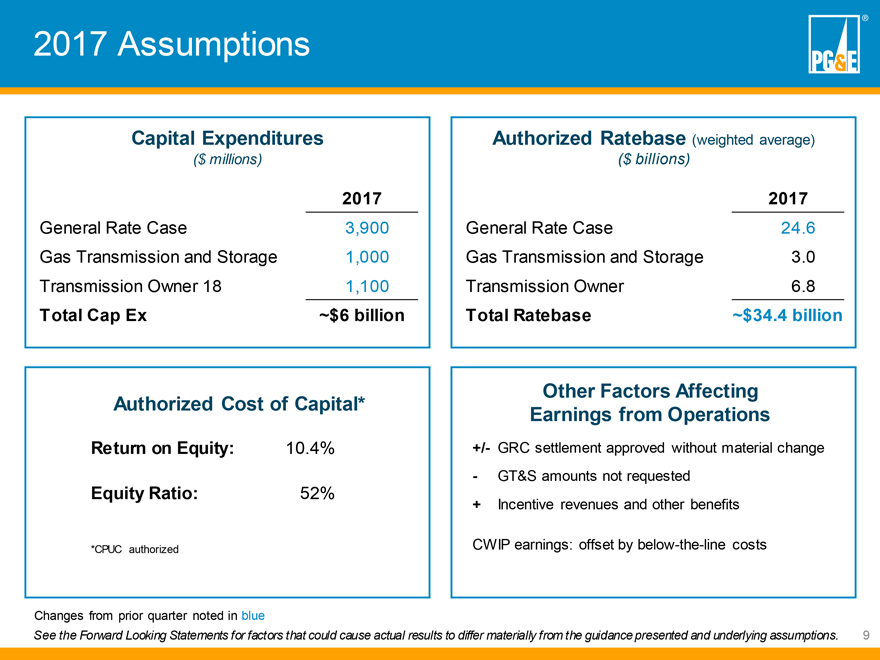
2017 Assumptions PG&E®
Capital
Expenditures
($ millions)
2017
General Rate Case 3,900
Gas Transmission and Storage 1,000
Transmission Owner 18 1,100
Total Cap Ex ~$6 billion
Authorized Ratebase (weighted average)
($ billions)
2017
General Rate Case 24.6
Gas
Transmission and Storage 3.0
Transmission Owner 6.8
Total Ratebase ~$34.4 billion
Authorized Cost of Capital*
Return on Equity: 10.4%
Equity Ratio: 52%
*CPUC authorized
Other Factors Affecting Earnings from Operations
+/- GRC settlement approved without material
change
-GT&S amounts not requested
+Incentive revenues and other benefits CWIP earnings:
offset by below-the-line costs
Changes from prior quarter noted in blue
See the Forward Looking Statements for factors that could cause actual results to differ materially from the guidance presented and underlying assumptions. 9
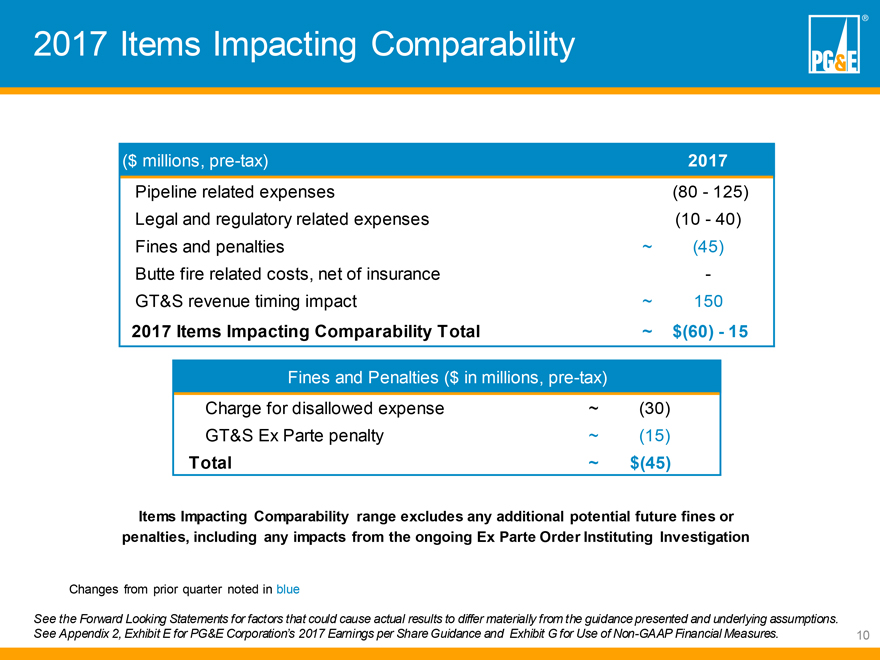
2017 Items Impacting Comparability PG&E®
($ millions, pre-tax) 2017
Pipeline related expenses (80 - 125)
Legal and regulatory related expenses (10 - 40)
Fines and penalties ~ (45)
Butte fire related costs, net of insurance -
GT&S revenue timing impact ~ 150
2017 Items Impacting Comparability Total ~ $(60) - 15
Fines and Penalties ($ in millions, pre-tax)
Charge for disallowed expense ~ (30)
GT&S Ex Parte
penalty ~ (15)
Total ~ $(45)
Items Impacting Comparability range excludes any additional
potential future fines or penalties, including any impacts from the ongoing Ex Parte Order Instituting Investigation
Changes from prior quarter noted in blue
See the Forward Looking Statements for factors that could cause actual results to differ materially from the guidance presented and underlying assumptions. See Appendix 2, Exhibit E for
PG&E Corporation’s 2017 Earnings per Share Guidance and Exhibit G for Use of Non-GAAP Financial Measures. 10
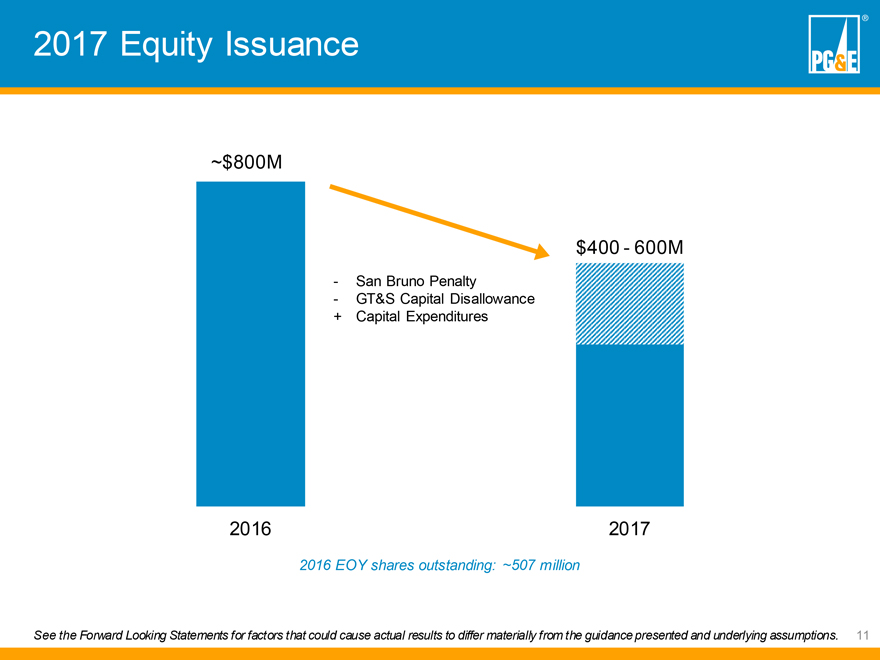
2017 Equity Issuance PG&E®
~$800M
$400 - 600M
- San Bruno Penalty
- GT&S Capital Disallowance
+ Capital Expenditures
2016
2017
2016 EOY shares outstanding:
~507 million
See the Forward Looking Statements for factors that could cause actual results to differ materially from the guidance presented and underlying assumptions.
11
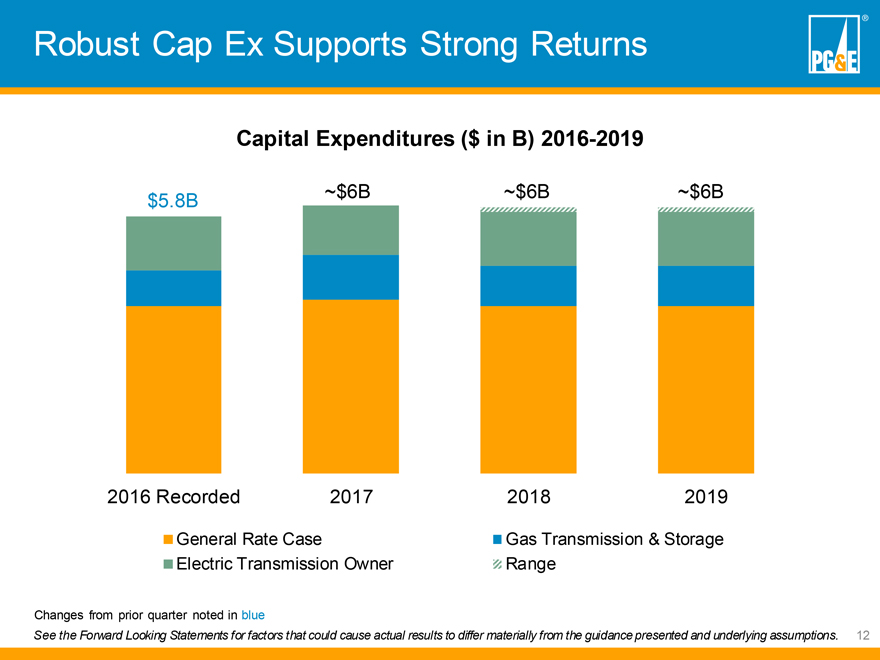
Robust Cap Ex Supports Strong Returns PG&E®
Capital Expenditures ($ in B) 2016-2019
$5.8B ~$6B ~$6B ~$6B
2016 Recorded 2017 2018 2019
General Rate Case
Gas Transmission & Storage
Electric Transmission Owner
Range
Changes from prior quarter noted in blue
See the Forward Looking Statements for factors that could cause actual results to differ materially from the guidance presented and underlying assumptions. 12
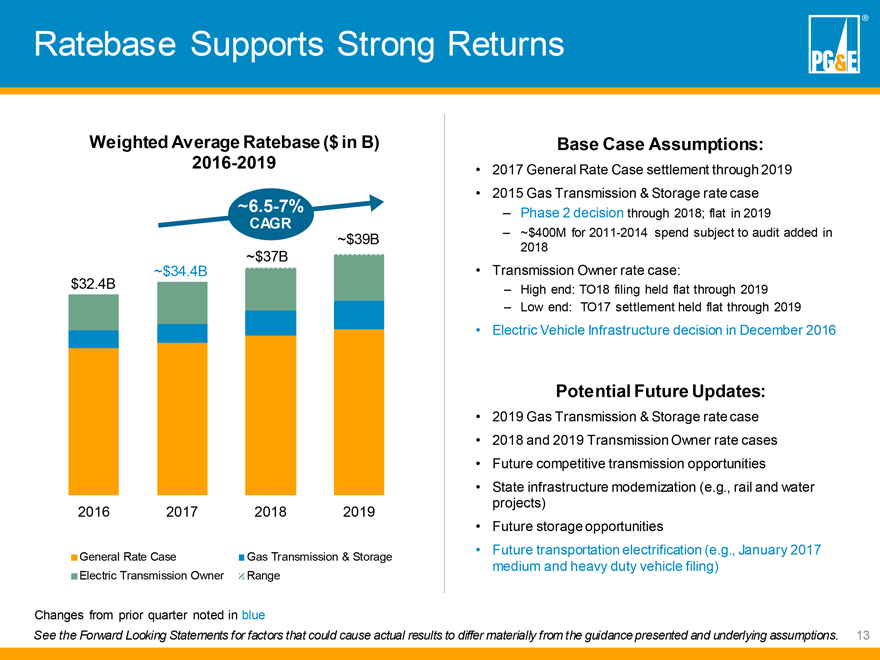
Ratebase Supports Strong Returns Weighted Average Ratebase ($ in B) 2016-2019 ~$39B ~$34.4B ~$37B $32.4B 2016 2017 2018 2019 ~6.5-7% CAGR General Rate Case Gas Transmission & Storage Electric Transmission Owner Range Base Case Assumptions: • 2017 General Rate Case settlement through 2019 • 2015 Gas Transmission & Storage rate case – Phase 2 decision through 2018; flat in 2019 – ~$400M for 2011-2014 spend subject to audit added in 2018 • Transmission Owner rate case: – High end: TO18 filing held flat through 2019 – Low end: TO17 settlement held flat through 2019 • Electric Vehicle Infrastructure decision in December 2016 Potential Future Updates: • 2019 Gas Transmission & Storage rate case • 2018 and 2019 Transmission Owner rate cases • Future competitive transmission opportunities • State infrastructure modernization (e.g., rail and water projects) • Future storage opportunities • Future transportation electrification (e.g., January 2017 medium and heavy duty vehicle filing) Changes from prior quarter noted in blue See the Forward Looking Statements for factors that could cause actual results to differ materially from the guidance presented and underlying assumptions. 13
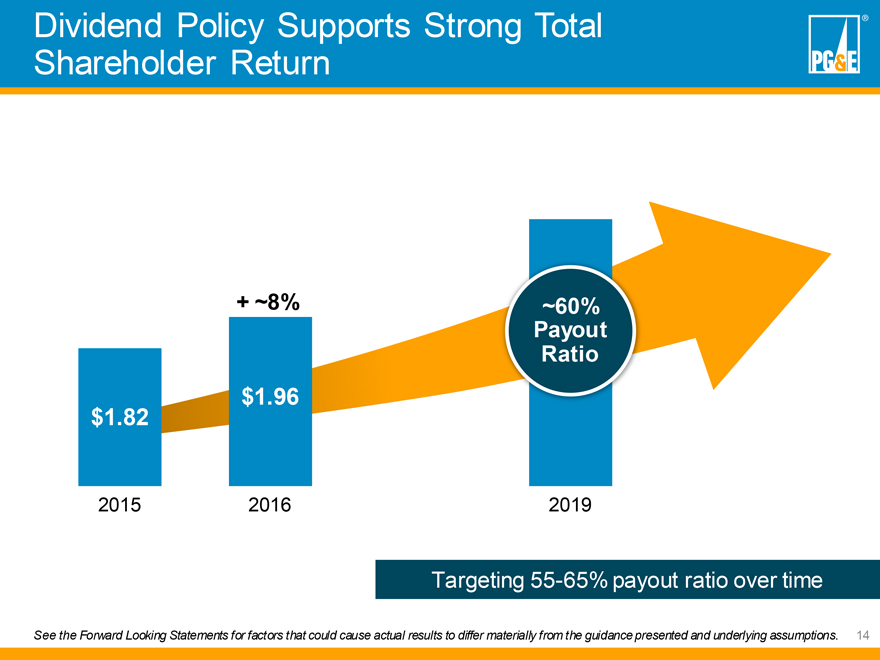
Dividend Policy Supports Strong Total Shareholder Return PG&E®
+ ~8%
~60% Payout Ratio
$1.82
$1.96
2015
2016
2019
Targeting 55-65% payout ratio over time
See the Forward Looking Statements for factors that could cause actual results to differ materially from the guidance presented and underlying assumptions. 14

PG&E PG&E Corporation®
Appendices
Table of Contents PG&E®
Appendix 1:
Guidance
Slide 17
Appendix 2: Supplemental Earnings Materials
Slides 18 – 34
16
APPENDIX 1 – GUIDANCE
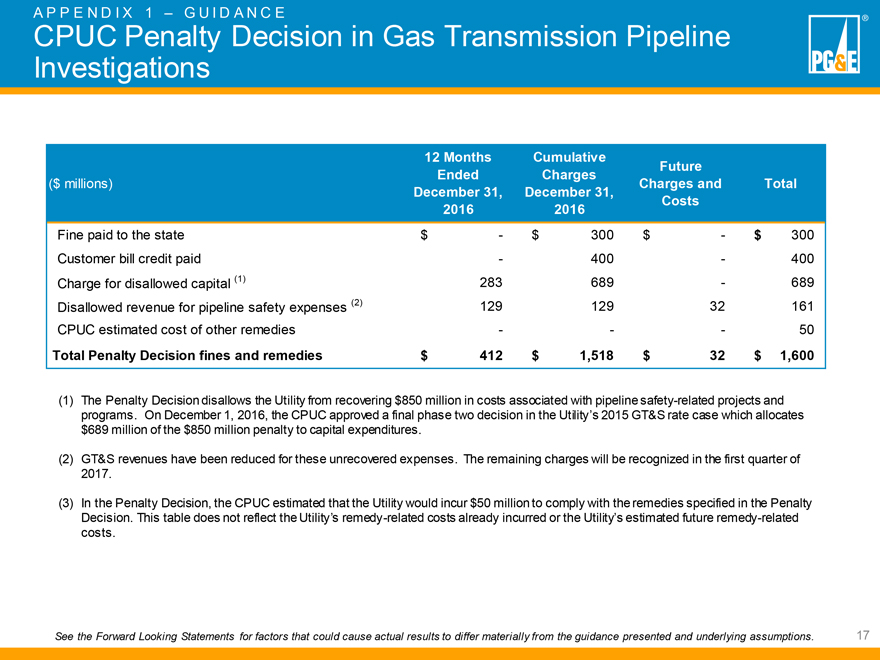
CPUC Penalty
Decision in Gas Transmission Pipeline Investigations PG&E®
($ millions)
12 Months Ended
December 31, 2016
Cumulative Charges December 31, 2016
Future Charges and Costs
Total
Fine paid to the state
$-
$300
$-
$300
Customer bill credit paid
-
400
-
400
Charge for disallowed capital (1)
283
689
-
689
Disallowed revenue for pipeline safety expenses (2)
129
129
32
161
CPUC estimated cost of other remedies
-
-
-
50
Total Penalty Decision fines and remedies
$412
$1,518
$32
$1,600
(1) The Penalty Decision disallows the Utility from recovering $850 million in costs associated with pipeline safety-related projects and programs. On December 1, 2016, the CPUC approved a
final phase two decision in the Utility’s 2015 GT&S rate case which allocates $689 million of the $850 million penalty to capital expenditures.
(2) GT&S
revenues have been reduced for these unrecovered expenses. The remaining charges will be recognized in the first quarter of 2017.
(3) In the Penalty Decision, the CPUC
estimated that the Utility would incur $50 million to comply with the remedies specified in the Penalty Decision. This table does not reflect the Utility’s remedy-related costs already incurred or the Utility’s estimated future
remedy-related costs.
See the Forward Looking Statements for factors that could cause actual results to differ materially from the guidance presented and underlying
assumptions. 17
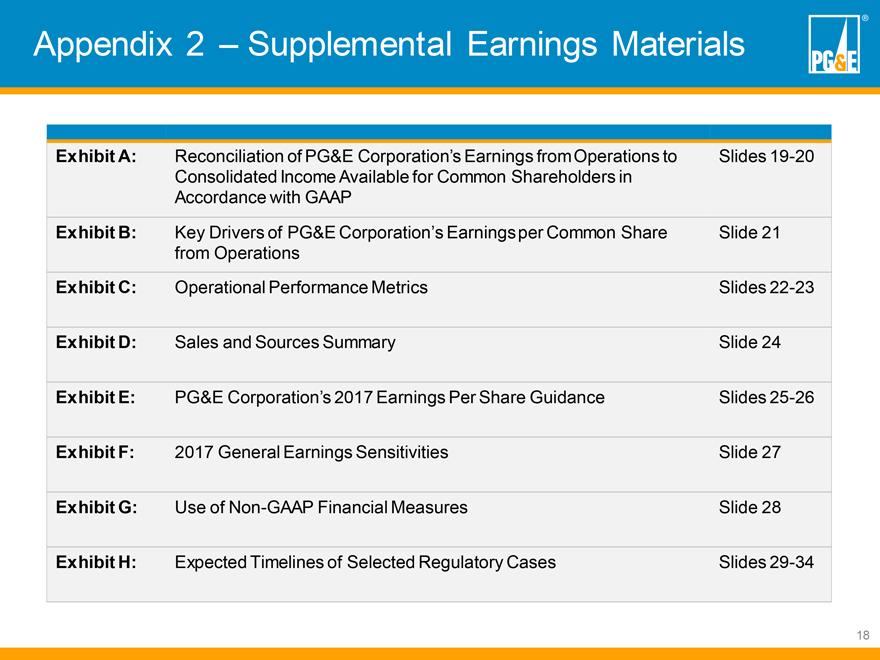
Appendix 2 – Supplemental Earnings Materials PG&E®
Exhibit A: Reconciliation of PG&E Corporation’s Earnings from Operations to Consolidated Income Available for Common Shareholders in Accordance with GAAP Slides 19-20
Exhibit B: Key Drivers of PG&E Corporation’s Earnings per Common Share from Operations Slide 21
Exhibit C: Operational Performance Metrics Slides 22-23
Exhibit D: Sales
and Sources Summary Slide 24
Exhibit E: PG&E Corporation’s 2017 Earnings Per Share Guidance Slides 25-26
Exhibit F: 2017 General Earnings Sensitivities Slide 27
Exhibit G: Use of
Non-GAAP Financial Measures Slide 28
Exhibit H: Expected Timelines of Selected Regulatory Cases Slides
29-34
18
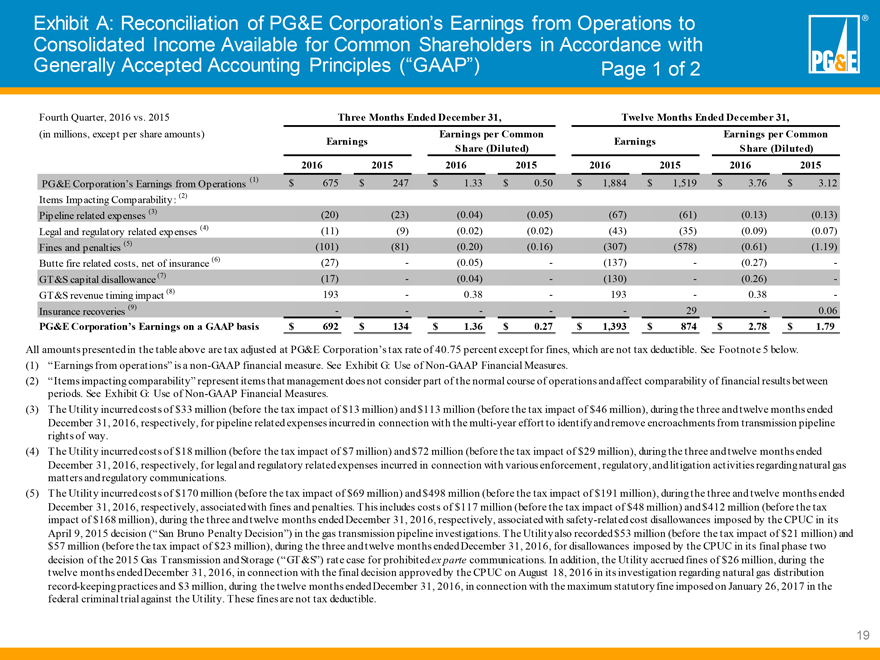
Exhibit A: Reconciliation of PG&E Corporation’s Earnings from Operations to Consolidated Income Available for
Common Shareholders in Accordance with Generally Accepted Accounting Principles (“GAAP”) Page 1 of 2 PG&E®
Fourth Quarter, 2016 vs. 2015 Three Months Ended
December 31, Twelve Months Ended December 31,
(in millions, except per share amounts) Earnings Earnings per Common Share (Diluted) Earnings Earnings per Common
Share (Diluted)
2016 2015 2016 2015 2016 2015 2016 2015
PG&E Corporation’s Earnings from
Operations (1) $675 $247 $1.33 $0.50 $1,884 $1,519 $3.76 $3.12
Items Impacting Comparability: (2)
Pipeline related expenses (3) (20) (23) (0.04) (0.05) (67) (61) (0.13) (0.13)
Legal and
regulatory related expenses (4) (11) (9) (0.02) (0.02) (43) (35) (0.09) (0.07)
Fines and penalties (5) (101) (81) (0.20) (0.16) (307) (578) (0.61) (1.19)
Butte fire related costs, net of insurance (6) (27) - (0.05) - (137) - (0.27) -
GT&S capital disallowance (7)
(17) - (0.04) - (130) - (0.26) -
GT&S revenue timing impact (8) 193 - 0.38 - 193 - 0.38 -
Insurance recoveries (9) - - - - - 29 - 0.06
PG&E Corporation’s Earnings on a GAAP basis
$692 $134 $1.36 $0.27 $1,393 $874 $2.78 $1.79
All amounts presented in the table above are tax adjusted at PG&E Corporation’s tax rate of 40.75 percent except
for fines, which are not tax deductible. See Footnote 5 below.
(1) “Earnings from operations” is a non-GAAP financial
measure. See Exhibit G: Use of Non-GAAP Financial Measures.
(2) “Items impacting comparability” represent items that
management does not consider part of the normal course of operations and affect comparability of financial results between periods. See Exhibit G: Use of Non-GAAP Financial Measures.
(3) The Utility incurred costs of $33 million (before the tax impact of $13 million) and $113 million (before the tax impact of $46 million), during the three and twelve months
ended December 31, 2016, respectively, for pipeline related expenses incurred in connection with the multi-year effort to identify and remove encroachments from transmission pipeline rights of way.
(4) The Utility incurred costs of $18 million (before the tax impact of $7 million) and $72 million (before the tax impact of $29 million), during the three and twelve months ended
December 31, 2016, respectively, for legal and regulatory related expenses incurred in connection with various enforcement, regulatory, and litigation activities regarding natural gas matters and regulatory communications.
(5) The Utility incurred costs of $170 million (before the tax impact of $69 million) and $498 million (before the tax impact of $191 million), during the three and twelve months
ended December 31, 2016, respectively, associated with fines and penalties. This includes costs of $117 million (before the tax impact of $48 million) and $412 million (before the tax impact of $168 million), during the three and
twelve months ended December 31, 2016, respectively, associated with safety-related cost disallowances imposed by the CPUC in its April 9, 2015 decision (“San Bruno Penalty Decision”) in the gas transmission pipeline
investigations. The Utility also recorded $53 million (before the tax impact of $21 million) and $57 million (before the tax impact of $23 million), during the three and twelve months ended December 31, 2016, for disallowances imposed
by the CPUC in its final phase two decision of the 2015 Gas Transmission and Storage (“GT&S”) rate case for prohibited ex parte communications. In addition, the Utility accrued fines of $26 million, during the twelve months ended
December 31, 2016, in connection with the final decision approved by the CPUC on August 18, 2016 in its investigation regarding natural gas distribution record-keeping practices and $3 million, during the twelve months ended
December 31, 2016, in connection with the maximum statutory fine imposed on January 26, 2017 in the federal criminal trial against the Utility. These fines are not tax deductible.
19
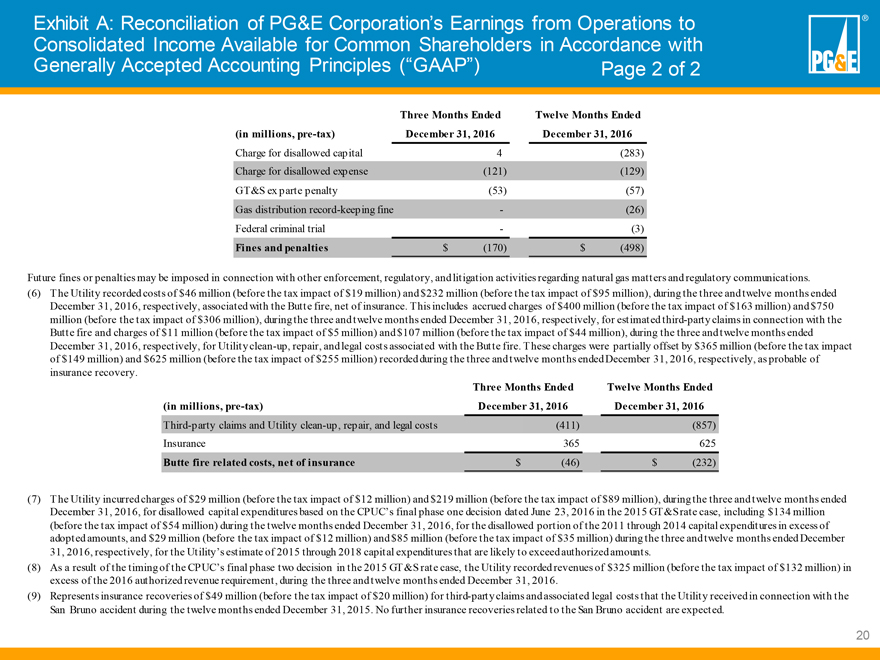
Exhibit A: Reconciliation of PG&E Corporation’s Earnings from Operations to Consolidated Income Available for
Common Shareholders in Accordance with Generally Accepted Accounting Principles (“GAAP”) Page 2 of 2 PG&E®
(in millions,
pre-tax) Three Months Ended December 31, 2016 Twelve Months Ended December 31, 2016
Charge for disallowed capital 4 (283)
Charge for disallowed expense (121) (129)
GT&S ex parte penalty (53) (57)
Gas distribution record-keeping fine - (26)
Federal criminal trial - (3)
Fines and penalties $(170) $(498)
Future fines or penalties may be imposed in connection with other enforcement,
regulatory, and litigation activities regarding natural gas matters and regulatory communications.
(6) The Utility recorded costs of $46 million (before the tax impact
of $19 million) and $232 million (before the tax impact of $95 million), during the three and twelve months ended December 31, 2016, respectively, associated with the Butte fire, net of insurance. This includes accrued charges of
$400 million (before the tax impact of $163 million) and $750 million (before the tax impact of $306 million), during the three and twelve months ended December 31, 2016, respectively, for estimated third-party claims in connection
with the Butte fire and charges of $11 million (before the tax impact of $5 million) and $107 million (before the tax impact of $44 million), during the three and twelve months ended December 31, 2016, respectively, for Utility clean-up, repair, and legal costs associated with the Butte fire. These charges were partially offset by $365 million (before the tax impact of $149 million) and $625 million (before the tax impact of $255
million) recorded during the three and twelve months ended December 31, 2016, respectively, as probable of insurance recovery.
(in millions, pre-tax) Three Months Ended December 31, 2016 Twelve Months Ended December 31, 2016
Third-party claims and Utility clean-up, repair, and legal costs (411) (857)
Insurance 365 625
Butte fire related costs, net of insurance $(46) $(232)
(7) The Utility incurred charges of
$29 million (before the tax impact of $12 million) and $219 million (before the tax impact of $89 million), during the three and twelve months ended December 31, 2016, for disallowed capital expenditures based on the CPUC’s final
phase one decision dated June 23, 2016 in the 2015 GT&S rate case, including $134 million (before the tax impact of $54 million) during the twelve months ended December 31, 2016, for the disallowed portion of the 2011 through 2014
capital expenditures in excess of adopted amounts, and $29 million (before the tax impact of $12 million) and $85 million (before the tax impact of $35 million) during the three and twelve months ended December 31, 2016, respectively,
for the Utility’s estimate of 2015 through 2018 capital expenditures that are likely to exceed authorized amounts.
(8) As a result of the timing of the CPUC’s
final phase two decision in the 2015 GT&S rate case, the Utility recorded revenues of $325 million (before the tax impact of $132 million) in excess of the 2016 authorized revenue requirement, during the three and twelve months ended
December 31, 2016.
(9) Represents insurance recoveries of $49 million (before the tax impact of $20 million) for third-party claims and associated legal costs that
the Utility received in connection with the San Bruno accident during the twelve months ended December 31, 2015. No further insurance recoveries related to the San Bruno accident are expected.
20
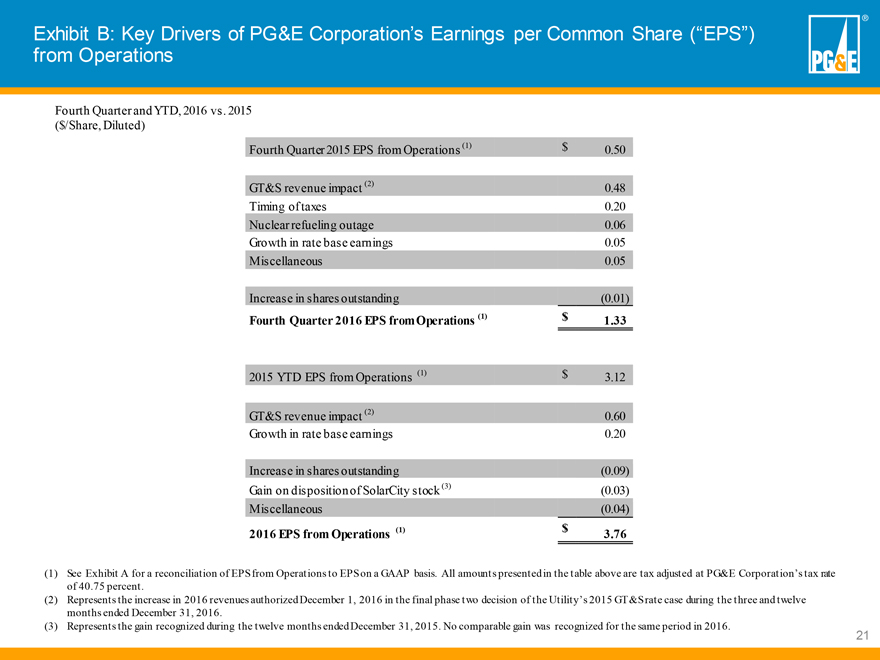
Exhibit B: Key Drivers of PG&E Corporation’s Earnings per Common Share (“EPS”) from Operations
PG&E®
Fourth Quarter and YTD, 2016 vs. 2015
($/Share, Diluted)
Fourth Quarter 2015 EPS from Operations (1) $0.50
GT&S revenue impact (2) 0.48
Timing of taxes 0.20
Nuclear refueling outage 0.06
Growth in rate base earnings 0.05
Miscellaneous 0.05
Increase in shares outstanding (0.01)
Fourth Quarter 2016 EPS from Operations (1) $1.33
2015 YTD EPS from Operations (1) $3.12
GT&S revenue impact (2) 0.60
Growth in rate base earnings 0.20
Increase in shares outstanding (0.09)
Gain on disposition of SolarCity stock (3) (0.03)
Miscellaneous (0.04)
2016 EPS from Operations (1) $3.76
(1) See Exhibit A for a reconciliation of EPS from Operations to EPS on a GAAP
basis. All amounts presented in the table above are tax adjusted at PG&E Corporation’s tax rate of 40.75 percent.
(2) Represents the increase in 2016 revenues
authorized December 1, 2016 in the final phase two decision of the Utility’s 2015 GT&S rate case during the three and twelve months ended December 31, 2016.
(3) Represents the gain recognized during the twelve months ended December 31, 2015. No comparable gain was recognized for the same period in 2016.
21
Exhibit C: Operational Performance Metrics PG&E®
2016 End of Year (EOY) EOY Actual EOY Target Meets YTD Target (1)
Safety (includes both public and employee safety
metrics)
Nuclear Operations Safety
Unit 1 Performance Indicator 100.0 98.7 ✓
Unit 2 Performance Indicator 90.0 98.7 -
Electric Operations Safety
Transmission & Distribution Wires Down (23.3)% 0.0% -
911 Emergency Response 98.3% 97.5% ✓
Gas Operations Safety
Gas In-Line Inspection and Upgrade
Index 0.88 1.00 -
Gas Dig-ins Reduction 2.02 2.03 ✓
Gas Emergency Response 20.0 21.0 ✓
Employee Safety
Lost Workday Case Rate 0.402 0.320 -
Serious Preventable Motor Vehicle Incident Rate 0.280 0.239 -
Timely Reporting of Injuries 67.3% 67.1% ✓
Customer
Customer Satisfaction Score 76.1 75.7 ✓
System Average Interruption Duration Index (SAIDI) 109.0 96.3 -
Financial
Earnings from Operations $1,884 See note (1) See note (1)
See following page for definitions of the operational performance metrics. The operational performance goals set under the PG&E Corporation 2016 Short Term Incentive Plan
(“STIP”) are based on the same operational metrics and targets.
(1) The 2016 target for earnings from operations is not publicly reported but is consistent with
the guidance range provided for 2016 EPS from operations of $3.65 to $3.85. 22
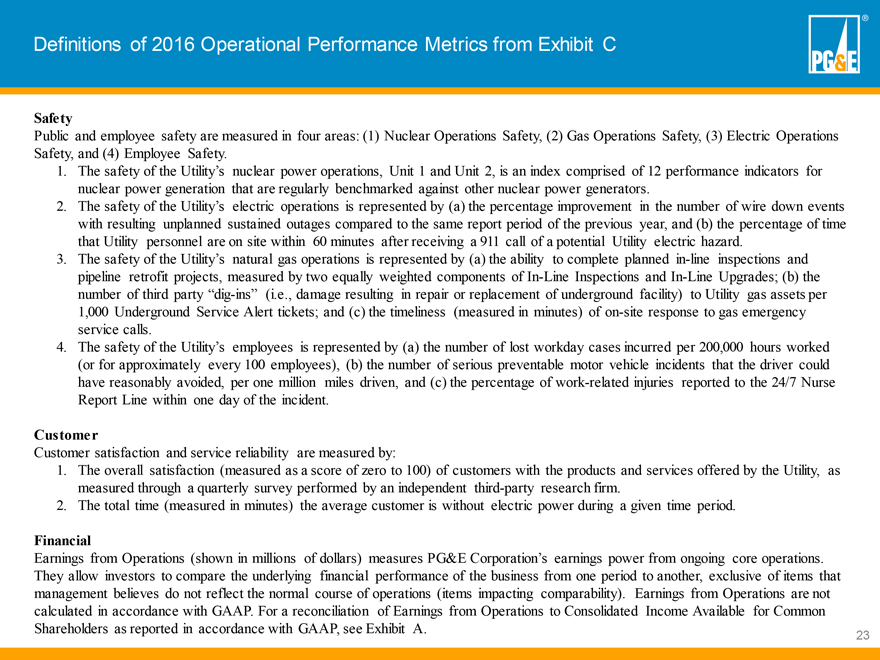
Definitions of 2016 Operational Performance Metrics from Exhibit C PG&E®
Safety
Public and employee safety are measured in four areas: (1) Nuclear Operations Safety, (2) Gas
Operations Safety, (3) Electric Operations Safety, and (4) Employee Safety.
1. The safety of the Utility’s nuclear power operations, Unit 1 and Unit 2, is an
index comprised of 12 performance indicators for nuclear power generation that are regularly benchmarked against other nuclear power generators.
2. The safety of the
Utility’s electric operations is represented by (a) the percentage improvement in the number of wire down events with resulting unplanned sustained outages compared to the same report period of the previous year, and (b) the
percentage of time that Utility personnel are on site within 60 minutes after receiving a 911 call of a potential Utility electric hazard.
3. The safety of the
Utility’s natural gas operations is represented by (a) the ability to complete planned in-line inspections and pipeline retrofit projects, measured by two equally weighted components of In-Line Inspections and In-Line Upgrades; (b) the number of third party “dig-ins” (i.e., damage resulting in repair or
replacement of underground facility) to Utility gas assets per 1,000 Underground Service Alert tickets; and (c) the timeliness (measured in minutes) of on-site response to gas emergency service calls.
4. The safety of the Utility’s employees is represented by (a) the number of lost workday cases incurred per 200,000 hours worked (or for approximately every 100
employees), (b) the number of serious preventable motor vehicle incidents that the driver could have reasonably avoided, per one million miles driven, and (c) the percentage of work-related injuries reported to the 24/7 Nurse Report Line within
one day of the incident.
Customer
Customer satisfaction and service reliability are measured by:
1. The overall satisfaction (measured as a score of zero to 100) of customers with the products and services offered by the Utility, as measured through a quarterly survey
performed by an independent third-party research firm.
2. The total time (measured in minutes) the average customer is without electric power during a given time period.
Financial
Earnings from Operations (shown in millions of dollars) measures PG&E
Corporation’s earnings power from ongoing core operations. They allow investors to compare the underlying financial performance of the business from one period to another, exclusive of items that management believes do not reflect the normal
course of operations (items impacting comparability). Earnings from Operations are not calculated in accordance with GAAP. For a reconciliation of Earnings from Operations to Consolidated Income Available for Common Shareholders as reported in
accordance with GAAP, see Exhibit A.
23
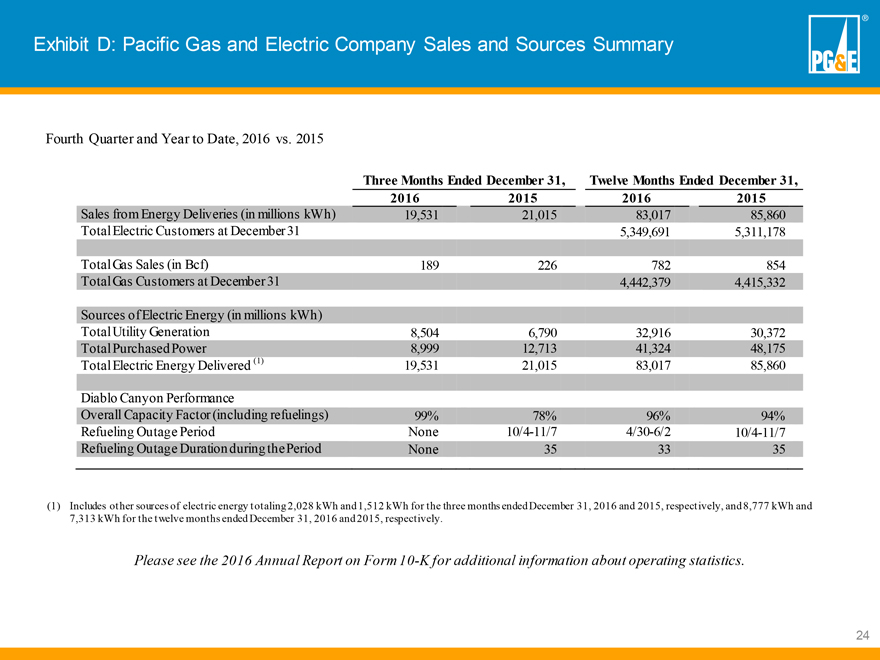
Exhibit D: Pacific Gas and Electric Company Sales and Sources Summary PG&E®
Fourth Quarter and Year to Date, 2016 vs. 2015
Three Months Ended December 31, Twelve Months Ended
December 31,
2016 2015 2016 2015
Sales from Energy Deliveries (in millions kWh) 19,531
21,015 83,017 85,860
Total Electric Customers at December 31 5,349,691 5,311,178
Total Gas
Sales (in Bcf) 189 226 782 854
Total Gas Customers at December 31 4,442,379 4,415,332
Sources of Electric Energy (in millions kWh)
Total Utility Generation 8,504 6,790 32,916 30,372
Total Purchased Power 8,999 12,713 41,324 48,175
Total Electric Energy Delivered (1) 19,531
21,015 83,017 85,860
Diablo Canyon Performance
Overall Capacity Factor (including refuelings) 99%
78% 96% 94%
Refueling Outage Period None 10/4-11/7 4/30-6/2
10/4-11/7
Refueling Outage Duration during the Period None 35 33 35
(1) Includes other sources of electric energy totaling 2,028 kWh and 1,512 kWh for the three months ended December 31, 2016 and 2015, respectively, and 8,777 kWh and 7,313 kWh for the
twelve months ended December 31, 2016 and 2015, respectively.
Please see the 2016 Annual Report on Form 10-K for additional
information about operating statistics.
24
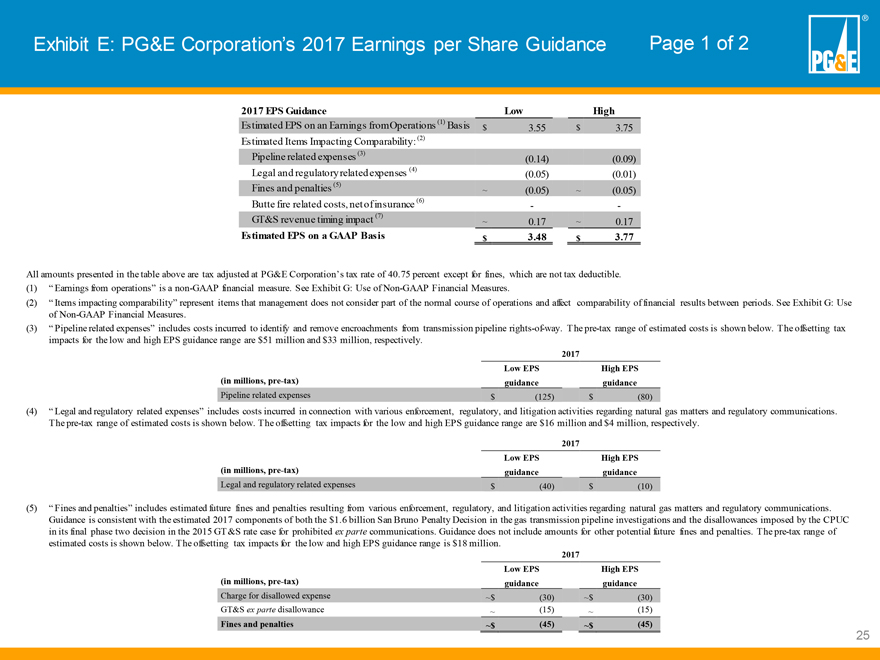
Exhibit E: PG&E Corporation’s 2017 Earnings per Share Guidance Page 1 of 2 PG&E®
2017 EPS Guidance Low High
Estimated EPS on an Earnings from Operations (1) Basis $ 3.55 $3.75
Estimated Items Impacting Comparability: (2)
Pipeline related expenses (3) (0.14) (0.09)
Legal and regulatory related expenses (4) (0.05) (0.01)
Fines and penalties (5) ~ (0.05) ~ (0.05)
Butte fire related costs, net of insurance (6) - -
GT&S revenue timing impact (7) ~ 0.17 ~ 0.17
Estimated EPS on a GAAP Basis $ 3.48 $3.77
All amounts presented in the table above are tax adjusted at PG&E
Corporation’s tax rate of 40.75 percent except for fines, which are not tax deductible.
(1) “Earnings from operations” is a non-GAAP financial measure. See Exhibit G: Use of Non-GAAP Financial Measures.
(2) “Items
impacting comparability” represent items that management does not consider part of the normal course of operations and affect comparability of financial results between periods. See Exhibit G: Use of
Non-GAAP Financial Measures.
(3) “Pipeline related expenses” includes costs incurred to identify and remove encroachments
from transmission pipeline rights-of-way. The pre-tax range of estimated costs is shown below. The offsetting tax impacts for the
low and high EPS guidance range are $51 million and $33 million, respectively.
2017
(in
millions, pre-tax) Low EPS guidance High EPS guidance
Pipeline related expenses $(125) $(80)
(4) “Legal and regulatory related expenses” includes costs incurred in connection with various enforcement, regulatory, and litigation activities regarding natural gas matters and
regulatory communications. The pre-tax range of estimated costs is shown below. The offsetting tax impacts for the low and high EPS guidance range are $16 million and $4 million, respectively.
2017
(in millions, pre-tax) Low EPS guidance High EPS
guidance
Legal and regulatory related expenses $(40) $(10)
(5) “Fines and penalties”
includes estimated future fines and penalties resulting from various enforcement, regulatory, and litigation activities regarding natural gas matters and regulatory communications. Guidance is consistent with the estimated 2017 components of both
the $1.6 billion San Bruno Penalty Decision in the gas transmission pipeline investigations and the disallowances imposed by the CPUC in its final phase two decision in the 2015 GT&S rate case for prohibited ex parte communications.
Guidance does not include amounts for other potential future fines and penalties. The pre-tax range of estimated costs is shown below. The offsetting tax impacts for the low and high EPS guidance range is
$18 million.
2017
(in millions, pre-tax) Low EPS
guidance High EPS guidance
Charge for disallowed expense ~$ (30) ~$ (30)
GT&S ex parte
disallowance ~ (15) ~ (15)
Fines and penalties ~$ (45) ~$ (45)
25
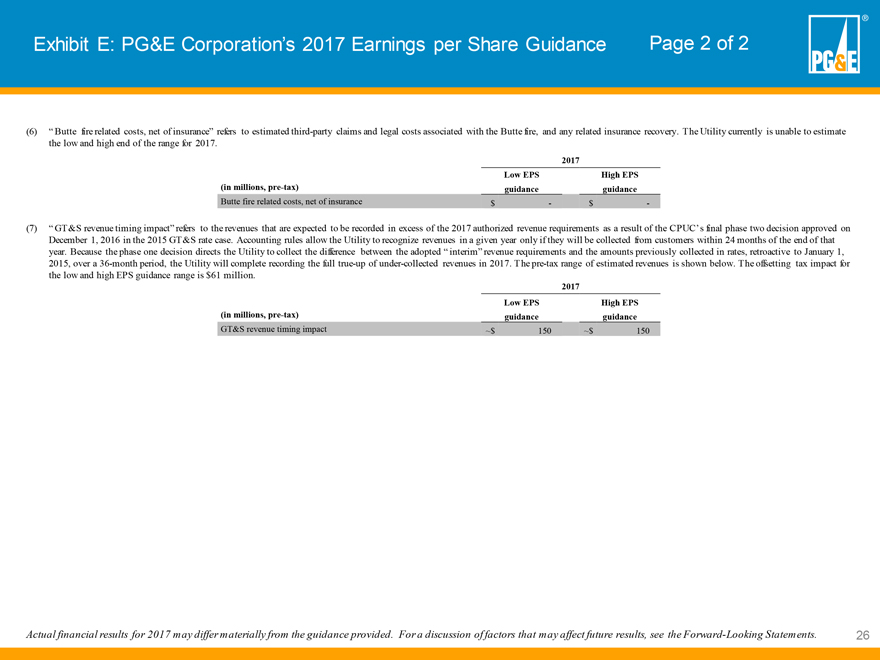
Exhibit E: PG&E Corporation’s 2017 Earnings per Share Guidance Page 2 of 2 PG&E®
(6) “Butte fire related costs, net of insurance” refers to estimated third-party claims and legal costs associated with the Butte fire, and any related insurance recovery. The
Utility currently is unable to estimate the low and high end of the range for 2017.
2017
(in
millions, pre-tax) Low EPS guidance High EPS guidance
Butte fire related costs, net of insurance $ - $ -
(7) “GT&S revenue timing impact” refers to the revenues that are expected to be recorded in excess of the 2017 authorized revenue requirements as a result of the CPUC’s
final phase two decision approved on December 1, 2016 in the 2015 GT&S rate case. Accounting rules allow the Utility to recognize revenues in a given year only if they will be collected from customers within 24 months of the end of that
year. Because the phase one decision directs the Utility to collect the difference between the adopted “ interim” revenue requirements and the amounts previously collected in rates, retroactive to January 1, 2015, over a 36-month period, the Utility will complete recording the full true-up of under-collected revenues in 2017. The pre-tax range of
estimated revenues is shown below. The offsetting tax impact for the low and high EPS guidance range is $61 million.
2017
(in millions, pre-tax) Low EPS guidance High EPS guidance
GT&S revenue
timing impact ~$ 150 ~$ 150
Actual financial results for 2017 may differ materially from the guidance provided. For a discussion of factors that may affect future results,
see the Forward-Looking Statements. 26
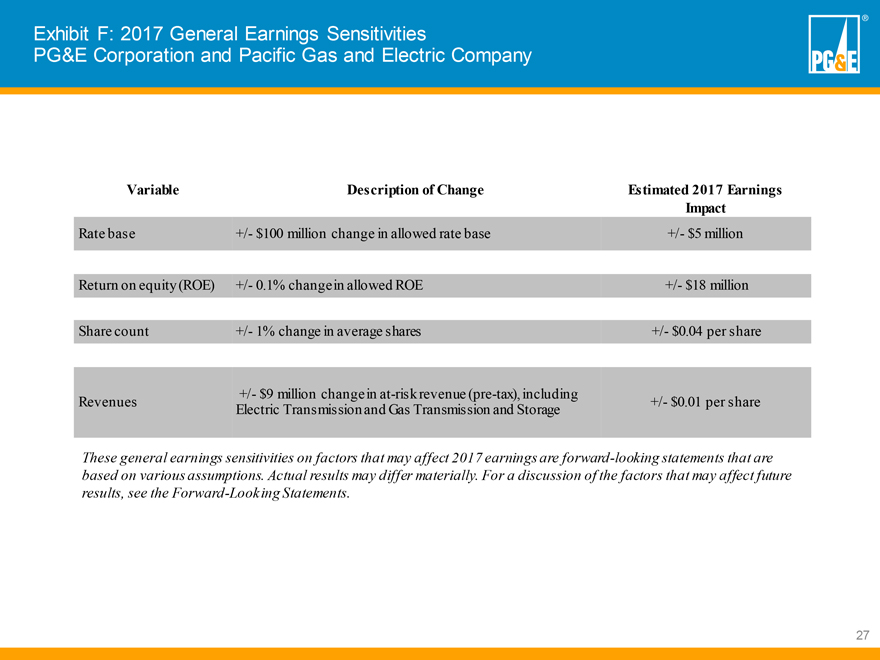
Exhibit F: 2017 General Earnings Sensitivities
PG&E Corporation and Pacific Gas and Electric Company PG&E®
Variable Description
of Change Estimated 2017 Earnings Impact
Rate base +/- $100 million change in allowed rate base +/- $5 million
Return on equity (ROE) +/- 0.1% change in allowed ROE +/- $18 million
Share count +/- 1%
change in average shares +/- $0.04 per share
Revenues +/- $9 million change in at-risk revenue (pre-tax), including Electric Transmission and Gas Transmission and Storage +/- $0.01 per share
These general earnings
sensitivities on factors that may affect 2017 earnings are forward-looking statements that are based on various assumptions. Actual results may differ materially. For a discussion of the factors that may affect future results, see the
Forward-Looking Statements.
27
Exhibit G: Use of Non-GAAP Financial Measures PG&E®
PG&E Corporation and Pacific Gas and Electric Company: Use of Non-GAAP Financial Measures
PG&E Corporation discloses historical financial results and provides guidance based on “earnings from operations” in order to provide a measure that allows investors
to compare the underlying financial performance of the business from one period to another, exclusive of items impacting comparability.
“Earnings from
operations” is a non-GAAP financial measure and is calculated as income available for common shareholders less items impacting comparability. “Items impacting comparability” represent items that
management does not consider part of the normal course of operations and affect comparability of financial results between periods, including certain pipeline related expenses, certain legal and regulatory related expenses, fines and penalties,
Butte fire related costs, impacts of the 2015 GT&S rate case, and insurance recoveries for natural gas matters. PG&E Corporation uses earnings from operations to understand and compare operating results across reporting periods for various
purposes including internal budgeting and forecasting, short- and long-term operating planning, and employee incentive compensation. PG&E Corporation believes that earnings from operations provide additional insight into the underlying trends of
the business allowing for a better comparison against historical results and expectations for future performance.
Earnings from operations are not a substitute or
alternative for GAAP measures such as consolidated income available for common shareholders and may not be comparable to similarly titled measures used by other companies.
28
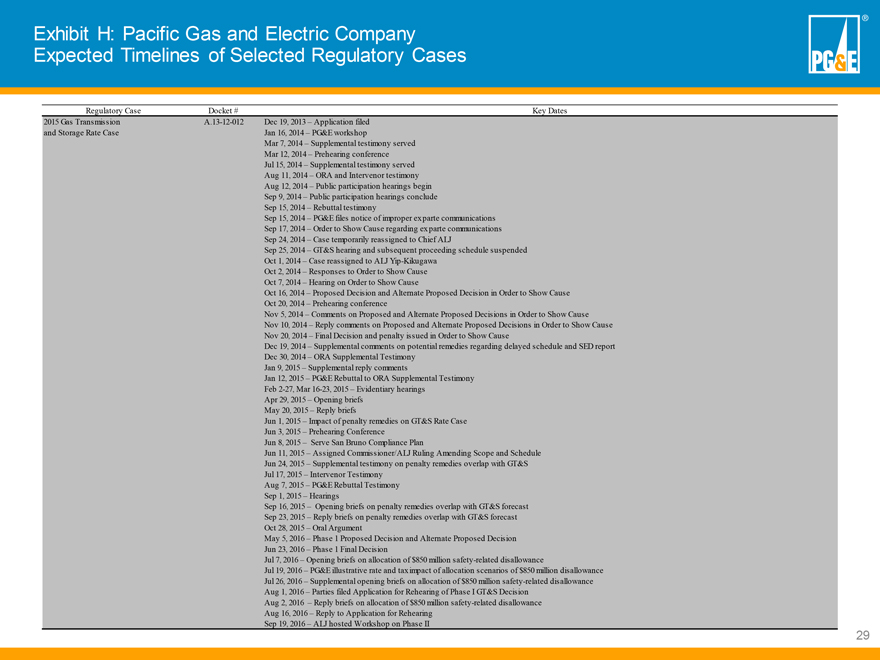
Exhibit H: Pacific Gas and Electric Company
Expected Timelines of Selected Regulatory Cases PG&E®
Regulatory Case Docket # Key
Dates
2015 Gas Transmission A.13-12-012 Dec 19, 2013 – Application filed
and Storage Rate Case Jan 16, 2014 – PG&E workshop
Mar 7, 2014
– Supplemental testimony served
Mar 12, 2014 – Prehearing conference
Jul 15, 2014 – Supplemental testimony served
Aug 11, 2014 – ORA and
Intervenor testimony
Aug 12, 2014 – Public participation hearings begin
Sep 9, 2014 – Public participation hearings conclude
Sep 15, 2014 –
Rebuttal testimony
Sep 15, 2014 – PG&E files notice of improper ex parte communications
Sep 17, 2014 – Order to Show Cause regarding ex parte communications
Sep 24, 2014 –
Case temporarily reassigned to Chief ALJ
Sep 25, 2014 – GT&S hearing and subsequent proceeding schedule suspended
Oct 1, 2014 – Case reassigned to ALJ Yip-Kikugawa
Oct 2, 2014 – Responses to Order to Show Cause
Oct 7, 2014 –
Hearing on Order to Show Cause
Oct 16, 2014 – Proposed Decision and Alternate Proposed Decision in Order to Show Cause
Oct 20, 2014 – Prehearing conference
Nov 5, 2014 – Comments on Proposed and
Alternate Proposed Decisions in Order to Show Cause
Nov 10, 2014 – Reply comments on Proposed and Alternate Proposed Decisions in Order to Show Cause
Nov 20, 2014 – Final Decision and penalty issued in Order to Show Cause
Dec 19, 2014 – Supplemental comments on potential remedies regarding delayed schedule and SED report
Dec 30, 2014 – ORA Supplemental Testimony
Jan 9, 2015 – Supplemental reply comments
Jan 12, 2015 – PG&E Rebuttal to ORA Supplemental Testimony
Feb 2-27, Mar 16-23, 2015 – Evidentiary hearings
Apr 29, 2015 – Opening briefs
May 20, 2015 – Reply briefs
Jun 1, 2015 – Impact of penalty
remedies on GT&S Rate Case
Jun 3, 2015 – Prehearing Conference
Jun
8, 2015 – Serve San Bruno Compliance Plan
Jun 11, 2015 – Assigned Commissioner/ALJ Ruling Amending Scope and Schedule
Jun 24, 2015 – Supplemental testimony on penalty remedies overlap with GT&S
Jul 17,
2015 – Intervenor Testimony
Aug 7, 2015 – PG&E Rebuttal Testimony
Sep 1, 2015 – Hearings
Sep 16, 2015 – Opening briefs on penalty
remedies overlap with GT&S forecast
Sep 23, 2015 – Reply briefs on penalty remedies overlap with GT&S forecast
Oct 28, 2015 – Oral Argument
May 5, 2016 – Phase 1 Proposed Decision and
Alternate Proposed Decision
Jun 23, 2016 – Phase 1 Final Decision
Jul 7,
2016 – Opening briefs on allocation of $850 million safety-related disallowance
Jul 19, 2016 – PG&E illustrative rate and tax impact of
allocation scenarios of $850 million disallowance
Jul 26, 2016 – Supplemental opening briefs on allocation of $850 million safety-related
disallowance
Aug 1, 2016 – Parties filed Application for Rehearing of Phase I GT&S Decision
Aug 2, 2016 – Reply briefs on allocation of $850 million safety-related disallowance
Aug 16, 2016 – Reply to Application for Rehearing
Sep 19, 2016 –
ALJ hosted Workshop on Phase II
29
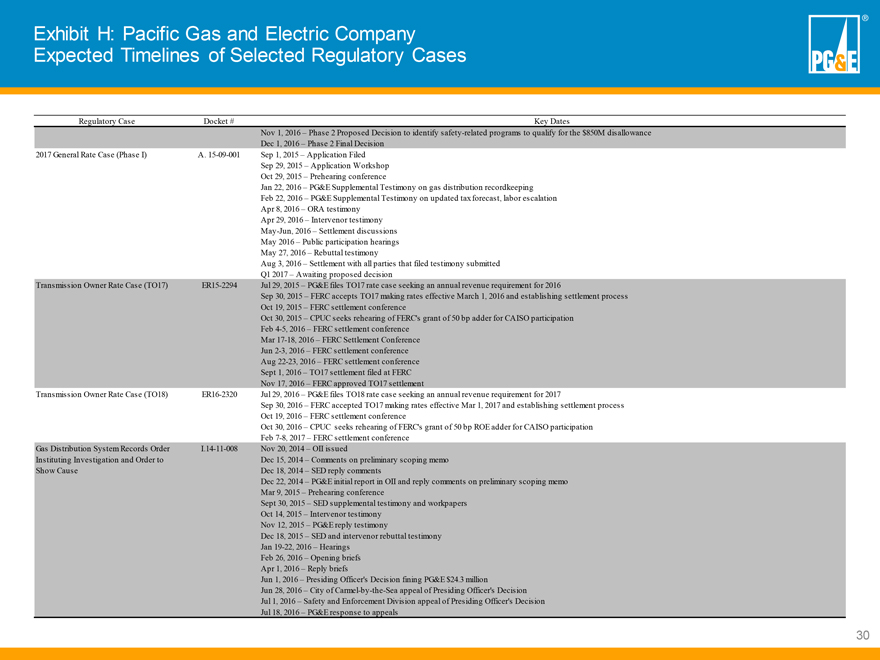
Exhibit H: Pacific Gas and Electric Company
Expected Timelines of Selected Regulatory Cases PG&E®
Regulatory Case Docket # Key
Dates
Nov 1, 2016 – Phase 2 Proposed Decision to identify safety-related programs to qualify for the $850M disallowance
Dec 1, 2016 – Phase 2 Final Decision
2017 General Rate Case (Phase I) A. 15-09-001 Sep 1, 2015 – Application Filed
Sep 29, 2015 – Application Workshop
Oct 29, 2015 – Prehearing conference
Jan 22, 2016 – PG&E
Supplemental Testimony on gas distribution recordkeeping
Feb 22, 2016 – PG&E Supplemental Testimony on updated tax forecast, labor escalation
Apr 8, 2016 – ORA testimony
Apr 29, 2016 – Intervenor testimony
May-Jun, 2016 – Settlement discussions
May 2016
– Public participation hearings
May 27, 2016 – Rebuttal testimony
Aug 3, 2016 – Settlement with all parties that filed testimony submitted
Q1 2017 –
Awaiting proposed decision
Transmission Owner Rate Case (TO17) ER15-2294 Jul 29, 2015 – PG&E files TO17 rate case seeking an annual revenue requirement
for 2016
Sep 30, 2015 – FERC accepts TO17 making rates effective March 1, 2016 and establishing settlement process
Oct 19, 2015 – FERC settlement conference
Oct 30, 2015 – CPUC seeks rehearing of
FERC’s grant of 50 bp adder for CAISO participation
Feb 4-5, 2016 – FERC settlement conference
Mar 17-18, 2016 – FERC Settlement Conference
Jun 2-3, 2016 – FERC settlement conference
Aug 22-23, 2016 – FERC settlement
conference
Sept 1, 2016 – TO17 settlement filed at FERC
Nov 17, 2016
– FERC approved TO17 settlement
Transmission Owner Rate Case (TO18) ER16-2320 Jul 29, 2016 – PG&E files TO18 rate case seeking an annual revenue
requirement for 2017
Sep 30, 2016 – FERC accepted TO17 making rates effective Mar 1, 2017 and establishing settlement process
Oct 19, 2016 – FERC settlement conference
Oct 30, 2016 – CPUC seeks rehearing of
FERC’s grant of 50 bp ROE adder for CAISO participation
Feb 7-8, 2017 – FERC settlement conference
Gas Distribution System Records Order I.14-11-008 Nov 20, 2014 – OII issued
Instituting Investigation and Order to Dec 15, 2014 – Comments on preliminary scoping memo
Show Cause Dec 18, 2014 – SED reply comments
Dec 22, 2014 –
PG&E initial report in OII and reply comments on preliminary scoping memo
Mar 9, 2015 – Prehearing conference
Sept 30, 2015 – SED supplemental testimony and workpapers
Oct 14, 2015 – Intervenor
testimony
Nov 12, 2015 – PG&E reply testimony
Dec 18, 2015 –
SED and intervenor rebuttal testimony
Jan 19-22, 2016 – Hearings
Feb 26, 2016 – Opening briefs
Apr 1, 2016 – Reply briefs
Jun 1, 2016 – Presiding Officer’s Decision fining PG&E $24.3 million
Jun
28, 2016 – City of Carmel-by-the-Sea appeal of Presiding Officer’s Decision
Jul 1, 2016 – Safety and Enforcement Division appeal of Presiding Officer’s Decision
Jul 18, 2016 – PG&E response to appeals
30
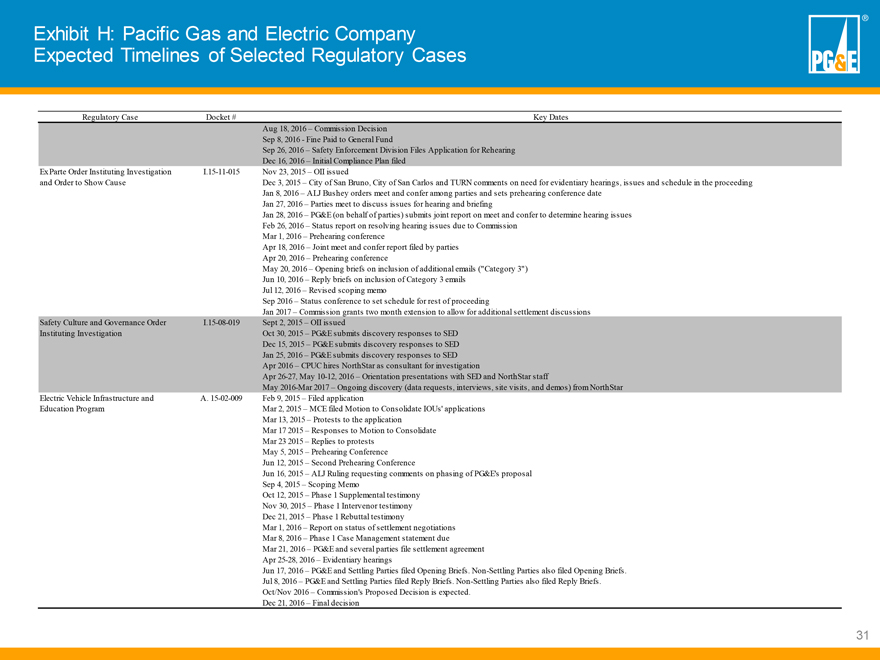
Exhibit H: Pacific Gas and Electric Company
Expected Timelines of Selected Regulatory Cases PG&E®
Regulatory Case Docket # Key
Dates
Aug 18, 2016 – Commission Decision
Sep 8, 2016 - Fine Paid to
General Fund
Sep 26, 2016 – Safety Enforcement Division Files Application for Rehearing
Dec 16, 2016 – Initial Compliance Plan filed
Ex Parte Order Instituting Investigation and
Order to Show Cause I.15-11-015 Nov 23, 2015 – OII issued
Dec 3, 2015 –
City of San Bruno, City of San Carlos and TURN comments on need for evidentiary hearings, issues and schedule in the proceeding
Jan 8, 2016 – ALJ Bushey
orders meet and confer among parties and sets prehearing conference date
Jan 27, 2016 – Parties meet to discuss issues for hearing and briefing
Jan 28, 2016 – PG&E (on behalf of parties) submits joint report on meet and confer to determine hearing issues
Feb 26, 2016 – Status report on resolving hearing issues due to Commission
Mar 1, 2016
– Prehearing conference
Apr 18, 2016 – Joint meet and confer report filed by parties
Apr 20, 2016 – Prehearing conference
May 20, 2016 – Opening briefs on inclusion
of additional emails (“Category 3”)
Jun 10, 2016 – Reply briefs on inclusion of Category 3 emails
Jul 12, 2016 – Revised scoping memo
Sep 2016 – Status conference to set schedule for
rest of proceeding
Jan 2017 – Commission grants two month extension to allow for additional settlement discussions
Safety Culture and Governance Order Instituting Investigation I.15-08-019 Sept 2, 2015 – OII
issued
Oct 30, 2015 – PG&E submits discovery responses to SED
Dec
15, 2015 – PG&E submits discovery responses to SED
Jan 25, 2016 – PG&E submits discovery responses to SED
Apr 2016 – CPUC hires NorthStar as consultant for investigation
Apr 26-27, May 10-12, 2016 – Orientation presentations with SED and NorthStar staff
May 2016-Mar 2017 – Ongoing discovery (data requests, interviews, site visits, and demos) from NorthStar
Electric Vehicle
Infrastructure and Education Program A. 15-02-009 Feb 9, 2015 – Filed application
Mar 2, 2015 – MCE filed Motion to Consolidate IOUs’ applications
Mar 13, 2015 –
Protests to the application
Mar 17 2015 – Responses to Motion to Consolidate
Mar 23 2015 – Replies to protests
May 5, 2015 – Prehearing Conference
Jun 12, 2015 – Second Prehearing Conference
Jun 16, 2015 – ALJ
Ruling requesting comments on phasing of PG&E’s proposal
Sep 4, 2015 – Scoping Memo
Oct 12, 2015 – Phase 1 Supplemental testimony
Nov 30, 2015 – Phase 1 Intervenor
testimony
Dec 21, 2015 – Phase 1 Rebuttal testimony
Mar 1, 2016 –
Report on status of settlement negotiations
Mar 8, 2016 – Phase 1 Case Management statement due
Mar 21, 2016 – PG&E and several parties file settlement agreement
Apr 25-28, 2016 – Evidentiary hearings
Jun 17, 2016 – PG&E and Settling Parties filed Opening Briefs. Non-Settling Parties also filed Opening Briefs.
Jul 8, 2016 – PG&E and Settling Parties filed Reply Briefs. Non-Settling Parties also filed Reply Briefs.
Oct/Nov 2016 – Commission’s Proposed Decision is expected.
Dec 21, 2016 – Final decision
31
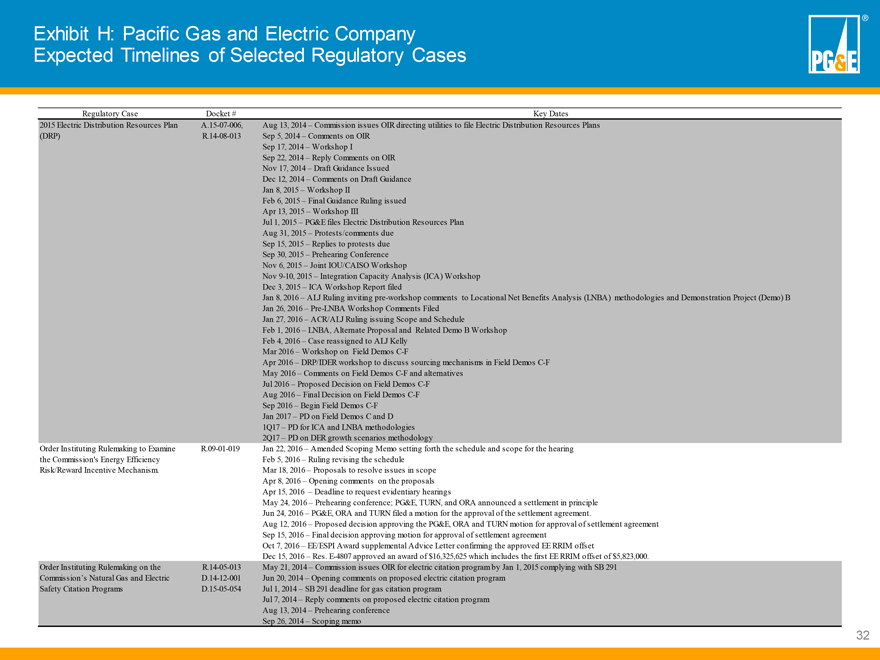
Exhibit H: Pacific Gas and Electric Company
Expected Timelines of Selected Regulatory Cases PG&E®
Regulatory Case Docket # Key
Dates
2015 Electric Distribution Resources Plan (DRP) A.15-07-006, Aug 13, 2014
– Commission issues OIR directing utilities to file Electric Distribution Resources Plans
R.14-08-013 Sep 5, 2014 – Comments on OIR
Sep 17, 2014 – Workshop I
Sep 22, 2014 – Reply Comments on OIR
Nov 17, 2014 – Draft Guidance Issued
Dec 12, 2014 – Comments on Draft Guidance
Jan 8, 2015 – Workshop II
Feb 6, 2015 – Final Guidance Ruling
issued
Apr 13, 2015 – Workshop III
Jul 1, 2015 – PG&E files
Electric Distribution Resources Plan
Aug 31, 2015 – Protests/comments due
Sep 15, 2015 – Replies to protests due
Sep 30, 2015 – Prehearing
Conference
Nov 6, 2015 – Joint IOU/CAISO Workshop
Nov 9-10, 2015 – Integration Capacity Analysis (ICA) Workshop
Dec 3, 2015 – ICA Workshop Report filed
Jan 8, 2016 – ALJ Ruling inviting pre-workshop comments to Locational Net Benefits Analysis (LNBA) methodologies and Demonstration
Project (Demo) B
Jan 26, 2016 – Pre-LNBA Workshop Comments Filed
Jan 27, 2016 – ACR/ALJ Ruling issuing Scope and Schedule
Feb 1, 2016 – LNBA,
Alternate Proposal and Related Demo B Workshop
Feb 4, 2016 – Case reassigned to ALJ Kelly
Mar 2016 – Workshop on Field Demos C-F
Apr 2016
– DRP/IDER workshop to discuss sourcing mechanisms in Field Demos C-F
May 2016 – Comments on Field Demos C-F and alternatives
Jul 2016 – Proposed Decision on Field Demos C-F
Aug 2016 – Final Decision on Field Demos C-F
Sep
2016 – Begin Field Demos C-F
Jan 2017 – PD on Field Demos C and D
1Q17 – PD for ICA and LNBA methodologies
2Q17 – PD on DER growth scenarios
methodology
Order Instituting Rulemaking to Examine the Commission’s Energy Efficiency Risk/Reward Incentive Mechanism. R.09-01-019 Jan 22, 2016 – Amended Scoping Memo setting forth the schedule and scope for the hearing
Feb 5, 2016
– Ruling revising the schedule
Mar 18, 2016 – Proposals to resolve issues in scope
Apr 8, 2016 – Opening comments on the proposals
Apr 15, 2016 – Deadline to request
evidentiary hearings
May 24, 2016 – Prehearing conference; PG&E, TURN, and ORA announced a settlement in principle
Jun 24, 2016 – PG&E, ORA and TURN filed a motion for the approval of the settlement agreement.
Aug 12, 2016 – Proposed decision approving the PG&E, ORA and TURN motion for approval of settlement agreement
Sep 15, 2016 – Final decision approving motion for approval of settlement agreement
Oct
7, 2016 – EE/ESPI Award supplemental Advice Letter confirming the approved EE RRIM offset
Dec 15, 2016 – Res.
E-4807 approved an award of $16,325,625 which includes the first EE RRIM offset of $5,823,000.
Order Instituting Rulemaking
on the Commission’s Natural Gas and Electric Safety Citation Programs R.14-05-013 May 21, 2014 – Commission issues OIR for electric citation program by
Jan 1, 2015 complying with SB 291
D.14-12-001 Jun 20, 2014 – Opening comments
on proposed electric citation program
D.15-05-054 Jul 1, 2014 – SB 291
deadline for gas citation program
Jul 7, 2014 – Reply comments on proposed electric citation program
Aug 13, 2014 – Prehearing conference
Sep 26, 2014 – Scoping memo
32
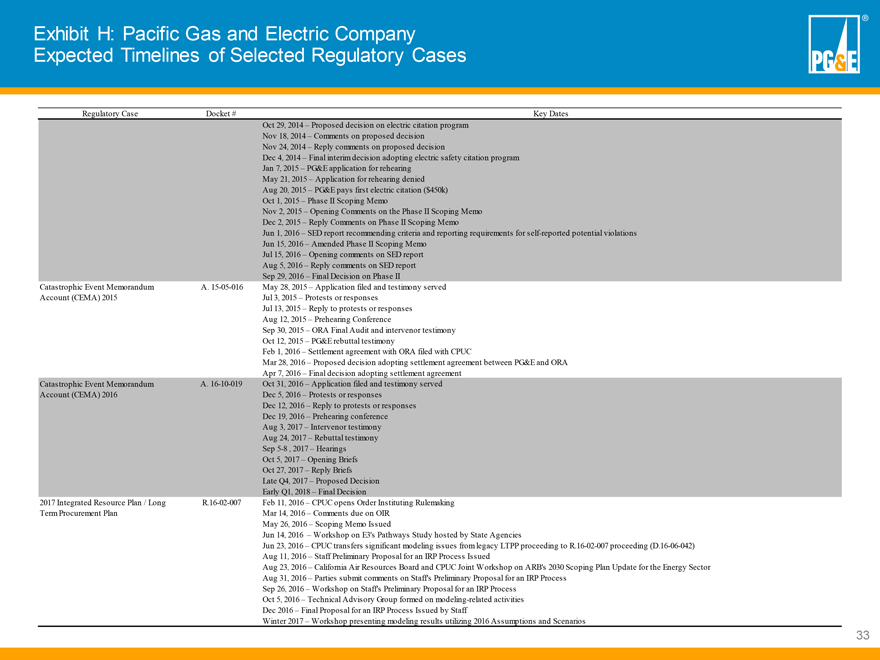
Exhibit H: Pacific Gas and Electric Company
Expected Timelines of Selected Regulatory Cases PG&E®
Regulatory Case Docket # Key
Dates
Oct 29, 2014 – Proposed decision on electric citation program
Nov
18, 2014 – Comments on proposed decision
Nov 24, 2014 – Reply comments on proposed decision
Dec 4, 2014 – Final interim decision adopting electric safety citation program
Jan 7,
2015 – PG&E application for rehearing
May 21, 2015 – Application for rehearing denied
Aug 20, 2015 – PG&E pays first electric citation ($450k)
Oct 1, 2015 – Phase II
Scoping Memo
Nov 2, 2015 – Opening Comments on the Phase II Scoping Memo
Dec 2, 2015 – Reply Comments on Phase II Scoping Memo
Jun 1, 2016 –
SED report recommending criteria and reporting requirements for self-reported potential violations
Jun 15, 2016 – Amended Phase II Scoping Memo
Jul 15, 2016 – Opening comments on SED report
Aug 5, 2016 – Reply comments on SED
report
Sep 29, 2016 – Final Decision on Phase II
Catastrophic Event
Memorandum Account (CEMA) 2015 A. 15-05-016 May 28, 2015 – Application filed and testimony served
Jul 3, 2015 – Protests or responses
Jul 13, 2015 – Reply to protests or responses
Aug 12, 2015 – Prehearing Conference
Sep 30, 2015 – ORA Final Audit
and intervenor testimony
Oct 12, 2015 – PG&E rebuttal testimony
Feb
1, 2016 – Settlement agreement with ORA filed with CPUC
Mar 28, 2016 – Proposed decision adopting settlement agreement between PG&E and ORA
Apr 7, 2016 – Final decision adopting settlement agreement
Catastrophic
Event Memorandum Account (CEMA) 2016 A. 16-10-019 Oct 31, 2016 – Application filed and testimony served
Dec 5, 2016 – Protests or responses
Dec 12, 2016 – Reply to protests or responses
Dec 19, 2016 – Prehearing conference
Aug 3, 2017 – Intervenor
testimony
Aug 24, 2017 – Rebuttal testimony
Sep 5-8 , 2017 – Hearings
Oct 5, 2017 – Opening Briefs
Oct 27, 2017 – Reply Briefs
Late Q4, 2017 – Proposed Decision
Early Q1, 2018 – Final Decision
2017 Integrated Resource Plan / Long Term Procurement
Plan R.16-02-007 Feb 11, 2016 – CPUC opens Order Instituting Rulemaking
Mar
14, 2016 – Comments due on OIR
May 26, 2016 – Scoping Memo Issued
Jun 14, 2016 – Workshop on E3’s Pathways Study hosted by State Agencies
Jun 23, 2016
– CPUC transfers significant modeling issues from legacy LTPP proceeding to R.16-02-007 proceeding
(D.16-06-042)
Aug 11, 2016 – Staff Preliminary Proposal for an IRP Process
Issued
Aug 23, 2016 – California Air Resources Board and CPUC Joint Workshop on ARB’s 2030 Scoping Plan Update for the Energy Sector
Aug 31, 2016 – Parties submit comments on Staff’s Preliminary Proposal for an IRP Process
Sep 26, 2016 – Workshop on Staff’s Preliminary Proposal for an IRP Process
Oct 5,
2016 – Technical Advisory Group formed on modeling-related activities
Dec 2016 – Final Proposal for an IRP Process Issued by Staff
Winter 2017 – Workshop presenting modeling results utilizing 2016 Assumptions and Scenarios
33
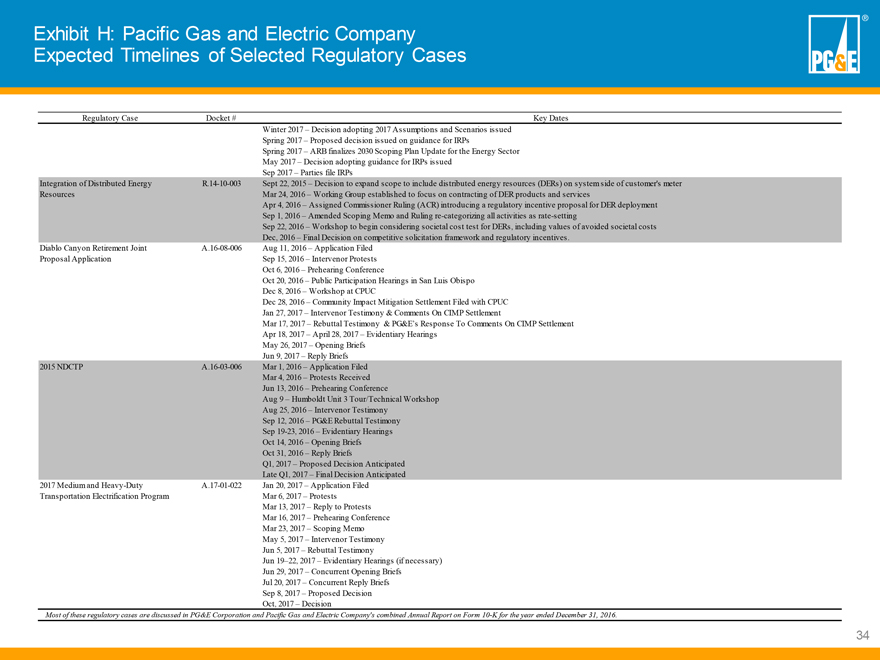
Exhibit H: Pacific Gas and Electric Company Expected Timelines of Selected Regulatory Cases Regulatory Case Integration of Distributed Energy Resources Diablo Canyon Retirement Joint Proposal Application 2015 NDCTP 2017 Medium and Heavy-Duty Transportation Electrification Program Docket # R.14-10-003 A.16-08-006 A.16-03-006 A.17-01-022 Key Dates Winter 2017 – Decision adopting 2017 Assumptions and Scenarios issued Spring 2017 – Proposed decision issued on guidance for IRPs Spring 2017 – ARB finalizes 2030 Scoping Plan Update for the Energy Sector May 2017 – Decision adopting guidance for IRPs issued Sep 2017 – Parties file IRPs Sept 22, 2015 – Decision to expand scope to include distributed energy resources (DERs) on system side of customer’s meter Mar 24, 2016 – Working Group established to focus on contracting of DER products and services Apr 4, 2016 – Assigned Commissioner Ruling (ACR) introducing a regulatory incentive proposal for DER deployment Sep 1, 2016 – Amended Scoping Memo and Ruling re-categorizing all activities as rate-setting Sep 22, 2016 – Workshop to begin considering societal cost test for DERs, including values of avoided societal costs Dec, 2016 – Final Decision on competitive solicitation framework and regulatory incentives. Aug 11, 2016 – Application Filed Sep 15, 2016 – Intervenor Protests Oct 6, 2016 – Prehearing Conference Oct 20, 2016 – Public Participation Hearings in San Luis Obispo Dec 8, 2016 – Workshop at CPUC Dec 28, 2016 – Community Impact Mitigation Settlement Filed with CPUC Jan 27, 2017 – Intervenor Testimony & Comments On CIMP Settlement Mar 17, 2017 – Rebuttal Testimony & PG&E’s Response To Comments On CIMP Settlement Apr 18, 2017 – April 28, 2017 – Evidentiary Hearings May 26, 2017 – Opening Briefs Jun 9, 2017 – Reply Briefs Mar 1, 2016 – Application Filed Mar 4, 2016 – Protests Received Jun 13, 2016 – Prehearing Conference Aug 9 – Humboldt Unit 3 Tour/Technical Workshop Aug 25, 2016 – Intervenor Testimony Sep 12, 2016 – PG&E Rebuttal Testimony Sep 19-23, 2016 – Evidentiary Hearings Oct 14, 2016 – Opening Briefs Oct 31, 2016 – Reply Briefs Q1, 2017 – Proposed Decision Anticipated Late Q1, 2017 – Final Decision Anticipated Jan 20, 2017 – Application Filed Mar 6, 2017 – Protests Mar 13, 2017 – Reply to Protests Mar 16, 2017 – Prehearing Conference Mar 23, 2017 – Scoping Memo May 5, 2017 – Intervenor Testimony Jun 5, 2017 – Rebuttal Testimony Jun 19–22, 2017 – Evidentiary Hearings (if necessary) Jun 29, 2017 – Concurrent Opening Briefs Jul 20, 2017 – Concurrent Reply Briefs Sep 8, 2017 – Proposed Decision Oct, 2017 – Decision Oct, 2017 – Decision Most of these regulatory cases are discussed in PG&E Corporation and Pacific Gas and Electric Company’s combined Annual Report on Form 10-K for the year ended December 31, 2016. 34