Attached files
| file | filename |
|---|---|
| EX-99.1 - EX-99.1 - TripAdvisor, Inc. | trip-ex991_6.htm |
| 8-K - FORM 8-K - TripAdvisor, Inc. | trip-8k_20170215.htm |
Exhibit 99.2

TripAdvisor, Inc. Q4 2016 Prepared Remarks
(All comparisons are against the same period of the prior year, unless otherwise noted)
2016 was an important transition year for our business and we made great progress towards our North Star: creating the best user experience in travel. We have made significant investments in our product experience, we have seen improvements in our revenue growth trends, and we continue to focus on creating a consumer mindset that TripAdvisor is the best place to compare prices and book.
TripAdvisor remains the category leader in planning and researching the best places to travel, worldwide. Network effects at the top-of-the-funnel remain strong. Our user-generated content grew nearly 50% in 2016 and is fast approaching 500 million reviews and opinions. Community grew 14% in 2016, and reached nearly 390 million monthly unique users per month during the peak summer travel season. With nearly half of our monthly unique users visiting TripAdvisor on the phone, we remain well positioned as travel planning and booking moves towards those smaller screens.
However, while ComScore studies suggest TripAdvisor influences roughly 40-50% of global online hotel reservations, we believe we get credit only for a tiny fraction of those transactions. This creates what we estimate is a multi-billion dollar opportunity if we can successfully bring more shoppers back to our site when they are ready to book and get credit for the transactions that we have influenced.
Adding hotel instant booking over the past couple of years completes the differentiated, next-generation hotel shopping vision we described a year ago. It enables a stickier, more comprehensive user value proposition – well beyond what we have achieved as the world’s largest and most well known travel-planning site. It also positions us to increase our market share of high value shoppers – the ones that are most likely to book – which we believe will enhance long-term revenue growth and profitability.
The instant booking rollout induced significant revenue headwinds in 2016, muting revenue growth and significantly impacting profitability. Consolidated revenues, GAAP net income and adjusted EBITDA were down year-on-year by 1%, 39%, and 24%, respectively. While such volatility was largely expected, we saw a dampened back-half recovery and we were perhaps too optimistic about how quickly our product changes would raise awareness of TripAdvisor as a great place to book. All the while, our competition has not been standing still and we continue to be significantly outspent on marketing. This competitive dynamic has been compounded as revenue per hotel shopper headwinds from instant booking slowed 2016 Hotel segment direct marketing expenses to single-digit growth year-on-year.
However, we are encouraged by recent trends. Click-based and transaction revenue growth improved in the fourth quarter and again in January compared to the fourth quarter, particularly in our U.S. market where we have completely lapped our instant booking rollout. We have been
1
re-investing our monetization improvements into performance-based marketing channels to enhance revenue growth and will continue to do so in 2017.
As we lap the instant booking rollout in other markets during the first half of 2017 and as we further streamline the hotel shopping experience to focus on helping users find the best price, we are also evaluating a multi-year brand marketing investment, including a return to TV advertising. At a high-level, we believe a brand marketing investment would enable us to reach a broad audience and could help to accelerate the user perception shift to TripAdvisor as a place to price compare and book. Size, scope, timing, and ROI of such investment are currently under consideration. We will provide our updated thoughts on this investment in due course.
While our significant ongoing investments have reduced near-term profitability, we believe they position us for both long-term revenue and profit growth. Over time, as users engage with TripAdvisor to price compare and to book, thereby plugging the leak, we believe hotel shopper monetization and marketing efficiency can improve. This, combined with margin improvement in our Non-Hotel businesses, will enable us to return to profit growth over the longer-term.
Q4 Hotel Segment Update
Our Hotel segment was 80% of total revenue in both the fourth quarter and for 2016. Users can seamlessly book hundreds of thousands of hotels, getting the best price from whichever partner has the lowest room rate, all while using their stored credit card. Our comprehensive hotel shopping experience is unique in the marketplace, and we view it as particularly strategic as consumer behavior moves towards a mobile-first, app-first world.
In the fourth quarter, we reached more than 560,000 instantly bookable hotels on our platform. Also, we were pleased to have recently announced global instant booking partnerships with Expedia and Hilton. On the product side, we introduced a new hotel sorting algorithm and a cleaner price-shopping display, kicking off an ongoing initiative focused on streamlining our hotel shopping experience.
We have seen nice early results helping users find the best deal before they book. We carry these insights into 2017 and we are rapidly iterating on a comprehensive hotel shopping experience refresh on all devices, making sure shoppers can find the best prices every time. Of course, instant booking remains our strategic preference since we expect it will generate greater long-term monetization value, while our core product focus remains on delivering the best user experience, whether that is powered by metasearch or instant booking.
In 2016, we also expanded our suite of products and tools that help hotelier and OTA partners advertise more effectively on our site. Earlier in the year, we enabled partners to retarget their visitors when they are on our hotel pages. In the fourth quarter, we launched our new Bid Management Platform, a product that is already helping many of our partners increase the efficiency of their campaigns. Early adopters have achieved nice share gains as a result. Including instant booking, these new products underscore our ongoing commitment to helping partners achieve even more value from our platform.
2
Turning to our Hotel segment financial performance, fourth quarter revenue results improved sequentially to negative 3% year-over-year driven by improving click-based and transaction revenue growth rates and partially offset by some softness in display and subscription revenue. Currency was approximately a one percent headwind in the period.
Our instant booking launch dampened our core click-based and transaction revenue growth in 2016, but we believe we have started to turn a corner. Click-based and transaction revenue growth improved significantly in the fourth quarter, up 10 percentage points sequentially, to flat growth year-over-year. Revenue per hotel shopper growth improved by five percentage points sequentially to negative 7% year-over-year. The graph below illustrates an improving revenue per hotel shopper trend following the significant instant booking dilution during the first half of 2016.
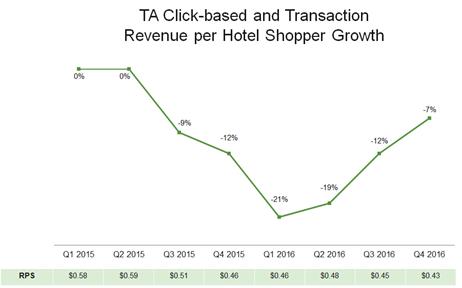
We are encouraged by this trend, particularly in the U.S., which, in late August, was our first country to anniversary the instant booking rollout. This trend led to revenue growth improvements in Q3 and Q4. In the fourth quarter, U.S. click-based and transaction revenue delivered double-digit growth year-on-year. We are investing in performance-based marketing behind these improving monetization trends to further enhance growth. In January, worldwide click-based and transaction revenue growth rates improved to high single-digits, driven by strong double-digit year-over-year growth in the U.S. We are in the midst of lapping the instant booking rollout in international markets, and we expect revenue growth rates in those regions to benefit, though similar to Q4, it will not translate into profit growth in Q1.
In total, improving monetization trends as well as performance-based marketing investments drove total average monthly unique hotel shopper growth, which accelerated to 8%, as shown in the graphic below.
3
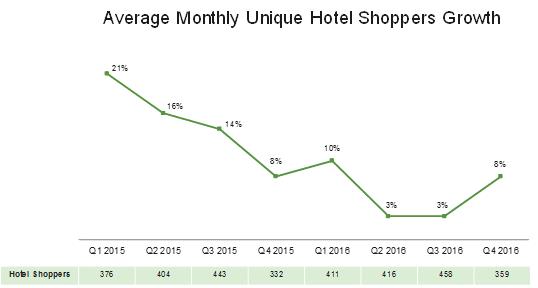
In addition, phone remains a fast-growing and key strategic platform, as fourth quarter hotel shoppers grew 22% year-on-year. Monetization on phone improved relative to desktop in 2016, and this still represents a large long-term opportunity.
Our fourth quarter results illustrate that we have a lot more work to do to improve Hotel monetization but we are pleased with our progress.
Q4 Non-Hotel Segment Update
While we progress along our Hotel initiatives, our Non-Hotel offerings – Attractions, Restaurants and Vacation Rentals – further expand our addressable market, enabling users to find and book more experiences on more trips. This segment constituted 20% of our total revenue in both the fourth quarter and for full-year 2016. Similar to our Hotel philosophy, we are investing in building bookable supply, bringing more functionality to mobile and delivering a more comprehensive experience, thereby helping more users in more moments on more trips.
Outside of Hotels, Attractions remains our largest long-term growth opportunity and we believe we are in a great position to win. In 2016, we grew the number of supplier partners by nearly 90% and grew bookable products by nearly 80% to 56,000. During the fourth quarter, we continued to deepen our Viator and TripAdvisor integration and improved our marketing efficiency. We have integrated Viator attractions content onto our TripAdvisor product pages, we completed our attractions instant booking launch across all TripAdvisor platforms, and we improved the overall shopping experience for attractions. Given our massive attractions audience on TripAdvisor, a key focus for 2017 will be on conversion, by matching travelers to businesses, and turning lookers into bookers as quickly and efficiently as possible.
We are investing behind similar demand and supply advantages to scale our Restaurants business. In 2016, we grew bookable restaurant supply by more than 20% to 40,000 across 12 countries and we launched mobile push notifications this year, which continues to drive awareness, repeat usage and bookings. In the fourth quarter, we launched our new Restaurant
4
Solutions product that provides restauranteurs with more powerful marketing tools. In 2017, we are focused on further expanding bookable inventory, redesigning the mobile experience and helping more restauranteurs get even more value from our platform.
In Vacation Rentals, our focus on providing users more high-quality supply has improved the user experience and driven very healthy conversion gains in 2016. Property listings grew by nearly 10% to 835,000 at the end of the fourth quarter, driven by our free-to-list model. Four out of every five of these properties are now online bookable, making it easier for the user to seamlessly find and book a rental.
Turning to Non-Hotel segment financial performance, fourth quarter revenue growth was 31% while currency was approximately a 6% headwind during the period. Full-year revenue growth of 27% was generally in line with last year’s outlook, which outlined strong second-half growth due to the highly seasonal revenue patterns in these businesses. Owing to its highly seasonal revenue pattern, Non-Hotel segment adjusted EBITDA margins were negative 13% in the fourth quarter. Looking at the full year, negative 10% adjusted EBITDA margins underscore the strategic growth investments we are making to grow supply, increase user conversion, expand our platform, and grow market share.
Q4 Consolidated Financials
Our fourth quarter consolidated total revenue growth improved to 2% year-over-year in reported currency, and 4% in constant currency. This revenue growth improved from our third quarter results, driven by improvements in our core click-based and transaction business.
Fourth quarter consolidated GAAP net income declined by 67% year-over-year. Total adjusted EBITDA declined by 33% in reported and 32% in constant currency, driven by increased marketing investments in Hotels, seasonality in our Attractions business, as well by a one-time non-cash item in fourth quarter 2015 to settle our pledge obligation with The TripAdvisor Charitable Foundation. The latter negatively impacted net income by $59 million ($36 million after-tax) in Q4 2015 and positively impacted Q4 2015 adjusted EBITDA by $6 million.
Our 2016 GAAP effective tax rate was approximately 21%, primarily due to earnings in jurisdictions outside the United States as well as certain discrete items. We note that our 2017 GAAP effective tax rate is likely to increase, potentially well into the 30’s, primarily driven by stock-based compensation tax accounting at a lower share price, changes in valuation allowances and debt interest deductions in some foreign jurisdictions. We believe our non-GAAP tax rate, which is not subject to share price volatility, will be less impacted than our GAAP tax rate.
Cash provided by operating activities in the fourth quarter was $46 million, or 15% of revenue, down from $78 million in fourth quarter of 2015. Capital expenditures for the quarter were $16 million, or 5% of revenue, flat from the fourth quarter of 2015. As a result, fourth quarter free cash flow was $30 million compared to $62 million in the fourth quarter of 2015.
Our liquidity position remains strong. Cash, cash equivalents and short-term and long-term marketable securities were $746 million at the end of the quarter. Throughout 2016, we allocated
5
$105 million to share repurchases at an average purchase price of approximately $52 per share. In the fourth quarter, we reached the $250 million limit of our initial share repurchase program. We recently received approval from our Board of Directors for another $250 million of share repurchase capacity.
2017 and longer term financial outlook
We operate a business in an attractive marketplace and we focus our efforts on long-term growth objectives. We regularly see opportunities throughout a given year to invest for growth, whether through organic or inorganic means. While investing for growth is well within our control, we also encounter factors that fall well outside of our control, such as movements in the competitive landscape and in our metasearch auction, and macro-economic events that affect the travel industry, among other things. As such, our overall visibility into financial performance can be limited. With that as a backdrop, we offer investors the following thoughts about our financial outlook:
Coming out of 2016, we believe we are turning a corner. We are investing behind improving monetization trends to enhance revenue growth amidst a competitive travel landscape, prioritizing revenue growth as opposed to profit growth this year. As a result, we are targeting double-digit consolidated revenue growth in 2017, driven by a return to double-digit click-based and transaction revenue growth, while absolute adjusted EBITDA could be flat to down year-on-year.
Leveraging indirect investments we have made in the past, we expect people costs to grow slower than revenue growth this year, while direct marketing costs grow in excess of revenue growth. We note that our consolidated revenue growth and adjusted EBITDA growth will be more back-half weighted than 2016 due to our increasingly seasonal business and as we make progress along our various growth initiatives.
These insights into our 2017 financial outlook do not include the aforementioned potential for a strategic multi-year brand marketing investment, including TV advertising. Any such brand investment would likely further enhance revenue growth and would likely negatively impact near-term adjusted EBITDA as well as our 2017 outlook outlined above. We will provide our updated thoughts in due course.
Looking out over the longer term, as travelers increasingly associate the TripAdvisor brand with price shopping and booking, and not just reviews, we believe we can drive improved profitability, as well as revenue growth. This will happen as we bring users back to TripAdvisor when they are ready to book, plugging the monetization leak and increasing revenue per hotel shopper. If successful, we believe this will enable us to meaningfully improve our marketing efficiency, drive sustained double-digit revenue growth and surpass the absolute adjusted EBITDA levels we achieved in 2014 and 2015. We believe we will make progress against this objective in 2017, though the full benefits and profit growth will more likely accrue over the longer-term.
6
TripAdvisor’s fourth quarter and full year 2016 earnings press release is available on the Investor Relations section of the TripAdvisor website at http://ir.tripadvisor.com/. The earnings release is also included as Exhibit 99.1 to our Current Report on Form 8-K as furnished to the SEC on February 15, 2017, which is available on the Investor Relations section of our website and the SEC’s website at www.sec.gov.
Forward-Looking Statements:
These prepared remarks contain “forward-looking statements” within the meaning of Section 27A of the Securities Act of 1933, as amended, or the Securities Act, and Section 21E of the Securities Exchange Act of 1934, as amended, or the Exchange Act. The following words, when used, are intended to identify forward-looking statements: “anticipate,” “believe,” “could,” “estimate,” “expect,” “intend,” “may,” “might,” “plan,” “project,” “result” “should,” “will,” and similar expressions which do not relate solely to historical matters. We caution investors that any forward-looking statements in these prepared remarks, or which management may make orally or in writing from time to time, are based on management’s beliefs and on assumptions made by, and information currently available to, management. Such statements are subject to risks, uncertainties and assumptions and are not guarantees of future performance, which may be affected by known and unknown risks, trends, uncertainties and factors that are beyond our control. Some of the risks and uncertainties that may cause our actual results, performance or achievements to differ materially from those expressed or implied by forward-looking statements are more fully described in Part I. Item 1A. "Risk Factors" of our Annual Report on Form 10-K. Moreover, we operate in a rapidly changing environment. New risk factors emerge from time to time and it is not possible for management to predict all such risk factors, nor can we assess the impact of all such risk factors on our business or the extent to which any factor, or combination of factors, may cause actual results to differ materially from those contained in any forward-looking statements. We caution you that, while forward-looking statements reflect our good faith beliefs when we make them, they are not guarantees of future performance and are impacted by actual events when they occur after we make such statements. We expressly disclaim any responsibility to update our forward-looking statements, whether as a result of new information, future events or otherwise.
Investors should also refer to our quarterly reports on Form 10-Q for future periods and current reports on Form 8-K as we file them with the U.S. Securities and Exchange Commission, or the SEC, and to other materials we may furnish to the public from time to time through Current Reports on Form 8-K or otherwise, for a discussion of risks and uncertainties that may cause actual results, performance or achievements to differ materially from those expressed or implied by forward-looking statements.
Use of Non-GAAP Financial Measures:
These prepared remarks include references to non-GAAP measures, such as adjusted EBITDA (including forecasted adjusted EBITDA), free cash flow, and constant currency measurements, such as, non-GAAP revenue before effects of foreign exchange, and adjusted EBITDA before effects of foreign exchange, which are considered non-GAAP financial measures as they are not
7
prepared in conformity with accounting principles generally accepted in the United States (“GAAP”). These non-GAAP financial measures are not prepared under a comprehensive set of accounting rules and, therefore, should only be reviewed alongside results reported under GAAP.
We urge you to review our earnings press release as it contains important information about our financial results, including tabular reconciliations to the most directly comparable GAAP financial measure, definitions, limitations and other related information about these non-GAAP financial measures. The earning press release is available on the Investor Relations section of our website at http://ir.tripadvisor.com/. It is also included as Exhibit 99.1 to our Current Report on Form 8-K as furnished to the SEC on February 15, 2017, which is available on the Investor Relations section of our website at http://ir.tripadvisor.com/ and the SEC’s website at www.sec.gov.
8