Attached files
| file | filename |
|---|---|
| 8-K - FORM 8-K - SELECTIVE INSURANCE GROUP INC | f8k_021517.htm |
Exhibit 99.1


PAGE 2 In this presentation, we make certain statements and reference other information that are “forward - looking statements” as defined i n the Private Securities Litigation Reform Act of 1995 (“PSLRA”). The PSLRA provides a safe harbor under the Securities Act of 1933 and th e S ecurities Exchange Act of 1934 for forward - looking statements that relate to our intentions, beliefs, projections, estimations, or forecasts of future eve nts or our future financial performance. Forward - looking statements involve known and unknown risks, uncertainties, and other factors that may result in ma terially differing actual results. We can give no assurance that our expectations expressed in forward - looking statements will prove to be correct . Factors that could cause our actual results to differ materially from those projected, forecasted, or estimated by us in forw ard - looking statements are discussed in further detail in Selective’s public filings with the United States Securities and Exchange Commission. We undertake no obligation to publicly update or revise any forward - looking statements – whether as a result of new information, future events or otherwise – other than as the federal securities laws may require. This presentation also includes certain non - GAAP financial measures within the meaning of Regulation G, including “operating ear nings per share,” “operating income,” and “operating return on equity.” Definitions of these non - GAAP measures and a reconciliation to the most co mparable GAAP figures pursuant to Regulation G are available in our Annual Report on Form 10 - K and our Supplemental Investor Package, Fourth Q uarter and Full Year 2016, which can be found on our website < www.selective.com > under “Investors/Reports, Earnings and Presentations.” We believe investors and other interested persons find these measurements beneficial and useful. We have consistently provided these financial measurements in previous investor communications so they have a consistent basis for comparing our results between quarters and with our industry competitors. Th ese non - GAAP measures, however, may not be comparable to similarly titled measures used outside of the insurance industry. Investors are cau tioned not to place undue reliance on these non - GAAP measures in assessing our overall financial performance. SAFE HARBOR STATEMENT

GREG MURPHY Chairman and Chief Executive Officer STRATEGIC OVERVIEW

PAGE 4 78 % Standard Commercial 9 % Excess & Surplus 13 % ▪ Super - regional P&C company with capabilities of a national carrier ▪ Long history of financial strength, superior execution, and disciplined growth ▪ Strong customer - centric focus SUSTAINABLE COMPETITIVE ADVANTAGES: ▪ True franchise value with “ivy league” distribution partners ▪ Unique field model coupled with sophisticated underwriting and claims tools ▪ Superior customer experience delivered by best in class employees Standard Personal PAGE 4 2016 NET PREMIUMS WRITTEN BEST SUPER REGIONAL COMPANY
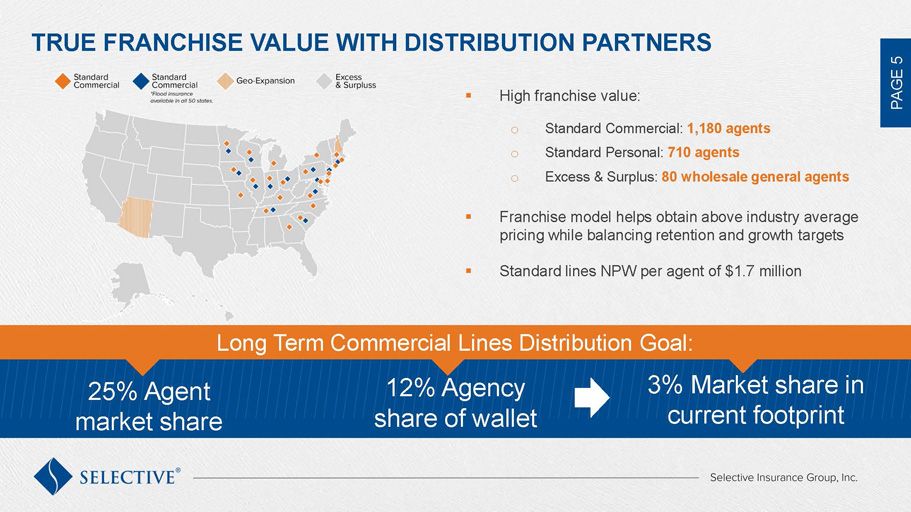
PAGE 5 TRUE FRANCHISE VALUE WITH DISTRIBUTION PARTNERS ▪ High franchise value: o Standard Commercial: 1,180 agents o Standard Personal: 710 agents o Excess & Surplus: 80 wholesale general agents ▪ Franchise model helps obtain above industry average pricing while balancing retention and growth targets ▪ Standard lines NPW per agent of $ 1.7 million 25% Agent market share 12% Agency share of wallet 3% Market share in current footprint Long Term Commercial Lines Distribution Goal:

PAGE 6 UNIQUE FIELD MODEL ▪ Responsive, field - based model: o ~ 105 Agency Management Specialists o ~15 Personal Lines Marketing Specialists o ~115 Claims Management Specialists o ~80 Safety Management Specialists ▪ Focused on delivering best - in - class customer service ▪ Armed with sophisticated underwriting and claims tools An empowered field model equipped with sophisticated tools is the cornerstone of our “High - tech High - touch” business strategy

PAGE 7 SUPERIOR CUSTOMER EXPERIENCE ▪ A personalized and customer - centric focus has been the centerpiece of our strategy since our founding ▪ Investing in omni - channel experience, a potential game changer in an industry that has been slow to adopt change ▪ Focus on driving increased customer loyalty and retention ▪ Franchise value is a competitive advantage for agency adoption Customer - centricity is critical for long - term success

PAGE 8 Overall Statutory Combined Ratios Statutory Combined Ratio (ex - CAT) 98.4% 97.3% 94.8% 92.5% 89.4% 89.0% 2011 2012 2013 2014 2015 2016 101.0% - 102.0% 101.5% 96.0% 92.0% 91.0% 91.0% Original ex - CAT Guidance 2015 92.4% 2016 91.8% Improvement 0.6 pts 2016: SELECTIVE’S MOST PROFITABLE YEAR ▪ Underlying statutory combined ratio of 92.2% in 2016 ▪ Pursuing price increases in each of our segments ▪ Claims and underwriting improvements ▪ Focus on lowering expense ratio Guidance as of February 2, 2017 2017 guidance for an underlying statutory combined ratio of 90.5% for a 1.7 point margin improvement

PAGE 9 Net Premiums Written 1998 2002 2006 2010 2014 $0B Managed Premium Volume During Soft Market $2.5B LONG HISTORY OF DISCIPLINED & PROFITABLE TOP LINE GROWTH GROWTH DRIVERS: ▪ Unique field model ▪ True franchise value with “ivy league” distribution partners ▪ Growing share of wallet ▪ New agent appointments ▪ Expansion in E&S Long track record of cycle management and profitable growth

PAGE 10 Selective has the right tools, technology and team in place to continue driving profitable growth in standard Commercial Lines $1.2 $1.7 2011 2012 2013 2014 2015 2016 NPW Combined Ratio $2.0B ($ in billions) 80.0% 110.0% $0B STANDARD COMMERCIAL LINES: A PROFIT ENGINE ▪ GROWTH DRIVERS: o AMS territory additions o Small business teams o New business capacity per AMS ▪ PROFITABILITY DRIVERS: o Underwriting improvements o Enhanced claims processes o Price increases that exceeded loss costs 2011 2012 2013 2014 2015 2016

PAGE 11 Commercial Lines renewal pure price increases averaged 2.6% in 2016 and 2.4% in January 2017 78% 80% 82% 84% 86% -2% 2% 6% 10% 2009 2010 2011 2012 2013 2014 2015 2016 SIGI Retention SIGI Pricing CLIPS Pricing Renewal Pure Price (%) Retention (%) PRICE INCREASES HAVE SIGNIFICANTLY OUTPERFORMED INDUSTRY AVERAGES ▪ Commercial Lines price increases have cumulatively outperformed the CLIPS index by 1,700 points since 2009 ▪ Ability to get price is reflective of our: o Dynamic Portfolio Manager (DPM) o Renewal portfolio meetings o Strong technical underwriting capabilities o Value through claims/safety management initiatives, etc. CLIPS: Willis Towers Watson Commercial Lines Insurance Pricing Survey

PAGE 12 Selective’s pricing tools allow the company to analyze and price business on a very granular level – a key advantage – that has enabled outperformance Commercial Lines Pricing By R etention Group 65% 75% 85% 95% 0% 3% 6% 9% Above Average Average Below Average Low Very Low Renewal Pure Price Point of Renewal Retention Renewal Pure Price Point of Renewal Retention 49.8% 24.6% 15.3% 7.6% 2.7% % of Premium SOPHISTICATED PRICING TOOLS ▪ Commercial Lines Dynamic Portfolio Manager (DPM) tool considers: o Average diamond score o Relative loss frequency and severity o Pricing deviation o Hazard and segment considerations ▪ The DPM provides for granular account - specific pricing and the correlated impact of each action on the overall portfolio ▪ DPM output is closely aligned with goals for individual underwriters and regions

PAGE 13 Recent uptick in Personal A uto loss trends has resulted in many large players seeking higher prices $273 $282 117.3% 95.2% 2011 2012 2013 2014 2015 2016 NPW Combined Ratio $400M 120% 60% ($ in millions) $0 PERSONAL LINES: A PROFITABLE YEAR BUT GREATER FOCUS ON AUTO MARGINS HOMEOWNERS ▪ Profitability close to long term target of 90% c ombined ratio (in normal CAT year) after years of price increases and underwriting changes ▪ Sixth largest writer of government - backed “Write Your Own” flood program ▪ Continue to diversify writings across footprint PERSONAL AUTO ▪ Industry grappling with increased loss frequency and severity trends ▪ We plan for rate filings averaging ~6% in 2017

PAGE 14 Long - term target - E&S combined ratio 4 - 6 points better than Standard Commercial ($ in millions) $113 $210 118.8% 102.1% 2012 2013 2014 2015 2016 NPW Combined Ratio $250M 120% 60% $0 EXCESS & SURPLUS: TARGETING MARGIN IMPROVEMENT ▪ Entered E&S through two transactions in 2011 and 2012 ▪ Our E&S business has a low - limit profile; average policy size below $3K ▪ Significant targeted price increases in challenged classes during 2016 to address underwriting margins ▪ New business in second half of 2016 was below expectations due to underwriting actions

MARK WILCOX EVP, Chief Financial Officer FINANCIAL STRENGTH & RISK PROFILE

PAGE 16 $11.57 $26.42 $10 $20 $30 2002 2004 2006 2008 2010 2012 2014 2016 Financial Crisis and Elevated Catastrophe Losses Strong financial strength ratings A.M. Best A Fitch A+ Moody’s A2 S&P A LONG - TERM SHAREHOLDER VALUE CREATION THROUGH BOOK VALUE GROWTH Selective’s Track Record of Book Value per Share Growth over Time ▪ Long - term financial target – operating ROE* of 300 basis points above our weighted average cost of capital ▪ Strong balance sheet underpinned by a conservative approach to: o Managing the investment portfolio o Purchasing reinsurance protection o Reserving o Focusing on low - to medium - hazard business ▪ Because of our conservative approach, we take on more operating leverage with a NPW / surplus ratio of 1.4x ▪ Each point on the combined ratio equates to ~ 1.0 point of operating ROE* * Refer to “Safe Harbor Statement” on page 2 of this presentation for further detail regarding certain non - GAAP financial measures

PAGE 17 Investment operating ROE*: After - tax yield of 1.9% x 3.50 investment leverage = 6.7% in 2016 CONSERVATIVE INVESTMENT PORTFOLIO ▪ “AA - ” average credit quality ▪ 3.6 year effective duration (including short - term ) ▪ Fixed income portfolio comprised of 97% investment grade bonds and 3% high yield securities ▪ 2016 operating cash flow - 13% of NPW ▪ 2017 after - tax net investment income guidance of approximately $110 million Fixed Income: 92 % Equities: 2% Short - term: 4% Alternatives & Other: 2% As of 12/31/2016 Guidance as of February 2, 2017 * Refer to “Safe Harbor Statement” on page 2 of this presentation for further detail regarding certain non - GAAP financial measures

PAGE 18 2% 2% 2% 3% 3% 3% 16% 0% 6% 12% 18% 25 50 100 150 200 250 500 (Return Period in Years) CONSERVATIVE REINSURANCE COVERAGE ▪ 2017 property catastrophe treaty structure: o Coverage of $685M in excess of $40M retention o Reinsurance exhausts at approximately 1 - in - 265 year event level o $201M limit is collateralized o Additional earnings volatility protection from our non - footprint $35M in excess of $5M layer ▪ Property XOL treaty covers 100% of losses up to $58M in excess of $2M retention ▪ Casualty XOL treaty covers 100% of losses up to $88M in excess of $2M retention Net Hurricane Loss as a % of Equity High quality reinsurance recoverables with A.M . Best weighted average rating of “A +”

PAGE 19 $7 $66 $0 $40 $80 2006 2008 2010 2012 2014 2016 ($ in millions) A STRONG RESERVING TRACK RECORD ▪ Disciplined reserving practices with quarterly actuarial reserve reviews ▪ Independent actuarial review performed semi - annually ▪ Independent year - end opinion ▪ Favorable reserve development in Workers Compensation and General Liability lines was partially offset by strengthening in Commercial Auto during 2016 A Long Track Record of Favorable Development Eleven consecutive years of favorable reserve development

PAGE 20 2017 COMBINED RATIO PLAN – UNDERLYING MARGIN IMPROVEMENT ▪ Earned rate increases in 2017 should offset projected loss cost inflation ▪ Expense reductions to lower statutory combined ratio by 0.6 points, and claims/underwriting initiatives to help underlying margin by 1.0 points in 2017 ▪ Additional $10M of expected corporate expense savings that are not included in the combined ratio calculation 2017 Statutory Combined Ratio (x - CAT) Forecast of 90.5% 2016 Accident Year 92.2% 1.9% Loss Trend (2.0)% Earned Rate (1.0)% Claims/ UW Improvement 2017 ex - CAT Projection 90.5% Guidance as of February 2, 2017 (0.6)% Expenses 2017 guidance assumes CAT budget of 3.5 points and no reserve development

PAGE 21 Selective delivers High - tech , High - touch insurance solutions while leveraging a unique distribution model to generate long - term value for shareholders INVESTMENT PROPOSITION ▪ Long track record of financial strength, superior execution and disciplined profitable growth ▪ Strong balance sheet with conservative investment portfolio allows us to take on more operating leverage ▪ Projected investment operating ROE* of 6.8% in 2017 ▪ Each point on the combined ratio ~ 1.0 point of ROE ▪ Premium growth opportunity: o Growing share of wallet ~ $1.0B o New agent appointments ~$1.8B o New states ▪ Available capital to support our growth * Refer to “Safe Harbor Statement” on page 2 of this presentation for further detail regarding certain non - GAAP financial measures
ADDITIONAL INFORMATION

PAGE 24 FINANCIAL HIGHLIGHTS 2012 - 2016 2012 2013 2014 2015 2016 Statutory NPW Growth 12.2% 8.7% 4.1% 9.8% 8.1% Net Income per Share $0.68 $1.87 $2.47 $2.85 $2.70 Operating EPS* $0.58 $1.65 $2.17 $2.70 $2.75 Dividend per Share $0.52 $0.52 $0.53 $0.57 $0.61 Book Value per Share $19.77 $20.63 $22.54 $24.37 $26.42 Statutory Premiums to Surplus 1.6x 1.4x 1.4x 1.5x 1.4x Invested Assets/Stockholder’s Equity 3.97 3.97 3.77 3.64 3.50 Return on Average Equity 3.5% 9.5% 11.7% 12.4% 10.8% Operating Return on Average Equity* 3.0% 8.4% 10.3% 11.8% 11.0% Statutory Combined Ratio - Total 103.5% 97.5% 95.7% 92.4% 91.8% - Standard Commercial Lines 103.0% 97.1% 95.5% 89.2% 89.9% - Standard Personal Lines 100.7% 96.9% 94.5% 99.9% 95.2% - Excess and Surplus Lines 118.8% 102.9% 99.2% 108.4% 102.1% GAAP Combined Ratio - Total 104.0% 97.8% 95.8% 92.5% 92.9% - Standard Commercial Lines 103.3% 97.4% 95.7% 89.2% 91.2% - Standard Personal Lines 101.3% 97.1% 94.4% 99.5% 95.6% - Excess and Surplus Lines 124.7% 103.0% 99.7% 109.8% 103.4% * Refer to “Safe Harbor Statement” on page 2 of this presentation for further detail regarding certain non - GAAP financial measures

PAGE 25 $227 $336 $233 $382 $302 40 440 2012 2013 2014 2015 2016 NET OPERATING CASH FLOW ($ in millions) 14% 19% Cash Flow as % of NPW 12% 13% 18%
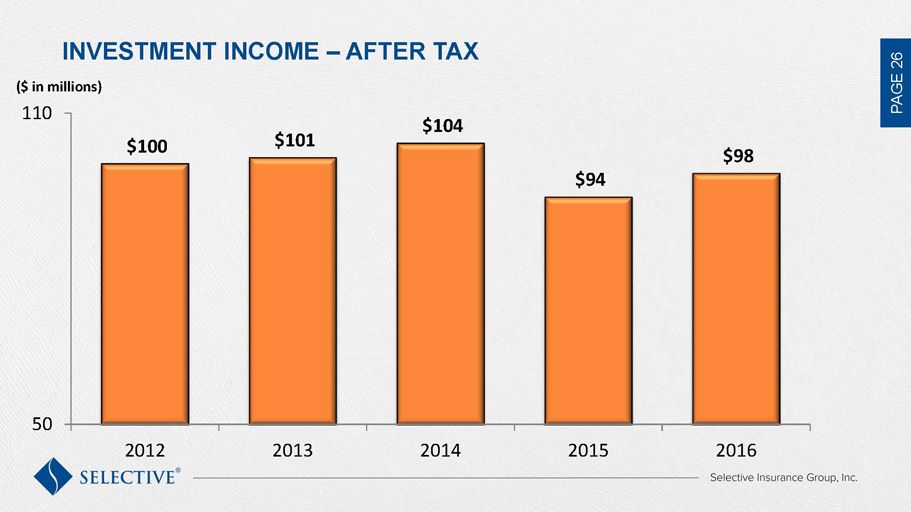
PAGE 26 $100 $101 $104 $94 $98 50 110 2012 2013 2014 2015 2016 INVESTMENT INCOME – AFTER TAX ($ in millions)

PAGE 27 $842 $908 $908 $979 $1,028 30 35 500 1,100 2012 2013 2014* 2015 2016 NPW per Employee Statutory Expense Ratio INSURANCE OPERATIONS PRODUCTIVITY ($ in 000s) *Expense ratio excludes 0.4 point benefit from self - insured group sale

PAGE 28 98.4 95.3 92.8 87.0 87.8 4.6 1.7 2.7 2.2 2.1 80 105 2012* 2013 2014 2015 2016 Combined Ratio(%) 95.5 Impact of Catastrophe Losses Combined Ratio excluding CATS Statutory Combined Ratios 103.0 97.1 *Includes impact of reinstatement premium on catastrophe reinsurance program as a result of Hurricane Sandy Some amounts may not foot due to rounding 89.2 STANDARD COMMERCIAL LINES PROFITABILITY 89.9
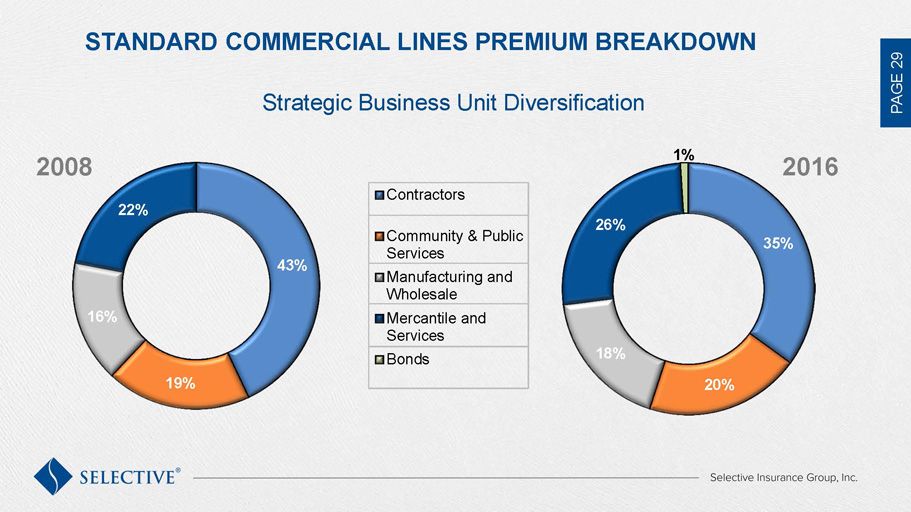
PAGE 29 43% 19% 16% 22% Contractors Community & Public Services Manufacturing and Wholesale Mercantile and Services Bonds 35% 20% 18% 26% 1% 2016 2008 Strategic Business Unit Diversification STANDARD COMMERCIAL LINES PREMIUM BREAKDOWN

PAGE 30 General Liability 32% Auto 24% BOP 6% Bonds 1% Other 1% Commercial Property 18% Workers Compensation 18% STANDARD COMMERCIAL LINES PREMIUM BREAKDOWN 2016 Net Premium Written

©2017 Selective Insurance Group, Inc., Branchville, NJ. Products vary by jurisdiction, terms, and conditions and are provided by Selective Insurance Company of America and its insurer affiliates. Details at selective.com/who - we - are/ selectives - affiliated - insurers.