Attached files
| file | filename |
|---|---|
| EX-32.2 - CERTIFICATION OF VICE PRESIDENT AND CHIEF FINANCIAL OFFICER, SECTION 906 - RAYTHEON CO/ | rtn-12312016xexhibit322.htm |
| EX-32.1 - CERTIFICATION OF CHAIRMAN AND CHIEF EXECUTIVE OFFICER, SECTION 906 - RAYTHEON CO/ | rtn-12312016xexhibit321.htm |
| EX-31.2 - CERTIFICATION OF VICE PRESIDENT AND CHIEF FINANCIAL OFFICER, SECTION 302 - RAYTHEON CO/ | rtn-12312016xexhibit312.htm |
| EX-31.1 - CERTIFICATION OF CHAIRMAN AND CHIEF EXECUTIVE OFFICER, SECTION 302 - RAYTHEON CO/ | rtn-12312016xexhibit311.htm |
| EX-23 - CONSENT OF INDEPENDENT REGISTERED PUBLIC ACCOUNTING FIRM - RAYTHEON CO/ | rtn-12312016xexx23.htm |
| EX-21 - SUBSIDIARIES OF RAYTHEON COMPANY - RAYTHEON CO/ | rtn-12312016xexx21.htm |
| EX-12 - STATEMENT REGARDING COMPUTATION OF RATIO OF EARNINGS TO FIXED CHARGES - RAYTHEON CO/ | rtn-12312016xexx12.htm |
UNITED STATES
SECURITIES AND EXCHANGE COMMISSION
WASHINGTON, D.C. 20549
__________________________________________________________
FORM 10-K
ý | ANNUAL REPORT PURSUANT TO SECTION 13 OR 15(d) OF THE SECURITIES EXCHANGE ACT OF 1934 |
For the fiscal year ended December 31, 2016 or
¨ | TRANSITION REPORT PURSUANT TO SECTION 13 OR 15(d) OF THE SECURITIES EXCHANGE ACT OF 1934 |
For the transition period from to
Commission File Number 1-13699
__________________________________________________________
RAYTHEON COMPANY
(Exact Name of Registrant as Specified in its Charter)
__________________________________________________________
Delaware | 95-1778500 |
(State or Other Jurisdiction of Incorporation or Organization) | (I.R.S. Employer Identification No.) |
870 Winter Street, Waltham, Massachusetts 02451
(Address of Principal Executive Offices) (Zip Code)
(781) 522-3000
(Registrant’s telephone number, including area code)
Securities registered pursuant to Section 12(b) of the Act:
Title of Each Class | Name of Each Exchange on Which Registered |
Common Stock, $.01 par value | New York Stock Exchange |
Securities registered pursuant to Section 12(g) of the Act:
None
__________________________________________________________
Indicate by check mark if the registrant is a well-known seasoned issuer, as defined in Rule 405 of the Securities Act. Yes ý No ¨
Indicate by check mark if the registrant is not required to file reports pursuant to Section 13 or Section 15(d) of the Act. Yes ¨ No ý
Indicate by check mark whether the registrant (1) has filed all reports required to be filed by Section 13 or 15(d) of the Securities Exchange Act of 1934 during the preceding 12 months (or for such shorter period that the Registrant was required to file such reports), and (2) has been subject to such filing requirements for the past 90 days. Yes ý No ¨
Indicate by check mark whether the Registrant has submitted electronically and posted on its corporate Web site, if any, every Interactive Data File required to be submitted and posted pursuant to Rule 405 of Regulation S-T (§ 232.405 of this chapter) during the preceding 12 months (or for such shorter period that the Registrant was required to submit and post such files). Yes ý No ¨
Indicate by check mark if disclosure of delinquent filers pursuant to Item 405 of Regulation S-K (§ 229.405 of this chapter) is not contained herein, and will not be contained, to the best of Registrant’s knowledge, in definitive proxy or information statements incorporated by reference in Part III of this Form 10-K or any amendment to this Form 10-K. ý
Indicate by check mark whether the Registrant is a large accelerated filer, an accelerated filer, a non-accelerated filer, or a smaller reporting company. See the definitions of “large accelerated filer,” “accelerated filer” and “smaller reporting company” in Rule 12b-2 of the Exchange Act.
Large accelerated filer ý Accelerated filer ¨ Non-accelerated filer ¨ Smaller reporting company ¨
Indicate by check mark whether the Registrant is a shell company (as defined in Rule 12b-2 of the Exchange Act). Yes ¨ No ý
The aggregate market value of the voting stock held by non-affiliates of the Registrant as of July 1, 2016, was approximately $39.7 billion.
The number of shares of Common Stock outstanding as of February 13, 2017 was 292,880,000.
Documents incorporated by reference and made a part of this Form 10-K:
Portions of the Registrant’s Definitive Proxy Statement for its 2017 Annual Meeting of Stockholders are incorporated by reference in Part III of this Form 10-K.
INDEX
Item 1. | ||
Item 1A. | ||
Item 1B. | ||
Item 2. | ||
Item 3. | ||
Item 4. | ||
Item 5. | ||
Item 6. | ||
Item 7. | ||
Item 7A. | ||
Item 8. | ||
Item 9. | ||
Item 9A. | ||
Item 9B. | ||
Item 10. | ||
Item 11. | ||
Item 12. | ||
Item 13. | ||
Item 14. | ||
Item 15. | ||
Item 16. | ||
PART I
ITEM 1. BUSINESS
General
Raytheon Company, together with its subsidiaries, is a technology and innovation leader specializing in defense and other government markets throughout the world. The terms “we”, “us”, “our”, “Raytheon” and the “Company” mean Raytheon Company and its subsidiaries, unless the context indicates another meaning. We develop technologically advanced and integrated products, services and solutions in our core markets: sensing; effects; command, control, communications, computers, cyber and intelligence; mission support; and cybersecurity. We serve both domestic and international customers, primarily as a prime contractor or subcontractor on a broad portfolio of defense and related programs for government customers.
We were founded in 1922 and have grown internally and through a number of acquisitions. We are incorporated in the state of Delaware. Our principal executive offices are located at 870 Winter Street, Waltham, Massachusetts 02451.
In this section, we describe our business, including our business segments, product lines, customers, operations and other considerations.
Business Segments
We operate in five business segments:
– | Integrated Defense Systems; |
– | Intelligence, Information and Services; |
– | Missile Systems; |
– | Space and Airborne Systems; and |
– | Forcepoint™. |
The following is a description of each of our business segments. As part of the description, we include a discussion of some of the segment’s notable initiatives and achievements in 2016, such as certain key contract awards, new product introductions and acquisitions. For a discussion of the financial performance of our business segments and other financial information, see "Segment Results" within Item 7 of this Form 10-K.
Integrated Defense Systems (IDS)—IDS, headquartered in Tewksbury, Massachusetts, is a leader in integrated air and missile defense; large land- and sea-based radar solutions; command, control, communications, computers, cyber and intelligence solutions; and naval combat and ship electronic systems. IDS delivers combat-proven performance against the complete spectrum of airborne and ballistic missile threats and is a world leader in the technology, development, and production of sensors and mission systems. IDS provides solutions to the U.S. Department of Defense (DoD) and the U.S. Intelligence Community, as well as more than 50 international customers which represent approximately half of IDS’s business.
In 2016, IDS booked a number of awards to provide advanced Patriot Air and Missile Defense (A&MD) systems for the U.S. Army and other international customers. IDS won a competitive award with the U.S. Navy: a development contract for the Enterprise Air Surveillance Radar (EASR) program to provide radars for aircraft carriers and amphibious warfare ships. IDS also received contract awards for missile defense radar sustainment for the Missile Defense Agency (MDA), and contract awards for equipment for DDG 1000 destroyer ships, ship integration and undersea sensor systems for the U.S. Navy.
IDS has the following principal product lines:
Mission Systems and Sensors (MSS)—MSS provides integrated whole-life air and missile defense systems. MSS produces systems and solutions, including Upgraded Early Warning Radars (UEWR), the Army Navy/Transportable Radar Surveillance-Model 2 (AN/TPY-2) and other land-based surveillance and search radars, which provide threat detection, precision tracking, discrimination and classification of ballistic missile threats. In addition, MSS provides command, control, communications, computers, cyber and intelligence solutions through the development, delivery and support of complex integrated, networked, actionable combat command and control solutions for air and land combat commanders. Key MSS customers include the U.S. Army and Air Force, the MDA and international customers.
1
Integrated Air and Missile Defense (IAMD)—IAMD provides combat-proven air and missile defense systems, including the Patriot A&MD system which is the cornerstone of the air and missile defense architecture for thirteen nations around the globe, including the U.S. and five NATO nations. The National Advanced Surface-to-Air Missile System (NASAMS™), also offered by IAMD, is a highly adaptable mid-range solution for any operational air defense requirement. It is deployed in the U.S. and five other countries. Key IAMD customers include the U.S. Army and international customers. Total sales from this business area were approximately 10% of our consolidated revenues for 2016, 2015 and 2014.
Seapower Capability Systems (SCS)—SCS is a provider and integrator of maritime air and missile defense radar systems, naval combat management, and airborne anti-submarine and mine warfare systems, as well as sensors, maritime naval navigation systems, and torpedoes for U.S. and international navies. As a naval radar provider, SCS is designing and will manufacture the low-rate initial production of the U.S. Navy’s two newest radars, the Air and Missile Defense Radar (AMDR), designated as AN/SPY-6, for the DDG 51 class of warships and the EASR for aircraft carriers and amphibious warfare ships. As a ship integrator for the U.S. Navy, SCS provides mission systems equipment and combat and missions system integration for the following ship classes: DDG 1000 destroyers; LPD 17 amphibious warfare ships; and CVN 78 aircraft carriers. Key SCS customers include the U.S. Navy and allied navies.
IDS also includes the Advanced Technology Programs (ATP) product line, which executes contract research and development programs primarily with the Office of Naval Research (ONR), the Strategic Capabilities Office (SCO) and the Defense Advanced Research Projects Agency (DARPA) in advanced materials, semiconductors such as Gallium Nitride (GaN) and next-generation radar systems such as Flexible Digital Array Radar (FlexDAR) and Network Cooperative Radar (NCR), to support Raytheon product lines. ATP also pursues attractive adjacent growth markets such as undersea warfare and directed energy.
Intelligence, Information and Services (IIS)—IIS, headquartered in Dulles, Virginia, provides a full range of technical and professional services to intelligence, defense, federal and commercial customers worldwide. IIS specializes in global Intelligence, Surveillance and Reconnaissance (ISR); navigation; DoD space and weather solutions; cybersecurity; analytics; training; logistics; mission support; engineering; automation and sustainment solutions; and international and domestic Air Traffic Management (ATM) systems. Key customers include the U.S. Intelligence Community, the U.S. Armed Forces, the Federal Aviation Administration (FAA), the National Oceanic and Atmospheric Administration (NOAA), the Department of Homeland Security (DHS), the National Aeronautics and Space Administration (NASA) and an increasing number of international customers.
During 2016, IIS won a variety of notable classified and unclassified contracts. IIS will be executing development work for new phases of the Intelligence Community’s Future Ground Architecture that provides a common framework for mission management across some of our core customers. IIS also extended new phases of work in support of the operations and sustainment of the Navy’s Relocatable Over The Horizon Radar (ROTHR) as well as classified cyber and special mission programs. In addition, IIS has also expanded internationally by providing additional growth in cybersecurity capabilities for our UK customers, as well as continued growth in our weapons systems installation and platform sustainment internationally, including for Canada and Australia.
IIS has the following principal product lines:
Cybersecurity and Special Missions (CSM)—CSM provides integrated cybersecurity and advanced intelligence solutions to strengthen information systems and mission execution. CSM designs and implements customized cyber, managed security services, and quick-reaction solutions, as well as high-consequence special missions support, for the U.S. Intelligence Community, the DoD, civilian federal agencies, international governments and large commercial enterprises. Raytheon leverages and incorporates the cyber capabilities within CSM across the Company by embedding information assurance technologies and know-how into its internal company systems, core solutions and products.
Global Training Solutions (GTS)—GTS provides training solutions, logistics and engineering support worldwide, principally under the Warfighter Field Operations Customer Support (FOCUS) contract with the U.S. Army, which will continue into the first half of 2018. We expect lower activity on this program beginning in the second half of 2017 when task order submissions are completed. Under this contract, the GTS-led Warrior Training Alliance provides integrated operational training through comprehensive support for live, virtual and constructive training exercises and operations, maintenance for training and range systems, curriculum development and instruction, management oversight and administration for contractor activities, and
2
supply support for government-owned property and material. GTS also provides training solutions to international customers and, through Raytheon Professional Services, provides commercial solutions, processes, tools and training experts to domestic and international commercial customers.
Navigation and Environmental Solutions (NES)—NES primarily supports programs for NASA, NOAA and the U.S. Air Force by implementing secure environmental and navigation ground solutions and data processing. NES capabilities include ground systems for command and control of space assets, large-scale data processing and exploitation, storage architectures, and high-performance data handling and processing systems. Key programs include the Joint Polar Satellite System (JPSS), which supports multiple civil, defense and international polar-orbiting environmental satellites and the Global Positioning System Next Generation Operational Control System (GPS-OCX).
Global Intelligence Solutions (GIS)—GIS provides strategic ISR and advanced technology solutions and services through large-scale satellite command and control, mission planning, constellation management, data processing, mission analytics, and secure data sharing. GIS's highly automated information solutions manage the collection and integration of information across multiple domains. GIS serves members of the Intelligence Community, commercial customers and international markets.
Mission Support and Modernization (MSM)—MSM provides full life-cycle mission operations, engineering, sustainment and modernization services for site and platform missions across all domains, as well as multi-intelligence (multi-INT) ground systems and unmanned systems technology for the U.S. Armed Forces and civil agencies. MSM’s core services are applied in two broad areas: proven models to support global mission operations more efficiently; and innovative engineering practices that generate affordable modernization and sustainment of mission-critical systems, weapons or platforms. Programs include advanced ground solutions for tactical ISR missions, such as Global Hawk and the U.S. Air Force's U-2 reconnaissance aircraft; services for the U.S. Air Force’s contractor field support; software and avionics solutions for the V-22 Osprey aircraft; border and critical infrastructure security solutions; integrated operations for the North American Aerospace Defense Command (NORAD) command center, NASA's Neutral Buoyancy Lab and, through its RGNext joint venture, for U.S. Air Force space launch facilities; and upgrades of airborne and sea-based weapons systems and podded aircraft reconnaissance systems.
Transportation and Support Services (TSS)—TSS develops, delivers and supports domestic and international ATM. TSS is a key provider of ATM solutions including automation, surveillance, and navigation and landing solutions, as well as its Standard Terminal Automation Replacement System (STARS), to the FAA and the DoD. TSS also provides "all-electronic" highway tolling systems for customers such as the Massachusetts Department of Transportation (MassDOT) and a highway system in Canada, infrastructure protection with Perimeter Intrusion Detection technology, and product support services for other Raytheon businesses, including system deployment, installation and integration, logistics and training for military and civil customers in over 80 countries.
IIS also includes the Cyber Operations, Development and Evaluation (CODE) Center, an advanced cyber range in which the Company demonstrates, tests and assesses new cyber products and services to determine how they can best integrate into a customer’s Cyber Security Operations Center (CSOC). IIS leverages CODE Center capabilities to drive both internal and external research and development with Governmental entities and commercial cyber protection companies.
Missile Systems (MS)—MS, headquartered in Tucson, Arizona, is a premier developer, integrator and producer of missile and combat systems for the armed forces of the U.S. and allied nations. Leveraging its capabilities in advanced airframes, guidance and navigation systems, high-resolution sensors, surveillance, targeting and netted systems, MS develops and supports a broad range of advanced weapon systems, including missiles, smart munitions, close-in weapon systems, projectiles, kinetic kill vehicles, directed energy effectors and advanced combat sensor solutions. Key customers include the U.S. Navy, Army, Air Force and Marine Corps, the MDA and the armed forces of more than 40 allied nations.
In 2016, MS continued to capture key contract awards from a broad global customer base, including awards for the Advanced Medium-Range Air-to-Air Missile (AMRAAM®) program, the Paveway™ program, the Standard Missile-3 (SM-3®) program and the Phalanx® weapon system program. In addition to these awards, MS received a significant award for the Hypersonic Air-breathing Weapon Concept (HAWC) program. MS completed successful flight tests on the SM-3 program, the Exoatmospheric Kill Vehicle (EKV) program, the Standard Missile-6 (SM-6®) program and the Small Diameter Bomb II (SDB II™) program.
3
MS has the following principal product lines:
Air Warfare Systems (AWS)—AWS products and services enable the U.S. Armed Forces and international customers to attack, suppress and destroy air-, sea- and ground-based targets. Products include the AMRAAM, a state-of-the-art, highly dependable and battle-proven air-to-air missile that also has a surface-to-air launch application; the Tomahawk™ cruise missile, an advanced surface- or submarine-launched cruise missile with loitering and network communication capability; SDB II, an air-to-ground glide weapon designed to engage moving targets in adverse weather and through battlefield conditions; the Joint Standoff Weapon (JSOW®), a family of air-to-ground weapons that employ an integrated GPS/inertial navigation system that guides the weapon to the target; the Paveway family of laser and GPS precision guided munitions; the AIM-9X Sidewinder™ short-range air-to-air missile; the Miniature Air Launched Decoy-Jammer (MALD®-J), a stand-off, high endurance electronic warfare decoy/jammer used to deceive and degrade air defenses; the High-Speed Anti-Radiation Missile (HARM®) and the HARM Targeting System; the Maverick® precision strike missile; and the Griffin®, a small lightweight missile that can be employed from aircraft, unmanned aerial vehicles, ships or ground-launched against light targets. Also, AWS partners with Kongsberg Defence Systems on the Naval Strike Missile (NSM) and the Joint Strike Missile (JSM), which are over-the-horizon anti-surface warfare and land attack weapons systems to be used on various aircraft platforms and ship classes. Total sales from this business area were approximately 10% of our consolidated revenues for 2016, 2015, and 2014.
Air and Missile Defense Systems (AMDS)—AMDS designs, develops, produces, and supports air defense and ballistic missile defense interceptor systems. AMDS's primary customers are the MDA, the U.S. Navy and various international customers around the world. The AMDS portfolio contains multiple versions of the Standard Missile family of products, including SM-3 and SM-6, with capabilities ranging from anti-air warfare to ballistic missile defense.
Naval and Area Mission Defense (NAMD)—NAMD offers a complete family of mission solutions for customers around the world. The product line provides highly effective layered ship defense for the navies of more than 30 countries across multiple platforms to counter the anti-ship threats of today and tomorrow. NAMD leverages its proven capabilities to provide forward-operating base defense for the U.S. Army, Air Force and Marine Corps. The product line designs, develops, manufactures and supports a variety of products that include the Phalanx Close-In Weapon System (employed afloat and ashore), the Rolling Airframe Missile (RAM™) and Launcher System, the SeaRAM® system, Standard Missile-2 (SM-2), and the Evolved SeaSparrow Missiles (ESSM®) family of missiles for layered ship mission protection against air, subsurface and surface cruise/ballistic missile threats. NAMD continues to leverage its strategic international cooperative partnerships to evolve its existing products and technologies with a goal of addressing the full spectrum of threats.
Land Warfare Systems (LWS)—From precision missiles and munitions to advanced electro-optical/infrared (EO/IR) sensors, LWS offers integrated mission solutions in the land domain for the U.S. Army, Marine Corps and more than 40 allied nations that provide warfighters the situational awareness and lethality they need to defeat evolving complex threats. LWS programs include the Tube-launched, Optically-tracked, Wireless-guided (TOW®) weapon system, a long-range precision anti-armor/anti-fortification/anti-amphibious-landing weapon system; Javelin, a shoulder-fired, fire-and-forget anti-tank weapon; Stinger®, a lightweight, self-contained, fire-and-forget, very short-range air defense system; TALON® Laser-Guided Rocket, a precision guided munition co-developed with the United Arab Emirates that can be fired both air-to-ground and ground-to-air; Excalibur®, a GPS-guided artillery round designed to provide indirect precision fire for ground forces; Precision Extended Range Munition (PERM®), a GPS-guided 120mm long-range mortar round; 2nd and 3rd Generation Forward Looking Infrared (FLIR), a sensor technology that provides warfighters with high-definition resolution and magnification of target images in darkness and through weather, smoke, dust and fog; a family of light to heavy Thermal Weapon Sights (TWS); and integrated system solutions for combat vehicle upgrade programs including the U.S. Army’s Stryker Fighting Vehicle, the Bradley Fighting Vehicle, the Abrams Main Battle Tank and the U.S. Marine Corps Light Armored Vehicle-Anti-Tank (LAV-AT) modernization programs.
Advanced Missile Systems (AMS)—AMS focuses on the development and early introduction of next-generation, end-to-end system solutions that support the AWS, AMDS, NAMD and LWS and other Raytheon product lines. AMS is engaged in opportunities involving the transition from weapon development to warfighter fielding in the areas of next generation missile systems, hypersonic vehicles, unmanned aircraft systems, non-kinetic solutions, space applications and collaborative weapon technologies. AMS works closely with DARPA, SCO and the research lab community.
Space and Airborne Systems (SAS)—SAS, headquartered in McKinney, Texas, is a leader in the design, development and manufacture of integrated sensor and communication systems for advanced missions. These missions include intelligence,
4
surveillance and reconnaissance; precision engagement; manned and unmanned aerial operations; and space. Leveraging state-of-the-art technologies, mission systems and domain knowledge, SAS designs, manufactures, supports and sustains civil and military applications of electro-optical/infrared (EO/IR) sensors; airborne radars for surveillance and fire control applications; lasers; precision guidance systems; signals intelligence systems; processors; electronic warfare systems; and communication and space-qualified systems. The U.S. Navy, Air Force, and Army, classified and international allies are key customers.
In 2016, SAS booked important awards in the electronic warfare, space and international markets. SAS was awarded a $1 billion contract for engineering, manufacturing and development of Increment 1 of the U.S. Navy’s Next Generation Jammer (NGJ) airborne electronic attack and jamming system. SAS also received a $564 million NASA award for two Visible Infrared Imaging Radiometer Suite (VIIRS) satellite sensor suites, which provide detail for emerging weather and climate patterns. SAS also won key domestic and international classified awards. SAS also launched a new variant of its Multi-Spectral Targeting System (MTS) and was awarded a U.S. Air Force contract for the AN/DAS-4, the newest MTS sensor that provides mission commanders high definition data to identify and engage targets.
SAS has the following principal product lines:
Intelligence, Surveillance and Reconnaissance Systems (ISRS)—ISRS designs, develops and manufactures an array of EO/IR sensors, light-sensing focal plane arrays, advanced visible and infrared sensors, active electronically scanned array (AESA) radars and various integrated systems solutions to provide customers with actionable information for strike, persistent surveillance and special mission platforms. These systems perform detection, identification, tracking, targeting, navigation, weather, and situational awareness tasks on a variety of airborne platforms, including maritime, littoral and overland patrol aircraft, unmanned aerial systems, and other tactical, attack and transport rotary- and fixed-wing aircraft. Key ISRS programs include the APY-10 radar on the U.S. Navy’s P-8A Poseidon; the MTS on numerous unmanned and manned aircraft; the Enhanced Integrated Sensor Suite for the Global Hawk; the Silent Knight Terrain Following/Terrain Avoiding radar for rotary-wing platforms; and an international classified program.
Secure Sensor Solutions (S3)—S3 designs, manufactures and develops cost-effective, high-performance integrated sensor solutions for tactical and strategic platforms, which deliver trusted, actionable information for mission assurance. S3 provides integrated advanced fire control radars to customers, including the U.S. Navy, Marine Corps, and Air Force and international governments. S3 produces AESA radars for the U.S. Air Force’s F-15 and B-2 aircraft, the U.S. Navy's F/A-18E/F and EA-18G and radars for several international customers, including Australia, Canada, Japan and Saudi Arabia. S3 also develops sophisticated anti-jam GPS solutions for many customers and provides a wide range of state-of-the-art product families and engineering services for the DoD’s response to dynamic threat environments.
Electronic Warfare Systems (EWS)—EWS designs and manufactures cost-effective, high-performance electronic warfare systems and equipment for strategic and tactical aircraft, helicopters, surface ships and ground forces for the U.S. Air Force, Army, Navy, Special Operations Forces, and intelligence agencies and international governments. EWS products deliver a range of non-kinetic effects ranging from radar jamming to information operations. The EWS portfolio includes the NGJ program, integrated electronic warfare suites, development of electronic warfare planning and management tools (EW PMT), the Multi-function Integrated Receiver/Exciter System (MFIRES) product family, advanced classified programs, and products which include towed decoys, radar warning receivers, radar and communications countermeasures and missile warning sensors.
Integrated Communications Systems (ICS)—ICS is a market leader in tactical airborne communications, software-defined radio technology, advanced tactical networking, cryptology and real-time sensor networking. The ARC-231 radio is deployed on U.S. and International rotary wing platforms and fixed wing aircraft. The Vinson/ANDVT Cryptology Modernization (VACM) family of products provides secure communications for the U.S. and international customers. ICS is the only producer of Advanced Extremely High Frequency (AEHF) satellite terminals for all U.S. military branches, providing protected, highly secure satellite communications terminals for the U.S. military, including the Navy Multiband Terminal (NMT) and the Air Force Family of Advanced Beyond Line of Sight Terminal (FAB-T) and related ground terminals.
Space Systems (SS)—SS designs and manufactures space and space-qualified sensor payloads for large national programs and develops innovative solutions for emerging intelligence, defense and civil space applications. SS provides EO/IR, radio frequency, radar and laser space-based sensors to customers, including branches of the DoD, MDA, NASA, classified customers and international governments. Its major non-classified program is the JPSS program, which provides the VIIRS, an advanced imaging and radiometric sensor for NASA and NOAA weather/environmental monitoring programs.
5
Advanced Concepts Technology (ACT), an innovation incubator, is also part of SAS. ACT conducts internal research and development for SAS and contract research and development for customers, including the U.S. Air Force Research Laboratory (AFRL) and the DARPA, and produces cutting-edge products including advanced laser weapons systems (high-resolution imaging and directed energy), next-generation all-weather millimeter wave targeting radars, advanced speech recognition with natural language understanding, plus systems exploiting acoustic phenomenology.
Forcepoint—Forcepoint (formerly Raytheon|Websense) is headquartered in Austin, Texas, and develops cybersecurity products serving commercial and government organizations worldwide. Forcepoint is a joint venture of Raytheon and Vista Equity Partners created in May 2015 that brought together the capabilities of the legacy Raytheon Cyber Products (RCP) and Websense, Inc. (Websense) businesses. Forcepoint delivers a portfolio of cybersecurity capabilities, including insider threat solutions; data loss prevention; next-generation firewall technology; cloud and on premise web and email security; and cross domain transfer products. Forcepoint's customers deploy its software products on standard servers or other information technology hardware, including Forcepoint optimized appliances, as a software-as-a-service (otherwise referred to as a cloud-based or cloud service) offering, or in a hybrid hardware/cloud configuration. Forcepoint’s customers include large enterprises, small- and medium-sized businesses and both domestic and international government agencies.
In 2016, the joint venture was rebranded as Forcepoint. Forcepoint also acquired the Stonesoft next-generation firewall business, including the Sidewinder proxy firewall technologies.
Effective January 1, 2017, Forcepoint has reorganized into the following principal product lines: Data and Insider Threat Security; Cloud Security; Global Governments; and Network Security. This structure reflects the reorganization of Forcepoint’s broad portfolio of cybersecurity products into focused technology and market categories.
Data and Insider Threat Security—Data and Insider Threat Security provides data loss prevention and insider threat security products. Forcepoint’s data loss prevention suites, TRITON® AP-DATA and AP-ENDPOINT, extend data security control solutions to enterprise cloud applications, end user software applications and sensitive data and intellectual property on laptops, both on- and off-network. Forcepoint’s SureView suite of products spans analytics, insider threat, advanced threat protection and related security features.
Cloud Security—Cloud Security's suite of products includes the TRITON security platform, which provides content security solutions by integrating Forcepoint's web, email and filtering technologies into a single security architecture. These products are deployed in the cloud, on premise (e.g. a proxy server or firewall) and in a hybrid environment. Cloud Security also sells a range of optimized commercial appliances that consolidate multiple security functions into a single hardware platform and deliver real-time security functionalities.
Global Governments—In addition to providing the full suite of Forcepoint products to government customers, Global Governments provides the High Speed Guard product, which enables highly complex, bi-directional, automated data transfers between multiple domains, specializing in real-time streaming video.
Network Security—Network Security delivers the Forcepoint Stonesoft next-generation firewall and the Forcepoint Sidewinder proxy firewall products. The Forcepoint Stonesoft product provides next-generation firewall software and hardware solutions that focus on high-availability, centralized management of large networks and protection from advanced evasion techniques. The Forcepoint Sidewinder product provides proxy-based firewall software and hardware solutions, designed to allow for clear visibility and control of command filtering, protocol enforcement and application access.
In addition to the principal product lines, Forcepoint provides consulting services of certified engineers who assess, plan, design, analyze and optimize security solutions for its customers' business environments.
6
Sales to the U.S. Government
(In millions, except percentages) | 2016 | 2015 | 2014 | ||||||||
Sales to the U.S. government(1) | $ | 16,101 | $ | 15,767 | $ | 16,083 | |||||
Sales to the U.S. government as a Percentage of Total Net Sales(1) | 67 | % | 68 | % | 70 | % | |||||
Foreign military sales through the U.S. government | $ | 2,899 | $ | 2,814 | $ | 2,962 | |||||
Foreign military sales through the U.S. government as a Percentage of Total Net Sales | 12 | % | 12 | % | 13 | % | |||||
(1) | Excludes foreign military sales through the U.S. government. |
Our principal U.S. government customer is the DoD; other U.S. government customers include other U.S. Intelligence Community agencies, NASA and the FAA.
U.S. Government Contracts and Regulation
We act as a prime contractor or major subcontractor for numerous U.S. government programs. As a result, we are subject to extensive regulations and requirements of the U.S. government agencies and entities that govern these programs, including with respect to the award, administration and performance of contracts under such programs. We are also subject to certain unique business risks associated with U.S. government program funding and appropriations, U.S. government contracts, and supplying technologically-advanced, cutting-edge defense-related products and services to the U.S. government.
U.S. government contracts generally are subject to the Federal Acquisition Regulation (FAR), which sets forth policies, procedures and requirements for the acquisition of goods and services by the U.S. government; department-specific regulations that implement or supplement the FAR, such as the DoD's Defense Federal Acquisition Regulation Supplement (DFARS); and other applicable laws and regulations. These regulations impose a broad range of requirements, many of which are unique to government contracting, including various procurement, import and export, security, contract pricing and cost, contract termination and adjustment, audit and product integrity requirements. A contractor's failure to comply with these regulations and requirements could result in reductions to the value of contracts, contract modifications or termination, and the assessment of penalties and fines, and could lead to suspension or debarment, for cause, from U.S. government contracting or subcontracting for a period of time. In addition, government contractors are also subject to routine audits and investigations by U.S. government agencies such as the Defense Contract Audit Agency (DCAA) and Defense Contract Management Agency (DCMA). These agencies review a contractor's performance under its contracts, cost structure and compliance with applicable laws, regulations and standards. The DCAA and DCMA also review the adequacy of and a contractor's compliance with its internal control systems and policies, including the contractor's accounting, purchasing, property, estimating, earned value management and material management accounting systems. For a discussion of certain risks associated with compliance with U.S. government contract regulations and requirements, see “Item 1A. Risk Factors” of this Form 10-K.
U.S. government contracts include both cost reimbursement and fixed-price contracts. Cost reimbursement contracts, subject to a contractual cost-ceiling amount in certain cases, provide for the reimbursement of allowable costs plus the payment of a fee. These contracts fall into three basic types: (i) cost-plus fixed fee contracts which provide for the payment of a fixed fee irrespective of the final cost of performance; (ii) cost-plus incentive fee contracts which provide for increases or decreases in the target incentive fee, within specified limits, based upon actual cost results compared to contractual cost targets; and (iii) cost-plus award fee contracts which provide for the payment of an award fee determined at the discretion of the customer based upon the performance of the contractor against pre-established criteria. Under cost reimbursement contracts, the contractor is reimbursed periodically for allowable costs and is paid a portion of the fee based on contract progress. Some costs incidental to performing contracts have been made partially or wholly unallowable for reimbursement by statute, the FAR or other regulation. Examples of such costs include charitable contributions, certain merger and acquisition costs, lobbying costs, interest expense and certain litigation defense costs. We also classify time-and-materials (T&M) contracts as cost reimbursement contracts as they are typically used to cover certain contract costs plus a set amount of fee.
Fixed-price contracts are predominantly either firm fixed-price (FFP) contracts or fixed-price incentive (FPI) contracts. Under FFP contracts, the contractor agrees to perform a specific scope of work for a fixed price and as a result, benefits from cost savings and carries the burden of cost overruns. Under FPI contracts, the contractor shares with the U.S. government savings accrued from contracts performed for less than target costs and costs incurred in excess of targets up to a negotiated ceiling price (which is higher than the target cost) and carries the entire burden of costs exceeding the negotiated ceiling price. Accordingly, under such contracts, the contractor's profit may also be adjusted up or down depending upon whether specified
7
cost objectives are met. Under FFP and FPI type contracts, the contractor usually receives either performance-based payments (PBPs) equaling up to 90% of the contract price or monthly progress payments from the U.S. government generally in amounts equaling 80% of costs incurred under U.S. government contracts. The remaining amount, including profits or incentive fees, is billed upon delivery and acceptance of end items under the contract. The DoD has expressed a preference to utilize FPI as opposed to FFP contracts. In the event we experience a greater proportion of FPI contracts and/or progress payments for our fixed-price DoD contracts in the future than historically, it could have an adverse effect on our operating margins, cash flow and liquidity. For a discussion of certain risks associated with fixed-price and cost reimbursement contracts and risks associated with changes in U.S. government procurement rules, regulations and business practices, see “Item 1A. Risk Factors” of this Form 10-K.
U.S. government contracts generally also permit the government to terminate the contract, in whole or in part, without prior notice, at the U.S. government's convenience or for default based on performance. If a contract is terminated for convenience, the contractor is generally entitled to payments for its allowable costs and will receive some allowance for profit on the work performed. If a contract is terminated for default, the contractor is generally entitled to payments for its work that has been accepted by the U.S. government, but a termination arising out of our default could expose us to liability and have a negative impact on our ability to obtain future contracts and orders. The U.S. government's right to terminate its contracts has not had a material adverse effect upon our operations, financial condition or liquidity. For a discussion of the risks associated with the U.S. government's right to terminate its contracts, see “Item 1A. Risk Factors” of this Form 10-K.
U.S. government programs generally are implemented by the award of individual contracts and subcontracts. Congress generally appropriates funds on a fiscal year basis even though a program may extend across several fiscal years. Consequently, programs are often only partially funded initially and additional funds are committed only as Congress makes further appropriations. The contracts and subcontracts under a program generally are subject to termination for convenience or adjustment if appropriations for such programs are not available or change. The U.S. government is required to equitably adjust a contract price for additions or reductions in scope or other changes ordered by it. For a discussion of the risks associated with program funding and appropriations, see “Item 1A. Risk Factors” and “Overview” within Item 7 of this Form 10-K. In addition, because we are engaged in supplying technologically-advanced, cutting-edge defense-related products and services to the U.S. government, we are subject to certain business risks, some of which are specific to our industry. These risks include: the cost of obtaining and retaining trained and skilled employees; the uncertainty and instability of prices for raw materials and supplies; the problems associated with advanced designs, which may result in unforeseen technological difficulties and cost overruns; the intense competition and the constant necessity for improvement in facility utilization and personnel training; and the impact of potential security and cyber threats. Our sales to the U.S. government may be affected by changes in procurement policies, budget considerations, changing priorities for national defense, political developments abroad and other factors. See “Item 1A. Risk Factors” and “Overview” within Item 7 of this Form 10-K for a more detailed discussion of these and other related risks.
We are also involved in U.S. government programs, principally through our IIS and SAS business segments, that are classified by the U.S. government and cannot be specifically described in this Form 10-K. The operating results of these classified programs are included in the applicable business segment's and our consolidated results of operations. The business risks and considerations associated with these and our international classified programs generally do not differ materially from those of our other U.S. government and international programs and products.
We are subject to government regulations and contract requirements that may differ from U.S. government regulation with respect to our sales to non-U.S. customers. See International Sales below for more information regarding our sales outside of the U.S. and “Item 1A. Risk Factors” of this Form 10-K for a discussion of the risks associated with international sales.
International Sales
(In millions, except percentages) | 2016 | 2015 | 2014 | ||||||||
Total international sales(1) | $ | 7,552 | $ | 7,150 | $ | 6,541 | |||||
Total international sales as a Percentage of Total Net Sales(1) | 31 | % | 31 | % | 29 | % | |||||
(1) | Includes foreign military sales through the U.S. government of $2,899 million, $2,814 million and $2,962 million in 2016, 2015 and 2014, respectively. |
International sales are principally in the areas of air and missile defense systems, missile systems, airborne radars, naval systems, air traffic control systems, electronic equipment, computer software and systems, personnel training, equipment
8
maintenance and microwave communications technology, cybersecurity, and other products and services permitted under the International Traffic in Arms Regulations (ITAR) and the Export Administration Regulations (EAR).
Our international sales are conducted through Raytheon Company and certain U.S. and international subsidiaries. For example, Raytheon Systems Limited, a U.K. subsidiary, provides a wide range of products and services, most notably with our MS and SAS business segments, to commercial, defense and other government customers in the U.K. and globally. Raytheon Australia delivers integrated solutions to the Australian Defence Force, most notably with our IDS and IIS business segments. Generally, we internally fund our international subsidiary working capital requirements in the applicable countries. In connection with certain international sales, we utilize the services of sales representatives who are paid commissions in return for services rendered, and international consultants and advisors who are typically paid a fixed retainer fee. Our Forcepoint joint venture also sells certain products and services, both domestically and internationally, primarily through a network of distributors and value-added resellers.
Sales and income from international operations and investments are subject to U.S. government laws, regulations and policies, including the ITAR, the EAR and the Foreign Corrupt Practices Act (FCPA) and other anti-corruption laws and the export laws and regulations described below. They are also subject to foreign government laws, regulations and procurement policies and practices, which may differ from U.S. government regulation, including export-import control, technology transfer, investments, exchange controls, repatriation of earnings and requirements to expend a portion of program funds in-country through manufacturing agreements or other financial support obligations, known as offset obligations. In addition, embargoes, international hostilities and changes in currency and commodity values can also impact our international sales. Exchange restrictions imposed by various countries could restrict the transfer of funds between countries, us and our subsidiaries. We have acted to protect ourselves against various risks through insurance, foreign exchange contracts, contract provisions, government guarantees and/or progress payments. Our international sales in functional currencies other than the U.S. dollar were approximately $1.3 billion in both 2016 and 2015, and $1.1 billion in 2014, the majority of which were in British pounds and Australian dollars with the remainder primarily in euros and Canadian dollars. See total net sales and property, plant and equipment by geographical area set forth in “Note 17: Business Segment Reporting” within Item 8 of this Form 10‑K.
Depending on the type of international sale, Raytheon must either seek various approvals from the U.S. government under the foreign military sales process or may require an export authorization and the issuance of a license by either the U.S. Department of State under the Arms Export Control Act of 1976 and its implementing regulations under the ITAR, the U.S. Department of Commerce under the Export Administration Act of 1979 and its implementing regulations under the EAR, as kept in force by the International Emergency Economic Powers Act of 1977 (IEEPA), and/or the U.S. Department of the Treasury under IEEPA or the Trading with the Enemy Act of 1917. Such licenses and authorizations may be denied for reasons of U.S. national security or foreign policy. In the case of certain exports of defense equipment and services, the Department of State must notify Congress at least 15-30 days (depending on the identity of the importing country that will utilize the equipment and services) prior to authorizing such exports. During that time, Congress may take action to block or delay a proposed export by joint resolution which is subject to Presidential veto. Additional information regarding the risks associated with our international business is contained in “Item 1A. Risk Factors” of this Form 10-K.
Classified Sales
Classified sales include U.S. government sales on programs designated as classified by the U.S. government, as well as international sales on programs for which the customer, end user or end product is prohibited from being publicly disclosed. Total classified sales were 17% in 2016, 16% in 2015 and 15% in 2014.
9
Backlog
% of Total Backlog(2) | |||||||||||||
(In millions, except percentages) | 2016 | 2015 | 2016 | 2015 | |||||||||
Total U.S. government backlog(1) | $ | 21,133 | $ | 19,228 | 57 | % | 55 | % | |||||
Total non-U.S. government domestic backlog | 623 | 631 | 2 | % | 2 | % | |||||||
Total domestic backlog | 21,756 | 19,859 | 59 | % | 57 | % | |||||||
Total foreign military sales backlog | 5,969 | 5,685 | 16 | % | 16 | % | |||||||
Total direct foreign government backlog | 8,320 | 8,240 | 23 | % | 24 | % | |||||||
Total non-government foreign backlog | 810 | 885 | 2 | % | 3 | % | |||||||
Total international backlog | 15,099 | 14,810 | 41 | % | 43 | % | |||||||
Total backlog | $ | 36,855 | $ | 34,669 | 100 | % | 100 | % | |||||
(1) | Excludes foreign military sales backlog through the U.S. government which is included in total international backlog. |
(2) | Percentages may not foot due to rounding. |
Approximately $18.1 billion of the December 31, 2016 year-end backlog is not expected to be filled during the following twelve months. These amounts include both funded backlog (unfilled orders for which funding is authorized, appropriated and contractually obligated by the customer) and unfunded backlog (firm orders for which funding has not been appropriated or obligated to us). For additional information related to backlog figures, see “Segment Results” within Item 7 of this Form 10-K.
Research and Development
We conduct extensive research and development activities to continually enhance our existing products and services and develop new products and services to meet our customers’ changing needs and requirements, and address new market opportunities. During 2016, we expended $755 million on research and development efforts compared to $706 million and $500 million in 2015 and 2014, respectively. These expenditures principally have been for product development for the U.S. government. We also conduct funded research and development activities under U.S. government contracts which are included in total net sales. For additional information related to our research and development activities, see “Note 1: Summary of Significant Accounting Policies” within Item 8 of this Form 10-K.
Raw Materials, Suppliers and Seasonality
We are dependent upon the availability of materials and major components and the performance of our suppliers and subcontractors. Some products require relatively scarce raw materials. We generally have not experienced significant difficulties in procuring the necessary raw materials, components and other supplies for our products.
In addition, we must comply with specific procurement requirements which may, in effect, limit the suppliers and subcontractors we may utilize. In some instances, for a variety of reasons, we are dependent on sole-source suppliers. We enter into long-term or volume purchase agreements with certain suppliers and take other actions to ensure the availability of needed materials, components and subsystems. We are also dependent on suppliers to provide genuine original equipment manufacturer parts and have a robust set of standardized policies to detect counterfeit material, especially electronic components, throughout our supply chain.
In recent years, our revenues in the second half of the year have generally exceeded revenues in the first half. Some of the factors that can affect revenue recognition between accounting periods include the timing of new program awards (including international contract awards and approvals), the availability of U.S. government funding, product deliveries (which are dependent on availability of materials) and customer acceptance. We expect this trend to continue in 2017.
Competition
We directly participate in most major areas of development in the defense and government electronics, space, information technology and technical services and support markets. Technical superiority, reputation, price, past performance, delivery schedules, financing and reliability are among the principal competitive factors considered by customers in these markets. We also compete in the commercial cybersecurity market, which is characterized by rapid changes in technology, products, customer specifications and industry standards. We compete worldwide with a number of U.S. and international companies
10
in these markets, some of which may have more extensive or more specialized engineering, manufacturing and marketing capabilities than we do in some areas. We frequently partner on various programs with our major suppliers, some of whom are, from time to time, competitors on other programs. In addition, U.S. defense spending levels in the future are increasingly difficult to predict. Changes in U.S. defense spending may potentially limit certain future market opportunities. See “Item 1A. Risk Factors” and “Overview” within Item 7 of this Form 10-K for a more detailed discussion of these and other related risks.
Intellectual Property
We own an intellectual property portfolio that includes many U.S. and foreign patents, as well as unpatented trade secrets and know-how, data, software, trademarks and copyrights, all of which contribute to the preservation of our competitive position in the market. In certain instances, we have augmented our technology base by licensing the proprietary intellectual property of others. We also license our intellectual property to others, including our customers, in certain instances. The U.S. government has licenses to certain of our intellectual property, including certain patents, developed in the performance of U.S. government contracts, and has the right to use and authorize others to use such intellectual property, including the inventions covered by such patents for U.S. government purposes. While our intellectual property rights in the aggregate are important to our operations, we do not believe that any particular trade secret, patent, trademark, copyright, license or other intellectual property right is of such importance that its loss or termination would have a material effect on our business.
Employment
As of December 31, 2016, we had approximately 63,000 employees.
Environmental Regulation
Our operations are subject to and affected by a variety of international, federal, state and local environmental protection laws and regulations. We have provided for the estimated cost to complete remediation—or, in the case of multi-party sites, our reasonably expected share thereof—where we have determined that it is probable that we will incur such costs in the future in connection with (i) facilities that are now, or were previously, owned or operated by us, (ii) sites where we have been named a Potentially Responsible Party (PRP) by the U.S. Environmental Protection Agency (EPA) or similarly designated by other environmental agencies, or (iii) sites where we have been named in a cost recovery or contribution claim by a non-governmental third party. It is difficult to estimate the timing and ultimate amount of environmental cleanup costs to be incurred in the future due to the uncertainties regarding the extent of the required cleanup, the discovery and application of innovative remediation technologies, and the status and interpretation of laws and regulations.
If we are ultimately found to have liability at a multi-party site where we have been designated a PRP or have been named in a cost recovery or contribution claim from a non-governmental third party, we expect that the actual costs of remediation will be shared with other PRPs. Generally in the U.S. and certain other countries, PRPs that are ultimately determined to be responsible parties are strictly liable for site clean-up and usually agree among themselves to share, on an allocated basis, the costs and expenses for investigation and remediation of hazardous materials. Under existing U.S. environmental laws, responsible parties are usually jointly and severally liable and, therefore, potentially liable for the full cost of funding such remediation. In the unlikely event that we are required to fund the entire cost of such remediation, the statutory framework provides that we may pursue rights of contribution from the other PRPs. The amounts we record do not reflect the unlikely event that we would be required to fund the entire cost of such remediation, nor do they reflect the possibility that we may recover some of these additional environmental costs from insurance policies or from other PRPs. However, a portion of these costs is eligible for future recovery through the pricing of our products and services to the U.S. government.
We manage various government-owned facilities on behalf of the U.S. government. At such facilities, environmental compliance and remediation costs have historically been primarily the responsibility of the U.S. government and we relied (and continue to rely with respect to past practices) upon U.S. government funding to pay such costs. While the government remains responsible for capital and operating costs associated with environmental compliance, responsibility for fines and penalties associated with environmental noncompliance is typically borne by either the U.S. government or the contractor, depending on the contract and the relevant facts. Fines and penalties are unallowable costs under the contracts pursuant to which such facilities are managed.
Most of the U.S. laws governing environmental matters include criminal provisions. If we were to be convicted of a criminal violation of certain U.S. federal environmental statutes, including the Federal Clean Air Act and the Clean Water Act, the facility or facilities involved in the violation would be placed by the EPA on the “Excluded Parties List” maintained by the Government Services Administration. The listing would continue until the EPA concluded that the cause of the violation had
11
been cured. Listed facilities cannot be used in performing any U.S. government contract awarded during any period of listing by the EPA.
Additional information regarding the effect of compliance with environmental protection requirements and the resolution of environmental claims against us and our operations, including expected remediation costs, is contained in “Item 1A. Risk Factors”, “Commitments and Contingencies” within Item 7 and “Note 12: Commitments and Contingencies” within Item 8 of this Form 10-K.
Available Information
Our internet address is www.raytheon.com. We use our Investor Relations website as a routine channel for distribution of important information, including news releases, analyst presentations and financial information. We make available free of charge on or through our Investor Relations website our annual reports and quarterly reports on Forms 10-K and 10-Q (including related filings in XBRL format), current reports on Form 8-K and amendments to those reports as soon as reasonably practicable after we electronically file such material with, or furnish it to, the Securities and Exchange Commission (SEC). Our SEC filings are also at the Public Reference Room of the SEC at 100 F Street, N.E., Washington, D.C. 20549. You may obtain information on the operation of the Public Reference Room by calling 1-800-SEC-0330. In addition, the SEC also maintains an internet site at www.sec.gov that contains reports, proxy statements and other information regarding registrants that file electronically, including Raytheon.
Additionally, we also make available on or through our website copies of our key corporate governance documents, including our Governance Principles, Certificate of Incorporation, By-laws and charters for the Audit Committee, Management Development and Compensation Committee, Governance and Nominating Committee, Public Affairs Committee and Special Activities Committee of the Board of Directors and our code of ethics entitled “Code of Conduct”. Raytheon stockholders may request free copies of these documents from our Investor Relations Department by writing to Raytheon Company, Investor Relations, 870 Winter Street, Waltham, MA 02451, or by calling (781) 522-5123 or sending an email request to invest@raytheon.com.
The content on any website referred to in this Form 10-K is not incorporated by reference into this Form 10-K unless expressly noted.
ITEM 1A. RISK FACTORS
This Form 10-K and the information we are incorporating by reference contain forward-looking statements within the meaning of federal securities laws, including information regarding our financial outlook, future plans, objectives, business prospects, products and services, trends and anticipated financial performance including with respect to our revenue, liquidity and capital resources; our bookings and backlog; international sales; cybersecurity sales; our pension and other postretirement benefit (PRB) expense and funding; our expectations regarding customer contracts; our capital expenditures; the impact of new accounting pronouncements; our expected tax payments; our unrecognized tax benefits; the impact of acquisitions, investments and other business arrangements; the impact and outcome of audits and legal and administrative proceedings, claims, investigations, commitments and contingencies; and the impact of changes in fair value of our reporting units; the impact of changes in foreign currency rates and interest rates; as well as information regarding domestic and international defense spending, budgets and business practices. You can identify these statements by the fact that they include words such as “will”, “believe”, “anticipate”, “expect”, “estimate”, “intend”, “plan”, or variations of these words, or similar expressions. These forward-looking statements are not statements of historical facts and represent only our current expectations regarding such matters. These statements inherently involve a wide range of known and unknown uncertainties. Our actual actions and results could differ materially from what is expressed or implied by these statements. Specific factors that could cause such a difference include, but are not limited to, those set forth below and other important factors disclosed previously and from time to time in our other filings with the Securities and Exchange Commission (SEC). Given these factors, as well as other variables that may affect our operating results, you should not rely on forward-looking statements, assume that past financial performance will be a reliable indicator of future performance, or use historical trends to anticipate results or trends in future periods. We expressly disclaim any obligation or intention to provide updates to the forward-looking statements and the estimates and assumptions associated with them, except as required by law.
12
We depend on the U.S. government for a substantial portion of our business, and changes in government defense spending and priorities could have consequences on our financial position, results of operations and business.
In 2016, U.S. government sales, excluding foreign military sales, accounted for approximately 67% of our total net sales. Our revenues from the U.S. government largely result from contracts awarded to us under various U.S. government programs, primarily defense-related programs with the U.S. Department of Defense (DoD), as well as a broad range of programs with the U.S. Intelligence Community and other departments and agencies. The funding of our programs is subject to the overall U.S. government policies, budget and appropriation decisions and processes which are driven by numerous factors, including geopolitical events, macroeconomic conditions, and the ability of the U.S. government to enact relevant legislation, such as appropriations bills and accords on the debt ceiling.
In recent years, U.S. government appropriations have been affected by larger U.S. government budgetary issues and related legislation. In 2011, Congress enacted the Budget Control Act of 2011 (BCA), which established specific limits on annual appropriations for fiscal years (FY) 2012–2021. The BCA has been amended a number of times, most recently by the Bipartisan Budget Act of 2015 (BBA). As a result, DoD funding levels have fluctuated over this period and have been difficult to predict. For example, the DoD budget was reduced by 7.8% in FY 2013 as compared to FY 2012, but remained essentially flat for FY 2014 and 2015. The BBA raised DoD FY 2016 funding approximately 5% relative to FY 2015, but the ultimate DoD funding for FY 2017 remains uncertain because the DoD is currently operating under a Continuing Resolution (CR) for FY 2017. The CR limits funding levels to FY 2016 and does not authorize new spending initiatives. Future spending levels are subject to a wide range of outcomes, depending on Congressional action. In addition, in recent years the U.S. government has been unable to complete its budget process before the end of its fiscal year, resulting in both a governmental shut-down and CRs to extend sufficient funds only for U.S. government agencies to continue operating. Additionally, the national debt has recently threatened to reach the statutory debt ceiling, and such an event in future years could result in the U.S. government defaulting on its debts.
As a result, defense spending levels are difficult to predict beyond the near-term due to numerous factors, including the external threat environment, future governmental priorities and the state of governmental finances. Significant changes in defense spending or changes in U.S. government priorities, policies and requirements could have a material adverse effect on our results of operations, financial condition or liquidity.
Our financial results largely are dependent on our ability to perform on our U.S. government contracts, which are subject to uncertain levels of funding and timing, as well as termination. Our financial results could also be affected by development delays, cost overruns or product failures in connection with these contracts.
Our financial results largely are dependent on our performance under our U.S. government contracts. While we are involved in numerous programs and are party to thousands of U.S. government contracts, the termination of one or more of such contracts, or the occurrence of delays, cost overruns and product failures in connection with one or more large contracts, could negatively impact our results of operations, financial condition or liquidity. Furthermore, we can give no assurance that we would be awarded new U.S. government contracts to offset the revenues lost as a result of termination of any of our contracts.
U.S. government contracts generally permit the government to terminate the contract, in whole or in part, without prior notice, at the U.S. government's convenience or for default based on performance. If one of our contracts is terminated for convenience, we would generally be entitled to payments for our allowable costs and would receive some allowance for profit on the work performed. If one of our contracts is terminated for default, we would generally be entitled to payments for our work that has been accepted by the U.S. government. A termination arising out of our default could expose us to liability and have a negative impact on our ability to obtain future contracts and orders. Furthermore, on contracts for which we are a subcontractor and not the prime contractor, the U.S. government could terminate the prime contract for convenience or otherwise, irrespective of our performance as a subcontractor.
The funding of U.S. government programs is subject to congressional appropriations, which are made on a fiscal year basis even for multi-year programs. Consequently, programs are often only partially funded initially and may not continue to be funded in future years. In addition, regular appropriation bills may be delayed, which may result in revenue and collection delays or delays in our contract performance due to lack of funds to procure related products and services. Under certain circumstances, we may use our own funds to meet our customer's desired delivery dates or other requirements. Furthermore,
13
if appropriations for one of our programs become unavailable, or are reduced or delayed, the U.S. government may terminate our contract or subcontract under such program.
Our U.S. government contracts also typically involve the development, application and manufacture of advanced defense and technology systems and products aimed at achieving challenging goals. New technologies may be untested or unproven. In some instances, product requirements or specifications may be modified. As a result, we may experience technological and other performance difficulties, which may result in delays, setbacks, cost overruns and product failures, in connection with performing our U.S. government contracts. Additionally, in order to win certain U.S. government contracts, we may be required to invest in development prior to award as our customers demand more mature and proven solutions. These additional investment amounts may not be recouped if we are not chosen for new contract awards.
Our U.S. government contracts are typically either fixed-priced contracts or cost reimbursable contracts. Fixed-price contracts represent approximately 56% of our backlog, and are predominantly either firm fixed-price (FFP) contracts or fixed-price incentive (FPI) contracts. Under FFP contracts, we receive a fixed price irrespective of the actual costs we incur and we therefore carry the burden of any cost overruns. Under FPI contracts, we carry the burden of cost overruns in excess of a negotiated cost ceiling, and share with the U.S. government any costs incurred in excess of a negotiated cost target up to the cost ceiling amount. Under cost reimbursable contracts, we are reimbursed for allowable costs and paid a fixed or performance-based fee, but generally are not reimbursed for costs not allowable under the contract or applicable regulations or unauthorized costs above any cost ceiling amount. Due to the nature of our work under many of our U.S. government contracts discussed above, we may experience unforeseen technological difficulties and cost overruns. If we are unable to control costs or if our initial cost estimates are incorrect, our profitability could be negatively affected, particularly under fixed-price development contracts. Some of our U.S. government contracts have provisions relating to cost controls and audit rights, and if we fail to meet the terms specified in those contracts, this could have a negative impact on our result of operations or financial condition and liquidity. Our contracts also require us to comply with extensive and evolving procurement rules and regulations, which are discussed in more detail below.
In addition, we are involved in programs that are classified by the U.S. government, principally through our Intelligence, Information and Services (IIS) and Space and Airborne Systems (SAS) business segments, which have security requirements that place limits on our ability to discuss our performance on these programs, including any risks, disputes and claims.
Our future success depends on our ability to develop new offerings and technologies for our current and future markets.
To achieve our business strategies and continue to grow our revenues and operating profit, we must successfully develop new offerings and technologies or adapt or modify our existing offerings and technologies for our current and future markets, including new international, civil, commercial, growth and emerging markets. Accordingly, our future performance depends on a number of factors, including our ability to:
- | Identify the needs of, and growth opportunities in, new and emerging markets; |
- | Identify emerging technological and other trends in our current and future markets; |
- | Identify additional uses for our existing technology to address customer needs in our current and future markets; |
- | Develop and maintain competitive products and services for our current and future markets; |
- | Enhance our offerings by adding innovative features that differentiate our offerings from those of our competitors; |
- | Develop, manufacture and bring solutions to market quickly at cost-effective prices; |
- | Enhance product designs for export and releasability to international markets; and |
- | Effectively structure our businesses, through the use of joint ventures, collaborative agreements and other forms of alliances, to reflect the competitive environment. |
We believe that, in order to remain competitive in the future, we will need to continue to invest significant financial resources to develop new offerings and technologies or to adapt or modify our existing offerings and technologies, including through customer funded and internal research and development, acquisitions and joint ventures or other teaming arrangements. We believe this is true to meet demands and expand within both our domestic and international markets, including emerging opportunities within the DoD market as well as our Forcepoint joint venture’s growth in the commercial cybersecurity market. Our expenditures to develop new offerings and technologies, or adapt and modify existing offerings and technologies, through research and development, acquisitions, joint ventures or other arrangements could divert our attention and resources from
14
other projects, and we cannot be sure that these expenditures will ultimately lead to the timely development of new offerings and technologies or identification of and expansion into new markets.
Due to the design complexity of our products, we may in the future experience delays in completing the development and introduction of new products. Any delays could result in increased costs of development or deflect resources from other projects. In addition, there can be no assurance that the market for our offerings will develop or continue to expand or that we will be successful in newly identified markets as we currently anticipate or that the acquisitions, joint ventures or other teaming arrangements we may enter into in pursuit of developing new offerings and technologies will be successful. The failure of our technology to gain market acceptance could significantly reduce our revenues and harm our business. Furthermore, we cannot be sure that our competitors will not develop competing technologies which gain market acceptance in advance of our products.
Additionally, the possibility exists that our competitors might develop new technology or offerings that might cause our existing technology and offerings to become obsolete. If we fail in our new product development efforts or our products or services fail to achieve market acceptance more rapidly than our competitors, our ability to procure new contracts could be negatively impacted, which would negatively impact our results of operations and financial condition.
Competition within our markets may reduce our revenues and market share and limit our future market opportunities.
We operate in highly competitive markets and our competitors may have more extensive or more specialized engineering, manufacturing and marketing capabilities than we do in some areas. We anticipate increased competition in our core markets as a result of continued defense industry consolidation, including cross-border consolidation of competition, and the expansion of competitors’ capabilities throughout the supply chain through vertical integration, each of which has enabled companies to enhance their competitive position against us. We are also facing heightened competition in our domestic and international markets from foreign and multinational firms. In addition, as discussed in more detail above, changes in U.S. defense spending and the U.S. government procurement environment may limit certain future market opportunities for us. For example, the DoD increasingly is committed to awarding contracts through competitive bidding and relying on competitive contract award types. Additionally, some customers, including the DoD, are increasingly turning to commercial contractors, rather than traditional defense contractors, for information technology and other support work. If we are unable to continue to compete successfully against our current or future competitors in our core markets, we may experience declines in revenues and market share which could negatively impact our results of operations, financial condition or liquidity. In addition, due to the current competitive environment, we continue to see an increase in bid protests from unsuccessful bidders on new program awards. Generally, a bid protest will delay the start of contract activities, delay earnings, and could result in the award decision being overturned, requiring a re-bid of the contract.
In addition, our Forcepoint joint venture, formed in May 2015, to accelerate our growth in the commercial cybersecurity market, faces significant competition in its areas of market focus due to rapid changes in technology, products, customer specifications and industry standards, as well as a wide range of market competitors, some of whom are significantly larger with broader product and service offerings, have best-of-breed products and/or maintain strong customer relationships. In order to compete effectively, Forcepoint must successfully execute on its growth strategy, including the development of new products and services. If Forcepoint is unable to compete successfully in the commercial cybersecurity market, it may divert financial and management resources that would otherwise be used to benefit our other operations.
As a U.S. government contractor, we are subject to extensive procurement rules and regulations. Changes in such rules, regulations and business practice could negatively affect current programs and potential awards, and our business could be negatively affected if we fail to comply with any procurement rules and regulations.
U.S. government contractors must comply with specific procurement regulations and other requirements including export-import control, security, contract pricing and cost, contract termination and adjustment, audit and product integrity requirements. These requirements impact our performance and compliance costs. In addition, the U.S. government has and may continue to implement initiatives focused on efficiencies, affordability and cost growth and other changes to its procurement practices which may negatively affect our results of operations, financial condition or liquidity, and could affect whether and, if so, how we pursue certain opportunities and the terms under which we are able to do so.
15
The DoD has adopted various procurement policies and practices, including contractual payment and cost reimbursement terms such as incentive-based contracts that require contractors to share cost overruns and underruns with the U.S. government, and terms relating to contractor independent research and development efforts under Better Buying Power 3.0. Recent legislation provides for other requirements, some of which differ with these policies and practices. It is unclear which policies the new Administration will follow, implement or change.
In addition, failure to comply with the procurement regulations and requirements could result in reductions of the value of contracts, contract modifications or termination, cash withholds on contract payments, forfeiture of profits, and the assessment of civil and criminal penalties and fines, which could negatively impact our results of operations, financial condition or liquidity. Our failure to comply with these regulations and requirements could also lead to suspension or debarment, for cause, from U.S. government contracting or subcontracting for a period of time. Among the causes for debarment are violations of various statutes, including those related to procurement integrity, export control, U.S. government security regulations, employment practices, protection of the environment, accuracy of records and the recording of costs, and foreign corruption. The penalties or sanctions, including contract termination, resulting from any failure to comply with applicable requirements could have a negative impact on our results of operations, financial condition or liquidity, and could have a negative impact on our reputation and ability to procure other U.S. government contracts in the future.
Issues with component availability, subcontractor performance or key supplier performance may affect our ability to manufacture and deliver our products and services.
We are dependent upon the delivery by suppliers of materials and the assembly by subcontractors of major components and subsystems used in our products in a timely and satisfactory manner and in full compliance with applicable terms and conditions. Some products require relatively scarce raw materials. We also are subject to specific procurement requirements that limit the types of materials we use and may, in effect, limit the suppliers and subcontractors we may utilize. These procurement requirements include restrictions on the use of certain chemicals in the European Union and requirements for genuine original equipment manufacturer parts. As we continue to seek further cost efficiencies throughout the enterprise, we may centralize procurements in order to attain better pricing through strategic sourcing, which may increase our dependency on certain suppliers. In some instances, we are dependent on sole-source suppliers. If certain component materials are not available or if any of these suppliers or subcontractors otherwise fails to meet our needs or becomes insolvent, we may not have readily available alternatives or alternatives at prices that meet the demands of our customers. While we enter into long-term or volume purchase agreements with certain suppliers and take other actions, such as accelerating supplier payments commensurate with value delivered, to ensure financial viability and the availability of needed materials, components and subsystems, we cannot be sure that such items will be available in the quantities we require, if at all. In addition, some of our suppliers or subcontractors, especially smaller entities, may be susceptible to changes in global economic conditions that could impair their ability to meet their obligations to us. If we experience a material supplier or subcontractor problem, our ability to satisfactorily and timely complete our customer obligations could be negatively impacted, which could result in reduced sales, termination of contracts and damage to our reputation and relationships with our customers. We could also incur additional costs in addressing such a problem. Any of these events could have a negative impact on our results of operations, financial condition or liquidity. In addition, we must conduct diligence and provide disclosure regarding the use of certain minerals, known as conflict minerals, which may impact our procurement practices and increase our costs.
Our international business is subject to geopolitical and economic factors, regulatory requirements and other risks.
Our international business exposes us to geopolitical and economic factors, regulatory requirements, increasing competition and other risks associated with doing business in foreign countries. These risks differ from and potentially may be greater than those associated with our domestic business. In 2016, our sales to customers outside the U.S. (including foreign military sales through the U.S. government) accounted for 31% of our total net sales. Our exposure to such risks may increase if our international business continues to grow as we anticipate.
Our international business is sensitive to changes in the priorities and budgets of international customers, which may be driven by changes in threat environments, geopolitical uncertainties, volatility in worldwide economic conditions, and various regional and local economic and political factors, including volatility in energy prices, changes in U.S. foreign policy, and other risks and uncertainties. Our international sales are subject to U.S. laws, regulations and policies, including the International Traffic in Arms Regulations (ITAR), the Export Administration Regulations (EAR), the Foreign Corrupt Practices Act (FCPA), and other anti-corruption and export laws and regulations. We maintain policies and controls to comply with such laws and
16
regulations and exercise oversight of such compliance. However, any failure by us or others working on our behalf to comply with these laws and resolutions could result in criminal, civil or administrative penalties, including fines, suspension or debarment from government contracts or suspension of our ability to export our products. In addition, due to the nature of our products, we must first obtain licenses and authorizations from various U.S. government agencies before we are permitted to sell our products outside of the U.S. We can give no assurance that we will continue to be successful in obtaining or maintaining the necessary licenses or authorizations or that certain sales will not be prevented or delayed. Any significant impairment of our ability to sell products outside of the U.S. could negatively impact our results of operations, financial condition or liquidity.
Our international sales are also subject to local government laws, regulations, and procurement policies and practices which may differ from U.S. government regulations. These include regulations relating to export-import control, technology transfer, investments, exchange controls and repatriation of earnings. Furthermore, our international sales contracts may be subject to non-U.S. contract laws and regulations and include contractual terms that differ from those of similar contracts in the U.S. or terms that may be interpreted differently by foreign courts. In addition, the occurrence of delays, cost overruns and product failures, or technological or other difficulties could affect our ability to perform on our international contracts and negatively affect our profitability, and these contracts may be subject to termination for default based on performance. These contracts may also be subject to termination at the customer's convenience, and may be subject to funding risks. In connection with our international business, we also operate subsidiaries domiciled in non-U.S. locations that are subject to local government laws and regulations which may differ from U.S. government regulations. In addition, the timing of orders, customer negotiations, governmental approvals and notifications from our international customers can be less predictable than from our domestic customers, and this may lead to variations in international bookings and sales each year. We must also manage a certain degree of exposure to the risk of currency fluctuations.
Our international business faces substantial competition from both U.S. companies and foreign companies. In some instances, foreign companies may receive loans, marketing subsidies and other assistance from their governments that may not be available to U.S. companies. In addition, foreign companies may be subject to fewer restrictions on technology transfer than U.S. companies.
Our international contracts may include industrial cooperation agreements requiring specific local purchases, manufacturing agreements or financial support obligations, known as offset obligations, and provide for penalties if we fail to meet such requirements. Approvals of offset thresholds and requirements may be subjective and time-consuming and may delay contract awards. The costs to satisfy our offset obligations are included in the estimates of our total costs to complete the contract. Offset requirements may, in certain countries, include the creation of a joint venture with a local company, which may control the venture. This could result in liability for violations of law for actions taken by these entities, such as laws related to anti-corruption, import and export, or local laws which may differ from U.S. laws and requirements. In addition, the ability to recover investments that we make may be dependent upon the success of ventures that we do not control. Such offset obligations are generally multi-year arrangements and may provide for penalties in the event we fail to perform in accordance with the offset requirements. In addition, customers' demands may increase for greater offset commitment levels, higher-value content to satisfy offset obligations, including the transfer of technologies and capabilities, and local economic development. We also are exposed to risks associated with using third-party foreign representatives and consultants for international sales, and teaming with international subcontractors, partners and suppliers in connection with international programs. As a result of the above factors, we could experience financial penalties and award and funding delays on international programs, our profitability on these programs could be negatively affected, and we could incur losses on these programs which could negatively impact our results of operations, financial condition or liquidity.
We depend on the recruitment and retention of qualified personnel, and our failure to attract and retain such personnel could seriously harm our business.
Due to the specialized nature of our business, our future performance is highly dependent upon the continued services of our key technical personnel and executive officers, the development of additional management personnel and the hiring of new qualified technical, manufacturing, marketing, sales and management personnel for our operations. In addition, certain personnel may be required to receive various security clearances and substantial training in order to work on certain programs or perform certain tasks. Competition for personnel is intense and we may not be successful in attracting or retaining qualified personnel. Furthermore, a significant percentage of our current workforce is nearing retirement. To the extent that we lose experienced personnel, it is critical that we develop other employees, hire new qualified personnel and successfully manage
17
the transfer of critical knowledge. The loss of key employees, our inability to attract new qualified employees or adequately train employees, or the delay in hiring key personnel could seriously harm our business.
Our business could be negatively impacted by cyber attacks and other security breaches and other disruptions.
As part of our business, we face certain security threats, including threats to our information technology infrastructure, attempts to gain access to our proprietary, sensitive or classified information, threats to physical security, including our facilities and personnel, and threats from terrorism or similar acts. We also face the potential for business disruptions associated with natural disasters. Cybersecurity threats in particular are persistent, evolve quickly and include, but are not limited to, computer viruses, attempts to access information, denial of service attacks and other electronic security breaches. Our information technology networks and related systems are critical to the operation of our business and essential to our ability to successfully perform day-to-day operations. We have in the past and will in the future continue to be the subject of cybersecurity threats. In addition, our customers, suppliers, subcontractors and other third parties with whom we do business generally face similar security threats, and in some cases we must rely on the safeguards put in place by these parties to protect against security threats. We believe we have implemented appropriate measures and controls and have invested in significant resources to appropriately identify and monitor these threats and mitigate potential risks, including risks involving our customers and suppliers. However, there can be no assurance that any such actions will be sufficient to prevent cybersecurity breaches, disruptions to mission critical systems, the unauthorized release of sensitive information or corruption of data, or harm to facilities or personnel.
In addition, as a provider of products and services to government and commercial customers, including through Forcepoint, our products and services may be the targets of cyber attacks that attempt to sabotage or otherwise disable them, or our cybersecurity and other products and services ultimately may not be able to effectively detect, prevent, or protect against or otherwise mitigate customer losses from all cyber attacks.
The impact of these security threats and other disruptions, including cyber attacks and other security breaches, is difficult to predict. Furthermore, our insurance coverage may not be adequate to cover all related costs. These threats and other events could disrupt our operations, or the operations of our customers, suppliers, subcontractors and other third parties, could require significant management attention and resources, could result in the loss of business, regulatory actions and potential liability, and could negatively impact our reputation among our customers and the public, any one of which could have a negative impact on our financial condition, results of operations or liquidity.
Our business could be adversely affected by a negative audit or investigatory finding by the U.S. government.
As a government contractor, we are subject to audits and investigations by U.S. government agencies including the Defense Contract Audit Agency (DCAA), the Defense Contract Management Agency (DCMA), the Inspectors General of the DoD and other departments and agencies, the Government Accountability Office, the Department of Justice (DoJ) and Congressional Committees. From time to time, these and other agencies investigate or conduct audits to determine whether our operations are being conducted in accordance with applicable requirements. The DCAA and DCMA also review the adequacy of, and our compliance with, our internal control systems and policies, including our accounting, purchasing, property, estimating, earned value management and material management accounting systems. Our final allowable incurred costs for each year are subject to audit and have from time to time resulted in disputes between us and the U.S. government. The DoJ has, from time to time, convened grand juries to investigate possible irregularities in our costs. Any costs found to be improperly allocated to a specific contract will not be reimbursed or must be refunded if already reimbursed. An adverse outcome of any audit or investigation could result in civil and criminal penalties and fines, which could negatively impact our results of operations, financial condition or liquidity. In addition, we could suffer serious reputational harm, which could negatively affect our financial position, results of operations or liquidity, if allegations of impropriety were made against us.
We use estimates in accounting for many of our programs, and changes in our estimates could adversely affect our future financial results.
Contract accounting requires judgment relative to assessing risks, including risks associated with customer-directed delays and reductions in scheduled deliveries, unfavorable resolutions of claims and contractual matters, management's judgments associated with estimating contract revenues and costs, and assumptions for schedule and technical issues. Due to the size and nature of many of our contracts, the estimation of total revenues and cost at completion is complicated and subject to many variables. For example, we must make assumptions regarding the length of time to complete a contract because costs
18
also include expected increases in wages and prices for materials; consider whether the intent of entering into multiple contracts was effectively to enter into a single project in order to determine whether such contracts should be combined or segmented; consider incentives or penalties related to performance on contracts in estimating sales and profit rates, and record them when there is sufficient information for us to assess anticipated performance; and use estimates of award fees in estimating sales and profit rates based on actual and anticipated awards. Because of the significance of management's judgments and estimation processes described above, it is likely that materially different amounts could be recorded if we used different assumptions or if the underlying circumstances were to change. Changes in underlying assumptions, circumstances or estimates may adversely affect our future results of operations and financial condition.
For a detailed discussion of how our financial statements can be affected by contract accounting policies, see “Critical Accounting Estimates” within Item 7 of this Form 10-K.
Significant changes in key estimates and assumptions, such as discount rates and assumed long-term return on plan assets (ROA), as well as our actual investment returns on our pension plan assets and other actuarial factors, could affect our earnings, equity and pension contributions in future periods.
We must determine our pension and PRB plans' expense or income which involves significant judgment, particularly with respect to our discount rate, long-term ROA and other actuarial assumptions. The discount rate assumption is set annually and we determine on an annual basis whether it is appropriate to change our long-term ROA assumption. These assumptions and other actuarial assumptions may change significantly due to changes in economic, legislative, and/or demographic experience or circumstances. Changes in our assumptions could result in negative changes to our pension and PRB plans' expense and funded status, and our cash contributions to such plans, which changes would negatively impact our results of operations. In addition, differences between our actual investment returns and our long-term ROA assumption would result in a change to our pension and PRB plans' expense and funded status and our required contributions to the plans. They may also be impacted by changes in regulatory, accounting and other requirements applicable to pensions.
For a detailed discussion of how our financial statements can be affected by pension and PRB plan accounting policies, see “Critical Accounting Estimates” within Item 7 of this Form 10-K.
If we fail to manage our acquisitions, investments, divestitures, joint ventures and other transactions successfully, these activities could adversely affect our future financial results.
In pursuing our business strategies, we continually review, evaluate and consider potential investments, acquisitions, divestitures, and joint venture, teaming and other collaborative arrangements. We undertake to identify opportunities that will complement our existing products and services or customer base, as well as expand our offerings and market reach into new areas that naturally extend from our core capabilities. In evaluating such transactions, we are required to make difficult judgments regarding the value of business opportunities, technologies and other assets, and the risks and cost of potential liabilities. Furthermore, these transactions involve certain other risks and uncertainties, including the risks involved with entering new markets, the difficulty in integrating newly-acquired businesses and managing or monitoring other collaborative business arrangements, challenges and failures in achieving strategic objectives and other expected benefits which may result in certain liabilities to us for guarantees and other commitments, unidentified issues not discovered in Raytheon’s due diligence, the diversion of our attention and resources from our operations and other initiatives, the potential impairment of acquired assets, the performance of underlying products, capabilities or technologies, and the potential loss of key employees and customers of acquired businesses.
Additionally, the joint venture agreement for our Forcepoint cybersecurity joint venture company, of which Raytheon owns 80.3% and Vista Equity Partners owns 19.7%, provides Vista Equity Partners with certain rights to exit the joint venture, including the right to require Raytheon to purchase all of Vista Equity Partners’ interest in Forcepoint and the right to require Forcepoint to pursue an initial public offering, as well as certain other rights with respect to the management of Forcepoint's business. In addition to the other risks described above, the exercise of any such rights by Vista Equity Partners could adversely affect our results of operations, financial condition or liquidity, or the management of our business as a whole. For a more detailed discussion regarding Forcepoint, see “Forcepoint” beginning on page 6 within Item 1 of this Form 10-K.
19
Goodwill and other intangible assets represent a significant portion of our assets, and any impairment of these assets could negatively impact our results of operations and financial condition.
At December 31, 2016, we had goodwill and other intangible assets of approximately $15.7 billion, net of accumulated amortization, which represented approximately 52% of our total assets. Our goodwill is subject to an impairment test on an annual basis and is also tested whenever events and circumstances indicate that goodwill may be impaired. Any excess goodwill resulting from the impairment test must be written off in the period of determination. Intangible assets (other than goodwill) are generally amortized over the useful life of such assets. In addition, from time to time, we may acquire or make an investment in a business which will require us to record goodwill and intangible assets based on the purchase price and the value of the acquired assets. We may subsequently experience unforeseen events that could adversely affect the value of our goodwill or intangible assets and trigger an evaluation of the recoverability of the recorded goodwill and intangible assets. Future determinations of significant impairments of goodwill or intangible assets as a result of an impairment test or any accelerated amortization of other intangible assets could have a negative impact on our results of operations and financial condition.
For a detailed discussion of how our financial statements can be affected by goodwill accounting policies, see “Critical Accounting Estimates” within Item 7 of this Form 10-K.
The outcome of litigation in which we have been named, or may in the future be named, as a defendant is unpredictable, and an adverse decision in any such matter could have a material adverse effect on our financial condition or results of operations.
We are the defendant in a number of litigation matters and are subject to various other claims, demands and investigations. In addition, we may be subject to future litigation matters, claims, demands and investigations. These matters may divert financial and management resources that would otherwise be used to benefit our operations. No assurances can be given that the results of these matters will be favorable to us. An adverse resolution or outcome of any of these lawsuits, claims, demands or investigations could have a negative impact on our financial condition, results of operations or liquidity.
We may be unable to adequately protect our intellectual property rights, which could affect our ability to compete.
We own many U.S. and foreign patents and patent applications, and have rights in unpatented know-how, data, software, trademarks and copyrights. The U.S. government has licenses under certain of our patents and certain other intellectual property that are developed or used in performance of government contracts, and it may use or authorize others (including our competitors) to use such patents and intellectual property for government and other purposes. The U.S. government may challenge the sufficiency of intellectual property rights we have granted in U.S. government contracts and attempt to obtain greater rights. There can be no assurance that any of our patents and other intellectual property will not be challenged, invalidated, misappropriated or circumvented by third parties. In some instances, we have augmented our technology base by licensing the proprietary intellectual property of others. In the future, we may not be able to obtain necessary licenses on commercially reasonable terms. We enter into confidentiality and intellectual property assignment agreements with our employees and enter into non-disclosure agreements with our suppliers and appropriate customers so as to limit access to and prevent disclosure of our trade secrets and other proprietary information. These measures may not suffice to deter misappropriation or third-party development of similar technologies. Moreover, the laws concerning intellectual property vary among nations and the protection provided to our intellectual property by the laws and courts of foreign nations may differ from those of the U.S.
Our operations expose us to the risk of material environmental liabilities.
We use hazardous substances and generate hazardous wastes in our manufacturing operations. As a result, we are subject to potentially material liabilities related to personal injuries or property damage that may be caused by hazardous substance releases and exposures. For example, we are investigating and remediating contamination related to past practices at a number of properties and, in some cases, have in the past been named as a defendant in related “toxic tort” claims.
We are also subject to laws and regulations that: (i) impose requirements for the proper management, treatment, storage and disposal of hazardous substances and wastes; (ii) restrict air and water emissions from our operations (including U.S. government-owned facilities we manage); and (iii) require maintenance of a safe workplace. These laws and regulations can lead to substantial fines and criminal sanctions for violations, and may require the installation of costly equipment or operational
20
changes to limit pollution emissions, decrease the likelihood of accidental hazardous substance releases and/or reduce the risks of injury to people in our workplaces.
If we were to be convicted of a criminal violation of certain U.S. federal environmental statutes, including the Federal Clean Air Act and the Clean Water Act, the facility or facilities involved in the violation would be placed by the U.S. Environmental Protection Agency (EPA) on the “Excluded Parties List” maintained by the Government Services Administration. The listing would continue until the EPA concluded that the cause of the violation had been cured. Listed facilities cannot be used in performing any U.S. government contract awarded during any period of listing by the EPA.
We incur, and expect to continue to incur, capital and operating costs to comply with these laws and regulations. In addition, new laws and regulations, changes in the interpretation and enforcement of existing laws and regulations, the discovery of previously unknown contamination, or the imposition of new clean-up standards could require us to incur costs in the future that would have a negative effect on our financial condition, results of operations or liquidity.
We face certain significant risk exposures and potential liabilities that may not be adequately covered by indemnity or insurance.
A significant portion of our business relates to designing, developing and manufacturing advanced defense and technology systems and products. New technologies may be untested or unproven. In addition, we may incur significant liabilities that are unique to our products and services, including but not limited to missile systems, command and control systems, border security systems, air traffic management systems, and cybersecurity products and services. In some, but not all, circumstances, we may be entitled to indemnification from our customers through contractual provisions, and obtain limitations of liability and additional defenses from the qualification of our products and services by the Department of Homeland Security (DHS) under the SAFETY Act provisions of the Homeland Security Act of 2002, or otherwise. The amount of the insurance coverage we maintain or indemnification to which we may be contractually or otherwise entitled may not be adequate to cover all claims or liabilities. Accordingly, we may be forced to bear substantial costs resulting from risks and uncertainties of our business which would negatively impact our results of operations, financial condition or liquidity.
Unanticipated changes in our tax provisions or exposure to additional income tax liabilities could affect our profitability.
We are subject to income taxes in the U.S. and many foreign jurisdictions. Significant judgment is required in determining our worldwide provision for income taxes. In the ordinary course of our business, there are transactions and calculations where the ultimate tax determination is uncertain. Furthermore, changes in domestic or foreign income tax laws and regulations, or their interpretation, could result in higher or lower income tax rates assessed or changes in the taxability of certain sales or the deductibility of certain expenses, thereby affecting our income tax expense and profitability. In addition, we are regularly under audit by tax authorities. The final determination of tax audits and any related litigation could be materially different from our historical income tax provisions and accruals. Additionally, changes in the geographic mix of our sales could impact our tax liabilities and affect our income tax expense and profitability.
ITEM 1B. UNRESOLVED STAFF COMMENTS
None.
ITEM 2. PROPERTIES
We and our subsidiaries operate in a number of plants, laboratories, warehouses and office facilities in the U.S. and abroad.
As of December 31, 2016 we owned, leased and/or utilized (through operating agreements) approximately 26.6 million square feet of floor space for manufacturing, engineering, research, administration, sales and warehousing, approximately 92% of which was located in the U.S. Of such total, approximately 45% was owned (or held under a long-term ground lease with ownership of the improvements), approximately 50% was leased, and approximately 5% was Government owned. In addition to the 26.6 million square feet of floor space described above, approximately 119,000 square feet of space was leased or subleased by us to unrelated third parties.
There are no major encumbrances on any of our facilities other than financing arrangements, which in the aggregate are not material. In the opinion of management, our properties have been well maintained and are suitable and adequate for us to
21
operate at present levels, and the productive capacity and extent of utilization of the facilities are appropriate for our existing real estate requirements.
As of December 31, 2016, our business segments had major operations at the following locations:
– | Integrated Defense Systems—Huntsville, AL; Fullerton, CA; San Diego, CA; Andover, MA; Billerica, MA; Marlboro, MA; Tewksbury, MA; Woburn, MA; Maple Lawn, MD; Portsmouth, RI; Keyport, WA; Waterloo, Canada; and Kiel, Germany. |
– | Intelligence, Information and Services—Aurora, CO; Orlando, FL; Indianapolis, IN; Burlington, MA; Riverdale, MD; Troy, MI; Omaha, NE; State College, PA; Richardson, TX; Dulles, VA; Norfolk, VA; and Springfield, VA. |
– | Missile Systems—Huntsville, AL; East Camden, AR; Tucson, AZ; Rancho Cucamonga, CA; Louisville, KY; Albuquerque, NM; Farmington, NM; Dallas, TX; Richardson, TX; Midland, Canada; Harlow, United Kingdom; and Glenrothes, Scotland. |
– | Space and Airborne Systems—El Segundo, CA; Goleta, CA; Sunnyvale, CA; Largo, FL; Cambridge, MA; Forest, MS; Dallas, TX; and McKinney, TX. |
– | Forcepoint—Los Gatos, CA; San Diego, CA; Minneapolis, MN; Austin, TX; Salt Lake City, UT; Herndon, VA; Sydney, Australia; Beijing, China; Reading, England; Helsinki, Finland; Chennai, India; Dublin, Ireland; Ra'anana, Israel; and Krakow, Poland. |
– | Corporate—Billerica, MA; Waltham, MA; Greenville, TX; Richardson, TX; Plano, TX; Arlington, VA; and Dulles, VA. |
A summary of the space owned, leased and/or utilized by us as of December 31, 2016, by business segment is as follows:
(In square feet) | Leased | Owned(1) | Government owned(2) | Total(3) | |||||||
Integrated Defense Systems | 1,295,789 | 3,746,859 | 129,968 | 5,172,616 | |||||||
Intelligence, Information and Services | 4,562,093 | 1,184,665 | 108,756 | 5,855,514 | |||||||
Missile Systems | 2,623,257 | 2,729,682 | 1,222,531 | 6,575,470 | |||||||
Space and Airborne Systems | 3,656,225 | 3,865,510 | — | 7,521,735 | |||||||
Forcepoint | 555,820 | — | — | 555,820 | |||||||
Corporate(4) | 605,583 | 340,226 | 3,136 | 948,945 | |||||||
Total square feet | 13,298,767 | 11,866,942 | 1,464,391 | 26,630,100 | |||||||
(1) | Ownership may include either fee ownership of land and improvements or a long-term ground lease with ownership of improvements. |
(2) | “Government owned” means space owned by the U.S. or a foreign government utilized by us pursuant to an operating agreement with the U.S. or a foreign government. |
(3) | Includes approximately 276,000 square feet of vacant space, but excludes approximately 119,000 square feet of space leased or subleased to unrelated third parties. |
(4) | Includes business development and Raytheon International, Inc. |
ITEM 3. LEGAL PROCEEDINGS
We primarily engage in providing products and services under contracts with the U.S. government and, to a lesser degree, under direct foreign sales contracts, some of which the U.S. government funds. As a U.S. government contractor, we are subject to many levels of audit and investigation by the U.S. government relating to our contract performance and compliance with applicable rules and regulations. Agencies that oversee contract performance include: the Defense Contract Audit Agency (DCAA); the Defense Contract Management Agency (DCMA); the Inspectors General of the U.S. Department of Defense (DoD) and other departments and agencies; the Government Accountability Office; the Department of Justice (DoJ); and Congressional Committees. From time to time, these and other agencies investigate or conduct audits to determine whether our operations are being conducted in accordance with applicable requirements. Such investigations and audits may be initiated due to a number of reasons, including as a result of a whistleblower complaint. Such investigations and audits could result in administrative, civil or criminal liabilities, including repayments, fines or penalties being imposed upon us, the suspension of government export licenses or the suspension or debarment from future U.S. government contracting. U.S. government investigations often take years to complete and many result in no adverse action against us. Our final allowable incurred costs for each year are also subject to audit and have, from time to time, resulted in disputes between us and the U.S. government, with litigation resulting at the Court of Federal Claims (COFC) or the Armed Services Board of Contract Appeals (ASBCA) or their related courts of appeals. In addition, the DoJ has, from time to time, convened grand juries to investigate possible irregularities by us. We also provide products and services to customers outside of the U.S., and those sales are subject to local government laws, regulations, and procurement policies and practices. Our compliance with such local government
22
regulations or any applicable U.S. government regulations (e.g., the Foreign Corrupt Practices Act (FCPA) and International Traffic in Arms Regulations (ITAR)) may also be investigated or audited. Other than as specifically disclosed in this Form 10-K, we do not expect these audits, investigations or disputes to have a material effect on our financial position, results of operations or liquidity, either individually or in the aggregate.
In addition, various other claims and legal proceedings generally incidental to the normal course of business are pending or threatened against us. We do not expect these proceedings to result in any additional liability that would materially affect our financial position, results of operations or liquidity.
ITEM 4. MINE SAFETY DISCLOSURES
Not applicable.
EXECUTIVE OFFICERS OF THE REGISTRANT
Our executive officers are listed below. Each executive officer was elected by our Board of Directors to serve for a term of one year and until his or her successor is elected and qualified or until his or her earlier removal, resignation or death.
Frank R. Jimenez
Mr. Jimenez has served as Vice President and General Counsel since January 2015 and Corporate Secretary since April 2015. Prior to joining Raytheon, Mr. Jimenez served as General Counsel, Secretary and Managing Director, Corporate Affairs of Bunge Limited, a leading global agribusiness and food company, from July 2012 to January 2015. From 2011 to 2012, he served as Senior Vice President, General Counsel and Corporate Secretary at Xylem Inc., a global water technology company spun off from ITT Corporation in 2011. From 2009 to 2011, he served as Vice President and General Counsel of ITT Corporation. From 2006 to 2009, he served as General Counsel of the U.S. Department of the Navy. He previously held a variety of other positions in government, including Deputy General Counsel (Legal Counsel) for the U.S. Department of Defense and Chief of Staff at the U.S. Department of Housing and Urban Development, as well as Deputy Chief of Staff and Acting General Counsel to the Governor of Florida. Age 52.
Thomas A. Kennedy
Dr. Kennedy has served as Chairman of the Board since October 2014, Chief Executive Officer since April 2014 and a Director since January 2014. From April 2013 to March 2014, he served as Executive Vice President and Chief Operating Officer of Raytheon Company. From June 2010 to March 2013, he served as Vice President of Raytheon Company and President of the Integrated Defense Systems (IDS) business unit. From July 2007 to June 2010, he was Vice President of the Tactical Airborne Systems product line within the Space and Airborne Systems (SAS) business unit, and from May 2003 to July 2007, he was Vice President of the Mission System Integration product line within SAS. Dr. Kennedy joined Raytheon in 1983 and has held positions of increasing responsibility as a new business leader and program manager for several radar and electronic warfare systems development programs. Age 61.
Wesley D. Kremer
Mr. Kremer has served as President of the Integrated Defense Systems (IDS) business unit since July 2015 and Vice President of Raytheon Company since October 2015. From July 2011 to July 2015, he was Vice President of the Air and Missile Defense Systems product line within the Missile Systems (MS) business unit. From May 2010 to July 2011, Mr. Kremer was Director of the Standard Missile-3 program, and from June 2008 to May 2010, he was Director of Systems Design and Performance Engineering within MS. From December 2006 to June 2008, he was General Manager of the Advanced Products Center within the Space and Airborne Systems (SAS) business unit. Prior to joining Raytheon in 2003, Mr. Kremer served 11 years in the U.S. Air Force as a weapon systems officer. Age 51.
Taylor W. Lawrence
Dr. Lawrence has served as Vice President of Raytheon Company and President of the Missiles Systems (MS) business unit since July 2008. Dr. Lawrence joined Raytheon in April 2006 and until July 2008, he served as Vice President, Engineering, Technology and Mission Assurance. From August 2001 to April 2006, Dr. Lawrence was sector vice president and general manager, C4ISR & Space Sensors Division for Northrop Grumman Electronic Systems. From March 1999 to August 2001, Dr. Lawrence was vice president, Products and Technology for Northrop Grumman’s Systems Development & Technology Division. Before joining Northrop Grumman, Dr. Lawrence served as the staff director for the Select Committee on Intelligence
23
for the U.S. Senate and, previously, as deputy director, Information Systems Office of the Defense Advanced Research Projects Agency. Age 53.
Randa G. Newsome
Ms. Newsome has served as Vice President of Human Resources and Global Security since January 2015. From April 2013 to December 2014, she was Vice President of Human Resources and Security for Raytheon’s Integrated Defense Systems (IDS) business unit. From December 2008 to April 2013, she was Vice President of Human Resources and Security for the former Technical Services (TS) business unit. From May 2004 to December 2008, Ms. Newsome was Director of Organization Performance and Talent Management for the former Intelligence and Information Systems business unit. Ms. Newsome joined Raytheon in 2001 as a human resources manager for the former Network Centric Systems business unit, after holding various assignments of increasing responsibility at Lockheed Martin Corporation. Age 51.
Anthony F. O'Brien
Mr. O’Brien has served as Vice President and Chief Financial Officer since March 2015. From March 2008 to March 2015, he was Vice President and Chief Financial Officer of Raytheon’s Integrated Defense Systems (IDS) business unit. Mr. O’Brien joined Raytheon in 1986 and has held numerous finance positions of increasing responsibility with the Company over the course of his 30-year career, including Vice President of Finance and the senior finance executive responsible for Raytheon Airline Aviation Services and Raytheon’s International Landed Companies, and Chief Financial Officer for Raytheon Aircraft Company. Age 52.
Rebecca R. Rhoads
Ms. Rhoads has served as Vice President of Raytheon Company and President of Global Business Services (GBS) since December 2013. From April 2001 to December 2013, she was a Vice President and the Chief Information Officer for Raytheon Company. From 1999 to April 2001, she was the Vice President of Information Technology for Raytheon’s former Electronics Systems business unit. Ms. Rhoads began her career with General Dynamics as an electrical engineer in 1979, and worked in Engineering and Operations holding various assignments of increasing responsibility at General Dynamics, Hughes and Raytheon. Age 59.
David C. Wajsgras
Mr. Wajsgras has served as Vice President of Raytheon Company and President of the Intelligence, Information and Services (IIS) business unit since March 2015. From March 2006 to March 2015, he was Senior Vice President and Chief Financial Officer for Raytheon Company. From August 2005 to March 2006, he was Executive Vice President and Chief Financial Officer of Lear Corporation, an automotive interior systems and components supplier. From January 2002 to August 2005, he served as Senior Vice President and Chief Financial Officer of Lear. Mr. Wajsgras joined Lear in September 1999 as Vice President and Controller. Age 57.
Michael J. Wood
Mr. Wood has served as Vice President, Controller and Chief Accounting Officer since October 2006. Prior to joining Raytheon, Mr. Wood held positions of increasing responsibility over a 16-year career at KPMG LLP, an accounting firm, including as an Audit Partner serving various aerospace and defense clients. Age 48.
Richard R. Yuse
Mr. Yuse has served as Vice President of Raytheon Company and President of the Space and Airborne Systems (SAS) business unit since March 2010. From May 2007 to March 2010, he was President of the former Technical Services (TS) business unit. From March 2007 to May 2007, Mr. Yuse was Vice President and Deputy General Manager of TS, and from January 2006 to March 2007, he served as Vice President of the Integrated Air Defense product line of the Integrated Defense Systems (IDS) business unit. Mr. Yuse joined Raytheon in 1976 and has held positions of increasing responsibility on a variety of programs ranging from system architecture and design to flight test director and program manager. Age 65.
24
PART II
ITEM 5. MARKET FOR REGISTRANT’S COMMON EQUITY, RELATED STOCKHOLDER MATTERS AND ISSUER PURCHASES OF EQUITY SECURITIES
At February 13, 2017, there were 22,771 record holders of our common stock. Our common stock is traded on the New York Stock Exchange under the symbol “RTN”. For information concerning stock prices and dividends paid during the past two years, see "Note 18: Quarterly Operating Results (Unaudited)" within Item 8 of this Form 10-K.
Securities Authorized for Issuance Under Equity Compensation Plans
The following table provides information about our equity compensation plans that authorize the issuance of shares of our common stock. This information is provided as of December 31, 2016.
Plan Category | (A) Number of securities to be issued upon exercise of outstanding options, warrants and rights(1) | (B) Weighted average exercise price of outstanding options, warrants and rights(2) | (C) Number of securities remaining available for future issuance under equity compensation plans (excluding securities reflected in column A) | ||||||
Equity compensation plans approved by stockholders | 1,566,115 | $— | 6,728,759 | ||||||
Equity compensation plans not approved by stockholders | — | — | — | ||||||
Total | 1,566,115 | $— | 6,728,759 | ||||||
(1) | This amount includes 1,008,946 shares, which is the aggregate of the actual number of shares that will be issued pursuant to the 2014 Long-term Performance Plan (LTPP) awards and the maximum number of shares that may be issued upon settlement of outstanding 2015 and 2016 LTPP awards, including estimated dividend equivalent amounts. The shares to be issued pursuant to the 2014, 2015 and 2016 LTPP awards will be issued under the Raytheon 2010 Stock Plan. The material terms of the 2014, 2015 and 2016 LTPP awards are described in more detail in "Note 14: Stock-based Compensation Plans" within Item 8 of this Form 10-K. These awards, which are granted as restricted stock units (RSUs), may be settled in cash or in stock at the discretion of the Management Development and Compensation Committee. |
This amount also includes 557,169 shares that may be issued upon settlement of RSUs, generally issued to retirement-eligible and non-U.S. employees. The shares to be issued in settlement of the RSUs will be issued under the 2010 Stock Plan. The RSUs generally vest one-third per year on the second, third and fourth anniversaries of the date of grant.
(2) | Since RSU awards do not have an exercise price, and there are no other options, warrants or rights outstanding at December 31, 2016, the weighted-average exercise price is zero. |
Stock Performance Graph
The following chart compares the total return on a cumulative basis of $100 invested in our common stock on December 31, 2011 to the Standard & Poor’s (S&P) 500 Stock Index and the S&P Aerospace & Defense Index.
Total Return To Stockholders (Includes reinvestment of dividends)
Annual Return Percentage Years Ending | ||||||||||||||
Company/Index | 12/31/2012 | 12/31/2013 | 12/31/2014 | 12/31/2015 | 12/31/2016 | |||||||||
Raytheon Common Stock | 23.29 | 62.33 | 21.50 | 18.02 | 17.12 | |||||||||
S&P 500 Index | 16.00 | 32.39 | 13.69 | 1.38 | 11.96 | |||||||||
S&P Aerospace & Defense Index | 14.56 | 54.92 | 11.43 | 5.43 | 18.90 | |||||||||
25
Indexed Returns Years Ending | |||||||||||||||||||||
Company/Index | Base Period 12/31/2011 | 12/31/2012 | 12/31/2013 | 12/31/2014 | 12/31/2015 | 12/31/2016 | |||||||||||||||
Raytheon Common Stock | $100 | $ | 123.29 | $ | 200.13 | $ | 243.15 | $ | 286.96 | $ | 336.08 | ||||||||||
S&P 500 Index | 100 | 116.00 | 153.57 | 174.60 | 177.01 | 198.18 | |||||||||||||||
S&P Aerospace & Defense Index | 100 | 114.56 | 177.48 | 197.77 | 208.52 | 247.93 | |||||||||||||||
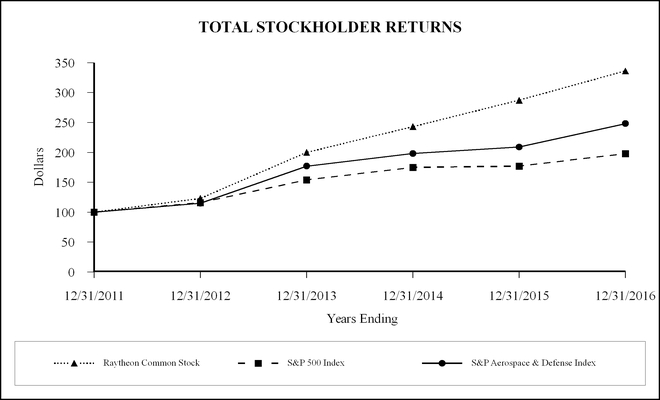
Issuer Purchases of Equity Securities
Period | Total Number of Shares Purchased (1) | Average Price Paid per Share | Total Number of Shares Purchased as Part of Publicly Announced Plans | Approximate Dollar Value (in Billions) of Shares that May Yet Be Purchased Under the Plans (2) | |||||||||
October (October 3, 2016–October 30, 2016) | 1,004 | $137.17 | — | $ | 1.7 | ||||||||
November (October 31, 2016–November 27, 2016) | 289,261 | 135.20 | 287,922 | 1.7 | |||||||||
December (November 28, 2016–December 31, 2016) | 422,974 | 143.44 | 422,974 | 1.6 | |||||||||
Total | 713,239 | $140.09 | 710,896 | ||||||||||
(1) | Includes shares purchased related to activity under our stock plans. Such activity during the fourth quarter of 2016 includes the surrender by employees of 2,343 shares to satisfy tax withholding obligations in connection with the vesting of restricted stock issued to employees. |
(2) | In November 2015, our Board of Directors authorized the repurchase of up to $2.0 billion of our outstanding common stock. |
26
ITEM 6. SELECTED FINANCIAL DATA
The following selected consolidated financial data should be read in conjunction with the information contained in Item 7, “Management’s Discussion and Analysis of Financial Condition and Results of Operations” and the consolidated financial statements and notes thereto included in Item 8 of this Form 10-K, which are incorporated herein by reference, in order to understand the factors that may affect the comparability of the financial data presented below.
FIVE-YEAR STATISTICAL SUMMARY
(In millions, except per share amounts and total employees) | 2016 | 2015 | 2014 | 2013 | 2012 | ||||||||||||||
Results of Operations | |||||||||||||||||||
Total net sales | $ | 24,069 | $ | 23,247 | $ | 22,826 | $ | 23,706 | $ | 24,414 | |||||||||
Operating income | 3,240 | 3,013 | 3,179 | 2,938 | 2,989 | ||||||||||||||
Interest expense, net | 216 | 222 | 203 | 198 | 192 | ||||||||||||||
Income from continuing operations(1) | 2,173 | 2,054 | 2,193 | 1,949 | 1,901 | ||||||||||||||
Income (loss) from discontinued operations, net of tax | 1 | 13 | 65 | 64 | (1 | ) | |||||||||||||
Net income(1) | 2,174 | 2,067 | 2,258 | 2,013 | 1,900 | ||||||||||||||
Net income attributable to Raytheon Company(1) | 2,211 | 2,074 | 2,244 | 1,996 | 1,888 | ||||||||||||||
Diluted earnings per share from continuing operations attributable to Raytheon Company common stockholders(1) | $ | 7.44 | $ | 6.75 | $ | 6.97 | $ | 5.96 | $ | 5.65 | |||||||||
Diluted earnings per share attributable to Raytheon Company common stockholders(1) | $ | 7.44 | $ | 6.80 | $ | 7.18 | $ | 6.16 | $ | 5.65 | |||||||||
Average diluted shares outstanding | 296.8 | 305.2 | 312.6 | 324.2 | 334.2 | ||||||||||||||
Financial Position at Year-End | |||||||||||||||||||
Cash and cash equivalents | $ | 3,303 | $ | 2,328 | $ | 3,222 | $ | 3,296 | $ | 3,188 | |||||||||
Short-term investments | 100 | 872 | 1,497 | 1,001 | 856 | ||||||||||||||
Total current assets | 10,678 | 9,812 | 10,279 | 9,792 | 9,150 | ||||||||||||||
Property, plant and equipment, net | 2,166 | 2,005 | 1,935 | 1,937 | 1,986 | ||||||||||||||
Total assets | 30,052 | 29,281 | 27,716 | 25,964 | 26,685 | ||||||||||||||
Total current liabilities | 6,427 | 6,126 | 5,752 | 5,704 | 5,902 | ||||||||||||||
Long-term liabilities (excluding debt) | 7,775 | 7,140 | 6,918 | 4,329 | 7,862 | ||||||||||||||
Long-term debt | 5,335 | 5,330 | 5,325 | 4,734 | 4,731 | ||||||||||||||
Total equity | 10,066 | 10,330 | 9,721 | 11,197 | 8,190 | ||||||||||||||
Cash Flow and Other Information | |||||||||||||||||||
Net cash provided by (used in) operating activities from continuing operations(1) | $ | 2,852 | $ | 2,346 | $ | 2,064 | $ | 2,382 | $ | 1,951 | |||||||||
Net cash provided by (used in) investing activities | 53 | (1,744 | ) | (1,322 | ) | (473 | ) | (1,523 | ) | ||||||||||
Net cash provided by (used in) financing activities(1) | (1,930 | ) | (1,509 | ) | (936 | ) | (1,797 | ) | (1,246 | ) | |||||||||
Bookings | 27,836 | 25,227 | 24,052 | 22,132 | 26,504 | ||||||||||||||
Total backlog | 36,855 | 34,669 | 33,571 | 33,685 | 36,181 | ||||||||||||||
Dividends declared per share | $ | 2.93 | $ | 2.68 | $ | 2.42 | $ | 2.20 | $ | 2.00 | |||||||||
Total employees from continuing operations | 63,000 | 61,000 | 61,000 | 63,000 | 67,800 | ||||||||||||||
(1) | Amounts prior to 2016 do not reflect the impact of the prospective adoption of Accounting Standards Update (ASU) 2016-09, Compensation - Stock Compensation (Topic 718): Improvements to Employee Share-Based Payment Accounting, in the first quarter of 2016. See "Note 1: Summary of Significant Accounting Policies" within Item 8 of this Form 10-K for additional information. |
27
ITEM 7. MANAGEMENT’S DISCUSSION AND ANALYSIS OF FINANCIAL CONDITION AND RESULTS OF OPERATIONS
OVERVIEW
Introduction
Raytheon Company develops technologically advanced and integrated products, services and solutions in our core markets: sensing; effects; command, control, communications, computers, cyber and intelligence; mission support; and cybersecurity. We serve both domestic and international customers, primarily as a prime contractor or subcontractor on a broad portfolio of defense and related programs for government customers.
We operate in five segments: Integrated Defense Systems (IDS); Intelligence, Information and Services (IIS); Missile Systems (MS); Space and Airborne Systems (SAS); and Forcepoint. For a more detailed description of our segments, see “Business Segments” within Item 1 of this Form 10-K.
In this section, we discuss our business environment and how certain factors may affect our business, key elements of our strategy, and how our financial performance is assessed and measured by management.
Business Environment
Domestic Considerations
U.S. government sales, excluding foreign military sales, accounted for 67% of our total net sales in 2016. Our principal U.S. government customer is the U.S. Department of Defense (DoD).
DoD funding levels, which are subject to budget and appropriation decisions and processes, are difficult to predict beyond the near-term. Spending caps on DoD funding imposed by the Budget Control Act of 2011 (BCA) have been raised several times, most recently by the Bipartisan Budget Act of 2015 (BBA) for fiscal years (FY) 2016 and 2017. DoD modernization funding, which consists of procurement and research and development, is of particular importance to defense contractors, and the DoD increased such funding in FY 2016. To date, the U.S. government has not signed a formal appropriation bill into law for FY 2017 and Congress has instead passed a Continuing Resolution (CR), under which the DoD is currently operating, through April 28, 2017. In addition, DoD funding levels for FY 2018 through 2021 remain governed by the BCA, and any change to those funding levels would require Congress to enact legislation. If the BCA caps are not amended, FY 2018 DoD funding would be similar to FY 2016 funding before gradually rising thereafter.
In addition to the DoD budget considerations discussed above, future domestic defense spending levels are impacted by a number of additional factors, including external threats to our national security, funding for on-going operations overseas, the priorities of the Administration and the Congress, overall health of the U.S. and world economies, and the state of governmental finances. However, we also continue to expect the DoD to continue to prioritize and protect the key capabilities required to execute its strategy, including being able to deter and defeat near peer adversaries. Such capabilities include Intelligence,
28
Surveillance and Reconnaissance (ISR), cybersecurity, missile defense, electronic warfare, improved kinetic and non-kinetic effectors, undersea warfare, unmanned systems, special operations forces and interoperability with allied forces. We believe those priorities are well aligned with our product offerings, technologies, services and capabilities.
We currently are involved in tens of thousands of contracts, with no single contract accounting for more than 5% of our total net sales in 2016. Although we believe our diverse portfolio of programs and capabilities is well suited to a changing defense environment, we face numerous challenges and risks, as discussed above. For more information on the risks and uncertainties that could impact the U.S. government's demand for our products and services, see “Item 1A. Risk Factors” of this Form 10-K.
International Considerations
In 2016, our sales to customers outside of the U.S. accounted for 31% of our total net sales (including foreign military sales through the U.S. government). Internationally, the growing threat of additional terrorist activity, cyber threats, emerging nuclear states, long-range missiles and conventional military threats have led to an increase in demand for defense systems and services and other security solutions. In North Asia, both short- and long-term regional security concerns are increasing demand for air and missile defense, air/naval modernization and maritime security. In the Middle East and North Africa, threats from state and non-state actors are increasing demand for air and missile defense, air/land/naval force modernization, precision engagement, ISR, maritime and border security, and cybersecurity solutions. Given such threat environments, we expect our customers to continue to prioritize security investments even if their budgets are impacted by volatile short-term energy prices. In Europe, while economic and political challenges have constrained defense spending of certain European nations, others have begun to increase spending in response to geopolitical events and conflicts in Eastern Europe and the resulting uncertainty and security threat environment. Based on the foregoing, we expect that European nations will continue to seek advanced air and missile defense and other capabilities. Overall, we believe many international defense budgets have the potential to grow and to do so at a faster rate than the U.S. defense budget. However, international demand is sensitive to changes in the priorities and budgets of international customers and geopolitical uncertainties, which may be driven by changes in threat environments, volatility in worldwide economic conditions, regional and local economic and political factors, U.S. foreign policy and other risks and uncertainties. For more information on the risks and uncertainties that could impact international demand for our products and services, see “Item 1A. Risk Factors” of this Form 10-K.
Our Strategy
The following are the broad elements of our strategy:
– | Build upon our areas of strength within our key mission areas; |
– | Focus additional resources on emerging opportunities within the DoD market; |
– | Engage key countries as individual markets with multiple customers; and |
– | Extend Raytheon's advanced cyber solutions beyond the U.S. government into international and commercial markets. |
We believe that our broad mix of technologies, domain expertise and key capabilities, our cost-effective, best-value solutions and the alignment of these strengths with customer needs position us favorably to grow in our key mission areas of missile defense; electronic warfare; command, control, communications, computers, cyber, intelligence, surveillance and reconnaissance; precision weapons; cybersecurity; and training. Globally, customers are increasingly seeking cost-effective mission solutions. These solutions can take the form of new electronics or electronic upgrades, but draw on our market focus area capabilities, deep domain expertise and system architecture skills. We continue to explore opportunities to make these affordable solutions more readily available to our international customers, including through enhanced design for export and releasability. We also continue to make investments to support our strategy, including through acquisitions and research and development.
International Growth—Because of the breadth of our offerings, our systems integration capability, the value of our solutions and our strong legacy in the international marketplace, we believe that we are well positioned to continue to grow our international business. As discussed above in International Considerations, we believe demand continues to grow for solutions in air and missile defense, precision engagement, naval systems integration, ISR and cybersecurity. As a result we continue to enhance our focus on global growth through increased investment in our international business in existing and new international markets. Such investment provides additional resources and capabilities, both in-country and in the U.S., that strengthen the Company’s position to pursue both existing and new opportunities. Although we believe our international business is well positioned to continue to grow, we recognize that we face substantial competition from both U.S. companies and other competitors in international markets, as well as the challenges of changing budget priorities, overall spending pressures and the timing of contract awards.
29
(In millions) | 2016 | 2015 | 2014 | ||||||||
International sales(1) | $ | 7,552 | $ | 7,150 | $ | 6,541 | |||||
International bookings | 8,194 | 8,511 | 8,362 | ||||||||
(1) | Includes foreign military sales through the U.S. government. |
Cybersecurity—We continue to both enhance our capabilities in the cyber market and leverage the capabilities of the 17 cyber acquisitions made since 2007. In 2015, we successfully executed on our strategy to extend our significant cyber capabilities into the commercial markets by creating Forcepoint, a new commercial cybersecurity joint venture company (with Vista Equity Partners) that combined Websense, Inc. (Websense) and Raytheon Cyber Products (RCP), formerly part of our IIS business. Forcepoint is leveraging its unique combination of capabilities to deliver “defense-grade” cybersecurity solutions to commercial markets worldwide. For more information on the Forcepoint joint venture transaction, see "Item 1. Business", and “Note 6: Forcepoint Joint Venture” within Item 8 of this Form 10-K.
We also provide cyber capabilities to government customers, including the Intelligence Community, the DoD, other defense and civil global customers, as well as embed information assurance capabilities in our products and our information technology infrastructure. We believe the commercial and government cyber markets both represent strong growth markets for Raytheon. We expect to continue to seek opportunities to leverage our extensive cyber capabilities and to grow and scale our cyber businesses.
Focus on the Customer and Execution
Our customer focus continues to be a critical part of our strategy—underpinned by a focus on performance, relationships and solutions. Performance means being able to meet customer commitments, which is ensured through strong processes, metrics and oversight. We maintain a “process architecture” that spans our defense businesses and our broad programs and pursuits. It consists of enterprisewide processes and systems such as our Integrated Product Development System (IPDS), which assures consistency of evaluation and execution at each step in a program's life-cycle; Product Data Management (PDM), which is our business system software for engineering; Achieving Process Excellence (APEX), which is our SAP business system software for accounting, finance and program management; Process Re-Invention Integrating Systems for Manufacturing (PRISM), which is our SAP software for manufacturing operations; Advanced Company Estimating System (ACES), which is our cost proposal system; and Raytheon Enterprise Supplier Assessment (RESA) tool for Supply Chain Management. These processes and systems are linked to an array of front-end and back-end metrics. With this structure, we are able to track results and be alerted to potential issues through numerous oversight mechanisms, including operating reviews and annual operating plan reviews.
We are also continuing to build strong customer relationships by working with customers as partners and including them on Raytheon Six Sigma™ teams to jointly improve their programs and processes. We are increasingly focused on responding to our customers' changing requirements with rapid and effective solutions to real-world problems. In recognition of our customers' constraints and priorities, we also continue to drive various cost reductions across the Company by continuing to focus on enterprise collaboration and improving productivity and strong execution throughout our programs. We have worked to reduce costs across the Company and improve efficiencies in our production facilities, and we continue to increase value through Raytheon Six Sigma, the implementation of lean processes, reduced cycle times and strategic supply chain initiatives, in addition to other initiatives.
30
FINANCIAL SUMMARY
We use the following key financial performance measures to manage our business on a consolidated basis and by business segment, and to monitor and assess our results of operations:
– | Bookings—a forward-looking metric that measures the value of firm orders awarded to us during the year; |
– | Net Sales—a growth metric that measures our revenue for the current year; |
– | Operating Income—a measure of our profit from continuing operations for the year, before non-operating expenses, net and taxes; and |
– | Operating Margin—a measure of our operating income as a percentage of total net sales. |
(In millions, except percentages) | 2016 | 2015 | 2014 | ||||||||
Bookings | $ | 27,836 | $ | 25,227 | $ | 24,052 | |||||
Total backlog | 36,855 | 34,669 | 33,571 | ||||||||
Total net sales | 24,069 | 23,247 | 22,826 | ||||||||
Total operating income(1) | 3,240 | 3,013 | 3,179 | ||||||||
Total operating margin | 13.5 | % | 13.0 | % | 13.9 | % | |||||
Operating cash flow from continuing operations | $ | 2,852 | $ | 2,346 | $ | 2,064 | |||||
(1) | Includes FAS/CAS Adjustment, described below in Critical Accounting Estimates, of $435 million of income, $185 million of income and $286 million of income in 2016, 2015 and 2014, respectively. |
Backlog represents the dollar value of firm orders for which work has not been performed. Backlog generally increases with bookings and generally converts into sales as we incur costs under the related contractual commitments. Therefore, we discuss changes in backlog, including any individually significant cancellations, for each of our segments, as we believe such discussion provides an understanding of the awarded but not executed portions of our contracts.
In addition, we maintain a strong focus on program execution and the prudent management of capital and investments in order to maximize operating income and cash. We pursue a capital deployment strategy that balances funding for growing our business, including capital expenditures, acquisitions and research and development; prudently managing our balance sheet, including debt repayments and pension contributions; and returning cash to our shareholders, including dividend payments and share repurchases.
We also focus on earnings per share (EPS) and measures to assess our cash generation and the efficiency and effectiveness of our use of capital, such as free cash flow (FCF) and return on invested capital (ROIC).
Considered together, we believe these metrics are strong indicators of our overall performance and our ability to create shareholder value. We feel these measures are balanced among long-term and short-term performance, efficiency and growth. We also use these and other performance metrics for executive compensation purposes.
A discussion of our results of operations and financial condition follows below in Consolidated Results of Operations; Segment Results; Financial Condition and Liquidity; and Capital Resources.
CRITICAL ACCOUNTING ESTIMATES
Our consolidated financial statements are based on the application of U.S. Generally Accepted Accounting Principles (GAAP), which require us to make estimates and assumptions about future events that affect the amounts reported in our consolidated financial statements and the accompanying notes. Future events and their effects cannot be determined with certainty; therefore, the determination of estimates requires the exercise of judgment. Actual results could differ from those estimates, and any such differences may be material to our consolidated financial statements. We believe the estimates set forth below may involve a higher degree of judgment and complexity in their application than our other accounting estimates and represent the critical accounting estimates used in the preparation of our consolidated financial statements. We believe our judgments related to these accounting estimates are appropriate. However, if different assumptions or conditions were to prevail, the results could be materially different from the amounts recorded.
31
Revenue Recognition
We determine the appropriate revenue recognition method by analyzing the type, terms and conditions of each contract or arrangement entered into with our customers. The significant estimates we make in recognizing revenue for the types of revenue-generating activities in which we are involved are described below. We classify contract revenues as product or service according to the predominant attributes of the relevant underlying contracts unless the contract can clearly be split between product and service. We define service revenue as revenue from activities that are not associated with the design, development or production of tangible assets, the delivery of software code or a specific capability. Our service revenue is primarily related to our IIS business segment.
Percentage-of-Completion Accounting—We use the percentage-of-completion accounting method to account for our long-term contracts associated with the design, development, manufacture, or modification of complex aerospace or electronic equipment and related services, such as certain cost-plus service contracts. Under this method, revenue is recognized based on the extent of progress toward completion of the long-term contract. Our analysis of these contracts also contemplates whether contracts should be combined or segmented in accordance with the applicable criteria under U.S. GAAP. We combine closely related contracts when all the applicable criteria under U.S. GAAP are met. The combination of two or more contracts requires judgment in determining whether the intent of entering into the contracts was effectively to enter into a single project, which should be combined to reflect an overall profit rate. Similarly, we may segment a project, which may consist of a single contract or group of contracts, with varying rates of profitability, only if the applicable criteria under U.S. GAAP are met. Judgment also is involved in determining whether a single contract or group of contracts may be segmented based on how the arrangement was negotiated and the performance criteria. The decision to combine a group of contracts or segment a contract could change the amount of revenue and gross profit recorded in a given period.
The selection of a method to measure progress toward completion of a contract also requires judgment and is based on the nature of the products or services to be provided. We generally use the cost-to-cost measure of progress for our long-term contracts unless we believe another method more clearly measures progress toward completion of the contract. Under the cost-to-cost measure of progress, the extent of progress toward completion is measured based on the ratio of costs incurred to date to the total estimated costs at completion of the contract. Contract costs include labor, materials and subcontractors costs, as well as an allocation of indirect costs. Revenues, including estimated fees or profits, are recorded as costs are incurred. Due to the nature of the work required to be performed on many of our contracts, the estimation of total revenue and cost at completion (the process for which we describe below in more detail) is complex and subject to many variables. Incentive and award fees generally are awarded at the discretion of the customer or upon achievement of certain program milestones or cost targets. Incentive and award fees, as well as penalties related to contract performance, are considered in estimating profit rates. Estimates of award fees are based on actual awards and anticipated performance, which may include the performance of subcontractors or partners depending on the individual contract requirements. Such incentives and penalties are recorded when there is sufficient information for us to assess anticipated performance. Incentive provisions that increase or decrease earnings based solely on a single significant event generally are not recognized until the event occurs. Our claims on contracts are recorded only if it is probable that the claim will result in additional contract revenue and the amounts can be reliably estimated.
We have a companywide standard and disciplined quarterly Estimate at Completion (EAC) process in which management reviews the progress and performance of our contracts. As part of this process, management reviews information including, but not limited to, any outstanding key contract matters, progress toward completion and the related program schedule, identified risks and opportunities, and the related changes in estimates of revenues and costs. The risks and opportunities include management's judgment about the ability and cost to achieve the schedule (e.g., the number and type of milestone events), technical requirements (e.g., a newly-developed product versus a mature product) and other contract requirements. Management must make assumptions and estimates regarding labor productivity and availability, the complexity of the work to be performed, the availability of materials, the length of time to complete the contract (e.g., to estimate increases in wages and prices for materials and related support cost allocations), performance by our subcontractors, the availability and timing of funding from our customer, and overhead cost rates, among other variables. These estimates also include the estimated cost of satisfying our industrial cooperation agreements, sometimes referred to as offset obligations, required under certain contracts. Based on this analysis, any quarterly adjustments to net sales, cost of sales and the related impact to operating income are recognized as necessary in the period they become known. These adjustments may result from positive program performance, and may result in an increase in operating income during the performance of individual contracts, if we determine we will be successful in mitigating risks surrounding the technical, schedule, and cost aspects of those contracts or in realizing related opportunities. Likewise, these adjustments may result in a decrease in operating income if we determine we will not be successful in mitigating these risks or in realizing related opportunities. Changes in estimates of net sales, cost of sales, and
32
the related impact to operating income are recognized quarterly on a cumulative catch-up basis, which recognizes in the current period the cumulative effect of the changes on current and prior periods based on a contract's percentage of completion. A significant change in one or more of these estimates could affect the profitability of one or more of our contracts. When estimates of total costs to be incurred on a contract exceed total estimates of revenue to be earned, a provision for the entire loss on the contract is recognized in the period the loss is determined.
Net EAC adjustments had the following impact on our operating results:
(In millions, except per share amounts) | 2016 | 2015 | 2014 | ||||||||
Operating income | $ | 401 | $ | 371 | $ | 513 | |||||
Income from continuing operations attributable to Raytheon Company | 272 | 241 | 333 | ||||||||
Diluted EPS from continuing operations attributable to Raytheon Company | $ | 0.92 | $ | 0.79 | $ | 1.07 | |||||
Other Considerations—The majority of our sales are driven by pricing based on costs incurred to produce products or perform services under contracts with the U.S. government. Cost-based pricing is determined under the Federal Acquisition Regulation (FAR). The FAR provides guidance on the types of costs that are allowable in establishing prices for goods and services under U.S. government contracts. For example, costs such as those related to charitable contributions, certain merger and acquisition costs, lobbying costs, interest expense and certain litigation defense costs are unallowable. In addition, we may enter into agreements with the U.S. government that address the allowability and allocation of costs to contracts for specific matters. Certain costs incurred in the performance of our U.S. government contracts are required to be recorded under U.S. GAAP but are not currently allocable to contracts. Such costs are deferred and primarily include a portion of our environmental expenses, asset retirement obligations, certain restructuring costs, deferred state income taxes, workers’ compensation and certain other accruals. These costs are allocated to contracts when they are paid or otherwise agreed. We regularly assess the probability of recovery of these costs. This assessment requires us to make assumptions about the extent of cost recovery under our contracts and the amount of future contract activity. If the level of backlog in the future does not support the continued deferral of these costs, the profitability of our remaining contracts could be adversely affected.
Pension and other postretirement benefits (PRB) costs are allocated to our contracts as allowed costs based upon the U.S. government Cost Accounting Standards (CAS). The CAS requirements for pension and PRB costs differ from the Financial Accounting Standards (FAS) requirements under U.S. GAAP. Given the inability to match with reasonable certainty individual expense and income items between the CAS and FAS requirements to determine specific recoverability, we have not estimated the incremental FAS income or expense to be recoverable under our expected future contract activity, and therefore did not defer any FAS expense for pension and PRB plans in 2014 through 2016. This resulted in $435 million of income, $185 million of income and $286 million of income in 2016, 2015 and 2014, respectively, reflected in our consolidated results of operations as the difference between CAS and FAS requirements for our pension and PRB plans in those years.
Pension and Other Postretirement Benefits (PRB) Costs
We have pension plans covering the majority of our employees hired prior to January 1, 2007, including certain employees in foreign countries. We must calculate our pension and PRB costs under both U.S. government CAS requirements and FAS requirements under U.S. GAAP, and both calculations require judgment. U.S. GAAP outlines the methodology used to determine pension and PRB expense or income for financial reporting purposes, which is not indicative of the funding requirements for pension and PRB plans that we determine under the Employee Retirement Income Security Act of 1974 (ERISA). CAS prescribes the allocation to and recovery of pension and PRB costs on U.S. government contracts. The CAS requirements for pension and PRB costs and its calculation methodology differ from the FAS requirements and calculation methodology. As a result, while both CAS and FAS use long-term assumptions in their calculation methodologies, each method results in different calculated amounts of pension and PRB cost. In addition, we are subject to the funding requirements under the Pension Protection Act of 2006 (PPA), which amended ERISA. Under the PPA, we are required to fully fund our pension plans over a rolling seven-year period as determined annually based upon the PPA calculated funded status at the beginning of each year. The funding requirements are primarily based on the year’s expected service cost and amortization of other previously unfunded liabilities.
We record CAS expense in our business segment results. Due to the differences between FAS and CAS amounts, we also present the difference between FAS and CAS expense, referred to as our FAS/CAS Adjustment, as a separate line item in our segment results. This effectively increases or decreases the amount of total pension expense in our results of operations so that such amount is equal to the FAS expense amount under U.S. GAAP. Due to the foregoing differences in requirements
33
and calculation methodologies, our FAS pension expense or income is not indicative of the funding requirements or amount of government recovery.
On December 27, 2011, the CAS Pension Harmonization Rule (CAS Harmonization) was published in the Federal Register. The rule was intended to improve the alignment of the pension cost recovered through contract pricing under CAS and the pension funding requirements under the PPA. The rule shortened the CAS amortization period for gains and losses from 15 to 10 years and requires the use of a discount rate based on high quality corporate bonds, consistent with PPA, to measure liabilities in determining the CAS pension expense. CAS Harmonization increases pension costs under CAS and the related FAS/CAS Pension Adjustment results in an increase to income in 2014 and beyond, primarily due to the liability measurement transition period of 0% in 2013, 25% in 2014, 50% in 2015, 75% in 2016 and 100% in 2017 included in the rule. Because CAS Harmonization is a required change in cost accounting for government contractors, we are entitled to an equitable adjustment for the increase in costs on our contracts. We have completed our negotiations with the government on the amount of the equitable adjustment which had an immaterial impact on our 2016 financial results.
In July 2012, the Surface Transportation Extension Act (STE Act) was passed by Congress and signed by the President. The STE Act includes a provision for temporary pension funding relief due to the low interest rate environment. The provision adjusts the 24-month average high quality corporate bond rates used to determine the PPA funded status so that they are within a floor and cap, or “corridor”, based on the 25-year average of corporate bond rates. The STE Act gradually phased out this interest rate provision beginning in 2013. Subsequent to the STE Act, the Highway and Transportation Funding Act of 2014 (HATFA) and the Bipartisan Budget Act of 2015 (BBA) further extended this interest rate provision until 2020, at which time the provision is gradually phased out. The STE, HATFA and BBA impact CAS expense as well because CAS Harmonization incorporates the PPA interest rate into CAS calculations. The BBA also increases the insurance premiums that we are required to pay the Pension Benefit Guarantee Corporation (PBGC). However, we do not expect the increases to have a material effect on our financial position, results of operations or liquidity.
The assumptions in the calculations of our pension FAS expense and CAS expense, which involve significant judgment, are described below.
FAS Expense—Our long-term return on plan assets (ROA) and discount rate assumptions are the key variables in determining pension expense or income and the funded status of our pension plans under U.S. GAAP.
The long-term ROA represents the average rate of earnings expected over the long term on the assets invested to provide for anticipated future benefit payment obligations. The long-term ROA used to calculate net periodic pension cost is set annually at the beginning of each year. Given the long-term nature of the ROA assumption, which we believe should not be solely reactive to short-term market conditions that may not persist, we expect the long-term ROA to remain unchanged unless there are significant changes in our investment strategy, the underlying economic assumptions or other major factors.
To establish our long-term ROA assumption we employ a “building block” approach. We then annually consider whether it is appropriate to change our long-term ROA assumption by reviewing the existing assumption against a statistically determined reasonable range of outcomes. The building block approach and the reasonable range of outcomes are based upon our asset allocation assumptions and long-term capital market assumptions. Such assumptions incorporate the economic outlook for various asset classes over short- and long-term periods and also take into consideration other factors, including historical market performance, inflation and interest rates.
For purposes of our long-term ROA assumptions for 2014 and prior, we considered the reasonable range to be between the 25th and 75th percentile likelihood of achieving a long-term return over future years, consistent with the Actuarial Standard of Practice No. 27, Selection of Economic Assumptions for Measuring Pension Obligations (ASOP 27) in effect at the time. Therefore, it was less than 25% likely that the long-term return of the pension plan would fall below or above the 25th and 75th percentiles points, respectively (i.e., it is 50% likely that the long-term return of the pension plan will be within the 25th and 75th percentile range). In September 2013, the Actuarial Standards Board issued a revision to ASOP 27, that replaced the explicit reference to the best estimate range concept with the selection of a reasonable assumption that considers multiple criteria including the purposes of measurement, the actuary’s professional judgment, historical and current economic data and estimates of future experience and has no significant bias. The revised standard is effective for assumptions established on or after September 30, 2014. As a result of the revised standard, we continue to evaluate our long-term ROA assumption against a reasonable range of possible outcomes, but effective for our 2015 and future years assumptions, we modified that range to be between the 35th to 65th percentile likelihood of achieving a long-term return over future years. We believe that continuing
34
to validate our ROA assumption within a reasonable range that is narrowed to the 35th to 65th percentile ensures an unbiased result while also ensuring that the ROA assumption is not solely reactive to short-term market conditions that may not persist, and is consistent with external actuarial practices.
The reasonable range of long-term returns that was used to validate the long-term ROA assumption for the calculation of the net periodic benefit cost for 2016, 2015 and 2014, is shown below.
Percentile | 2016 | 2015 | 2014 | |||||
25th | N/A | N/A | 5.53 | % | ||||
35th | 6.09 | % | 6.37 | % | N/A | |||
65th | 8.16 | % | 8.37 | % | N/A | |||
75th | N/A | N/A | 9.65 | % | ||||
2014 ROA Assumption—The long-term domestic ROA of 8.75% fell between the 60th–65th percentile of the applicable reasonable range for 2014. The 50th percentile of this reasonable range was 7.59%.
2015 ROA Assumption—In the fourth quarter of 2014, we reduced our long-term target allocation for equities and increased our target allocation for fixed income within the investment policy allocations established by our Investment Committee in order to reduce the overall exposure to equity volatility. This change in asset allocation reduced the range of reasonable outcomes that we use to evaluate our long-term ROA assumption and we determined that the historical assumption of 8.75% no longer fell within this range. As a result, we employed a building block approach to develop our 2015 long-term ROA assumption. Under this building block method, the overall expected investment return equals the weighted-average of the individual expected return for each asset class based on the target asset allocation and the long-term capital market assumptions. The expected return for each asset class is composed of inflation plus a risk-free rate of return, plus an expected risk premium for that asset class. The resulting return is then adjusted for administrative, investment management and trading expenses as well as recognition of alpha for active management. The building block approach resulted in a long-term ROA assumption of 8.0% for 2015. To validate this assumption we compared the result against the reasonable range of outcomes and confirmed that the 8.0% result fell between the 55th–60th percentile of the reasonable range for 2015 with the 50th percentile at 7.37%. In addition, when we updated our target asset allocation and our long-term ROA assumption changed from 8.75% to 8.0%, we assessed what our historical asset performance may have been since 1986 using the updated target allocation and concluded the average return would likely have been equal to or greater than 8.0% for the time period from 1986 through 2014.
Based upon our application of the building block approach and our review of the resulting assumption against the 35th to 65th reasonable range and an analysis of our historical results, we established a 2015 long-term domestic ROA assumption of 8.0% for purposes of determining the net periodic benefit cost for 2015 and determined that the assumption is reasonable and consistent with the provisions of ASOP 27.
2016 ROA Assumption—The long-term domestic ROA of 8.0% fell between the 60th–65th percentile of the applicable reasonable range for 2016. The 50th percentile of this reasonable range was 7.12%.
2017 ROA Assumption—At year end 2016, we determined that the 8.0% long-term ROA assumption no longer fell within the range of reasonable outcomes, driven primarily by the current outlook on economic assumptions used to develop the reasonable range. As a result, we employed the building block approach described above to develop our 2017 long-term ROA assumption. The building block approach resulted in a long-term ROA assumption of 7.5% for 2017. To validate this assumption, we compared the result against the reasonable range of outcomes and confirmed that the 7.5% fell between the 55th and 60th percentile of the reasonable range for 2017 with the 50th percentile at 6.89%.
Once our long-term ROA has been determined to be within the 35th to 65th percentile range of results, we review historical averages and patterns of returns to confirm reasonability of our long-term ROA assumption compared to past results. While history is not solely indicative of future market expectations, it does provide insight into general historical trends and long-term asset performance. Our average annual actual rate of return from 1986 to 2016 of 8.80%, determined on an arithmetic basis, exceeds our estimated 7.5% assumed return. Arithmetic annual averages represent the simple average returns over independent annual periods, whereas geometric returns reflect the compound average returns of dependent annual periods.
35
The average annual actual return on a geometric basis for the same period was 8.14%. In addition, the actual annual returns have exceeded our long-term ROA assumption of 7.5% in five of the past ten years.
Based upon our application of the building block approach and our review of the resulting assumption against the 35th to 65th percentile reasonable range and an analysis of our historical results, we have established a 2017 long-term ROA domestic assumption of 7.5% for purposes of determining the net periodic benefit cost for 2017 and have determined that the new assumption is reasonable and consistent with the provisions of ASOP 27.
If we significantly change our long-term investment allocation or strategy, or if there is a significant change in the economic assumptions, then our long-term ROA assumption could change in the future.
Our domestic pension plans’ actual rates of return were approximately 6%, 0% and 6% for 2016, 2015 and 2014, respectively. Asset returns in recent years have been impacted by the historically low risk-free interest rate environment, which is not expected to persist in the long term. The difference between the actual rate of return and our long-term ROA assumption is included in deferred losses.
The investment policy asset allocation ranges for our domestic pension plans, as set by our Investment Committee, for the year ended December 31, 2016 were as follows:
Asset Category | ||
Global equity (combined U.S. and international equity) | 40%-60% | |
U.S. equities | 25%-40% | |
International equities | 15%-25% | |
Fixed-income securities | 25%-40% | |
Cash and cash equivalents | 0%-10% | |
Private equity and private real estate | 5%-25% | |
Other (including absolute return funds) | 5%-20% | |
Our long-term ROA assumptions for foreign pension plans are based on the asset allocations and the economic environment prevailing in the locations where the pension plans reside. Foreign pension assets do not make up a significant portion of the total assets for all of our pension plans.
The discount rate represents the interest rate that should be used to determine the present value of future cash flows currently expected to be required to settle our pension and PRB obligations. The discount rate assumption is determined by using a theoretical bond portfolio model consisting of bonds rated AA or better by Moody’s Investors Service for which the timing and amount of cash flows approximate the estimated benefit payments for each of our pension plans. The discount rate assumption for our domestic pension plans at December 31, 2016 is 4.36%, which represents a weighted-average discount rate across our plans, compared to the December 31, 2015 discount rate of 4.47%.
CAS Expense—In addition to providing the methodology for calculating pension costs, CAS also prescribes the method for assigning those costs to specific periods. While the ultimate liability for pension costs under FAS and CAS is similar, the pattern of cost recognition is different. The key drivers of CAS pension expense include the funded status and the method used to calculate CAS reimbursement for each of our plans. Under the prior CAS rules, the discount rate used to measure liabilities was required to be consistent with the long-term ROA assumption, which generally changes infrequently given its long-term nature. In addition to certain other changes, CAS Harmonization requires contractors to compare the liability under the prior CAS methodology and assumptions to a liability using a discount rate based on high-quality corporate bonds, and use the greater of the two liability calculations in developing CAS expense. In addition, unlike FAS, we can only allocate pension costs for a plan under CAS until such plan is fully funded as determined under CAS requirements. When the estimated future CAS pension costs increase, the estimated CAS cost allocated to our contracts in the future increases.
36
Other FAS and CAS Considerations—An increase or decrease of 25 basis points in the discount rate assumption would have had the following approximate impacts on 2016 FAS pension results:
(In millions) | |||
Impact of change in discount rate on net periodic benefit cost | $ | 65 | |
Impact of change in discount rate on benefit obligations | 722 | ||
Changes in the high-quality corporate bond rate assumption could impact the CAS discount rate for purposes of determining CAS pension expense due to CAS Harmonization. However in 2016, the CAS pension expense was not impacted by this assumption due to the passage of HATFA and BBA which extended the provisions of pension funding relief as described above. The discount rate assumption could impact CAS pension expense in future periods depending upon the interest rate and regulatory environments.
An increase or decrease of 25 basis points in the long-term ROA assumption would have had the following approximate impacts on 2016 FAS and CAS pension results:
(In millions) | ||||
FAS expense | $ | (46 | ) | |
CAS expense | 3 | |||
FAS/CAS Pension Adjustment | $ | (43 | ) | |
A 25 basis point increase or decrease in our long-term ROA assumption would result in a decrease or increase to our FAS pension expense by approximately $46 million for 2016. In addition to the impact on our 2016 FAS/CAS Pension Adjustment, a portion of the $3 million change in CAS pension expense would also be allocated to fixed-price contracts in backlog and would either increase or decrease the profit rate on those contracts at the time of such a change (i.e., a change in the long-term ROA assumption on January 1, 2016 would drive a change in estimated costs in EACs and related contract profit rates as of December 31, 2015). The contract impact resulting from the change in CAS pension expense is difficult to estimate because remaining performance periods can vary, the amount and timing of expected new awards (i.e., the proposals expected to be awarded in the year which will bear their allocated portion of the change in CAS pension expense), and our mix of fixed-price and cost reimbursable contracts can change. Based on our contract profile at December 31, 2015, if we had 65% of our backlog in fixed-price contracts, and they were on average 50% complete, with our actual new award profile for 2016, a 25 basis point change in our long-term ROA assumption at January 1, 2016 would drive less than $1 million of aggregate total EAC adjustments at December 31, 2015. In addition, our fixed-price contracts in backlog as of December 31, 2015 would have a lower profit rate in 2016, resulting in less than $1 million impact as costs are incurred in that year on those contracts. The total impact on 2015 would be less than $1 million driven by the aggregate EAC adjustments and the total impact on 2016 would be approximately $43 million (the FAS/CAS Pension Adjustment and the lower profit rate impact in 2016 on fixed-price contracts in backlog at December 31, 2015). A change in our long-term ROA assumption would be subject to review by our government customer for reasonableness. Given our history of recovering changes to CAS pension expense, we expect the assumption change would be allocable and allowable, per regulatory guidelines, as long as the assumption is reasonable.
The impact of changing our long-term ROA for our domestic pension plans from 8.75% to 8.0% in 2015 increased our FAS expense by $140 million, increased our CAS expense by $40 million and decreased our FAS/CAS Pension Adjustment to income by $100 million in 2015. The impact of changing our long-term ROA for our domestic pension plans from 8.0% to 7.5% in 2017 is expected to increase our FAS expense by $87 million, decrease our CAS expense by $18 million and decrease our FAS/CAS Pension Adjustment to income by $105 million in 2017. The CAS impact is primarily driven by whether the pre-CAS Harmonization methodology applies, which uses a discount rate based on the long-term ROA assumption, or the post-CAS Harmonization methodology applies, which uses a discount rate based on high-quality corporate bond rates. The actual CAS impact is not linear and can vary significantly from the theoretical impact described above because it relies on the actual change in the long-term ROA and the corresponding relationship between the long-term ROA, which is used under the pre-CAS Harmonization methodology, and the high-quality corporate bond rates, which are used under the post-CAS Harmonization methodology. In addition, the timing of the change relative to the transition period for CAS Harmonization affects the CAS impact. The $40 million increase in our CAS expense in 2015 was included in our EACs and did not have a significant impact on our 2014 results based on our overall ending overhead positions. The $18 million decrease in our CAS
37
expense in 2017 was included in our EACs and did not have a significant impact on our 2016 results based on our overall ending overhead positions.
In accordance with both FAS and CAS, a calculated “market-related value” of our plan assets is used to develop the amount of deferred asset gains or losses to be amortized. The market-related value of assets is determined using actual asset gains or losses over a certain prior period (three years for FAS and five years for CAS, subject to certain limitations under CAS on the difference between the market-related value and actual market value of assets). Because of this difference in the number of years over which actual asset gains or losses are recognized and subsequently amortized, FAS expense generally tends to reflect recent asset gains or losses faster than CAS. Another driver of CAS expense (but not FAS expense) is the funded status of our pension plans under CAS. As noted above, CAS expense is only recognized for plans that are not fully funded; consequently, if plans become or cease to be fully funded under CAS due to our asset or liability experience, our CAS expense will change accordingly.
Under FAS, a “corridor” approach may be elected and applied in the recognition of asset and liability gains or losses which limits expense recognition to the net outstanding gains and losses in excess of the greater of 10% of the projected benefit obligation or the calculated "market-related value" of assets. We do not use a “corridor” approach in the calculation of FAS expense.
Our pension and PRB plans' investments are stated at fair value. Investments in equity securities (common and preferred) are valued at the last reported sales price when an active market exists. Investments in fixed-income securities are generally valued using methods based upon market transactions for comparable securities and various relationships between securities which are generally recognized by institutional traders. Investments in private equity funds, private real estate funds, and other commingled funds are estimated at fair market value which primarily utilizes net asset values reported by the investment manager or fund administrator. We review additional valuation and pricing information from the fund managers, including audited financial statements, to evaluate the net asset values.
The change in accumulated other comprehensive loss (AOCL) related to pension and PRB plans was as follows:
(In millions) | 2016 | 2015 | 2014 | |||||||||
Beginning balance | $ | (10,912 | ) | $ | (11,437 | ) | $ | (7,923 | ) | |||
Amortization of net losses included in net income | 1,006 | 1,135 | 898 | |||||||||
Gain (loss) arising during the period | (1,209 | ) | (610 | ) | (4,412 | ) | ||||||
Ending balance | $ | (11,115 | ) | $ | (10,912 | ) | $ | (11,437 | ) | |||
The balance in AOCL related to our pension and PRB plans is composed primarily of differences between changes in discount rates, differences between actual and expected asset returns, differences between actual and assumed demographic experience, and changes in plan provisions. Changes to our pension and PRB obligation as a result of these variables are initially reflected in other comprehensive income. The deferred gains and losses are amortized and included in future pension expense over the average employee service period of approximately 9 years at December 31, 2016. The $1.2 billion in 2016 losses arising during the period were driven primarily by the decrease in the discount rate from 4.47% at December 31, 2015 to 4.36% at December 31, 2016, which had an impact of approximately $0.5 billion, and actual returns, which were lower than our expected return, and had an impact of approximately $0.4 billion, as well as other actuarial factors.
The $0.6 billion in 2015 losses arising during the period were driven primarily by actual returns, which were lower than our expected return and had an impact of approximately $1.6 billion, as well as other actuarial factors, partially offset by the increase in the discount rate from 4.08% at December 31, 2014 to 4.47% at December 31, 2015, which had an impact of approximately $1.2 billion.
The $4.4 billion in 2014 losses arising during the period were driven primarily by the decrease in the discount rate from 5.08% at December 31, 2013 to 4.08% at December 31, 2014, which had an impact of approximately $3.0 billion, and actual returns which were lower than our expected return and had an impact of approximately $0.3 billion, as well as other actuarial factors including mortality. The mortality assumption is the basis for determining the longevity of our pension participants and the expected period over which they will receive pension benefits. A 2014 study released by the Society of Actuaries indicated that life expectancies have increased over the past several years and are longer than what was assumed by most existing mortality tables. Since December 31, 2014, our pension obligations reflect a change in the underlying mortality assumption,
38
which reflects improvements in life expectancy consistent with the Society of Actuaries 2014 study. In addition, these pension obligations reflect an increase in the expected rate of future longevity improvement taking into consideration data from multiple sources including the Society of Actuaries 2014 study and Social Security Administration data. These changes resulted in an increase in our projected benefit obligation of $0.6 billion as of December 31, 2014.
Goodwill
We evaluate our goodwill for impairment annually as of the first day of our fiscal fourth quarter and in any interim period in which circumstances arise that indicate our goodwill may be impaired. Indicators of impairment include, but are not limited to, the loss of significant business, significant decreases in federal government appropriations or funding for our contracts, or other significant adverse changes in industry or market conditions. No events occurred during the periods presented that indicated the existence of an impairment with respect to our goodwill. We estimate the fair value of our reporting units using a discounted cash flow (DCF) model based on our most recent long-range plan in place at the time of our impairment testing, and compare the estimated fair value of each reporting unit to its net book value, including goodwill. We discount the cash flow forecasts using the weighted-average cost of capital method at the date of evaluation. The weighted-average cost of capital is comprised of the estimated required rate of return on equity, based on publicly available data for peer companies, plus an equity risk premium related to specific company risk factors, and the after-tax rate of return on debt, weighted at the relative values of the estimated debt and equity for the industry. Preparation of forecasts for use in the long-range plan and the selection of the discount rate involve significant judgments that we base primarily on existing firm orders, expected future orders, contracts with suppliers, labor agreements and general market conditions. Significant changes in these forecasts or the discount rate selected could affect the estimated fair value of one or more of our reporting units and could result in a goodwill impairment charge in a future period. When available and as appropriate, we also use comparative market multiples to corroborate our DCF model results. There was no indication of goodwill impairment as a result of our 2016 annual impairment analysis, as the fair values of each of our reporting units exceeded their respective net book values, including goodwill.
Based on our 2016 impairment analysis, the Forcepoint reporting unit had a fair value in excess of net book value, including goodwill, of approximately 25%. All other factors equal, a 10% decrease in expected future cash flows for our Forcepoint reporting unit would result in an excess of fair value over net book value of approximately 10%. Alternatively, all other factors being equal, a 100 basis points increase in the discount rate used in the calculation of the fair value of our Forcepoint reporting unit would also result in an excess of fair value over net book value of approximately 10%. Based on our 2016 impairment analysis of the other reporting units, the reporting unit that was closest to impairment had a fair value in excess of net book value, including goodwill, of approximately 85%. All other factors equal, a 10% decrease in expected future cash flows for that reporting unit would result in an excess of fair value over net book value of approximately 70%. Alternatively, all other factors being equal, a 100 basis points increase in the discount rate used in the calculation of the fair value of that reporting unit would result in an excess of fair value over net book value of approximately 55%. If we are required to record an impairment charge in the future, it could materially affect our results of operations.
ACCOUNTING STANDARDS
In May 2014, the Financial Accounting Standards Board (FASB) issued Accounting Standards Update (ASU) 2014-09, Revenue from Contracts with Customers (Topic 606), which will replace numerous requirements in U.S. GAAP, including industry-specific requirements, and provide companies with a single revenue recognition model for recognizing revenue from contracts with customers. The core principle of the new standard is that a company should recognize revenue to depict the transfer of promised goods or services to customers in an amount that reflects the consideration to which the company expects to be entitled in exchange for those goods or services. The two permitted transition methods under the new standard are the full retrospective method, in which case the standard would be applied to each prior reporting period presented and the cumulative effect of applying the standard would be recognized at the earliest period shown, or the modified retrospective method, in which case the cumulative effect of applying the standard would be recognized at the date of initial application. In July 2015, the FASB approved the deferral of the new standard's effective date by one year. The new standard is effective for annual reporting periods beginning after December 15, 2017. The FASB will permit companies to adopt the new standard early, but not before the original effective date of annual reporting periods beginning after December 15, 2016.
In 2014, we established a cross-functional implementation team consisting of representatives from across all of our business segments. We utilized a bottom-up approach to analyze the impact of the standard on our contract portfolio by reviewing our current accounting policies and practices to identify potential differences that would result from applying the requirements of the new standard to our revenue contracts. In addition, we identified and implemented appropriate changes to our business processes, systems and controls to support recognition and disclosure under the new standard. The implementation team has
39
reported the findings and progress of the project to management and the Audit Committee on a frequent basis over the last two years.
We have been closely monitoring FASB activity related to the new standard, as well as working with various non-authoritative groups to conclude on specific interpretative issues. In the first half of 2016, we made significant progress toward completing our evaluation of the potential changes from adopting the new standard on our future financial reporting and disclosures. Our progress was aided by the FASB issuing ASU 2016-10, Identifying Performance Obligations and Licensing, which amended the current guidance on performance obligations and provided additional clarity on this topic, and the significant progress of the non-authoritative groups in concluding on specific interpretative issues. In the second half of 2016, we finalized our contract reviews and detailed policy drafting. Based on our evaluation, we will early adopt the requirements of the new standard in the first quarter of 2017 and will used the full retrospective transition method.
The impact of adopting the new standard on our 2015 and 2016 total net sales and operating income is not material. The immaterial impact of adopting Topic 606 primarily relates to the deferral of commissions on our commercial software arrangements, which previously were expensed as incurred but under the new standard will generally be capitalized and amortized over the period of contract performance or a longer period if renewals are expected and the renewal commission is not commensurate with the initial commission, and policy changes related to the recognition of revenue and costs on our defense and commercial software contracts to better align our policies with the new standard, which may impact the timing of revenue. The impact to our results is not material because the analysis of our contracts under the new revenue recognition standard supports the recognition of revenue over time under the cost-to-cost method for the majority of our contracts, which is consistent with our current revenue recognition model. Revenue on the majority of our contracts will continue to be recognized over time because of the continuous transfer of control to the customer. For U.S. government contracts, this continuous transfer of control to the customer is supported by clauses in the contract that allow the customer to unilaterally terminate the contract for convenience, pay us for costs incurred plus a reasonable profit and take control of any work in process. Similarly, for non-U.S. government contracts, the customer typically controls the work in process as evidenced either by contractual termination clauses or by our rights to payment for work performed to date to deliver products or services that do not have an alternative use to the company. Under the new standard, the cost-to-cost measure of progress continues to best depict the transfer of control of assets to the customer, which occurs as we incur costs. In addition, the number of our performance obligations under the new standard is not materially different from our contract segments under the existing standard. Lastly, the accounting for the estimate of variable consideration is not materially different compared to our current practice.
Select recast unaudited financial statement line items, which reflect the adoption of Topic 606 are as follows:
(In millions, except per share amounts) Years Ended December 31: | 2016 | 2015 | |||||
Total net sales | $ | 24,124 | $ | 23,321 | |||
Operating income | 3,295 | 3,067 | |||||
Basic earnings per share attributable to Raytheon Company common stockholders: | |||||||
Income from continuing operations | $ | 7.55 | $ | 6.88 | |||
Income (loss) from discontinued operations, net of tax | — | 0.04 | |||||
Net income | 7.56 | 6.92 | |||||
Diluted earnings per share attributable to Raytheon Company common stockholders: | |||||||
Income from continuing operations | $ | 7.55 | $ | 6.87 | |||
Income (loss) from discontinued operations, net of tax | — | 0.04 | |||||
Net income | 7.55 | 6.91 | |||||
We also do not expect the standard to have a material impact on our consolidated balance sheet. The immaterial impact primarily relates to reclassifications among financial statement accounts to align with the new standard. Most notably, contracts in process, net will be reclassified as receivables or contract assets based on amounts billed or unbilled, respectively. Advance payments and billings in excess of costs incurred and deferred revenue will be combined and reclassified as contract liabilities. Our contract balances will be reported in a net contract asset or liability position on a contract-by-contract basis at the end of each reporting period.
40
In March 2016, the FASB issued ASU 2016-09, Compensation - Stock Compensation (Topic 718): Improvements to Employee Share-Based Payment Accounting, which amends the accounting for employee share-based payment transactions to require recognition of the tax effects resulting from the settlement of stock-based awards as income tax expense or benefit in the income statement in the reporting period in which they occur. In addition, the ASU requires that all tax-related cash flows resulting from share-based payments, including the excess tax benefits related to the settlement of stock-based awards, be classified as cash flows from operating activities in the statement of cash flows. The ASU also requires that cash paid by directly withholding shares for tax withholding purposes be classified as a financing activity in the statement of cash flows. In addition, the ASU allows companies to make an accounting policy election to either estimate the number of awards that are expected to vest, consistent with current U.S. GAAP, or account for forfeitures when they occur. The new standard is effective for annual reporting periods beginning after December 15, 2016 with early adoption permitted. We elected to early adopt the requirements of the amended standard in the first quarter of 2016. In accordance with U.S. GAAP, we adopted the amendment requiring recognition of excess tax benefits and tax deficiencies in the income statement prospectively beginning in the first quarter of 2016, which could result in fluctuations in our effective tax rate period over period depending on how many awards vest in a quarter as well as the volatility of our stock price. In 2016, the impact to our income statement was $47 million, included in federal and foreign income taxes. In addition, we elected to adopt the amendment related to the presentation of excess tax benefits within operating activities on the statement of cash flows prospectively beginning in the first quarter of 2016. We had previously classified cash paid for tax withholding purposes as a financing activity in the statement of cash flows, therefore there is no change related to this requirement. Furthermore, we elected to change our accounting policy to account for forfeitures when they occur for consistency with our government recovery accounting practices on a modified retrospective basis.
In February 2016, the FASB issued ASU 2016-02, Leases (Topic 842), which requires lessees to recognize a right-of-use asset and lease liability for most lease arrangements. The new standard is effective for annual reporting periods beginning after December 15, 2018 with early adoption permitted, and must be adopted using the modified retrospective approach. We are currently evaluating the potential changes from this ASU to our future financial reporting and disclosures. We expect the standard to have an impact of approximately $1 billion on our assets and liabilities for the addition of right-of-use assets and lease liabilities, but we do not expect it to have a material impact to our results of operations or liquidity.
Other new pronouncements issued but not effective until after December 31, 2016 are not expected to have a material impact on our financial position, results of operations or liquidity.
CONSOLIDATED RESULTS OF OPERATIONS
Total Net Sales
The composition of external net sales by products and services for each segment in 2016 was approximately the following:
(% of segment total external net sales) | IDS | IIS | MS | SAS | Forcepoint |
Products(1) | 90% | 50% | 100% | 95% | 90% |
Services | 10% | 50% | —% | 5% | 10% |
(1) | Products net sales includes software related sales, including software subscriptions. |
% of Total Net Sales | ||||||||||||||||||||
(In millions, except percentages) | 2016 | 2015 | 2014 | 2016 | 2015 | 2014 | ||||||||||||||
Net sales | ||||||||||||||||||||
Products | $ | 20,166 | $ | 19,443 | $ | 19,126 | 83.8 | % | 83.6 | % | 83.8 | % | ||||||||
Services | 3,903 | 3,804 | 3,700 | 16.2 | % | 16.4 | % | 16.2 | % | |||||||||||
Total net sales | $ | 24,069 | $ | 23,247 | $ | 22,826 | 100.0 | % | 100.0 | % | 100.0 | % | ||||||||
Total Net Sales - 2016 vs. 2015—The increase in total net sales of $822 million in 2016 compared to 2015 was primarily due to higher external net sales of $536 million at MS and $394 million at SAS, partially offset by lower external net sales of $376 million at IDS. The increase in external net sales at MS was primarily due to higher net sales on the Paveway program principally driven by international requirements. The increase in external net sales at SAS was primarily due to higher net sales on classified programs, including an international classified program awarded in the first quarter of 2016. The decrease in external net sales at IDS was primarily due to lower net sales on our missile defense radar production programs, lower net
41
sales on an international communications program and lower net sales on the Air Warfare Destroyer (AWD) program, all due to the scheduled completion of certain production phases on these programs.
Products and Services Net Sales - 2016 vs. 2015—The increase in products net sales of $723 million in 2016 compared to 2015 was primarily due to higher external products net sales of $519 million at MS and $515 million at SAS, partially offset by lower external products net sales of $431 million at IDS. The increase in external products net sales at MS and SAS was primarily due to the programs discussed above. The decrease in external products net sales at IDS was primarily due to the programs discussed above. The increase in services net sales of $99 million in 2016 compared to 2015 was primarily due to higher external services net sales of $117 million at IIS and $55 million at IDS, partially offset by lower external services net sales of $121 million at SAS. The increase in external services net sales at IIS was spread across numerous programs with no individual driver. The increase in external services net sales at IDS was driven principally by higher services net sales on radar sustainment programs for the Missile Defense Agency (MDA) and various Patriot support programs. The decrease in external services net sales at SAS was primarily due to lower service net sales on classified programs.
Total Net Sales - 2015 vs. 2014—The increase in total net sales of $421 million in 2015 compared to 2014 was primarily due to higher external net sales of $279 million at IDS, $244 million at MS, and $159 million at Forcepoint including the unfavorable impact of the deferred revenue adjustment recorded at corporate, partially offset by lower external net sales of $215 million at SAS. The increase in external net sales at IDS was primarily due to higher net sales from an international Patriot program awarded in the second quarter of 2015 driven by program activity and the recognition of previously deferred precontract costs, higher net sales from an international Patriot program awarded in the fourth quarter of 2014, higher net sales on the AWD program driven by additional scope awarded in the fourth quarter of 2014 and higher net change in EAC adjustments as discussed below in Segment Results beginning on page 48, and higher net sales from an international air and missile defense system program awarded in the fourth quarter of 2013 due to scheduled production phases. The higher net sales were partially offset by lower net sales from the scheduled completion of certain production phases on various Patriot programs for international customers and from the scheduled completion of certain production phases on our missile defense radar programs. The increase in external net sales at MS was primarily due to higher net sales on the Paveway program principally driven by international requirements, higher net sales on the Tube-launched, Optically-tracked, Wireless-guided (TOW) missile program primarily due to planned increases in production, and higher net sales on certain air and missile defense programs primarily due to a contract awarded in the third quarter of 2015, partially offset by lower net sales on the Standard Missile-3 (SM-3) program primarily due to the planned transition from development to production. The increase in external net sales at Forcepoint was primarily due to higher sales of $160 million resulting from the acquisition of Websense in the second quarter of 2015, including the unfavorable impact of the deferred revenue adjustment recorded at Corporate. Included in the change in external net sales at SAS was lower net sales primarily due to reduced schedule requirements on international tactical radar systems programs, lower intersegment sales driven by lower volume on contracts supporting radar programs, and higher net sales on classified programs. The remaining change in total net sales at SAS was spread across numerous programs with no individual or common significant driver.
Products and Services Net Sales - 2015 vs. 2014—The increase in products net sales of $317 million in 2015 compared to 2014 was primarily due to higher external products net sales of $262 million at MS and $161 million at Forcepoint, partially offset by lower external products net sales of $126 million at SAS. The increase in external products net sales at MS was primarily due to the programs discussed above. The increase in external products net sales at Forcepoint was principally driven by the acquisition of Websense. The decrease in external products net sales at SAS was primarily due to the international tactical radar systems programs discussed above. The increase in services net sales of $104 million in 2015 compared to 2014 was primarily due to higher external services net sales of $160 million at IDS, partially offset by lower external services net sales of $89 million at SAS. The increase in external services net sales at IDS was driven principally by higher services net sales on radar sustainment programs for the MDA and new service program awards, partially offset by lower services net sales on various other programs. The decrease in external services net sales at SAS was principally driven by several Intelligence, Surveillance and Reconnaissance Systems (ISRS) maintenance and sustainment programs due to scheduled completion in 2014.
42
Sales to Major Customers
% of Total Net Sales | ||||||||||||||||||||
(In millions, except percentages) | 2016 | 2015 | 2014 | 2016 | 2015 | 2014 | ||||||||||||||
Sales to the U.S. government(1) | $ | 16,101 | $ | 15,767 | $ | 16,083 | 67 | % | 68 | % | 70 | % | ||||||||
Sales to the U.S. Department of Defense(1) | 15,355 | 14,876 | 15,059 | 64 | % | 64 | % | 66 | % | |||||||||||
Total international sales(2) | 7,552 | 7,150 | 6,541 | 31 | % | 31 | % | 29 | % | |||||||||||
Foreign direct commercial sales(1) | 4,653 | 4,336 | 3,579 | 19 | % | 19 | % | 16 | % | |||||||||||
Foreign military sales through the U.S. government | 2,899 | 2,814 | 2,962 | 12 | % | 12 | % | 13 | % | |||||||||||
(1) | Excludes foreign military sales through the U.S. government. |
(2) | Includes foreign direct commercial sales and foreign military sales through the U.S. government. Due to rounding, the total international sales percentage may not equal the sum of the percentages for foreign direct commercial sales and foreign military sales through the U.S. government. |
As described above in Domestic Considerations, U.S. defense spending levels are difficult to predict due to numerous factors, including U.S. government budget appropriation decisions, geopolitical events and macroeconomic conditions.
Total Cost of Sales
Cost of sales, for both products and services, consists of labor, materials and subcontractors costs, as well as related allocated costs. For each of our contracts, we manage the nature and amount of direct costs at the contract level, and manage indirect costs through cost pools as required by government accounting regulations. The estimate of the actual amount of direct and indirect costs forms the basis for estimating our total costs at completion of the contract.
% of Total Net Sales | ||||||||||||||||||||
(In millions, except percentages) | 2016 | 2015 | 2014 | 2016 | 2015 | 2014 | ||||||||||||||
Cost of sales | ||||||||||||||||||||
Products | $ | 14,767 | $ | 14,447 | $ | 14,260 | 61.4 | % | 62.1 | % | 62.5 | % | ||||||||
Services | 3,180 | 3,127 | 3,035 | 13.2 | % | 13.5 | % | 13.3 | % | |||||||||||
Total cost of sales | $ | 17,947 | $ | 17,574 | $ | 17,295 | 74.6 | % | 75.6 | % | 75.8 | % | ||||||||
Total Cost of Sales - 2016 vs. 2015—The increase in total cost of sales of $373 million in 2016 compared to 2015 was primarily due to higher external cost of sales of $434 million at MS, $385 million at SAS and $227 million at IIS, partially offset by lower external cost of sales of $470 million at IDS and $250 million of lower expense related to the FAS/CAS Adjustment as described below in Segment Results beginning on page 48. The increases in external cost of sales at MS and SAS were driven principally by the activity on the programs described above in Total Net Sales. The increase in external cost of sales at IIS was driven principally by a $181 million impact from the eBorders settlement in 2015. In March 2015, Raytheon Systems Limited (RSL) reached a settlement with the UK Home Office concluding the parties' dispute regarding the UK Home Office's July 2010 termination of RSL's eBorders contract within our IIS segment. The settlement included a cash payment from the UK Home Office to RSL of £150 million (approximately $226 million based on foreign exchange rates as of the settlement date) for the resolution of all claims and counterclaims of both parties related to the matter. After certain expenses and derecognition of the outstanding receivables, IIS recorded $181 million in operating income through a reduction in cost of sales. The decrease in external cost of sales at IDS was principally driven by the tax-free $158 million gain from the sale of our equity method investment in Thales-Raytheon Systems Company S.A.S. (TRS SAS) in the second quarter of 2016, and the programs described above in Total Net Sales. In the second quarter of 2016, Thales S.A. and Raytheon amended and restated the Thales-Raytheon Systems Co. Ltd. (TRS) joint venture agreement to reduce the existing joint venture arrangement to Thales-Raytheon Systems Air and Missile Defense Command and Control S.A.S. (TRS AMDC2). The amendment and restatement of the TRS joint venture agreement resulted in Raytheon acquiring Thales S.A.'s noncontrolling interest in Raytheon Command and Control Solutions LLC (RCCS LLC), previously called Thales-Raytheon Systems LLC, and selling our equity method investment in TRS SAS, which resulted in a non-cash tax-free gain of $158 million. See "Note 5: Thales-Raytheon Systems Co. Ltd. (TRS) Joint Venture" within Item 8 of this Form 10-K for additional information.
Products and Services Cost of Sales - 2016 vs. 2015—The increase in products cost of sales of $320 million in 2016 compared to 2015 was primarily due to higher external products cost of sales of $481 million at SAS and $415 million at MS, partially offset by lower external products cost of sales of $515 million at IDS and $206 million of lower expense related to the FAS/
43
CAS Adjustment as described below in Segment Results beginning on page 48. The increases in external products cost of sales at SAS and MS were driven principally by the activity on the programs described above in Total Net Sales. The decrease in external products cost of sales at IDS was primarily due to the programs described above in Total Net Sales. The increase in services cost of sales of $53 million in 2016 compared to 2015 was primarily due to higher external services cost of sales of $108 million at IIS and $45 million at IDS, partially offset by lower external services cost of sales of $96 million at SAS all of which were driven principally by the programs described above in Total Net Sales.
Total Cost of Sales - 2015 vs. 2014—The increase in total cost of sales of $279 million in 2015 compared to 2014 was primarily due to higher external cost of sales of $346 million at IDS and $114 million at MS and $101 million of higher expense related to the FAS/CAS Adjustment as described below in Segment Results beginning on page 48, partially offset by lower external cost of sales of $228 million at IIS and $179 million at SAS. The increases in external cost of sales at IDS and MS were driven principally by the activity on the programs described above in Total Net Sales. The decrease in external cost of sales at IIS was driven principally by a $181 million impact from the eBorders settlement in 2015 as described above. The decrease in external cost of sales at SAS was primarily due to the programs described above in Total Net Sales.
Products and Services Cost of Sales - 2015 vs. 2014—The increase in products cost of sales of $187 million in 2015 compared to 2014 was primarily due to higher external products cost of sales of $219 million at IDS and $127 million at MS, both driven principally by the activity on the programs described above in Total Net Sales. The increases in products cost of sales were partially offset by a decrease in external products cost of sales of $252 million at IIS, principally driven by a $181 million impact from the eBorders settlement described above. The increase in services cost of sales of $92 million in 2015 compared to 2014 was primarily due to higher external services cost of sales of $127 million at IDS, driven principally by the programs described above in Total Net Sales.
General and Administrative Expenses
% of Total Net Sales | ||||||||||||||||||||
(In millions, except percentages) | 2016 | 2015 | 2014 | 2016 | 2015 | 2014 | ||||||||||||||
Administrative and selling expenses | $ | 2,127 | $ | 1,954 | $ | 1,852 | 8.8 | % | 8.4 | % | 8.1 | % | ||||||||
Research and development expenses | 755 | 706 | 500 | 3.1 | % | 3.0 | % | 2.2 | % | |||||||||||
Total general and administrative expenses | $ | 2,882 | $ | 2,660 | $ | 2,352 | 12.0 | % | 11.4 | % | 10.3 | % | ||||||||
The increase in administrative and selling expenses of $173 million in 2016 compared to 2015 was primarily driven by a $128 million increase at Forcepoint principally driven by the acquisitions of Websense in the second quarter of 2015 and Stonesoft in the first quarter of 2016.
The increase in administrative and selling expenses of $102 million in 2015 compared to 2014 was primarily driven by a $90 million increase in selling and marketing expenses at Forcepoint principally driven by the acquisition of Websense. Included in administrative and selling expenses in 2015 was $26 million of Websense transaction and integration-related costs recorded at Corporate as described below in Segment Results beginning on page 48.
Included in administrative and selling expenses is the provision for state income taxes, which generally can be recovered through the pricing of products and services to the U.S. government. Net state income taxes allocated to our contracts were $26 million, $28 million and $41 million in 2016, 2015 and 2014, respectively.
The increase in research and development expenses of $49 million in 2016 compared to 2015 was primarily due to increased research and development expenses of $41 million at Forcepoint driven by our acquisitions of Websense in the second quarter of 2015 and Stonesoft in the first quarter of 2016.
The increase in research and development expenses of $206 million in 2015 compared to 2014 was primarily due to higher independent research and development activity, principally driven by $79 million at MS related to advanced capabilities, and increased research and development expenses of $52 million at Forcepoint driven by our acquisition of Websense and development on new commercial products.
44
Total Operating Expenses
% of Total Net Sales | ||||||||||||||||||||
(In millions, except percentages) | 2016 | 2015 | 2014 | 2016 | 2015 | 2014 | ||||||||||||||
Total operating expenses | $ | 20,829 | $ | 20,234 | $ | 19,647 | 86.5 | % | 87.0 | % | 86.1 | % | ||||||||
The increase in total operating expenses of $595 million in 2016 compared to 2015 was primarily due to the increase in total cost of sales of $373 million, the primary drivers of which are described above in Total Cost of Sales.
The increase in total operating expenses of $587 million in 2015 compared to 2014 was primarily due to the increase in total cost of sales of $279 million, the primary drivers of which are described above in Total Cost of Sales, and the increase in research and development expenses of $206 million, the primary drivers of which are described above in General and Administrative Expenses.
Operating Income
% of Total Net Sales | ||||||||||||||||||||
(In millions, except percentages) | 2016 | 2015 | 2014 | 2016 | 2015 | 2014 | ||||||||||||||
Operating income | $ | 3,240 | $ | 3,013 | $ | 3,179 | 13.5 | % | 13.0 | % | 13.9 | % | ||||||||
The increase in operating income of $227 million in 2016 compared to 2015 was due to the increase in total net sales of $822 million, the primary drivers of which are described above in Total Net Sales, partially offset by the increase in total operating expenses of $595 million, the primary drivers of which are described above in Total Operating Expenses. Included in total operating expenses in 2016 was the tax-free $158 million gain from the sale of our equity method investment in TRS SAS in the second quarter of 2016 as described above in Total Costs of Sales. Included in total operating expenses in 2015 was the $181 million impact from the eBorders settlement in the first quarter of 2015 as described above in Total Cost of Sales.
The decrease in operating income of $166 million in 2015 compared to 2014 was due to the increase in total operating expenses of $587 million, the primary drivers of which are described above in Total Operating Expenses, offset by the increase in total net sales of $421 million, the primary drivers of which are described above in Total Net Sales.
Total Non-Operating (Income) Expense, Net
(In millions) | 2016 | 2015 | 2014 | ||||||||
Non-operating (income) expense, net | |||||||||||
Interest expense | $ | 232 | $ | 233 | $ | 213 | |||||
Interest income | (16 | ) | (11 | ) | (10 | ) | |||||
Other expense (income), net | (6 | ) | 4 | (7 | ) | ||||||
Total non-operating (income) expense, net | $ | 210 | $ | 226 | $ | 196 | |||||
The decrease in total non-operating (income) expense, net, of $16 million in 2016 compared to 2015, was primarily due to a $9 million change in the fair value of marketable securities held in trust associated with certain of our non-qualified deferred compensation plans, due to net gains of $8 million in 2016 compared to net losses of $1 million in 2015.
The increase in total non-operating (income) expense, net, of $30 million in 2015 compared to 2014, was primarily due to $20 million of higher interest expense in 2015, principally driven by the issuance of $600 million of fixed-rate long-term debt in the fourth quarter of 2014, and a $12 million change in the fair value of marketable securities held in trust associated with certain of our non-qualified deferred compensation plans, due to net losses of $1 million in 2015 compared to net gains of $11 million in 2014.
45
Federal and Foreign Income Taxes
(In millions) | 2016 | 2015 | 2014 | ||||||||
Federal and foreign income taxes | $ | 857 | $ | 733 | $ | 790 | |||||
The increase in federal and foreign income taxes of $124 million in 2016 compared to 2015 was primarily due to an increase in operating income.
The decrease in federal and foreign income taxes of $57 million in 2015 compared to 2014 was primarily due to a decrease in operating income.
Our effective tax rate, which is used to determine federal and foreign income tax expense, differed from the U.S. statutory rate due to the following:
2016 | 2015 | 2014 | ||||||
Statutory tax rate | 35.0 | % | 35.0 | % | 35.0 | % | ||
Research and development tax credit | (1.3 | ) | (1.2 | ) | (1.1 | ) | ||
Tax settlements and refund claims | — | (3.2 | ) | (0.5 | ) | |||
Domestic manufacturing deduction benefit | (2.7 | ) | (3.1 | ) | (2.7 | ) | ||
Foreign income tax rate differential | — | (1.4 | ) | (0.6 | ) | |||
Equity compensation | (1.6 | ) | — | — | ||||
TRS tax-free gain | (1.8 | ) | — | — | ||||
Tax benefit of foreign dividend | — | — | (2.8 | ) | ||||
Other items, net | 0.7 | 0.2 | (0.8 | ) | ||||
Effective tax rate | 28.3 | % | 26.3 | % | 26.5 | % | ||
Our effective tax rate reflects the 35% U.S. statutory rate adjusted for various permanent differences between book and tax reporting. In December 2015, U.S. legislation was enacted to permanently reinstate the Research and Development tax credit (R&D tax credit) which had expired December 31, 2014. In 2016, 2015 and 2014 we recorded a full year benefit of approximately $41 million, $33 million and $30 million related to the 2016, 2015 and 2014 R&D tax credits, respectively.
Our effective tax rate in 2016 was lower than the statutory federal tax rate primarily due to the domestic manufacturing deduction, which decreased the rate by approximately 2.7%, the tax-free gain related to the sale of our equity method investment in TRS SAS as described in above in Total Cost of Sales, which decreased the rate by 1.8%, the tax benefit recognized upon settlement of stock-based awards due to the adoption of the new accounting standard for stock-based compensation in the first quarter of 2016 as discussed further in "Note 1: Summary of Significant Accounting Policies" within Item 8 of this Form 10-K, which decreased the rate by 1.6%, and the R&D tax credit which decreased the rate by approximately 1.3%. The remaining increase of 0.7% is composed of various unrelated items, which individually or collectively are not significant.
Our effective tax rate in 2015 was lower than the statutory federal tax rate primarily due to tax settlements and refunds, which decreased the rate by approximately 3.2%, the domestic manufacturing deduction, which decreased the rate by approximately 3.1%, the foreign rate differential which decreased the rate by 1.4% and was primarily driven by the tax impact of the eBorders settlement, and the reinstatement of the R&D tax credit, which decreased the rate by approximately 1.2%. The remaining increase of 0.2% is composed of various unrelated items, which individually or collectively are not significant.
Our effective tax rate in 2014 was lower than the statutory federal tax rate primarily due to the tax benefit on the foreign dividend, which decreased the rate by approximately 2.8%, the domestic manufacturing deduction, which decreased the rate by approximately 2.7%, the reinstatement of the R&D tax credit, which decreased the rate by approximately 1.1%, the foreign rate differential, which decreased the rate by 0.6% and tax settlements and refunds, which decreased the rate by approximately 0.5%.The remaining decrease of 0.8% is composed of various unrelated items, which individually or collectively are not significant
Our effective tax rate in 2016 was 2.0% higher than in 2015 primarily due to tax settlements in 2015, which decreased the 2015 rate by 3.2% and the foreign rate differential, primarily driven by the e-Borders settlement in 2015, which decreased the
46
2015 rate by 1.4%, partially offset by the tax-free gain related to the sale of our equity method investment in TRS SAS as discussed above, which decreased the rate by 1.8% and the tax benefit recognized upon settlement of stock-based awards as discussed above, which decreased the rate by 1.6%. The remaining increase of 0.8% is composed of various unrelated items, which individually or collectively are not significant.
Our effective tax rate in 2015 was 0.2% lower than in 2014 primarily due to the tax settlements and refunds, which decreased the rate by approximately 2.7%, partially offset by the 2014 tax benefit on the foreign dividend, which increased the rate by approximately 2.8%. The remaining decrease of 0.3% is composed of various unrelated items, which individually or collectively are not significant.
Income from Continuing Operations
(In millions) | 2016 | 2015 | 2014 | ||||||||
Income from continuing operations | $ | 2,173 | $ | 2,054 | $ | 2,193 | |||||
The increase in income from continuing operations of $119 million in 2016 compared to 2015 was primarily due to the $227 million increase in operating income, described above in Operating Income, partially offset by the $124 million increase in federal and foreign income taxes, described above in Federal and Foreign Income Taxes.
The decrease in income from continuing operations of $139 million in 2015 compared to 2014 was primarily due to the $166 million decrease in operating income, described above in Operating Income.
Income (Loss) from Discontinued Operations, Net of Tax
(In millions) | 2016 | 2015 | 2014 | ||||||||
Income (loss) from discontinued operations, net of tax | $ | 1 | $ | 13 | $ | 65 | |||||
Income (loss) from discontinued operations, net of tax, in 2016 was relatively consistent with 2015.
The decrease in income from discontinued operations, net of tax, of $52 million in 2015 compared to 2014 was primarily due to a gain of $52 million in 2014 related to the resolution of a dispute and related litigation with the U.S. government regarding pension segment closing adjustments under Cost Accounting Standard 413 (CAS 413) for operations we divested over ten years ago. Under CAS 413, a pension plan termination adjustment is required when a contractor divests a business, yet retains ownership of the pension plan assets and liabilities of that business. These adjustments can result in payments to the U.S. government for pension plans that are in surplus position or payments to contractors for plans that are in a deficit position. See "Note 7: Discontinued Operations" within Item 8 of this Form 10-K for additional details.
Net Income
(In millions) | 2016 | 2015 | 2014 | ||||||||
Net income | $ | 2,174 | $ | 2,067 | $ | 2,258 | |||||
The increase in net income of $107 million in 2016 compared to 2015 was primarily due to the increase in income from continuing operations of $119 million described above in Income from Continuing Operations.
The decrease in net income of $191 million in 2015 compared to 2014 was due to the decrease in income from continuing operations of $139 million described above in Income from Continuing Operations.
Diluted EPS from Continuing Operations Attributable to Raytheon Company Common Stockholders
(In millions, except per share amounts) | 2016 | 2015 | 2014 | ||||||||
Income from continuing operations attributable to Raytheon Company | $ | 2,210 | $ | 2,061 | $ | 2,179 | |||||
Diluted weighted-average shares outstanding | 296.8 | 305.2 | 312.6 | ||||||||
Diluted EPS from continuing operations attributable to Raytheon Company | $ | 7.44 | $ | 6.75 | $ | 6.97 | |||||
47
The increase in diluted EPS from continuing operations attributable to Raytheon Company common stockholders of $0.69 in 2016 compared to 2015 was primarily due to the increase in income from continuing operations described above in Income from Continuing Operations and a decrease in weighted-average shares outstanding, which was driven by the common stock share activity shown in the table below. Diluted EPS from continuing operations attributable to Raytheon Company common stockholders was reduced by $0.01 for the impact of our redeemable noncontrolling interest redemption value adjustments, as discussed in "Note 1: Summary of Significant Accounting Policies" within Item 8 of this Form 10-K.
The decrease in diluted EPS from continuing operations attributable to Raytheon Company common stockholders of $0.22 in 2015 compared to 2014 was primarily due to the decrease in income from continuing operations described above in Income from Continuing Operations, partially offset by a decrease in weighted-average shares outstanding, which was driven by the common stock share activity shown in the table below.
Our common stock share activity for the years ended 2016, 2015, and 2014 was as follows:
(Shares in millions) | 2016 | 2015 | 2014 | |||||
Beginning balance | 299.0 | 307.3 | 314.5 | |||||
Stock plans activity | 1.5 | 1.6 | 1.4 | |||||
Share repurchases | (7.7 | ) | (9.9 | ) | (8.6 | ) | ||
Ending balance | 292.8 | 299.0 | 307.3 | |||||
Diluted EPS from Discontinued Operations Attributable to Raytheon Company Common Stockholders
Diluted EPS from discontinued operations attributable to Raytheon Company common stockholders were earnings of less than $0.01, $0.04 and $0.21 in 2016, 2015 and 2014, respectively.
Diluted EPS from discontinued operations attributable to Raytheon Company common stockholders in 2016 was relatively consistent with 2015.
The decrease of $0.17 in 2015 compared to 2014 was primarily due to the resolution of a dispute and related litigation with the U.S. government in the second quarter of 2014 described above in Income (Loss) from Discontinued Operations, Net of Tax.
Diluted EPS Attributable to Raytheon Company Common Stockholders
(In millions, except per share amounts) | 2016 | 2015 | 2014 | ||||||||
Net income attributable to Raytheon Company | $ | 2,211 | $ | 2,074 | $ | 2,244 | |||||
Diluted weighted-average shares outstanding | 296.8 | 305.2 | 312.6 | ||||||||
Diluted EPS attributable to Raytheon Company | $ | 7.44 | $ | 6.80 | $ | 7.18 | |||||
The increase in diluted EPS attributable to Raytheon Company common stockholders of $0.64 in 2016 compared to 2015 was primarily due to the $0.69 increase in diluted EPS from continuing operations attributable to Raytheon Company common stockholders described above in Diluted EPS from Continuing Operations Attributable to Raytheon Company Common Stockholders.
The decrease of $0.38 in 2015 compared to 2014 was primarily due to the $0.22 decrease in diluted EPS from continuing operations attributable to Raytheon Company common stockholders described above in Diluted EPS from Continuing Operations Attributable to Raytheon Company Common Stockholders and the $0.17 decrease in diluted EPS from discontinued operations described above in Diluted EPS from Discontinued Operations Attributable to Raytheon Company Common Stockholders.
SEGMENT RESULTS
We report our results in the following segments: IDS; IIS; MS; SAS; and Forcepoint.
The following provides some context for viewing our segment performance through the eyes of management.
48
Given the nature of our business, bookings, total net sales and operating income (and the related operating margin percentage), which we disclose and discuss at the segment level, are most relevant to an understanding of management’s view of our segment performance, and often these measures have significant interrelated effects, as described below. In addition, we disclose and discuss backlog, which represents future sales that we expect to recognize over the remaining contract period, which is generally several years. We also disclose total operating expenses and the components of total operating expenses within our segment disclosures.
Bookings—We disclose the amount of bookings and notable contract awards for each segment. Bookings generally represent the dollar value of new contracts awarded to us during the reporting period and include firm orders for which funding has not been appropriated. We believe bookings are an important measure of future performance and are an indicator of potential future changes in total net sales, because we cannot record revenues under a new contract without first having a booking in the current or a preceding period.
Bookings are impacted by the timing and amounts of awards in a given period, which are subject to numerous factors, including the desired capability by the customer and urgency of customer needs; customer budgets and other fiscal constraints; political and economic and other environmental factors; the timing of customer negotiations; the timing of governmental approvals and notifications; and the timing of option exercises or increases in scope. In addition, due to these factors, quarterly bookings tend to fluctuate from period to period, particularly on a segment basis. As a result, we believe comparing bookings on a quarterly basis or for periods less than one year is less meaningful than for longer periods and that shorter term changes in bookings may not necessarily indicate a material trend.
Bookings (in millions) | 2016 | 2015 | 2014 | ||||||||
Integrated Defense Systems | $ | 5,389 | $ | 6,389 | $ | 6,174 | |||||
Intelligence, Information and Services | 5,563 | 5,416 | 5,984 | ||||||||
Missile Systems | 7,909 | 8,134 | 6,383 | ||||||||
Space and Airborne Systems | 8,414 | 4,936 | 5,410 | ||||||||
Forcepoint | 561 | 352 | 101 | ||||||||
Total | $ | 27,836 | $ | 25,227 | $ | 24,052 | |||||
Included in bookings were international bookings of $8,194 million, $8,511 million and $8,362 million in 2016, 2015 and 2014, respectively, which included foreign military bookings through the U.S. government. International bookings amounted to 29%, 34% and 35% of total bookings in 2016, 2015 and 2014, respectively. Classified bookings amounted to 20% of total bookings in 2016 and 15% of total bookings in 2015 and 2014.
We record bookings for not-to-exceed contract awards (e.g., undefinitized contract awards, binding letter agreements) based on reasonable estimates of expected contract definitization, which generally will not be less than 75% of the award. We subsequently adjust bookings to reflect the actual amounts definitized or, when prior to definitization, when facts and circumstances indicate that our previously estimated amounts are no longer reasonable. The timing of awards that may cover multiple fiscal years influences the size of bookings in each year. Bookings exclude unexercised contract options and potential orders under ordering-type contracts (e.g., indefinite-delivery, indefinite-quantity (IDIQ) type contracts), and are reduced for contract cancellations and terminations of bookings recognized in the current year. We reflect contract cancellations and terminations from prior year bookings, as well as the impact of changes in foreign exchange rates, directly as an adjustment to backlog in the period in which the cancellation or termination occurs and the impact is determinable.
Backlog—We disclose period-ending backlog for each segment. Backlog represents the dollar value of firm orders for which work has not been performed. Backlog generally increases with bookings and generally converts into sales as we incur costs under the related contractual commitments. Therefore, we discuss changes in backlog, including any individually significant cancellations, for each of our segments, as we believe such discussion provides an understanding of the awarded but not executed portions of our contracts.
49
Funded Backlog | Total Backlog(1) | ||||||||||||||||||||||
Backlog (in millions) at December 31 | 2016 | 2015 | 2014 | 2016 | 2015 | 2014 | |||||||||||||||||
Integrated Defense Systems | $ | 8,438 | $ | 8,961 | $ | 8,257 | $ | 10,224 | $ | 10,629 | $ | 10,362 | |||||||||||
Intelligence, Information and Services | 2,340 | 2,933 | 3,536 | 5,663 | 6,367 | 6,958 | |||||||||||||||||
Missile Systems | 9,008 | 7,998 | 6,992 | 11,617 | 10,885 | 9,269 | |||||||||||||||||
Space and Airborne Systems | 5,286 | 4,692 | 4,259 | 8,819 | 6,309 | 6,930 | |||||||||||||||||
Forcepoint(2) | 532 | 476 | 48 | 532 | 479 | 52 | |||||||||||||||||
Total | $ | 25,604 | $ | 25,060 | $ | 23,092 | $ | 36,855 | $ | 34,669 | $ | 33,571 | |||||||||||
(1) | In 2016, 2015 and 2014 we had backlog adjustments of $1.6 billion, $0.9 billion and $1.3 billion, respectively, primarily related to contract underruns and contract deobligations. The only individually material backlog adjustment in these periods was a backlog adjustment of approximately $450 million for a contract that was terminated for convenience at our SAS segment in 2014. |
(2) | Forcepoint funded and total backlog excludes the unfavorable impact of $45 million, $86 million and less than $1 million at December 31, 2016, December 31, 2015 and December 31, 2014, respectively, related to the acquisition accounting adjustments to record acquired deferred revenue at fair value. |
Total backlog includes funded backlog (firm orders for which funding is authorized, appropriated and contractually obligated by the customer but for which work has not been performed) and unfunded backlog (firm orders for which funding has not been appropriated and/or contractually obligated by the customer and for which work has not been performed). Revenue is generally not recognized on backlog until funded. Backlog excludes unexercised contract options and potential orders under ordering-type contracts (e.g., IDIQ). Both funded and unfunded backlog are affected by changes in foreign exchange rates.
Total Net Sales—We generally express changes in total net sales in terms of volume. Volume generally refers to increases or decreases in revenues related to varying amounts of total operating expenses, which are comprised of cost of sales and general and administrative expenses, which include administrative and selling expenses (including bid and proposal costs) and research and development expenses, incurred on individual contracts (i.e., from performance against contractual commitments on our bookings related to engineering, production or service activity). Therefore, we discuss volume changes attributable principally to individual programs or product lines unless there is a discrete event (e.g., a major contract termination, natural disaster or major labor strike), or some other unusual item that has a material effect on changes in a segment's volume for a reported period. Due to the nature of our contracts, the amount of costs incurred and related revenues will naturally fluctuate over the lives of our contracts. As a result, in any reporting period, the changes in volume on numerous contracts are likely to be due to normal fluctuations in our engineering, production or service activities.
Total net sales by segment were as follows:
Total Net Sales (in millions) | 2016 | 2015 | 2014 | ||||||||
Integrated Defense Systems | $ | 5,476 | $ | 5,847 | $ | 5,600 | |||||
Intelligence, Information and Services | 6,194 | 6,111 | 6,222 | ||||||||
Missile Systems | 7,071 | 6,556 | 6,309 | ||||||||
Space and Airborne Systems | 6,199 | 5,796 | 6,075 | ||||||||
Forcepoint | 566 | 328 | 104 | ||||||||
Eliminations | (1,360 | ) | (1,330 | ) | (1,481 | ) | |||||
Total business segment sales | 24,146 | 23,308 | 22,829 | ||||||||
Acquisition Accounting Adjustments(1) | (77 | ) | (61 | ) | (3 | ) | |||||
Total | $ | 24,069 | $ | 23,247 | $ | 22,826 | |||||
(1) | Acquisition accounting adjustments include the adjustments to record acquired deferred revenue at fair value as part of our purchase price allocation process and the amortization of acquired intangible assets related to historical acquisitions. |
Total Operating Expenses—We generally disclose operating expenses for each segment in terms of the following: 1) cost of sales—labor; 2) cost of sales—materials and subcontractors; and 3) other costs of sales and other operating expenses. Included in cost of sales—labor is the incurred direct labor associated with the performance of contracts in the current period and any applicable overhead and fringe costs. Included in cost of sales—materials and subcontractors is the incurred direct materials, subcontractor costs (which could include effort performed by other Raytheon segments or locations) and applicable overhead allocations in the current period. Included in other cost of sales and other operating expenses is other direct costs not captured in labor or material and subcontractor costs, such as precontract costs previously deferred, costs previously deferred into
50
inventory on contracts using commercial or units of delivery accounting, applicable overhead allocations, general and administrative expenses, which include administrative and selling expenses (including bid and proposal costs) and research and development expenses, other direct costs (such as ancillary services and travel expenses) and adjustments for loss contracts.
Operating Income (and the related operating margin percentage)—We generally express changes in segment operating income in terms of volume, net changes in EAC adjustments or changes in contract mix and other program performance.
The impact of changes in volume on operating income excludes the impact of net EAC adjustments and the impact of changes in contract mix and other program performance and is calculated based on changes in costs on individual programs at an overall margin for the segment.
Changes in net EAC adjustments typically relate to the current period impact of revisions to total estimated revenues and costs at completion. These changes reflect improved or deteriorated operating performance or award fee rates. For a full description of our EAC process, refer to Critical Accounting Estimates. Given that we have thousands of individual contracts and the types and complexity of the assumptions and estimates we must make on an on-going basis, we have both favorable and unfavorable EAC adjustments. We had the following aggregate EAC adjustments for the periods presented:
EAC Adjustments (in millions) | 2016 | 2015 | 2014 | ||||||||
Gross favorable | $ | 879 | $ | 811 | $ | 1,106 | |||||
Gross unfavorable | (478 | ) | (440 | ) | (593 | ) | |||||
Total net EAC adjustments | $ | 401 | $ | 371 | $ | 513 | |||||
In recent years, our net EAC adjustments generally have been between 1.5% and 2.5% of total net sales. For 2016, 2015 and 2014, our net EAC adjustments as a percentage of total net sales were 1.7%, 1.6% and 2.2%, respectively.
Significant EAC adjustments in 2016, 2015 and 2014 are discussed in the Operating Income and Margin section of each business segment's discussion below. The $30 million increase in net EAC adjustments in 2016 compared to 2015 was primarily due to the increase in net EAC adjustments at SAS and IIS, partially offset by the decrease in net EAC adjustments at MS, all of which are described below in the respective segment's results. The $142 million decrease in net EAC adjustments in 2015 compared to 2014 was primarily due to the decrease in net EAC adjustments at SAS as described beginning on page 59.
Changes in contract mix and other program performance refer to changes in operating margin due to a change in the relative volume of contracts with higher or lower fee rates such that the overall average margin rate for the segment changes, and other drivers of program performance including margin rate increases or decreases due to EAC adjustments in prior periods. A higher or lower expected fee rate at the initial award of a contract typically correlates to the contract's risk profile, which is often specifically driven by the type of customer and related procurement regulations, the type of contract (e.g., fixed-price vs. cost-plus), the maturity of the product or service and the scope of work. Changes in contract mix and other performance also include all other items which are not related to volume or EAC adjustments.
Because each segment has thousands of contracts in any reporting period, changes in operating income and margin are likely to be due to normal changes in volume, net EAC adjustments, and contract mix and other performance on many contracts with no single change, or series of related changes, materially driving a segment's change in operating income or operating margin percentage.
51
Operating income by segment was as follows:
Operating Income (in millions) | 2016 | 2015 | 2014 | ||||||||
Integrated Defense Systems | $ | 950 | $ | 864 | $ | 928 | |||||
Intelligence, Information and Services | 467 | 646 | 532 | ||||||||
Missile Systems | 916 | 868 | 801 | ||||||||
Space and Airborne Systems | 817 | 829 | 886 | ||||||||
Forcepoint | 51 | 30 | 11 | ||||||||
Eliminations | (141 | ) | (140 | ) | (149 | ) | |||||
Total business segment operating income | 3,060 | 3,097 | 3,009 | ||||||||
Acquisition Accounting Adjustments | (198 | ) | (168 | ) | (55 | ) | |||||
FAS/CAS Adjustment | 435 | 185 | 286 | ||||||||
Corporate | (57 | ) | (101 | ) | (61 | ) | |||||
Total | $ | 3,240 | $ | 3,013 | $ | 3,179 | |||||
Integrated Defense Systems | |||||||||||||||||
% Change | |||||||||||||||||
(In millions, except percentages) | 2016 | 2015 | 2014 | 2016 compared to 2015 | 2015 compared to 2014 | ||||||||||||
Total net sales | $ | 5,476 | $ | 5,847 | $ | 5,600 | (6.3 | )% | 4.4 | % | |||||||
Total operating expenses | |||||||||||||||||
Cost of sales—labor | 1,967 | 1,895 | 1,880 | 3.8 | % | 0.8 | % | ||||||||||
Cost of sales—materials and subcontractors | 1,849 | 2,164 | 1,867 | (14.6 | )% | 15.9 | % | ||||||||||
Other cost of sales and other operating expenses | 710 | 924 | 925 | (23.2 | )% | (0.1 | )% | ||||||||||
Total operating expenses | 4,526 | 4,983 | 4,672 | (9.2 | )% | 6.7 | % | ||||||||||
Operating income | $ | 950 | $ | 864 | $ | 928 | 10.0 | % | (6.9 | )% | |||||||
Operating margin | 17.3 | % | 14.8 | % | 16.6 | % | |||||||||||
Change in Operating Income (in millions) | Year Ended 2016 Versus Year Ended 2015 | Year Ended 2015 Versus Year Ended 2014 | |||||||||||||||
Volume | $ | (44 | ) | $ | 49 | ||||||||||||
Net change in EAC adjustments | (6 | ) | (20 | ) | |||||||||||||
Mix and other performance | 136 | (93 | ) | ||||||||||||||
Total change in operating income | $ | 86 | $ | (64 | ) | ||||||||||||
% Change | |||||||||||||||||
(In millions, except percentages) | 2016 | 2015 | 2014 | 2016 compared to 2015 | 2015 compared to 2014 | ||||||||||||
Bookings | $ | 5,389 | $ | 6,389 | $ | 6,174 | (15.7 | )% | 3.5 | % | |||||||
Total Backlog | 10,224 | 10,629 | 10,362 | (3.8 | )% | 2.6 | % | ||||||||||
IDS is a leader in integrated air and missile defense; large land- and sea-based radar solutions; command, control, communications, computers, cyber and intelligence solutions; and naval combat and ship electronic systems. IDS delivers combat-proven performance against the complete spectrum of airborne and ballistic missile threats and is a world leader in the technology, development, and production of sensors and mission systems. IDS provides solutions to the U.S. Department of Defense (DoD) and the U.S. Intelligence Community, as well as more than 50 international customers which represent approximately half of IDS’s business.
52
Total Net Sales—The decrease in total net sales of $371 million in 2016 compared to 2015 was primarily due to lower net sales of $134 million on our missile defense radar production programs, $88 million of lower net sales on an international communications program and $70 million of lower net sales on the Air Warfare Destroyer (AWD) program, all due to the scheduled completion of certain production phases on these programs. Included in the change in total net sales are higher net sales of $11 million on integrated air and missile defense programs, including $114 million of higher net sales on an international Patriot program awarded in the first quarter of 2015 due to a scheduled increase in production and $160 million of lower net sales from the scheduled completion of certain production phases on an international air and missile defense systems program.
The increase in net sales of $247 million in 2015 compared to 2014 was primarily due to higher net sales of $385 million from an international Patriot program awarded in the second quarter of 2015 driven by program activity and the recognition of previously deferred precontract costs, $320 million of higher net sales from an international Patriot program awarded in the fourth quarter of 2014, $161 million of higher net sales on the AWD program driven by additional scope awarded in the fourth quarter of 2014 and higher net change in EAC adjustments as discussed below, and $144 million of higher net sales from an international air and missile defense system program awarded in the fourth quarter of 2013 due to scheduled production phases. The higher net sales were partially offset by lower net sales of $510 million from the scheduled completion of certain production phases on various Patriot programs for international customers and $227 million from the scheduled completion of certain production phases on our missile defense radar programs.
Total Operating Expenses—The decrease in total operating expenses of $457 million in 2016 compared to 2015 was primarily due to a decrease in materials and subcontractors costs of $315 million and a decrease in other cost of sales and other operating expenses of $214 million. The decrease in materials and subcontractors costs was primarily due to the activity on the international air and missile defense program and the AWD program described above in Total Net Sales. The decrease in other cost of sales and other operating expenses was principally driven by the tax-free $158 million gain from the sale of our equity method investment in TRS SAS in the second quarter of 2016 as described in Consolidated Results of Operations, and a change in previously deferred precontract costs of $101 million in the second quarter of 2015 related to the international Patriot program awarded in the second quarter of 2015.
The increase in total operating expenses of $311 million in 2015 compared to 2014 was primarily due to an increase in materials and subcontractors costs of $297 million, driven principally by the activity on the international Patriot program awarded in the fourth quarter of 2014 and the international air and missile defense system program awarded in the fourth quarter of 2013 described above in Total Net Sales.
Operating Income and Margin—The increase in operating income of $86 million in 2016 compared to 2015 was primarily due to a change in mix and other performance of $136 million, partially offset by lower volume of $44 million. The change in mix and other performance was driven principally by the tax-free $158 million gain from the sale of our equity method investment in TRS SAS in the second quarter of 2016 as described in Consolidated Results of Operations. Also included in the change in mix and other performance were $9 million of gains on real estate transactions in 2016. The decrease in volume was primarily due to the programs described above in Total Net Sales. Included in the net change in EAC adjustments in 2016 compared to 2015 was a negative profit adjustment of $36 million in the first quarter of 2016 on an international command and control program driven by costs to replace or repair shelters which the subcontractor refused to remedy resulting in the subcontractor being terminated, and net positive profit adjustments of $20 million in the second and fourth quarters of 2015 on the AWD program as discussed below. The increase in operating margin in 2016 compared to 2015 was primarily due to the change in mix and other performance.
The decrease in operating income of $64 million in 2015 compared to 2014 was primarily due to a change in mix and other performance of $93 million, partially offset by an increase in volume of $49 million. The change in mix and other performance was principally driven by lower volume on the various Patriot programs for international customers, partially offset by higher volume on the international Patriot program awarded in the second quarter of 2015, both of which are described above in Total Net Sales. The increase in volume was primarily due to the activity on the programs described above in Total Net Sales. The net change in EAC adjustments in 2015 compared to 2014 was primarily due to net EAC adjustments of approximately $72 million in 2014 driven primarily by the reduction of expected costs to fulfill contractual commitments on nine contracts related to industrial cooperation agreements for an international customer as further discussed below, partially offset by a net increase in EAC adjustments of $59 million on our AWD program primarily driven by the adjustments discussed below. Prior to a contract modification and restructure of the AWD program in the fourth quarter of 2015, our incentives fees were tied directly to both our cost performance and the cost performance of the shipyard. This resulted in an unfavorable EAC adjustment
53
in the second quarter of 2014 of $38 million from a decrease in estimated incentive fees driven by an increase in expected costs by the shipbuilder to complete its portion of the program and a further EAC adjustment in the second quarter of 2015 of $33 million to eliminate all remaining estimated incentive fees due to the shipbuilder further extending the planned schedule and a related increase in costs to complete its portion of the program. The contract modification and restructure of the AWD program in the fourth quarter of 2015 resulted in a change in the incentive fee structure such that almost all of our incentive fees are now tied solely to our performance which resulted in a favorable $53 million EAC adjustment in the fourth quarter of 2015. The decrease in operating margin in 2015 compared to 2014 was primarily due to the change in mix and other performance.
Backlog and Bookings—Backlog was $10,224 million, $10,629 million and $10,362 million at December 31, 2016, 2015 and 2014, respectively. The decrease in backlog of $405 million at December 31, 2016 compared to December 31, 2015 was primarily due to sales in excess of bookings at our Integrated Air and Missile Defense (IAMD) product line. The increase in backlog of $267 million at December 31, 2015 compared to December 31, 2014 was primarily due to the 2015 international Patriot bookings in our IAMD product line described below, partially offset by sales in excess of bookings spread across our other product lines.
The bookings decrease of $1,000 million in 2016 compared to 2015 was driven primarily by the $1,162 million decrease in the specifically disclosed bookings below. In 2016, IDS booked approximately $1.8 billion to provide advanced Patriot air and missile defense capabilities for certain international customers, including $480 million for Kuwait, $163 million for Qatar, and $623 million, $265 million and $226 million for three international customers. IDS also booked $373 million on the Aegis weapon system for the U.S. Navy and international customers, $228 million to provide Consolidated Contractor Logistics Support (CCLS), $227 million to provide Patriot engineering services support for U.S. and international customers, $200 million on the Army Navy/Transportable Radar Surveillance-Model 2 (AN/TPY-2) radar sustainment program for the MDA, $117 million for in-service support for the Collins class submarine for the Royal Australian Navy, $110 million on the Air and Missile Defense Radar (AMDR) program for the U.S. Navy, $92 million for the Engineering and Manufacturing Development phase on the competitively awarded Enterprise Air Surveillance Radar (EASR) program for the U.S. Navy, and $86 million to provide advanced Patriot air and missile defense capability for the U.S. Army. IDS also booked $198 million on a classified program.
Bookings in 2015 were relatively consistent with 2014. In 2015, IDS booked $2.0 billion to provide advanced Patriot air and missile defense capability for the Kingdom of Saudi Arabia and $769 million to provide advanced Patriot air and missile defense capability for the Republic of Korea. IDS also booked $366 million on the Zumwalt-class destroyer program for the U.S. Navy; $266 million to provide Patriot engineering services support for U.S. and international customers; $245 million to provide CCLS and $141 million for a radar sustainment contract for the MDA; $185 million on the Standard Terminal Automation Replacement System (STARS) program; $163 million to continue development on the Air Defense Operations Center (ADOC) for Qatar; $139 million to provide satellite communication ground terminals for an international customer; $110 million for the AWD program for the Australian Navy; $83 million to provide advanced Patriot air and missile defense capability for the U.S. Army; and $83 million to provide training and logistics support for an international customer.
In 2014, IDS booked $2,038 million to provide advanced Patriot air and missile defense capability for Qatar, $587 million to provide advanced Patriot air and missile defense capability for Kuwait, $378 million for the AWD program for the Australian Navy and $375 million on the STARS program for the Federal Aviation Administration (FAA). IDS also booked $284 million to provide Patriot engineering services support for U.S. and international customers, $271 million to provide CCLS for the MDA, $212 million to provide radar digital processors for the Patriot system to the U.S. Army and international customers, $212 million for a radar sustainment contract for the MDA, $160 million to provide Patriot Guidance Enhanced Missile-Tactical (GEM-T) missiles for South Korea, and $94 million to provide Patriot technical and logistics support for Taiwan.
54
Intelligence, Information and Services
% Change | |||||||||||||||||
(In millions, except percentages) | 2016 | 2015 | 2014 | 2016 compared to 2015 | 2015 compared to 2014 | ||||||||||||
Total net sales | $ | 6,194 | $ | 6,111 | $ | 6,222 | 1.4 | % | (1.8 | )% | |||||||
Total operating expenses | |||||||||||||||||
Cost of sales—labor | 2,468 | 2,397 | 2,305 | 3.0 | % | 4.0 | % | ||||||||||
Cost of sales—materials and subcontractors | 2,370 | 2,521 | 2,668 | (6.0 | )% | (5.5 | )% | ||||||||||
Other cost of sales and other operating expenses | 889 | 547 | 717 | 62.5 | % | (23.7 | )% | ||||||||||
Total operating expenses | 5,727 | 5,465 | 5,690 | 4.8 | % | (4.0 | )% | ||||||||||
Operating income | $ | 467 | $ | 646 | $ | 532 | (27.7 | )% | 21.4 | % | |||||||
Operating margin | 7.5 | % | 10.6 | % | 8.6 | % | |||||||||||
Change in Operating Income (in millions) | Year Ended 2016 Versus Year Ended 2015 | Year Ended 2015 Versus Year Ended 2014 | |||||||||||||||
Volume | $ | 4 | $ | (21 | ) | ||||||||||||
Net change in EAC adjustments | 17 | (32 | ) | ||||||||||||||
Mix and other performance | (200 | ) | 167 | ||||||||||||||
Total change in operating income | $ | (179 | ) | $ | 114 | ||||||||||||
% Change | |||||||||||||||||
(In millions, except percentages) | 2016 | 2015 | 2014 | 2016 compared to 2015 | 2015 compared to 2014 | ||||||||||||
Bookings | $ | 5,563 | $ | 5,416 | $ | 5,984 | 2.7 | % | (9.5 | )% | |||||||
Total Backlog | 5,663 | 6,367 | 6,958 | (11.1 | )% | (8.5 | )% | ||||||||||
IIS provides a full range of technical and professional services to intelligence, defense, federal and commercial customers worldwide. IIS specializes in global Intelligence, Surveillance and Reconnaissance (ISR); navigation; DoD space and weather solutions; cybersecurity; analytics; training; logistics; mission support; engineering; automation and sustainment solutions; and international and domestic Air Traffic Management (ATM) systems. Key customers include the U.S. Intelligence Community, the U.S. Armed Forces, the Federal Aviation Administration (FAA), the National Oceanic and Atmospheric Administration (NOAA), the Department of Homeland Security (DHS), the National Aeronautics and Space Administration (NASA) and an increasing number of international customers.
Total Net Sales—Total net sales in 2016 were relatively consistent with 2015. Included in the change in net sales was higher net sales of $137 million on various cybersecurity and special missions programs due to a continued focus on cyber capabilities resulting in expansion with key customers, higher net sales of $91 million on a U.S. Air Force program due to increased effort to achieve the current schedule milestones, lower net sales of $74 million on the Joint Polar Satellite System (JPSS) Common Ground System (CGS) for NASA due to the program transitioning from the development phase to the test phase and lower net sales of $68 million on training activities on the Air Traffic Control Optimum Training Solution (ATCOTS) contract for the FAA, which ended in 2015.
The decrease in total net sales of $111 million in 2015 compared to 2014 was primarily due to lower net sales of $129 million on training programs supporting the U.S. Army's Warfighter Field Operations Customer Support (FOCUS) activities due to a decrease in customer-determined activity levels and lower net sales of $122 million on a classified program for an international customer, partially offset by higher net sales of $132 million on cybersecurity and special missions programs excluding a classified program for an international customer, primarily driven by the fourth quarter of 2014 acquisition of Raytheon Blackbird Technologies (RBT).
55
Total Operating Expenses—The increase in total operating expenses of $262 million in 2016 compared to 2015 was primarily due to an increase in other cost of sales and other operating expenses of $342 million, partially offset by a decrease in materials and subcontractors costs of $151 million. The increase in other cost of sales and other operating expenses was driven principally by the $181 million impact from the eBorders settlement in the first quarter of 2015 as described in Consolidated Results of Operations and activity on a classified program for an international customer due to completed milestones in the third quarter of 2016. The decrease in materials and subcontractors costs was driven principally by various classified programs.
The decrease in total operating expenses of $225 million in 2015 compared to 2014 was primarily due to a decrease in other cost of sales and other operating expenses of $170 million and a decrease in materials and subcontractors costs of $147 million. The decrease in other cost of sales and other operating expenses was driven principally by the $181 million impact from the eBorders settlement in the first quarter of 2015 as described in Consolidated Results of Operations. The decrease in materials and subcontractors costs was driven principally by the activity on the training programs supporting the U.S. Army's Warfighter FOCUS activities and the classified program for an international customer described above in Total Net Sales.
Operating Income and Margin—The decrease in operating income of $179 million and the related decrease in operating margin in 2016 compared to 2015 was primarily due to a change in mix and other performance of $200 million, partially offset by a net change in EAC adjustments of $17 million. The change in mix and other performance was principally driven by the $181 million impact from the eBorders settlement in the first quarter of 2015 as described in Consolidated Results of Operations. Included in mix and other performance in 2016 was a $3 million net gain related to the termination and expected cost recovery of a pension plan for one of our joint ventures and a $2 million gain on a real estate transaction. The net change in EAC adjustments was primarily due to a $37 million net change in EAC adjustments for the classified program for an international customer, due to higher than expected costs in 2015, partially offset by a $17 million net change in EAC adjustments due to higher design and material costs on a munition release capability program for the U.S. Air Force.
The increase in operating income of $114 million and the related increase in operating margin in 2015 compared to 2014 was primarily due to a change in mix and other performance of $167 million, principally driven by the $181 million impact from the eBorders settlement, partially offset by a net change in EAC adjustment of $32 million. The net change in EAC adjustments was primarily due to a $44 million net change in EAC adjustments for the classified program for an international customer described above in Total Net Sales, driven principally by higher than expected costs. The remaining change in EAC adjustments in 2015 compared to the 2014 was spread across numerous programs with no individual or common significant driver.
Backlog and Bookings—Backlog was $5,663 million, $6,367 million and $6,958 million at December 31, 2016, 2015 and 2014, respectively. The decrease in backlog of $704 million or 11% at December 31, 2016 compared to December 31, 2015 was primarily due to $729 million of backlog adjustments from contract underruns and contract deobligations. In 2015 we had $519 million of backlog adjustments from contract underruns and contract deobligations. The decrease in backlog of $591 million at December 31, 2015 compared to December 31, 2014 was primarily due to sales in excess of bookings, driven principally by the Global Positioning System Next Generation Operational Control System (GPS-OCX) program and the JPSS program for NASA.
Bookings in 2016 were relatively consistent with 2015. In 2016, IIS booked $744 million on domestic training programs and $283 million on foreign training programs in support of Warfighter FOCUS activities, $269 million on the Joint Precision Approach and Landing System (JPALS) program for the U.S. Navy program, $170 million to provide a common ground station for unmanned vehicles for the U.S. Air Force, and $105 million to provide ISR support for the U.S. Air Force. IIS also booked $310 million for a U.S. Air Force program and $1,891 million on a number of classified contracts
The bookings decrease of $568 million in 2015 compared to 2014 was driven primarily by the $695 million decrease in the specifically disclosed bookings below. In 2015, IIS booked $703 million on domestic training programs and $260 million on foreign training programs in support of Warfighter FOCUS activities, $105 million on a contract to support the U.S. Air Force’s Distributed Common Ground System (DCGS), $103 million on the Wide Area Augmentation System (WAAS) program and $78 million on the NextGen Weather Processor (NWP) program for the FAA, $98 million to provide development and sustainment support for the National Cybersecurity Protection System for the DHS, a contract that was subsequently protested in the fourth quarter of 2015 and terminated for convenience in the third quarter of 2016 for administrative reasons, and $78 million to continue supporting the Counter Narcoterrorism Technology Program Office (CNTPO). IIS also booked $1,953 million on a number of classified contracts.
56
In 2014, IIS booked $511 million for a U.S. Air Force program; $174 million on a contract to provide ISR support to the U.S. Air Force, $161 million on a program to provide operations and maintenance services on an international radar system, $130 million on the All Electronic Tolling System (AETS) for the Massachusetts Department of Transportation (MassDOT), $127 million on the JPSS program for NASA and $105 million on the WAAS Dual Frequency Operations program for the FAA. IIS also booked $768 million on domestic training programs and $263 million on foreign training programs in support of Warfighter FOCUS activities, and $1,834 million on a number of classified contracts, including a $260 million award for international cyber.
Missile Systems
% Change | |||||||||||||||||
(In millions, except percentages) | 2016 | 2015 | 2014 | 2016 compared to 2015 | 2015 compared to 2014 | ||||||||||||
Total net sales | $ | 7,071 | $ | 6,556 | $ | 6,309 | 7.9 | % | 3.9 | % | |||||||
Total operating expenses | |||||||||||||||||
Cost of sales—labor | 2,101 | 1,980 | 1,934 | 6.1 | % | 2.4 | % | ||||||||||
Cost of sales—materials and subcontractors | 2,928 | 2,739 | 2,640 | 6.9 | % | 3.8 | % | ||||||||||
Other cost of sales and other operating expenses | 1,126 | 969 | 934 | 16.2 | % | 3.7 | % | ||||||||||
Total operating expenses | 6,155 | 5,688 | 5,508 | 8.2 | % | 3.3 | % | ||||||||||
Operating income | $ | 916 | $ | 868 | $ | 801 | 5.5 | % | 8.4 | % | |||||||
Operating margin | 13.0 | % | 13.2 | % | 12.7 | % | |||||||||||
Change in Operating Income (in millions) | Year Ended 2016 Versus Year Ended 2015 | Year Ended 2015 Versus Year Ended 2014 | |||||||||||||||
Volume | $ | 61 | $ | 21 | |||||||||||||
Net change in EAC adjustments | (63 | ) | 12 | ||||||||||||||
Mix and other performance | 50 | 34 | |||||||||||||||
Total change in operating income | $ | 48 | $ | 67 | |||||||||||||
% Change | |||||||||||||||||
(In millions, except percentages) | 2016 | 2015 | 2014 | 2016 compared to 2015 | 2015 compared to 2014 | ||||||||||||
Bookings | $ | 7,909 | $ | 8,134 | $ | 6,383 | (2.8 | )% | 27.4 | % | |||||||
Total Backlog | 11,617 | 10,885 | 9,269 | 6.7 | % | 17.4 | % | ||||||||||
MS is a premier developer, integrator and producer of missile and combat systems for the armed forces of the U.S. and allied nations. Leveraging its capabilities in advanced airframes, guidance and navigation systems, high-resolution sensors, surveillance, targeting and netted systems, MS develops and supports a broad range of advanced weapon systems, including missiles, smart munitions, close-in weapon systems, projectiles, kinetic kill vehicles, directed energy effectors and advanced combat sensor solutions. Key customers include the U.S. Navy, Army, Air Force and Marine Corps, the MDA and the armed forces of more than 40 allied nations.
Total Net Sales—The increase in total net sales of $515 million in 2016 compared to 2015 was primarily due to $419 million of higher net sales on the Paveway program principally driven by international requirements.
The increase in total net sales of $247 million in 2015 compared to 2014 was primarily due to $98 million of higher net sales on the Paveway program principally driven by international requirements, $97 million of higher net sales on the Tube-launched, Optically-tracked, Wireless-guided (TOW) missile program primarily due to planned increases in production, and $90 million of higher net sales on certain air and missile defense programs primarily due to a contract awarded in the third quarter of 2015, partially offset by $120 million of lower net sales on the Standard Missile-3 (SM-3) program primarily due to the planned transition from development to production.
57
Total Operating Expenses—The increase in total operating expenses of $467 million in 2016 compared to 2015 was primarily due to an increase in materials and subcontractors costs of $189 million, an increase in other cost of sales and other operating expenses of $157 million and an increase in labor costs of $121 million. The increase in materials and subcontractors costs was driven principally by activity on the Paveway program described above in Total Net Sales. The increase in other cost of sales and other operating expenses was principally driven by a change in previously deferred precontract costs based on contract awards or funding. The increase in labor costs was principally driven by development activity on an advanced interceptors program and a ship defense missile program.
The increase in total operating expenses of $180 million in 2015 compared to 2014 was primarily due to an increase in materials and subcontractors costs of $99 million driven principally by the activity on the TOW program described above in Total Net Sales and activity on the Phalanx program driven by planned increases in production, partially offset by activity on the SM-3 program described above in Total Net Sales. Included in the change in other cost of sales and other operating expenses was an increase in research and development expenses of $79 million principally related to advanced capabilities.
Operating Income and Margin—The increase in operating income of $48 million in 2016 compared to 2015 was primarily due to an increase in volume of $61 million and a change in mix and other performance of $50 million, partially offset by a net change in EAC adjustments of $63 million. The increase in volume was principally driven by activity on the Paveway program as described above in Total Net Sales. The change in mix and other performance was driven principally by activity on the Paveway program as described above in Total Net Sales, with the remaining change in mix and other performance spread across numerous programs with no individual or common significant driver. The net change in EAC adjustments was primarily driven by a $48 million unfavorable change on two next generation precision strike weapon contracts due to increases in expected costs to complete the programs, a $38 million unfavorable change on a missile defense interceptor program driven primarily by a decrease in estimated incentive fees due to re-phasing incentive events in the first quarter of 2016 and an increase in expected cost to complete the program, and a $25 million favorable resolution of a contractual issue in the first quarter of 2015, partially offset by a $68 million favorable change on the Paveway program driven by lower labor and material production costs as well as improved estimated costs to fulfill other contractual requirements. The decrease in operating margin in 2016 compared to 2015 was primarily due to the net change in EAC adjustments, partially offset by the change in mix and other performance.
The increase in operating income of $67 million in 2015 compared to 2014 was primarily due to a change in mix and other performance of $34 million and an increase in volume of $21 million. The change in mix and other performance was driven principally by higher volume on the Paveway program described above in Total Net Sales, with the remaining change spread across numerous programs with no individual or common significant driver. The increase in volume was driven principally by the programs described above in Total Net Sales. Included in the net change in EAC adjustments was a $25 million favorable resolution of a contractual issue in the first quarter of 2015. The increase in operating margin in 2015 compared to 2014 was primarily due to the change in mix and other performance and the net change in EAC adjustments.
Backlog and Bookings—Backlog was $11,617 million, $10,885 million and $9,269 million at December 31, 2016, 2015 and 2014, respectively. The increase in backlog of $732 million or 7% at December 31, 2016 compared to December 31, 2015 was primarily due to bookings in excess of sales, primarily within the Advanced Missile Systems product line. The increase in backlog of $1,616 million at December 31, 2015 compared to December 31, 2014 was primarily due to bookings in excess of sales, primarily within the Air Warfare Systems product line.
Bookings in 2016 were relatively consistent with 2015. In 2016, MS booked $941 million for Paveway for the U.S. Air Force and international customers, $937 million for SM-3 for the MDA and international customers, $799 million for Advanced Medium-Range Air-to-Air Missiles (AMRAAM) for the U.S. Air Force, U.S. Navy and international customers, $554 million for Phalanx weapon systems for the U.S Navy and international customers, $416 million for Standard Missile-6 (SM-6) for the U.S. Navy, $384 million for AIM-9X Sidewinder short-range air-to-air missiles for the U.S. Navy, U.S. Air Force, U.S. Army and international customers, $367 million for Tomahawk for the U.S. Navy and international customers, $325 million for Rolling Airframe Missile (RAM) for the U.S. Navy and international customers, $321 million for Evolved SeaSparrow Missile (ESSM) for the U.S. Navy and international customers, $276 million for TOW missiles for the U.S. Army, U.S. Marine Corps and international customers, $243 million for Miniature Air Launched Decoy (MALD) for the U.S. Air Force and Navy, $223 million for Stinger for the U.S. Army and international customers, $195 million for Woomera Mobile Range Upgrade program for the Royal Australian Air Force, $175 million for Hypersonic Air-breathing Weapon Concept program for the
58
Defense Advanced Research Projects Agency (DARPA) and U.S. Air Force and $130 million for the David's Sling weapon system's Stunner Missile for an international customer.
The bookings increase of $1,751 million in 2015 compared to 2014 was driven primarily by the $1,346 million increase in the specifically disclosed bookings below. In 2015, MS booked $1,726 million for Paveway for the U.S. Air Force and international customers, $1,202 million for SM-3 for the MDA and an international customer, $637 million for AMRAAM for the U.S. Air Force, U.S. Navy and international customers, $623 million on ESSM for the U.S. Navy and international customers, $579 million for AIM-9X Sidewinder short-range air-to-air missiles for the U.S. Armed Forces and international customers, $310 million for Phalanx weapon systems for the U.S. Navy, U.S. Army and international customers, $273 million for SM-6 for the U.S. Navy, $267 million for Tomahawk for the U.S. Navy and an international customer, $235 million for the Joint Standoff Weapon (JSOW) for the U.S. Navy, and international customers, $169 million for RAM for the U.S. Navy and international customers, $152 million for the production of Stinger for the U.S. Army and international customers, $148 million for the production of Exoatmospheric Kill Vehicle (EKV) contract for the MDA, $110 million for MALD for the U.S. Air Force and Navy, $108 million for the production of the Light Armored Vehicle-Anti-Tank (LAV-AT) for the U.S. Marines, and $104 million for production of Javelin missiles for the U.S. Army and international customers. MS also booked $158 million on a classified program.
In 2014, MS booked $893 million for TOW missiles for the U.S. Army, U.S. Marines and international customers, $706 million for AMRAAM for the U.S. Air Force, U.S. Navy and international customers, $634 million for SM-3 for the MDA, $510 million for Phalanx weapon systems for the U.S. Navy, U.S. Army and international customers, $359 million for AIM-9X Sidewinder short range air-to-air missiles for the U.S. Navy, U.S. Air Force and international customers, $321 million for Paveway for the U.S. Air Force, and international customers, $316 million for Tomahawk for the U.S. Navy and international customers, $307 million for SM-6 for the U.S. Navy, $216 million for the production of EKV contract for the MDA, $211 million for the production of ESSM for the U.S. Navy and international customers, $150 million for Maverick missiles for the U.S. Air Force, U.S. Navy and international customers, $149 million for the Iron Dome Tamir Co-Production program for an international customer, $123 million for RAM for the U.S. Navy and international customers, $119 million for production of Javelin missiles for the U.S. Army, $117 million for Laser Guided Rockets for an international customer, $104 million for MALD for the U.S. Air Force, $80 million for the Excalibur program for the U.S. Army, and $140 million on a classified program.
Space and Airborne Systems
% Change | |||||||||||||||||
(In millions, except percentages) | 2016 | 2015 | 2014 | 2016 compared to 2015 | 2015 compared to 2014 | ||||||||||||
Total net sales | $ | 6,199 | $ | 5,796 | $ | 6,075 | 7.0 | % | (4.6 | )% | |||||||
Total operating expenses | |||||||||||||||||
Cost of sales—labor | 2,422 | 2,482 | 2,478 | (2.4 | )% | 0.2 | % | ||||||||||
Cost of sales—materials and subcontractors | 1,949 | 1,455 | 1,629 | 34.0 | % | (10.7 | )% | ||||||||||
Other cost of sales and other operating expenses | 1,011 | 1,030 | 1,082 | (1.8 | )% | (4.8 | )% | ||||||||||
Total operating expenses | 5,382 | 4,967 | 5,189 | 8.4 | % | (4.3 | )% | ||||||||||
Operating income | $ | 817 | $ | 829 | $ | 886 | (1.4 | )% | (6.4 | )% | |||||||
Operating margin | 13.2 | % | 14.3 | % | 14.6 | % | |||||||||||
59
Change in Operating Income (in millions) | Year Ended 2016 Versus Year Ended 2015 | Year Ended 2015 Versus Year Ended 2014 | |||||||||||||||
Volume | $ | 59 | $ | (33 | ) | ||||||||||||
Net change in EAC adjustments | 73 | (93 | ) | ||||||||||||||
Mix and other performance | (144 | ) | 69 | ||||||||||||||
Total change in operating income | $ | (12 | ) | $ | (57 | ) | |||||||||||
% Change | |||||||||||||||||
(In millions, except percentages) | 2016 | 2015 | 2014 | 2016 compared to 2015 | 2015 compared to 2014 | ||||||||||||
Bookings | $ | 8,414 | $ | 4,936 | $ | 5,410 | 70.5 | % | (8.8 | )% | |||||||
Total Backlog | 8,819 | 6,309 | 6,930 | 39.8 | % | (9.0 | )% | ||||||||||
SAS is a leader in the design, development and manufacture of integrated sensor and communication systems for advanced missions. These missions include intelligence, surveillance and reconnaissance; precision engagement; manned and unmanned aerial operations; and space. Leveraging state-of-the-art technologies, mission systems and domain knowledge, SAS designs, manufactures, supports and sustains civil and military applications of electro-optical/infrared (EO/IR) sensors; airborne radars for surveillance and fire control applications; lasers; precision guidance systems; signals intelligence systems; processors; electronic warfare systems; and communication and space-qualified systems. The U.S. Navy, Air Force, and Army, classified and international allies are key customers.
Total Net Sales—The increase in total net sales of $403 million in 2016 compared to 2015 was primarily due to higher net sales of $339 million on classified programs, including an international classified program awarded in the first quarter of 2016.
Total net sales decreased $279 million in 2015 compared to 2014. Included in the change in total net sales was lower net sales of $111 million primarily due to reduced schedule requirements on international tactical radar systems programs, lower intersegment sales of $65 million driven by lower volume on contracts supporting radar programs, and higher net sales of $279 million on classified programs. The remaining change in total net sales was spread across numerous programs with no individual or common significant driver.
Total Operating Expenses—The increase in total operating expenses of $415 million in 2016 compared to 2015 was primarily due to an increase in materials and subcontractors costs of $494 million, principally driven by activity on the classified programs described above in Total Net Sales. In 2016, we eliminated intra-segment charging between SAS product lines for work performed on other SAS product lines’ contracts. Operating expense amounts for 2015 have been retroactively reclassified to reflect these changes resulting in a $246 million and $123 million increase in labor costs and other cost of sales and other operating expenses, respectively, and a corresponding $369 million decrease in materials and subcontractors costs.
The decrease in total operating expenses of $222 million in 2015 compared to 2014 was primarily due to a decrease in materials and subcontractors costs of $174 million. The decrease in material and subcontractors costs was driven principally by activity on intersegment contracts supporting radar programs, activity on tactical communications networks and radio production programs and activity on the international tactical radar programs described above in Total Net Sales, partially offset by activity on the classified programs described above in Total Net Sales. The remaining change in materials and subcontractors costs was spread across numerous programs with no individual or common significant driver. In 2016, we eliminated intra-segment charging between SAS product lines for work performed on other SAS product lines’ contracts. Operating expense amounts for 2014 have been retroactively reclassified to reflect these changes resulting in a $257 million and $121 million increase in labor costs and other cost of sales and other operating expenses, respectively, and a corresponding $378 million decrease in materials and subcontractors costs.
Operating Income and Margin—Operating income in 2016 was relatively consistent with 2015. The change in mix and other performance of $144 million was primarily driven by lower activity due to scheduled completion of certain production phases on two international tactical radar systems programs and activity on the international classified program described above in
60
Total Net Sales. Also included in mix and other performance was an $11 million gain on a real estate transaction in the second quarter of 2015. The net change in EAC of $73 million adjustments was principally driven by labor and material production efficiencies on tactical radar systems programs which amounted to $30 million, and improved program performance on domestic classified programs. The increase in volume of $59 million was primarily driven by the international classified program described above in Total Net Sales. The decrease in operating margin in 2016 compared to 2015 was primarily due to the change in mix and other performance, partially offset by the net change in EAC adjustments.
The decrease in operating income of $57 million in 2015 compared to 2014 was primarily due to a net change in EAC adjustments of $93 million and decreased volume of $33 million, partially offset by a change in mix and other performance of $69 million. The net change in EAC adjustments was principally driven by labor and material production efficiencies throughout 2014 on two international tactical radar systems programs which amounted to $58 million, with the remainder of the change driven by efficiencies on certain classified programs in 2014. The decrease in volume was spread across numerous programs with no individual or common significant driver. The change in mix and other performance was primarily driven by international F-15 Radar programs. Also included in mix and other performance was an $11 million gain on a real estate transaction in the second quarter of 2015. The decrease in operating margin in 2015 compared to 2014 was primarily due to the net change in EAC adjustments, partially offset by the change in mix and other performance.
Backlog and Bookings—Backlog was $8,819 million, $6,309 million and $6,930 million at December 31, 2016, 2015 and 2014, respectively. The increase in backlog of $2,510 million or 40% at December 31, 2016 compared to December 31, 2015 was primarily due to bookings in excess of sales, principally within our Electronic Warfare Systems (EWS) and Space Systems product lines. The decrease in backlog of $621 million at December 31, 2015 compared to December 31, 2014 was primarily due sales in excess of bookings, principally within our ISRS and Tactical Airborne Systems (TAS) product lines.
The bookings increase of $3,478 million in 2016 compared to 2015 was driven primarily by the $3,478 million increase in the specifically disclosed bookings below. In 2016, SAS booked $992 million on the Next Generation Jammer (NGJ) program for the U.S. Navy, over $650 million on an international classified program, $553 million on the JPSS program for NASA, $610 million on active electronically scanned array (AESA) production awards for the U.S. Air Force and international customers, $164 million to provide integrated Sentinel support services for the U.K. Royal Air Force, $91 million on the next-generation Multi-Spectral Targeting System (MTS) for the U.S. Air Force, $87 million to provide radar components, and $75 million on a cryptographic modernization program. SAS also booked $2,283 million on a number of classified contracts, including $590 million for a major classified contract.
The bookings decrease of $474 million in 2015 compared to 2014 was driven primarily by lower bookings in our ISRS and TAS product lines, partially offset by higher bookings in our EWS product line. In 2015, SAS booked $153 million on a multi-mission radar program for the U.S. Navy and an international customer, $106 million for the production of AESA radars for the U.S. Air Force, $102 million on the Navy Multiband Terminal (NMT) program, $99 million on an AESA radar Performance Based Logistics (PBL) contract for an international customer, $92 million to provide radar spares for an international customer, $92 million for the production of AESA radars for an international customer, $88 million to provide radar components for the U.S. Air Force, and $82 million to provide communication subsystems for the U.S. Navy and an international customer. SAS also booked $1,213 million on a number of classified contracts.
In 2014, SAS booked $267 million to provide radar subsystems for the U.S. Navy, $197 million to provide radar components for an international customer, $105 million for Advanced Targeting Forward Looking Infrared (ATFLIR) pods and spares for the U.S. Navy and international customers, $92 million on an optical sensor satellite program for a commercial customer, $81 million for software enhancements for the AESA radars for the U.S. Air Force, and $76 million on the NMT program. SAS also booked $1,320 million on a number of classified contracts.
61
Forcepoint | ||||||||||||||||
% Change | ||||||||||||||||
(In millions, except percentages) | 2016 | 2015 | 2014 | 2016 compared to 2015 | 2015 compared to 2014 | |||||||||||
Total net sales | $ | 566 | $ | 328 | $ | 104 | 72.6 | % | NM | |||||||
Total operating expenses | ||||||||||||||||
Cost of sales | 110 | 62 | 24 | 77.4 | % | NM | ||||||||||
Selling and marketing | 206 | 109 | 19 | 89.0 | % | NM | ||||||||||
Research and development | 128 | 87 | 35 | 47.1 | % | NM | ||||||||||
General and administrative | 71 | 40 | 15 | 77.5 | % | NM | ||||||||||
Total operating expenses | 515 | 298 | 93 | 72.8 | % | NM | ||||||||||
Operating income (loss) | $ | 51 | $ | 30 | $ | 11 | 70.0 | % | NM | |||||||
Operating margin | 9.0 | % | 9.1 | % | 10.6 | % | ||||||||||
NM = Not meaningful | ||||||||||||||||
% Change | ||||||||||||||||
(In millions, except percentages) | 2016 | 2015 | 2014 | 2016 compared to 2015 | 2015 compared to 2014 | |||||||||||
Bookings | $ | 561 | $ | 352 | $ | 101 | 59.4 | % | NM | |||||||
Total Backlog | 532 | 479 | 52 | 11.1 | % | NM | ||||||||||
NM = Not meaningful | ||||||||||||||||
Forcepoint develops cybersecurity products serving commercial and government organizations worldwide. Forcepoint is a joint venture of Raytheon and Vista Equity Partners created in May 2015 that brought together the capabilities of the legacy Raytheon Cyber Products (RCP) and Websense, Inc. (Websense) businesses. Forcepoint delivers a portfolio of cybersecurity capabilities, including insider threat solutions; data loss prevention; next-generation firewall technology; cloud and on premise web and email security; and cross domain transfer products. The Forcepoint results reflect RCP results for all periods and Websense results after the acquisition date of May 29, 2015.
Total Net Sales—The increase in total net sales of $238 million in 2016 compared to 2015 was primarily due to $214 million of higher sales resulting from the acquisitions of Websense in the second quarter of 2015 and Stonesoft in the first quarter of 2016. Total net sales excluded the unfavorable impact related to the deferred revenue acquisition accounting adjustments described below in Acquisition Accounting Adjustments.
The increase in total net sales of $224 million in 2015 compared to 2014 was primarily due to $221 million of higher sales resulting from the acquisition of Websense. Total net sales excluded the unfavorable impact related to the deferred revenue acquisition accounting adjustments described below in Acquisition Accounting Adjustments.
Total Operating Expenses—We disclose our operating expenses for the segment, which excludes amortization of acquired intangible assets and certain other acquisition and acquisition related expenses, in terms of the following:
• | Cost of sales—labor and overhead costs associated with analytic and technical support services; infrastructure costs associated with maintaining our databases; and labor, materials and overhead costs associated with providing our product offerings. |
• | Selling and marketing—labor costs related to personnel engaged in selling and marketing and customer support functions; costs related to public relations, advertising, promotions and travel; and related overhead costs. |
• | Research and development—labor costs for the development and management of new and existing products; and related overhead costs. |
• | General and administrative expenses—labor costs for our executive, finance and administrative personnel; third party professional service fees; and related overhead costs. |
62
Total operating expenses in 2016 increased $217 million compared to 2015. The increase in all of the categories of total operating expenses was primarily due to the acquisitions of Websense in the second quarter of 2015 and Stonesoft in the first quarter of 2016. The increase in selling and marketing expense was also driven by an increase in commission expense due to higher bookings. Research and development expense in 2015 included $6 million related to severance and retention associated with the restructuring of Websense. Total operating expenses excluded amortization of acquired intangible assets as described below in Acquisition Accounting Adjustments.
Total operating expenses in 2015 increased $205 million compared to 2014. The increase in all of the categories of total operating expenses was primarily due to the acquisition of Websense. In addition, the increase in total operating expenses included $20 million of additional research and development and selling and marketing expenses for the development and launch of new commercial products. Research and development expense in 2015 also included $6 million related to severance and retention associated with the restructuring of Websense. Total operating expenses excluded amortization of acquired intangible assets as described below in Acquisition Accounting Adjustments and $26 million of other acquisition and acquisition related costs in 2015 as described below in Corporate.
Operating Income and Margin—The increase in operating income of $21 million in 2016 compared to 2015 was primarily due to the acquisitions of Websense in the second quarter of 2015 and Stonesoft in the first quarter of 2016. Operating income excludes the acquisition accounting adjustments described below in Acquisition Accounting Adjustments. Operating margin in 2016 was relatively consistent with 2015.
The increase in operating income of $19 million in 2015 compared to 2014 was primarily due to an additional $30 million of income resulting from the acquisition of Websense, partially offset by the additional research and development and sales and marketing expenses for the development and launch of new commercial products. Operating income excludes the acquisition accounting adjustments described below in Acquisition Accounting Adjustments and certain other acquisition and acquisition related costs described below in Corporate. The decrease in operating margin in 2015 compared to 2014 was primarily due to the increased research and development expenses described above in Total Operating Expenses.
Backlog and Bookings—Backlog was $532 million, $479 million and $52 million at December 31, 2016, 2015 and 2014, respectively. The increase in backlog of $53 million at December 31, 2016 compared to December 31, 2015 was primarily due to the acquisitions of Websense and Stonesoft. The increase in backlog of $427 million at December 31, 2015 compared to December 31, 2014 was primarily due to the acquisition of Websense.
Bookings increased by $209 million in 2016 compared to 2015 primarily due to the acquisitions of Websense and Stonesoft. Bookings increased by $251 million in 2015 compared to 2014 primarily due to the acquisition of Websense.
Acquisition Accounting Adjustments
Acquisition Accounting Adjustments include the adjustments to record acquired deferred revenue at fair value as part of our purchase price allocation process, referred to as the deferred revenue adjustment, and the amortization of acquired intangible assets related to historical acquisitions. These adjustments are not considered part of management's evaluation of segment results.
The components of Acquisition Accounting Adjustments were as follows:
(In millions) | 2016 | 2015 | 2014 | ||||||||
Deferred revenue adjustment | $ | (77 | ) | $ | (61 | ) | $ | (3 | ) | ||
Amortization of acquired intangibles | (121 | ) | (107 | ) | (52 | ) | |||||
Total Acquisition Accounting Adjustments | $ | (198 | ) | $ | (168 | ) | $ | (55 | ) | ||
The deferred revenue adjustment for 2016 and 2015 relates to the Forcepoint segment. The deferred revenue adjustment for 2014 relates to the SAS segment.
63
Amortization of acquired intangibles by segment was as follows:
(In millions) | 2016 | 2015 | 2014 | ||||||||
Integrated Defense Systems | $ | 1 | $ | 1 | $ | 2 | |||||
Intelligence, Information and Services | 17 | 12 | 6 | ||||||||
Missile Systems | 1 | 1 | 1 | ||||||||
Space and Airborne Systems | 17 | 35 | 37 | ||||||||
Forcepoint | 85 | 58 | 6 | ||||||||
Total | $ | 121 | $ | 107 | $ | 52 | |||||
The change in our Acquisition Accounting Adjustments of $30 million in 2016 compared to 2015 was due to a $16 million increase in the deferred revenue adjustment, principally driven by the acquisition of Stonesoft in the first quarter of 2016 and a $14 million increase in the intangibles amortization adjustment, principally driven by the acquisition of Websense in the second quarter of 2015, partially offset by the acquisition of Applied Signal Technology, Inc. at our SAS segment in the first quarter of 2011.
The change in our Acquisition Accounting Adjustments of $113 million in 2015 compared to 2014 was due to a $58 million increase in the deferred revenue adjustment and a $55 million increase in the intangibles amortization adjustment, both of which were primarily driven by the acquisition of Websense.
FAS/CAS Adjustment
The FAS/CAS Adjustment represents the difference between our pension and PRB expense or income under FAS requirements under U.S. GAAP and our pension and PRB expense under CAS. The results of each segment only include pension and PRB expense under CAS that we generally recover through the pricing of our products and services to the U.S. government.
The components of the FAS/CAS Adjustment were as follows:
(In millions) | 2016 | 2015 | 2014 | ||||||||
FAS/CAS Pension Adjustment | $ | 435 | $ | 182 | $ | 281 | |||||
FAS/CAS PRB Adjustment | — | 3 | 5 | ||||||||
FAS/CAS Adjustment | $ | 435 | $ | 185 | $ | 286 | |||||
The components of the FAS/CAS Pension Adjustment were as follows:
(In millions) | 2016 | 2015 | 2014 | ||||||||
FAS (expense) | $ | (1,073 | ) | $ | (1,186 | ) | $ | (895 | ) | ||
CAS expense | 1,508 | 1,368 | 1,176 | ||||||||
FAS/CAS Pension Adjustment | $ | 435 | $ | 182 | $ | 281 | |||||
The key drivers of the difference between FAS and CAS expense (and consequently, the FAS/CAS Pension Adjustment) are the pattern of earnings and expense recognition for gains and losses that arise when our asset and liability experience differs from our assumptions under each set of requirements and the calculation of funded status under CAS Harmonization. In accordance with both FAS and CAS, a “calculated market-related value” of our plan assets is used to calculate the amount of deferred asset gains or losses to be amortized. The market-related value of assets is determined using actual asset gains or losses over a certain prior period (three years for FAS and five years for CAS, subject to certain limitations under CAS on the difference between the market-related value and actual market value of assets). Generally, gains or losses are amortized under FAS over the average future working lifetime of the eligible employee population of approximately 9 years. Beginning in 2013, CAS Harmonization reduced this amortization period from 15 to 10 years, as well as changed the liability measurement method. Another driver of CAS expense (but not FAS expense) is the funded status of our pension plans under CAS. CAS expense is only recognized for plans that are not fully funded; consequently, if plans become or cease to be fully funded under CAS due to our asset or liability experience, our CAS expense will change accordingly.
The change in our FAS/CAS Pension Adjustment of $253 million in 2016 compared to 2015 was driven by a $140 million increase in our CAS expense and a $113 million decrease in our FAS expense. The increase in the CAS expense in 2016 was
64
primarily due to the CAS Harmonization phased transition to the use of a discount rate based on high quality corporate bonds, consistent with PPA, to measure liabilities in determining the CAS pension expense. The decrease in our FAS expense in 2016 was primarily due to the higher discount rate at December 31, 2015 compared to the discount rate as of December 31, 2014. The change in the discount rate used to measure liabilities for purposes of determining CAS pension expense has been included in our contracts through our overhead forward pricing rates.
The change in our FAS/CAS Pension Adjustment of $99 million in 2015 compared to 2014 was driven by a $291 million increase in FAS and a $192 million increase in our CAS expense. The increase in our FAS expense in 2015 was primarily due to the lower discount rate at December 31, 2014 compared to the discount rate as of December 31, 2013, and the change in our long-term return on plan assets (ROA) assumption from 8.75% to 8.0%. The increase in the CAS expense in 2015 was primarily due to the CAS Harmonization phased transition 25% increase from 2014 to 2015 to the use of a discount rate based on high quality corporate bonds, consistent with PPA, to measure liabilities in determining the CAS pension expense. The change in the discount rate used to measure liabilities for purposes of determining CAS pension expenses has been included in our contracts through our overhead forward pricing rates.
The components of the FAS/CAS PRB Adjustment were as follows:
(In millions) | 2016 | 2015 | 2014 | ||||||||
FAS (expense) | $ | (16 | ) | $ | (12 | ) | $ | (8 | ) | ||
CAS expense | 16 | 15 | 13 | ||||||||
FAS/CAS PRB Adjustment | $ | — | $ | 3 | $ | 5 | |||||
For 2017 compared to 2016, we currently expect both our FAS expense and our CAS expense to increase, resulting in a slightly lower FAS/CAS Adjustment to income of $428 million driven by the differences in the assumptions and the recognition period for gains and losses under FAS and CAS and the transition to CAS Harmonization. The FAS/CAS Adjustment is subject to our annual update, generally planned in the third quarter, of our actuarial estimate of the unfunded benefit obligation for both FAS and CAS for final census data. After 2017, the FAS/CAS Adjustment is more difficult to predict because future FAS and CAS expense is based on a number of key assumptions for future periods. Differences between those assumptions and future actual results could significantly change both FAS and CAS expense in future periods. However, based solely on our current assumptions at December 31, 2016, we would expect our FAS/CAS Adjustment to increase income in 2018.
Corporate
Corporate operating income consists of unallocated costs and certain other corporate costs not considered part of management’s evaluation of reportable segment operating performance.
Operating income related to Corporate was as follows:
(In millions) | 2016 | 2015 | 2014 | ||||||||
Corporate | $ | (57 | ) | $ | (101 | ) | $ | (61 | ) | ||
The increase in operating income related to Corporate of $44 million in 2016 compared to 2015 was primarily due to $26 million of Websense transaction and integration-related expenses in 2015.
The decrease in operating income related to Corporate of $40 million in 2015 compared to 2014 was primarily due to $26 million of Websense transaction and integration-related expenses in 2015. Included in operating income related to Corporate in 2014 was $25 million of stock-based compensation expense associated with restricted stock units (RSUs) awarded in 2014. The RSU awards vest over a specified period of time as determined by the Management Development and Compensation Committee of our Board of Directors (MDCC) and are compensatory in nature. The RSUs continue to vest, but do not accelerate, on the scheduled vesting dates into retirement subject to the employee's compliance with certain post-employment covenants. Due to the continued vesting provisions of the RSUs into retirement, the Company recognized all of the stock-based compensation expense associated with the RSUs in 2014 rather than over the vesting period of the awards.
Discontinued Operations
In pursuing our business strategies we have divested certain non-core businesses, investments and assets when appropriate. All residual activity relating to our previously disposed businesses appears in discontinued operations.
65
In the second quarter of 2014, we received notice of the resolution of a dispute and related litigation with the U.S. government regarding pension segment closing adjustments under U.S. government Cost Accounting Standard 413 (CAS 413) for operations we divested over ten years ago. Under CAS 413, a pension plan termination adjustment is required when a contractor divests a business, yet retains ownership of the pension plan assets and liabilities of that business. These adjustments can result in payments to the U.S. government for pension plans that are in surplus position or payments to contractors for plans that are in a deficit position. As a result, in 2014 we received payment of $81 million and recorded a $52 million gain, net of federal tax expense, in discontinued operations, attributable to the affected plans that were in a deficit position at the time of divestiture.
FINANCIAL CONDITION AND LIQUIDITY
Overview
We pursue a capital deployment strategy that balances funding for growing our business, including capital expenditures, acquisitions and research and development; prudently managing our balance sheet, including debt repayments and pension contributions; and returning cash to our shareholders, including dividend payments and share repurchases, as outlined below. Our need for, cost of and access to funds are dependent on future operating results, as well as other external conditions. We currently expect that cash and cash equivalents, available-for-sale securities, cash flow from operations and other available financing resources will be sufficient to meet anticipated operating, capital expenditure, investment, debt service and other financing requirements during the next twelve months and for the foreseeable future.
In addition, the following table highlights selected measures of our liquidity and capital resources at December 31:
(In millions) | 2016 | 2015 | |||||
Cash and cash equivalents | $ | 3,303 | $ | 2,328 | |||
Short-term investments | 100 | 872 | |||||
Working capital | 4,251 | 3,686 | |||||
Amount available under our credit facilities | 1,250 | 1,250 | |||||
Operating Activities
(In millions) | 2016 | 2015 | 2014 | ||||||||
Net cash provided by (used in) operating activities from continuing operations | $ | 2,852 | $ | 2,346 | $ | 2,064 | |||||
Net cash provided by (used in) operating activities | 2,852 | 2,359 | 2,184 | ||||||||
The increase of $493 million in net cash provided by operating activities in 2016 compared to 2015 was primarily due to lower net tax payments as discussed below and the change in inventory as presented in the consolidated statements of cash flows principally due to the timing of capitalized precontract and other deferred costs, partially offset by the eBorders settlement payment received in the second quarter of 2015. The increase of $175 million in net cash provided by operating activities in 2015 compared to 2014 was primarily due to a decrease in pension contributions as discussed below, partially offset by an increase in tax payments as discussed below, and the timing of collections, which is driven by various items including milestone payments on international programs and payment terms.
Pension Plan Contributions—We may make both required and discretionary contributions to our pension plans. Required contributions are primarily determined in accordance with the Pension Protection Act of 2006 (PPA), which amended the Employee Retirement Income Security Act of 1974 (ERISA) rules and are affected by the actual return on plan assets (ROA) and plan funded status. The funding requirements under the PPA require us to fully fund our pension plans over a rolling seven-year period as determined annually based upon the funded status at the beginning of the year. The PPA funded status is based on actual asset performance, averaged over three years and PPA discount rates, which are based on a 24-month average of high quality corporate bond rates, as published by the Internal Revenue Service (IRS). As discussed in Critical Accounting Estimates, the STE Act, HATFA Act and BBA Act were passed by Congress and signed by the President in 2012, 2014 and 2015, respectively. The STE Act includes a provision for temporary pension funding relief due to the low interest rate environment. The provision adjusts the 24-month average high quality corporate bond rates used to determine the PPA funded status so that they are within a floor and cap, or “corridor”, based on the 25-year average of corporate bond rates. The STE Act gradually phased out this interest rate provision beginning in 2013. The HATFA and BBA Acts extended the phase out
66
provisions until 2020. As a result, the interest rates used to determine PPA funded status will continue to be adjusted within a “corridor” and do not begin to phase out until 2020.
We made the following required and discretionary contributions during the years ended December 31:
(In millions) | 2016 | 2015 | 2014 | ||||||||
Required pension contributions | $ | 145 | $ | 339 | $ | 650 | |||||
Discretionary pension contributions | 500 | 200 | 600 | ||||||||
PRB contributions | 25 | 22 | 20 | ||||||||
Total | $ | 670 | $ | 561 | $ | 1,270 | |||||
The decrease in required pension contributions of $194 million in 2016 compared to 2015 and $311 million in 2015 compared to 2014 was primarily due to HATFA as described above.
We expect to make required contributions to our pension and PRB plans of $777 million in 2017. We periodically evaluate whether to make discretionary contributions. Due to the differences in requirements and calculation methodologies, our FAS pension expense or income is not indicative of the funding requirement or amount of government recovery.
Tax Payments and Refunds—We made the following net tax payments during the years ended December 31:
(In millions) | 2016 | 2015 | 2014 | ||||||||
Federal | $ | 710 | $ | 1,008 | $ | 705 | |||||
Foreign | 47 | 43 | 19 | ||||||||
State | 22 | 30 | 35 | ||||||||
The decrease in net tax payments of $302 million in 2016 compared to 2015 was primarily due to the timing and amount of pension contributions. Federal and foreign net tax payments for 2017 are expected to approximate $820 million. The increase in expected federal and foreign net tax payments in 2017 is primarily due to the timing and amount of pension contributions.
The increase in net tax payments of $322 million in 2015 compared to 2014 was primarily due to the timing and amount of pension contributions.
Interest Payments—We made interest payments on our outstanding debt of $231 million, $232 million and $209 million in 2016, 2015 and 2014, respectively. Interest payments in 2016 were relatively consistent with 2015. The increase in interest payments in 2015 compared to 2014 was primarily due to the issuance of $600 million of fixed-rate long-term debt in the fourth quarter of 2014.
Investing Activities
(In millions) | 2016 | 2015 | 2014 | ||||||||
Net cash provided by (used in) investing activities | $ | 53 | $ | (1,744 | ) | $ | (1,322 | ) | |||
The change of $1,797 million in net cash provided by (used in) investing activities in 2016 compared to 2015 was primarily due to $1,897 million of lower cash payments for acquisitions in 2016 as compared to 2015, partially offset by a $155 million increase in additions to property, plant and equipment, both of which are described below. The change of $422 million in net cash provided by (used in) investing activities in 2015 compared to 2014 was primarily due to $1,527 million of higher cash payments for acquisitions in 2015 as compared to 2014 as described below, partially offset by a change in our short-term investments activity of $1,119 million as described below.
67
Additions to Property, Plant and Equipment and Capitalized Internal Use Software—Additions to property, plant and equipment and capitalized internal use software were as follows:
(In millions) | 2016 | 2015 | 2014 | ||||||||
Additions to property, plant and equipment | $ | 561 | $ | 406 | $ | 326 | |||||
Additions to capitalized internal use software | 64 | 51 | 54 | ||||||||
The increase in additions to property, plant and equipment of $155 million in 2016 compared to 2015 was primarily due to recent and anticipated growth and investment in productivity initiatives across the company, including factory automation and equipment upgrades.
We expect our property, plant and equipment and capitalized internal use software expenditures to be between approximately $555–$585 million and $95–$110 million, respectively, in 2017, consistent with the anticipated needs of our business and for specific investments including capital assets and facility improvements.
Short-term Investments Activity—We invest in marketable securities in accordance with our short-term investment policy and cash management strategy. These marketable securities are classified as available-for-sale and are recorded at fair value as short-term investments in our consolidated balance sheets. Activity related to short-term investments was as follows:
(In millions) | 2016 | 2015 | 2014 | ||||||||
Purchases of short-term investments | $ | (472 | ) | $ | (1,392 | ) | $ | (2,914 | ) | ||
Sales of short-term investments | — | 209 | 882 | ||||||||
Maturities of short-term investments | 1,184 | 1,793 | 1,523 | ||||||||
As of December 31, 2016, our short-term investments had an average maturity of approximately two months.
Acquisitions—In pursuing our business strategies, we acquire and make investments in certain businesses that meet strategic and financial criteria. Payments for purchases of acquired companies, net of cash acquired, were as follows:
(In millions) | 2016 | 2015 | 2014 | ||||||||
Payments for purchases of acquired companies, net of cash received | $ | 57 | $ | 1,954 | $ | 427 | |||||
The decrease of $1,897 million in payments for acquired companies, net of cash received, in 2016 compared to 2015 was primarily due to the 2015 acquisitions of Websense for $1.9 billion and Foreground Security for $62 million, partially offset by Forcepoint's acquisition of the Stonesoft next-generation firewall (NGFW) business, including the Sidewinder proxy firewall technology, in 2016. The increase of $1,527 million in payments for acquired companies, net of cash received, in 2015 compared to 2014 was primarily due to the 2015 acquisition of Websense for $1.9 billion, partially offset by the 2014 acquisition of Blackbird Technologies, Incorporated for $427 million.
Financing Activities
(In millions) | 2016 | 2015 | 2014 | ||||||||
Net cash provided by (used in) financing activities | $ | (1,930 | ) | $ | (1,509 | ) | $ | (936 | ) | ||
We have used cash provided by operating activities and proceeds from the issuance of new debt as our primary source for the repayment of debt, payment of dividends, pension contributions and the repurchase of our common stock. The change of $421 million in net cash provided by (used in) financing activities in 2016 compared to 2015 was primarily due to the sale of noncontrolling interest in Forcepoint in the second quarter of 2015 for $343 million and the $90 million net cash payment that we made to Thales S.A. in the second quarter of 2016 related to our acquisition of Thales S.A.'s noncontrolling interest in RCCS LLC and the sale of our equity method investment in TRS SAS as described in Consolidated Results of Operations beginning on page 41. The change of $573 million in net cash provided by (used in) financing activities in 2015 compared to 2014 was primarily due to $592 million of proceeds from debt issuance in 2014 and a $259 million increase in share repurchases, partially offset by the sale of noncontrolling interest in Forcepoint for $343 million, all of which are described below.
68
Debt—In the fourth quarter of 2014, we received proceeds of $592 million for the issuance of $600 million fixed-rate long-term debt.
Share Repurchases—From time to time, our Board of Directors authorizes the repurchase of shares of our common stock. In November 2015, our Board authorized the repurchase of up to $2.0 billion of our outstanding common stock. At December 31, 2016, we had approximately $1.6 billion available under the 2015 repurchase program. Share repurchases will take place from time to time at management’s discretion depending on market conditions.
Share repurchases also include shares surrendered by employees to satisfy tax withholding obligations in connection with restricted stock awards (RSAs), RSUs, stock options and Long-term Performance Plan (LTPP) awards issued to employees.
Our share repurchases were as follows:
2016 | 2015 | 2014 | |||||||||||||||
(In millions) | $ | Shares | $ | Shares | $ | Shares | |||||||||||
Shares repurchased under our share repurchase programs | $ | 900 | 6.9 | $ | 1,000 | 9.0 | $ | 750 | 7.7 | ||||||||
Shares repurchased to satisfy tax withholding obligations | 96 | 0.8 | 99 | 0.9 | 90 | 0.9 | |||||||||||
Total share repurchases | $ | 996 | 7.7 | $ | 1,099 | 9.9 | $ | 840 | 8.6 | ||||||||
Cash Dividends—Our Board of Directors authorized the following cash dividends:
(In millions, except per share amounts) | 2016 | 2015 | 2014 | ||||||||
Cash dividends per share | $2.93 | $2.68 | $2.42 | ||||||||
Dividends paid | 850 | 797 | 735 | ||||||||
In March 2016, our Board of Directors authorized a 9.3% increase to our annual dividend payout rate from $2.68 to $2.93 per share. In March 2015, our Board of Directors authorized an 11% increase in our annual dividend payout rate from $2.42 to $2.68 per share. Dividends are subject to quarterly approval by our Board of Directors.
Sale of Noncontrolling Interest in Forcepoint—In connection with the Websense acquisition in the second quarter of 2015, we combined Websense with RCP to form Forcepoint and then sold 19.7% of the equity interest in Forcepoint to Vista Equity Partners for $343 million.
CAPITAL RESOURCES
Total debt was $5.3 billion at December 31, 2016 and December 31, 2015. Our outstanding debt bears contractual interest at fixed interest rates ranging from 2.5% to 7.2% and matures at various dates from 2018 through 2044.
Cash and Cash Equivalents and Short-term Investments—Cash and cash equivalents and short-term investments were $3.4 billion and $3.2 billion at December 31, 2016 and December 31, 2015, respectively. We may invest in U.S. Treasuries; AAA/Aaa rated money market funds; certificates of deposit, time deposits and commercial paper of banks with a minimum long-term debt rating of A or A2 and minimum short-term debt rating of A-1 and P-1; and commercial paper of corporations with a minimum long-term debt rating of A- or A3 and minimum short-term debt rating of A-2 and P-2. Cash and cash equivalents and short-term investments balances held at our foreign subsidiaries were approximately $641 million and $1,040 million at December 31, 2016 and December 31, 2015, respectively. In the first quarter of 2014, a foreign subsidiary authorized and completed a transaction which resulted in a taxable dividend of approximately $115 million. The transaction does not affect our indefinite reinvestment assertion because it generated a net tax benefit of approximately $80 million. Earnings from our foreign subsidiaries are currently deemed to be indefinitely reinvested. We do not expect such reinvestment to affect our liquidity and capital resources, and we continuously evaluate our liquidity needs and ability to meet global cash requirements as a part of our overall capital deployment strategy. Factors that affect our global capital deployment strategy include anticipated cash flows, the ability to repatriate cash in a tax efficient manner, funding requirements for operations and investment activities, acquisitions and divestitures, and capital market conditions.
Credit Facilities—In November 2015, we entered into a $1.25 billion revolving credit facility maturing in November 2020 and terminated the previous $1.4 billion credit facility entered into in December 2011. Under the $1.25 billion credit facility, we can borrow, issue letters of credit and backstop commercial paper. Borrowings under this facility bear interest at various
69
rate options, including LIBOR plus a margin based on our credit ratings. Based on our credit ratings at December 31, 2016, borrowings would generally bear interest at LIBOR plus 80.5 basis points. The credit facility is composed of commitments from 20 separate highly rated lenders, each committing no more than 10% of the facility. As of December 31, 2016 and December 31, 2015 there were no borrowings outstanding under the $1.25 billion credit facility. We had no outstanding letters of credit at December 31, 2016 or December 31, 2015.
Under the $1.25 billion credit facility we must comply with certain covenants, including a ratio of total debt to total capitalization of no more than 60%. We were in compliance with the credit facility covenants during 2016 and 2015. Our ratio of total debt to total capitalization, as those terms are defined in the credit facility, was 34.6% at December 31, 2016. We are providing this ratio as this metric is used by our lenders to monitor our leverage and is also a threshold that could limit our ability to utilize this facility.
Shelf Registrations—We have an effective shelf registration with the Securities and Exchange Commission (SEC), filed in June 2016, which covers the registration of debt securities, common stock, preferred stock and warrants.
CONTRACTUAL OBLIGATIONS
The following is a schedule of our contractual obligations outstanding at December 31, 2016:
Payment due by period | |||||||||||||||||||
(In millions) | Total | Less than 1 year (2017) | 1–3 years (2018–2019) | 3–5 years (2020–2021) | After 5 years (2022 and thereafter) | ||||||||||||||
Debt(1) | $ | 5,383 | $ | — | $ | 591 | $ | 1,500 | $ | 3,292 | |||||||||
Interest payments | 2,524 | 231 | 415 | 321 | 1,557 | ||||||||||||||
Operating leases | 1,292 | 226 | 356 | 265 | 445 | ||||||||||||||
Purchase obligations | 9,153 | 7,211 | 1,605 | 172 | 165 | ||||||||||||||
Total | $ | 18,352 | $ | 7,668 | $ | 2,967 | $ | 2,258 | $ | 5,459 | |||||||||
(1) | Debt includes scheduled principal payments only. |
Purchase obligations in the table above represent enforceable and legally binding agreements with suppliers to purchase goods or services. We enter into contracts with customers, primarily the U.S. government, which entitle us to full recourse for costs incurred, including purchase obligations, in the event the contract is terminated by the customer for convenience. These purchase obligations are included above notwithstanding the amount for which we are entitled to full recourse from our customers. The table above does not include required pension and PRB contributions. We expect to make required pension and PRB contributions of approximately $777 million in 2017, exclusive of any U.S. government recovery. Amounts beyond 2017 for required pension and PRB contributions depend upon actuarial assumptions, actual plan asset performance and other factors described under pension costs in Critical Accounting Estimates. However, based solely on our current assumptions, we expect our funding requirements to be approximately $1,025 million in 2018, exclusive of any U.S. government recovery.
Interest payments include interest on debt that is redeemable at our option.
OFF-BALANCE SHEET ARRANGEMENTS
At December 31, 2016, we had no significant off-balance sheet arrangements other than operating leases and guarantees to third parties on behalf of our affiliates as described below in Commitments and Contingencies. Such arrangements are not material to our overall liquidity or capital resources, market risk support or credit risk support as described below.
70
COMMITMENTS AND CONTINGENCIES
Environmental Matters—We are involved in various stages of investigation and cleanup related to remediation of various environmental sites. Our estimate of the liability of total environmental remediation costs includes the use of a discount rate and takes into account that a portion of these costs is eligible for future recovery through the pricing of our products and services to the U.S. government. We consider such recovery probable based on government contracting regulations and our long history of receiving reimbursement for such costs, and accordingly have recorded the estimated future recovery of these costs from the U.S. government within contracts in process, net, in our consolidated balance sheets. Our estimates regarding remediation costs to be incurred were as follows at December 31:
(In millions, except percentages) | 2016 | 2015 | |||||
Total remediation costs—undiscounted | $ | 219 | $ | 224 | |||
Weighted-average discount rate | 5.2 | % | 5.2 | % | |||
Total remediation costs—discounted | $ | 147 | $ | 149 | |||
Recoverable portion | 92 | 94 | |||||
We also lease certain government-owned properties and generally are not liable for remediation of preexisting environmental contamination at these sites. As a result, we generally do not provide for these costs in our consolidated financial statements.
Due to the complexity of environmental laws and regulations, the varying costs and effectiveness of alternative cleanup methods and technologies, the uncertainty of insurance coverage and the unresolved extent of our responsibility, it is difficult to determine the ultimate outcome of environmental matters. However, we do not expect any additional liability to have a material adverse effect on our financial position, results of operations or liquidity.
Environmental remediation costs expected to be incurred are:
(In millions) | |||
2017 | $ | 32 | |
2018 | 28 | ||
2019 | 18 | ||
2020 | 12 | ||
2021 | 10 | ||
Thereafter | 119 | ||
Financing Arrangements and Other—We issue guarantees, and banks and surety companies issue, on our behalf, letters of credit and surety bonds to meet various bid, performance, warranty, retention and advance payment obligations of us or our affiliates. These instruments expire on various dates through 2024. Additional guarantees of project performance for which there is no stated value also remain outstanding. The stated values outstanding consisted of the following at December 31:
(In millions) | 2016 | 2015 | |||||
Guarantees | $ | 190 | $ | 213 | |||
Letters of credit | 2,345 | 2,242 | |||||
Surety bonds | 127 | 264 | |||||
Included in guarantees and letters of credit described above were $180 million and $44 million, respectively, at December 31, 2016, and $203 million and $187 million, respectively, at December 31, 2015, related to our joint venture in TRS. The joint venture agreement for the TRS joint venture was amended and restated in the second quarter of 2016, as discussed in "Note 5: Thales-Raytheon Systems Co. Ltd. (TRS) Joint Venture" within Item 8 of this Form 10-K, reducing the scope of the joint venture to TRS AMDC2 only. We provide these guarantees and letters of credit to TRS AMDC2 and other affiliates to assist these entities in obtaining financing on more favorable terms, making bids on contracts and performing their contractual obligations. While we expect these entities to satisfy their loans and meet their project performance and other contractual obligations, their failure to do so may result in a future obligation to us. We periodically evaluate the risk of TRS AMDC2 and other affiliates failing to meet their obligations described above. At December 31, 2016, we believe the risk that TRS AMDC2 and other affiliates will not be able to meet their obligations is minimal for the foreseeable future based on their
71
current financial condition. All obligations were current at December 31, 2016. At December 31, 2016 and December 31, 2015, we had an estimated liability of $3 million and $8 million, respectively, related to these guarantees and letters of credit.
The joint venture agreement between Raytheon and Vista Equity Partners relating to Forcepoint provides Vista Equity Partners with certain rights to require Forcepoint to pursue an initial public offering at any time after four years and three months following the closing date of May 29, 2015, or pursue a sale of the company at any time after five years following the closing date. In either of these events, Raytheon has the option to purchase all (but not less than all) of Vista Equity Partners’ interest in Forcepoint for cash at a price equal to fair value as determined under the joint venture agreement. Additionally, Vista Equity Partners has the ability to liquidate its ownership through a put option any time after two years following the closing date, which could occur any time after May 29, 2017. In the event of a put option, Vista Equity Partners could require Raytheon to purchase all (but not less than all) of Vista Equity Partners’ interest in Forcepoint for cash at a price equal to fair value as determined under the joint venture agreement. The joint venture agreement provides for the process under which the parties would determine the fair value of the interest and could result in a payment by Raytheon shortly after the exercise of the put option; however, the ultimate timing will depend on the actions of the parties and other factors. Lastly, at any time after three years following the closing date, Raytheon has the option to purchase all (but not less than all) of Vista Equity Partners’ interest in Forcepoint at a price equal to fair value as determined under the joint venture agreement. At December 31, 2016, the fair value of the noncontrolling interest is estimated at $449 million and is subject to change based upon market conditions and business performance. The estimate of fair value for purposes of presenting the redeemable noncontrolling interest, outside of stockholders' equity, in our consolidated balance sheets could differ from the parties' determination of fair value for the put option under the joint venture agreement.
We have entered into industrial cooperation agreements, sometimes referred to as offset agreements, as a condition to obtaining orders for our products and services from certain customers in foreign countries. At December 31, 2016, the aggregate amount of our offset agreements, both agreed to and anticipated to be agreed to, had an outstanding notional value of approximately $8.8 billion. To the extent we have entered into purchase obligations that satisfy our offset agreements, those amounts are included in the Contractual Obligations table on page 70. These agreements are designed to return economic value to the foreign country by requiring us to engage in activities supporting local defense or commercial industries, promoting a balance of trade, developing in-country technology capabilities or addressing other local development priorities. Offset agreements may be satisfied through activities that do not require a direct cash payment, including transferring technology, providing manufacturing, training and other consulting support to in-country projects, and the purchase by third parties (e.g., our vendors) of supplies from in-country vendors. These agreements may also be satisfied through our use of cash for activities such as subcontracting with local partners, purchasing supplies from in-country vendors, providing financial support for in-country projects and making investments in local ventures. Such activities may also vary by country depending upon requirements as dictated by their governments. We typically do not commit to offset agreements until orders for our products or services are definitive. The amounts ultimately applied against our offset agreements are based on negotiations with the customers and typically require cash outlays that represent only a fraction of the notional value in the offset agreements. Offset programs usually extend over several or more years and may provide for penalties in the event we fail to perform in accordance with offset requirements. We have historically not been required to pay any such penalties.
As a U.S. government contractor, we are subject to many levels of audit and investigation by the U.S. government relating to our contract performance and compliance with applicable rules and regulations. Agencies that oversee contract performance include: the Defense Contract Audit Agency (DCAA); the Defense Contract Management Agency (DCMA); the Inspectors General of the U.S. Department of Defense (DoD) and other departments and agencies; the Government Accountability Office; the Department of Justice (DoJ); and Congressional Committees. From time to time, these and other agencies investigate or conduct audits to determine whether our operations are being conducted in accordance with applicable requirements. Such investigations and audits may be initiated due to a number of reasons, including as a result of a whistleblower complaint. Such investigations and audits could result in administrative, civil or criminal liabilities, including repayments, fines or penalties being imposed upon us, the suspension of government export licenses or the suspension or debarment from future U.S. government contracting. U.S. government investigations often take years to complete and many result in no adverse action against us. Our final allowable incurred costs for each year are also subject to audit and have, from time to time, resulted in disputes between us and the U.S. government, with litigation resulting at the Court of Federal Claims (COFC) or the Armed Services Board of Contract Appeals (ASBCA) or their related courts of appeals. In addition, the DoJ has, from time to time, convened grand juries to investigate possible irregularities by us. We also provide products and services to customers outside of the U.S., and those sales are subject to local government laws, regulations and procurement policies and practices. Our compliance with such local government regulations or any applicable U.S. government regulations (e.g., the Foreign Corrupt
72
Practices Act (FCPA) and International Traffic in Arms Regulations (ITAR)) may also be investigated or audited. Other than as specifically disclosed herein, we do not expect these audits, investigations or disputes to have a material effect on our financial position, results of operations or liquidity, either individually or in the aggregate.
On June 23, 2016, the U.K. held a referendum in which British citizens approved an exit from the European Union (EU), commonly referred to as “Brexit”. As a result of the referendum, there has been a decline in the value of the British pound as compared to the U.S. dollar and volatility in exchange rates may continue as the U.K. negotiates its exit from the EU. The British pound is the functional currency for approximately 2% of our sales. In addition, for any contracts that are not denominated in the same currency as the functional currency (for example, contracts denominated in British pounds where the functional currency is the U.S. dollar), we enter into foreign currency forward contracts to hedge our risk related to foreign currency exchange rate fluctuations. As a result, we currently do not expect the U.K.’s exit from the EU to have a material impact on our financial position, results of operations or liquidity.
In addition, various other claims and legal proceedings generally incidental to the normal course of business are pending or threatened against, or initiated by, us. We do not expect any of these proceedings to result in any additional liability or gains that would materially affect our financial position, results of operations or liquidity. In connection with certain of our legal matters, we may be entitled to insurance recovery for qualified legal costs. We do not expect any insurance recovery to have a material impact on the financial exposure that could result from these matters.
ITEM 7A. QUANTITATIVE AND QUALITATIVE DISCLOSURES ABOUT MARKET RISK
Our primary market exposures are to interest rates and foreign exchange rates.
We generally supplement our working capital requirements with a combination of variable-rate short-term and fixed-rate long-term financing. We enter into foreign currency forward contracts with commercial banks to fix the foreign currency exchange rates on specific commitments and payments to vendors and customer receipts. We may enter into interest rate swap agreements with commercial and investment banks to manage interest rates associated with our financing arrangements. The market-risk sensitive instruments we use for hedging are entered into with commercial and investment banks and are directly related to a particular asset, liability or transaction for which a firm commitment is in place.
The following tables provide information as of December 31, 2016 and December 31, 2015 about our market risk exposure associated with changing interest rates. For long-term debt obligations, the table presents principal cash flows by maturity date and average interest rates related to outstanding obligations. There were no interest rate swaps outstanding at December 31, 2016 and December 31, 2015.
Principal payments and interest rate detail for long-term debt by contractual maturity dates as of December 31, 2016 and December 31, 2015, respectively, were as follows:
(In millions, except percentages) | 2017 | 2018 | 2019 | 2020 | 2021 | Thereafter | Total | Fair Value | |||||||||||||||||||||||
Fixed-rate debt | $ | — | $ | 591 | $ | — | $ | 1,500 | $ | — | $ | 3,292 | $ | 5,383 | $ | 5,848 | |||||||||||||||
Average interest rate | — | 6.549 | % | — | 3.550 | % | — | 4.229 | % | 4.295 | % | ||||||||||||||||||||
(In millions, except percentages) | 2016 | 2017 | 2018 | 2019 | 2020 | Thereafter | Total | Fair Value | |||||||||||||||||||||||
Fixed-rate debt | $ | — | $ | — | $ | 591 | $ | — | $ | 1,500 | $ | 3,292 | $ | 5,383 | $ | 5,826 | |||||||||||||||
Average interest rate | — | — | 6.549 | % | — | 3.550 | % | 4.229 | % | 4.295 | % | ||||||||||||||||||||
In addition, the aggregate notional amount of the outstanding foreign currency forward contracts was $1,277 million and $1,076 million at December 31, 2016 and December 31, 2015, respectively. The net notional exposure of these contracts was approximately $342 million and $117 million at December 31, 2016 and December 31, 2015, respectively.
For foreign currency forward contracts designated and qualifying for hedge accounting, we record the effective portion of the gain or loss on the derivative in accumulated other comprehensive loss, net of tax, and reclassify it into earnings in the same period or periods during which the hedged revenue or cost of sales transaction affects earnings. Unrealized gains of $53 million and $9 million were included in other assets, net, and unrealized losses of $48 million and $29 million were included in other
73
current liabilities at December 31, 2016 and December 31, 2015, respectively.
Realized gains and losses resulting from these cash flow hedges offset the foreign currency exchange gains and losses on the underlying assets or liabilities being hedged. We believe our exposure due to changes in foreign currency rates is not material due to our hedging policy.
At December 31, 2016, we had short-term investments with a fair value of $100 million, which are classified as available-for-sale and consist of highly rated bank certificates of deposit with a minimum long-term debt rating of A or A2 and a minimum short-term debt rating of A-1 and P-1. Our exposure due to changes in interest rates is not material due to the nature and amount of our short-term investments (i.e., high-quality certificates of deposit which had an average maturity of approximately two months).
74
ITEM 8. FINANCIAL STATEMENTS AND SUPPLEMENTARY DATA
Topic | Page |
COMPANY RESPONSIBILITY FOR FINANCIAL STATEMENTS
The financial statements and related information contained in this Annual Report have been prepared by and are the responsibility of our management. Our financial statements have been prepared in conformity with accounting principles generally accepted in the United States of America and reflect judgments and estimates as to the expected effects of transactions and events currently being reported. Our management is responsible for the integrity and objectivity of the financial statements and other financial information included in this Annual Report. To meet this responsibility, we maintain a system of internal control over financial reporting to provide reasonable assurance that assets are safeguarded and that transactions are properly executed and recorded. The system includes policies and procedures, internal audits and our officers’ reviews.
Our Audit Committee of our Board of Directors is composed solely of directors who are independent under applicable SEC and New York Stock Exchange rules. Our Audit Committee meets periodically and, when appropriate, separately with representatives of the independent registered public accounting firm, our officers and the internal auditors to monitor the activities of each.
PricewaterhouseCoopers LLP, an independent registered public accounting firm, was appointed by our Audit Committee to audit our financial statements and our internal control over financial reporting and their report follows. Our stockholders ratified the appointment of PricewaterhouseCoopers LLP at the 2016 Annual Meeting of Stockholders.
75
MANAGEMENT’S REPORT ON INTERNAL CONTROL OVER FINANCIAL REPORTING
Management is responsible for establishing and maintaining adequate internal control over financial reporting for the Company. In order to evaluate the effectiveness of internal control over financial reporting, as required by Section 404 of the Sarbanes-Oxley Act, management has conducted an assessment, including testing, using the criteria in Internal Control – Integrated Framework, issued by the Committee of Sponsoring Organizations of the Treadway Commission (COSO) in 2013. The Company’s system of internal control over financial reporting is designed to provide reasonable assurance regarding the reliability of financial reporting and the preparation of financial statements for external purposes in accordance with accounting principles generally accepted in the United States of America. Because of its inherent limitations, internal control over financial reporting may not prevent or detect misstatements. Also, projections of any evaluation of effectiveness to future periods are subject to the risk that controls may become inadequate because of changes in conditions, or that the degree of compliance with the policies or procedures may deteriorate.
Based on its assessment, management has concluded that the Company maintained effective internal control over financial reporting as of December 31, 2016, based on criteria in Internal Control – Integrated Framework, issued by the COSO in 2013. The effectiveness of the Company’s internal control over financial reporting as of December 31, 2016, has been audited by PricewaterhouseCoopers LLP, an independent registered public accounting firm, as stated in their report which is included below.
/s/ Thomas A. Kennedy | /s/ Anthony F. O'Brien | |
Thomas A. Kennedy | Anthony F. O'Brien | |
Chairman and Chief Executive Officer | Vice President and Chief Financial Officer | |
76
REPORT OF INDEPENDENT REGISTERED PUBLIC ACCOUNTING FIRM
To the Board of Directors and Shareholders of Raytheon Company:
In our opinion, the accompanying consolidated balance sheets and the related consolidated statements of operations, of comprehensive income, of equity, and of cash flows present fairly, in all material respects, the financial position of Raytheon Company and its subsidiaries at December 31, 2016 and 2015, and the results of their operations and their cash flows for each of the three years in the period ended December 31, 2016 in conformity with accounting principles generally accepted in the United States of America. Also in our opinion, the Company maintained, in all material respects, effective internal control over financial reporting as of December 31, 2016, based on criteria established in Internal Control-Integrated Framework issued by the Committee of Sponsoring Organizations of the Treadway Commission (COSO) in 2013. The Company’s management is responsible for these financial statements, for maintaining effective internal control over financial reporting and for its assessment of the effectiveness of internal control over financial reporting, included in the accompanying Management’s Report on Internal Control Over Financial Reporting. Our responsibility is to express opinions on these financial statements and on the Company’s internal control over financial reporting based on our integrated audits. We conducted our audits in accordance with the standards of the Public Company Accounting Oversight Board (United States). Those standards require that we plan and perform the audits to obtain reasonable assurance about whether the financial statements are free of material misstatement and whether effective internal control over financial reporting was maintained in all material respects. Our audits of the financial statements included examining, on a test basis, evidence supporting the amounts and disclosures in the financial statements, assessing the accounting principles used and significant estimates made by management, and evaluating the overall financial statement presentation. Our audit of internal control over financial reporting included obtaining an understanding of internal control over financial reporting, assessing the risk that a material weakness exists, and testing and evaluating the design and operating effectiveness of internal control based on the assessed risk. Our audits also included performing such other procedures as we considered necessary in the circumstances. We believe that our audits provide a reasonable basis for our opinions.
As discussed in Note 1 to the consolidated financial statements, the Company changed the manner in which it accounts for the income tax effects of share-based payment transactions in 2016.
A company’s internal control over financial reporting is a process designed to provide reasonable assurance regarding the reliability of financial reporting and the preparation of financial statements for external purposes in accordance with generally accepted accounting principles. A company’s internal control over financial reporting includes those policies and procedures that (i) pertain to the maintenance of records that, in reasonable detail, accurately and fairly reflect the transactions and dispositions of the assets of the company; (ii) provide reasonable assurance that transactions are recorded as necessary to permit preparation of financial statements in accordance with generally accepted accounting principles, and that receipts and expenditures of the company are being made only in accordance with authorizations of management and directors of the company; and (iii) provide reasonable assurance regarding prevention or timely detection of unauthorized acquisition, use, or disposition of the company’s assets that could have a material effect on the financial statements.
Because of its inherent limitations, internal control over financial reporting may not prevent or detect misstatements. Also, projections of any evaluation of effectiveness to future periods are subject to the risk that controls may become inadequate because of changes in conditions, or that the degree of compliance with the policies or procedures may deteriorate.
/s/ PricewaterhouseCoopers LLP
Boston, Massachusetts
February 15, 2017
77
RAYTHEON COMPANY
CONSOLIDATED BALANCE SHEETS
(In millions, except per share amount) December 31: | 2016 | 2015 | |||||
Assets | |||||||
Current assets | |||||||
Cash and cash equivalents | $ | 3,303 | $ | 2,328 | |||
Short-term investments | 100 | 872 | |||||
Contracts in process, net | 6,202 | 5,564 | |||||
Inventories | 659 | 635 | |||||
Prepaid expenses and other current assets | 414 | 413 | |||||
Total current assets | 10,678 | 9,812 | |||||
Property, plant and equipment, net | 2,166 | 2,005 | |||||
Goodwill | 14,788 | 14,731 | |||||
Other assets, net | 2,420 | 2,733 | |||||
Total assets | $ | 30,052 | $ | 29,281 | |||
Liabilities, Redeemable Noncontrolling Interest and Equity | |||||||
Current liabilities | |||||||
Advance payments and billings in excess of costs incurred | $ | 2,239 | $ | 2,193 | |||
Accounts payable | 1,520 | 1,402 | |||||
Accrued employee compensation | 1,234 | 1,154 | |||||
Other current liabilities | 1,434 | 1,377 | |||||
Total current liabilities | 6,427 | 6,126 | |||||
Accrued retiree benefits and other long-term liabilities | 7,775 | 7,140 | |||||
Long-term debt | 5,335 | 5,330 | |||||
Commitments and contingencies (Note 12) | |||||||
Redeemable noncontrolling interest (Note 6) | 449 | 355 | |||||
Equity | |||||||
Raytheon Company stockholders’ equity | |||||||
Common stock, par value, $0.01 per share, 1,450 shares authorized, 293 and 299 shares outstanding at December 31, 2016 and 2015, respectively. | 3 | 3 | |||||
Additional paid-in capital | — | 398 | |||||
Accumulated other comprehensive loss | (7,411 | ) | (7,176 | ) | |||
Retained earnings | 17,474 | 16,903 | |||||
Total Raytheon Company stockholders’ equity | 10,066 | 10,128 | |||||
Noncontrolling interests in subsidiaries | — | 202 | |||||
Total equity | 10,066 | 10,330 | |||||
Total liabilities, redeemable noncontrolling interest and equity | $ | 30,052 | $ | 29,281 | |||
The accompanying notes are an integral part of the consolidated financial statements.
78
RAYTHEON COMPANY
CONSOLIDATED STATEMENTS OF OPERATIONS
(In millions, except per share amounts) Years Ended December 31: | 2016 | 2015 | 2014 | ||||||||
Net sales | |||||||||||
Products | $ | 20,166 | $ | 19,443 | $ | 19,126 | |||||
Services | 3,903 | 3,804 | 3,700 | ||||||||
Total net sales | 24,069 | 23,247 | 22,826 | ||||||||
Operating expenses | |||||||||||
Cost of sales—products | 14,767 | 14,447 | 14,260 | ||||||||
Cost of sales—services | 3,180 | 3,127 | 3,035 | ||||||||
General and administrative expenses | 2,882 | 2,660 | 2,352 | ||||||||
Total operating expenses | 20,829 | 20,234 | 19,647 | ||||||||
Operating income | 3,240 | 3,013 | 3,179 | ||||||||
Non-operating (income) expense, net | |||||||||||
Interest expense | 232 | 233 | 213 | ||||||||
Interest income | (16 | ) | (11 | ) | (10 | ) | |||||
Other (income) expense, net | (6 | ) | 4 | (7 | ) | ||||||
Total non-operating (income) expense, net | 210 | 226 | 196 | ||||||||
Income from continuing operations before taxes | 3,030 | 2,787 | 2,983 | ||||||||
Federal and foreign income taxes | 857 | 733 | 790 | ||||||||
Income from continuing operations | 2,173 | 2,054 | 2,193 | ||||||||
Income (loss) from discontinued operations, net of tax | 1 | 13 | 65 | ||||||||
Net income | 2,174 | 2,067 | 2,258 | ||||||||
Less: Net income (loss) attributable to noncontrolling interests in subsidiaries | (37 | ) | (7 | ) | 14 | ||||||
Net income attributable to Raytheon Company | $ | 2,211 | $ | 2,074 | $ | 2,244 | |||||
Basic earnings per share attributable to Raytheon Company common stockholders: | |||||||||||
Income from continuing operations | $ | 7.45 | $ | 6.76 | $ | 6.98 | |||||
Income (loss) from discontinued operations, net of tax | — | 0.04 | 0.21 | ||||||||
Net income | 7.45 | 6.81 | 7.19 | ||||||||
Diluted earnings per share attributable to Raytheon Company common stockholders: | |||||||||||
Income from continuing operations | $ | 7.44 | $ | 6.75 | $ | 6.97 | |||||
Income (loss) from discontinued operations, net of tax | — | 0.04 | 0.21 | ||||||||
Net income | 7.44 | 6.80 | 7.18 | ||||||||
Amounts attributable to Raytheon Company common stockholders: | |||||||||||
Income from continuing operations | $ | 2,210 | $ | 2,061 | $ | 2,179 | |||||
Income (loss) from discontinued operations, net of tax | 1 | 13 | 65 | ||||||||
Net income | $ | 2,211 | $ | 2,074 | $ | 2,244 | |||||
Dividends declared per share | $ | 2.93 | $ | 2.68 | $ | 2.42 | |||||
The accompanying notes are an integral part of the consolidated financial statements.
79
RAYTHEON COMPANY
CONSOLIDATED STATEMENTS OF COMPREHENSIVE INCOME
(In millions) Years Ended December 31: | 2016 | 2015 | 2014 | ||||||||
Net income | $ | 2,174 | $ | 2,067 | $ | 2,258 | |||||
Other comprehensive income (loss), before tax: | |||||||||||
Pension and other employee benefit plans, net: | |||||||||||
Prior service (cost) credit arising during period | (1 | ) | (2 | ) | (11 | ) | |||||
Amortization of prior service cost (credit) included in net periodic cost | 4 | 6 | 6 | ||||||||
Net gain (loss) arising during period | (1,238 | ) | (622 | ) | (4,410 | ) | |||||
Amortization of net actuarial loss included in net income | 1,002 | 1,129 | 892 | ||||||||
Loss due to curtailments/settlements | 5 | 4 | — | ||||||||
Effect of exchange rates | 25 | 10 | 9 | ||||||||
Pension and postretirement benefit plans, net | (203 | ) | 525 | (3,514 | ) | ||||||
Foreign exchange translation | (115 | ) | (57 | ) | (50 | ) | |||||
Cash flow hedges | 25 | (4 | ) | (10 | ) | ||||||
Unrealized gains (losses) on investments and other, net | 15 | (5 | ) | 1 | |||||||
Other comprehensive income (loss), before tax | (278 | ) | 459 | (3,573 | ) | ||||||
Income tax benefit (expense) related to items of other comprehensive income (loss) | 43 | (177 | ) | 1,228 | |||||||
Other comprehensive income (loss), net of tax | (235 | ) | 282 | (2,345 | ) | ||||||
Total comprehensive income (loss) | 1,939 | 2,349 | (87 | ) | |||||||
Less: Comprehensive income (loss) attributable to noncontrolling interests in subsidiaries | (37 | ) | (7 | ) | 14 | ||||||
Comprehensive income (loss) attributable to Raytheon Company | $ | 1,976 | $ | 2,356 | $ | (101 | ) | ||||
The accompanying notes are an integral part of the consolidated financial statements.
80
RAYTHEON COMPANY
CONSOLIDATED STATEMENTS OF EQUITY
Years Ended December 31, 2016, 2015 and 2014 (in millions): | Common stock | Additional paid-in capital | Accumulated other comprehensive income (loss) | Retained earnings | Total Raytheon Company stockholders’ equity | Noncontrolling interests in subsidiaries(1) | Total equity | ||||||||||||||||||||
Balance at December 31, 2013 | $ | 3 | $ | 1,972 | $ | (5,113 | ) | $ | 14,173 | $ | 11,035 | $ | 162 | $ | 11,197 | ||||||||||||
Net income (loss) | 2,244 | 2,244 | 14 | 2,258 | |||||||||||||||||||||||
Other comprehensive income (loss), net of tax | (2,345 | ) | (2,345 | ) | (2,345 | ) | |||||||||||||||||||||
Distributions and other activity related to noncontrolling interests | (22 | ) | (22 | ) | 20 | (2 | ) | ||||||||||||||||||||
Dividends declared | (746 | ) | (746 | ) | (746 | ) | |||||||||||||||||||||
Common stock plans activity | 199 | 199 | 199 | ||||||||||||||||||||||||
Share repurchases | (840 | ) | (840 | ) | (840 | ) | |||||||||||||||||||||
Balance at December 31, 2014 | 3 | 1,309 | (7,458 | ) | 15,671 | 9,525 | 196 | 9,721 | |||||||||||||||||||
Net income (loss) | 2,074 | 2,074 | 10 | 2,084 | |||||||||||||||||||||||
Other comprehensive income (loss), net of tax | 282 | 282 | 282 | ||||||||||||||||||||||||
Adjustment of redeemable noncontrolling interest to redemption value | (29 | ) | (29 | ) | (29 | ) | |||||||||||||||||||||
Distributions and other activity related to noncontrolling interests | (2 | ) | (2 | ) | (4 | ) | (6 | ) | |||||||||||||||||||
Dividends declared | (813 | ) | (813 | ) | (813 | ) | |||||||||||||||||||||
Common stock plans activity | 190 | 190 | 190 | ||||||||||||||||||||||||
Share repurchases | (1,099 | ) | (1,099 | ) | (1,099 | ) | |||||||||||||||||||||
Balance at December 31, 2015 | 3 | 398 | (7,176 | ) | 16,903 | 10,128 | 202 | 10,330 | |||||||||||||||||||
Net income (loss) | 2,211 | 2,211 | (15 | ) | 2,196 | ||||||||||||||||||||||
Other comprehensive income (loss), net of tax | (235 | ) | (235 | ) | (235 | ) | |||||||||||||||||||||
Adjustment of redeemable noncontrolling interest to redemption value | (143 | ) | (143 | ) | (143 | ) | |||||||||||||||||||||
Distributions and other activity related to noncontrolling interests | (195 | ) | (195 | ) | (187 | ) | (382 | ) | |||||||||||||||||||
Dividends declared | 3 | (867 | ) | (864 | ) | (864 | ) | ||||||||||||||||||||
Common stock plans activity | 160 | 160 | 160 | ||||||||||||||||||||||||
Share repurchases | (561 | ) | (435 | ) | (996 | ) | (996 | ) | |||||||||||||||||||
Balance at December 31, 2016 | $ | 3 | $ | — | $ | (7,411 | ) | $ | 17,474 | $ | 10,066 | $ | — | $ | 10,066 | ||||||||||||
(1) | Excludes redeemable noncontrolling interest which is not considered equity. See "Note 6: Forcepoint Joint Venture" for additional information. |
The accompanying notes are an integral part of the consolidated financial statements.
81
RAYTHEON COMPANY
CONSOLIDATED STATEMENTS OF CASH FLOWS
(In millions) Years Ended December 31: | 2016 | 2015 | 2014 | ||||||||
Cash flows from operating activities | |||||||||||
Net income | $ | 2,174 | $ | 2,067 | $ | 2,258 | |||||
(Income) loss from discontinued operations, net of tax | (1 | ) | (13 | ) | (65 | ) | |||||
Income from continuing operations | 2,173 | 2,054 | 2,193 | ||||||||
Adjustments to reconcile to net cash provided by (used in) operating activities from continuing operations, net of acquisitions and divestitures | |||||||||||
Depreciation and amortization | 515 | 489 | 439 | ||||||||
Stock-based compensation | 151 | 140 | 148 | ||||||||
Gain on sale of equity method investment | (158 | ) | — | — | |||||||
Deferred income taxes | 109 | (56 | ) | (60 | ) | ||||||
Tax benefit from stock-based awards | — | (47 | ) | (47 | ) | ||||||
Changes in assets and liabilities | |||||||||||
Contracts in process, net and advance payments and billings in excess of costs incurred | (593 | ) | (637 | ) | (162 | ) | |||||
Inventories | (23 | ) | (223 | ) | (50 | ) | |||||
Prepaid expenses and other current assets | 181 | (28 | ) | 50 | |||||||
Income taxes receivable/payable | (185 | ) | (181 | ) | (33 | ) | |||||
Accounts payable | 152 | 107 | 54 | ||||||||
Accrued employee compensation | 77 | 72 | (20 | ) | |||||||
Other current liabilities | (6 | ) | 58 | (33 | ) | ||||||
Accrued retiree benefits | 419 | 637 | (367 | ) | |||||||
Other, net | 40 | (39 | ) | (48 | ) | ||||||
Net cash provided by (used in) operating activities from continuing operations | 2,852 | 2,346 | 2,064 | ||||||||
Net cash provided by (used in) operating activities from discontinued operations | — | 13 | 120 | ||||||||
Net cash provided by (used in) operating activities | 2,852 | 2,359 | 2,184 | ||||||||
Cash flows from investing activities | |||||||||||
Additions to property, plant and equipment | (561 | ) | (406 | ) | (326 | ) | |||||
Proceeds from sales of property, plant and equipment | 34 | 59 | 9 | ||||||||
Additions to capitalized internal use software | (64 | ) | (51 | ) | (54 | ) | |||||
Purchases of short-term investments | (472 | ) | (1,392 | ) | (2,914 | ) | |||||
Sales of short-term investments | — | 209 | 882 | ||||||||
Maturities of short-term investments | 1,184 | 1,793 | 1,523 | ||||||||
Payments for purchases of acquired companies, net of cash received | (57 | ) | (1,954 | ) | (427 | ) | |||||
Other | (11 | ) | (2 | ) | (15 | ) | |||||
Net cash provided by (used in) investing activities | 53 | (1,744 | ) | (1,322 | ) | ||||||
Cash flows from financing activities | |||||||||||
Dividends paid | (850 | ) | (797 | ) | (735 | ) | |||||
Issuance of long-term debt, net of offering costs | — | — | 592 | ||||||||
Repurchases of common stock under share repurchase programs | (900 | ) | (1,000 | ) | (750 | ) | |||||
Repurchases of common stock to satisfy tax withholding obligations | (96 | ) | (99 | ) | (90 | ) | |||||
Proceeds from exercise of stock options | — | — | 2 | ||||||||
Acquisition of noncontrolling interest in RCCS LLC | (90 | ) | — | — | |||||||
Contribution from noncontrolling interest in Forcepoint | 11 | — | — | ||||||||
Tax benefit from stock-based awards | — | 47 | 47 | ||||||||
Sale of noncontrolling interest in Forcepoint | — | 343 | — | ||||||||
Other | (5 | ) | (3 | ) | (2 | ) | |||||
Net cash provided by (used in) financing activities | (1,930 | ) | (1,509 | ) | (936 | ) | |||||
Net increase (decrease) in cash and cash equivalents | 975 | (894 | ) | (74 | ) | ||||||
Cash and cash equivalents at beginning of year | 2,328 | 3,222 | 3,296 | ||||||||
Cash and cash equivalents at end of year | $ | 3,303 | $ | 2,328 | $ | 3,222 | |||||
The accompanying notes are an integral part of the consolidated financial statements.
82
Note 1: Summary of Significant Accounting Policies
Consolidation and Classification—The consolidated financial statements include the accounts of Raytheon Company, and all wholly-owned, majority-owned and otherwise controlled domestic and foreign subsidiaries. All intercompany transactions have been eliminated. For classification of certain current assets and liabilities, we use the duration of the related contract or program as our operating cycle, which is generally longer than one year. As used in these notes, the terms “we”, “us”, “our”, “Raytheon” and the “Company” mean Raytheon Company and its subsidiaries, unless the context indicates another meaning.
Use of Estimates—Our consolidated financial statements are based on the application of U.S. Generally Accepted Accounting Principles (GAAP), which require us to make estimates and assumptions about future events that affect the amounts reported in our consolidated financial statements and the accompanying notes. Future events and their effects cannot be determined with certainty. Therefore, the determination of estimates requires the exercise of judgment. Actual results could differ from those estimates, and any such differences may be material to our consolidated financial statements.
Revenue Recognition—We use the percentage-of-completion accounting method to account for our long-term contracts associated with the design, development, manufacture, or modification of complex aerospace or electronic equipment and related services, such as certain cost-plus service contracts. Under this method, revenue is recognized based on the extent of progress toward completion of the long-term contract. Our analysis of these contracts also contemplates whether contracts should be combined or segmented in accordance with the applicable criteria under U.S. GAAP. We combine closely related contracts when all the applicable criteria under U.S. GAAP are met. The combination of two or more contracts requires judgment in determining whether the intent of entering into the contracts was effectively to enter into a single project, which should be combined to reflect an overall profit rate. Similarly, we may segment a project, which may consist of a single contract or group of contracts, with varying rates of profitability, only if the applicable criteria under U.S. GAAP are met. Judgment also is involved in determining whether a single contract or group of contracts may be segmented based on how the arrangement was negotiated and the performance criteria. The decision to combine a group of contracts or segment a contract could change the amount of revenue and gross profit recorded in a given period.
The selection of a method to measure progress toward completion of a contract also requires judgment and is based on the nature of the products or services to be provided. We generally use the cost-to-cost measure of progress for our long-term contracts unless we believe another method more clearly measures progress toward completion of the contract. Under the cost-to-cost measure of progress, the extent of progress toward completion is measured based on the ratio of costs incurred to date to the total estimated costs at completion of the contract. Contract costs include labor, materials and subcontractors costs, as well as an allocation of indirect costs. Revenues, including estimated fees or profits, are recorded as costs are incurred. Due to the nature of the work required to be performed on many of our contracts, the estimation of total revenue and cost at completion (the process for which we describe below in more detail) is complex and subject to many variables. Incentive and award fees generally are awarded at the discretion of the customer or upon achievement of certain program milestones or cost targets. Incentive and award fees, as well as penalties related to contract performance, are considered in estimating profit rates. Estimates of award fees are based on actual awards and anticipated performance, which may include the performance of subcontractors or partners depending on the individual contract requirements. Such incentives and penalties are recorded when there is sufficient information for us to assess anticipated performance. Incentive provisions that increase or decrease earnings based solely on a single significant event generally are not recognized until the event occurs. Our claims on contracts are recorded only if it is probable that the claim will result in additional contract revenue and the amounts can be reliably estimated.
We have a companywide standard and disciplined quarterly Estimate at Completion (EAC) process in which management reviews the progress and performance of our contracts. As part of this process, management reviews information including, but not limited to, any outstanding key contract matters, progress toward completion and the related program schedule, identified risks and opportunities, and the related changes in estimates of revenues and costs. The risks and opportunities include management's judgment about the ability and cost to achieve the schedule (e.g., the number and type of milestone events), technical requirements (e.g., a newly-developed product versus a mature product) and other contract requirements. Management must make assumptions and estimates regarding labor productivity and availability, the complexity of the work to be performed, the availability of materials, the length of time to complete the contract (e.g., to estimate increases in wages and prices for materials and related support cost allocations), performance by our subcontractors, the availability and timing of funding from our customer, and overhead cost rates, among other variables. These estimates also include the estimated
83
cost of satisfying our industrial cooperation agreements, sometimes referred to as offset obligations, required under certain contracts. Based on this analysis, any quarterly adjustments to net sales, cost of sales and the related impact to operating income are recognized as necessary in the period they become known. These adjustments may result from positive program performance, and may result in an increase in operating income during the performance of individual contracts, if we determine we will be successful in mitigating risks surrounding the technical, schedule, and cost aspects of those contracts or in realizing related opportunities. Likewise, these adjustments may result in a decrease in operating income if we determine we will not be successful in mitigating these risks or in realizing related opportunities. Changes in estimates of net sales, cost of sales, and the related impact to operating income are recognized quarterly on a cumulative catch-up basis, which recognizes in the current period the cumulative effect of the changes on current and prior periods based on a contract's percentage of completion. A significant change in one or more of these estimates could affect the profitability of one or more of our contracts. When estimates of total costs to be incurred on a contract exceed total estimates of revenue to be earned, a provision for the entire loss on the contract is recognized in the period the loss is determined.
Net EAC adjustments had the following impact on our operating results:
(In millions, except per share amounts) | 2016 | 2015 | 2014 | ||||||||
Operating income | $ | 401 | $ | 371 | $ | 513 | |||||
Income from continuing operations attributable to Raytheon Company | 272 | 241 | 333 | ||||||||
Diluted earnings per share (EPS) from continuing operations attributable to Raytheon Company | $ | 0.92 | $ | 0.79 | $ | 1.07 | |||||
We apply the separation guidance under U.S. GAAP for contracts with multiple deliverables. We analyze revenue arrangements with multiple deliverables to determine if the deliverables should be divided into more than one unit of accounting. For contracts with more than one unit of accounting, we allocate the consideration we receive among the separate units of accounting based on their relative selling prices, which we determine based on prices of the deliverables as sold on a stand-alone basis, or if not sold on a stand-alone basis, the prices we would charge if sold on a stand-alone basis. We recognize revenue for each deliverable based on the revenue recognition policies described herein.
We recognize revenue on contracts to sell software when evidence of an arrangement exists, the software has been delivered and accepted by the customer, the fee is fixed or determinable, and collection is probable. For software arrangements that include multiple elements, including perpetual software licenses and undelivered items (e.g., maintenance and/or services; subscriptions/term licenses), we allocate and defer revenue for the undelivered items based on vendor specific objective evidence (VSOE) of the fair value of the undelivered elements, and recognize revenue on the perpetual license using the residual method. We base VSOE of each element on the price for which the undelivered element is sold separately. We determine fair value of the undelivered elements based on historical evidence of our stand-alone sales of these elements to third parties or from the stated renewal rate for the undelivered elements. When VSOE does not exist for undelivered items, we recognize the entire arrangement fee ratably over the applicable performance period. We also sell software via subscriptions and hosted solutions and revenue for these arrangements is recognized straight-line over the term of the agreement. A portion of our revenues are generated from the sale of appliances that contain software components, such as operating systems, that operate together with the hardware platform to provide the essential functionality of the appliance. When sold in a multiple element arrangement, these appliances are considered non-software deliverables and therefore, we allocate the arrangement fee based upon relative selling price of each element. When applying the relative selling price method, we determine the selling price of each element using best estimate of selling price (BESP), when VSOE and third-party evidence (TPE) are not available. We estimate BESP by considering internal factors such as historical pricing practices and gross margin objectives, as well as market conditions such as competitor pricing strategies, customer demands and geography, and regularly review these assumptions. The revenues allocated to the software-related elements are recognized based on software industry specific revenue recognition guidance, as noted above. The revenues allocated to the non-software related elements are recognized based on the nature of the element provided.
To a much lesser extent, we enter into other types of contracts such as service, commercial and licensing arrangements. Revenue under fixed-price service contracts not associated with the design, development, manufacture, or modification of complex aerospace or electronic equipment, and under commercial contracts, generally is recognized upon delivery or as services are rendered once persuasive evidence of an arrangement exists, our price is fixed or determinable, and collectability is reasonably assured. Costs on fixed-price service contracts are expensed as incurred, unless they otherwise qualify for
84
deferral. Revenue from non-software license fees is recognized over the expected life of the continued involvement with the customer. Additionally, royalty revenue is recognized when earned.
Research and Development Expenses—Research and development expenses are included in general and administrative expenses in our consolidated statements of operations. Expenditures for Company-sponsored research and development projects are expensed as incurred, and were $755 million, $706 million and $500 million in 2016, 2015 and 2014, respectively. Customer-sponsored research and development projects performed under contracts are accounted for as contract costs as the work is performed and included in contracts in process, net, in our consolidated balance sheets.
Federal, Foreign and State Income Taxes—The Company and its domestic subsidiaries provide for federal income taxes on pretax accounting income at rates in effect under existing tax law. Foreign subsidiaries record provisions for income taxes at applicable foreign tax rates in a similar manner. Such provisions differ from the amounts currently payable because certain items of income and expense are recognized in different time periods for financial reporting purposes than for income tax purposes. The Company does not provide for a U.S. income tax liability on undistributed earnings of our foreign subsidiaries. Such earnings are indefinitely reinvested in foreign operations or expected to be remitted substantially free of additional tax. With the exception of Forcepoint, payments made for state income taxes are included in administrative and selling expenses as these costs can generally be recovered through the pricing of products and services to the U.S. government in the period in which the tax is payable. Accordingly, the state income tax provision (benefit) is allocated to contracts in future periods as described below in Deferred Contract Costs. Payments made for state income taxes related to Forcepoint are included in federal and foreign income tax expense.
Other Expense (Income), Net—Other expense (income), net, consists primarily of gains and losses from our investments held in trusts used to fund certain of our non-qualified deferred compensation plans, gains and losses on the early repurchase of long-term debt and certain financing fees. Periodically we enter into equity method or other investments that are not related to our core operations, including early stage technology companies. We record the income or loss from these investments as a component of other (income) expense, net. We record losses beyond the carrying amount of the investment only when we guarantee obligations of the investee or commit to provide the investee further financial support.
Cash and Cash Equivalents—Cash and cash equivalents consist of cash and highly liquid investments with original maturities of 90 days or less at the date of purchase. The estimated fair value of cash and cash equivalents approximates the carrying value due to their short maturities.
Short-term Investments—We invest in marketable securities in accordance with our short-term investment policy and cash management strategy. These marketable securities are classified as available-for-sale and are recorded at fair value as short-term investments in our consolidated balance sheets. These investments are deemed Level 2 assets under the fair value hierarchy at December 31, 2016 and December 31, 2015, as their fair value is determined under a market approach using valuation models that utilize observable inputs, including maturity date, issue date, settlements date and current rates. At December 31, 2016 and December 31, 2015, we had short-term investments of $100 million and $872 million, respectively, consisting of highly rated bank certificates of deposit with a minimum long-term debt rating of A or A2 and a minimum short-term debt rating of A-1 and P-1. As of December 31, 2016, our short-term investments had an average maturity of approximately two months. The amortized cost of these securities closely approximated their fair value at December 31, 2016 and December 31, 2015. There were no securities deemed to have other than temporary declines in value for 2016. In 2016, we recorded unrealized losses on short-term investments of less than $1 million, net of tax, in accumulated other comprehensive loss (AOCL). In 2015, we recorded unrealized gains on short-term investments of less than $1 million, net of tax, in AOCL. In 2016, we did not have any sales of short-term investments. In 2015, we recorded sales of short-term investments of $209 million, which resulted in gains of less than $1 million recorded in other (income) expense, net. For purposes of computing realized gains and losses on available-for-sale securities, we determine cost on a specific identification basis.
Contracts in Process, Net—Contracts in process, net, are stated at cost-plus estimated profit, but not in excess of estimated realizable value. Included in contracts in process, net are accounts receivable, which include amounts billed and due from customers. We maintain an allowance for doubtful accounts to provide for the estimated amount of accounts receivable that will not be collected. The allowance is based upon an assessment of customer creditworthiness, historical payment experience, the age of outstanding receivables and collateral to the extent applicable.
85
Deferred Contract Costs—Included in contracts in process, net, are certain costs related to the performance of our U.S. government contracts which are required to be recorded under U.S. GAAP but are not currently allocable to contracts. Such costs are deferred and primarily include a portion of our environmental expenses, asset retirement obligations, certain restructuring costs, deferred state income taxes, workers’ compensation and certain other accruals. At December 31, 2016 and December 31, 2015, net deferred contract costs were approximately $211 million and $241 million, respectively. These costs are allocated to contracts when they are paid or otherwise agreed. We regularly assess the probability of recovery of these costs. This assessment requires us to make assumptions about the extent of cost recovery under our contracts and the amount of future contract activity. If the level of backlog in the future does not support the continued deferral of these costs, the profitability of our remaining contracts could be adversely affected.
Pension and other postretirement benefits (PRB) costs are allocated to our contracts as allowed costs based on the U.S. government Cost Accounting Standards (CAS). The CAS requirements for pension and PRB costs differ from the Financial Accounting Standards (FAS) requirements under U.S. GAAP. Given the inability to match with reasonable certainty individual expense and income items between the CAS and FAS requirements to determine specific recoverability, we have not estimated the incremental FAS income or expense to be recoverable under our expected future contract activity, and therefore did not defer any FAS expense for pension and PRB plans in 2014 through 2016. This resulted in $435 million of income, $185 million of income and $286 million of income in 2016, 2015 and 2014, respectively, reflected in our consolidated results of operations for the difference between CAS and FAS requirements for our pension and PRB plans in those years.
Inventories—Inventories are stated at the lower of its cost (first-in, first-out or average cost) or net realizable value. An impairment for excess or inactive inventory is recorded based upon an analysis that considers current inventory levels, historical usage patterns, future sales expectations and salvage value.
Inventories consisted of the following at December 31:
(In millions) | 2016 | 2015 | |||||
Materials and purchased parts | $ | 66 | $ | 69 | |||
Work in process | 583 | 551 | |||||
Finished goods | 10 | 15 | |||||
Total | $ | 659 | $ | 635 | |||
We capitalize costs incurred in advance of contract award or funding in inventories if we determine that contract award or funding is probable. To the extent these are precontract costs, start-up costs have been excluded. We included capitalized precontract costs and other deferred costs of $211 million and $225 million in inventories as work in process at December 31, 2016 and December 31, 2015.
Property, Plant and Equipment, Net—Property, plant and equipment, net, are stated at cost less accumulated depreciation. Major improvements are capitalized while expenditures for maintenance, repairs and minor improvements are expensed. We include gains and losses on the sales of plant and equipment that are allocable to our contracts in overhead as we generally can recover these costs through the pricing of products and services to the U.S. government. For all other sales or asset retirements, the assets and related accumulated depreciation and amortization are eliminated from the accounts, and any resulting gain or loss is reflected in operating income.
Provisions for depreciation generally are computed using a combination of accelerated and straight-line methods and are based on estimated useful lives as follows:
Years | |
Machinery and equipment | 3–10 |
Buildings | 20–45 |
Leasehold improvements are amortized over the lesser of the remaining lease term or the estimated useful life of the improvement.
86
Impairment of Goodwill and Long-lived Assets—We evaluate our goodwill for impairment annually or whenever events or circumstances indicate that the carrying value of goodwill may not be recoverable. We perform our annual impairment test as of the first day of the fourth quarter utilizing a two-step methodology that requires us to first identify potential goodwill impairment and then measure the amount of the related goodwill impairment loss, if any. We have identified our operating segments as reporting units under the impairment test assessment criteria outlined in U.S. GAAP. In performing our annual impairment test in the fourth quarters of 2016, 2015 and 2014 we did not identify any goodwill impairment.
We determine whether long-lived assets are to be held for use or disposal. Upon indication of possible impairment of long-lived assets held for use, we evaluate the recoverability of such assets by measuring the carrying amount of the assets against the related estimated undiscounted future cash flows. When an evaluation indicates that the future undiscounted cash flows are not sufficient to recover the carrying value of the asset, the asset is adjusted to its estimated fair value. In order for long-lived assets to be considered held for disposal, we must have committed to a plan to dispose of the assets. Once deemed held for disposal, the assets are stated at the lower of the carrying amount or fair value.
Computer Software, Net—Internal use computer software, net, included in other assets, net, which consists primarily of our enterprisewide software solutions, is stated at cost less accumulated amortization and is amortized using the straight-line method over its estimated useful life, generally 10 years. Computer software development costs related to software products developed for external use are capitalized, when significant, after establishment of technological feasibility and marketability. There have been no such costs capitalized to date as the costs incurred during the period between technological feasibility to general release have not been significant.
Advance Payments and Billings in Excess of Costs Incurred—We receive advances, performance-based payments and progress payments from customers that may exceed costs incurred on certain contracts. We classify advance payments and billings in excess of costs incurred as current liabilities. Costs incurred in excess of billings are classified as contracts in process, net.
Deferred Revenue—We receive up-front payments related to software license sales primarily for Forcepoint, which we recognize ratably over the license term. We classify deferred revenue as current and noncurrent based on the timing of when we expect to recognize revenue. The current and noncurrent portions of deferred revenue are included in other current liabilities and accrued retiree benefits and other long-term liabilities, respectively, in our consolidated balance sheets.
Redeemable Noncontrolling Interest—Redeemable noncontrolling interest is recognized at the greater of the estimated redemption value as of the balance sheet date or the initial value adjusted for the noncontrolling interest holder's share of the cumulative impact of net income (loss) and other changes in accumulated other comprehensive income (loss). Adjustments to the redemption value over the period from the date of acquisition to the date the redemption feature becomes puttable, and the related tax impact, are immediately recorded to retained earnings. We reflect the redemption value adjustments in the EPS calculation if redemption value is in excess of the fair value of noncontrolling interest which resulted in a $0.01 unfavorable impact to both basic and diluted EPS in 2016.
Other Comprehensive Income (Loss)—Other comprehensive income (loss) includes gains and losses associated with pension and PRB, foreign exchange translation adjustments, the effective portion of gains and losses on derivative instruments qualified as cash flow hedges, and unrealized gains (losses) on available-for-sale investments. The computation of other comprehensive income (loss) and its components are presented in the consolidated statements of comprehensive income.
87
A rollforward of Accumulated other comprehensive income (loss) was as follows:
Pension and PRB plans, net(1) | Foreign exchange translation | Cash flow hedges(2) | Unrealized gains (losses) on investments and other, net(3) | Total | |||||||||||||||
(In millions) | |||||||||||||||||||
Balance at December 31, 2013 | $ | (5,143 | ) | $ | 47 | $ | (8 | ) | $ | (9 | ) | $ | (5,113 | ) | |||||
Before tax amount | (3,514 | ) | (50 | ) | (10 | ) | 1 | (3,573 | ) | ||||||||||
Tax (expense) benefit | 1,225 | — | 4 | (1 | ) | 1,228 | |||||||||||||
Net of tax amount | (2,289 | ) | (50 | ) | (6 | ) | — | (2,345 | ) | ||||||||||
Balance at December 31, 2014 | (7,432 | ) | (3 | ) | (14 | ) | (9 | ) | (7,458 | ) | |||||||||
Before tax amount | 525 | (57 | ) | (4 | ) | (5 | ) | 459 | |||||||||||
Tax (expense) benefit | (181 | ) | — | 2 | 2 | (177 | ) | ||||||||||||
Net of tax amount | 344 | (57 | ) | (2 | ) | (3 | ) | 282 | |||||||||||
Balance at December 31, 2015 | (7,088 | ) | (60 | ) | (16 | ) | (12 | ) | (7,176 | ) | |||||||||
Before tax amount | (203 | ) | (115 | ) | 25 | 15 | (278 | ) | |||||||||||
Tax (expense) benefit | 57 | — | (9 | ) | (5 | ) | 43 | ||||||||||||
Net of tax amount | (146 | ) | (115 | ) | 16 | 10 | (235 | ) | |||||||||||
Balance at December 31, 2016 | $ | (7,234 | ) | $ | (175 | ) | $ | — | $ | (2 | ) | $ | (7,411 | ) | |||||
(1) | The pension and PRB plans, net, is shown net of tax benefits of $3,881 million and $3,824 million at December 31, 2016 and December 31, 2015, respectively. |
(2) | The cash flow hedges are shown net of tax benefits of $1 million and $10 million at December 31, 2016 and December 31, 2015, respectively. |
(3) | The unrealized gains (losses) on investments and other, net, are shown net of tax expense of $1 million and tax benefit of $4 million at December 31, 2016 and December 31, 2015, respectively. |
Material amounts reclassified out of AOCL were related to amortization of net actuarial loss associated with our pension and PRB plans and were $1,002 million, $1,129 million and $892 million before tax in 2016, 2015 and 2014, respectively. This component of AOCL is included in the calculation of net periodic pension expense (income) (see "Note 15: Pension and Other Employee Benefits" for additional details).
We expect less than $1 million of after-tax net unrealized gains on our cash flow hedges at December 31, 2016 to be reclassified into earnings at then-current values over the next twelve months as the underlying hedged transactions occur.
Translation of Foreign Currencies—Assets and liabilities of foreign subsidiaries are translated at current exchange rates and the effects of these translation adjustments are reported as a component of AOCL in equity. Deferred taxes are not recognized for translation-related temporary differences of foreign subsidiaries as their undistributed earnings are considered to be indefinitely reinvested. Income and expenses in foreign currencies are translated at the average exchange rate during the period.
Foreign exchange transaction gains and losses in 2016, 2015 and 2014 were not material.
Treasury Stock—Repurchased shares are retired immediately upon repurchase. We account for treasury stock under the cost method. Upon retirement the excess over par value is charged against additional paid-in capital until reduced to zero, with the remainder recorded as a reduction to retained earnings.
Pension and Other Postretirement Benefits (PRB) Costs—We have pension plans covering the majority of our employees hired before January 1, 2007, including certain employees in foreign countries. We calculate our pension costs as required under U.S. GAAP, and the calculations and assumptions utilized require judgment. U.S. GAAP outlines the methodology used to determine pension expense or income for financial reporting purposes. For purposes of determining pension expense under U.S. GAAP, a calculated “market-related value” of our plan assets is used to develop the amount of deferred asset gains or losses to be amortized. The market-related value of assets is determined using actual asset gains or losses over a three year period. Under U.S. GAAP, a “corridor” approach may be elected and applied in the recognition of asset and liability gains or losses which limits expense recognition to the net outstanding gains and losses in excess of the greater of 10% of the projected
88
benefit obligation or the calculated "market-related value" of assets. We do not use a “corridor” approach in the calculation of FAS expense.
We recognize the funded status of a postretirement benefit plan (defined benefit pension and other benefits) as an asset or liability in our consolidated balance sheets. Funded status represents the difference between the projected benefit obligation of the plan and the market value of the plan’s assets. Previously unrecognized deferred amounts such as demographic or asset gains or losses and the impact of historical plan changes are included in AOCL. Changes in these amounts in future years will be reflected through AOCL and amortized in future pension expense over the estimated average remaining employee service period.
Derivative Financial Instruments—We enter into foreign currency forward contracts with commercial banks to fix the foreign currency exchange rates on specific commitments, payments and receipts. Our foreign currency forward contracts are transaction driven and relate directly to a particular asset, liability or transaction for which commitments are in place. We execute these instruments with financial institutions that we judge to be credit-worthy, and the majority of our foreign currency forward contracts are denominated in currencies of major industrial countries. We do not hold or issue derivative financial instruments for trading or speculative purposes.
For foreign currency forward contracts designated and qualified for cash flow hedge accounting, we record the effective portion of the gain or loss on the derivative in AOCL, net of tax, and reclassify it into earnings in the same period or periods during which the hedged revenue or cost of sales transaction affects earnings. We classify the cash flows from these instruments in the same category as the cash flows from the hedged items. The aggregate notional amount of the outstanding foreign currency forward contracts was $1,277 million and $1,076 million at December 31, 2016 and December 31, 2015, respectively. The net notional exposure of these contracts was approximately $342 million and $117 million at December 31, 2016 and December 31, 2015, respectively. The foreign currency forward contracts at December 31, 2016 have maturities at various dates through 2028 as follows: $901 million in 2017; $258 million in 2018; $75 million in 2019; and $43 million thereafter.
We recognize all derivative financial instruments as either assets or liabilities at fair value in our consolidated balance sheets. The fair value of asset derivatives included in other assets, net and liability derivatives included in other current liabilities in our consolidated balance sheets related to foreign currency contracts were $53 million and $48 million, respectively at December 31, 2016 and $9 million and $29 million, respectively at December 31, 2015. The fair values of these derivatives are Level 2 in the fair value hierarchy for 2016 and 2015 because they are determined based on a market approach utilizing externally quoted forward rates for similar contracts. We measure and record the impact of counterparty credit risk into our valuation and the impact was less than $1 million for the years ended December 31, 2016 and 2015. We designate most foreign currency forward contracts as cash flow hedges of forecasted purchases and sales denominated in foreign currencies, and interest rate swaps as fair value hedges of our fixed-rate financing obligations.
Realized gains and losses resulting from these cash flow hedges offset the foreign exchange gains and losses on the underlying transactions being hedged. Gains and losses on derivatives not designated for hedge accounting or representing either hedge ineffectiveness or hedge components excluded from the assessment of effectiveness are recognized currently in net sales or cost of sales.
We may also enter into pay-variable, receive-fixed interest rate swaps to manage interest rate risk associated with our fixed-rate financing obligations. We account for our interest rate swaps as fair value hedges of a portion of our fixed-rate financing obligations, and accordingly record gains and losses from changes in the fair value of these swaps in interest expense, along with the offsetting gains and losses on the fair value adjustment of the hedged portion of our fixed-rate financing obligations. We also record in interest expense the net amount paid or received under the swap for the period and the amortization of gain or loss from the early termination of interest rate swaps. There were no interest rate swaps outstanding at December 31, 2016 and December 31, 2015.
Fair Values—The accounting standard for fair value measurements provides a framework for measuring fair value and requires expanded disclosures regarding fair value measurements. Fair value is defined as the price that would be received for an asset or the exit price that would be paid to transfer a liability in the principal or most advantageous market in an orderly transaction between market participants on the measurement date. This accounting standard established a fair value hierarchy, which
89
requires an entity to maximize the use of observable inputs, where available. The following summarizes the three levels of inputs required:
Level 1: | Quoted prices in active markets for identical assets or liabilities. |
Level 2: | Observable inputs, other than Level 1 prices, such as quoted prices for similar assets or liabilities; quoted prices in markets that are not active; or other inputs that are observable or that we corroborate with observable market data for substantially the full term of the related assets or liabilities. |
Level 3: | Unobservable inputs supported by little or no market activity that are significant to the fair value of the assets or liabilities. |
Assets and liabilities measured at fair value on a recurring basis consisted of marketable securities held in trust, short-term investments and foreign currency forward contracts as of December 31, 2016 and 2015. Fair value information for those assets and liabilities, including their classification in the fair value hierarchy, is included in "Note 15: Pension and Other Employee Benefits" (for marketable securities held in trust) and "Note 1: Summary of Significant Accounting Policies" (for short-term investments and foreign currency forward contracts). Certain investments that are measured at fair value using the net asset value per share (or its equivalent) practical expedient have not been classified in the fair value hierarchy. We did not have any significant nonfinancial assets or nonfinancial liabilities that would be recognized or disclosed at fair value on a recurring basis as of December 31, 2016 and 2015. We did not have any material amounts of Level 3 assets or liabilities at December 31, 2016 and 2015.
Earnings per Share (EPS)—We compute basic EPS attributable to Raytheon Company common stockholders by dividing income from continuing operations attributable to Raytheon Company common stockholders, income (loss) from discontinued operations attributable to Raytheon Company common stockholders, and net income attributable to Raytheon Company, by our weighted-average common shares outstanding, including participating securities outstanding, as described below, during the period. Diluted EPS reflects the potential dilution beyond shares for basic EPS that could occur if securities or other contracts to issue common stock were exercised, converted into common stock, or resulted in the issuance of common stock that would have shared in our earnings. We compute basic and diluted EPS using actual income from continuing operations attributable to Raytheon Company common stockholders, income (loss) from discontinued operations attributable to Raytheon Company common stockholders, net income attributable to Raytheon Company, and our actual weighted-average shares outstanding rather than the numbers presented within our consolidated financial statements, which are rounded to the nearest million. As a result, it may not be possible to recalculate EPS as presented in our consolidated financial statements. Furthermore, it may not be possible to recalculate EPS attributable to Raytheon Company common stockholders by adjusting EPS from continuing operations by EPS from discontinued operations.
We include all unvested stock awards that contain non-forfeitable rights to dividends or dividend equivalents, whether paid or unpaid, in the number of shares outstanding in our basic and diluted EPS calculations as they are considered participating securities. As a result, we have included all of our outstanding unvested restricted stock awards (RSAs), as well as restricted stock units (RSUs) and Long-term Performance Plan (LTPP) awards that meet the retirement eligible criteria in our calculation of basic and diluted EPS. We disclose EPS for common stock and unvested stock-based payment awards, and separately disclose distributed and undistributed earnings. Distributed earnings represent common stock dividends and dividends earned on unvested RSAs and stock-based payment awards of retirement eligible employees. Undistributed earnings represent earnings that were available for distribution but were not distributed. Common stock and unvested stock-based payment awards earn dividends equally. We reflect the redemption value adjustments for redeemable noncontrolling interests in both the basic and diluted EPS calculation if redemption value is in excess of the fair value of noncontrolling interest.
Employee Stock Plans—Stock-based compensation cost is measured at the grant date based on the calculated fair value of the award. The expense is recognized over the employees’ requisite service period, generally the vesting period of the award. The expense is amortized over the service period using the graded vesting method for our RSAs and RSUs and the straight-line amortization method for our LTPP. The expense related to our Forcepoint long-term incentive plans is recognized over the requisite service period when achievement of the performance conditions is considered probable. Prior to the adoption of Accounting Standards Update (ASU) 2016-09, Compensation - Stock Compensation (Topic 718), the related gross excess tax benefit received upon exercise of stock options or vesting of a stock-based award, if any, was reflected in the consolidated statements of cash flows as a financing activity rather than an operating activity. Upon adoption of the new standard in 2016,
90
the gross excess tax benefit received upon exercise of stock options or vesting of a stock-based award, if any, is now reflected in the consolidated statements of cash flows as an operating activity.
Risks and Uncertainties—We provide a wide range of technologically advanced products, services and solutions for principally governmental customers in the U.S. and abroad, and are subject to certain business risks specific to that industry. Total sales to the U.S. government, excluding foreign military sales, were 67%, 68% and 70% of total net sales in 2016, 2015 and 2014, respectively. Total sales to customers outside the U.S., including foreign military sales through the U.S. government, were 31% of total net sales in 2016 and 2015 and 29% of total net sales in 2014. Sales to the U.S. government may be affected by changes in procurement policies, budget considerations, changing concepts of national defense, political developments abroad and other factors. Sales to international customers may be affected by changes in the priorities and budgets of international customers, which may be driven by changes in threat environments, geopolitical uncertainties, potentially volatile worldwide economic conditions, various regional and local economic and political factors, risks and uncertainties and U.S. foreign policy.
Accounting Standards—In May 2014, the Financial Accounting Standards Board (FASB) issued Accounting Standards Update (ASU) 2014-09, Revenue from Contracts with Customers (Topic 606), which will replace numerous requirements in U.S. GAAP, including industry-specific requirements, and provide companies with a single revenue recognition model for recognizing revenue from contracts with customers. The core principle of the new standard is that a company should recognize revenue to depict the transfer of promised goods or services to customers in an amount that reflects the consideration to which the company expects to be entitled in exchange for those goods or services. The two permitted transition methods under the new standard are the full retrospective method, in which case the standard would be applied to each prior reporting period presented and the cumulative effect of applying the standard would be recognized at the earliest period shown, or the modified retrospective method, in which case the cumulative effect of applying the standard would be recognized at the date of initial application. In July 2015, the FASB approved the deferral of the new standard's effective date by one year. The new standard is effective for annual reporting periods beginning after December 15, 2017. The FASB will permit companies to adopt the new standard early, but not before the original effective date of annual reporting periods beginning after December 15, 2016.
In 2014, we established a cross-functional implementation team consisting of representatives from across all of our business segments. We utilized a bottom-up approach to analyze the impact of the standard on our contract portfolio by reviewing our current accounting policies and practices to identify potential differences that would result from applying the requirements of the new standard to our revenue contracts. In addition, we identified and implemented appropriate changes to our business processes, systems and controls to support recognition and disclosure under the new standard. The implementation team has reported the findings and progress of the project to management and the Audit Committee on a frequent basis over the last two years.
We have been closely monitoring FASB activity related to the new standard, as well as working with various non-authoritative groups to conclude on specific interpretative issues. In the first half of 2016, we made significant progress toward completing our evaluation of the potential changes from adopting the new standard on our future financial reporting and disclosures. Our progress was aided by the FASB issuing ASU 2016-10, Identifying Performance Obligations and Licensing, which amended the current guidance on performance obligations and provided additional clarity on this topic, and the significant progress of the non-authoritative groups in concluding on specific interpretative issues. In the second half of 2016, we finalized our contract reviews and detailed policy drafting. Based on our evaluation, we will early adopt the requirements of the new standard in the first quarter of 2017 and will used the full retrospective transition method.
The impact of adopting the new standard on our 2015 and 2016 total net sales and operating income is not material. The immaterial impact of adopting Topic 606 primarily relates to the deferral of commissions on our commercial software arrangements, which previously were expensed as incurred but under the new standard will generally be capitalized and amortized over the period of contract performance or a longer period if renewals are expected and the renewal commission is not commensurate with the initial commission, and policy changes related to the recognition of revenue and costs on our defense and commercial software contracts to better align our policies with the new standard, which may impact the timing of revenue. The impact to our results is not material because the analysis of our contracts under the new revenue recognition standard supports the recognition of revenue over time under the cost-to-cost method for the majority of our contracts, which is consistent with our current revenue recognition model. Revenue on the majority of our contracts will continue to be recognized over time because of the continuous transfer of control to the customer. For U.S. government contracts, this continuous transfer of control to the customer is supported by clauses in the contract that allow the customer to unilaterally
91
terminate the contract for convenience, pay us for costs incurred plus a reasonable profit and take control of any work in process. Similarly, for non-U.S. government contracts, the customer typically controls the work in process as evidenced either by contractual termination clauses or by our rights to payment for work performed to date to deliver products or services that do not have an alternative use to the company. Under the new standard, the cost-to-cost measure of progress continues to best depict the transfer of control of assets to the customer, which occurs as we incur costs. In addition, the number of our performance obligations under the new standard is not materially different from our contract segments under the existing standard. Lastly, the accounting for the estimate of variable consideration is not materially different compared to our current practice.
We also do not expect the standard to have a material impact on our consolidated balance sheet. The immaterial impact primarily relates to reclassifications among financial statement accounts to align with the new standard. Most notably, contracts in process, net will be reclassified as receivables or contract assets based on amounts billed or unbilled, respectively. Advance payments and billings in excess of costs incurred and deferred revenue will be combined and reclassified as contract liabilities. Our contract balances will be reported in a net contract asset or liability position on a contract-by-contract basis at the end of each reporting period.
In March 2016, the FASB issued ASU 2016-09, Compensation - Stock Compensation (Topic 718): Improvements to Employee Share-Based Payment Accounting, which amends the accounting for employee share-based payment transactions to require recognition of the tax effects resulting from the settlement of stock-based awards as income tax expense or benefit in the income statement in the reporting period in which they occur. In addition, the ASU requires that all tax-related cash flows resulting from share-based payments, including the excess tax benefits related to the settlement of stock-based awards, be classified as cash flows from operating activities in the statement of cash flows. The ASU also requires that cash paid by directly withholding shares for tax withholding purposes be classified as a financing activity in the statement of cash flows. In addition, the ASU allows companies to make an accounting policy election to either estimate the number of awards that are expected to vest, consistent with current U.S. GAAP, or account for forfeitures when they occur. The new standard is effective for annual reporting periods beginning after December 15, 2016 with early adoption permitted. We elected to early adopt the requirements of the amended standard in the first quarter of 2016. In accordance with U.S. GAAP, we adopted the amendment requiring recognition of excess tax benefits and tax deficiencies in the income statement prospectively beginning in the first quarter of 2016, which could result in fluctuations in our effective tax rate period over period depending on how many awards vest in a quarter as well as the volatility of our stock price. In 2016, the impact to our income statement was $47 million, included in federal and foreign income taxes. In addition, we elected to adopt the amendment related to the presentation of excess tax benefits within operating activities on the statement of cash flows prospectively beginning in the first quarter of 2016. We had previously classified cash paid for tax withholding purposes as a financing activity in the statement of cash flows, therefore there is no change related to this requirement. Furthermore, we elected to change our accounting policy to account for forfeitures when they occur for consistency with our government recovery accounting practices on a modified retrospective basis.
In February 2016, the FASB issued ASU 2016-02, Leases (Topic 842), which requires lessees to recognize a right-of-use asset and lease liability for most lease arrangements. The new standard is effective for annual reporting periods beginning after December 15, 2018 with early adoption permitted, and must be adopted using the modified retrospective approach. We are currently evaluating the potential changes from this ASU to our future financial reporting and disclosures. We expect the standard to have an impact of approximately $1 billion on our assets and liabilities for the addition of right-of-use assets and lease liabilities, but we do not expect it to have a material impact to our results of operations or liquidity.
Other new pronouncements issued but not effective until after December 31, 2016 are not expected to have a material impact on our financial position, results of operations or liquidity.
92
Note 2: Earnings Per Share (EPS)
EPS from continuing operations attributable to Raytheon Company common stockholders and unvested stock-based payment awards was as follows:
2016 | 2015 | 2014 | |||||||||
Basic EPS attributable to Raytheon Company common stockholders: | |||||||||||
Distributed earnings | $ | 2.92 | $ | 2.67 | $ | 2.39 | |||||
Undistributed earnings | 4.53 | 4.09 | 4.59 | ||||||||
Total | $ | 7.45 | $ | 6.76 | $ | 6.98 | |||||
Diluted EPS attributable to Raytheon Company common stockholders: | |||||||||||
Distributed earnings | $ | 2.92 | $ | 2.67 | $ | 2.39 | |||||
Undistributed earnings | 4.52 | 4.08 | 4.58 | ||||||||
Total | $ | 7.44 | $ | 6.75 | $ | 6.97 | |||||
Basic and diluted EPS from discontinued operations attributable to Raytheon Company common stockholders and unvested stock-based payment awards were earnings of less than $0.01, $0.04 and $0.21 for 2016, 2015 and 2014, respectively.
Income attributable to participating securities was as follows:
(In millions) | 2016 | 2015 | 2014 | ||||||||
Income from continuing operations attributable to participating securities | $ | 30 | $ | 32 | $ | 39 | |||||
Income (loss) from discontinued operations, net of tax attributable to participating securities(1) | — | — | 1 | ||||||||
Net income attributable to participating securities | $ | 30 | $ | 32 | $ | 40 | |||||
(1) | Income (loss) from discontinued operations, net of tax attributable to participating securities, was income of less than $1 million for 2016 and 2015. |
The weighted-average shares outstanding for basic and diluted EPS were as follows:
(In millions) | 2016 | 2015 | 2014 | |||||
Shares for basic EPS(1) | 296.5 | 304.8 | 312.0 | |||||
Dilutive effect of LTPP, RSUs and stock options(2) | 0.3 | 0.4 | 0.6 | |||||
Shares for diluted EPS | 296.8 | 305.2 | 312.6 | |||||
(1) | Includes participating securities of 4 million, 4.7 million and 5.5 million for 2016, 2015 and 2014, respectively. |
(2) | There were 2 thousand stock options outstanding at December 31, 2014. There were no stock options outstanding at December 31, 2016 or December 31, 2015. |
Our Board of Directors is authorized to issue up to 200 million shares of preferred stock, $0.01 par value per share, in multiple series with terms as determined by them. There were no shares of preferred stock outstanding at December 31, 2016 and December 31, 2015.
Note 3: eBorders Settlement
In March 2015, Raytheon Systems Limited (RSL) reached a settlement with the UK Home Office concluding the parties' dispute regarding the UK Home Office's July 2010 termination of RSL's eBorders contract within our Intelligence, Information and Services (IIS) segment. The settlement included a cash payment from the UK Home Office to RSL of £150 million (approximately $226 million based on foreign exchange rates as of the settlement date) for the resolution of all claims and counterclaims of both parties related to the matter. After certain expenses and derecognition of the outstanding receivables, IIS recorded $181 million in operating income through a reduction in cost of sales in 2015.
Note 4: Acquisitions and Goodwill
In pursuing our business strategies, we acquire and make investments in certain businesses that meet strategic and financial criteria.
93
In January 2016, our Forcepoint business acquired the Stonesoft next-generation firewall (NGFW) business, including the Sidewinder proxy firewall technology. Vista Equity Partners contributed 19.7% of the purchase price, which is reflected in contribution from noncontrolling interest in Forcepoint in our consolidated statements of cash flows. Stonesoft provides NGFW software and hardware solutions that focus on high-availability, centralized management of large networks and protection from advanced evasion techniques. The Sidewinder product provides proxy-based firewall software and hardware solutions, allowing for clear visibility and control of command filtering, protocol enforcement and application access. Stonesoft expands the cloud and hybrid capabilities of Forcepoint. In connection with this acquisition, we have recorded $51 million of goodwill, primarily related to expected synergies from combining operations and the value of the existing workforce, the majority of which is deductible for tax purposes, and $23 million of intangible assets, primarily related to technology and customer relationships, with a weighted-average life of five years.
In October 2015, we acquired Foreground Security, subsequently renamed Raytheon Foreground Security (RFS), for $62 million in cash, net of cash received, and exclusive of retention payments. RFS has been integrated into our IIS business, within the Cybersecurity and Special Missions (CSM) product area. RFS provides security operations centers (SOCs), managed security service solutions and cybersecurity professional services. RFS accelerates Raytheon's expansion into managed security services across federal, international and commercial markets. In connection with this transaction we have recorded $58 million of goodwill related to expected synergies from combining operations and the value of the existing workforce, a portion of which is deductible for tax purposes, and $7 million of intangible assets, primarily related to customer relationships and technology with a weighted-average life of seven years.
In May 2015, we acquired Websense, Inc. (Websense) from Vista Equity Partners for approximately $1.9 billion, net of cash received, and exclusive of retention payments. Following the acquisition, we completed a series of transactions to create our Forcepoint joint venture (with Vista Equity Partners). Forcepoint is a leader in advanced threat protection and data theft prevention across web, email, cloud and endpoint infrastructure. For more information on the Forcepoint joint venture, see "Note 6: Forcepoint Joint Venture". In connection with this acquisition, we incurred transaction and integration-related costs of $33 million in 2015 of which $26 million were recorded at Corporate. We recorded $1.6 billion of goodwill, all of which was allocated to the Forcepoint segment, primarily related to expected synergies from combining operations and the value of the existing workforce, and none of which is expected to be deductible for tax purposes.
The final purchase price allocation, net of cash received, for the Websense acquisition was as follows:
(In millions) | Purchase price allocation | ||
Accounts receivable (at contractually stated amounts) | $ | 38 | |
Other current assets | 21 | ||
Property, plant and equipment | 19 | ||
Goodwill | 1,624 | ||
Intangible assets | 501 | ||
Other noncurrent assets | 16 | ||
Deferred revenue | (225 | ) | |
Current liabilities | (51 | ) | |
Long-term liabilities | (52 | ) | |
Fair value of net assets acquired | $ | 1,891 | |
94
The following were the identifiable intangible assets acquired and the respective estimated periods over which such assets will be amortized:
(In millions, except years) | Gross carrying amount | Weighted-average useful life (in years) | |||
Completed technology | $ | 439 | 7 | ||
Customer relationships | 43 | 13 | |||
Trademarks and other | 19 | 10 | |||
Fair value of intangible assets acquired | $ | 501 | |||
In November 2014, we acquired Blackbird Technologies, Incorporated, subsequently renamed Raytheon Blackbird Technologies (RBT), for $427 million in cash, net of cash received, and exclusive of retention payments. RBT is a leading provider of persistent surveillance, secure tactical communications and cybersecurity solutions to the Intelligence Community and special operations market and further expands our IIS offerings. In connection with this acquisition, we have recorded $300 million of goodwill, all of which was allocated to our IIS business segment and is deductible for tax purposes, primarily related to expected synergies from combining operations and the value of the existing workforce, and $126 million of intangible assets, primarily related to contractual relationships, completed technology and trade names with a weighted-average life of nine years.
Pro forma financial information and revenue from the date of acquisition has not been provided for these acquisitions as they are not material either individually or in the aggregate.
We funded each of the above acquisitions using cash on hand. The operating results of these businesses have been included in our consolidated results as of the respective closing dates of the acquisitions. The purchase price of these businesses has been allocated to the estimated fair value of net tangible and intangible assets acquired, with any excess purchase price recorded as goodwill. The total amount of goodwill that is expected to be deductible for tax purposes related to these acquisitions was $318 million at December 31, 2016.
A rollforward of goodwill by segment was as follows:
(In millions) | Integrated Defense Systems(1) | Intelligence, Information and Services(1) | Missile Systems | Space and Airborne Systems | Forcepoint(3)(4) | Total | |||||||||||||||||
Balance at December 31, 2014 | $ | 1,707 | $ | 2,913 | $ | 4,150 | $ | 4,106 | $ | 185 | $ | 13,061 | |||||||||||
Acquisitions(2) | — | 48 | 4 | — | 1,624 | 1,676 | |||||||||||||||||
Effect of foreign exchange rates and other | (3 | ) | (3 | ) | — | — | — | (6 | ) | ||||||||||||||
Balance at December 31, 2015 | 1,704 | 2,958 | 4,154 | 4,106 | 1,809 | 14,731 | |||||||||||||||||
Acquisitions(5) | — | 8 | — | — | 51 | 59 | |||||||||||||||||
Effect of foreign exchange rates and other | (2 | ) | — | — | — | — | (2 | ) | |||||||||||||||
Balance at December 31, 2016 | $ | 1,702 | $ | 2,966 | $ | 4,154 | $ | 4,106 | $ | 1,860 | $ | 14,788 | |||||||||||
(1) | In connection with the January 1, 2016 reorganization of Integrated Defense Systems (IDS) and IIS, goodwill of $90 million was allocated to the IIS segment on a relative fair value basis and is reflected in the revised balances at December 31, 2015. |
(2) | In addition to the acquisitions of Websense and Foreground Security, we acquired Sensintel, Inc. at Missile Systems (MS) and finalized the purchase price allocation for RBT at IIS in 2015. |
(3) | In connection with the reclassification of Raytheon Cyber Products (RCP) from our IIS segment, goodwill of $185 million was allocated to the Forcepoint segment on a relative fair value basis. |
(4) | At December 31, 2016, Forcepoint's fair value is estimated to exceed its net book value by approximately $950 million. As discussed in "Note 6: Forcepoint Joint Venture", we are required to determine Forcepoint's fair value on a quarterly basis due to the accounting related to the redeemable noncontrolling interest. |
(5) | In addition to the acquisition of the Stonesoft NGFW business during the first quarter of 2016, we finalized the purchase price allocation for Foreground Security at IIS, which resulted in an adjustment to goodwill of $8 million. |
For information on our intangible assets, see "Note 10: Other Assets, Net".
95
Note 5: Thales-Raytheon Systems Co. Ltd. (TRS) Joint Venture
In 2001, we formed the TRS joint venture with Thales S.A. The TRS joint venture arrangement involved three operating companies, one of which, Raytheon Command and Control Solutions LLC (RCCS LLC), previously called Thales-Raytheon Systems LLC, we control and consolidate, and the other two, Thales-Raytheon Systems Company S.A.S. (TRS SAS) and Thales-Raytheon Systems Air and Missile Defense Command and Control S.A.S. (TRS AMDC2), which we accounted for using the equity method through our investment in TRS. All are reflected in our IDS segment results.
On December 24, 2015, Thales S.A. and Raytheon entered into a letter agreement relating to the joint venture agreement for the TRS joint venture, which contemplated that the parties would use their commercially reasonable efforts to amend the joint venture agreement on or before June 30, 2016 to reduce its existing scope of work. In the second quarter of 2016, Thales S.A. and Raytheon amended and restated the TRS joint venture agreement to reduce the existing joint venture arrangement to TRS AMDC2 only and limit its scope to NATO-only business opportunities involving air command and control systems, theatre missile defense and ballistic missile defense. Accordingly, TRS AMDC2 continues to be a joint venture between Thales S.A. and Raytheon that is accounted for using the equity method. We record our share of the TRS income or loss and other comprehensive income (loss) as a component of cost of sales and AOCL, respectively. We record losses beyond the carrying amount of the investment only when we guarantee obligations of the investee or commit to provide the investee further financial support. Our equity method investments are included in other noncurrent assets, net and are not material individually or in the aggregate.
The amendment and restatement of the TRS joint venture agreement resulted in Raytheon acquiring Thales S.A.'s noncontrolling interest in RCCS LLC and selling our equity method investment in TRS SAS, resulting in a net cash payment to Thales S.A. of $90 million which was classified as a financing activity in our consolidated statements of cash flows. In the second quarter of 2016, we recorded our acquisition of Thales S.A.'s noncontrolling interest in RCCS LLC at fair value, which resulted in a reduction to equity of $167 million before tax, $205 million after tax, which was subsequently adjusted to $197 million after tax in the fourth quarter of 2016, and the sale of our equity method investment in TRS SAS at fair value, which resulted in a tax-free gain of $158 million that was recorded in operating income through a reduction in cost of sales, consistent with the historical classification of equity method income for TRS SAS, at our IDS segment.
Note 6: Forcepoint Joint Venture
In May 2015, we created Forcepoint, a new cybersecurity joint venture company (with Vista Equity Partners), through a series of transactions by which we acquired Websense from Vista Equity Partners and combined it with RCP, formerly part of our IIS segment. We then sold 19.7% of the equity interest in the combined company to Vista Equity Partners for $343 million.
The joint venture agreement between Raytheon and Vista Equity Partners provides Vista Equity Partners with certain rights to require Forcepoint to pursue an initial public offering at any time after four years and three months following the closing date of May 29, 2015, or pursue a sale of the company at any time after five years following the closing date. In either of these events, Raytheon has the option to purchase all (but not less than all) of Vista Equity Partners’ interest in Forcepoint for cash at a price equal to fair value as determined under the joint venture agreement. Additionally, Vista Equity Partners has the ability to liquidate its ownership through a put option any time after two years following the closing date, which could occur anytime after May 29, 2017. In the event of a put option, Vista Equity Partners could require Raytheon to purchase all (but not less than all) of Vista Equity Partners’ interest in Forcepoint for cash at a price equal to fair value as determined under the joint venture agreement. Lastly, at any time after three years following the closing date, Raytheon has the option to purchase all (but not less than all) of Vista Equity Partners’ interest in Forcepoint at a price equal to fair value as determined under the joint venture agreement. The joint venture agreement provides for the process under which the parties would determine the fair value of the interest and could result in a payment by Raytheon shortly after the exercise of the put option; however, the ultimate timing will depend on the actions of the parties and other factors. Vista Equity Partners' interest in Forcepoint is presented as redeemable noncontrolling interest, outside of stockholders' equity, in our consolidated balance sheets.
The redeemable noncontrolling interest is recognized at the greater of the estimated redemption value as of the balance sheet date, which was $449 million at December 31, 2016, or the carrying value, which was $315 million at December 31, 2016. The estimated redemption value could differ from the parties' determination of fair value for the put option under the joint venture agreement.
96
A rollforward of redeemable noncontrolling interest was as follows:
(In millions) | 2016 | 2015 | |||||
Beginning balance | $ | 355 | $ | — | |||
Sale of noncontrolling interest in Forcepoint | — | 343 | |||||
Net income (loss) | (22 | ) | (17 | ) | |||
Other comprehensive income (loss), net of tax(1) | (1 | ) | — | ||||
Contribution from noncontrolling interest | 11 | — | |||||
Adjustment of noncontrolling interest to redemption value (before tax) | 106 | 29 | |||||
Ending balance | $ | 449 | $ | 355 | |||
(1) | Other comprehensive income (loss), net of tax, was a loss of less than $1 million in 2015. |
Note 7: Discontinued Operations
In pursuing our business strategies we have divested certain non-core businesses, investments and assets when appropriate. All residual activity relating to our previously disposed businesses appears in discontinued operations.
In the second quarter of 2014, we received notice of the resolution of a dispute and related litigation with the U.S. government regarding pension segment closing adjustments under U.S. government Cost Accounting Standard 413 (CAS 413) for operations we divested over ten years ago. Under CAS 413, a pension plan termination adjustment is required when a contractor divests a business, yet retains ownership of the pension plan assets and liabilities of that business. These adjustments can result in payments to the U.S. government for pension plans that are in surplus position or payments to contractors for plans that are in a deficit position. As a result, in 2014 we received payment of $81 million and recorded a $52 million gain, net of federal tax expense, in discontinued operations, attributable to the affected plans that were in a deficit position at the time of divestiture.
Note 8: Contracts in Process, Net
Contracts in process, net, consisted of the following at December 31:
Cost-Type | Fixed-Price | Total | |||||||||||||||||||||
(In millions) | 2016 | 2015 | 2016 | 2015 | 2016 | 2015 | |||||||||||||||||
U.S. government contracts (including foreign military sales): | |||||||||||||||||||||||
Billed | $ | 343 | $ | 432 | $ | 195 | $ | 196 | $ | 538 | $ | 628 | |||||||||||
Unbilled | 990 | 867 | 7,957 | 8,381 | 8,947 | 9,248 | |||||||||||||||||
Progress payments | — | — | (5,608 | ) | (5,752 | ) | (5,608 | ) | (5,752 | ) | |||||||||||||
1,333 | 1,299 | 2,544 | 2,825 | 3,877 | 4,124 | ||||||||||||||||||
Other customers: | |||||||||||||||||||||||
Billed | 19 | 22 | 669 | 524 | 688 | 546 | |||||||||||||||||
Unbilled | 54 | 21 | 1,997 | 1,317 | 2,051 | 1,338 | |||||||||||||||||
Progress payments | — | — | (406 | ) | (439 | ) | (406 | ) | (439 | ) | |||||||||||||
73 | 43 | 2,260 | 1,402 | 2,333 | 1,445 | ||||||||||||||||||
Allowance for doubtful accounts | — | — | (8 | ) | (5 | ) | (8 | ) | (5 | ) | |||||||||||||
Total contracts in process, net | $ | 1,406 | $ | 1,342 | $ | 4,796 | $ | 4,222 | $ | 6,202 | $ | 5,564 | |||||||||||
The U.S. government has title to the assets related to unbilled amounts on contracts that provide progress payments. Unbilled amounts are recorded under the percentage-of-completion method and are recoverable from the customer upon shipment of the product, presentation of billings or completion of the contract. Included in unbilled at December 31, 2016 was $154 million which is expected to be collected outside of one year.
Billed and unbilled contracts in process include retentions arising from contractual provisions. At December 31, 2016, retentions were $72 million. We anticipate collecting $10 million of these retentions in 2017 and the balance thereafter.
97
Note 9: Property, Plant and Equipment, Net
Property, plant and equipment, net, consisted of the following at December 31:
(In millions) | 2016 | 2015 | |||||
Land | $ | 88 | $ | 86 | |||
Buildings and improvements | 2,508 | 2,530 | |||||
Machinery and equipment | 4,198 | 3,917 | |||||
Property, plant and equipment, gross | 6,794 | 6,533 | |||||
Accumulated depreciation and amortization | (4,628 | ) | (4,528 | ) | |||
Total | $ | 2,166 | $ | 2,005 | |||
Depreciation and amortization expense of property, plant and equipment, net, was $316 million, $307 million and $301 million in 2016, 2015 and 2014, respectively.
Note 10: Other Assets, Net
Other assets, net, consisted of the following at December 31:
(In millions) | 2016 | 2015 | |||||
Marketable securities held in trust(1) | $ | 550 | $ | 525 | |||
Computer software, net of accumulated amortization of $1,113 and $1,059 at December 31, 2016 and 2015, respectively | 291 | 294 | |||||
Other intangible assets, net of accumulated amortization of $520 and $402 at December 31, 2016 and 2015, respectively | 598 | 700 | |||||
Other noncurrent assets, net | 228 | 308 | |||||
Deferred tax asset(2) | 753 | 906 | |||||
Total | $ | 2,420 | $ | 2,733 | |||
(1) | For further details, refer to "Note 15: Pension and Other Employee Benefits". |
(2) | For further details, refer to "Note 16: Income Taxes". |
Computer software amortization expense was $68 million, $70 million and $79 million in 2016, 2015 and 2014, respectively.
Other intangible assets, net, consisted primarily of completed technology, intellectual property and acquired customer relationships, and increased $23 million as a result of acquired businesses in 2016. These intangible assets are being amortized over their estimated useful lives which range from 1 to 15 years using either a straight-line or accelerated amortization method based on the pattern of economic benefits we expect to realize from such assets. Amortization expense for other intangible assets was $131 million, $113 million and $58 million in 2016, 2015 and 2014, respectively.
Computer software and other intangible asset amortization expense is expected to be approximately $190 million in 2017, $170 million in 2018, $142 million in 2019, $102 million in 2020 and $75 million in 2021.
98
Note 11: Long-term Debt
Long-term debt consisted of the following at December 31:
(In millions, except percentages) | 2016 | 2015 | |||||
$251 notes due 2018, 6.75% | $ | 251 | $ | 251 | |||
$340 notes due 2018, 6.40% | 339 | 339 | |||||
$500 notes due 2020, 4.40% | 498 | 498 | |||||
$1,000 notes due 2020, 3.125% | 995 | 993 | |||||
$1,100 notes due 2022, 2.50% | 1,094 | 1,093 | |||||
$300 notes due 2024, 3.15% | 297 | 297 | |||||
$382 notes due 2027, 7.20% | 372 | 370 | |||||
$185 notes due 2028, 7.00% | 184 | 184 | |||||
$600 notes due 2040, 4.875% | 591 | 591 | |||||
$425 notes due 2041, 4.70% | 419 | 419 | |||||
$300 notes due 2044, 4.20% | 295 | 295 | |||||
Total debt issued and outstanding | $ | 5,335 | $ | 5,330 | |||
The notes are redeemable by us at any time at redemption prices based on U.S. Treasury rates. The carrying value of long-term debt was recorded at amortized cost. The fair value of long-term debt was determined using quoted prices in inactive markets, which falls within Level 2 of the fair value hierarchy.
The estimated fair value of long-term debt was the following at December 31:
(In millions) | 2016 | 2015 | |||||
Fair value of long-term debt | $ | 5,848 | $ | 5,826 | |||
In the fourth quarter of 2014, we received proceeds of $592 million for the issuance of $600 million fixed-rate long-term debt.
The adjustments to the principal amounts of long-term debt were as follows at December 31:
(In millions) | 2016 | 2015 | |||||
Principal | $ | 5,383 | $ | 5,383 | |||
Unamortized issue discounts | (39 | ) | (43 | ) | |||
Unamortized interest rate lock costs | (9 | ) | (10 | ) | |||
Total | $ | 5,335 | $ | 5,330 | |||
The aggregate amounts of principal payments due on long-term debt for the next five years are:
(In millions) | |||
2017 | $ | — | |
2018 | 591 | ||
2019 | — | ||
2020 | 1,500 | ||
2021 | — | ||
Thereafter | 3,292 | ||
In November 2015, we entered into a $1.25 billion revolving credit facility maturing in November 2020 and terminated the previous $1.4 billion credit facility entered into in December 2011. Under the $1.25 billion credit facility, we can borrow, issue letters of credit and backstop commercial paper. Borrowings under this facility bear interest at various rate options,
99
including LIBOR plus a margin based on our credit ratings. Based on our credit ratings at December 31, 2016, borrowings would generally bear interest at LIBOR plus 80.5 basis points. The credit facility is composed of commitments from 20 separate highly rated lenders, each committing no more than 10% of the facility. As of December 31, 2016 and December 31, 2015 there were no borrowings outstanding under the $1.25 billion credit facility. We had no outstanding letters of credit at December 31, 2016 or December 31, 2015.
Under the $1.25 billion credit facility we must comply with certain covenants, including a ratio of total debt to total capitalization of no more than 60%. We were in compliance with the credit facility covenants during 2016 and 2015. Our ratio of total debt to total capitalization, as those terms are defined in the credit facility, was 34.6% at December 31, 2016. We are providing this ratio as this metric is used by our lenders to monitor our leverage and is also a threshold that could limit our ability to utilize this facility.
Total cash paid for interest on long-term debt was $231 million, $232 million and $209 million in 2016, 2015 and 2014, respectively.
Note 12: Commitments and Contingencies
Leases—At December 31, 2016, we had commitments under long-term leases requiring annual rentals on a net lease basis as follows:
(In millions) | |||
2017 | $ | 226 | |
2018 | 196 | ||
2019 | 160 | ||
2020 | 132 | ||
2021 | 133 | ||
Thereafter | 445 | ||
Rent expense was $239 million, $236 million and $225 million in 2016, 2015 and 2014, respectively. In the normal course of business, we lease equipment, office buildings and other facilities under leases that include standard escalation clauses for adjusting rent payments to reflect changes in price indices, as well as renewal options.
At December 31, 2016, we had commitments under agreements to outsource a portion of our information technology function, which have minimum annual payments of approximately $15 million.
Environmental Matters—We are involved in various stages of investigation and cleanup related to remediation of various environmental sites. Our estimate of the liability of total environmental remediation costs includes the use of a discount rate and takes into account that a portion of these costs is eligible for future recovery through the pricing of our products and services to the U.S. government. We consider such recovery probable based on government contracting regulations and our long history of receiving reimbursement for such costs, and accordingly have recorded the estimated future recovery of these costs from the U.S. government within contracts in process, net, in our consolidated balance sheets. Our estimates regarding remediation costs to be incurred were as follows at December 31:
(In millions, except percentages) | 2016 | 2015 | |||||
Total remediation costs—undiscounted | $ | 219 | $ | 224 | |||
Weighted-average discount rate | 5.2 | % | 5.2 | % | |||
Total remediation costs—discounted | $ | 147 | $ | 149 | |||
Recoverable portion | 92 | 94 | |||||
We also lease certain government-owned properties and generally are not liable for remediation of preexisting environmental contamination at these sites. As a result, we generally do not provide for these costs in our consolidated financial statements.
Due to the complexity of environmental laws and regulations, the varying costs and effectiveness of alternative cleanup methods and technologies, the uncertainty of insurance coverage and the unresolved extent of our responsibility, it is difficult
100
to determine the ultimate outcome of environmental matters. However, we do not expect any additional liability to have a material adverse effect on our financial position, results of operations or liquidity.
Environmental remediation costs expected to be incurred are:
(In millions) | |||
2017 | $ | 32 | |
2018 | 28 | ||
2019 | 18 | ||
2020 | 12 | ||
2021 | 10 | ||
Thereafter | 119 | ||
Financing Arrangements and Other—We issue guarantees, and banks and surety companies issue, on our behalf, letters of credit and surety bonds to meet various bid, performance, warranty, retention and advance payment obligations of us or our affiliates. These instruments expire on various dates through 2024. Additional guarantees of project performance for which there is no stated value also remain outstanding. The stated values outstanding consisted of the following at December 31:
(In millions) | 2016 | 2015 | |||||
Guarantees | $ | 190 | $ | 213 | |||
Letters of credit | 2,345 | 2,242 | |||||
Surety bonds | 127 | 264 | |||||
Included in guarantees and letters of credit described above were $180 million and $44 million, respectively, at December 31, 2016, and $203 million and $187 million, respectively, at December 31, 2015, related to our joint venture in TRS. The joint venture agreement for the TRS joint venture was amended and restated in the second quarter of 2016, as discussed in "Note 5: Thales-Raytheon Systems Co. Ltd. (TRS) Joint Venture", reducing the scope of the joint venture to TRS AMDC2 only. We provide these guarantees and letters of credit to TRS AMDC2 and other affiliates to assist these entities in obtaining financing on more favorable terms, making bids on contracts and performing their contractual obligations. While we expect these entities to satisfy their loans and meet their project performance and other contractual obligations, their failure to do so may result in a future obligation to us. We periodically evaluate the risk of TRS AMDC2 and other affiliates failing to meet their obligations described above. At December 31, 2016, we believe the risk that TRS AMDC2 and other affiliates will not be able to meet their obligations is minimal for the foreseeable future based on their current financial condition. All obligations were current at December 31, 2016. At December 31, 2016 and December 31, 2015, we had an estimated liability of $3 million and $8 million, respectively, related to these guarantees and letters of credit.
As discussed in "Note 6: Forcepoint Joint Venture", under the joint venture agreement between Raytheon Company and Vista Equity Partners, Raytheon may be required to purchase Vista Equity Partners' interest in Forcepoint.
We have entered into industrial cooperation agreements, sometimes referred to as offset agreements, as a condition to obtaining orders for our products and services from certain customers in foreign countries. At December 31, 2016, the aggregate amount of our offset agreements, both agreed to and anticipated to be agreed to, had an outstanding notional value of approximately $8.8 billion. These agreements are designed to return economic value to the foreign country by requiring us to engage in activities supporting local defense or commercial industries, promoting a balance of trade, developing in-country technology capabilities or addressing other local development priorities. Offset agreements may be satisfied through activities that do not require a direct cash payment, including transferring technology, providing manufacturing, training and other consulting support to in-country projects, and the purchase by third parties (e.g., our vendors) of supplies from in-country vendors. These agreements may also be satisfied through our use of cash for activities such as subcontracting with local partners, purchasing supplies from in-country vendors, providing financial support for in-country projects and making investments in local ventures. Such activities may also vary by country depending upon requirements as dictated by their governments. We typically do not commit to offset agreements until orders for our products or services are definitive. The amounts ultimately applied against our offset agreements are based on negotiations with the customers and typically require cash outlays that represent only a fraction of the notional value in the offset agreements. Offset programs usually extend over several or more years and may
101
provide for penalties in the event we fail to perform in accordance with offset requirements. We have historically not been required to pay any such penalties.
As a U.S. government contractor, we are subject to many levels of audit and investigation by the U.S. government relating to our contract performance and compliance with applicable rules and regulations. Agencies that oversee contract performance include: the Defense Contract Audit Agency (DCAA); the Defense Contract Management Agency (DCMA); the Inspectors General of the U.S. Department of Defense (DoD) and other departments and agencies; the Government Accountability Office; the Department of Justice (DoJ); and Congressional Committees. From time to time, these and other agencies investigate or conduct audits to determine whether our operations are being conducted in accordance with applicable requirements. Such investigations and audits may be initiated due to a number of reasons, including as a result of a whistleblower complaint. Such investigations and audits could result in administrative, civil or criminal liabilities, including repayments, fines or penalties being imposed upon us, the suspension of government export licenses or the suspension or debarment from future U.S. government contracting. U.S. government investigations often take years to complete and many result in no adverse action against us. Our final allowable incurred costs for each year are also subject to audit and have, from time to time, resulted in disputes between us and the U.S. government, with litigation resulting at the Court of Federal Claims (COFC) or the Armed Services Board of Contract Appeals (ASBCA) or their related courts of appeals. In addition, the DoJ has, from time to time, convened grand juries to investigate possible irregularities by us. We also provide products and services to customers outside of the U.S., and those sales are subject to local government laws, regulations and procurement policies and practices. Our compliance with such local government regulations or any applicable U.S. government regulations (e.g., the Foreign Corrupt Practices Act (FCPA) and International Traffic in Arms Regulations (ITAR)) may also be investigated or audited. Other than as specifically disclosed herein, we do not expect these audits, investigations or disputes to have a material effect on our financial position, results of operations or liquidity, either individually or in the aggregate.
In addition, various other claims and legal proceedings generally incidental to the normal course of business are pending or threatened against, or initiated by, us. We do not expect any of these proceedings to result in any additional liability or gains that would materially affect our financial position, results of operations or liquidity. In connection with certain of our legal matters, we may be entitled to insurance recovery for qualified legal costs. We do not expect any insurance recovery to have a material impact on the financial exposure that could result from these matters.
Note 13: Stockholders’ Equity
The changes in shares of our common stock outstanding were as follows:
(In millions) | 2016 | 2015 | 2014 | |||||
Beginning balance | 299.0 | 307.3 | 314.5 | |||||
Stock plans activity | 1.5 | 1.6 | 1.4 | |||||
Share repurchases | (7.7 | ) | (9.9 | ) | (8.6 | ) | ||
Ending balance | 292.8 | 299.0 | 307.3 | |||||
From time to time, our Board of Directors authorizes the repurchase of shares of our common stock. In November 2015, our Board authorized the repurchase of up to $2.0 billion of our outstanding common stock. At December 31, 2016, we had approximately $1.6 billion available under the 2015 repurchase program. Share repurchases will take place from time to time at management’s discretion depending on market conditions.
Share repurchases also include shares surrendered by employees to satisfy tax withholding obligations in connection with RSAs, RSUs, stock options and LTPP awards issued to employees.
Due to the volume of repurchases made under our share repurchase program, additional paid-in capital was reduced to zero, with the remainder of the excess purchase price over par value of $435 million recorded as a reduction to retained earnings in 2016.
102
Our share repurchases were as follows:
2016 | 2015 | 2014 | |||||||||||||||
(In millions) | $ | Shares | $ | Shares | $ | Shares | |||||||||||
Shares repurchased under our share repurchase programs | $ | 900 | 6.9 | $ | 1,000 | 9.0 | $ | 750 | 7.7 | ||||||||
Shares repurchased to satisfy tax withholding obligations | 96 | 0.8 | 99 | 0.9 | 90 | 0.9 | |||||||||||
Total share repurchases | $ | 996 | 7.7 | $ | 1,099 | 9.9 | $ | 840 | 8.6 | ||||||||
In March 2016, our Board of Directors authorized a 9.3% increase to our annual dividend payout rate from $2.68 to $2.93 per share. Our Board of Directors declared dividends of $2.93, $2.68 and $2.42 per share in 2016, 2015 and 2014, respectively. Dividends are subject to quarterly approval by our Board of Directors.
As further discussed in "Note 5: Thales-Raytheon Systems Co. Ltd. (TRS) Joint Venture", in the second quarter of 2016, we recorded our acquisition of Thales S.A.'s noncontrolling interest in RCCS LLC at fair value, which resulted in a reduction to retained earnings of $167 million before tax, $205 million after tax, which was subsequently adjusted to $197 million after tax in the fourth quarter of 2016. The $30 million of deferred tax is due to the change in outside basis difference in RCCS LLC.
Note 14: Stock-based Compensation Plans
The Raytheon 2010 Stock Plan provides for shares to be issued as stock options, stock appreciation rights, restricted stock, RSUs or stock grants, including awards based on performance criteria. The plan authorizes the issuance of 7.5 million shares in addition to shares available under certain prior plans of the Company. The total maximum number of shares originally authorized for issuance under the 2010 Stock Plan and those certain prior plans is 41.8 million. The 2010 Stock Plan provides that awards to our employees, officers and consultants are generally made by the Management Development and Compensation Committee of our Board of Directors (MDCC) and are compensatory in nature, while awards to our non-employee directors are made by the Board's Governance and Nominating Committee. Shares issued as a result of stock awards, stock option exercises or conversion of RSU awards will be funded through the issuance of shares under the 2010 Stock Plan. At December 31, 2016, there were 6.7 million shares available for new awards and 4.0 million shares outstanding.
Stock-based compensation expense and the associated tax benefit recognized were as follows:
(In millions) | 2016 | 2015 | 2014 | ||||||||
Stock-based compensation expense | |||||||||||
Restricted stock expense | $ | 96 | $ | 92 | $ | 81 | |||||
RSU expense | 26 | 26 | 28 | ||||||||
LTPP expense | 29 | 22 | 39 | ||||||||
Total stock-based compensation expense | $ | 151 | $ | 140 | $ | 148 | |||||
Stock-based tax benefit recognized | 46 | 44 | 48 | ||||||||
At December 31, 2016, there was $169 million of compensation expense related to nonvested awards not yet recognized which is expected to be recognized over a weighted-average period of 1.5 years.
Restricted Stock and Restricted Stock Units (RSUs)
RSAs vest over a specified period of time as determined by the MDCC, generally four years for employee awards and one year for nonemployee directors. RSAs entitle the recipient to full dividend and voting rights beginning on the date of grant. Non-vested shares are restricted as to disposition and subject to forfeiture under certain circumstances. At the date of grant each share of restricted stock is credited to common stock at par value. The fair value of restricted stock, calculated under the intrinsic value method at the date of grant, is charged to income as compensation expense generally over the vesting period with a corresponding credit to additional paid-in capital.
RSUs also vest over a specified period of time as determined by the MDCC, are compensatory in nature and are primarily awarded to retirement eligible employees. Retirement eligible recipients of RSUs are entitled to full dividend rights beginning
103
on the date of grant. In addition, RSUs granted to retirement eligible employees continue to vest, but do not accelerate, on the scheduled vesting dates into retirement subject to the recipient's compliance with certain post-employment covenants. Since recipients of RSUs with continued vesting provisions have satisfied the service requirement of the award at the date of grant, the Company recognizes all of the stock-based compensation expense associated with the RSUs awarded to retirement eligible employees in the period the award is granted.
Restricted stock and RSU activity was as follows:
Shares/units (in thousands) | Weighted-average grant date fair value | |||||
Outstanding at December 31, 2013 | 5,337 | $ | 56.10 | |||
Granted | 1,355 | 96.84 | ||||
Vested | (1,648 | ) | 51.30 | |||
Forfeited | (526 | ) | 58.74 | |||
Outstanding at December 31, 2014 | 4,518 | 69.76 | ||||
Granted | 1,242 | 110.28 | ||||
Vested | (1,597 | ) | 57.65 | |||
Forfeited | (423 | ) | 77.02 | |||
Outstanding at December 31, 2015 | 3,740 | 87.57 | ||||
Granted | 1,128 | 124.08 | ||||
Vested | (1,407 | ) | 71.09 | |||
Forfeited | (167 | ) | 98.61 | |||
Outstanding at December 31, 2016 | 3,294 | $ | 106.56 | |||
The total fair value of restricted stock and RSUs vested and the related tax benefit realized were as follows:
(In millions) | 2016 | 2015 | 2014 | ||||||||
Fair value of restricted stock and RSUs vested | $ | 183 | $ | 167 | $ | 161 | |||||
Tax benefit realized related to vested shares/units(1) | 64 | 58 | 56 | ||||||||
(1) | Amount in 2016 includes excess tax benefit recognized of $32 million. |
Long-term Performance Plan (LTPP)
In 2004, we established the LTPP, which provides for restricted stock unit awards granted from our stock plans to our senior leadership. Recipients of LTPP awards have no voting rights and receive dividend equivalent units. The vesting of LTTP awards and related dividend equivalent units is based upon the achievement of specific pre-established levels of performance at the end of a three-year performance cycle. In the event of a retirement, vesting for awards will not accelerate and instead will vest in accordance with the original vesting conditions on a pro-rated basis.
The performance goals for the three outstanding performance cycles at December 31, 2016 are independent of each other and based on three metrics, as defined in the award agreements: return on invested capital (ROIC), weighted at 50%; total shareholder return (TSR) relative to a peer group, weighted at 25%; and cumulative free cash flow from continuing operations (CFCF), weighted at 25%. Depending on the achievement of these metrics, a recipient of the award is entitled to receive a number of ordinary shares equal to a percentage, ranging from zero to 200% of the award granted.
Compensation expense for the awards is recognized on a straight-line basis from the grant date through the end of the performance period based upon the value determined under the intrinsic value method for the CFCF and ROIC portions of the award and the Monte Carlo simulation method for the TSR portion of the award. Compensation expense for the CFCF and ROIC portions of the awards will be adjusted based upon the expected achievement of those performance goals.
104
The assumptions used in the Monte Carlo model for the TSR portion of the awards granted during each year were as follows:
2016 | 2015 | 2014 | ||||||
Expected stock price volatility | 18.60 | % | 16.90 | % | 18.93 | % | ||
Peer group stock price volatility | 20.06 | % | 19.37 | % | 23.19 | % | ||
Correlations of returns | 58.05 | % | 59.51 | % | 68.01 | % | ||
Risk free interest rate | 1.08 | % | 0.89 | % | 0.87 | % | ||
LTPP activity related to the expected units was as follows(1):
Units (in thousands) | Weighted-average grant date fair value | |||||
Outstanding at December 31, 2013 | 1,827 | $ | 54.13 | |||
Granted | 280 | 97.59 | ||||
Increase due to expected performance | 99 | 39.50 | ||||
Vested | (664 | ) | 52.33 | |||
Forfeited | (134 | ) | 75.80 | |||
Outstanding at December 31, 2014 | 1,408 | 60.53 | ||||
Granted | 189 | 112.14 | ||||
Increase due to expected performance | 148 | 73.70 | ||||
Vested | (797 | ) | 50.83 | |||
Forfeited | (33 | ) | 85.16 | |||
Outstanding at December 31, 2015 | 915 | 80.83 | ||||
Granted | 167 | 123.31 | ||||
Increase due to expected performance | 205 | 89.62 | ||||
Vested | (590 | ) | 61.38 | |||
Forfeited | (32 | ) | 105.52 | |||
Outstanding at December 31, 2016 | 665 | $ | 110.32 | |||
(1) | This table excludes 28 thousand, 50 thousand and 93 thousand expected dividend equivalent units outstanding at December 31, 2016, December 31, 2015 and December 31, 2014, respectively, based on expected performance on each reporting date. |
The total fair value of LTPP units vested and the related tax benefit realized were as follows:
(In millions) | 2016 | 2015 | 2014 | ||||||||
Fair value of LTPP units vested | $ | 77 | $ | 93 | $ | 70 | |||||
Tax benefit realized related to vested LTPP units(1) | 27 | 33 | 25 | ||||||||
(1) | Amount in 2016 includes excess tax benefit recognized of $15 million. |
Forcepoint Plans
In 2015, Forcepoint established long-term incentive plans that provide for awards of unit appreciation rights and profits interests in the joint venture to Forcepoint management and key employees. Awards are approved by the Board of Forcepoint. These awards vest over a specified period of time and settlement is subject to a liquidity event defined as either a change in control or an initial public offering of the joint venture. In 2016, Forcepoint issued 3 thousand unit appreciation rights and had 15 thousand outstanding at December 31, 2016. Also in 2016, Forcepoint issued 63 thousand profits interests, 23 thousand were forfeited, and had 92 thousand outstanding at December 31, 2016. At December 31, 2016, there were 131 thousand and 24 thousand combined units and/or profits interests authorized and available for issuance, respectively, under these plans. The fair value of the awards is determined using the Black-Scholes valuation model and compensation expense is recognized over the requisite service period when achievement of the liquidity event is considered probable. In certain limited circumstances other vesting conditions may apply and the expense attributable to these vesting conditions was $10 million for 2016.
105
The weighted-average assumptions used in the Black-Scholes model and the weighted-average grant date fair value for the Forcepoint awards granted in 2016 were as follows:
Unit Price | $ | 935.28 | |
Expected life (in years) | 4.24 | ||
Expected unit price volatility | 54.65 | % | |
Risk free interest rate | 1.12 | % | |
Dividend yield | — | % | |
Grant date fair value | $ | 402.64 | |
Note 15: Pension and Other Employee Benefits
We have pension plans covering the majority of our employees hired prior to January 1, 2007, including certain employees in foreign countries (Pension Benefits). Our primary pension obligations relate to our domestic Internal Revenue Service (IRS) qualified pension plans. In addition, we provide certain health care and life insurance benefits to retired employees and to eligible employees upon retirement through other postretirement benefit (PRB) plans.
The fair value of plan assets for our domestic and foreign Pension Benefits plans was as follows:
(In millions) | 2016 | 2015 | |||||
Domestic Pension Benefits plan | $ | 17,808 | $ | 18,063 | |||
Foreign Pension Benefits plan | 797 | 837 | |||||
We maintain a defined contribution plan that includes a 401(k) plan. Covered employees hired or rehired after January 1, 2007 are eligible for a Company contribution based on age and service, instead of participating in our pension plans. These and other covered employees are eligible to contribute up to a specific percentage of their pay to the 401(k) plan. We match the employee’s contribution, generally up to 3% or 4% of the employee’s pay, which is invested in the same way as employee contributions. Total expense for our contributions was $286 million, $276 million and $274 million in 2016, 2015 and 2014, respectively.
At December 31, 2016 and December 31, 2015, there was $15.9 billion and $14.6 billion invested in our defined contribution plan, respectively. At December 31, 2016 and December 31, 2015, $1.6 billion and $1.5 billion of these amounts were invested in our stock fund, respectively.
We also sponsor nonqualified defined benefit and defined contribution plans to provide benefits in excess of qualified plan limits. We have set aside certain assets in a separate trust, which we expect to be used to pay for trust obligations. The fair value of marketable securities held in trust, which are considered Level 1 assets under the fair value hierarchy, consisted of the following at December 31:
(In millions) | 2016 | 2015 | |||||
Marketable securities held in trust | $ | 550 | $ | 525 | |||
Included in marketable securities held in trust in the table above was $354 million and $337 million at December 31, 2016 and December 31, 2015, respectively, related to the nonqualified defined contribution plans. The liabilities related to the nonqualified defined contribution plans were $360 million and $337 million at December 31, 2016 and December 31, 2015, respectively.
We also maintain additional contractual pension benefits agreements for certain executive officers. The liability associated with such agreements was $38 million at both December 31, 2016 and December 31, 2015.
106
Contributions and Benefit Payments
We may make both required and discretionary contributions to our pension plans. Required contributions are primarily determined in accordance with the Pension Protection Act of 2006 (PPA), which amended the Employee Retirement Income Security Act of 1974 (ERISA) rules and are affected by the actual return on plan assets (ROA) and plan funded status. The funding requirements under the PPA require us to fully fund our pension plans over a rolling seven-year period as determined annually based upon the funded status at the beginning of the year.
In July 2012, the Surface Transportation Extension Act (STE Act) was passed by Congress and signed by the President. The STE Act includes a provision for temporary pension funding relief due to the low interest rate environment. The provision adjusts the 24-month average high quality corporate bond rates used to determine the PPA funded status so that they are within a floor and cap, or “corridor”, based on the 25-year average of corporate bond rates. The STE Act gradually phased out this interest rate provision beginning in 2013. Subsequent to the STE Act, the Highway and Transportation Funding Act of 2014 (HATFA) and the Bipartisan Budget Act of 2015 (BBA) further extended this interest rate provision until 2020, at which time the provision is gradually phased out.
We made the following contributions to our pension and PRB plans during the years ended December 31:
(In millions) | 2016 | 2015 | 2014 | ||||||||
Required pension contributions | $ | 145 | $ | 339 | $ | 650 | |||||
Discretionary pension contributions | 500 | 200 | 600 | ||||||||
PRB contributions | 25 | 22 | 20 | ||||||||
Total | $ | 670 | $ | 561 | $ | 1,270 | |||||
We periodically evaluate whether to make additional discretionary contributions. We expect to make required contributions of approximately $750 million and $27 million to our pension and PRB plans, respectively, in 2017.
The table below reflects the total Pension Benefits expected to be paid from the plans or from our assets, including both our share of the benefit cost and the participants’ share of the cost, which is funded by participant contributions. PRB benefits expected to be paid reflect our portion only.
(In millions) | Pension Benefits | PRB | |||||
2017 | $ | 1,978 | $ | 62 | |||
2018 | 1,921 | 62 | |||||
2019 | 1,713 | 62 | |||||
2020 | 1,721 | 57 | |||||
2021 | 1,613 | 56 | |||||
Thereafter (next 5 years) | 7,913 | 255 | |||||
107
Defined Benefit Retirement Plan Summary Financial Information
The tables below outline the components of net periodic benefit expense (income) and related actuarial assumptions of our domestic and foreign Pension Benefits and PRB plans.
Pension Benefits | |||||||||||
Components of Net Periodic Pension Expense (Income) (in millions) | 2016 | 2015 | 2014 | ||||||||
Service cost | $ | 482 | $ | 537 | $ | 448 | |||||
Interest cost | 1,089 | 1,047 | 1,128 | ||||||||
Expected return on plan assets | (1,505 | ) | (1,533 | ) | (1,580 | ) | |||||
Amounts reflected in net funded status | 66 | 51 | (4 | ) | |||||||
Amortization of prior service cost included in net periodic pension expense | 5 | 7 | 7 | ||||||||
Recognized net actuarial loss | 999 | 1,127 | 891 | ||||||||
Loss recognized due to settlements | 3 | 1 | 1 | ||||||||
Amounts reclassified during the year | 1,007 | 1,135 | 899 | ||||||||
Net periodic pension expense (income) | $ | 1,073 | $ | 1,186 | $ | 895 | |||||
Net periodic pension expense (income) also includes income from foreign Pension Benefits plans of $4 million, $5 million and $9 million in 2016, 2015 and 2014, respectively.
PRB | |||||||||||
Components of Net Periodic PRB Expense (Income) (in millions) | 2016 | 2015 | 2014 | ||||||||
Service cost | $ | 6 | $ | 7 | $ | 6 | |||||
Interest cost | 31 | 30 | 35 | ||||||||
Expected return on plan assets | (25 | ) | (28 | ) | (33 | ) | |||||
Amounts reflected in net funded status | 12 | 9 | 8 | ||||||||
Amortization of prior service cost included in net periodic PRB expense | (1 | ) | (1 | ) | (1 | ) | |||||
Recognized net actuarial loss | 3 | 2 | 1 | ||||||||
Loss recognized due to settlements | 2 | 2 | — | ||||||||
Amounts reclassified during the year | 4 | 3 | — | ||||||||
Net periodic PRB expense (income) | $ | 16 | $ | 12 | $ | 8 | |||||
Pension Benefits | PRB | ||||||||||||||
Funded Status – Amounts Recognized on our Balance Sheets (in millions) December 31: | 2016 | 2015 | 2016 | 2015 | |||||||||||
Noncurrent assets | $ | 19 | $ | 43 | $ | — | $ | — | |||||||
Current liabilities | (127 | ) | (114 | ) | (19 | ) | (13 | ) | |||||||
Noncurrent liabilities | (7,074 | ) | (6,474 | ) | (358 | ) | (352 | ) | |||||||
Net amount recognized on our balance sheets | $ | (7,182 | ) | $ | (6,545 | ) | $ | (377 | ) | $ | (365 | ) | |||
Pension Benefits | PRB | ||||||||||||||
Reconciliation of Amounts Recognized on our Balance Sheets (in millions) December 31: | 2016 | 2015 | 2016 | 2015 | |||||||||||
Accumulated other comprehensive loss: | |||||||||||||||
Prior service (cost) credit | $ | (13 | ) | $ | (14 | ) | $ | 1 | $ | 2 | |||||
Net loss | (10,975 | ) | (10,793 | ) | (128 | ) | (107 | ) | |||||||
Accumulated other comprehensive loss | (10,988 | ) | (10,807 | ) | (127 | ) | (105 | ) | |||||||
Accumulated contributions in excess (below) net periodic benefit or cost | 3,806 | 4,262 | (250 | ) | (260 | ) | |||||||||
Net amount recognized on our balance sheets | $ | (7,182 | ) | $ | (6,545 | ) | $ | (377 | ) | $ | (365 | ) | |||
108
Pension Benefits | PRB | ||||||||||||||
Sources of Change in Accumulated Other Comprehensive Loss (in millions) | 2016 | 2015 | 2016 | 2015 | |||||||||||
Prior service (cost) credit arising during period | $ | (1 | ) | $ | (1 | ) | $ | — | $ | (1 | ) | ||||
Amortization of prior service cost (credit) included in net income | 5 | 7 | (1 | ) | (1 | ) | |||||||||
Net change in prior service (cost) credit not recognized in net income during that period | 4 | 6 | (1 | ) | (2 | ) | |||||||||
Actuarial gain (loss) arising during period | (1,212 | ) | (609 | ) | (26 | ) | (13 | ) | |||||||
Amortization of net actuarial (gain) loss included in net income | 999 | 1,127 | 3 | 2 | |||||||||||
Loss due to curtailments/settlements | 3 | 2 | 2 | 2 | |||||||||||
Net change in actuarial gain (loss) not included in net income during the period | (210 | ) | 520 | (21 | ) | (9 | ) | ||||||||
Effect of exchange rates | 25 | 10 | — | — | |||||||||||
Total change in accumulated other comprehensive loss during period | $ | (181 | ) | $ | 536 | $ | (22 | ) | $ | (11 | ) | ||||
The amounts in accumulated other comprehensive loss at December 31, 2016 expected to be recognized as components of net periodic benefit cost in 2017 are as follows:
(In millions) | Pension Benefits | PRB | |||||
Amortization of net gain (loss) | $ | (1,118 | ) | $ | (8 | ) | |
Amortization of prior service (cost) credit | (5 | ) | 1 | ||||
Total | $ | (1,123 | ) | $ | (7 | ) | |
The projected benefit obligation (PBO) represents the present value of Pension Benefits earned through the end of the year, with an allowance for future salary increases. The accumulated benefit obligation (ABO) is similar to the PBO, but does not provide for future salary increases. The PBO, ABO and asset values for our domestic qualified pension plans were as follows:
(In millions) | 2016 | 2015 | |||||
PBO for domestic qualified pension plans | $ | 23,818 | $ | 23,623 | |||
ABO for domestic qualified pension plans | 22,089 | 21,598 | |||||
Asset values for domestic qualified pension plans | 17,808 | 18,063 | |||||
The PBO and fair value of plans assets for Pension Benefits plans with PBOs in excess of plan assets were $24,382 million and $17,182 million, respectively, at December 31, 2016 and $24,699 million and $18,111 million, respectively, at December 31, 2015.
The ABO and fair value of plan assets for Pension Benefits plans with ABOs in excess of plan assets were $22,511 million and $17,182 million, respectively, at December 31, 2016 and $22,546 million and $18,111 million, respectively, at December 31, 2015. The ABO for all Pension Benefits plans was $23,911 million and $23,286 million at December 31, 2016 and December 31, 2015, respectively.
109
The tables below provide a reconciliation of benefit obligations, plan assets and related actuarial assumptions of our domestic and foreign Pension Benefits and PRB plans.
Pension Benefits | PRB | ||||||||||||||
Change in Projected Benefit Obligation (in millions) | 2016 | 2015 | 2016 | 2015 | |||||||||||
PBO at beginning of year | $ | 25,445 | $ | 26,649 | $ | 745 | $ | 782 | |||||||
Service cost | 482 | 537 | 6 | 7 | |||||||||||
Interest cost | 1,089 | 1,047 | 31 | 30 | |||||||||||
Plan participants’ contributions | 9 | 10 | 46 | 50 | |||||||||||
Amendments | 1 | 1 | — | 1 | |||||||||||
Plan curtailments/settlements | (7 | ) | (5 | ) | (10 | ) | (9 | ) | |||||||
Actuarial loss (gain) | 831 | (943 | ) | 21 | (17 | ) | |||||||||
Foreign exchange loss (gain) | (140 | ) | (47 | ) | — | — | |||||||||
Benefits paid | (1,923 | ) | (1,804 | ) | (102 | ) | (99 | ) | |||||||
PBO at end of year | $ | 25,787 | $ | 25,445 | $ | 737 | $ | 745 | |||||||
The PBO for our domestic and foreign Pension Benefits plans was $24,946 million and $841 million, respectively, at December 31, 2016 and $24,605 million and $840 million, respectively, at December 31, 2015.
Pension Benefits | PRB | ||||||||||||||
Change in Plan Assets (in millions) | 2016 | 2015 | 2016 | 2015 | |||||||||||
Fair value of plan assets at beginning of year | $ | 18,900 | $ | 20,220 | $ | 380 | $ | 418 | |||||||
Actual return (loss) on plan assets | 1,124 | (19 | ) | 21 | (2 | ) | |||||||||
Company contributions | 645 | 539 | 25 | 22 | |||||||||||
Plan participants’ contributions | 9 | 10 | 46 | 50 | |||||||||||
Plan settlements | (7 | ) | (4 | ) | (10 | ) | (9 | ) | |||||||
Foreign exchange gain (loss) | (143 | ) | (42 | ) | — | — | |||||||||
Benefits paid | (1,923 | ) | (1,804 | ) | (102 | ) | (99 | ) | |||||||
Fair value of plan assets at end of year | $ | 18,605 | $ | 18,900 | $ | 360 | $ | 380 | |||||||
Retirement Plan Assumptions
Pension Benefits | ||||||||
Weighted-Average Net Periodic Benefit Cost Assumptions | 2016 | 2015 | 2014 | |||||
Discount rate | 4.45 | % | 4.06 | % | 5.06 | % | ||
Expected long-term rate of return on plan assets | 7.91 | % | 7.91 | % | 8.67 | % | ||
Rate of compensation increase | ||||||||
Range | 2%–7% | 2%–7% | 2%–7% | |||||
Average | 4.42 | % | 4.41 | % | 4.40 | % | ||
110
PRB | ||||||||
Weighted-Average Net Periodic Benefit Cost Assumptions | 2016 | 2015 | 2014 | |||||
Discount rate | 4.42 | % | 4.05 | % | 5.01 | % | ||
Expected long-term rate of return on plan assets | 6.99 | % | 7.01 | % | 8.24 | % | ||
Rate of compensation increase | ||||||||
Range | 2%–7% | 2%–7% | 2%–7% | |||||
Average | 4.50 | % | 4.50 | % | 4.50 | % | ||
Health care trend rate* | 4.00 | % | 4.00 | % | 4.00 | % | ||
* Currently at the ultimate trend rate.
Pension Benefits | PRB | ||||||||||
Weighted-Average Year-End Benefit Obligation Assumptions | 2016 | 2015 | 2016 | 2015 | |||||||
Discount rate | 4.31 | % | 4.45 | % | 4.28 | % | 4.42 | % | |||
Rate of compensation increase | |||||||||||
Range | 2%–7% | 2%–7% | 2%–7% | 2%–7% | |||||||
Average | 4.40 | % | 4.40 | % | 4.50 | % | 4.50 | % | |||
Health care trend rate* | 4.00 | % | 4.00 | % | |||||||
* Currently at the ultimate trend rate.
The weighted-average year-end benefit obligation discount rate for our domestic Pension Benefits plans was 4.36% and 4.47% at December 31, 2016 and December 31, 2015, respectively. Our foreign Pension Benefits plan assumptions have been included in the Pension Benefits assumptions in the table above.
The long-term ROA represents the average rate of earnings expected over the long term on the assets invested to provide for anticipated future benefit payment obligations. The long-term ROA used to calculate net periodic pension cost is set annually at the beginning of each year. Given the long-term nature of the ROA assumption, which we believe should not be solely reactive to short-term market conditions that may not persist, we expect the long-term ROA to remain unchanged unless there are significant changes in our investment strategy, the underlying economic assumptions or other major factors.
To establish our long-term ROA assumption we employ a “building block” approach. We then annually consider whether it is appropriate to change our long-term ROA assumption by reviewing the existing assumption against a statistically determined reasonable range of outcomes. The building block approach and the reasonable range of outcomes are based upon our asset allocation assumptions and long-term capital market assumptions. Such assumptions incorporate the economic outlook for various asset classes over short- and long-term periods and also take into consideration other factors, including historical market performance, inflation and interest rates.
For purposes of our long-term ROA assumptions for 2014 and prior, we considered the reasonable range to be between the 25th and 75th percentile likelihood of achieving a long-term return over future years, consistent with the Actuarial Standard of Practice No. 27, Selection of Economic Assumptions for Measuring Pension Obligations (ASOP 27) in effect at the time. Therefore, it was less than 25% likely that the long-term return of the pension plan would fall below or above the 25th and 75th percentiles points, respectively (i.e., it is 50% likely that the long-term return of the pension plan will be within the 25th and 75th percentile range). In September 2013, the Actuarial Standards Board issued a revision to ASOP 27, that replaced the explicit reference to the best estimate range concept with the selection of a reasonable assumption that considers multiple criteria including the purposes of measurement, the actuary’s professional judgment, historical and current economic data and estimates of future experience and has no significant bias. The revised standard is effective for assumptions established on or after September 30, 2014. As a result of the revised standard, we continue to evaluate our long-term ROA assumption against a reasonable range of possible outcomes, but effective for our 2015 and future years assumptions, we modified that range to be between the 35th to 65th percentile likelihood of achieving a long-term return over future years. We believe that continuing to validate our ROA assumption within a reasonable range that is narrowed to the 35th to 65th percentile ensures an unbiased result while also ensuring that the ROA assumption is not solely reactive to short-term market conditions that may not persist, and is consistent with external actuarial practices.
111
The reasonable range of long-term returns that was used to validate the long-term ROA assumption for the calculation of the net periodic benefit cost for 2016, 2015 and 2014, is shown below.
Percentile | 2016 | 2015 | 2014 | |||||
25th | N/A | N/A | 5.53 | % | ||||
35th | 6.09 | % | 6.37 | % | N/A | |||
65th | 8.16 | % | 8.37 | % | N/A | |||
75th | N/A | N/A | 9.65 | % | ||||
2014 ROA Assumption—The long-term domestic ROA of 8.75% fell between the 60th–65th percentile of the applicable reasonable range for 2014. The 50th percentile of this reasonable range was 7.59%.
2015 ROA Assumption—In the fourth quarter of 2014, we reduced our long-term target allocation for equities and increased our target allocation for fixed income within the investment policy allocations established by our Investment Committee in order to reduce the overall exposure to equity volatility. This change in asset allocation reduced the range of reasonable outcomes that we use to evaluate our long-term ROA assumption and we determined that the historical assumption of 8.75% no longer fell within this range. As a result, we employed a building block approach to develop our 2015 long-term ROA assumption. Under this building block method, the overall expected investment return equals the weighted-average of the individual expected return for each asset class based on the target asset allocation and the long-term capital market assumptions. The expected return for each asset class is composed of inflation plus a risk-free rate of return, plus an expected risk premium for that asset class. The resulting return is then adjusted for administrative, investment management and trading expenses as well as recognition of alpha for active management. The building block approach resulted in a long-term ROA assumption of 8.0% for 2015. To validate this assumption we compared the result against the reasonable range of outcomes and confirmed that the 8.0% result fell between the 55th–60th percentile of the reasonable range for 2015 with the 50th percentile at 7.37%. In addition, when we updated our target asset allocation and our long-term ROA assumption changed from 8.75% to 8.0%, we assessed what our historical asset performance may have been since 1986 using the updated target allocation and concluded the average return would likely have been equal to or greater than 8.0% for the time period from 1986 through 2014.
Based upon our application of the building block approach and our review of the resulting assumption against the 35th to 65th reasonable range and an analysis of our historical results, we established a 2015 long-term domestic ROA assumption of 8.0% for purposes of determining the net periodic benefit cost for 2015 and determined that the assumption is reasonable and consistent with the provisions of ASOP 27.
2016 ROA Assumption—The long-term domestic ROA of 8.0% fell between the 60th–65th percentile of the applicable reasonable range for 2016. The 50th percentile of this reasonable range was 7.12%.
Our domestic pension plans’ actual rates of return were approximately 6%, 0% and 6% for 2016, 2015 and 2014, respectively. The difference between the actual rate of return and our long-term ROA assumption is included in deferred losses.
The long-term ROA assumptions for foreign Pension Benefits plans are based on the asset allocations and the economic environment prevailing in the locations where the Pension Benefits plans reside. Foreign pension assets do not make up a significant portion of the total assets for all of our Pension Benefits plans.
For purposes of determining pension expense under U.S. GAAP, a “corridor” approach may be elected and applied in the recognition of asset and liability gains or losses which limits expense recognition to the net outstanding gains and losses in excess of the greater of 10% of the projected benefit obligation or the calculated "market-related value" of assets. We do not use a “corridor” approach in the calculation of FAS expense.
The effect of a 1% increase or decrease in the assumed health care trend rate for each future year for the aggregate of service cost and interest cost is less than $1 million and for the accumulated postretirement benefit obligation is a $6 million increase or decrease.
112
Plan Assets
Substantially all our domestic Pension Benefits Plan (Plan) assets, which consist of investments in cash and cash equivalents, publicly traded U.S. and international equity securities, private equity funds, private real estate funds, fixed-income securities, commingled funds and other investments such as insurance contracts and derivatives, are held in a master trust, which was established for the investment of assets of our Company-sponsored retirement plans. The assets of the master trust are overseen by our Investment Committee comprised of members of senior management drawn from appropriate diversified levels of the executive management team.
The Investment Committee is responsible for setting the policy that provides the framework for management of the Plan assets. In accordance with its responsibilities and charter, the Investment Committee meets on a regular basis to review the performance of the Plan assets and compliance with the investment policy. The policy sets forth an investment structure for managing Plan assets, including setting the asset allocation ranges, which are expected to provide an appropriate level of overall diversification and total investment return over the long term while maintaining sufficient liquidity to pay the benefits of the Plan. In developing the asset allocation ranges, third-party asset allocation and liability studies are periodically performed that consider the current and expected positions of the plan assets and funded status. Based on these studies and other appropriate information, the Investment Committee establishes asset allocation ranges taking into account acceptable risk targets and associated returns.
The investment policy asset allocation ranges for the Plan, as set by the Investment Committee, for the year ended December 31, 2016 were as follows:
Asset Category | |
Global equity (combined U.S. and international equity) | 40%-60% |
U.S. equities | 25%-40% |
International equities | 15%-25% |
Fixed-income securities | 25%-40% |
Cash and cash equivalents | 0%-10% |
Private equity and private real estate | 5%-25% |
Other (including absolute return funds) | 5%-20% |
The Investment Committee appoints the investment fiduciary, who is responsible for making investment decisions within the framework of the Investment Policy, setting the long-term target allocation within the investment policy asset allocation ranges and for supervising the internal pension investment team. The pension investment team is comprised of experienced investment professionals, who are all employees of the Company. The investment fiduciary reports back to the Investment Committee. During times of unusual market conditions, the investment fiduciary may seek authorization from the Investment Committee to change the investing allocation ranges to reasonably limit excessive volatility or other undesirable consequences.
Taking into account the asset allocation ranges, the investment fiduciary determines the specific allocation of the Plan’s investments within various asset classes. The Plan utilizes select investment strategies which are executed through separate account or fund structures with external investment managers who demonstrate experience and expertise in the appropriate asset classes and styles. The selection of investment managers is done with careful evaluation of all aspects of performance and risk, due diligence of internal operations and controls, reputation, systems evaluation, fees and a review of investment managers' policies and processes. The Plan also utilizes funds that track an index and are highly liquid. Investment performance is monitored frequently against appropriate benchmarks and tracked to compliance guidelines with the assistance of third-party performance evaluation tools and metrics.
Consistent with the objective of optimizing return on investment while taking into account investment risks that are prudent and reasonable given prevailing market conditions, multiple investment strategies are employed to diversify risk such that no single investment or manager holding represents a significant exposure to the total investment portfolio. Plan assets are invested in numerous diversified strategies with the intent to minimize correlations. This allows for diversification of returns. Plan assets can be invested in funds that track an index and are designed to achieve broad market diversification. The Plan had $2.2 billion invested in such funds across six indices as of December 31, 2016. Other than funds that track an index, no individual investment strategy represented more than 5% of the Plan as of December 31, 2016. Further, within each separate
113
account strategy, guidelines are established which set forth the list of authorized investments, the typical portfolio characteristics and diversification required by limiting the amount that can be invested by sector, country and issuer.
The Plan’s investments are stated at fair value. Investments in equity securities (common and preferred) are valued at the last reported sales price when an active market exists. Investments in fixed-income securities are generally valued using methods based upon market transactions for comparable securities and various relationships between securities which are generally recognized by institutional traders. Investments in private equity funds, private real estate funds and other commingled funds are estimated at fair market value, which primarily utilizes net asset values reported by the investment manager or fund administrator. We review additional valuation and pricing information from fund managers, including audited financial statements, to evaluate the net asset values.
The fair value of our Plan assets by asset category and by level (as described in "Note 1: Summary of Significant Accounting Policies") at December 31, 2016 and December 31, 2015 were as follows:
December 31, 2016: (In millions) | Total | Level 1 | Level 2 | Level 3 | Not subject to leveling(7) | ||||||||||||||
U.S. equities(1) | $ | 4,630 | $ | 2,536 | $ | — | $ | — | $ | 2,094 | |||||||||
International equities(1) | 3,099 | 2,120 | 1 | — | 978 | ||||||||||||||
Fixed-income securities | |||||||||||||||||||
U.S. government and agency securities | 1,031 | 917 | 114 | — | — | ||||||||||||||
Corporate debt securities/instruments(2) | 3,092 | 277 | 2,527 | — | 288 | ||||||||||||||
Core fixed-income(3) | 345 | 345 | — | — | — | ||||||||||||||
Global multi-sector fixed-income(4) | 343 | 343 | — | — | — | ||||||||||||||
Securitized and structured credit(5) | 611 | — | — | — | 611 | ||||||||||||||
Cash and cash equivalents(6) | 571 | 26 | 8 | — | 537 | ||||||||||||||
Absolute return funds | 1,412 | — | — | — | 1,412 | ||||||||||||||
Private equity funds | 1,251 | — | — | — | 1,251 | ||||||||||||||
Private real estate funds | 1,167 | — | — | — | 1,167 | ||||||||||||||
Insurance contracts | 29 | — | — | 29 | — | ||||||||||||||
Total investments | 17,581 | 6,564 | 2,650 | 29 | 8,338 | ||||||||||||||
Net receivables and payables | 227 | — | — | — | 227 | ||||||||||||||
Total assets | $ | 17,808 | $ | 6,564 | $ | 2,650 | $ | 29 | $ | 8,565 | |||||||||
114
December 31, 2015: (In millions) | Total | Level 1 | Level 2 | Level 3 | Not subject to leveling(7) | ||||||||||||||
U.S. equities(1) | $ | 5,341 | $ | 2,838 | $ | — | $ | — | $ | 2,503 | |||||||||
International equities(1) | 2,954 | 2,043 | 1 | — | 910 | ||||||||||||||
Fixed-income securities | |||||||||||||||||||
U.S. government and agency securities | 344 | 258 | 86 | — | — | ||||||||||||||
Corporate debt securities/instruments(2) | 2,671 | 109 | 2,440 | — | 122 | ||||||||||||||
Core fixed-income(3) | 1,172 | 1,172 | — | — | — | ||||||||||||||
Global multi-sector fixed-income(4) | 434 | 434 | — | — | — | ||||||||||||||
Securitized and structured credit(5) | 818 | — | — | — | 818 | ||||||||||||||
Cash and cash equivalents(6) | 877 | 637 | 1 | — | 239 | ||||||||||||||
Absolute return funds | 1,406 | — | — | — | 1,406 | ||||||||||||||
Private equity funds | 1,068 | — | — | — | 1,068 | ||||||||||||||
Private real estate funds | 997 | — | — | — | 997 | ||||||||||||||
Insurance contracts | 28 | — | — | 28 | — | ||||||||||||||
Total investments | 18,110 | 7,491 | 2,528 | 28 | 8,063 | ||||||||||||||
Net receivables and payables | (47 | ) | — | — | — | (47 | ) | ||||||||||||
Total assets | $ | 18,063 | $ | 7,491 | $ | 2,528 | $ | 28 | $ | 8,016 | |||||||||
(1) | U.S. and International equities primarily include investments across the spectrum of large, medium and small market capitalization stocks. |
(2) | Corporate debt securities/instruments include investment grade and non-investment grade bonds. |
(3) | Core fixed-income securities are funds that invest primarily in intermediate-term high quality domestic bonds issued by various governmental or private sector entities. |
(4) | Global multi-sector fixed-income investments are funds that invest globally among several sectors including governments, investment grade corporate bonds, high yield corporate bonds and emerging market bonds. |
(5) | Securitized and structured credit include fixed-income funds and securities that pool together various cash flow producing financial assets that are structured in a way that can achieve desired targeted credit, maturity or other characteristics and are typically collateralized by residential mortgages, commercial mortgages and other assets, and other fixed income related securities. |
(6) | Cash and cash equivalents are invested in highly liquid money market funds and bank sponsored collective funds. Included in cash and cash equivalents is excess cash in investment manager accounts. This cash is available for immediate use and is used to fund daily operations and execute the investment policy. This amount is not considered to be part of the cash target allocation set forth in the investment policy. |
(7) | Receivables, payables and certain investments that are valued using the net asset value per share (or its equivalent) practical expedient have not been classified in the fair value hierarchy. The fair value amounts presented in this table are intended to permit reconciliation of the fair value hierarchy to the amount presented for the total domestic pension benefits plan assets. |
A reconciliation of investments with significant unobservable inputs (Level 3) has not been provided as the amounts are immaterial.
The Plan limits the use of derivatives through direct or separate account investments such that the derivatives used are liquid and able to be readily valued in the market. Derivative usage in separate account structures is limited to hedging purposes or to gain market exposure in a non-speculative manner. The fair market value of the Plan’s derivatives through direct or separate account investments was approximately $1 million as of December 31, 2016 and approximately less than $1 million as of December 31, 2015.
In addition, assets are held in trust for non-U.S. Pension Benefits plans, primarily in the U.K. and Canada, which are governed locally in accordance with specific jurisdictional requirements. These assets are overseen by local management in Canada and by trustees with a combination of members representing plan participants and local management in the U.K. Investments in the non-U.S. Pension Benefits plans consist primarily of fixed-income securities and equity securities and had a fair market value of $797 million and $837 million at December 31, 2016 and December 31, 2015, respectively. These investments are valued using quoted prices in active markets (Level 1) as well as significant observable inputs (Level 2). Investments with significant unobservable inputs (Level 3) are immaterial in the non-U.S. Pension Benefits plans.
The fair market value of assets related to our PRB Benefits was $360 million and $380 million as of December 31, 2016 and December 31, 2015, respectively. These assets included $161 million and $169 million at December 31, 2016 and December 31, 2015, respectively, that were invested in the master trust described above and are therefore invested in the same
115
assets described above. The remaining investments are held within Voluntary Employees’ Beneficiary Association (VEBA) trusts. The assets of the VEBA trusts are also overseen by the Investment Committee and managed by the same investment fiduciary that manages the master trust’s investments. These assets are generally invested in mutual funds and are valued primarily using quoted prices in active markets (Level 1) as well as significant observable inputs (Level 2). There were no Level 3 investments in the VEBA trusts at December 31, 2016 or December 31, 2015.
The table below details assets by category for our VEBA trusts. These assets consisted primarily of publicly-traded equity securities and publicly-traded fixed-income securities.
% of Plan Assets at Dec 31: | |||||
Asset category | 2016 | 2015 | |||
Fixed-income securities | 45 | % | 45 | % | |
U.S. equities | 40 | % | 40 | % | |
International equities | 10 | % | 10 | % | |
Cash and cash equivalents | 5 | % | 5 | % | |
Total | 100 | % | 100 | % | |
Note 16: Income Taxes
The provision for federal and foreign income taxes consisted of the following:
(In millions) | 2016 | 2015 | 2014 | ||||||||
Current income tax expense (benefit) | |||||||||||
Federal | $ | 713 | $ | 757 | $ | 837 | |||||
Foreign | 38 | 36 | 13 | ||||||||
State | (3 | ) | (4 | ) | — | ||||||
Deferred income tax expense (benefit) | |||||||||||
Federal | 102 | (103 | ) | (73 | ) | ||||||
Foreign | 6 | 45 | 13 | ||||||||
State | 1 | 2 | — | ||||||||
Total | $ | 857 | $ | 733 | $ | 790 | |||||
The expense for income taxes differed from the U.S. statutory rate due to the following:
2016 | 2015 | 2014 | ||||||
Statutory tax rate | 35.0 | % | 35.0 | % | 35.0 | % | ||
Research and development tax credit | (1.3 | ) | (1.2 | ) | (1.1 | ) | ||
Tax settlements and refund claims | — | (3.2 | ) | (0.5 | ) | |||
Domestic manufacturing deduction benefit | (2.7 | ) | (3.1 | ) | (2.7 | ) | ||
Foreign income tax rate differential | — | (1.4 | ) | (0.6 | ) | |||
Equity compensation | (1.6 | ) | — | — | ||||
TRS tax-free gain | (1.8 | ) | — | — | ||||
Tax benefit on foreign dividend | — | — | (2.8 | ) | ||||
Other, net | 0.7 | 0.2 | (0.8 | ) | ||||
Effective tax rate | 28.3 | % | 26.3 | % | 26.5 | % | ||
In the second quarter of 2016, the Company recorded a tax benefit of approximately $55 million as a result of the tax-free gain from the sale of our equity method investment in TRS SAS as discussed in “Note 5: Thales- Raytheon Systems Co. Ltd. (TRS) Joint Venture”.
116
In December 2015, U.S. legislation was enacted to permanently reinstate the Research and Development tax credit (R&D tax credit) which had expired on December 31, 2014. In 2016, 2015 and 2014 we recorded a full year benefit of approximately $41 million, $33 million and $30 million related to the 2016, 2015 and 2014 R&D tax credits, respectively.
We are subject to income taxes in the U.S. and numerous foreign jurisdictions. We have participated in the IRS Compliance Assurance Process (CAP) program since 2011. In the third quarter of 2016 the IRS completed the examination for the 2014 tax year, which completed all examinations through 2014. We continue to participate in the CAP program for the 2015 and 2016 tax years. We are also under audit by multiple state and foreign tax authorities.
During 2014, a foreign subsidiary authorized and completed a transaction which resulted in a taxable dividend of approximately $115 million. The transaction did not affect our indefinite reinvestment assertion because it generated a net tax benefit of approximately $80 million.
(In millions) | 2016 | 2015 | 2014 | ||||||||
Domestic income from continuing operations before taxes | $ | 2,928 | $ | 2,482 | $ | 2,868 | |||||
Foreign income from continuing operations before taxes | 102 | 305 | 115 | ||||||||
At December 31, 2016, foreign earnings of approximately $732 million have been retained by foreign subsidiaries for reinvestment. No provision has been made for deferred taxes on undistributed earnings of non-U.S. subsidiaries as these earnings have been indefinitely invested or are expected to be remitted substantially free of additional tax. Determination of the amount of unrecognized deferred tax liability on these undistributed earnings is not practicable because of the complexity of laws and regulations, the varying tax treatment of alternative repatriation scenarios, and the variation due to multiple potential assumptions relating to the timing of any future repatriation.
We made the following net tax payments during the years ended December 31:
(In millions) | 2016 | 2015 | 2014 | ||||||||
Federal | $ | 710 | $ | 1,008 | $ | 705 | |||||
Foreign | 47 | 43 | 19 | ||||||||
State | 22 | 30 | 35 | ||||||||
There has been no material change in our unrecognized tax benefit since December 31, 2015.
A rollforward of our unrecognized tax benefits was as follows:
(In millions) | 2016 | 2015 | 2014 | ||||||||
Unrecognized tax benefits, beginning of year | $ | 7 | $ | 104 | $ | 118 | |||||
Additions based on current year tax positions | 2 | 4 | 1 | ||||||||
Additions based on prior year tax positions | 1 | 1 | 10 | ||||||||
Reductions based on prior year tax positions | (3 | ) | (102 | ) | (25 | ) | |||||
Unrecognized tax benefits, end of year | $ | 7 | $ | 7 | $ | 104 | |||||
With the exception of Forcepoint, we generally account for our state income tax expense as a deferred contract cost, to the extent we can recover this expense through the pricing of our products and services to the U.S. government. We include this deferred amount in contracts in process, net, until allocated to our contracts, which generally occurs upon payment or when otherwise agreed as allocable with the U.S. government. Net state income tax expense allocated to our contracts was $26 million, $28 million and $41 million in 2016, 2015 and 2014, respectively. We include state income tax expense allocated to our contracts in administrative and selling expenses.
117
Deferred income taxes consisted of the following at December 31:
(In millions) | 2016 | 2015 | |||||
Noncurrent deferred tax assets (liabilities) | |||||||
Accrued employee compensation and benefits | $ | 293 | $ | 322 | |||
Other accrued expenses and reserves | 126 | 133 | |||||
Contracts in process and inventories | (852 | ) | (841 | ) | |||
Pension benefits | 2,368 | 2,355 | |||||
Other retiree benefits | 109 | 109 | |||||
Net operating loss and tax credit carryforwards | 107 | 115 | |||||
Depreciation and amortization | (1,343 | ) | (1,385 | ) | |||
Partnership outside basis difference | (90 | ) | 6 | ||||
Other | 52 | 75 | |||||
Valuation allowance | (24 | ) | (2 | ) | |||
Deferred income taxes—noncurrent | $ | 746 | $ | 887 | |||
As of December 31, 2016, we had U.S. federal and state net operating loss (NOL) carryforwards related to Forcepoint of approximately $151 million and $112 million, respectively, which expire at various dates through 2035. We have evaluated both the positive and negative evidence to support its ability to realize the deferred tax asset associated with these NOLs. We believe it is more likely than not that the deferred tax asset will be realized to the extent of existing deferred tax liabilities. Accordingly, we have provided a valuation allowance of $20 million and $4 million on the deferred tax assets related to these U.S. federal and state NOL carryforwards. The tax benefits related to any reversal of the valuation allowance on deferred tax assets as of December 31, 2016 will be recognized as a reduction of income tax expense.
We also had foreign NOL carryforwards of approximately $87 million, with the majority generated in the U.K. where NOLs may be carried forward indefinitely. We believe that we have sufficient taxable income to realize these deferred tax assets.
The tax expense (benefit) related to discontinued operations was $(1) million, $(14) million and $23 million in 2016, 2015 and 2014, respectively.
Note 17: Business Segment Reporting
Our reportable segments, organized based on capabilities and technologies, are: Integrated Defense Systems (IDS); Intelligence, Information and Services (IIS); Missile Systems (MS); Space and Airborne Systems (SAS); and Forcepoint.
IDS is a leader in integrated air and missile defense; large land- and sea-based radar solutions; command, control, communications, computers, cyber and intelligence solutions; and naval combat and ship electronic systems. IDS delivers combat-proven performance against the complete spectrum of airborne and ballistic missile threats and is a world leader in the technology, development, and production of sensors and mission systems.
IIS provides a full range of technical and professional services to intelligence, defense, federal and commercial customers worldwide. IIS specializes in global Intelligence, Surveillance and Reconnaissance (ISR); navigation; DoD space and weather solutions; cybersecurity; analytics; training; logistics; mission support; engineering; automation and sustainment solutions; and international and domestic Air Traffic Management (ATM) systems.
MS is a premier developer, integrator and producer of missile and combat systems for the armed forces of the U.S. and allied nations. Leveraging its capabilities in advanced airframes, guidance and navigation systems, high-resolution sensors, surveillance, targeting and netted systems, MS develops and supports a broad range of advanced weapon systems, including missiles, smart munitions, close-in weapon systems, projectiles, kinetic kill vehicles, directed energy effectors and advanced combat sensor solutions.
SAS is a leader in the design, development and manufacture of integrated sensor and communication systems for advanced missions. These missions include intelligence, surveillance and reconnaissance; precision engagement; manned and unmanned
118
aerial operations; and space. Leveraging state-of-the-art technologies, mission systems and domain knowledge, SAS designs, manufactures, supports and sustains civil and military applications of electro-optical/infrared (EO/IR) sensors; airborne radars for surveillance and fire control applications; lasers; precision guidance systems; signals intelligence systems; processors; electronic warfare systems; and communication and space-qualified systems.
Forcepoint develops cybersecurity products serving commercial and government organizations worldwide. Forcepoint is a joint venture of Raytheon and Vista Equity Partners created in May 2015 that brought together the capabilities of the legacy Raytheon Cyber Products (RCP) and Websense, Inc. (Websense) businesses. Forcepoint delivers a portfolio of cybersecurity capabilities, including insider threat solutions; data loss prevention; next-generation firewall technology; cloud and on premise web and email security; and cross domain transfer products.
The amounts, discussion and presentation of our business segments, including Corporate and eliminations for intersegment activity, set forth in this Form 10-K, reflect the Forcepoint transaction. The Forcepoint results reflect RCP results for all periods and Websense results after the acquisition date of May 29, 2015.
Segment total net sales and operating income generally include intersegment sales and profit recorded at cost-plus a specified fee, which may differ from what the selling entity would be able to obtain on sales to external customers. Eliminations includes intersegment sales and profit eliminations. Corporate operating income includes expenses that represent unallocated costs and certain other corporate costs not considered part of management’s evaluation of reportable segment operating performance. Acquisition accounting adjustments include the adjustments to record acquired deferred revenue at fair value as part of our purchase price allocation process and the amortization of acquired intangible assets related to historical acquisitions.
Segment financial results were as follows:
Total Net Sales (in millions) | 2016 | 2015 | 2014 | ||||||||
Integrated Defense Systems | $ | 5,476 | $ | 5,847 | $ | 5,600 | |||||
Intelligence, Information and Services | 6,194 | 6,111 | 6,222 | ||||||||
Missile Systems | 7,071 | 6,556 | 6,309 | ||||||||
Space and Airborne Systems | 6,199 | 5,796 | 6,075 | ||||||||
Forcepoint | 566 | 328 | 104 | ||||||||
Eliminations | (1,360 | ) | (1,330 | ) | (1,481 | ) | |||||
Total business segment sales | 24,146 | 23,308 | 22,829 | ||||||||
Acquisition Accounting Adjustments | (77 | ) | (61 | ) | (3 | ) | |||||
Total | $ | 24,069 | $ | 23,247 | $ | 22,826 | |||||
Intersegment Sales (in millions) | 2016 | 2015 | 2014 | ||||||||
Integrated Defense Systems | $ | 69 | $ | 64 | $ | 96 | |||||
Intelligence, Information and Services | 657 | 624 | 686 | ||||||||
Missile Systems | 122 | 143 | 140 | ||||||||
Space and Airborne Systems | 493 | 484 | 548 | ||||||||
Forcepoint | 19 | 15 | 11 | ||||||||
Total | $ | 1,360 | $ | 1,330 | $ | 1,481 | |||||
119
Operating Income (in millions) | 2016 | 2015 | 2014 | ||||||||
Integrated Defense Systems | $ | 950 | $ | 864 | $ | 928 | |||||
Intelligence, Information and Services | 467 | 646 | 532 | ||||||||
Missile Systems | 916 | 868 | 801 | ||||||||
Space and Airborne Systems | 817 | 829 | 886 | ||||||||
Forcepoint | 51 | 30 | 11 | ||||||||
Eliminations | (141 | ) | (140 | ) | (149 | ) | |||||
Total business segment operating income | 3,060 | 3,097 | 3,009 | ||||||||
Acquisition Accounting Adjustments | (198 | ) | (168 | ) | (55 | ) | |||||
FAS/CAS Adjustment | 435 | 185 | 286 | ||||||||
Corporate | (57 | ) | (101 | ) | (61 | ) | |||||
Total | $ | 3,240 | $ | 3,013 | $ | 3,179 | |||||
Intersegment Operating Income (in millions) | 2016 | 2015 | 2014 | ||||||||
Integrated Defense Systems | $ | 4 | $ | 2 | $ | 7 | |||||
Intelligence, Information and Services | 65 | 68 | 67 | ||||||||
Missile Systems | 12 | 15 | 14 | ||||||||
Space and Airborne Systems | 46 | 47 | 52 | ||||||||
Forcepoint | 14 | 8 | 9 | ||||||||
Total | $ | 141 | $ | 140 | $ | 149 | |||||
We must calculate our pension and PRB costs under both FAS requirements under U.S. GAAP and CAS requirements. U.S. GAAP outlines the methodology used to determine pension expense or income for financial reporting purposes, which is not indicative of the funding requirements for pension and PRB plans that we determine by other factors. CAS prescribes the allocation to and recovery of pension and PRB costs on U.S. government contracts. The results of each segment only include pension and PRB expense as determined under CAS. The CAS requirements for pension costs and its calculation methodology differ from the FAS requirements and calculation methodology. As a result, while both FAS and CAS use long-term assumptions in their calculation methodologies, each method results in different calculated amounts of pension and PRB cost. The FAS/CAS Adjustment, which is reported as a separate line in our segment results above, represents the difference between our pension and PRB expense or income under FAS in accordance with U.S. GAAP and our pension and PRB expense under CAS.
The components of the FAS/CAS Adjustment were as follows:
(In millions) | 2016 | 2015 | 2014 | ||||||||
FAS/CAS Pension Adjustment | $ | 435 | $ | 182 | $ | 281 | |||||
FAS/CAS PRB Adjustment | — | 3 | 5 | ||||||||
FAS/CAS Adjustment | $ | 435 | $ | 185 | $ | 286 | |||||
Capital Expenditures (in millions) | 2016 | 2015 | 2014 | ||||||||
Integrated Defense Systems | $ | 135 | $ | 124 | $ | 95 | |||||
Intelligence, Information and Services | 59 | 87 | 45 | ||||||||
Missile Systems | 135 | 62 | 56 | ||||||||
Space and Airborne Systems | 149 | 131 | 117 | ||||||||
Forcepoint | 19 | 10 | — | ||||||||
Corporate | 29 | 11 | 13 | ||||||||
Total(1) | $ | 526 | $ | 425 | $ | 326 | |||||
(1) | Total capital expenditures may not agree to our consolidated statements of cash flows due to non-cash transactions. |
120
Depreciation and Amortization (in millions) | 2016 | 2015 | 2014 | ||||||||
Integrated Defense Systems | $ | 88 | $ | 86 | $ | 90 | |||||
Intelligence, Information and Services | 65 | 48 | 47 | ||||||||
Missile Systems | 69 | 74 | 75 | ||||||||
Space and Airborne Systems | 122 | 131 | 131 | ||||||||
Forcepoint | 15 | 8 | 1 | ||||||||
Acquisition Accounting Adjustments | 121 | 107 | 52 | ||||||||
Corporate | 35 | 35 | 43 | ||||||||
Total | $ | 515 | $ | 489 | $ | 439 | |||||
Total Assets (in millions) | 2016 | 2015 | |||||
Integrated Defense Systems(1) | $ | 4,551 | $ | 4,132 | |||
Intelligence, Information and Services(1) | 4,283 | 4,380 | |||||
Missile Systems(1) | 6,878 | 6,561 | |||||
Space and Airborne Systems(1) | 6,523 | 6,416 | |||||
Forcepoint(1) | 2,514 | 2,486 | |||||
Corporate | 5,303 | 5,306 | |||||
Total | $ | 30,052 | $ | 29,281 | |||
(1) | Total assets includes intangible assets. Related amortization expense is included in Acquisition Accounting Adjustments. |
Total Net Sales by Geographic Areas (in millions) | 2016 | 2015 | 2014 | ||||||||
United States | $ | 16,517 | $ | 16,097 | $ | 16,285 | |||||
Asia/Pacific | 2,531 | 2,429 | 2,390 | ||||||||
Middle East and North Africa | 3,772 | 3,446 | 2,857 | ||||||||
All other (principally Europe) | 1,249 | 1,275 | 1,294 | ||||||||
Total | $ | 24,069 | $ | 23,247 | $ | 22,826 | |||||
The following is a breakdown of net sales to major customers:
(In millions) | 2016 | 2015 | 2014 | ||||||||
Sales to the U.S. government(1) | $ | 16,101 | $ | 15,767 | $ | 16,083 | |||||
Sales to the U.S. Department of Defense(1) | 15,355 | 14,876 | 15,059 | ||||||||
Total international sales(2) | 7,552 | 7,150 | 6,541 | ||||||||
Foreign direct commercial sales(1) | 4,653 | 4,336 | 3,579 | ||||||||
Foreign military sales through the U.S. government | 2,899 | 2,814 | 2,962 | ||||||||
(1) | Excludes foreign military sales through the U.S. government. |
(2) | Includes foreign direct commercial sales and foreign military sales through the U.S. government. Due to rounding, the total international sales percentage may not equal the sum of the percentages for foreign direct commercial sales and foreign military sales through the U.S. government. |
Property, Plant and Equipment, Net, by Geographic Area (in millions) | 2016 | 2015 | |||||
United States | $ | 2,085 | $ | 1,928 | |||
All other (principally Europe) | 81 | 77 | |||||
Total | $ | 2,166 | $ | 2,005 | |||
121
Note 18: Quarterly Operating Results (Unaudited)
2016 (in millions, except per share amounts, stock prices and workdays) | First | Second(3) | Third | Fourth | |||||||||||
Total net sales | $ | 5,763 | $ | 6,035 | $ | 6,033 | $ | 6,238 | |||||||
Gross margin | 1,363 | 1,655 | 1,521 | 1,583 | |||||||||||
Income from continuing operations | 404 | 705 | 523 | 541 | |||||||||||
Net income attributable to Raytheon Company | 429 | 709 | 529 | 544 | |||||||||||
EPS from continuing operations attributable to Raytheon Company common stockholders(1) | |||||||||||||||
Basic | $ | 1.43 | 2.39 | $ | 1.79 | $ | 1.84 | ||||||||
Diluted | 1.43 | 2.38 | 1.79 | 1.84 | |||||||||||
EPS attributable to Raytheon Company common stockholders(1) | |||||||||||||||
Basic | 1.43 | 2.39 | 1.79 | 1.84 | |||||||||||
Diluted | 1.43 | 2.38 | 1.79 | 1.84 | |||||||||||
Cash dividends per share | |||||||||||||||
Declared | 0.7325 | 0.7325 | 0.7325 | 0.7325 | |||||||||||
Paid | 0.6700 | 0.7325 | 0.7325 | 0.7325 | |||||||||||
Common stock prices | |||||||||||||||
High | 128.24 | 136.66 | 142.65 | 150.54 | |||||||||||
Low | 117.62 | 124.22 | 134.90 | 132.97 | |||||||||||
Workdays(2) | 65 | 64 | 63 | 57 | |||||||||||
2015 (in millions, except per share amounts, stock prices and workdays) | First(4) | Second | Third | Fourth | |||||||||||
Total net sales | $ | 5,288 | $ | 5,848 | $ | 5,783 | $ | 6,328 | |||||||
Gross margin | 1,455 | 1,323 | 1,375 | 1,520 | |||||||||||
Income from continuing operations | 554 | 502 | 444 | 554 | |||||||||||
Net income attributable to Raytheon Company | 551 | 505 | 447 | 571 | |||||||||||
EPS from continuing operations attributable to Raytheon Company common stockholders(1) | |||||||||||||||
Basic | $ | 1.79 | $ | 1.65 | $ | 1.47 | $ | 1.85 | |||||||
Diluted | 1.78 | 1.65 | 1.47 | 1.85 | |||||||||||
EPS attributable to Raytheon Company common stockholders(1) | |||||||||||||||
Basic | 1.79 | 1.65 | 1.47 | 1.89 | |||||||||||
Diluted | 1.79 | 1.65 | 1.47 | 1.89 | |||||||||||
Cash dividends per share | |||||||||||||||
Declared | 0.670 | 0.670 | 0.670 | 0.670 | |||||||||||
Paid | 0.605 | 0.670 | 0.670 | 0.670 | |||||||||||
Common stock prices | |||||||||||||||
High | 112.40 | 110.99 | 110.33 | 127.95 | |||||||||||
Low | 100.05 | 97.79 | 95.57 | 105.69 | |||||||||||
Workdays(2) | 61 | 64 | 63 | 61 | |||||||||||
(1) | EPS is computed independently for each of the quarters presented; therefore, the sum of the quarterly earnings per share may not equal the total computed for each year. |
(2) | Number of workdays per our fiscal calendar, which excludes holidays and weekends. |
(3) | In the second quarter 2016, we recorded the sale of our equity method investment in TRS SAS at fair value, which resulted in a tax-free gain of $158 million, at IDS, that was recorded in operating income through a reduction in cost of sales. |
(4) | In March 2015, RSL recorded a settlement with the UK Home Office concluding the parties' dispute regarding the UK Home Office's July 2010 termination of RSL's eBorders contract within our IIS segment. After certain expenses and derecognition of outstanding receivables, IIS recorded $181 million in operating income through a reduction in cost of sales in the first quarter of 2015. |
122
ITEM 9. CHANGES IN AND DISAGREEMENTS WITH ACCOUNTANTS ON ACCOUNTING AND FINANCIAL DISCLOSURE
None.
ITEM 9A. CONTROLS AND PROCEDURES
Evaluation of Disclosure Controls and Procedures
Management has conducted an evaluation, under the supervision and with the participation of the Chief Executive Officer and Chief Financial Officer, of the effectiveness of the design and operation of our disclosure controls and procedures (as defined in Rules 13a–15(e) and 15d–15(e) of the Securities Exchange Act of 1934) as of December 31, 2016.
Conclusion of Evaluation—Based on this evaluation, the Chief Executive Officer and Chief Financial Officer concluded that our disclosure controls and procedures as of December 31, 2016 were effective.
Inherent Limitations on Effectiveness of Controls—In designing and evaluating our disclosure controls and procedures, management recognizes that any control, no matter how well designed and operated, can provide only reasonable, not absolute, assurance of achieving the desired control objectives. Due to the inherent limitations in all control systems, no evaluation of controls can provide absolute assurance that misstatements due to error or fraud will not occur or that all control issues and instances of fraud, if any, within the Company have been detected.
Evaluation of Internal Control Over Financial Reporting
Management’s Report on Internal Control Over Financial Reporting—Management’s Report on Internal Control Over Financial Reporting is set forth in Part II, Item 8 of this Annual Report on Form 10-K.
Report of the Independent Registered Public Accounting Firm—The effectiveness of our internal control over financial reporting as of December 31, 2016 has been audited by PricewaterhouseCoopers LLP, an independent registered public accounting firm, as stated in their report which is set forth in Part II, Item 8 of this Annual Report on Form 10-K.
Changes in Internal Control Over Financial Reporting—There were no changes in our internal control over financial reporting during the fourth quarter of 2016 that have materially affected or are reasonably likely to materially affect our internal control over financial reporting.
ITEM 9B. OTHER INFORMATION
None.
PART III
ITEM 10. DIRECTORS, EXECUTIVE OFFICERS AND CORPORATE GOVERNANCE
Information regarding members of our Board of Directors will be contained in our definitive proxy statement for the 2017 Annual Meeting of Stockholders under the caption “Election of Directors” and is incorporated herein by reference. Information regarding our executive officers is contained in Part I of this Form 10-K under the caption "Executive Officers of the Registrant". Information regarding Section 16(a) compliance will be contained in our definitive proxy statement under the caption “Section 16(a) Beneficial Ownership Reporting Compliance” and is incorporated herein by reference. Information regarding our Audit Committee and our Audit Committee Financial Expert will be contained in our definitive proxy statement under the caption “The Board of Directors and Board Committees” and is incorporated herein by reference.
We have adopted a code of ethics that applies to all of our directors, officers, employees and representatives. Information regarding our Code of Ethics will be contained in our definitive proxy statement for the 2017 Annual Meeting of Stockholders under the caption “Corporate Governance—Code of Ethics and Conflicts of Interest” and is incorporated herein by reference.
Information regarding the procedures by which our stockholders may recommend nominees to our Board of Directors will be contained in our definitive proxy statement for the 2017 Annual Meeting of Stockholders under the caption “Corporate Governance—Director Nomination Process”.
123
ITEM 11. EXECUTIVE COMPENSATION
This information will be contained in our definitive proxy statement for the 2017 Annual Meeting of Stockholders under the captions “Executive Compensation”, “Director Compensation” and “The Board of Directors and Board Committees—Compensation Committee Interlocks and Insider Participation” and is incorporated herein by reference.
ITEM 12. SECURITY OWNERSHIP OF CERTAIN BENEFICIAL OWNERS AND MANAGEMENT AND RELATED STOCKHOLDER MATTERS
Information regarding security ownership of certain beneficial owners and for directors and executive officers will be contained in our definitive proxy statement for the 2017 Annual Meeting of Stockholders under the caption “Stock Ownership” and is incorporated herein by reference. Information regarding securities authorized for issuance under our executive compensation plans is contained in Part II, Item 5 of this Annual Report on Form 10-K.
ITEM 13. CERTAIN RELATIONSHIPS AND RELATED TRANSACTIONS, AND DIRECTOR INDEPENDENCE
This information will be contained in our definitive proxy statement for the 2017 Annual Meeting of Stockholders under the captions “Corporate Governance—Board Independence”, “Corporate Governance—Transactions with Related Persons” and “Stock Ownership—Five Percent Stockholders” and is incorporated herein by reference.
ITEM 14. PRINCIPAL ACCOUNTANT FEES AND SERVICES
This information will be contained in our definitive proxy statement for the 2017 Annual Meeting of Stockholders under the caption “Independent Auditors: Audit and Non-Audit Fees” and is incorporated herein by reference.
PART IV
ITEM 15. EXHIBITS AND FINANCIAL STATEMENT SCHEDULES
(a) | Financial Statements and Schedules |
(1) | The following financial statements of Raytheon Company, supplemental information and report of independent registered public accounting firm are included in this Form 10-K: |
Consolidated Balance Sheets at December 31, 2016 and 2015
Consolidated Statements of Operations for the Years Ended December 31, 2016, 2015 and 2014
Consolidated Statements of Comprehensive Income for the Years Ended December 31, 2016, 2015 and 2014
Consolidated Statements of Equity for the Years Ended December 31, 2016, 2015 and 2014
Consolidated Statements of Cash Flows for the Years Ended December 31, 2016, 2015 and 2014
Notes to Consolidated Financial Statements
Five-Year Statistical Summary (Unaudited)
Report of PricewaterhouseCoopers LLP dated February 15, 2017 on the Company’s financial statements filed as a part hereof for the fiscal years ended December 31, 2016, 2015 and 2014 and on the Company’s internal control over financial reporting as of December 31, 2016 is included in Part II, Item 8 of this Annual Report on Form 10-K. The independent registered public accounting firm’s consent with respect to this report appears in Exhibit 23 of this Annual Report on Form 10-K.
(2) List of financial statement schedules:
All schedules have been omitted because they are not required, not applicable or the information is otherwise included.
124
(b) | Exhibits: |
The following list of exhibits includes exhibits submitted with this Form 10-K as filed with the SEC and those incorporated by reference to other filings.
3.1 | Raytheon Company Restated Certificate of Incorporation, restated as of April 2, 2002, filed as an exhibit to the Company’s Registration Statement on Form S-3, File No. 333-85648, is hereby incorporated by reference. |
3.2 | Certificate of Amendment of Restated Certificate of Incorporation of Raytheon Company, amended as of May 5, 2005, filed as an exhibit to the Company’s Current Report on Form 8-K filed May 9, 2005, is hereby incorporated by reference. |
3.3 | Certificate of Amendment of Restated Certificate of Incorporation of Raytheon Company, as amended as of June 2, 2010, filed as an exhibit to the Company’s Quarterly Report on Form 10-Q for the quarter ended June 27, 2010, is hereby incorporated by reference. |
3.4 | Certificate of Amendment of Restated Certificate of Incorporation of Raytheon Company, as amended as of May 29, 2014, filed as an exhibit to the Company’s Definitive Proxy Statement for the year ended December 31, 2013, is hereby incorporated by reference. |
3.5 | Raytheon Company Amended and Restated By-Laws, as amended as of May 26, 2016, filed as an exhibit to the Company’s Form S-3 Registration Statement filed June 6, 2016, is hereby incorporated by reference. |
4.1 | Indenture relating to Senior Debt Securities dated as of July 3, 1995, between Raytheon Company and The Bank of New York, Trustee, filed as an exhibit to the former Company’s Registration Statement on Form S-3, File No. 33-59241, is hereby incorporated by reference. |
4.2 | Indenture relating to Subordinated Debt Securities dated as of July 3, 1995, between Raytheon Company and The Bank of New York, Trustee, filed as an exhibit to the former Company’s Registration Statement on Form S-3, File No. 33-59241, is hereby incorporated by reference. |
4.3 | Supplemental Indenture dated as of December 17, 1997, between Raytheon Company and The Bank of New York, Trustee, filed as an exhibit to the Company’s Annual Report on Form 10-K for the year ended December 31, 1997, is hereby incorporated by reference. |
4.4 | Second Supplemental Indenture, dated as of May 9, 2001, between Raytheon Company and The Bank of New York, Trustee, filed as an exhibit to the Company’s Current Report on Form 8-K filed May 10, 2001, is hereby incorporated by reference. |
4.5 | Form of Senior Debt Securities, filed as an exhibit to the Company’s Registration Statement on Form S-3, File No. 333-58474, is hereby incorporated by reference. |
4.6 | Form of Subordinated Debt Securities, filed as an exhibit to the Company’s Registration Statement on Form S-3, File No. 333-58474, is hereby incorporated by reference. |
4.7 | Agreement of Resignation, Appointment and Acceptance, dated April 1, 2005, between Raytheon Company and The Bank of New York appointing Successor Trustee, Paying Agent and Registrar in connection with certain securities originally authorized and issued under the Indenture dated as of July 3, 1995, filed as an exhibit to the Company’s Quarterly Report on Form 10-Q for the quarter ended March 27, 2005, is hereby incorporated by reference. |
No other instruments defining the rights of holders of long-term debt are filed since the total amount of securities authorized under any such instrument does not exceed 10% of the total assets of the Company on a consolidated basis. The Company agrees to furnish a copy of such instruments to the SEC upon request.
10.1 | Raytheon Company 2001 Stock Plan, as amended on September 21, 2005, filed as an exhibit to the Company’s Quarterly Report on Form 10-Q for the quarter ended September 25, 2005, is hereby incorporated by reference. |
125
10.2 | Raytheon 2010 Stock Plan, filed as Appendix B to the Company’s definitive proxy statement filed on April 26, 2010, is hereby incorporated by reference. |
10.3 | Amendment No. 1 to Raytheon 2010 Stock Plan, filed as an exhibit to the Company’s Quarterly Report on Form 10-Q for the quarter ended September 26, 2010, is hereby incorporated by reference. |
10.4 | Raytheon Company 1997 Nonemployee Directors Restricted Stock Plan, as amended on September 21, 2005, filed as an exhibit to the Company’s Quarterly Report on Form 10-Q for the quarter ended September 25, 2005, is hereby incorporated by reference. |
10.5 | Raytheon Company Excess Savings Plan, as amended and restated effective as of January 1, 2009, as further amended effective January 1, 2010 and November 1, 2013, filed as an exhibit to the Company's Annual Report for the year ended December 31, 2013, is hereby incorporated by reference. |
10.6 | Raytheon Company Excess Pension Plan, as amended and restated effective as of January 1, 2009, as further amended effective January 1, 2009, filed as an exhibit to the Company's Annual Report for the year ended December 31, 2013, is hereby incorporated by reference. |
10.7 | Raytheon Company Supplemental Executive Retirement Plan, as amended and restated effective as of January 1, 2009, as further amended effective January 1, 2011, filed as an exhibit to the Company's Annual Report for the year ended December 31, 2013, is hereby incorporated by reference. |
10.8 | Raytheon Company Deferred Compensation Plan, as amended and restated effective as of January 1, 2009, as further amended effective January 1, 2009, January 1, 2010, May 6, 2010 and November 1, 2013, filed as an exhibit to the Company's Annual Report for the year ended December 31, 2013, is hereby incorporated by reference. |
10.9 | Form of Incentive Stock Option Agreement under the Raytheon Company 2001 Stock Plan, filed as an exhibit to the Company’s Quarterly Report on Form 10-Q for the quarter ended September 26, 2004, is hereby incorporated by reference. |
10.10 | Form of Nonqualified Stock Option Agreement under the Raytheon Company 2001 Stock Plan, filed as an exhibit to the Company’s Quarterly Report on Form 10-Q for the quarter ended September 26, 2004, is hereby incorporated by reference. |
10.11 | Form of Restricted Stock Agreement under the Raytheon 2010 Stock Plan, filed as an exhibit to the Company’s Quarterly Report on Form 10-Q for the quarter ended September 26, 2010, is hereby incorporated by reference. |
10.12 | Form of Restricted Stock Unit Agreement under the Raytheon 2010 Stock Plan, filed as an exhibit to the Company’s Quarterly Report on Form 10-Q for the quarter ended September 26, 2010, is hereby incorporated by reference. |
10.13 | Form of Performance Stock Unit Award Agreement with respect to the Long-term Performance Plan, under the Raytheon 2010 Stock Plan, filed as an exhibit to the Company’s Quarterly Report on Form 10-Q for the quarter ended September 26, 2010, is hereby incorporated by reference. |
10.14 | Form of Restricted Stock Unit Agreement for U.K. employees under the Raytheon 2010 Stock Plan, filed as an exhibit to the Company’s Quarterly Report on Form 10-Q for the quarter ended September 26, 2010, is hereby incorporated by reference. |
10.15 | Form of Restricted Stock Unit Agreement for Certain Retirement Eligible Employees under the Raytheon 2010 Stock Plan, filed as an exhibit to the Company's Quarterly Report on Form 10-Q for the quarter ended March 30, 2014, is hereby incorporated by reference. |
10.16 | Form of Restricted Stock Unit Agreement for Certain Retirement Eligible Non U.S. Employees under the Raytheon 2010 Stock Plan, filed as an exhibit to the Company's Quarterly Report on Form 10-Q for the quarter ended March 30, 2014, is hereby incorporated by reference. |
10.17 | Form of Restricted Stock Award Agreement under the 1997 Nonemployee Directors Restricted Stock Plan, filed as an exhibit to the Company’s Current Report on Form 8-K filed May 9, 2005, is hereby incorporated by reference. |
126
10.18 | Form of Stock Award Agreement under the 1997 Nonemployee Directors Restricted Stock Plan, filed as an exhibit to the Company’s Quarterly Report on Form 10-Q for the quarter ended June 29, 2008, is hereby incorporated by reference. |
10.19 | Form of Change in Control Severance Agreement between the Company and certain executive officers (providing for benefits in the event of a qualified termination upon a change in control of three times base salary and bonus), filed as an exhibit to the Company’s Annual Report on Form 10-K for the year ended December 31, 2009, is hereby incorporated by reference. |
10.20 | Form of Change in Control Severance Agreement between the Company and certain executive officers (providing for benefits in the event of a qualified termination upon a change in control of two times base salary and bonus), filed as an exhibit to the Company’s Annual Report on Form 10-K for the year ended December 31, 2009, is hereby incorporated by reference. |
10.21 | Form of Amendment to Change in Control Severance Agreement between the Company and its executive officers, filed as an exhibit to the Company’s Annual Report on Form 10-K for the year ended December 31, 2009, is hereby incorporated by reference. |
10.22 | Form of Change in Control Severance Agreement between the Company and certain executive officers (providing for benefits in the event of a qualified termination upon a change in control of one times base salary and bonus), filed as an exhibit to the Company’s current Report on Form 10-Q for the quarter ended April 3, 2016, is hereby incorporated by reference. |
10.23 | Summary of Executive Severance and Change in Control Guidelines, filed as an exhibit to the Company's Annual Report on Form 10-K for the year ended December 31, 2013, is hereby incorporated by reference. |
10.24 | Agreement between Raytheon Company and William H. Swanson, filed as an exhibit to the Company’s Current Report on Form 8-K filed July 28, 2014, is hereby incorporated by reference. |
10.25 | Summary of Executive Perquisites Policy, filed as an exhibit to the Company's Annual Report for the year ended December 31, 2013, is hereby incorporated by reference. |
10.26 | Summary of Key Employee Permanent Domestic Relocation Policy, filed as an exhibit to the Company’s Annual Report on Form 10-K for the year ended December 31, 2009, is hereby incorporated by reference. |
10.27 | Letter Agreement dated February 21, 2006 between Raytheon Company and David C. Wajsgras, filed as an exhibit to the Company’s Current Report on Form 8-K filed February 28, 2006, is hereby incorporated by reference. |
10.28 | Summary of the Raytheon Company Results-Based Incentive Program, filed as an exhibit to the Company’s Current Report on Form 8-K filed December 14, 2006, is hereby incorporated by reference. |
10.29 | Summary of the Raytheon Company Long-term Performance Plan, filed as an exhibit to the Company's Annual Report for the year ended December 31, 2013, is hereby incorporated by reference. |
10.30 | Form of Indemnification Agreement between the Company and each of its directors and executive officers, filed as an exhibit to the Company’s Quarterly Report on Form 10-Q for the quarter ended September 23, 2007, is hereby incorporated by reference. |
10.31 | Form of Clawback Policy Acknowledgement, filed as an exhibit to the Company’s Annual Report on Form 10-K for the year ended December 31, 2009, is hereby incorporated by reference. |
10.32 | Agreement dated January 15, 2015 by and between Raytheon Company and Jay B. Stephens, filed as an exhibit to the Company’s Quarterly Report on Form 10-Q for the quarter ended March 29, 2015, is hereby incorporated by reference. |
10.33 | Transition Agreement dated July 30, 2015 between Raytheon Company and Daniel J. Crowley, filed as an exhibit to the Company’s Current Report on Form 8-K filed August 11, 2015, is hereby incorporated by reference. |
10.34 | Letter Agreement dated January 21, 2015 by and between the Company and Anthony F. O'Brien, filed as an exhibit to the Company’s current Report on Form 10-Q for the quarter ended April 3, 2016, is hereby incorporated by reference. |
127
10.35 | Letter Agreement dated December 16, 2014 by and between the Company and Frank R. Jimenez, filed as an exhibit to the Company’s current Report on Form 10-Q for the quarter ended April 3, 2016, is hereby incorporated by reference. |
10.36 | Amendment to Letter Agreement dated January 23, 2015 by and between the Company and Frank R. Jimenez, filed as an exhibit to the Company’s current Report on Form 10-Q for the quarter ended April 3, 2016, is hereby incorporated by reference. |
10.37 | Five-Year Competitive Advance and Revolving Credit Agreement by and among Raytheon Company as the Borrower, the Lenders named therein, and JPMorgan Chase Bank, N.A. as Administrative Agent, dated as of November 13, 2015, filed as an exhibit to the Company’s Current Report on Form 8-K filed November 16, 2015, is hereby incorporated by reference. |
12 | Statement regarding Computation of Ratio of Earnings to Fixed Charges for the year ended December 31, 2016.* |
21 | Subsidiaries of Raytheon Company.* |
23 | Consent of Independent Registered Public Accounting Firm.* |
31.1 | Certification of Thomas A. Kennedy pursuant to Section 302 of the Sarbanes-Oxley Act of 2002.* |
31.2 | Certification of Anthony F. O'Brien pursuant to Section 302 of the Sarbanes-Oxley Act of 2002.* |
32.1 | Certification of Thomas A. Kennedy pursuant to 18 U.S.C. Section 1350, as Adopted Pursuant to Section 906 of the Sarbanes-Oxley Act of 2002.** |
32.2 | Certification of Anthony F. O'Brien pursuant to 18 U.S.C. Section 1350, as Adopted Pursuant to Section 906 of the Sarbanes-Oxley Act of 2002.** |
101 | The following materials from Raytheon Company’s Annual Report on Form 10-K for the year ended December 31, 2016, formatted in eXtensible Business Reporting Language (XBRL): (i) the Consolidated Balance Sheets; (ii) Consolidated Statements of Operations; (iii) Consolidated Statements of Comprehensive Income; (iv) Consolidated Statements of Equity; (v) Consolidated Statements of Cash Flows; and (vi) Notes to Consolidated Financial Statements.* |
(Exhibits marked with an asterisk (*) are filed electronically herewith.)
(Exhibits marked with two asterisks (**) are deemed to be furnished electronically herewith, and not filed.)
ITEM 16. FORM 10-K SUMMARY
Not applicable.
128
SIGNATURES
Pursuant to the requirements of Section 13 or 15(d) of the Securities Exchange Act of 1934, the Registrant has duly caused this report to be signed on its behalf by the undersigned, thereunto duly authorized.
RAYTHEON COMPANY | ||||
/s/ Michael J. Wood | ||||
Michael J. Wood Vice President, Controller and Chief Accounting Officer | ||||
Dated: February 15, 2017
Pursuant to the requirements of the Securities Exchange Act of 1934, this report has been signed below by the following persons on behalf of the Registrant and in the capacities and on the dates indicated.
SIGNATURES | TITLE | DATE | ||
/s/ Thomas A. Kennedy | Chairman and Chief Executive Officer (Principal Executive Officer) | February 15, 2017 | ||
Thomas A. Kennedy | ||||
/s/ Anthony F. O'Brien | Vice President and Chief Financial Officer (Principal Financial Officer) | February 15, 2017 | ||
Anthony F. O'Brien | ||||
/s/ Michael J. Wood | Vice President, Controller and Chief Accounting Officer (Principal Accounting Officer) | February 15, 2017 | ||
Michael J. Wood | ||||
/s/ Tracy A. Atkinson | Director | February 15, 2017 | ||
Tracy A. Atkinson | ||||
/s/ Robert E. Beauchamp | Director | February 15, 2017 | ||
Robert E. Beauchamp | ||||
/s/ Vernon E. Clark | Director | February 15, 2017 | ||
Vernon E. Clark | ||||
/s/ Stephen J. Hadley | Director | February 15, 2017 | ||
Stephen J. Hadley | ||||
/s/ Letitia A. Long | Director | February 15, 2017 | ||
Letitia A. Long | ||||
/s/ George R. Oliver | Director | February 15, 2017 | ||
George R. Oliver | ||||
/s/ Dinesh C. Paliwal | Director | February 15, 2017 | ||
Dinesh C. Paliwal | ||||
/s/ Michael C. Ruettgers | Director | February 15, 2017 | ||
Michael C. Ruettgers | ||||
/s/ William R. Spivey | Director | February 15, 2017 | ||
William R. Spivey | ||||
/s/ James A. Winnefeld, Jr. | Director | February 15, 2017 | ||
James A. Winnefeld, Jr. | ||||
129