Attached files
| file | filename |
|---|---|
| 8-K - 8-K - NEWFIELD EXPLORATION CO /DE/ | a17-4188_28k.htm |
Exhibit 99.1
Credit Suisse 22nd Annual Energy Summit Larry S. Massaro – Executive Vice President & CFO

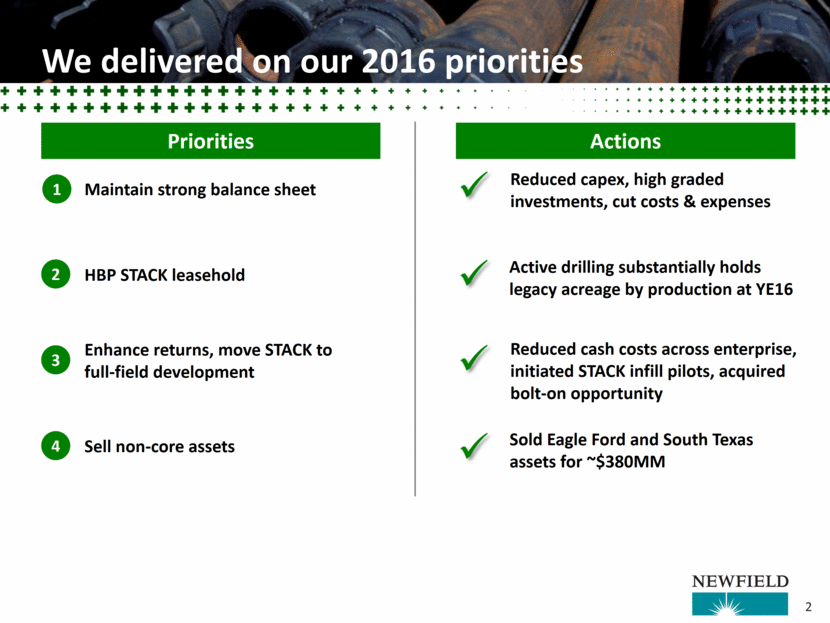
We delivered on our 2016 priorities Priorities Actions 4 Maintain strong balance sheet HBP STACK leasehold Enhance returns, move STACK to full-field development Sell non-core assets 3 2 1 Reduced capex, high graded investments, cut costs & expenses Active drilling substantially holds legacy acreage by production at YE16 Reduced cash costs across enterprise, initiated STACK infill pilots, acquired bolt-on opportunity Sold Eagle Ford and South Texas assets for ~$380MM 2
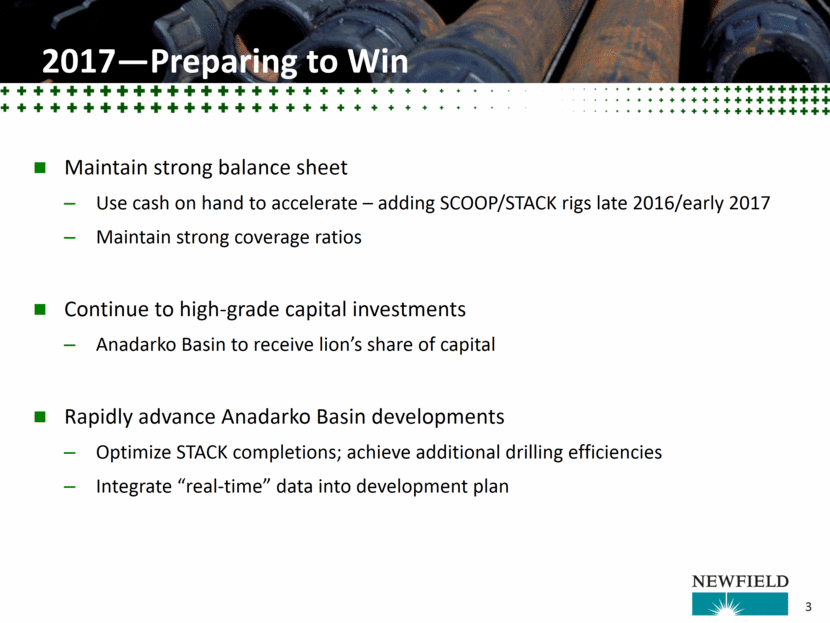
Maintain strong balance sheet Use cash on hand to accelerate – adding SCOOP/STACK rigs late 2016/early 2017 Maintain strong coverage ratios Continue to high-grade capital investments Anadarko Basin to receive lion’s share of capital Rapidly advance Anadarko Basin developments Optimize STACK completions; achieve additional drilling efficiencies Integrate “real-time” data into development plan 2017—Preparing to Win 3
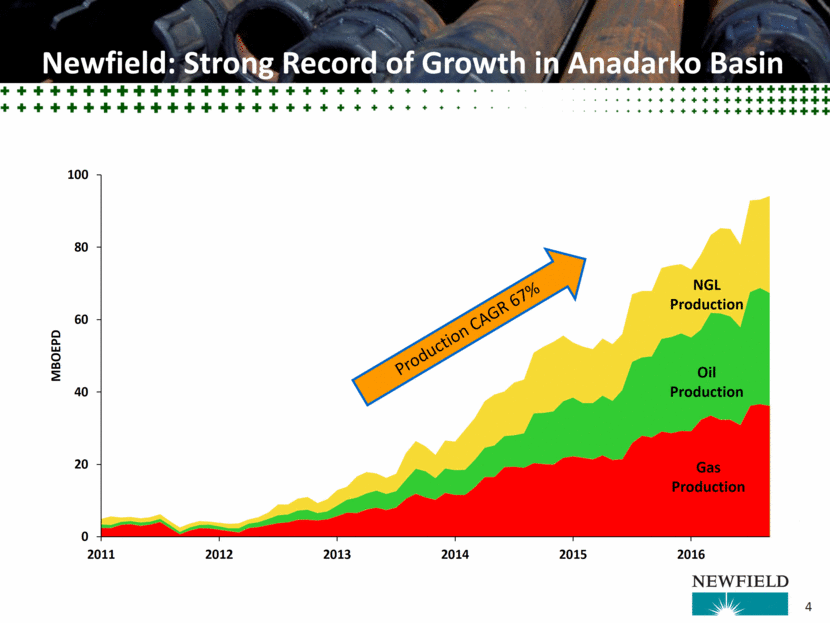
Newfield: Strong Record of Growth in Anadarko Basin Production CAGR 67% Oil Production Gas Production NGL Production 4 0 20 40 60 80 100 2011 2012 2013 2014 2015 2016 MBOEPD
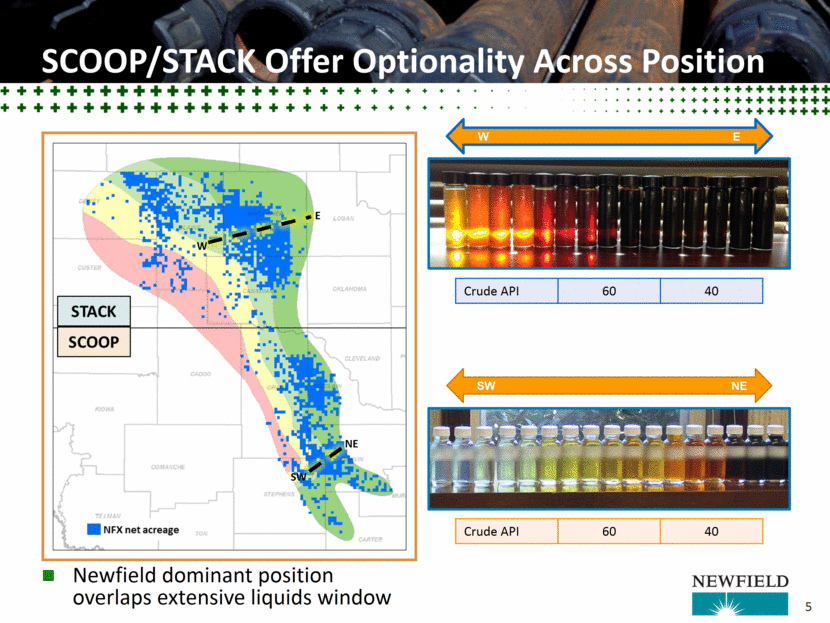
SCOOP/STACK Offer Optionality Across Position Newfield dominant position overlaps extensive liquids window E W NE SW Crude API 60 40 Crude API 60 40 W E SW NE 5
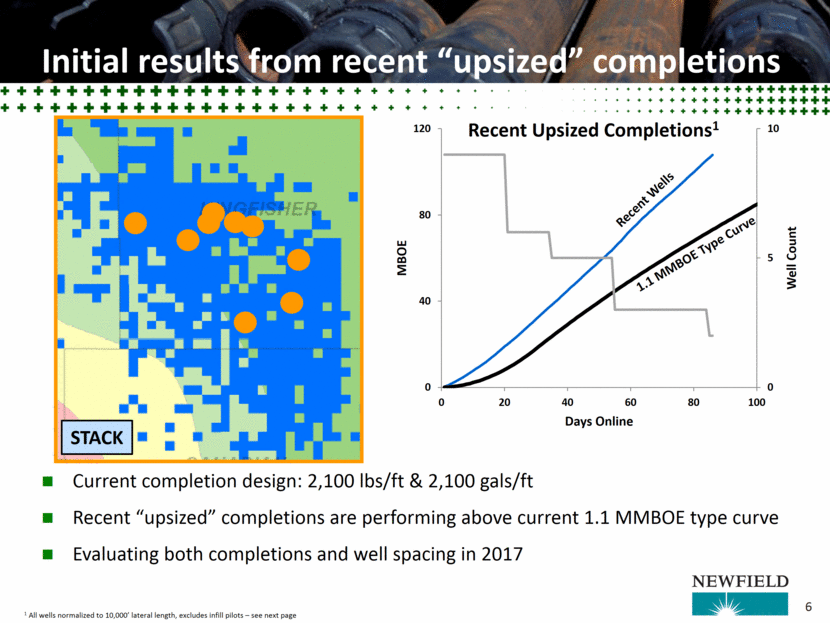
Initial results from recent “upsized” completions Current completion design: 2,100 lbs/ft & 2,100 gals/ft Recent “upsized” completions are performing above current 1.1 MMBOE type curve Evaluating both completions and well spacing in 2017 1.1 MMBOE Type Curve Recent Wells 1 All wells normalized to 10,000’ lateral length, excludes infill pilots – see next page 6 STACK 0 5 10 0 40 80 120 0 20 40 60 80 100 Well Count MBOE Days Online Recent Upsized Completions 1
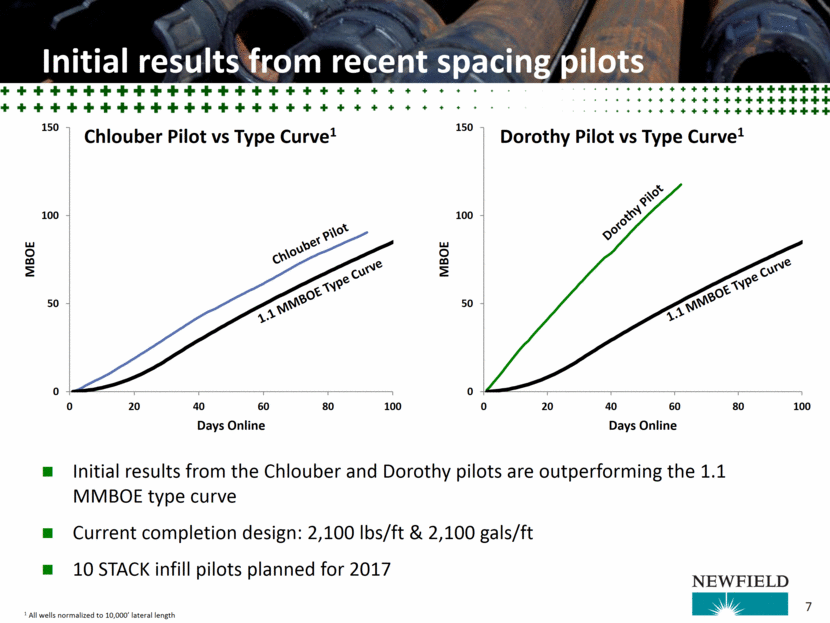
Initial results from recent spacing pilots 1.1 MMBOE Type Curve Dorothy Pilot 1 All wells normalized to 10,000’ lateral length 7 Initial results from the Chlouber and Dorothy pilots are outperforming the 1.1 MMBOE type curve Current completion design: 2,100 lbs/ft & 2,100 gals/ft 10 STACK infill pilots planned for 2017 1.1 MMBOE Type Curve Chlouber Pilot 0 50 100 150 0 20 40 60 80 100 MBOE Days Online Dorothy Pilot vs Type Curve 1 0 50 100 150 0 20 40 60 80 100 MBOE Days Online Chlouber Pilot vs Type Curve 1
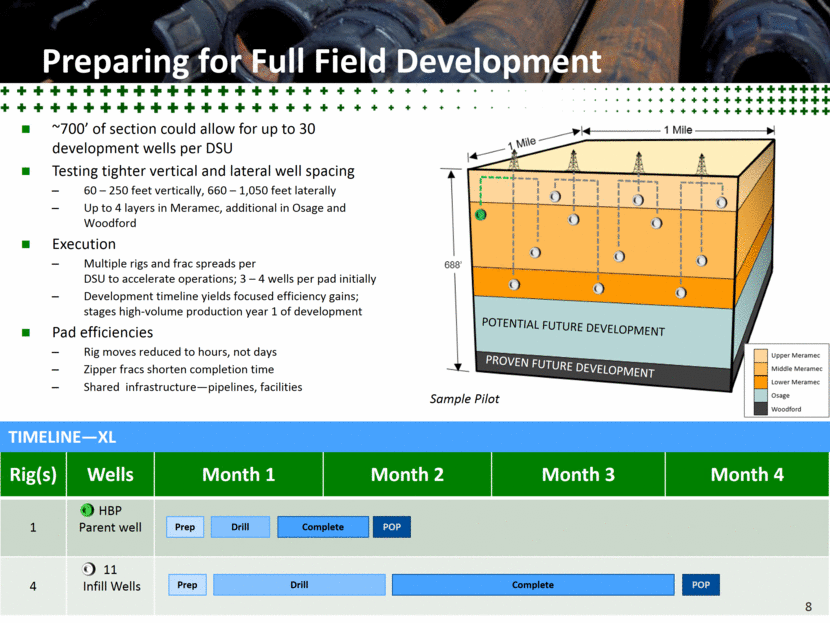
Preparing for Full Field Development 8 Rig(s) Wells Month 1 Month 2 Month 3 Month 4 1 HBP Parent well 4 11 Infill Wells Drill Prep Complete POP Drill Prep Complete POP TIMELINE—XL ~700’ of section could allow for up to 30 development wells per DSU Testing tighter vertical and lateral well spacing 60 – 250 feet vertically, 660 – 1,050 feet laterally Up to 4 layers in Meramec, additional in Osage and Woodford Execution Multiple rigs and frac spreads per DSU to accelerate operations; 3 – 4 wells per pad initially Development timeline yields focused efficiency gains; stages high-volume production year 1 of development Pad efficiencies Rig moves reduced to hours, not days Zipper fracs shorten completion time Shared infrastructure—pipelines, facilities POTENTIAL FUTURE DEVELOPMENT PROVEN FUTURE DEVELOPMENT Sample Pilot 8
Improved capital structure 1 Net debt represents principal balance of debt less cash on balance sheet. Adjusted EBITDA calculated per credit agreement definition; Q3’2016 reflects 5th amendment executed 3/18/2016. See slide 13. Net debt / adj EBITDA1 Fixed debt maturity schedule $ millions No maturities for 5+ years Improved liquidity (Bn)1 +1.0 Bn Increased liquidity $1.0 Bn Reduced total debt by $600 mm Maintained 2.0x net debt / EBITDA Staggered debt maturities $2.6 Bn of hedging gains since 2009 Highlights 9 $750 $ 1,000 $700 2016 2018 2020 2022 2024 2026 1.9x 1.9x 1.9x YE 2014 YE 2015 Q3'2016 $1.5 $2.5 2012 2016
Track Record: Did it can do it again Weathered commodity price cycles History of finding and developing valuable plays Proven operator Asset Quality The Anadarko Basin provides premium returns TODAY Development mode lies ahead efficiency improvements apparent Inventory Depth Thousands of quality drilling locations Financial Strength Record of financial discipline 10 So, Why own Newfield today?
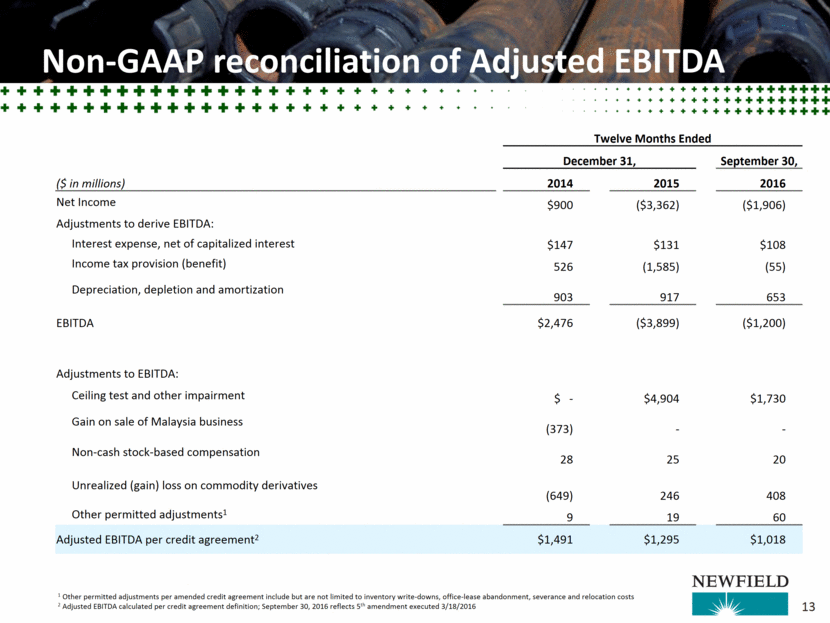
Forward looking statements and related matters This presentation contains forward-looking statements within the meaning of Section 27A of the Securities Act of 1933, as amended, and Section 21E of the Securities Exchange Act of 1934, as amended. The words “may,” “believe,” “expect,” “anticipate,” “intend,” “estimate,” “project,” “target,” “goal,” “plan,” “should,” “will,” “predict,” “guidance,” “potential” or other similar expressions are intended to identify forward-looking statements. Other than historical facts included in this presentation, all information and statements, including but not limited to information regarding planned capital expenditures, estimated reserves, estimated production targets, drilling and development plans, the timing of production, planned capital expenditures, and other plans and objectives for future operations, are forward-looking statements. Although, as of the date of this presentation, Newfield believes that these expectations are reasonable, this information is based upon assumptions and anticipated results that are subject to numerous uncertainties and risks. Actual results may vary significantly from those anticipated due to many factors, including but not limited to commodity prices, drilling results, our liquidity and the availability of capital resources, operating risks, industry conditions, China and U.S. governmental regulations, financial counterparty risks, the prices of goods and services, the availability of drilling rigs and other support services, our ability to monetize assets and repay or refinance our existing indebtedness, labor conditions, severe weather conditions, and other operating risks. Please see Newfield’s 2015 Annual Report on Form 10-K and subsequent public filings, all filed with the U.S. Securities and Exchange Commission (SEC), for a discussion of other factors that may cause actual results to vary. Unpredictable or unknown factors not discussed herein or in Newfield’s SEC filings could also have material adverse effects on actual results. Readers are cautioned not to place undue reliance on forward-looking statements, which speak only as of the date of this presentation. Unless legally required, Newfield undertakes no obligation to publicly update or revise any forward-looking statements, whether as a result of new information, future events or otherwise. This presentation has been prepared by Newfield and includes market data and other statistical information from sources believed by Newfield to be reliable, including independent industry publications, government publications or other published independent sources. Some data are also based on Newfield’s good faith estimates, which are derived from its review of internal sources as well as the independent sources described above. Although Newfield believes these sources are reliable, it has not independently verified the information and cannot guarantee its accuracy and completeness. Actual quantities that may be ultimately recovered from Newfield’s interests may differ substantially from the estimates in this presentation. Factors affecting ultimate recovery include the scope of Newfield’s ongoing drilling program, which will be directly affected by commodity prices, the availability of capital, drilling and production costs, availability of drilling services and equipment, drilling results, lease expirations, transportation constraints, regulatory approvals and other factors, and actual drilling results, including geological and mechanical factors affecting recovery rates. Newfield may use terms in this presentation, such as “EURs”, “upside potential”, “net unrisked resource”, “gross EURs”, and similar terms that the SEC’s guidelines strictly prohibit in SEC filings. These terms include reserves with substantially less certainty than proved reserves, and no discount or other adjustment is included in the presentation of such reserve numbers. Investors are urged to consider closely the oil and gas disclosures in Newfield’s 2015 Annual Report on Form 10-K and subsequent public filings, available at www.newfield.com, www.sec.gov or by writing Newfield at 4 Waterway Square Place, Suite 100, The Woodlands, Texas 77380 Attn: Investor Relations. In addition, this presentation contains non-GAAP financial measures, which include, but are not limited to, Adjusted EBITDA. Newfield defines EBITDA as net (loss) income before income tax (benefit) expense, interest expense and depreciation, depletion and amortization. Adjusted EBITDA, as presented herein, is EBITDA before ceiling test impairments, gains on asset sales, non-cash compensation expense and net unrealized (gains) / losses on commodity derivatives. Adjusted EBITDA is not a recognized term under GAAP and does not represent net income as defined under GAAP, and should not be considered an alternatives to net income as an indicator of operating performance or to cash flows as a measure of liquidity. Adjusted EBITDA is a supplemental financial measure used by Newfield’s management and by securities analysts, lenders, ratings agencies and others who follow the industry as an indicator of Newfield’s ability to internally fund exploration and development activities. 11
Appendix
Non-GAAP reconciliation of Adjusted EBITDA Twelve Months Ended December 31, September 30, ($ in millions) 2014 2015 2016 Net Income $900 ($3,362) ($1,906) Adjustments to derive EBITDA: Interest expense, net of capitalized interest $147 $131 $108 Income tax provision (benefit) 526 (1,585) (55) Depreciation, depletion and amortization 903 917 653 EBITDA $2,476 ($3,899) ($1,200) Adjustments to EBITDA: Ceiling test and other impairment $ - $4,904 $1,730 Gain on sale of Malaysia business (373) - - Non-cash stock-based compensation 28 25 20 Unrealized (gain) loss on commodity derivatives (649) 246 408 Other permitted adjustments1 9 19 60 Adjusted EBITDA per credit agreement2 $1,491 $1,295 $1,018 1 Other permitted adjustments per amended credit agreement include but are not limited to inventory write-downs, office-lease abandonment, severance and relocation costs 2 Adjusted EBITDA calculated per credit agreement definition; September 30, 2016 reflects 5th amendment executed 3/18/2016 13
