Attached files
| file | filename |
|---|---|
| EX-99.1 - EX-99.1 - MEDICAL PROPERTIES TRUST INC | d348102dex991.htm |
| 8-K - FORM 8-K - MEDICAL PROPERTIES TRUST INC | d348102d8k.htm |
Exhibit 99.2

MPT Medical Properties Trust
FOURTH QUARTER 2016
Supplemental Information
MEDICALPROPERTIESTRUST.COM
TABLE OF CONTENTS
COMPANY OVERVIEW
Company Information 3
FINANCIAL INFORMATION
Reconciliation of Net Income to Funds from Operations 5
Debt Summary 6
Pro Forma Debt Maturity Schedule 7
Pro Forma Net Debt /Annualized EBITDA 8
PORTFOLIO INFORMATION
Lease and Mortgage Loan Maturity Schedule 9
Investments and Revenue by Asset Type, Operator,
State and Country 10
EBITDAR to Rent Coverage 13
Summary of Acquisitions and
Development Projects 14
FINANCIAL STATEMENTS
Consolidated Statements of
Income 15
Consolidated Balance Sheets 16
Other Income Generating Assets 17
FORWARD-LOOKING STATEMENT Forward-looking statements involve known and unknown risks, uncertainties and other factors that may cause the actual results of the
Company or future events to differ materially from those expressed in or underlying such forward-looking statements, including without limitation: Normalized FFO per share; expected payout ratio, the amount of acquisitions of healthcare real estate,
if any; estimated debt metrics, portfolio diversification, capital markets conditions, the repayment of debt arrangements; statements concerning the additional income to the Company as a result of ownership interests in certain hospital operations
and the timing of such income; the payment of future dividends, if any; completion of additional debt arrangement, and additional investments; national and international economic, business, real estate and other market conditions; the competitive
environment in which the Company operates; the execution of the Company’s business plan; financing risks; the Company’s ability to maintain its status as a REIT for federal income tax purposes; acquisition and development risks; potential
environmental and other liabilities; and other factors affecting the real estate industry generally or healthcare real estate in particular. For further discussion of the factors that could affect outcomes, please refer to the “Risk
Factors” section of the Company’s Annual Report on Form 10-K for the year ended December 31, 2015, and as updated by the Company’s subsequently filed Quarterly Reports on Form 10-Q and other SEC filings. Except as otherwise required by the federal securities laws, the Company undertakes no obligation to update the information in this report.
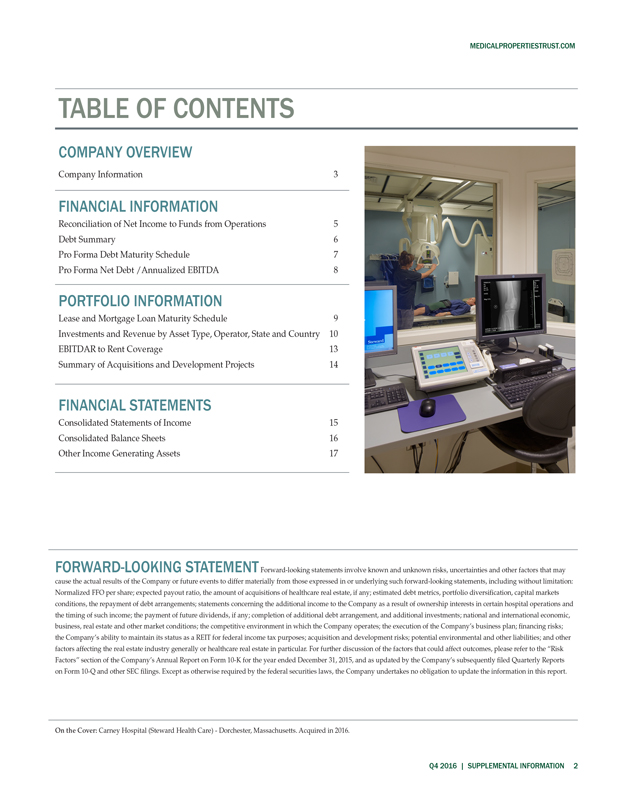
On the Cover: Carney Hospital (Steward Health Care) - Dorchester, Massachusetts. Acquired in 2016.
Q4 2016 | SUPPLEMENTAL INFORMATION 2
MEDICALPROPERTIESTRUST.COM
COMPANY OVERVIEW
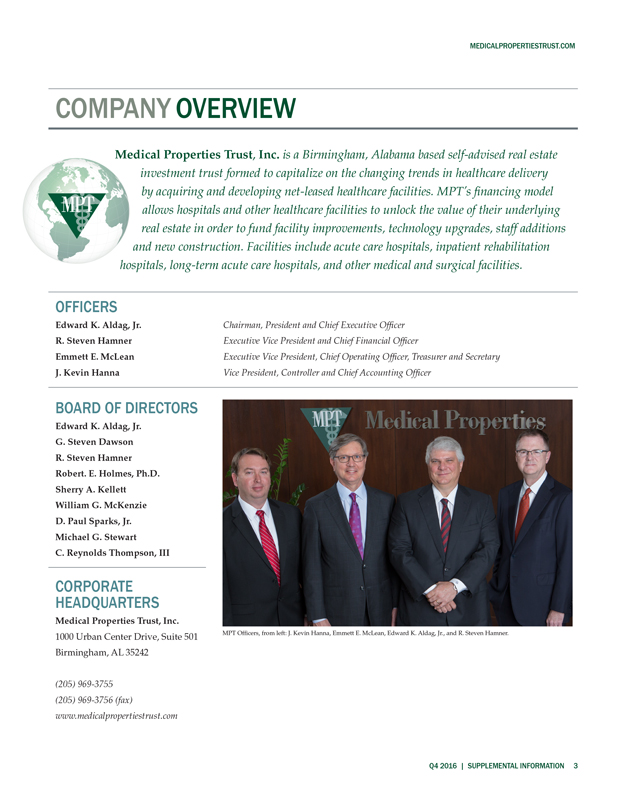
MPT Medical Properties Trust, Inc. is a Birmingham, Alabama based self-advised real estate investment trust formed to capitalize on the changing trends in
healthcare delivery by acquiring and developing net-leased healthcare facilities. MPT’s financing model allows hospitals and other healthcare facilities to unlock the value of their underlying real estate
in order to fund facility improvements, technology upgrades, staff additions and new construction. Facilities include acute care hospitals, inpatient rehabilitation hospitals, long-term acute care hospitals, and other medical and surgical
facilities.
OFFICERS
Edward K. Aldag, Jr. Chairman, President and Chief
Executive Officer
R. Steven Hamner Executive Vice President and Chief Financial Officer
Emmett E. McLean Executive Vice President, Chief Operating Officer, Treasurer and Secretary
J.
Kevin Hanna Vice President, Controller and Chief Accounting Officer
BOARD OF DIRECTORS
Edward K. Aldag, Jr.
G. Steven Dawson
R. Steven Hamner
Robert. E. Holmes, Ph.D.
Sherry A. Kellett
William G. McKenzie
D. Paul Sparks, Jr.
Michael G. Stewart
C. Reynolds Thompson, III
CORPORATE HEADQUARTERS
Medical Properties Trust, Inc.
1000 Urban Center Drive, Suite 501 Birmingham, AL 35242
(205) 969-3755 (205) 969-3756 (fax) www.medicalpropertiestrust.com
MPT Officers, from left: J. Kevin Hanna, Emmett E. McLean, Edward K. Aldag, Jr., and R. Steven Hamner.
Q4 2016 | SUPPLEMENTAL INFORMATION 3
MEDICALPROPERTIESTRUST.COM
COMPANY
OVERVIEW(continued)
INVESTOR RELATIONS MPW
Tim Berryman | Director - Investor
Relations LISTED
(205) 397-8589 NYSE
tberryman@medicalpropertiestrust.com
CAPITAL MARKETS
Charles Lambert | Managing Director - Capital Markets
(205)
397-8897
clambert@medicalpropertiestrust.com
TRANSFER AGENT STOCK EXCHANGE SENIOR UNSECURED
American Stock Transfer LISTING AND DEBT
RATINGS
and Trust Company TRADING SYMBOL Moody’s – Ba1
6201 15th
Avenue New York Stock Exchange Standard & Poor’s – BBB-
Brooklyn, NY 11219 (NYSE): MPW
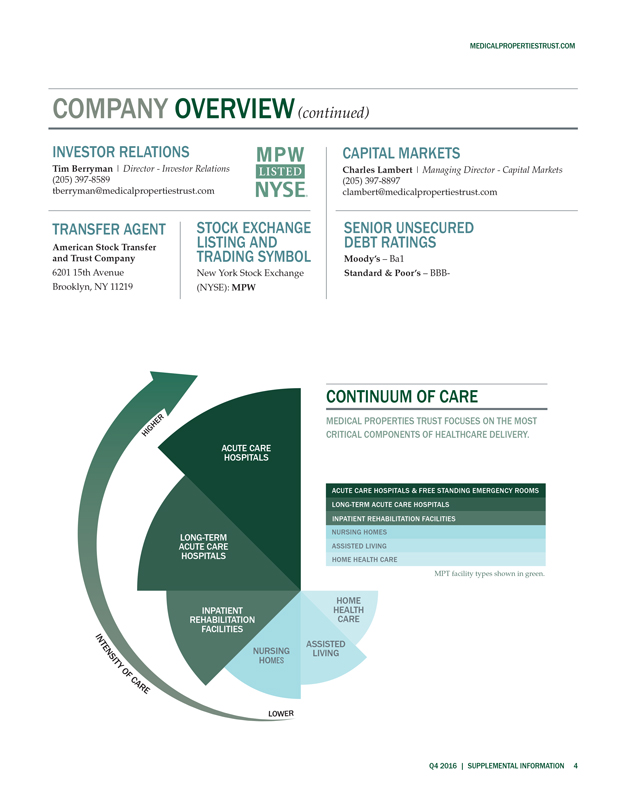
CONTINUUM OF CARE
HIGHER MEDICAL PROPERTIES TRUST FOCUSES ON THE MOST
CRITICAL COMPONENTS OF HEALTHCARE DELIVERY.
ACUTE CARE
HOSPITALS
ACUTE CARE HOSPITALS & FREE STANDING EMERGENCY ROOMS
LONG-TERM ACUTE CARE HOSPITALS
INPATIENT REHABILITATION FACILITIES
LONG-TERM NURSING HOMES
ACUTE CARE ASSISTED LIVING
HOSPITALS HOME HEALTH CARE
MPT facility types shown in green.
INPATIENT HOME
REHABILITATION HEALTH
FACILITIES CARE
INTENSITY OF CARE
ASSISTED
NURSING HOMES LIVING
LOWER
Q4 2016 | SUPPLEMENTAL INFORMATION 4
MEDICALPROPERTIESTRUST.COM
FINANCIAL INFORMATION
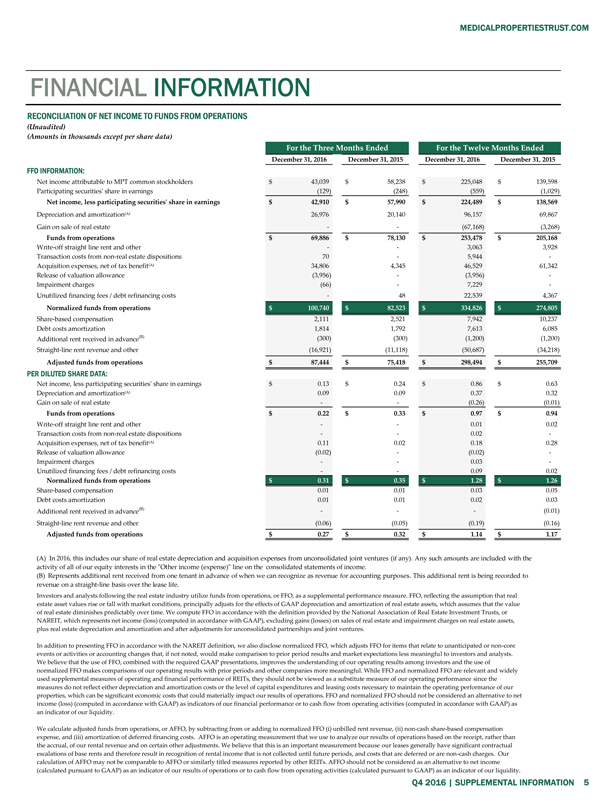
RECONCILIATION OF NET INCOME TO FUNDS FROM OPERATIONS
(Unaudited)
(Amounts in thousands except per share data)
For the Three Months Ended For the Twelve Months
Ended
December 31, 2016 December 31, 2015 December 31, 2016 December 31, 2015
FFO INFORMATION:
Net income attributable to MPT common stockholders $43,039 $58,238 $225,048
$139,598
Participating securities’ share in earnings (129) (248) (559) (1,029)
Net income, less participating securities’ share in earnings $42,910 $57,990 $224,489 $138,569
Depreciation and amortization(A) 26,976 20,140 96,157 69,867
Gain on sale of real estate - -
(67,168) (3,268)
Funds from operations $69,886 $78,130 $253,478 $205,168
Write-off straight line rent and other - - 3,063 3,928
Transaction costs from non-real
estate dispositions 70 - 5,944 -
Acquisition expenses, net of tax benefit(A) 34,806 4,345 46,529 61,342
Release of valuation allowance (3,956) - (3,956) -
Impairment charges (66) - 7,229 -
Unutilized financing fees / debt refinancing costs - 48 22,539 4,367
Normalized funds from operations $100,740 $82,523 $334,826 $274,805
Share-based compensation 2,111 2,521 7,942 10,237
Debt costs amortization
1,814 1,792 7,613 6,085
Additional rent received in advance(B) (300) (300) (1,200) (1,200)
Straight-line rent revenue and other (16,921) (11,118) (50,687) (34,218)
Adjusted funds from
operations $87,444 $75,418 $298,494 $255,709
PER DILUTED SHARE DATA:
Net
income, less participating securities’ share in earnings $0.13 $0.24 $0.86 $0.63
Depreciation and amortization(A) 0.09 0.09 0.37 0.32
Gain on sale of real estate - - (0.26) (0.01)
Funds from operations $0.22 $0.33 $0.97 $0.94
Write-off straight line rent and other - - 0.01 0.02
Transaction costs from non-real estate dispositions - - 0.02 -
Acquisition expenses, net of tax benefit(A) 0.11 0.02 0.18 0.28
Release of valuation allowance
(0.02) - (0.02) -
Impairment charges - - 0.03 -
Unutilized financing fees /
debt refinancing costs - - 0.09 0.02
Normalized funds from operations $0.31 $0.35 $1.28 $1.26
Share-based compensation 0.01 0.01 0.03 0.05
Debt costs amortization 0.01 0.01 0.02 0.03
Additional rent received in advance(B) - - - (0.01)
Straight-line rent
revenue and other (0.06) (0.05) (0.19) (0.16)
Adjusted funds from operations $0.27 $0.32 $1.14 $1.17
(A) In 2016, this includes our share of real estate depreciation and acquisition expenses from unconsolidated joint ventures (if any). Any such amounts are included with the
activity of all of our equity interests in the “Other income (expense)” line on the consolidated statements of income.
(B) Represents additional rent
received from one tenant in advance of when we can recognize as revenue for accounting purposes. This additional rent is being recorded to revenue on a straight-line basis over the lease life.
Investors and analysts following the real estate industry utilize funds from operations, or FFO, as a supplemental performance measure. FFO, reflecting the assumption that real
estate asset values rise or fall with market conditions, principally adjusts for the effects of GAAP depreciation and amortization of real estate assets, which assumes that the value of real estate diminishes predictably over time. We compute FFO in
accordance with the definition provided by the National Association of Real Estate Investment Trusts, or NAREIT, which represents net income (loss) (computed in accordance with GAAP), excluding gains (losses) on sales of real estate and impairment
charges on real estate assets, plus real estate depreciation and amortization and after adjustments for unconsolidated partnerships and joint ventures.
In addition
to presenting FFO in accordance with the NAREIT definition, we also disclose normalized FFO, which adjusts FFO for items that relate to unanticipated or non-core events or activities or accounting changes
that, if not noted, would make comparison to prior period results and market expectations less meaningful to investors and analysts. We believe that the use of FFO, combined with the required GAAP presentations, improves the understanding of our
operating results among investors and the use of normalized FFO makes comparisons of our operating results with prior periods and other companies more meaningful. While FFO and normalized FFO are relevant and widely used supplemental measures of
operating and financial performance of REITs, they should not be viewed as a substitute measure of our operating performance since the measures do not reflect either depreciation and amortization costs or the level of capital expenditures and
leasing costs necessary to maintain the operating performance of our properties, which can be significant economic costs that could materially impact our results of operations. FFO and normalized FFO should not be considered an alternative to net
income (loss) (computed in accordance with GAAP) as indicators of our financial performance or to cash flow from operating activities (computed in accordance with GAAP) as an indicator of our liquidity.
We calculate adjusted funds from operations, or AFFO, by subtracting from or adding to normalized FFO (i) unbilled rent revenue,
(ii) non-cash share-based compensation expense, and (iii) amortization of deferred financing costs. AFFO is an operating measurement that we use to analyze our results of operations based on the
receipt, rather than the accrual, of our rental revenue and on certain other adjustments. We believe that this is an important measurement because our leases generally have significant contractual escalations of base rents and therefore result in
recognition of rental income that is not collected until future periods, and costs that are deferred or are non-cash charges. Our calculation of AFFO may not be comparable to AFFO or similarly titled measures
reported by other REITs. AFFO should not be considered as an alternative to net income (calculated pursuant to GAAP) as an indicator of our results of operations or to cash flow from operating activities (calculated pursuant to GAAP) as an indicator
of our liquidity.
Q4 2016 | SUPPLEMENTAL INFORMATION 5
MEDICALPROPERTIESTRUST.COM
FINANCIAL INFORMATION
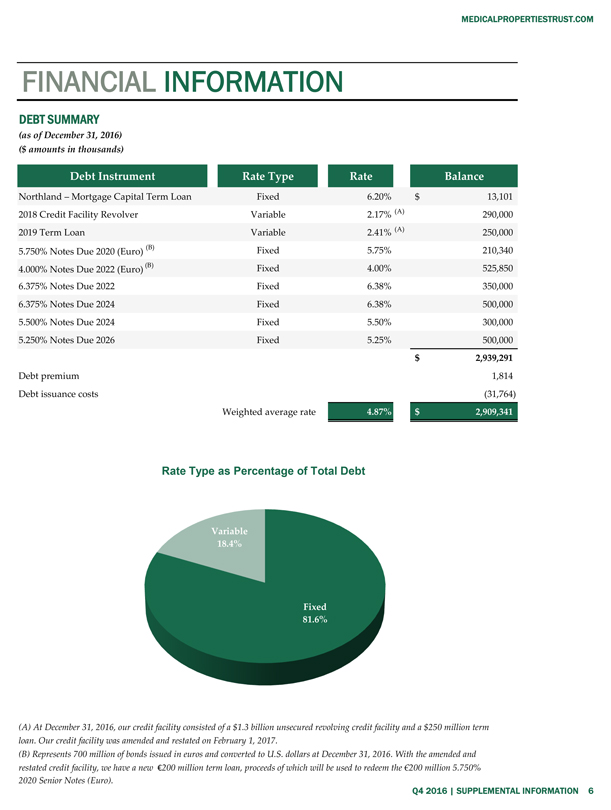
DEBT SUMMARY
(as of December 31, 2016)
($ amounts in thousands)
Debt Instrument Rate Type Rate Balance
Northland – Mortgage Capital Term Loan Fixed 6.20% $13,101
2018 Credit Facility Revolver
Variable 2.17% (A) 290,000
2019 Term Loan Variable 2.41% (A) 250,000
5.750%
Notes Due 2020 (Euro) (B) Fixed 5.75% 210,340
4.000% Notes Due 2022 (Euro) (B) Fixed 4.00% 525,850
6.375% Notes Due 2022 Fixed 6.38% 350,000
6.375% Notes Due 2024 Fixed 6.38% 500,000
5.500% Notes Due 2024 Fixed 5.50% 300,000
5.250% Notes Due 2026 Fixed 5.25%
500,000
$2,939,291
Debt premium 1,814
Debt issuance costs (31,764)
Weighted average rate 4.87% $2,909,341
Rate Type as Percentage of Total Debt
Variable 18.4%
Fixed 81.6%
(A) At December 31, 2016, our credit facility consisted of a
$1.3 billion unsecured revolving credit facility and a $250 million term loan. Our credit facility was amended and restated on February 1, 2017.
(B)
Represents 700 million of bonds issued in euros and converted to U.S. dollars at December 31, 2016. With the amended and restated credit facility, we have a new €200 million term loan, proceeds of which will be used to redeem the €200
million 5.750% 2020 Senior Notes (Euro).
Q4 2016 | SUPPLEMENTAL INFORMATION 6
MEDICALPROPERTIESTRUST.COM
FINANCIAL INFORMATION
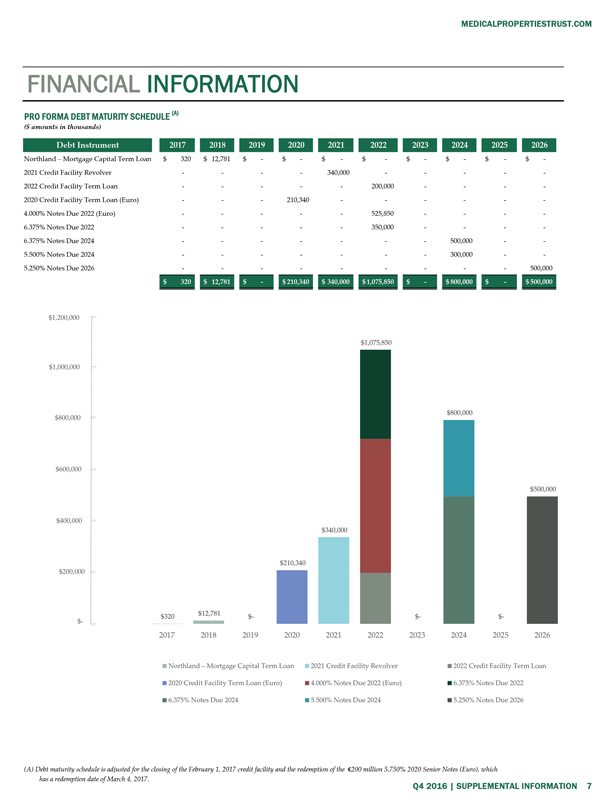
PRO FORMA DEBT MATURITY SCHEDULE (A)
($ amounts in thousands)
Debt Instrument 2017 2018 2019 2020 2021 2022 2023 2024 2025 2026
Northland – Mortgage
Capital Term Loan $320 $12,781 $— $— $— $— $— $— $— $—
2021 Credit Facility Revolver — — — — 290,000
— — — — —
2022 Credit Facility Term Loan — — — — — 200,000 — — — —
2020 Credit Facility Term Loan (Euro) — — — 210,340 — — — — — —
4.000% Notes Due 2022 (Euro) — — — — — 525,850 — — — —
6.375% Notes Due 2022 — — — — — 350,000 — — — —
6.375% Notes Due 2024 — — — — — — — 500,000 — —
5.500% Notes Due 2024 — — — — — — — 300,000 — —
5.250% Notes Due 2026 — — — — — — — — — 500,000
$320 $12,781 $— $210,340 $290,000 $1,075,850 $— $800,000 $— $500,000
$1,200,000
$1,075,850
$1,000,000
$800,000 $800,000
$600,000
$500,000
$400,000
$290,000
$210,340
$200,000
$12,781
$— $320 $— $— $—
2017 2018 2019 2020 2021 2022 2023 2024 2025 2026
Northland – Mortgage Capital Term Loan 2021 Credit Facility Revolver 2022 Credit Facility Term Loan
2020 Credit Facility Term Loan (Euro) 4.000% Notes Due 2022 (Euro) 6.375% Notes Due 2022
6.375% Notes Due 2024 5.500% Notes Due 2024 5.250% Notes Due 2026
(A) Debt
maturity schedule is adjusted for the closing of the February 1, 2017 credit facility and the redemption of the €200 million 5.750% 2020 Senior Notes (Euro), which has a redemption date of March 4, 2017.
Q4 2016 | SUPPLEMENTAL INFORMATION 7
MEDICALPROPERTIESTRUST.COM
FINANCIAL INFORMATION
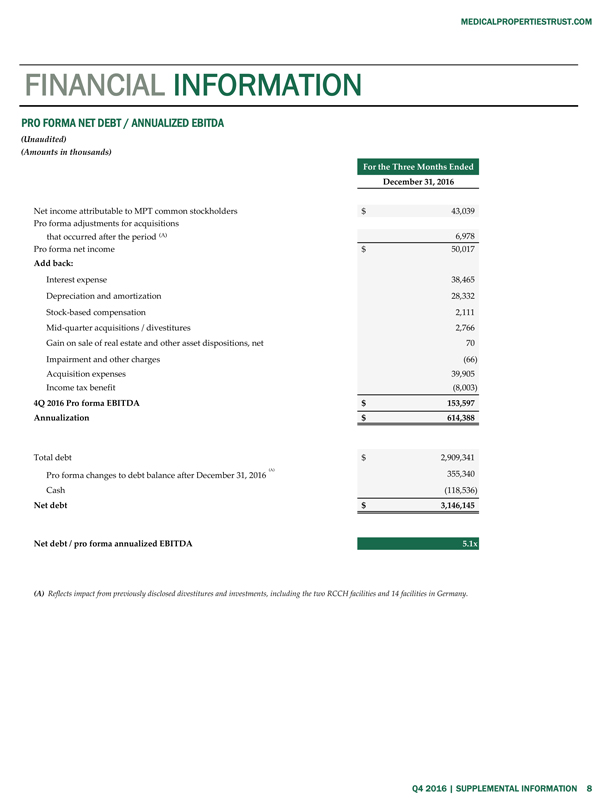
PRO FORMA NET DEBT / ANNUALIZED EBITDA
(Unaudited)
(Amounts in thousands)
For the Three Months Ended
December 31, 2016
Net income attributable to MPT common stockholders $43,039
Pro forma adjustments for acquisitions that occurred after the period (A) 6,978
Pro forma net
income $50,017
Add back:
Interest expense 38,465
Depreciation and amortization 28,332
Stock-based compensation 2,111
Mid-quarter acquisitions / divestitures 2,766
Gain on
sale of real estate and other asset dispositions, net 70
Impairment and other charges (66)
Acquisition expenses 39,905
Income tax benefit (8,003)
4Q 2016 Pro forma EBITDA $153,597
Annualization $614,388
Total debt $2,909,341
Pro forma changes to debt balance after December 31, 2016 (A)
355,340
Cash (118,536)
Net debt $3,146,145
Net debt / pro forma annualized EBITDA 5.1x
(A) Reflects impact from previously disclosed
divestitures and investments, including the two RCCH facilities and 14 facilities in Germany.
Q4 2016 | SUPPLEMENTAL INFORMATION 8
MEDICALPROPERTIESTRUST.COM
PORTFOLIO INFORMATION
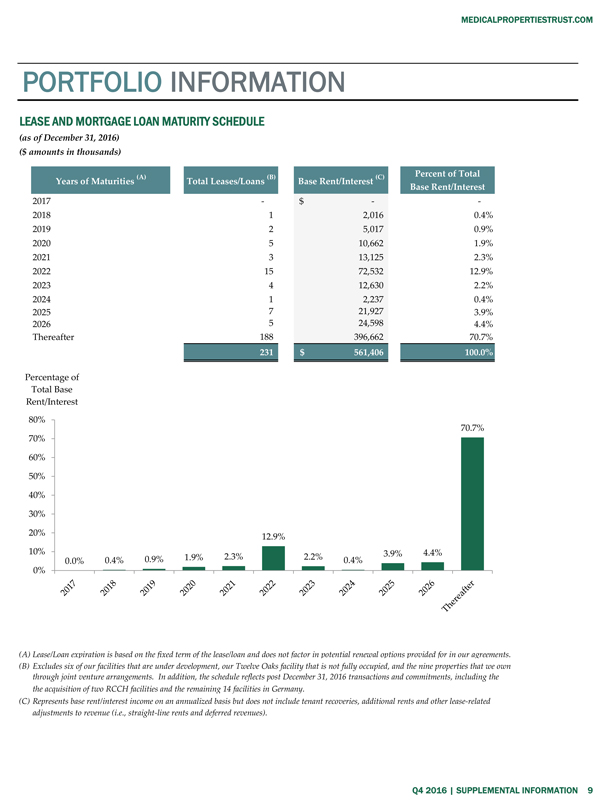
LEASE AND MORTGAGE LOAN MATURITY SCHEDULE
(as of December 31, 2016)
($ amounts in thousands)
Years of Maturities (A) Total Leases/Loans (B) Base
Rent/Interest (C) Percent of Total Base Rent/Interest
2017 — $— —
2018 1 2,016 0.4%
2019 2 5,017 0.9%
2020 5 10,662 1.9%
2021 3 13,125 2.3%
2022 15 72,532 12.9%
2023 4 12,630 2.2%
2024 1 2,237 0.4%
2025 7 21,927 3.9%
2026 5 24,598 4.4%
Thereafter 188 396,662 70.7%
231 $561,406 100.0%
Percentage of Total Base Rent/Interest
80%
70.7%
70%
60%
50%
40%
30%
20% 12.9%
10% 3.9% 4.4%
0.0% 0.4% 0.9% 1.9% 2.3% 2.2% 0.4%
0%
2017 2018 2019 2020 2021 2022 2023 2024 2025 2026 Thereafter
(A) Lease/Loan expiration is based on the fixed term of the lease/loan and does not factor in potential renewal options provided for in our agreements.
(B) Excludes six of our facilities that are under development, our Twelve Oaks facility that is not fully occupied, and the nine properties that we own through joint venture
arrangements. In addition, the schedule reflects post December 31, 2016 transactions and commitments, including the the acquisition of two RCCH facilities and the remaining 14 facilities in Germany.
(C) Represents base rent/interest income on an annualized basis but does not include tenant recoveries, additional rents and other lease-related adjustments to revenue (i.e.,
straight-line rents and deferred revenues).
Q4 2016 | SUPPLEMENTAL INFORMATION 9
MEDICALPROPERTIESTRUST.COM
PORTFOLIO INFORMATION
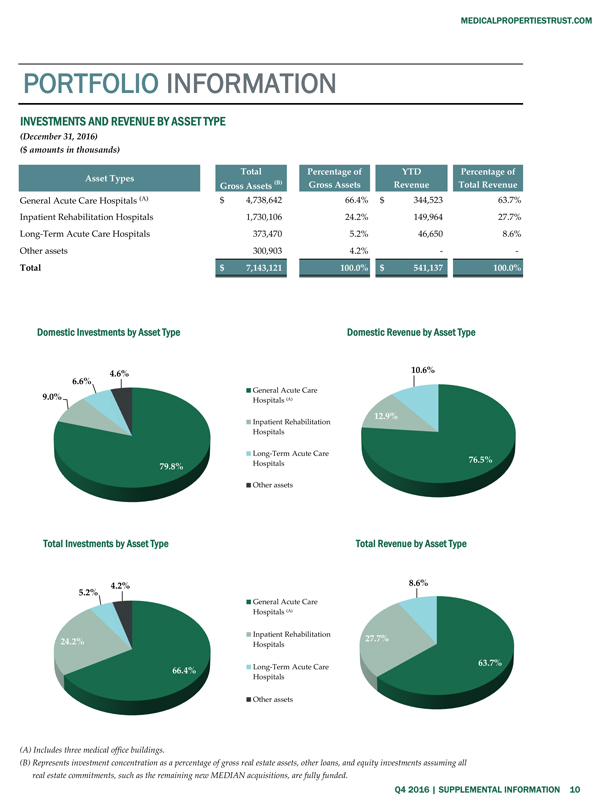
INVESTMENTS AND REVENUE BY ASSET TYPE
(December 31, 2016)
($ amounts in thousands)
Asset Types Total Gross Assets (B) Percentage of Gross Assets YTD
Revenue Percentage of Total Revenue
General Acute Care Hospitals (A) $4,738,642 66.4% $344,523 63.7%
Inpatient Rehabilitation Hospitals 1,730,106 24.2% 149,964 27.7%
Long-Term Acute Care
Hospitals 373,470 5.2% 46,650 8.6%
Other assets 300,903 4.2% — —
Total $7,143,121 100.0% $541,137 100.0%
Domestic Investments by Asset Type
9.0% 6.6% 4.6% 79.8%
General Acute Care
Hospitals (A)
Inpatient Rehabilitation Hospitals
Long-Term Acute Care Hospitals
Other assets
Total Investments by Asset Type
5.2% 24.2% 4.2% 66.4%
General Acute Care
Hospitals (A)
Inpatient Rehabilitation Hospitals
Long-Term Acute Care Hospitals
Other assets
Domestic Revenue by Asset Type
12.9% 10.6% 76.5%
Total Revenue by Asset Type
27.7% 8.6% 63.7%
(A) Includes three medical office buildings.
(B) Represents investment concentration as a percentage of gross real estate assets, other loans, and equity investments assuming all real estate commitments, such as the remaining
new MEDIAN acquisitions, are fully funded.
Q4 2016 | SUPPLEMENTAL INFORMATION 10
MEDICALPROPERTIESTRUST.COM
PORTFOLIO INFORMATION
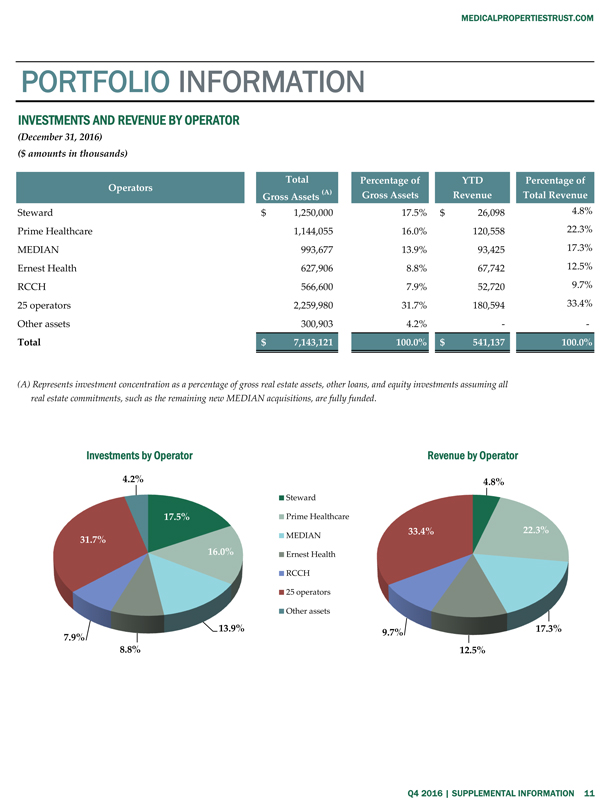
INVESTMENTS AND REVENUE BY OPERATOR
(December 31, 2016)
($ amounts in thousands)
Operators
Total Gross Assets (A)
Percentage of Gross Assets
YTD Revenue
Percentage of Total Revenue
Steward $1,250,000 17.5% $26,098 4.8%
Prime Healthcare 1,144,055 16.0% 120,558 22.3%
MEDIAN 993,677 13.9% 93,425 17.3%
Ernest Health 627,906 8.8% 67,742 12.5%
RCCH 566,600 7.9% 52,720 9.7%
25 operators 2,259,980 31.7% 180,594 33.4%
Other assets 300,903 4.2% — —
Total
$7,143,121 100.0% $541,137 100.0%
(A) Represents investment concentration as a percentage of gross real estate assets, other loans, and equity investments assuming
all real estate commitments, such as the remaining new MEDIAN acquisitions, are fully funded.
Investments by Operator
31.7%
4.2%
17.5%
16.0%
7.9%
8.8%
13.9%
Steward
Prime Healthcare
MEDIAN
Ernest Health
RCCH
25 operators
Other assets
Revenue by Operator
33.4%
4.8%
22.3%
9.7%
12.5%
17.3%
Q4 2016 | SUPPLEMENTAL INFORMATION 11
MEDICALPROPERTIESTRUST.COM
PORTFOLIO INFORMATION
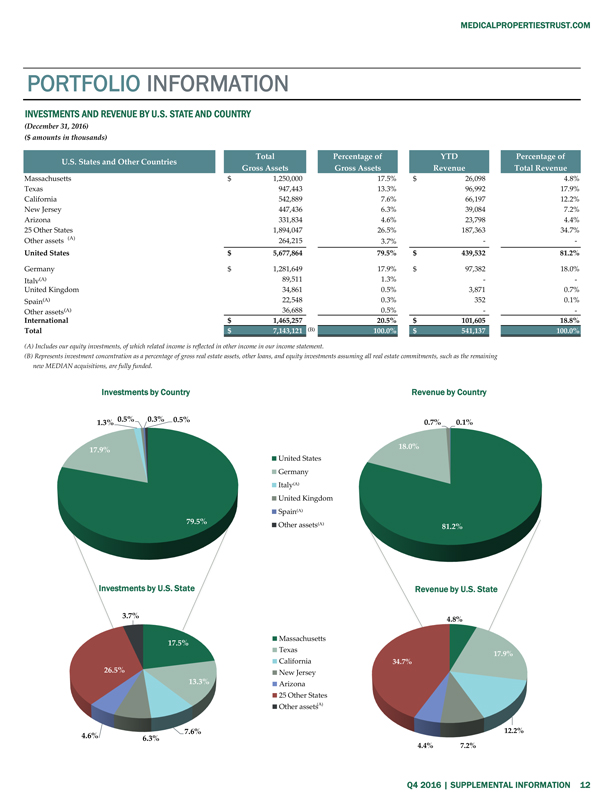
INVESTMENTS AND REVENUE BY U.S. STATE AND COUNTRY
(December 31, 2016) ($
amounts in thousands)
U.S. States and Other Countries
Total Gross Assets
Percentage of Gross Assets
YTD Revenue
Percentage of Total Revenue
Massachusetts $1,250,000 17.5% $26,098 4.8%
Texas 947,443 13.3% 96,992 17.9%
California 542,889 7.6% 66,197 12.2%
New Jersey 447,436 6.3% 39,084 7.2%
Arizona 331,834 4.6% 23,798 4.4%
25 Other States 1,894,047 26.5% 187,363 34.7%
Other assets(A) 264,215 3.7% —
—
United States $5,677,864 79.5% $439,532 81.2%
Germany
$1,281,649 17.9% $97,382 18.0%
Italy(A) 89,511 1.3% — —
United Kingdom 34,861 0.5% 3,871 0.7%
Spain(A) 22,548 0.3% 352 0.1%
Other assets(A) 36,688 0.5% — —
International $1,465,257
20.5% $101,605 18.8%
Total $7,143,121(B) 100.0% $541,137 100.0%
(A) Includes
our equity investments, of which related income is reflected in other income in our income statement.
(B) Represents investment concentration as a percentage of
gross real estate assets, other loans, and equity investments assuming all real estate commitments, such as the remaining new MEDIAN acquisitions, are fully funded.
Investments by Country
1.3% 0.5% 0.3% 0.5% 17.9% 79.5%
Investments by U.S. State
3.7% 17.5% 26.5% 13.3% 7.6% 4.6% 6.3%
United States
Germany
Italy(A)
United Kingdom
Spain(A)
Other assets(A)
Massachusetts
Texas
California
New Jersey
Arizona
25 Other States
Other assets(A)
Revenue by Country
0.7% 0.1% 18.0% 81.2%
Revenue by U.S. State
4.8% 17.9% 34.7% 12.2% 4.4% 7.2%
Q4 2016 | SUPPLEMENTAL INFORMATION 12
MEDICALPROPERTIESTRUST.COM
PORTFOLIO INFORMATION
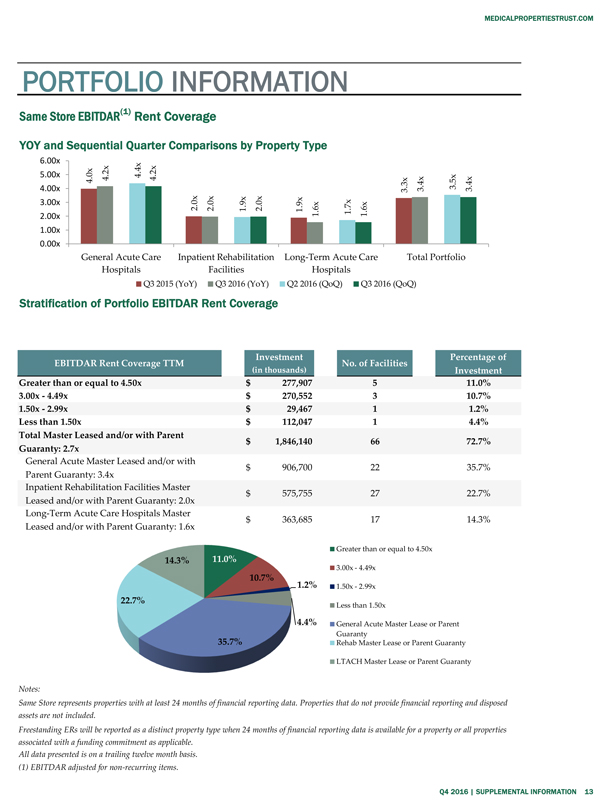
Same Store EBITDAR(1) Rent Coverage
YOY and Sequential Quarter Comparisons by
Property Type
6.00x
5.00x
4.00x
3.00x
2.00x
1.00x
0.00x
4.2x
4.4x
4.2x
4.0x
3.3x
3.5x
3.4x
3.4x
2.0x
1.9x
1.9x
1.7x
2.0x
2.0x
1.6x
General Acute Care Hospitals
Inpatient Rehabilitation Facilities
Long-Term Acute Care Hospitals
Total Portfolio
Q3 2015 (YoY)
Q3 2016 (YoY)
Q2 2016 (QoQ)
Q3 2016 (QoQ)
Stratification of Portfolio EBITDAR Rent Coverage
EBITDAR Rent Coverage TTM
Greater than or equal to 4.50x
3.00x - 4.49x
1.50x - 2.99x
Less than 1.50x
Total Master Leased and/or with Parent
Guaranty: 2.7x
General Acute Master Leased and/or with
Parent Guaranty: 3.4x
Inpatient Rehabilitation Facilities Master
Leased and/or with Parent Guaranty: 2.0x
Long-Term Acute Care Hospitals Master
Leased and/or with Parent Guaranty:
1.6x
Investment (in thousands)
$277,907
$270,552
$29,467
$112,047
$1,846,140
$906,700
$575,755
$363,685
No. of Facilities
5 3 1 1 66 22 27 17
Percentage of Investment
11.0% 10.7% 1.2% 4.4% 72.7% 35.7% 22.7% 14.3%
14.3% 11.0% 10.7% 1.2% 22.7% 4.4% 35.7%
Greater than or equal to 4.50x
3.00x - 4.49x
1.50x - 2.99x
Less than 1.50x
General Acute Master Lease or Parent
Guaranty
Rehab Master Lease or Parent Guaranty
LTACH Master Lease or Parent Guaranty
Notes:
Same Store represents properties with at least 24 months of financial reporting data.
Properties that do not provide financial reporting and disposed assets are not included.
Freestanding ERs will be reported as a distinct property type when 24
months of financial reporting data is available for a property or all properties associated with a funding commitment as applicable.
All data presented is on a
trailing twelve month basis.
(1) EBITDAR adjusted for non-recurring items.
Q4 2016 | SUPPLEMENTAL INFORMATION 13
MEDICALPROPERTIESTRUST.COM
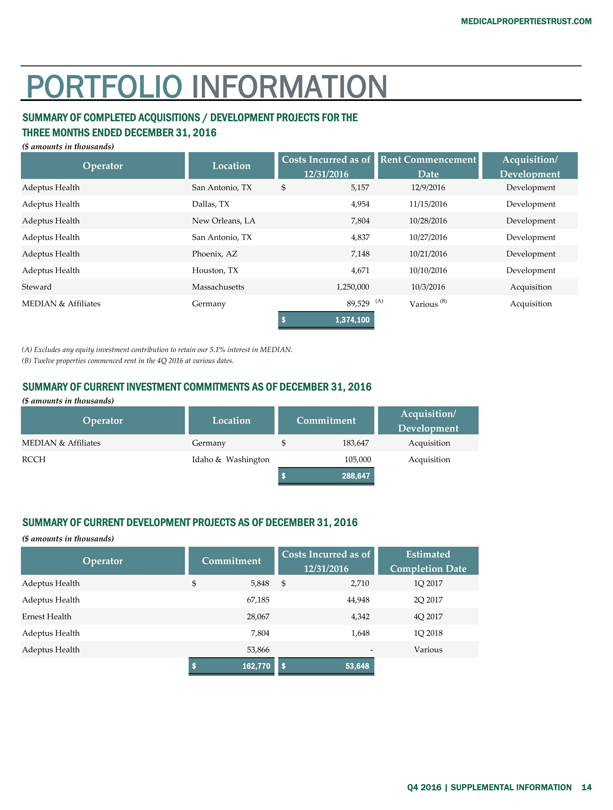
PORTFOLIO INFORMATION
SUMMARY OF COMPLETED ACQUISITIONS / DEVELOPMENT PROJECTS FOR THE THREE MONTHS ENDED DECEMBER 31, 2016
($ amounts in thousands)
Operator
Adeptus Health
Adeptus Health
Adeptus Health
Adeptus Health
Adeptus Health
Adeptus Health
Steward
MEDIAN & Affiliates
Location
San Antonio, TX
Dallas, TX
New Orleans, LA
San Antonio, TX
Phoenix, AZ
Houston, TX
Massachusetts
Germany
Costs Incurred as of 12/31/2016
$5,157
4,954
7,804
4,837
7,148
4,671
1,250,000
89,529(A)
$1,374,100
Rent Commencement Date
12/9/2016
11/15/2016
10/28/2016
10/27/2016
10/21/2016
10/10/2016
10/3/2016
Various (B)
Acquisition/ Development
Development
Development
Development
Development
Development
Development
Acquisition
Acquisition
(A) Excludes any equity investment contribution to retain our 5.1% interest in
MEDIAN.
(B) Twelve properties commenced rent in the 4Q 2016 at various dates.
SUMMARY OF CURRENT INVESTMENT COMMITMENTS AS OF DECEMBER 31, 2016
($
amounts in thousands)
Operator
MEDIAN & Affiliates
RCCH
Location
Germany
Idaho & Washington
Commitment
$183,647
105,000
$288,647
Acquisition/ Development
Acquisition
Acquisition
SUMMARY OF CURRENT DEVELOPMENT PROJECTS AS OF DECEMBER 31, 2016
($ amounts in thousands)
Operator Commitment
Costs Incurred as of 12/31/2016
Estimated Completion Date
Adeptus Health
$5,848 $2,710 1Q 2017
Adeptus Health 67,185 44,948 2Q 2017
Ernest Health 28,067 4,342 4Q 2017
Adeptus Health 7,804 1,648 1Q 2018
Adeptus Health 53,866 —
Various $162,770 $53,648
Q4 2016 | SUPPLEMENTAL INFORMATION 14
MEDICALPROPERTIESTRUST.COM
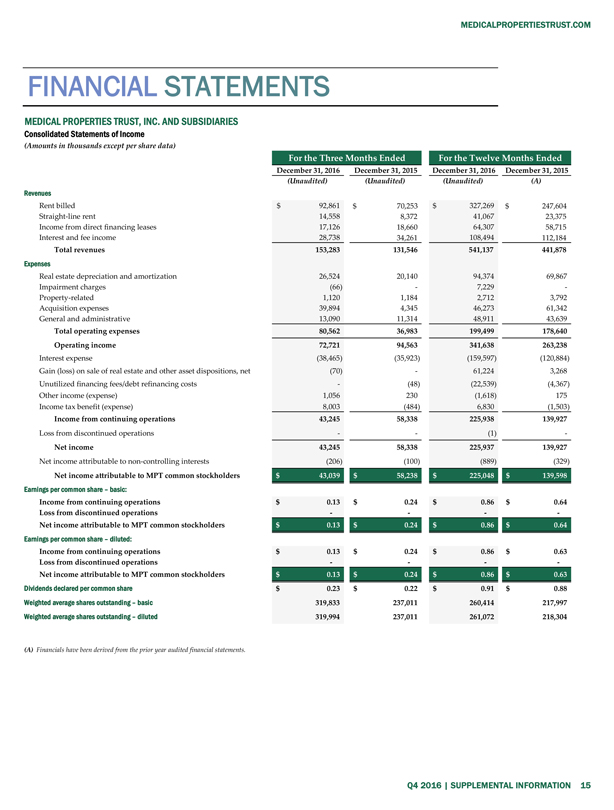
FINANCIAL STATEMENTS
MEDICAL PROPERTIES TRUST, INC. AND SUBSIDIARIES
Consolidated Statements of
Income
(Amounts in thousands except per share data)
For the Three Months
Ended For the Twelve Months Ended
December 31, 2016 December 31, 2015 December 31, 2016 December 31, 2015
(Unaudited) (Unaudited) (Unaudited) (A)
Revenues
Rent billed $92,861 $70,253 $327,269 $247,604
Straight-line rent 14,558 8,372 41,067 23,375
Income from direct financing leases 17,126 18,660 64,307 58,715
Interest and
fee income 28,738 34,261 108,494 112,184
Total revenues 153,283 131,546 541,137 441,878
Expenses
Real estate depreciation and amortization 26,524 20,140 94,374 69,867
Impairment charges (66) — 7,229 —
Property-related 1,120 1,184 2,712 3,792
Acquisition expenses 39,894 4,345 46,273 61,342
General and administrative
13,090 11,314 48,911 43,639
Total operating expenses 80,562 36,983 199,499 178,640
Operating income 72,721 94,563 341,638 263,238
Interest expense (38,465) (35,923) (159,597)
(120,884)
Gain (loss) on sale of real estate and other asset dispositions, net (70) — 61,224 3,268
Unutilized financing fees/debt refinancing costs — (48) (22,539) (4,367)
Other income
(expense) 1,056 230 (1,618) 175
Income tax benefit (expense) 8,003 (484) 6,830 (1,503)
Income from continuing operations 43,245 58,338 225,938 139,927
Loss from discontinued
operations — — (1) —
Net income 43,245 58,338 225,937 139,927
Net income attributable to non-controlling interests (206) (100) (889) (329)
Net income attributable to MPT common stockholders $43,039 $58,238 $225,048 $139,598
Earnings
per common share – basic:
Income from continuing operations $0.13 $0.24 $0.86 $0.64
Loss from discontinued operations — — — —
Net income attributable to MPT
common stockholders $0.13 $0.24 $0.86 $0.64
Earnings per common share – diluted:
Income from continuing operations $0.13 $0.24 $0.86 $0.63
Loss from discontinued operations
— — — —
Net income attributable to MPT common stockholders $0.13 $0.24 $0.86 $0.63
Dividends declared per common share $0.23 $0.22 $0.91 $0.88
Weighted average shares
outstanding – basic 319,833 237,011 260,414 217,997
Weighted average shares outstanding – diluted 319,994 237,011 261,072 218,304
(A) Financials have been derived from the prior year audited financial statements.
Q4 2016 |
SUPPLEMENTAL INFORMATION 15
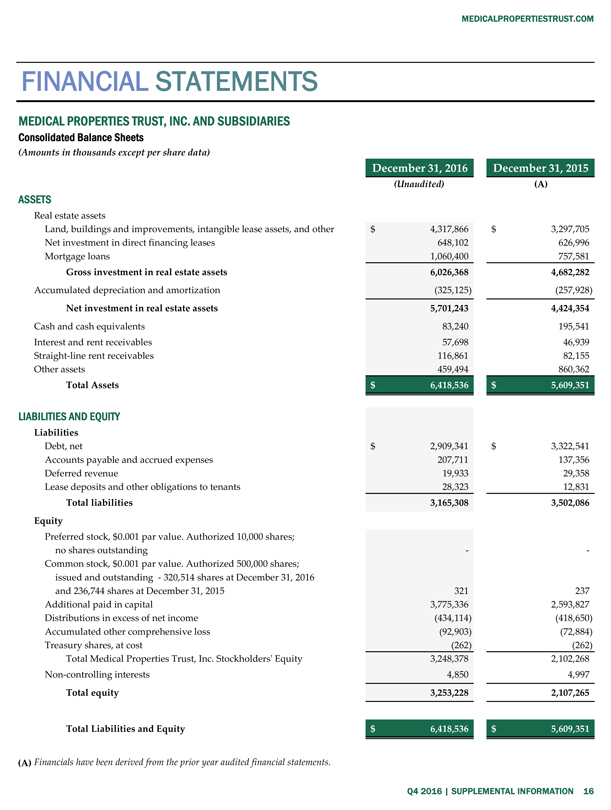
MEDICALPROPERTIESTRUST.COM
FINANCIAL STATEMENTS
MEDICAL PROPERTIES TRUST, INC. AND SUBSIDIARIES
Consolidated Balance Sheets
(Amounts in thousands except per share data)
December 31, 2016
December 31, 2015
(Unaudited) (A)
ASSETS
Real estate assets
Land, buildings and improvements, intangible lease assets, and other
$4,317,866 $3,297,705
Net investment in direct financing leases 648,102 626,996
Mortgage loans 1,060,400 757,581
Gross investment in real estate assets
6,026,368 4,682,282
Accumulated depreciation and amortization (325,125) (257,928)
Net investment in real estate assets 5,701,243 4,424,354
Cash and cash equivalents 83,240
195,541
Interest and rent receivables 57,698 46,939
Straight-line rent
receivables 116,861 82,155
Other assets 459,494 860,362
Total Assets
$6,418,536 $5,609,351
LIABILITIES AND EQUITY
Liabilities
Debt, net $2,909,341 $3,322,541
Accounts payable and accrued expenses 207,711 137,356
Deferred revenue 19,933 29,358
Lease deposits and other obligations to
tenants 28,323 12,831
Total liabilities 3,165,308 3,502,086
Equity
Preferred stock, $0.001 par value. Authorized 10,000 shares; no shares outstanding — —
Common stock, $0.001 par value. Authorized 500,000 shares; issued and outstanding - 320,514 shares at December 31, 2016 and 236,744 shares at December 31, 2015 321 237
Additional paid in capital 3,775,336 2,593,827
Distributions in excess of net
income (434,114) (418,650)
Accumulated other comprehensive loss (92,903) (72,884)
Treasury shares, at cost (262) (262)
Total Medical Properties Trust, Inc. Stockholders’
Equity 3,248,378 2,102,268
Non-controlling interests 4,850 4,997
Total equity 3,253,228 2,107,265
Total Liabilities and Equity $6,418,536 $5,609,351
(A) Financials have been derived from the prior year audited financial statements.
Q4 2016 | SUPPLEMENTAL INFORMATION 16
MEDICALPROPERTIESTRUST.COM
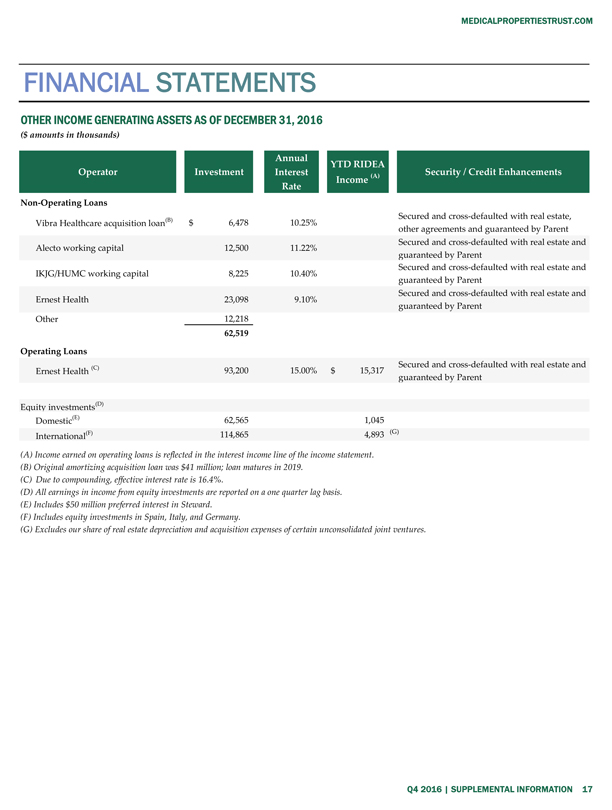
FINANCIAL STATEMENTS
OTHER INCOME GENERATING ASSETS AS OF DECEMBER 31, 2016
($ amounts in
thousands)
Operator Investment Annual Interest Rate YTD RIDEA Income (A) Security / Credit Enhancements
Non-Operating Loans
(B) Secured and cross-defaulted
with real estate,
Vibra Healthcare acquisition loan $6,478 10.25%
other
agreements and guaranteed by Parent
Secured and cross-defaulted with real estate and
Alecto working capital 12,500 11.22%
guaranteed by Parent
Secured and cross-defaulted with real estate and
IKJG/HUMC working capital 8,225 10.40%
guaranteed by Parent
Secured and cross-defaulted with real estate and
Ernest Health 23,098 9.10%
guaranteed by Parent
Other 12,218
62,519
Operating Loans
(C) Secured and cross-defaulted with real estate and
Ernest Health 93,200 15.00% $15,317
guaranteed by Parent
Equity investments(D)
Domestic(E) 62,565 1,045
International(F) 114,865 4,893 (G)
(A) Income earned on operating loans is reflected in the
interest income line of the income statement.
(B) Original amortizing acquisition loan was $41 million; loan matures in 2019.
(C) Due to compounding, effective interest rate is 16.4%.
(D) All earnings in income from
equity investments are reported on a one quarter lag basis.
(E) Includes $50 million preferred interest in Steward.
(F) Includes equity investments in Spain, Italy, and Germany.
(G) Excludes our share of real
estate depreciation and acquisition expenses of certain unconsolidated joint ventures.
Q4 2016 | SUPPLEMENTAL INFORMATION 17

MPT
Medical Properties Trust
1000 Urban Center Drive, Suite 501
Birmingham, AL 35242
(205) 969-3755 NYSE: MPW
www.medicalpropertiestrust.com
Contact:
Charles Lambert, Managing Director - Capital Markets
(205) 397-8897 or clambert@medicalpropertiestrust.com
or
Tim Berryman, Director - Investor Relations
(205) 397-8589 or tberryman@medicalpropertiestrust.com
AT THE VERY HEART OF HEALTHCARE®.