Attached files
| file | filename |
|---|---|
| 8-K - 8-K - Ameris Bancorp | v458931_8k.htm |
Exhibit 99.1

Ameris Ban c orp 4 th Quar t e r 201 6 & YTD R e sults I n v e s t or P r ese n t a tion

This pres entation contains certa i n p erfor ma nc e mea su res determine d b y method s ot h e r tha n i n accordanc e wi t h accounti n g p r i nc i p le s g e n erally accep t ed i n the Un i ted S tates o f Ame r ic a (“ G AAP”) . Managemen t o f Ame r i s Bancor p (the “Co m p a ny” ) use s thes e n o n- G A AP measure s i n it s a nalysi s o f the Comp an y’s perform ance . Thes e m ea s ure s are usefu l when evalu a ting the u nd erlyi n g per f or ma nc e a n d efficiency of the Co m p a ny’ s operations a n d ba la nc e sheet . T he Company’ s managemen t believe s tha t thes e no n- GA AP m e asur es pro v i de a gr ea t er un d erstand i n g of o n going operations , e nhanc e co m p arabi l it y o f r esult s wit h prior period s a n d demonstrat e th e effects o f signifi ca n t gains a n d cha r ges i n t h e cur r ent period . Th e C omp a ny’ s m a n agement be l i eves that investors m ay use t h ese non- GA AP fin a nci a l mea su res to evaluate the Comp a ny’ s fin a nc i al performan c e without th e i m pac t of u n u s u a l i tems that may obscur e tre nds i n th e C ompany’ s underl y in g perfor m ance . The s e disclosures shoul d no t be v iewe d as a substitut e fo r f inancia l measures determine d i n accordanc e wit h GAAP , n o r ar e they necessaril y comparabl e t o no n- G AAP pe r for ma nce m ea s ures that may be p r e sente d b y othe r c omp ani es . T ang ib le commo n e quit y a n d T i e r 1 capita l ratio s ar e n o n- G AAP mea s ures . Th e Co m p a ny calculate s th e Tie r 1 c a p ita l r atio us in g curren t call re p o rt instructions . T h e Comp a ny’s managemen t use s thes e measure s t o a sses s th e q ualit y o f capital an d be l i eves that investor s m ay fi n d t h em useful in t he i r eva l u atio n o f t he Com p a ny . The s e ca p it al m ea s ur es 1 may , o r ma y n o t b e necessaril y c omparabl e t o s i mila r capital measures that may be presented by other c ompanies . Thi s presentatio n ma y c ontai n statement s tha t constitute “forwar d- lo o kin g statements ” withi n th e m eanin g of Sect io n 27 A of t he S ec u r i tie s A ct of 193 3 , as a me n d e d, an d Section 2 1 E of t he S ecu r i t ies Excha n g e A ct of 193 4 , as amended . Th e word s “believe” , “estimate”, “ expect”, “ i ntend ” , “ a n tic i pate ” an d simi l ar e x p ressions a n d variations thereof i d e n t ify c ertain of such forwar d - lookin g statements, which s pea k onl y as o f the date s which the y w ere m ade . The Compan y undertake s n o obli g atio n to p ublicl y updat e or revise any forwar d- look i ng statements , whethe r as a result o f ne w information , fut u re events o r otherwise . R ea d ers ar e cautione d t h at a n y su c h forwar d- look i ng statement s a r e not guar a n tee s o f futur e perform a nc e an d i nvolve r isk s and uncertaintie s an d that actua l results ma y diffe r mater i ally fro m thos e indicate d i n th e f orwar d - l oo kin g statement s as a result o f various f actors . R eaders ar e cautione d no t to p lace und ue re lianc e o n t he s e f orwar d- look i ng statement s a n d are referre d to t h e Company’ s periodic f i l ing s wit h th e S ecurities a n d E xc ha n g e C ommis s io n f o r a s u m m a ry o f c erta i n fa cto rs tha t may i m p ac t th e Co m p a ny’s re s u lt s o f operation s and financi a l condition . Cautionary S t at eme n ts

Almost singula r focu s o f ou r team right no w i s “t o p roduc e to p quartile operatin g r esults , c onsist e ntl y ” . • Mai n ta i n do u bl e - digi t reve n u e g ro w t h wit h 15 % + growt h i n loans , fu n de d almos t entirely wit h lo w - co s t deposi t s and a ugmente d b y highl y profitabl e and g rowing lines-o f - business ( Mortgage, SBA and Treasury) • Expense management aime d a t p ro d u cing lo w singl e di g i t growt h rate s in operatin g expenses . C ontinu e t o rationalize o perating expenses where p ossible and inves t i n source s o f revenue wit h lowe r ope x burden. 2 Cur r e n t F o c us Consisten t Operatin g Performance Finis h Buildin g Platform fo r $10 billion • Strengthe n ou r suppor t structure a n d staffin g around BSA/AML • Review system s in I/T a n d data proc essing as well a s o t he r a dministrativ e function s to ensur e w e hav e the systems and staff in p lace. Drive Earning s Per Share fro m Organi c Sources • O rganic Source s o f l oan s from ex i s t i n g set o f p roducers. More reso u rces s u p port i ng o ur relationship m a n a gers to support much large r portfolios. • I nsulat e o urselve s from rate movements a n d economic swings with highl y stable, no n -rate sensitiv e deposits. • G row c apital level s and boo k value through highe r than avera g e ROAs a n d ROTCE. • Avoid concentrations; take the lon g view.

E a r n i n g s Summary – Ope r a ting Basis 3 Quar t e r t o D a t e R e sults 4Q1 6 4Q1 5 Chan g e Y e ar t o D a t e R e sults YT D 1 6 YTD 1 5 Chan g e Ope r a tin g E arnings E arning s P er Sha r e $ 21,92 6 $ 0.62 $ 15,323 $ 0.47 43% 32% $ 79,982 $ 2.30 $ 53,341 $ 1.66 50% 39% R etu rn on Assets R etu rn on T C E 1.33% 17.04% 1.12% 14.97% 18% 13% 1.30% 16.71% 1.11% 13.66% 17% 24% NI M (ne t of acc r etion) E f ficienc y R a tio Ne t O v erhead R a tio 3.73% 59.97% 1.84% 3.74% 72.12% 2.11% 1% - 16% - 28% 3.74% 62.65% 1.68% 3.85% 68.89% 2.20% - 3% - 15% - 25%

4Q 201 6 Ope r a ting Highlig h ts 4 • O r g an ic Loan Growth of $660.4 million, or 20.8% annualized • O p er a ti n g efficiency rati o of 59.97% compared to 72.12% in 4 Q 2015 • T ot a l Revenu e of $81.6 million, growth of 14.8% compared to 4 Q 2015 • L e g a cy NPAs decline d to 0.42% of total assets • N o n - acquired NCOs of only 0.14% of loans • N e t income contribution from line s of business increased to $4.1 million or 22.8% of ne t income. Standalon e efficiency rati o of 58.1% • Gr o w th in TBV per shar e by 14.0% over last twelve months

YTD 201 6 Ope r a ting Highlig h ts 5 • Core Operating expenses exclude merge r related charges and compliance charges.. • Operating efficienc y ratio formul a i s Core Operating Expense s divide d by Net Interes t Income and Non - interes t income YT D 2016 YT D 2015 Ass e t G r o w th 1,303,091 1,551,863 A sse t Growt h Ra t e 23.32% 38.44% O r g anic Loan G r o w th 660,427 344,212 Organic Loan Growt h Ra t e 20.78% 13.40% T o t al R e v enue 325,172 263,699 T o t al R e venue Growth 24.53% 23.01% Co r e Ope r a ting Expenses 203,709 179,894 Core OPEX Growth 13.24% 25.55% Ope r a ting E fficiency 62.65% 71.80% Le g acy N P As / Ass e ts 0.42% 0.59% C r edi t R e l a t e d Co s ts 10,263 22,971

T o t al R e v enue Reliabl e increase s in revenue • Up 19 % over same quarter in 2015 • Y TD, higher b y 29% Diversifie d betwee n sprea d an d non - interest income: • 66.3% o f revenue is spread related • 4 . 1% o f revenue is accretion income Organi c Growth in No n - Interest Income • N on - interest income higher b y 16% compared to 3 Q 2015 • R epresents 1.82% o f total assets $53.6 6 $53.8 $59.3 $69.7 $68.9 $72.5 $79.7 $83.3 $80.3 $30.0 $45.0 $60.0 $75.0 $90.0 4Q 14 1Q 15 2Q 15 3Q 15 4Q 15 1Q 16 2Q 16 3Q 16 4Q 16 T o t al Quar t erly R e v e nue (in millions)

N e t I n t e r e s t Ma r gin $36.2 3.50% $30.0 7 $38.6 $45.1 3.87% $46.5 $48.2 $51.3 Ne t I n t e r e s t In c o me b e f o r e Acc r etion (in millions) $56.1 $54.4 4.05% 3.81% 3.74% 3.80% 3.70% 3.75% 3.76% 3.00% 4.00% 4.50% $20.0 $40.0 $50.0 $60.0 1Q 15 2Q 15 3Q 15 4Q 15 1Q 16 2Q 16 3Q 16 4Q 16

Expense s – 4 Q 1 6 • F ourt h q uarte r fal l i n O P E X relate s t o l owe r i n centive a n d c ommi s s io n p a y m ent s . T i ed m o s t l y t o e x pec t e d revenu e dec li nes i n mortgag e an d c o mmercial lending . • Conti n u i ng to b ui l d s o urce s o f r evenue wit h l o wer incrementa l OPEX burden . • LOB’ s ar e high l y e fficien t a nd pr o du ce in cremental a s set s w it h b e tte r credit m e t rics t h a n t he i ndustr y a s a n average . • M a n age d mo s t l y fl a t ope r at i ng expense s at t h e b a nk leve l f o r s o metim e a s w e experienc ed revenue growth . 1 – Recurrin g operatin g expenses exclude Probl e m loa n and ORE O costs, merger cost s and sp ecial complianc e char ge s i n 4Q1 6 . Stable levels of OPEX $29.4 $30.7 $31.1 $38.6 $40.2 $38.2 $39.3 $39.6 $37.5 $7.0 $7.0 $8.9 $8.7 $8.8 $9.2 $11.3 $12.1 $10.4 $0.0 $10.0 $20.0 $30.0 $40.0 $50.0 4Q 14 2Q 15 4Q 15 2Q 16 4Q 16 B a nk Level O PE X (1) LO B O PEX 8 Ste a dy, Recurrin g Operatin g Expenses
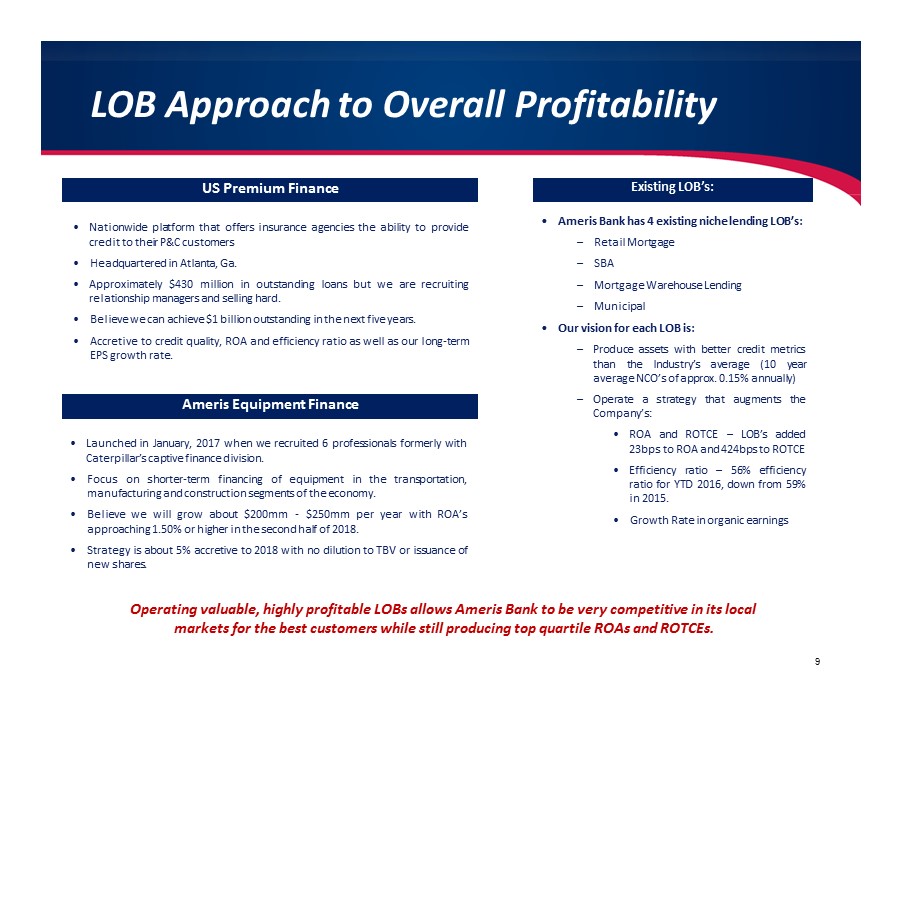
L O B Approach t o Overal l Profi t ability 9 • Ameri s Bank has 4 existing niche l endin g LOB’s: – Retail Mortgage – S B A – Mortgage Warehouse Lending – M unicipal • Ou r vision for eac h LO B i s: – P r o duce assets w i th b e tt e r c red i t met r i cs t h an t h e In dustry’s ave r age ( 10 yea r average NCO’s o f approx . 0 . 15 % annually) – Operate a s t r ategy t hat a ugments the Company’s : • R O A and R OTCE – L OB’s add e d 23 bps to ROA and 424 bps to ROTCE • E fficie n cy ratio – 56 % efficie n cy r a t i o f o r YT D 2 016 , dow n from 59 % in 2015 . • G rowth Rate i n o rganic earnings Existing LOB’s: U S Premium Finance • Nat i onw i d e p latfor m t h at o ffer s insuranc e a gencies the abi l it y t o p rov i de credit to their P & C customers • Headquartered i n Atlanta, Ga. • A pproximately $4 3 0 m il li o n i n o u tstandin g l o an s bu t w e are recruit i n g relationship managers an d s elling hard. • B elieve we can a chieve $1 billio n outstandin g i n the nex t f ive y ears. • A c cretive t o credi t qual i ty, R O A a n d effic iency ratio as wel l as o u r l ong - term EP S g rowth rate. Ameri s Equipment Finance • L aunched i n J an u ary, 2017 when we recruited 6 p r ofessional s f ormerl y w it h Caterpillar’ s captive financ e d ivision. • F o cu s o n s h orte r - te r m financin g o f equipme n t i n t h e t r anspo r tatio n , manufacturing and construction s egments o f t h e economy. • B elieve we will grow a b out $200mm - $250mm p er ye a r w i t h ROA’s approaching 1.50% o r highe r i n the s econd hal f o f 2018. • Strategy i s about 5% accre t ive t o 2018 with no d i l u ti o n to TBV or i ssuance o f ne w shares. Operatin g valuable , highl y profitable LOBs allows Ameri s Bank to be ver y competitive in its local markets f o r the best customers whil e stil l producing top quartile ROA s and ROTCEs.

T o p 30 0 R e lationships Relative Size of our Top 30 0 Relationships • To p Relationships a re small relative to ou r capital level s a n d ou r lega l lendin g limit. • Lookin g for large r deals , bu t no t m aking bi g bet s especially o n CRE. • About 3 0% o f our top 50 r e la ti onship $’s have liquid c o l lateral o r are municipal credits backed by taxing authorit y . Relationship Groupings Total Principa l Percen t of Total (millions) Portfolio To p 25 relationshi p s To p 50 relationshi p s To p 100 relationsh i ps To p 250 relationsh i ps To p 300 relationsh i ps $603.1 $931.5 $1,313.2 $1,962.9 $2,098.0 11.5% 17.6% 24.9% 37.3% 39.8% Individual Groupings Principal (millions) Larges t Re l at io n s h ip 10th Larges t Re l at io n s h ip $44 . 6 $24 . 8 10 $44 .6 $10 .0 $6 .0 $4 .8 $3 .8 $3 .0 $2 .5 $0.0 $10.0 $20.0 $30.0 $40.0 $50.0 Re lationship Size in m illions 1 50 100 150 200 250 300 50th Larges t Re l at io n s h ip $10 . 0 Number o f Re lationships 100th Larges t Relationship $6.1 200th Larges t Relationship $3.8 300th Larges t Relationship $2.5
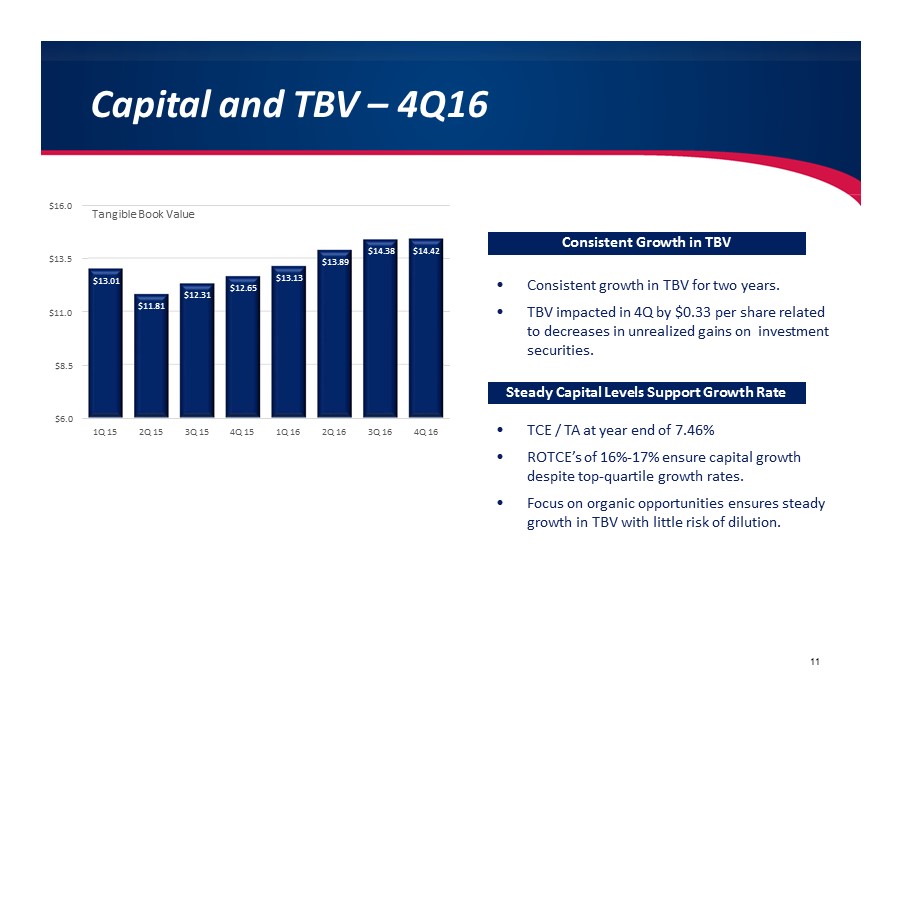
Capi t al and T B V – 4 Q 1 6 • C o ns is t e nt growth in TBV fo r two years. • TBV impacte d in 4 Q b y $0.33 pe r shar e related to decrease s in unrealiz e d gains on inve s tm e n t securities. • T C E / TA at year en d of 7.46% • R O T C E’s of 16 %- 17 % ensur e capital growth despit e to p -qua rt ile growth rates. • F oc u s on organi c opportuni t ie s ensure s steady growth in TBV with litt l e risk of dilu t i o n. Consisten t Growth in TBV $13 . 01 11 $11 . 81 $12 . 31 $12 . 65 $13 . 13 $13 . 89 $14 . 38 $14 . 42 $6.0 $8.5 $11.0 $13.5 $16.0 1Q 15 2Q 15 3Q 15 4Q 15 1Q 16 2Q 16 3Q 16 4Q 16 Tangibl e Book Value Steady Capita l Level s Support Growth Rate

201 7 Outlook 12 Growth • Lookin g t o su s t a in ou r op era ti n g ra t io s as we continue to grow th e balanc e sheet . • Margins are s table in t he 3 . 75 % - 3 . 80 % ra n g e ( net o f accretion) • E xpect t hat higher rates will make us more comp e t i t i v e on t h e d e p os i t s ide . D o no t n e e d higher rates to d eliver on our earnings expectations . • M ortgage revenues s hould benefit from relationships with c onstructi o n firm s & b rok ers . Generally les s than 15 % o f busine s s i s refinance . Operatin g Performance • E xpect to s ustain current levels of organic growth in loans, especially given USPF and Equipment Financ e Strategy • W il l imp r o v e our d e po s i t gr o w t h r a t e s to b e tt er match growth i n earning assets • F orecasting continued ru n -off i n m ort g a g e p oo l s and d o n ot anticipate additi on a l purchases • Onl y 35 % o f ou r 201 7 budge t e d loa n growth is CRE • Ex p ect E qu i p m e nt F i n a n ce D i v i sio n to or ig i n a te approxim a t ely $ 200 mm - $ 250 mm . Consensu s Estimates • Consen s u s estimates reflect 16 % growth in operatin g EPS • 201 7 consensu s estimates are approxim a t e l y $2.66 pe r share • M anagement comfortabl e with consensu s estimates fo r 201 7 an d 2018.

Ameris Ban c orp P r es s R e l e as e & Financia l Highlig h ts Decembe r 31 , 2016 13

New s Rele ase For m ore i n f o r ma tio n c o n t ac t : Dennis J . Ze m ber J r . Exe c utiv e Vic e Pres i d ent , CF O & COO ( 22 9) 8 9 0 - 1 111 AM E R I S BA N CO RP ANNOU NC E S 201 6 FIN A N C IA L R ES U LTS M O U LT RI E , Ga . , J a n ua r y 2 0 , 20 17 – A m er i s Ba n c o r p ( Nas da q : A B C B ) ( t he “ C o m pan y ”) to day r e p o r t ed a d jus t e d op e ratin g ne t i n co m e o f $ 80 . 0 m illion , o r $ 2 . 3 0 pe r s h a r e , fo r th e yea r e nd e d Dece m be r 31 , 2016 , c o m p are d with $ 5 3 . 3 m il l i on, or $ 1 . 66 p e r sha r e , f o r 2 01 5 . A dj u ste d o p e r ati ng n e t i n c o m e f o r t he f o u r t h q u a r te r o f 201 6 i n c r eased 3 1 % t o $ 2 1 . 9 mi l li on, o r $ 0 . 62 p e r s h are , c o m p a r e d w it h $ 1 5 . 3 m i l li on, or $ 0 . 4 7 p e r s h a r e , f or t he sam e q u a r te r of 2 01 5 . Fo r th e yea r e nde d Dece m be r 31 , 2016 , t h e C o m p any’ s a djuste d operatin g retur n o n a v er a g e asset s i m prove d t o 1 . 30 % co m pared to 1 . 11 % in 2 01 5 . For t he f o u r t h qu a r t er of 2 0 1 6 , t he C o m pan y ’s a d j us t ed op e ra tin g re tur n o n av e r a ge asset s i m pr o v e d t o 1 . 33 % , co m p are d t o 1 . 12 % i n t he sa m e qu a r te r i n 2 0 15 . C o mme n ti ng on t he C o m p a n y ’s ear n in g s, E d w i n W . H o r t m a n, Jr . , P res i dent a n d C h ie f E x ec u ti ve Offi cer of the C o m pany, said, “ In 2 0 1 6 , we d e li v e r e d a 3 9 % i ncrease i n a d j u s t ed o pera tin g e a rn i ngs per sh a re by dr ivi ng s t r on g g ro w t h i n rev e nu e a n d m a nag i ng o p e ra ti ng exp e nse s . We gr e w o r g a n i c l oa n s by a p p r o x i m a t ely 21 % i n 2 01 6 , u p s ig n i f i can tl y f r om the 13 % t hat w e e x per i e n c e d d u r in g 20 1 5 . F or 2 01 7 , we a re f o c u se d o n m ai n tai n i ng t he p a c e of or g a n i c g r o w t h wh il e sustai n i ng a le v e l o f o p e r ati ng res u lt s t h a t p u t s us i n t he to p qu a rtil e of ou r p ee r grou p . ” Re p o r t ed re s u lt s f or 2 0 1 6 i nc lu de net i n c o m e of $ 7 2 . 1 m i l li on, o r $ 2 . 0 8 per d il u te d sh a re, c o m pared w it h $ 4 0 . 8 m il l i on, or $ 1 . 27 p e r d i luted s h a re, for 2015 . Fo r th e quart e r e ndin g D ece m be r 31 , 2016 , reporte d r e s u lt s inc l ud e ne t in c o me of $ 1 8 . 2 m illi o n, or $ 0 . 52 p e r d il u te d s h are , c o m p are d wit h $ 1 4 . 1 m il l i on, or $ 0 . 43 p e r dil u te d s h are , fo r t he sa m e per i od i n 2 0 1 5 . A s u m m ar y of t he adj u st m e nts b e t w ee n re p orte d n e t i n c o m e an d a d j u ste d op e ratin g n e t i n c o m e f o llows : Three Months E n ded T w elve Months Ended 14 Adjust e d Operat i ng Net I n c o m e R e conciliation Dec 16 Dec 15 Dec 16 Dec 15 Net inc o m e avail a ble to c o m m on sh a r eholders $ 18 , 177 $ 14 , 148 $ 72 , 100 $ 40 , 847 Mer ger and conve r sion cha r ges 17 1 , 807 6 , 376 7 , 980 Ce r tain credit re solution re lated expenses - - - 11 , 241 Ce r tain c o m pliance re solution expe n ses 5 , 750 - 5 , 750 - Ta x effect of m a nage m e nt - a djusted cha r ges ( 2 , 018) ( 632) ( 4 , 244) ( 6 , 727) Plus: After tax m a nage m e nt - a djusted cha r ges 3 , 749 1 , 175 7 , 882 12 , 494 Adjusted Operating Net inc o m e $ 21 , 926 $ 15 , 323 $ 79 , 982 $ 53 , 341 Reported Return on average assets 1 . 1 0% 1 . 0 3% 1 . 1 7% 0 . 8 5% Adjusted Operating Return on average assets 1 . 3 3% 1 . 1 2% 1 . 3 0% 1 . 1 1%

15 Hig h lig h t s of t he C o m p a n y’ s res u lt s fo r 2 0 1 6 i n c l ude t he f o ll o w i ng : A dj u ste d o p e r ati ng r et u r n o n a v e r a ge asset s o f 1 . 30 % , c o m p a r e d w it h 1.11 % i n 2 0 15 A dj us t ed o per a ti ng re t u r n o n a ver a ge t a ng i b l e co m m on e q u it y of 1 6 .7 1%, c o m pared w it h 1 3 . 6 6% i n 2 0 1 5 I m prove m e nt i n a d j us t e d op e rati ng e ff i c i en c y ra ti o t o 6 2 .7 %, c o m pared w it h 6 8 . 9 % fo r 2 0 1 5 Or g a n i c grow t h i n l o a ns of $ 6 6 0 . 4 m illi on, or 2 0 . 8% To ta l g ro w t h i n no n - i n t erest bear i ng de m a nd d e p os it s o f $ 2 4 3 . 5 m i l li on, or 1 8 . 3 %, t o e n d t he y ear at 2 8 .2% of t o ta l d e p o sits I n creas e i n t o ta l re v e n ue of 24. 5% t o $ 3 2 5 . 2 mi l li on Dec li ne i n t he g r ow t h ra t e o f op e ra tin g e xp e nses ( l ess o ne - t i m e or ie n t ed c ha r ge s ) Decli ne i n a n n u alize d n e t c h ar g e - off s t o 0.0 3% of t o ta l l o a ns a n d 0 . 11% of no n - p u r c ha s ed l o a ns In c r eas e i n tangibl e boo k va l ue p e r s h a re o f 14.0 % t o $14.42 , co m p ar e d wit h $12.6 5 pe r shar e a t Decemb e r 3 1 , 2 015 C on tin u e d i m pr o v e m e nt i n no n - p erf o r m i ng assets , decreas i ng t o 0 .8 5% of t o ta l assets In c rease i n net i n c o m e from re tai l m or t ga ge , war e h ouse l e nd i ng a nd S B A li n e s of b u s i ness o f 3 5 . 7% t o $ 2 0 . 6 m illi on, c o m p are d wit h $ 1 5. 2 m i lli on i n 20 15 Increas e i n N e t Interes t In c ome Net i n te rest i n c o m e on a ta x - e qu i va le nt ba s i s i ncreas e d 2 5 . 6 % i n 20 16 t o $ 2 2 3 . 6 m i l li on, up f r om $ 1 7 8 . 1 m i lli on fo r 2 01 5 . G ro w t h i n ear n in g asset s f r om interna l source s , a s w e l l a s fro m acquisiti on acti v ity , c on t rib u te d t o t he i n crease . A v era ge ear n i n g asset s i n crease d 2 9 . 6 % i n 20 16 t o $ 5 . 6 0 billi on, c o m p are d wit h $ 4 . 3 2 b illi on f or 2 01 5 . Alt ho ug h t he C o m p a n y’ s n e t i n teres t i n com e i n creased , n e t i n teres t m ar g i n f or 20 1 6 , i n clu d in g acc r etion , decl i ne d t o 3 . 99 % , c o m p a r e d w it h 4 . 1 2 % f o r 201 5 . T he C o m p a n y ’s n e t i n te r es t m a rg i n w a s 3 . 9 5 % f or th e f o ur t h q u a r te r of 2 01 6 , do wn f r om 3 . 9 9 % r e p o r t ed f or t he t h ir d qu a r t er of 2 01 6 a nd 3 . 98 % r e p o r t ed f or t he fo ur t h q u a rte r o f 2 01 5 . A cc r etio n i n com e for 2 0 1 6 inc r ease d t o $ 1 4 . 1 m i l li on, c o m p a r e d w it h $ 11 . 7 m il l i on f or 2 0 1 5 . A cc r etio n i n c o m e for t he f o urt h q u arte r o f 20 16 d ecrease d sli gh tl y t o $ 3 . 4 m il lion, c o m p are d wit h $ 3 . 6 m illi on fo r t he t h ir d q uarte r of 2 0 16 , but i ncre a sed f r om $ 2 . 9 m il l i on r e p o r t ed f or t he f o u r t h qu a r te r o f 2 0 1 5 . E x clu d in g t he effec t o f a ccretion , the C o m p a n y ’s ma rg i n f or 20 16 w a s 3 . 7 4 % , c o m p a r e d w it h 3 . 8 5 % f or 201 5 . E x c l ud i ng t he ef f ec t o f acc r eti o n , t he C o m p a n y ’s ma rg i n fo r t he f o u r t h q u a r te r of 2 0 1 6 w a s 3 . 7 3 % , a slig ht d ecli ne c o m p a r e d w it h 3 . 75 % f or t he t h ird qu a r te r o f 2 01 6 a nd 3 . 7 4 % fo r t he f o u r t h qua r te r of 20 1 5 . Y iel ds o n ea r ni ng asset s i n 2 0 1 6 w e re 4 . 35 % , co m p are d wit h 4 . 4 7 % i n 2 01 5 . T h i s d e cli ne relate s p ri n ci p all y t o the s h o r t - te rm i n ves t m e nt st r ateg y ass o ciate d wit h t he C o m p a n y ’s 20 15 acq u isiti ons . Y ie l ds o n t he f und s in v este d in p u r c h ase d m o rt g a ge p o o l s w e re 2 . 7 7 % du r in g 20 1 6 , c o m p a r e d w it h 3 . 2 1 % d u r in g 20 1 5 . In te r e s t i n c o m e on l o a ns on a ta x - e q u i va len t bas i s i n c reas e d s u b s ta n tiall y d u r in g 2 0 1 6 t o $ 21 8 . 8 m i l li on, co m pared w i t h $ 17 0 . 0 m i l li on fo r 2 01 5 . D u r in g t he qua r t er e nd e d D e ce m ber 3 1 , 20 1 6 , i n t e rest i n c o m e on l o a ns i ncreas e d t o $ 5 8 . 4 m i l li on, c o m pared w it h $ 5 7 . 3 m illi on f or t he t h ir d q u arte r of 20 16 an d $ 4 6 . 9 m illi on f or t he fo ur t h qu a rte r o f 2 01 5 . T o ta l i n teres t e xp e nse fo r 2 01 6 wa s $ 1 9 . 7 m illi on, c o m p are d wit h $ 1 4 . 9 m illi on fo r 20 1 5 . Dep o si t c o st s wer e sta b le f o r m o s t of 20 1 6 , en d in g t he yea r a t 0 . 2 4 % , c o m p a r e d w i t h 0 . 2 3 % f or 20 1 5 . D e pos i t c o st s i n c r ease d sli gh tl y i n t he f o ur t h q u a r te r of 2 01 6 t o 0 . 2 7 % , c o m p a r e d w it h 0 . 2 3 % fo r t he t h i rd qu a r t e r o f 2 0 1 6 . N o n - i n te r e s t b ea r in g d e p osits repres e nted 29 . 1 % of the t otal av e rage d e po s it s f o r 2 01 6 , co m p a r e d w it h 2 9 . 2 % f o r 2 0 1 5 . Non - I nterest I ncome No n - i n teres t inc o m e i n crease d 2 3 . 6 % i n 2 0 16 t o $ 1 0 5 . 8 mi l li on, c o m p are d wit h $ 8 5 . 6 m illi on f or 2 0 1 5 . Ser v ice charges on d e posit accounts i ncreas e d by $ 8 . 3 m i llion to $ 4 2 . 7 m illion dur i ng 2016 , a n i n crease of 24 . 0 % c o m pared wit h 2015 . Grow t h i n ser v i c e ch a r g e relat e d rev e nue s o n commercia l and c onsu m er accounts was re s pons i ble for m o s t o f th e i n c r eas e i n servi c e ch a r ge s , whi l e NS F a nd d e bi t ca rd r even u e s w e re m o stl y f lat .
16 Retai l m o rtgag e rev e nue s i n crease d 36 . 8 % dur i n g 2016 , fro m $ 43 . 3 m illio n fo r 201 5 t o $ 59 . 3 m i llio n fo r 2016 . Net i nco m e for t he C o m pan y ’s r e tai l m or t gage d i v i s io n gr e w 4 2 . 3 % d ur i n g 2 01 6 t o $ 1 3 . 2 m i l li on . R e v e nu e s f rom t he C o m p a n y’ s wareho u s e le nd i n g d i v isio n i n crease d 5 4 . 1 % d u r i ng t he year , fr om $ 5 . 5 m ill ion fo r 2 01 5 t o $ 8 . 5 m i l li on f o r 20 1 6 , an d n e t i n c o m e f or t he d i v isio n i n c r ease d 4 8 . 3 % , f r om $ 3 . 1 mi l li on f o r 20 15 t o $ 4 . 6 m il li on f or 2 016 . Re v en u e s an d profita b ilit y sl ow e d f or bot h m o rt g ag e a nd ware h o use len d in g i n th e f o urt h q u arter , w h ic h is tra d iti on all y a sl ow e r ti m e of t he year . Ne t i n c o m e fo r t he C o m p a n y’ s re t ai l m o rt g a ge d i v isio n wa s $ 2 . 6 m il l i on for t he fo ur t h q u arte r of 2 01 6 , co m p are d w it h $ 3 . 5 m illi on i n t he t h i rd qu a r t e r of 2 01 6 an d $ 2 . 0 m i l li on f or t he fo ur t h qu a rte r of 201 5 . N e t i n c o m e fo r t he C o m p a n y’ s wh o lesal e len d in g d i v isi on w a s $ 1 . 1 m i lli on fo r t he fo ur t h q u arte r of 2 01 6 , c o m par e d w it h $ 1 . 5 m il li on f o r t he t h ir d qu a r t er o f 2 0 15 a n d $ 7 3 1 , 0 00 f or t he f o u r t h qu a r t er o f 2 0 1 5 . Re ve n ues fr om t he C o m pan y’ s S B A d i v i s i on c o n tin u e d t o i ncrease d ur in g 2 01 6 , r i s i ng fr om $ 8 . 3 m i l li on f or 2 01 5 t o $ 8 . 9 m i lli on fo r 2 01 6 . N e t i nc o m e for t he d i v isio n r e m ai n e d sta b l e a t $ 2 . 8 mil l i on f o r b o t h 2 01 6 a nd 20 1 5 . Non - I nterest Exp e nse N o n - i n teres t e xp e nse i n crease d $ 1 6 . 7 m ill io n , or 8 . 4 % , t o $ 21 5 . 8 m i l l ion f or t he yea r e nd e d D ece m b e r 3 1 , 2 016 , c o m p are d wit h $ 1 9 9 . 1 m il l i on f or t he yea r 2 01 5 . T o ta l e xp e ns e s i n 20 16 inclu de ap p ro x i m a tel y $ 6 . 4 m illi on in mer g er - relate d c h ar g e s a nd $ 5 . 7 5 m illi on i n c o m p lia n ce - relate d c h arges , w h il e t o ta l ex p e ns e s i n 2 01 5 i n clu de ap pr oxi m a tely $ 8 . 0 m illion in m e rger - related cha r ge s . E xc l ud i ng these a m o u nts, e x pe n s e s in 2 01 6 in c r e a sed by o nly $ 1 2 . 6 m illi on, or 6 . 6 % , c o m p are d wit h 20 15 le v els . Salarie s an d be n efit s i n crease d $ 1 2 . 8 m il lion d urin g 201 6 , dri v e n by $ 2 . 5 m illi on ass o ciate d w it h t he C o m p a n y’s ac qu isitio n o f T he Jac k son v ill e Ban k i n Marc h 2 01 6 an d $ 8 . 2 m il l i on relati ng t o h ig h e r c o m p e n satio n le v el s i n t he C o m pan y ’s m or t g a ge a nd S B A d i v i s io ns . O ccu p a n c y cost s i n c r ease d $ 3 . 2 m il l i on, o r 1 5 . 1 % , du r in g 2 0 1 6 , pr incipall y a s a r es u l t o f t he i n c r ease d n u m b e r of retai l br a n c h e s op e rate d d u r i n g t he year , a s wel l a s a dd itio n a l ex p e ns e s f or a d m i n istrat ive o ffices . Dat a p r o cess i n g an d IT - relate d c o st s i n crease d $ 4 . 7 m i lli on, or 2 3 . 9 % , i n 2 01 6 . G r o w t h i n ac c ount s as s o ciate d with t he ac qu isitio n o f T he Jac k so nv ill e Ba nk acc o u n te d fo r a p ortio n of t h i s i n crease , w h il e t he m a jo rit y o f t he i n crease re late d t o m uch h ig her o n li ne a n d m ob il e b a nk i ng a do p ti o n . O t h e r n on - i n t e rest e xp e nse s , exc lu d in g $ 5 . 7 5 m il l i on i n c o m pl i ance - re la t e d c ha r ges i n 2 0 1 6 , i n c reas e d 5 . 8 % t o $ 3 3 . 2 mi l li on durin g t he year . Balance Sheet Trends T o ta l asset s increase d $ 1 . 30 b illi on, or 2 3 . 3 % , d u r i ng 2 0 1 6 . T h i s grow t h i n clu d e s $ 5 2 8 . 9 m i lli on res u lti ng fr om t he ac qu isitio n of T he Jac k so nv i l l e Ba nk i n Marc h 20 16 an d $ 37 3 . 0 m il l i on res u lti ng fr om t he acq u isiti on of t he l o an portfoli o o f U S Pre m i u m Fina nce in Dece m ber 2016 . T o ta l l o a n s , i ncl ud in g l o a ns hel d fo r sale , purc h ase d no n - co v ere d l o a n p o ol s an d co v e re d l o a n s , wer e $ 5 . 37 b illi on at t he e nd o f 2 0 1 6 , c o m p are d wit h $ 4 . 0 2 b illi on a t t he e nd of 2 01 5 . Or g a n i c growt h i n l o an s t o tale d $ 6 6 0 . 4 m il l i on, or 2 0 . 8 % , d u r in g 2 01 6 , c o m p a r e d w it h $ 3 4 4 . 2 mi l li on, or 1 3 . 5 % , i n 20 1 5 . As e xp ecte d, l o a n g r o w t h r a t e s i n t he f ou r th qu a r t er of 2 01 6 s lo we d , dec l i n in g t o 12 . 1 % on a n a nn ua li zed basi s , co m p are d wit h 15 . 7 % on a n a n n u alize d b a s i s in t he sa m e quar t er of 2 0 1 5 . Dep o sit s i n crease d $ 6 9 5 . 9 m i lli on d urin g 20 16 t o e nd t he y ea r a t $ 5 . 5 8 b illi on . A t Dece m b e r 3 1 , 20 1 6 , no n - i n terest b ear i ng d e p o si t accou n t s wer e $ 1 . 5 7 b illi o n , o r 2 8 . 2 % of t o t al d e pos its , c o m p are d wit h $ 1 . 33 b illio n, o r 2 7 . 3 % of t o tal d ep o sits , a t Dec e m b e r 3 1 , 20 1 5 . No n - rat e se ns iti ve d e pos i ts (i n c l ud i ng NIB , NO W a nd s av in g s ) t o tale d $ 3 . 17 b illi on a t Dece m be r 31 , 2016 , c o m p a r e d wit h $ 2 . 7 1 billio n a t th e en d o f 2015 . Thes e fun ds r e pr e sent e d 56 . 9 % o f t he C o m p a n y ’s t o t a l d ep o sit s a t t he e nd o f 2 0 16 , c o m p a r e d w it h 5 5 . 6 % a t t he e nd o f 2 0 1 5 . St o ckh o l d e r s ’ e qu it y a t D ece m b e r 3 1 , 20 16 t o tale d $ 64 6 . 4 m il l i on, a n i n c r eas e of $ 13 1 . 7 m il l i on, or 2 5 . 6 % , f r om Dece m be r 31 , 2015 . Th e increas e i n s t ockholders ’ equit y wa s th e r e sul t o f th e Co m p any’ s i s suanc e o f $ 72 . 5 m il l ion of c o m m on share s i n t he acq u isiti on of Th e Jac k so nv ill e Ba nk, p l us ear n i ngs o f $ 7 2 . 1 m illi on d u r i ng 2 0 1 6 , offse t by d i v i d e n ds pa i d t o sha r e h o l d e r s of $ 1 0 . 5 m i ll i on . T a n g i b l e b oo k va l ue p e r share was $ 14 . 4 2 at t he e n d of 2 01 6 , up 1 4 . 0 % fr om $ 1 2 . 65 at t he e n d of 20 1 5 .

Equipmen t Finance I n additio n t o reportin g it s operatin g results , th e C o m p an y als o a n noun ce d t h a t i t h a s h i re d a tea m o f acco m p lished equ i p m ent f i nance in d u s t ry vete rans t o l a unc h a n e w d i v i s i on of it s b a nk , “A m e r i s Equ i p m ent F i nanc e ” . T he te am wil l be le d by C h ri s Re g as , w ho c o m e s t o t h e C o m p a ny fro m C a ter p illa r Fi n a n cial , wh o p u rc h ase d a ca p ti ve fi n a n ce c o m p a ny t h a t he h a d f o un d e d an d g r ow n p r o f ita b ly . J o i ni ng M r . Re g a s a re o t h e r in du s t ry v ete r a ns w it h e xp e r tis e i n or i g i na tio n, c a p ita l m a rke t s, u n d e r w r iti ng, ri sk m a nage m e nt a n d se r v icin g . A m eri s Eq u ipme nt Fi n a n c e wil l f o c us on a growin g, ye t u n d erser v e d, clie nt b as e acros s a w i de rang e o f eq u i p m e nt sect or s , i n cludi ng c o nstructi o n , tra n sportati on a nd m a nuf act ur i n g . Tar g ete d tra n sact i on size s wil l ran ge fr om $ 50 0 , 0 0 0 t o $ 1 0 m i l li on, w it h an a ver a ge re l a ti on s h i p s i ze of ap pr ox i m atel y $ 1 . 5 m i lli on t o $ 5 . 0 m i lli on . C u r rent a nd p r o s p ecti ve corp or at e clie n t s o f A m eri s Ba nk wil l b e n ef i t fr om t he expa nd e d prod u c t offerin g s , a s t he C o m p a ny le v era g e s it s c o r e c o m p ete n c y of len d in g t o qua li f i e d m i dd l e - m a rket c lie n t s na tion w i de . C o mm e n ti ng o n t he ne w g r o u p , Mr . H o r t m a n sa i d, “ T he te am we have r ecru ite d h a s a p ro ven t ra c k r eco r d i n t h i s i n d u stry , m a n a g in g a v e r y lar ge p ortf o li o an d m a n a g in g throu gh se v e ra l cre d i t cycle s wit h o u tstan d in g res u lts . We expect t his str a tegy to fur t her aug m ent our org a nic grow t h rates and also be accretive t o ou r credi t qu a lity , earnings p e r s h a re g rowt h r ate s an d r et u r n o n a v e r a ge a ss et s . We are e xcited t o w e lco m e Chris a n d his team to the C o m pany a nd b eliev e t h a t t h i s i s a gr ea t o pp o r t un it y t o d i v e rsif y o u r p o rtf o li o . ” Confe r enc e C a ll T he C o m p a ny wil l host a telec o nfere n c e a t 1 1 : 0 0 a . m . Easte rn ti m e t od a y (Jan u ar y 2 0 , 20 1 7 ) t o d isc u s s t he C o m p a n y's result s a nd an s w e r a ppropria t e questi o n s . T he c o n fer e nce ca l l can be ac c essed by d i a lin g 1 - 8 77 - 50 4 - 1 1 9 0 ( o r 1 - 8 55 - 6 69 - 96 57 fo r p a r tici p a n t s i n Ca n a da an d 1 - 41 2 - 9 02 - 66 30 f or o t h e r i n ter n ati on a l p a r tici p a n ts ) . T he c o n f e r e n c e ID n a m e i s A m er is Ba n cor p A B CB . A re p la y of t he cal l wil l be availa b l e on e h ou r afte r t he e nd o f t he confere n c e call un ti l Fe b r u a r y 3 , 2 0 1 7 . T o l i ste n t o t he re p lay , d ia l 1 - 8 77 - 3 44 - 75 29 ( or 1 - 85 5 - 6 69 - 96 58 f or p a rtici p a n t s i n Ca n a da an d 1 - 412 - 317 - 008 8 fo r othe r internationa l participants) . Th e conferenc e repla y acces s cod e i s 10099453 . The c o nfere n c e cal l re p la y an d t he fi n a n cia l i n f o rmati on d isc us se d wil l als o be a v aila b l e on th e I nv es t or Relati ons p a ge of t he A m eri s Ba nk we bs it e a t w w w . a m er i sb a n k . co m . A bout Ameri s B a nc orp A m e r i s Ba n cor p i s a b an k h o l d in g c o m p a ny h eadq u a r tere d i n Mo u lt r ie , G e o r g ia . T he C o m p a n y ’s b a n k i ng s ubs i d ia r y , A m eris Bank, had 97 locations in G e org i a, Alaba m a, north e rn F l or i da and South Carolin a a t th e en d o f th e m o s t recent qu a r t er . This news rele a s e co n tains certain p erf ormanc e measure s d e te r mine d b y meth o d s other than in accordance with accounti n g principles ge n erally a c cep t ed in the Un i ted St a t e s of Ameri c a ( “GAAP” ) . Mana g ement of Ameris Bancor p ( t h e “Company” ) uses these non - GAAP measures in its an a lysis o f the Company’s p e rformance . T hese measures a r e usef u l when evaluating the underlying p erf o r mance and e f fi c ien c y of the Co m pany’s operati o n s and balance s h ee t . The Compa n y’s management bel i eves th a t these non - G A AP measures prov i de a gre a ter u n derstanding of o ngoing opera t i o ns, enhance comparability of results with prior periods and demonstrate the effects of sign i ficant gains and charges in the current period . The C ompany’s management believes that investors may use t h ese no n - GAAP fina n cial measures to ev a luate t h e Comp a ny’s fina n ci a l p e rformance with o ut t h e impa c t of unusual items that may obscu r e trends in the C ompany’s underlying performance . The s e d isclos u res should not be viewed as a substitute for f i nancial measures determined in accordance wit h GAA P , nor a r e they necessarily comparab l e to non - GA A P performance measures that may be presented b y other companies . This news release contains sta t ements t hat co n s titute “forwar d - looking sta t em e nts” within the meaning of S e c t ion 27 A o f the Securit i es A ct of 1933 , as amen d ed, and Section 21 E of the S e curities Exchange A ct o f 193 4 , as a m ended . The w o rds “believe”, “estimate”, “expect”, “i n tend”, “anticipa t e” a nd similar expressions and variations there o f identify cert a in of such forward - looking st a teme n ts, which speak o nly as of the dates on which t h ey were made . The Company und e rtake s n o obliga t io n t o publicly update or revise any forward - lo o king stateme n ts, whether as a result of new info r m ation, future events or o therwise . Readers a r e cautio n ed th a t a ny such forward - looking statements are not guarantees o f f u ture per f ormance a n d involve risks a nd uncert a inties an d tha t actua l result s ma y diffe r materiall y from those in d icated in the forward - l o ok i ng st a teme n ts as a result o f v a rious fa ctors . Readers are cautioned not to pla c e undu e relia n ce o n thes e forward - lookin g stateme n ts and are refe r r ed to t h e Com p any’s period i c filings w ith the S ecurit i es and Exchange Commission, inclu d ing t h e Company’s 2 0 15 Annual Repo r t on Form 10 - K , for a summary of certain factors that may impact t h e Company’s results of o p era t ions and f inanc i al con d itio n . 17

18 Twelve Months Ended AMERIS BANCORP FINANCIAL HIGHLIGHTS (unaudited) (dollars in thousands except per share data and FTE headcount) Three Months Ended Dec. 2016 Sept. 2016 Jun. 2016 Mar. 2016 Dec. 2015 Dec. 2016 Dec. 2015 EARNINGS Net Income $ 18,177 $ 21,557 $ 20,049 $ 12,317 $ 14,148 $ 72,100 $ 40,847 Adjusted Operating Net Inco m e $ 21,926 $ 21,557 $ 20,049 $ 16,450 $ 15,323 $ 79,982 $ 53,341 PER COMMON SHARE DATA Earnings per share available to common shareholders Basic $ 0.52 $ 0.62 $ 0.58 $ 0.38 $ 0.44 $ 2.10 $ 1.29 Dilut e d $ 0.52 $ 0.61 $ 0.57 $ 0.37 $ 0.43 $ 2.08 $ 1.27 Cash Dividends per sha r e $ 0.10 $ 0.10 $ 0.05 $ 0.05 $ 0.05 $ 0.30 $ 0.20 Book value per share (period en d ) $ 18.51 $ 18.42 $ 17.96 $ 17.25 $ 15.98 $ 18.51 $ 15.98 Tangible book value per share (period en d ) Weighted average number of shares Basic $ 14.42 34,915,459 $ 14.38 34,869,747 $ 13.89 34,832,621 $ 13.13 32,752,063 $ 12.65 32,199,632 $ 14.42 34,346,570 $ 12.65 31,761,624 Dilut e d 35,293,035 35,194,739 35,153,311 33,053,554 32,594,929 34,701,732 32,126,667 Period - end number of shar e s Market data: High closing pri c e 34,921,474 $ 47.30 34,891,304 $ 35.80 34,847,311 $ 32.39 34,837,454 $ 32.68 32,211,385 $ 34.90 34,921,474 $ 47.30 32,211,385 $ 34.90 Low closing pri c e $ 35.02 $ 29.09 $ 27.89 $ 25.09 $ 27.65 $ 25.09 $ 22.75 Period end closing pri c e $ 43.60 $ 34.95 $ 29.70 $ 29.58 $ 33.99 $ 43.60 $ 33.99 Average daily volu m e 191,894 166,841 215,409 253,779 301,775 206,487 173,391 PERFORMANCE RATIOS Return on average assets 1.10% 1.35% 1.31% 0.88% 1.03% 1.17% 0.85% Return on average common equi t y 11.06% 13.39% 13.08% 9.14% 10.94% 11.75% 8.37% Earning asset yield (T E ) 4.34% 4.35% 4.35% 4.36% 4.30% 4.35% 4.47% Total cost of fun d s 0.38% 0.36% 0.35% 0.33% 0.32% 0.36% 0.34% Net interest margin (T E ) Non - interest income excluding securities transactions as a percent of total revenue (T E ) 3.95% 27.32% 3.99% 31.36% 4.01% 32.01% 4.03% 30.40% 3.98% 29.56% 3.99% 30.28% 4.12% 30.68% Efficiency rat i o 67.05% 61.91% 63.11% 74.41% 74.66% 66.38% 76.25% CAPITAL ADEQUACY (period end) Stockholders' equity to asse t s 9.38% 9.90% 10.06% 9.85% 9.21% 9.38% 9.21% Tangible common equity to tangible asset 7.46% 7.90% 7.96% 7.68% 7.44% 7.46% 7.44% EQUITY TO ASSETS RECONCILIATION Tangible common equity to tangible asset 7.46% 7.90% 7.96% 7.68% 7.44% 7.46% 7.44% Effect of goodwill and other intangible 1.92% 2.00% 2.10% 2.17% 1.77% 1.92% 1.77% Equity to assets (GAA P ) 9.38% 9.90% 10.06% 9.85% 9.21% 9.38% 9.21% OTHER PERIOD - END DATA Banking Division FTE 1,035 1,011 1,023 1,085 1,075 1,035 1,075 Mortgage Division F T E 263 259 245 233 229 263 229 Total Ameris Bancorp FTE Headcoun 1,298 1,270 1,268 1,318 1,304 1,298 1,304 Assets per Banking Division F T E $ 6,659 $ 6,423 $ 6,081 $ 5,620 $ 5,199 $ 6,659 $ 5,199 Branch locatio n s 97 99 102 103 101 97 101 Deposits per branch locati o n $ 57,476 $ 53,597 $ 50,780 $ 50,784 $ 48,310 $ 57,476 $ 48,310

AMERIS BANCORP FINANCIAL HIGHLIGHTS (unaudited) (dollars in thousands except per share data and FTE headcount) Three Months Ended Twelve Months Ended Dec. Sept. Jun. Mar. Dec. Dec. Dec. 2016 2016 2016 2016 2015 2016 2015 INCOME STATEMENT 19 (1) Includes expenses associated with problem loans and OREO, as well as OREO losses and writedowns. Interest income Interest and fees on loa n s $ 57,982 $ 57,322 $ 54,164 $ 49,191 $ 47,336 $ 218,659 $ 171,567 Interest on taxable securiti e s 4,348 4,336 4,554 4,586 4,540 17,824 16,134 Interest on nontaxable securiti e s 425 397 454 446 458 1,722 1,869 Interest on deposits in other ban k s 193 147 159 328 262 827 790 Interest on federal funds so l d 8 8 9 8 5 33 33 Total interest inco m e 62,956 62,210 59,340 54,559 52,601 239,065 190,393 Interest expense Interest on deposits $ 3,680 $ 3,074 $ 2,915 $ 2,741 $ 2,687 $ 12,410 $ 9,752 Interest on other borrowin g s 1,997 2,069 1,836 1,382 1,296 7,284 5,104 Total interest expen s e 5,677 5,143 4,751 4,123 3,983 19,694 14,856 Net interest inco m e 57,279 57,067 54,589 50,436 48,618 219,371 175,537 Provision for loan loss e s 1,710 811 889 681 553 4,091 5,264 Net interest income after provision for loan loss e s $ 55,569 $ 56,256 $ 53,700 $ 49,755 $ 48,065 $ 215,280 $ 170,273 Noninterest inco m e Service charges on deposit accoun t s $ 11,036 $ 11,358 $ 10,436 $ 9,915 $ 10,119 $ 42,745 $ 34,465 Mortgage banking activi t y 9,878 14,067 14,142 10,211 8,586 48,298 36,800 Other service charges, commissions and fe e s 706 791 967 1,111 1,112 3,575 3,754 Gain(loss) on sale of securiti e s - - - 94 - 94 137 Other non - interest inco m e 2,652 2,648 2,834 2,955 2,590 11,089 10,430 Total noninterest inco m e 24,272 28,864 28,379 24,286 22,407 105,801 85,586 Noninterest expense Salaries and employee benefi t s 25,137 27,982 27,531 26,187 25,972 106,837 94,003 Occupancy and equipment expens e s 6,337 5,989 6,371 5,700 5,917 24,397 21,195 Data processing and telecommunications expens e s 6,244 6,185 6,049 6,113 6,046 24,591 19,849 Credit resolution related expenses (1) 1,083 1,526 1,764 1,799 2,223 6,172 17,707 Advertising and marketing expens e s 1,273 1,249 854 805 1,171 4,181 3,312 Amortization of intangible asse t s 1,044 993 1,319 1,020 1,160 4,376 3,741 Merger and conversion charg e s 17 - - 6,359 1,807 6,376 7,980 Other non - interest expens e s 13,542 9,275 8,471 7,617 8,732 38,905 31,328 Total noninterest expen s e 54,677 53,199 52,359 55,600 53,028 215,835 199,115 Income before income tax e s $ 25,164 $ 31,921 $ 29,720 $ 18,441 $ 17,444 $ 105,246 $ 56,744 Income tax expen s e 6,987 10,364 9,671 6,124 3,296 33,146 15,897 Net inco m e $ 18,177 $ 21,557 $ 20,049 $ 12,317 $ 14,148 $ 72,100 $ 40,847 Diluted earnings available to common shareholders 0.52 0.61 0.57 0.37 0.43 2.08 1.27

Liabilities Deposits: 20 AMERIS BANCORP FINANCIAL HIGHLIGHTS (unaudited) (dollars in thousands except per share data and FTE headcount) Three Months Ended Dec. 2016 Sept. 2016 Jun. 2016 Mar. 2016 Dec. 2015 PERIOD - END BALANCE SHEET Assets Cash and due from ban k s $ 127,164 $ 123,270 $ 116,255 $ 146,863 $ 118,518 Federal funds sold and interest bearing balanc e s 71,221 90,801 68,273 107,373 272,045 Investment securities available for sale, at fair val u e 822,735 838,124 843,646 837,103 783,185 Other investmen t s 29,464 24,578 19,125 12,802 9,323 Mortgage loans held for sa l e 105,924 126,263 102,757 97,439 111,182 Loans, net of unearned inco m e 3,626,821 3,091,039 2,819,071 2,528,007 2,406,877 Purchased, non - covered loans (excluding loan pools 1,011,031 1,067,090 1,072,217 1,129,919 771,554 Purchased, non - covered loan poo l s 568,314 624,886 610,425 656,734 592,963 Covered loans 58,160 62,291 121,418 130,279 137,529 Less allowance for loan loss e s (23,920) (22,963) (21,734) (21,482) (21,062) Loans, n e t 5,240,406 4,822,343 4,601,397 4,423,457 3,887,861 Other real estate own e d 10,874 10,392 13,765 14,967 16,147 Purchased, non - covered other real estate own e d 11,332 14,126 13,928 15,048 14,333 Covered other real estate own e d 1,208 1,000 2,742 3,764 5,011 Total other real estate own e d 23,414 25,518 30,435 33,779 35,491 Premises and equipment, n e t 121,217 122,191 123,978 124,747 121,639 Goodwi l l 125,532 122,545 121,422 121,512 90,082 Other intangibles, n e t 17,428 18,472 20,574 21,892 17,058 FDIC loss sharing receivab l e - - - 1,197 6,301 Cash value of bank owned life insuran c e 78,053 77,637 77,095 76,676 64,251 Other assets 129,473 101,753 96,337 92,931 72,004 Total assets $ 6,892,031 $ 6,493,495 $ 6,221,294 $ 6,097,771 $ 5,588,940 Noninterest - beari n g $ 1,573,389 $ 1,563,316 $ 1,553,972 $ 1,529,037 $ 1,329,857 Interest - beari n g 4,001,774 3,742,782 3,625,560 3,701,750 3,549,433 Total deposits 5,575,163 5,306,098 5,179,532 5,230,787 4,879,290 Federal funds purchased & securities sold und e r agreements to repurcha s e 53,505 42,647 37,139 43,741 63,585 FDIC loss sharing payable, n e t 6,313 7,775 1,897 - - Other borrowin g s 492,321 373,461 260,191 110,531 39,000 Other liabiliti e s 34,064 37,033 33,050 28,647 22,432 Subordinated deferrable interest debentur e s 84,228 83,898 83,570 83,237 69,874 Total liabiliti e s 6,245,594 5,850,912 5,595,379 5,496,943 5,074,181 Stockholders' equi t y Preferred sto c k $ - $ - $ - $ - $ - Common sto c k 36,378 36,348 36,303 36,272 33,625 Capital surpl u s 410,276 409,630 408,549 407,726 337,349 Retained earnin g s 214,454 199,769 181,701 163,395 152,820 Accumulated other comprehensive income/(loss (1,058) 10,449 12,960 6,411 3,353 Less treasury stock (13,613) (13,613) (13,598) (12,976) (12,388) Total stockholders' equi t y 646,437 642,583 625,915 600,828 514,759 Total liabilities and stockholders' equi t y $ 6,892,031 $ 6,493,495 $ 6,221,294 $ 6,097,771 $ 5,588,940 Other Data Earning Asse t s 6,293,670 5,925,072 5,656,932 5,499,656 5,084,658 Intangible Asse t s 142,960 141,017 141,996 143,404 107,140 Interest Bearing Liabiliti e s 4,631,828 4,242,788 4,006,460 3,939,259 3,721,892 Average Assets 6,573,344 6,330,350 6,138,757 5,618,397 5,427,367 Average Common Stockholders' Equi t y 653,991 640,382 616,361 542,264 513,098

21 Net charge - off informati o n Non - accrual loans (excluding purchased non - cover e d (1) Asset quality information is presented net of covered assets where the Company's risk exposure is limited substantially b y l oss sharing agreements with the FD I C AMERIS BANCORP FINANCIAL HIGHLIGHTS (unaudited) (dollars in thousands except per share data and FTE headcount) Three Months Ended Twelve Months Ended Dec. 2016 Sept. 2016 Jun. 2016 Mar. 2016 Dec. 2015 Dec. 2016 Dec. 2015 ASSET QUALITY INFORMATION (1) Allowance for loan loss e s Balance at beginning of peri o d $ 22,963 $ 21,734 $ 21,482 $ 21,062 $ 22,471 $ 21,062 $ 21,157 Provision for loan lo s s 1,710 811 889 681 553 4,091 5,264 Charge - of f s 1,686 1,451 1,376 1,814 2,675 6,327 9,133 Recoveries 933 1,869 739 1,553 713 5,094 3,774 Net charge - offs (recoverie s ) 753 (418) 637 261 1,962 1,233 5,359 Ending balan c e $ 23,920 $ 22,963 $ 21,734 $ 21,482 $ 21,062 $ 23,920 $ 21,062 As a percentage of loa n s 0.66% 0.74% 0.77% 0.85% 0.88% 0.66% 0.88% As a percentage of nonperforming loa n s 132.05% 140.20% 135.81% 136.83% 124.92% 132.05% 124.92% Charge - offs Commercial, financial & agricultura $ 726 $ 326 $ 541 $ 406 $ 501 $ 1,999 $ 1,438 Real estate - residenti a l 239 292 123 468 621 1,122 1,587 Real estate - commercial & farmla n d - - 361 347 1,009 708 2,367 Real estate - construction & developme n t 264 60 109 155 157 588 622 Consumer installmen 159 74 59 59 110 351 410 Purchased non - covered, including poo l s 240 408 111 307 178 1,066 950 Cover e d 58 291 72 72 99 493 1,759 Total charge - of f s 1,686 1,451 1,376 1,814 2,675 6,327 9,133 Recoveries Commercial, financial & agricultura 121 119 87 73 134 400 651 Real estate - residenti a l 23 40 14 314 13 391 151 Real estate - commercial & farmla n d 78 13 57 121 13 269 317 Real estate - construction & developme n t 16 131 221 122 9 490 323 Consumer installmen 8 78 16 25 20 127 137 Purchased non - covered, including poo l s 458 399 208 658 232 1,723 1,187 Cover e d 229 1,089 136 240 292 1,694 1,008 Total recoveri e s 933 1,869 739 1,553 713 5,094 3,774 Net charge - offs (recoveries) $ 753 $ (418) $ 637 $ 261 $ 1,962 $ 1,233 $ 5,359 and covered loans) 18,114 16,379 16,003 15,700 16,860 18,114 16,860 Non - accrual purchased non - covered loa n s 18,420 17,993 15,767 19,187 13,330 18,420 13,330 Non - accrual purchased loan poo l s - 864 864 - - - - Foreclosed assets (excluding purchased asset s ) 10,874 10,392 13,765 14,967 16,147 10,874 16,147 Purchased, non - covered other real estate own e d 11,332 14,126 13,928 15,048 14,333 11,332 14,333 Accruing loans delinquent 90 days or mo r e - - - - - - - Total non - performing assets, excluding covered asse t s 58,740 59,754 60,327 64,902 60,670 58,740 60,670 Non - performing assets as a percent of total asse t s 0.85% 0.92% 0.97% 1.06% 1.09% 0.85% 1.09% Net charge offs as a percent of loans (Annualize d ) Net charge offs, excluding purchased loans, loan pools a n d covered loans, as a percent of loans (Annualize d ) 0.06% 0.14% - 0.04% 0.05% 0.06% 0.12% 0.03% 0.13% 0.21% 0.38% 0.03% 0.11% 0.16% 0.22%

Commercial, financial & agricultura Real estate - construction & developme n t Real estate - commercial & farmla n d Real estate - residenti a l Consumer installmen Total Purchased non - covered loan poo l s - - - 568,314 $ - - - 624,886 $ - - - 610,425 $ - - - 656,734 $ - - - 592,963 $ - - - - - $ 568,314 $ 624,886 $ 610,425 $ 656,734 $ 592,963 Troubled Debt Restructurings, excluding purchased non - covered and covered loans: Accruing loan type s : 22 AMERIS BANCORP FINANCIAL HIGHLIGHTS (unaudited) (dollars in thousands except per share data and FTE headcount) For the quarter ended: Loans by Type Dec. 2016 Sept. 2016 Jun. 2016 Mar. 2016 Dec. 2015 Commercial, financial & agricultura $ 967,138 $ 625,947 $ 564,343 $ 434,073 $ 449,623 Real estate - construction & developme n t 363,045 328,308 274,717 264,820 244,693 Real estate - commercial & farmla n d 1,406,219 1,297,582 1,248,580 1,154,887 1,104,991 Real estate - residenti a l 781,018 766,933 680,233 629,138 570,430 Consumer installmen 96,915 68,305 33,245 31,901 31,125 Oth e r Total Legacy (excluding purchas e d 12,486 3,964 17,953 13,188 6,015 non - covered and covered) $ 3,626,821 $ 3,091,039 $ 2,819,071 $ 2,528,007 $ 2,406,877 Commercial, financial & agricultura $ 95,743 $ 99,596 $ 101,803 $ 111,537 $ 45,462 Real estate - construction & developme n t 78,376 86,099 89,096 103,753 72,080 Real estate - commercial & farmla n d 563,438 590,388 574,830 598,935 390,755 Real estate - residenti a l 268,888 286,169 300,898 309,770 258,153 Consumer installmen 4,586 4,838 5,590 5,924 5,104 Total Purchased non - covered (net of discount s ) $ 1,011,031 $ 1,067,090 $ 1,072,217 $ 1,129,919 $ 771,554 Commercial, financial & agricultura $ 794 $ 830 $ 1,604 $ 4,739 $ 5,546 Real estate - construction & developme n t 2,992 3,220 7,168 7,205 7,612 Real estate - commercial & farmla n d 12,917 13,688 65,091 67,055 71,226 Real estate - residenti a l 41,389 44,457 47,455 51,176 53,038 Consumer installmen 68 96 100 104 107 Total Covered (net of discount s ) $ 58,160 $ 62,291 $ 121,418 $ 130,279 $ 137,529 Total Loan Portfolio: Commercial, financial & agricultura $ 1,063,675 $ 726,373 $ 667,750 $ 550,349 $ 500,631 Real estate - construction & developme n t 444,413 417,627 370,981 375,778 324,385 Real estate - commercial & farmla n d 1,982,574 1,901,658 1,888,501 1,820,877 1,566,972 Real estate - residenti a l 1,659,609 1,722,445 1,639,011 1,646,818 1,474,584 Consumer installmen 101,569 73,239 38,935 37,929 36,336 Oth e r 12,486 3,964 17,953 13,188 6,015 Total Loans $ 5,264,326 $ 4,845,306 $ 4,623,131 $ 4,444,939 $ 3,908,923 Commercial, financial & agricultura $ 47 $ 53 $ 275 $ 279 $ 240 Real estate - construction & developme n t 686 691 468 476 792 Real estate - commercial & farmla n d 4,119 5,535 5,802 5,945 5,766 Real estate - residenti a l 9,340 7,713 8,226 7,648 7,574 Consumer installmen 17 21 24 37 46 Total Accruing TDRs $ 14,209 $ 14,013 $ 14,795 $ 14,385 $ 14,418 Non - accruing loan type s : Commercial, financial & agricultura $ 114 $ 112 $ 86 $ 75 $ 110 Real estate - construction & developme n t 35 35 36 30 63 Real estate - commercial & farmla n d 2,970 2,015 1,832 1,871 596 Real estate - residenti a l 738 849 899 1,040 1,123 Consumer installmen 130 120 113 87 94 Total Non - accrual TDRs $ 3,987 $ 3,131 $ 2,966 $ 3,103 $ 1,986 Total Troubled Debt Restructurin g s $ 18,196 $ 17,144 $ 17,761 $ 17,488 $ 16,404
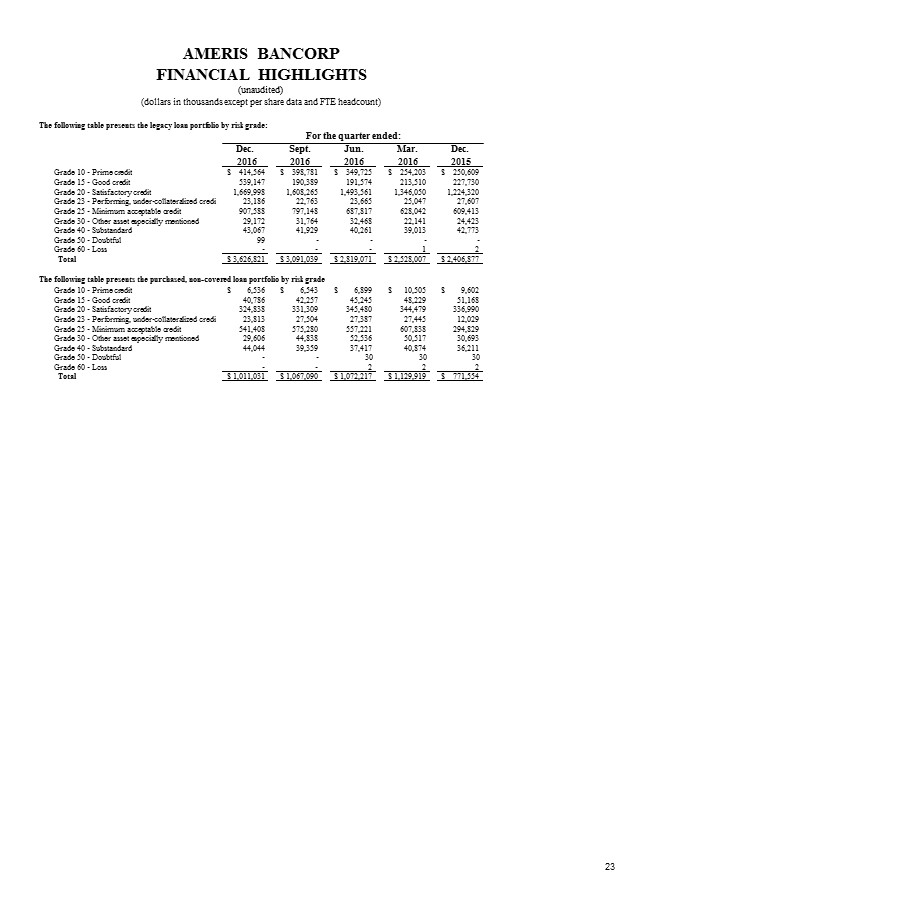
The following table presents the legacy loan portfolio by risk grade: For the quarter ended: Dec. Sept. Jun. Mar. Dec. The following table presents the purchased, non - covered loan portfolio by risk grade AMERIS BANCORP FINANCIAL HIGHLIGHTS (unaudited) (dollars in thousands except per share data and FTE headcount) 23 2016 2016 2016 2016 2015 Grade 10 - Prime cred i t $ 414,564 $ 398,781 $ 349,725 $ 254,203 $ 250,609 Grade 15 - Good credit 539,147 190,389 191,574 213,510 227,730 Grade 20 - Satisfactory cred i t 1,669,998 1,608,265 1,493,561 1,346,050 1,224,320 Grade 23 - Performing, under - collateralized credi 23,186 22,763 23,665 25,047 27,607 Grade 25 - Minimum acceptable cred i t 907,588 797,148 687,817 628,042 609,413 Grade 30 - Other asset especially mention e d 29,172 31,764 32,468 22,141 24,423 Grade 40 - Substanda r d 43,067 41,929 40,261 39,013 42,773 Grade 50 - Doubtf u l 99 - - - - Grade 60 - Loss - - - 1 2 Total $ 3,626,821 $ 3,091,039 $ 2,819,071 $ 2,528,007 $ 2,406,877 Grade 10 - Prime cred i t $ 6,536 $ 6,543 $ 6,899 $ 10,505 $ 9,602 Grade 15 - Good credit 40,786 42,257 45,245 48,229 51,168 Grade 20 - Satisfactory cred i t 324,838 331,309 345,480 344,479 336,990 Grade 23 - Performing, under - collateralized credi 23,813 27,504 27,387 27,445 12,029 Grade 25 - Minimum acceptable cred i t 541,408 575,280 557,221 607,838 294,829 Grade 30 - Other asset especially mention e d 29,606 44,838 52,536 50,517 30,693 Grade 40 - Substanda r d 44,044 39,359 37,417 40,874 36,211 Grade 50 - Doubtf u l - - 30 30 30 Grade 60 - Loss - - 2 2 2 Total $ 1,011,031 $ 1,067,090 $ 1,072,217 $ 1,129,919 $ 771,554

Three Months Ended Dec. Sept. Jun. Mar. Dec. Twelve Months Ended Dec. Dec. 2016 2016 2016 2016 2015 2016 2015 AVERAGE BALANCES AMERIS BANCORP FINANCIAL HIGHLIGHTS (unaudited) (dollars in thousands except per share data and FTE headcount) 24 Federal funds so l d $ 5,261 $ 5,500 $ 7,186 $ 6,200 $ 5,500 $ 6,033 $ 5,500 Interest bearing deposits in ban k s 122,538 85,051 96,906 201,814 291,303 126,453 214,120 Investment securities - taxab l e 770,373 767,421 766,006 728,269 730,608 758,076 650,708 Investment securities - nontaxab l e 66,566 68,325 69,664 68,824 69,711 68,340 71,035 Other investmen t s 19,732 21,687 14,765 9,606 9,322 16,470 9,422 Mortgage loans held for sa l e 102,926 105,859 96,998 82,803 98,765 97,995 87,952 Loans 3,145,714 2,897,771 2,653,171 2,410,747 2,333,577 2,777,505 2,161,726 Purchased non - covered loa n s 1,042,333 1,086,039 1,111,814 836,187 752,508 1,019,093 712,022 Purchased non - covered loan poo l s 590,617 629,666 630,503 627,178 454,884 619,440 201,689 Covered loans 59,574 113,136 127,595 134,383 180,493 108,672 206,774 Total Earning Assets $ 5,925,634 $ 5,780,455 $ 5,574,608 $ 5,106,011 $ 4,926,671 $ 5,598,077 $ 4,320,948 Noninterest bearing deposi t s $ 1,592,073 $ 1,546,211 $ 1,561,621 $ 1,362,007 $ 1,324,999 $ 1,515,771 $ 1,227,682 NOW accounts 1,253,849 1,085,828 1,087,442 1,137,076 1,100,972 1,141,206 877,949 MMDA 1,435,958 1,435,151 1,413,503 1,278,199 1,212,087 1,390,948 1,074,349 Savings accoun t s 262,782 266,344 265,936 251,108 241,337 261,559 209,206 Retail CDs < $100,000 445,132 431,570 437,899 438,122 449,158 438,798 425,583 Retail CDs > $100,000 497,113 451,115 439,954 406,699 395,978 448,243 384,761 Brokered CDs 3,750 5,000 5,000 1,099 - 3,716 - Total Deposits 5,490,657 5,221,219 5,211,355 4,874,310 4,724,531 5,200,241 4,199,530 FHLB advanc e s 222,426 265,202 104,195 9,648 - 150,879 8,444 Other borrowin g s 38,728 49,345 51,970 42,096 39,000 45,526 40,931 Subordinated debentur e s Federal funds purchased and securities so l d under agreements to repurcha s e 84,050 44,000 83,719 37,305 83,386 43,286 72,589 52,787 69,723 61,986 80,952 44,324 67,962 50,988 Total Non - Deposit Funding 389,204 435,571 282,837 177,120 170,709 321,681 168,325 Total Fundi n g $ 5,879,861 $ 5,656,790 $ 5,494,192 $ 5,051,430 $ 4,895,240 $ 5,521,922 $ 4,367,855

AMERIS BANCORP FINANCIAL HIGHLIGHTS (unaudited) (dollars in thousands except per share data and FTE headcount) Three Months Ended Twelve Months Ended Dec. Sept. Jun. Mar. Dec. Dec. Dec. 2016 2016 2016 2016 2015 2016 2015 INTEREST INCOME/EXPENSE INTEREST INCOME Accretion Income (included abov e ) 3,370 3,604 4,196 2,942 2,912 14,112 11,681 INTEREST EXPENSE Total Funding $ 5,678 $ 5,143 $ 4,751 $ 4,123 $ 3,983 $ 19,695 $ 14,856 Net Interest Income (TE) $ 58,897 $ 58,024 $ 55,525 $ 51,177 $ 49,403 $ 223,623 $ 178,113 25 Federal funds sold $ 8 $ 8 $ 9 $ 8 $ 5 $ 33 $ 33 Interest bearing deposits in ban k s 193 147 159 328 262 827 790 Investment securities - taxab l e 4,348 4,336 4,554 4,586 4,540 17,824 16,134 Investment securities - nontaxable (TE 654 536 613 602 618 2,405 2,523 Mortgage loans held for sa l e 989 826 821 755 1,040 3,391 3,466 Loans (T E ) 37,418 33,672 31,531 28,684 27,901 131,305 103,206 Purchased non - covered loa n s 16,036 17,629 17,062 13,133 12,129 63,860 46,208 Purchased non - covered loan poo l s 3,950 4,346 3,730 5,144 3,335 17,170 6,481 Covered loans 979 1,667 1,797 2,060 3,556 6,503 14,128 Total Earning Assets $ 64,575 $ 63,167 $ 60,276 $ 55,300 $ 53,386 $ 243,318 $ 192,969 Non - interest bearing deposi t s $ - $ - $ - $ - $ - $ - $ - NOW accounts 613 433 439 468 463 1,953 1,461 MMDA 1,405 1,241 1,168 1,040 929 4,854 3,229 Savings accoun t s 44 45 45 43 42 177 158 Retail CDs < $100,000 553 493 476 512 594 2,034 2,202 Retail CDs > $100,000 1,060 854 779 676 659 3,369 2,703 Brokered CDs 6 8 8 2 - 24 - Total Deposits 3,681 3,074 2,915 2,741 2,687 12,411 9,753 FHLB advances 328 393 155 23 - 899 31 Other borrowings 432 479 484 370 328 1,765 1,362 Subordinated debentur e s Federal funds purchased and securities so l d under agreements to repurcha s e 1,216 21 1,179 18 1,173 24 954 35 924 44 4,522 98 3,536 174 Total Non - Deposit Funding 1,997 2,069 1,836 1,382 1,296 7,284 5,103

AMERIS BANCORP FINANCIAL HIGHLIGHTS (unaudited) (dollars in thousands except per share data and FTE headcount) Three Months Ended Twelve Months Ended Dec. Sept. Jun. Mar. Dec. Dec. Dec. 2016 2016 2016 2016 2015 2016 2015 YIELDS (1) (1) Interest and average rates are calculated on a tax - equivalent basis using an effective tax rate of 35% (2) Rate calculated based on average earning assets. (3) Rate calculated based on total average funding including non - interest bearing liabiliti e s 26 Federal funds sold 0.60% 0.58% 0.50% 0.52% 0.36% 0.55% 0.60% Interest bearing deposits in banks 0.63% 0.69% 0.66% 0.65% 0.36% 0.65% 0.37% Investment securities - taxable 2.25% 2.25% 2.39% 2.53% 2.47% 2.35% 2.48% Investment securities - nontaxable 3.91% 3.12% 3.54% 3.52% 3.52% 3.52% 3.55% Mortgage loans held for sale 3.82% 3.10% 3.40% 3.67% 4.18% 3.46% 3.94% Loans 4.73% 4.62% 4.78% 4.79% 4.74% 4.73% 4.77% Purchased non - covered loans 6.12% 6.46% 6.17% 6.32% 6.39% 6.27% 6.49% Purchased non - covered loan pools 2.66% 2.75% 2.38% 3.30% 2.91% 2.77% 3.21% Covered loans 6.54% 5.86% 5.66% 6.17% 7.82% 5.98% 6.83% Total Earning Assets 4.34% 4.35% 4.35% 4.36% 4.30% 4.35% 4.47% Noninterest bearing deposi t s 0.00% 0.00% 0.00% 0.00% 0.00% 0.00% 0.00% NOW accounts 0.19% 0.16% 0.16% 0.17% 0.17% 0.17% 0.17% MMDA 0.39% 0.34% 0.33% 0.33% 0.30% 0.35% 0.30% Savings accoun t s 0.07% 0.07% 0.07% 0.07% 0.07% 0.07% 0.08% Retail CDs < $100,000 0.49% 0.45% 0.44% 0.47% 0.52% 0.46% 0.52% Retail CDs > $100,000 0.85% 0.75% 0.71% 0.67% 0.66% 0.75% 0.70% Brokered CDs 0.64% 0.64% 0.64% 0.73% 0.00% 0.65% 0.00% Total Deposits 0.27% 0.23% 0.22% 0.23% 0.23% 0.24% 0.23% FHLB advanc e s 0.59% 0.59% 0.60% 0.96% 0.00% 0.60% 0.37% Other borrowin g s 4.44% 3.86% 3.75% 3.54% 3.34% 3.88% 3.33% Subordinated debentur e s Federal funds purchased and securities so l d under agreements to repurcha s e 5.76% 0.19% 5.60% 0.19% 5.66% 0.22% 5.29% 0.27% 5.26% 0.28% 5.59% 0.22% 5.20% 0.34% Total Non - Deposit Funding 2.04% 1.89% 2.61% 3.14% 3.01% 2.26% 3.03% Total funding ( 3 ) 0.38% 0.36% 0.35% 0.33% 0.32% 0.36% 0.34% Net interest spread 3.95% 3.99% 4.00% 4.03% 3.98% 3.99% 4.13% Net interest marg i n 3.95% 3.99% 4.01% 4.03% 3.98% 3.99% 4.12%

Three Months Ended Twelve Months Ended Dec. Sept. Jun. Mar. Dec. Dec. Dec. Net Interest Margin and Yields on Total Loans 2016 2016 2016 2016 2015 2016 2015 Excluding Accretion Reconciliati o n 27 AMERIS BANCORP FINANCIAL HIGHLIGHTS (unaudited) (dollars in thousands except per share data and FTE headcount) Three Months Ended Twelve Months Ended Adjusted Operating Net Income Reconciliation Dec. 2016 Sept. Jun. Mar. 2016 2016 2016 Dec. 2015 Dec. 2016 Dec. 2015 Net income available to common shareholders $ 18,177 $ 21,557 $ 20,049 $ 12,317 $ 14,148 $ 72,100 $ 40,847 Merger and conversion charges 17 - - 6,359 1,807 6,376 7,980 Certain credit resolution related expenses - - - - - - 11,241 Certain compliance resolution expenses 5,750 - - - - 5,750 - Tax effect of management - adjusted charges (2,018) - - (2,226) (632) (4,244) (6,727) Plus: After tax management - adjusted charges 3,749 - - 4,133 1,175 7,882 12,494 Adjusted Operating Net income 21,926 21,557 20,049 16,450 15,323 79,982 53,341 Adjusted operating net income per diluted share: $ 0.62 $ 0.61 $ 0.57 $ 0.50 $ 0.47 $ 2.30 $ 1.66 Adjusted operating return on average assets 1.33% 1.35% 1.31% 1.18% 1.12% 1.30% 1.11% Adjusted operating return on average common tangible equity 17.04% 17.18% 17.03% 15.42% 14.97% 16.71% 13.66% Total Interest Income (T E ) $ 64,575 $ 63,167 $ 60,276 $ 55,300 $ 53,386 $ 243,318 $ 192,969 Accretion Inco m e 3,370 3,604 4,196 2,942 2,912 14,112 11,681 Total Interest Income (TE) Excluding Accreti o n $ 61,205 $ 59,563 $ 56,080 $ 52,358 $ 50,474 $ 229,206 $ 181,288 Total Interest Expen s e $ 5,677 $ 5,143 $ 4,751 $ 4,123 $ 3,983 $ 19,694 $ 14,856 Net Interest Income (TE) Excluding Accreti o n $ 55,528 $ 54,420 $ 51,329 $ 48,235 $ 46,491 $ 209,512 $ 166,432 Yield on Total Loans Excluding Accreti o n 4.51% 4.49% 4.42% 4.60% 4.68% 4.50% 4.80% Net Interest Margin Excluding Accreti o n 3.73% 3.75% 3.70% 3.80% 3.74% 3.74% 3.85%

Three Months Ended Dec. Sept. Jun. Mar. Dec. Twelve Months Ended Dec. Dec. Core Earnings Reconciliation 2016 2016 2016 2016 2015 2016 2015 Plus: Management - adjusted charg e s Less: Management - adjusted gains (losse s ) Gains on sales of securities Gains/(Losses) on sales of bank premis e s - - - (94) 430 238 401 (77) $ 34,175 $ 34,537 $ 32,809 $ 27,143 2.07% 2.17% 2.15% 1.94% Three Months Ended Dec. Sept. Jun. Mar. - (267) $ 21,818 (94) (137) 992 (267) Pretax, Pre - provision earnin g s $ 128,664 $ 87,957 2.09% 1.62% Twelve Months Ended Dec. Dec. As percentage of average assets, annualiz e d 1.59% Dec. 28 AMERIS BANCORP FINANCIAL HIGHLIGHTS (unaudited) (dollars in thousands except per share data and FTE headcount) Pre - tax operating profit/(los s ) $ 25,164 $ 31,921 $ 29,720 $ 18,441 $ 17,444 $ 105,246 $ 56,744 Plus: Credit Related Costs Provision for loan loss e s 1,710 811 889 681 553 4,091 5,264 (Gains)/Losses on the sale of legacy OR E O 72 377 447 753 535 1,649 1,117 Gains/(Losses) on the sale of covered OREO 1 (89) 28 166 610 106 880 Problem loan and OREO expense 1,010 1,238 1,289 880 1,078 4,417 15,732 Interest reversed (received) on non - accrual loa n s 21 41 35 34 58 131 644 Total Credit - Related Costs 2,814 2,378 2,688 2,514 2,834 10,394 23,637 Conversion charg e s 17 - - 6,359 1,807 6,376 7,980 Compliance resolution expens e s 5,750 - - - - 5,750 - Management - Adjusted Operating Expenses 2016 2016 2016 2016 2015 2016 2015 Total Operating Expens e s Less: Credit costs & managemnt - adjusted charg e s Gains/(Losses) on the sale of legacy OR E O 54,677 (72) 53,199 (377) 52,359 (447) 55,600 (753) 53,028 (535) 215,835 (1,649) 199,115 (1,117) Gains/(Losses) on the sale of covered OREO (1) 89 (28) (166) (610) (106) (880) Problem loan and OREO expen s e (1,010) (1,238) (1,289) (880) (1,078) (4,417) (15,732) Conversion expens e s (17) - - (6,359) (1,807) (6,376) (7,980) Compliance resolution expens e s (5,750) - - - - (5,750) - Gains/(Losses) on the sale of premis e s (430) (238) (401) 77 267 (992) 267 Management - adjusted operating expens e s $ 47,397 $ 51,435 $ 50,194 $ 47,519 $ 49,265 $ 196,545 $ 173,673

Retail Mortgage Division: Warehouse Lending: SBA Division: 29 Three Months Ended AMERIS BANCORP FINANCIAL HIGHLIGHTS (unaudited) (dollars in thousands except per share data and FTE headcount) Twelve Months Ended Segment Reporting Dec. 2016 Sept. 2016 Jun. 2016 Mar. 2016 Dec. 2015 Dec. 2016 Dec. 2015 Banking Division: Net interest inco m e $ 50,240 $ 50,374 $ 48,940 $ 45,801 $ 44,088 $ 195,355 $ 159,777 Provision for loan loss e s 610 57 733 681 504 2,081 4,847 Noninterest inco m e Noninterest expense: Salaries and employee benefi t s 13,466 17,084 13,949 18,323 13,018 18,428 12,735 18,989 12,739 19,225 53,168 72,824 44,251 68,183 Occupancy 5,670 5,490 5,901 5,150 5,356 22,211 19,320 Data Processing 5,885 5,794 5,685 5,820 5,759 23,184 18,681 Other expenses 15,667 11,533 11,071 16,436 13,853 54,707 59,636 Total noninterest expense 44,306 41,140 41,085 46,395 44,193 172,926 165,820 Income before income tax e s 18,790 23,126 20,140 11,460 12,130 73,516 33,361 Income T a x 4,756 7,286 6,318 3,681 1,436 22,041 7,713 Net income $ 14,034 $ 15,840 $ 13,822 $ 7,779 $ 10,694 $ 51,476 $ 25,648 Net interest inco m e $ 4,118 $ 3,679 $ 3,293 $ 3,020 $ 2,812 $ 14,110 $ 8,821 Provision for loan loss e s 33 447 93 - 49 573 417 Noninterest inco m e 9,036 13,198 13,304 9,624 7,966 45,162 34,498 Noninterest expense: Salaries and employee benefi t s 7,098 8,940 8,304 6,347 5,855 30,689 22,112 Occupancy 602 433 405 488 501 1,928 1,674 Data Processing 326 364 338 272 266 1,300 1,065 Other expenses 1,093 1,303 1,133 956 1,043 4,485 3,787 Total noninterest expense 9,119 11,040 10,180 8,063 7,665 38,402 28,638 Income before income tax e s 4,002 5,390 6,324 4,581 3,064 20,297 14,264 Income T a x 1,401 1,887 2,213 1,603 1,072 7,104 4,992 Net income $ 2,601 $ 3,504 $ 4,111 $ 2,978 $ 1,992 $ 13,193 $ 9,272 Net interest inco m e $ 1,972 $ 2,073 $ 1,622 $ 1,019 $ 995 $ 6,686 $ 4,137 Provision for loan loss e s 496 94 - - - 590 - Noninterest inco m e 462 555 440 333 336 1,790 1,364 Noninterest expense: Salaries and employee benefi t s 220 103 108 188 156 619 519 Occupancy 1 1 1 1 3 4 7 Data Processing 32 26 25 20 20 103 95 Other expenses 29 26 26 25 28 106 123 Total noninterest expense 282 156 160 234 207 832 744 Income before income taxes 1,656 2,378 1,902 1,118 1,124 7,054 4,757 Income T a x 580 832 666 391 393 2,469 1,665 Net income $ 1,076 $ 1,546 $ 1,236 $ 727 $ 731 $ 4,585 $ 3,092 Net interest inco m e $ 949 $ 941 $ 734 $ 596 $ 723 $ 3,220 $ 2,802 Provision for loan loss e s 571 213 63 - - 847 - Noninterest inco m e 1,308 1,162 1,617 1,594 1,366 5,681 5,473 Noninterest expense: Salaries and employee benefi t s 735 616 691 663 736 2,705 3,189 Occupancy 64 65 64 61 57 254 194 Data Processing 1 1 1 1 1 4 8 Other expenses 170 181 178 183 169 712 522 Total noninterest expense 970 863 934 908 963 3,675 3,913 Income before income taxes 716 1,027 1,354 1,282 1,126 4,379 4,362 Income T a x 251 359 474 449 394 1,533 1,527 Net income $ 465 $ 668 $ 880 $ 833 $ 732 $ 2,846 $ 2,835