Attached files
| file | filename |
|---|---|
| EX-32.2 - EXHIBIT 32.2 - POWER INTEGRATIONS INC | powi_ex322x12-31x2016.htm |
| EX-32.1 - EXHIBIT 32.1 - POWER INTEGRATIONS INC | powi_ex321x12-31x2016.htm |
| EX-31.2 - EXHIBIT 31.2 - POWER INTEGRATIONS INC | powi_ex312x12-31x2016.htm |
| EX-31.1 - EXHIBIT 31.1 - POWER INTEGRATIONS INC | powi_ex311x12-31x2016.htm |
| EX-23.1 - EXHIBIT 23.1 - POWER INTEGRATIONS INC | powi_ex231x12-31x2016.htm |
| EX-21.1 - EXHIBIT 21.1 - POWER INTEGRATIONS INC | powi_ex211x12-31x2016.htm |
| EX-10.47 - EXHIBIT 10.47 - POWER INTEGRATIONS INC | powi_ex1047x12-31x2016.htm |
| EX-10.46 - EXHIBIT 10.46 - POWER INTEGRATIONS INC | powi_ex1046x12-31x2016.htm |
| EX-10.27 - EXHIBIT 10.27 - POWER INTEGRATIONS INC | powi_ex1027x12-31x2016.htm |
| EX-10.26 - EXHIBIT 10.26 - POWER INTEGRATIONS INC | powi_ex1026x12-31x2016.htm |
| EX-10.25 - EXHIBIT 10.25 - POWER INTEGRATIONS INC | powi_ex1025x12-31x2016.htm |
UNITED STATES
SECURITIES AND EXCHANGE COMMISSION
Washington, DC 20549
FORM 10-K
(Mark One)
x Annual report pursuant to Section 13 or 15(d) of the Securities Exchange Act of 1934 for the fiscal year ended December 31, 2016
or
o Transition report pursuant to Section 13 or 15(d) of the Securities Exchange Act of 1934 for the transition period from to
Commission File Number 0-23441
POWER INTEGRATIONS, INC.
(Exact name of registrant as specified in its charter)
DELAWARE | 94-3065014 |
(State or other jurisdiction of | (I.R.S. Employer |
Incorporation or organization) | Identification No.) |
5245 Hellyer Avenue, San Jose, California | 95138-1002 |
(Address of principal executive offices) | (Zip code) |
(408) 414-9200
(Registrant’s telephone number, including area code)
Securities registered pursuant to Section 12(b) of the Act:
Title of Each Class | Name of Each Exchange on Which Registered | |
Common Stock, $0.001 Par Value | The NASDAQ Global Select Market | |
Securities registered pursuant to Section 12(g) of the Act: None
Indicate by check mark if the registrant is a well-known seasoned issuer, as defined in Rule 405 of the Securities Act. YES x NO o
Indicate by check mark if the registrant is not required to file reports pursuant to Section 13 or Section 15(d) of the Act. YES o NO x
Indicate by check mark whether the registrant (1) has filed all reports required to be filed by Section 13 or 15(d) of the Securities Exchange Act of 1934 during the preceding 12 months (or for such shorter period that the registrant was required to file such reports), and (2) has been subject to such filing requirements for the past 90 days. YES x NO o
Indicate by check mark whether the registrant has submitted electronically and posted on its corporate Web site, if any, every Interactive Data File required to be submitted and posted pursuant to Rule 405 of Regulation S-T during the preceding 12 months (or for such shorter period that the registrant was required to submit and post such files). YES x NO o
Indicate by check mark if disclosure of delinquent filers pursuant to Item 405 of Regulation S-K is not contained herein, and will not be contained, to the best of registrant’s knowledge, in definitive proxy or information statements incorporated by reference in Part III of this Form 10-K or any amendment to this Form 10-K. o
Indicate by check mark whether the registrant is a large accelerated filer, an accelerated filer, a non-accelerated filer, or a smaller reporting company. See the definitions of “large accelerated filer”, “accelerated filer” and “smaller reporting company” in Rule 12b-2 of the Exchange Act:
Large accelerated filer x | Accelerated filer o | Non-accelerated filer o (Do not check if a smaller reporting company) | Smaller reporting company o |
Indicate by check mark whether the registrant is a shell company (as defined in Rule 12b-2 of the Act). YES o NO x
The aggregate market value of registrant’s voting and non-voting common stock held by non-affiliates of registrant on June 30, 2016, the last business day of the registrant’s most recently completed second fiscal quarter, was approximately $1.2 billion, based upon the closing sale price of the common stock as reported on The NASDAQ Global Select Market. Shares of common stock held by each officer and director have been excluded in that such persons may be deemed to be affiliates. This determination of affiliate status is not a conclusive determination for other purposes.
Outstanding shares of registrant’s common stock, $0.001 par value, as of January 31, 2017: 29,415,049.
DOCUMENTS INCORPORATED BY REFERENCE
The information required by Part III of this report, to the extent not set forth herein, is incorporated by reference from the Registrant’s definitive proxy statement relating to the 2017 annual meeting of stockholders, which definitive proxy statement will be filed with the Securities and Exchange Commission within 120 days after the fiscal year to which this Report relates.
POWER INTEGRATIONS, INC.
TABLE OF CONTENTS
Page | ||
ITEM 1. | ||
ITEM 1A. | ||
ITEM 1B. | ||
ITEM 2. | ||
ITEM 3. | ||
ITEM 4. | ||
ITEM 5. | ||
ITEM 6. | ||
ITEM 7. | ||
ITEM 7A. | ||
ITEM 8. | ||
ITEM 9. | ||
ITEM 9A. | ||
ITEM 9B. | ||
ITEM 10. | ||
ITEM 11. | ||
ITEM 12. | ||
ITEM 13. | ||
ITEM 14. | ||
ITEM 15. | ||
ITEM 16. | ||
2
Cautionary Note Regarding Forward-Looking Statements
This Annual Report on Form 10-K, including information incorporated by reference herein, includes a number of forward-looking statements that involve many risks and uncertainties. In some cases, forward-looking statements are indicated by the use of words such as “would,” “could,” “will,” “may,” “expect,” “believe,” “anticipate,” “if,” “future,” “intend,” “plan,” “estimate,” “potential,” “seek” or “continue” and similar words and phrases, including the negatives of these terms, or other variations of these terms. These statements reflect our current views with respect to future events and our potential financial performance and are subject to risks and uncertainties that could cause our actual results and financial position to differ materially and/or adversely from what is projected or implied in any forward-looking statements included in this Form 10-K. These factors include, but are not limited to: we do not have long-term contracts with any of our customers and if they fail to place, or if they cancel or reschedule orders for our products, our operating results and our business may suffer; intense competition in the high-voltage power supply industry may lead to a decrease in our average selling price and reduced sales volume of our products; if demand for our products declines in our major end markets, our net revenues will decrease; we depend on third-party suppliers to provide us with wafers for our products, and if they fail to provide us sufficient quantities of wafers, our business may suffer; if we are unable to adequately protect or enforce our intellectual property rights, we could lose market share, incur costly litigation expenses, suffer incremental price erosion or lose valuable assets, any of which could harm our operations and negatively impact our profitability; fluctuations in exchange rates, particularly the exchange rate between the U.S. dollar and the Japanese yen, Swiss franc and euro, may impact our gross margin or net income; audits of our tax returns and potential future changes in tax laws may increase the amount of taxes we are required to pay; we are engaged in intellectual property litigation, and if we do not prevail in our litigation, we will have expended significant financial resources, potentially without any benefit, and may also suffer the loss of rights to use some technologies; and the other risks factors described in Item 1A of Part I -- “Risk Factors” of this Form 10-K. We make these forward looking statements based upon information available on the date of this Form 10-K, and we have no obligation (and expressly disclaim any obligation) to update or alter any forward-looking statements, whether as a result of new information or otherwise. In evaluating these statements, you should specifically consider the risks described under Item 1A of Part I -- “Risk Factors,” Item 7 of Part II -“Management’s Discussion and Analysis of Financial Condition and Results of Operations” and elsewhere in this Annual Report on Form 10-K.
3
PART I.
Item 1. Business.
Overview
We design, develop and market analog and mixed-signal integrated circuits (ICs) and other electronic components and circuitry used in high-voltage power conversion. Our products are used in power converters that convert electricity from a high-voltage source (typically 48 volts or higher) to the type of power required for a specified downstream use. In most cases, this conversion entails, among other functions, converting alternating current (AC) to direct current (DC) or vice versa, reducing or increasing the voltage, and regulating the output voltage and/or current according to the customer’s specifications.
A large percentage of our products are ICs used in AC-DC power supplies, which convert the high-voltage AC from a wall outlet to the low-voltage DC required by most electronic devices. Power supplies incorporating our products are used with all manner of electronic products including mobile phones, computing and networking equipment, appliances, electronic utility meters, industrial controls, and lights that utilize light-emitting diodes (LEDs), and “smart-home,” or “internet of things” applications such as networked thermostats, power strips and other home-automation and security devices.
We also offer high-voltage gate drivers - either standalone ICs or circuit boards containing ICs, electrical isolation components and other circuitry - used to operate high-voltage switches such as insulated-gate bipolar transistors (IGBTs). These combinations of switches and drivers are used for power conversion in high-power applications (i.e., power levels ranging from a few kilowatts up to one gigawatt) such as industrial motors, solar- and wind-power systems, electric vehicles and high-voltage DC transmission systems.
Our products bring a number of important benefits to the power-conversion market compared with less advanced alternatives, including reduced component count and design complexity, smaller size, higher reliability and reduced time-to-market. Our products also improve the energy efficiency of power converters, helping our customers meet the increasingly stringent efficiency standards that have been adopted around the world for many electronic products, and improving the efficacy of renewable-energy systems, electric vehicles and other high-power applications.
While the size of our addressable market fluctuates with changes in macroeconomic conditions, the market has generally exhibited a modest growth rate over time as growth in the unit volume of power converters has largely been offset by reductions in the average selling price of components in this market. Therefore, the growth of our business depends largely on our penetration of the addressable market, and our success in expanding the addressable market by introducing new products that expand the range of applications we can address and/or increase the value of the components we can sell into a power converter. Our growth strategy includes the following elements:
•Increase the penetration of our ICs in the “low-power” market. The largest proportion of our revenues comes from AC-DC power-supply applications requiring 500 watts of output or less. We continue to introduce more advanced products for this market that offer higher levels of integration and performance compared to earlier products. We also continue to expand our sales and application-engineering staff, as well as our offerings of technical documentation and design-support tools to help customers use our ICs. These tools include our PI Expert™ design software, which we offer free of charge, and our transformer-sample service.
•Increase the penetration of our products and the size of our market opportunity in “high-power” applications. We also bring the benefits of integration to higher-power applications (up to approximately one gigawatt). In particular, we sell our gate-driver products into applications such as industrial motor drives, renewable energy systems, DC transmission systems and electric vehicles. We have recently expanded our addressable market for high-power applications by introducing the SCALE-iDriver product family, which enables us to address applications between approximately 10 kilowatts and 100 kilowatts, whereas previously our sales of high-power products were primarily for applications above 100 kilowatts.
•Capitalize on the growing demand for more energy-efficient electronic products and lighting technologies, and for cleaner energy and transportation technologies. We believe that energy-efficiency is becoming an increasingly important design criterion for power supplies due largely to the emergence of standards and specifications that encourage,
4
and in some cases mandate, the design of more energy-efficient electronic products. For example, in 2008 the U.S. Department of Energy implemented mandatory federal standards governing the efficiency of external power supplies; these standards were tightened in 2016. Power supplies incorporating our ICs are generally able to comply with all known efficiency specifications currently in effect, including these tighter U.S. standards.
Additionally, technological advances combined with regulatory and legislative actions are resulting in the adoption of alternative lighting technologies such as LEDs. We believe this presents a significant opportunity for us because our ICs are used in driver (i.e., power-supply) circuitry for high-voltage LED lighting applications. Finally, the growing desire for less carbon-intensive sources of energy and modes of transportation represents an opportunity for us since our high-voltage gate drivers are used in renewable-energy systems as well as electric trains and electric vehicles.
Industry Background
Virtually every electronic device that plugs into a wall socket requires a power supply to convert the high-voltage alternating current provided by electric utilities into the low-voltage direct current required by most electronic devices. A power supply may be located inside a device, such as a consumer appliance or desktop computer, or it may be outside the device as in the case of a mobile-phone charger or an adapter for a cordless phone.
Until approximately 1970, AC-DC power supplies were generally in the form of line-frequency, or linear, transformers. These devices, consisting primarily of copper wire wound around an iron core, tend to be bulky and heavy, and typically waste a substantial amount of electricity. In the 1970s, the invention of high-voltage discrete semiconductors enabled the development of a new generation of power supplies known as switched-mode power supplies, or switchers. These switchers generally came to be a cost-effective alternative to linear transformers in applications requiring more than about three watts of power; in recent years the use of linear transformers has declined even further as a result of energy-efficiency standards and higher raw-material prices.
Switchers are generally smaller, lighter-weight and more energy-efficient than linear transformers. However, switchers designed with discrete components are highly complex, containing numerous components and requiring a high level of analog design expertise. Further, the complexity and high component count of discrete switchers make them relatively costly, difficult to manufacture and prone to failures. Also, some discrete switchers lack inherent safety and energy-efficiency features; adding these features may further increase the component count, cost and complexity of the power supply.
In high-power systems such as industrial motor drives, electric locomotives and renewable-energy systems, power conversion is typically performed using arrays of high-power silicon transistors known as IGBT modules; these modules are operated by electronic circuitry known as gate drivers (or IGBT drivers), whose function is to ensure accurate, safe and reliable operation of the IGBT modules. Much like discrete power supplies, discrete gate drivers tend to be highly complex, requiring a large number of components and a great deal of design expertise.
Our Highly Integrated Approach
In 1994 we introduced TOPSwitch, the industry’s first cost-effective high-voltage IC for switched-mode AC-DC power supplies; we have since introduced a range of other product families such as TinySwitch, LinkSwitch, Hiper and InnoSwitch which have expanded the range of power-supply applications we can address. In May 2012 we expanded our addressable market to include high-voltage gate drivers.
Our ICs and gate drivers drastically reduce the complexity and component count of power converters compared to typical discrete designs by integrating many of the functions otherwise performed by numerous discrete electronic components, and by eliminating (or reducing the size and cost of) additional components through innovative system design. As a result, our products enable power converters to have superior features and functionality at a total cost equal to or lower than that of many competing alternatives. Our products offer the following key benefits:
• | Fewer Components, Reduced Size and Higher Reliability |
Our highly integrated ICs and gate drivers enable designs with up to 70% fewer components than comparable discrete designs. This reduction in component count enhances reliability and efficiency, reduces size, accelerates time-to-market and results in lower manufacturing costs for our customers. Power supplies that incorporate our ICs are also lighter and more portable than comparable power supplies built with copper-and-iron linear transformers, which are still used in some low-power applications.
5
• | Reduced Time-to-Market, Enhanced Manufacturability |
Because our products eliminate much of the complexity associated with the design of power converters, designs can typically be completed in much less time, resulting in more efficient use of our customers' design resources and shorter time-to-market for new designs. The lower component count and reduced complexity enabled by our products also makes designs more suitable for high-volume manufacturing. We also provide extensive hands-on design support as well as online design tools, such as our PI Expert design software, that further reduce time-to-market and product development risks.
• | Energy Efficiency |
Our patented EcoSmart technology, introduced in 1998, improves the energy efficiency of electronic devices during normal operation as well as standby and “no-load” conditions. This technology enables manufacturers to cost-effectively meet the growing demand for energy-efficient products, and to comply with increasingly stringent energy-efficiency requirements. Our gate drivers also enable very high efficiency in high-power systems; in many such systems, such as renewable-energy installations, even small efficiency gains can dramatically shorten the payback period over which the cost of a system is recovered through energy savings.
• | Wide Power Range and Scalability |
Products in our current IC families can address AC-DC power supplies with output power up to approximately 500 watts as well as some high-voltage DC-DC applications; our high-voltage gate drivers are used in applications with power levels as high as one gigawatt. Within each of our product families, the designer can scale up or down in power to address a wide range of designs with minimal design effort.
Energy Efficiency
Power supplies often draw significantly more electricity than the amount needed by the devices they power. As a result, billions of dollars' worth of electricity is wasted each year, and millions of tons of greenhouse gases are unnecessarily produced by power plants. Energy waste occurs during the normal operation of a device and in standby mode, when the device is plugged in but idle. For example, computers and printers waste energy while in “sleep” mode. TVs that are turned off by remote control consume energy while awaiting a remote-control signal to turn them back on. A mobile-phone charger left plugged into a wall outlet continues to draw electricity even when not connected to the phone (a condition known as “no-load”). Many common household appliances, such as microwave ovens, dishwashers and washing machines, also consume power when not in use. In fact, a 2015 study by the National Resources Defense Council found that devices that are "always-on" but inactive may be causing as much as $19 billion in annual energy waste in the U.S alone.
Lighting is another major source of energy waste. Less than 5% of the energy consumed by traditional incandescent light bulbs is converted to light, while the remainder is wasted as heat. The Alliance to Save Energy has estimated that a conversion to efficient lighting technologies such as compact fluorescent bulbs and light-emitting diodes, or LEDs, could save as much as $18 billion worth of electricity and 158 million tons of carbon dioxide emissions per year in the United States alone.
In response to concerns about the environmental impact of carbon emissions, policymakers are taking action to promote energy efficiency. For example, the ENERGY STAR® program and the European Union Code of Conduct encourage manufacturers of electronic devices to comply with voluntary energy-efficiency specifications. In 2007 the California Energy Commission (CEC) implemented mandatory efficiency standards for external power supplies. The CEC standards were implemented nationwide in the United States in July 2008 as a result of the Energy Independence and Security Act of 2007, or EISA; these federal standards were tightened in 2016. Similar standards for external power supplies took effect in the European Union in 2010 as part of the EU’s EcoDesign Directive for Energy-Related Products.
In 2009 the CEC announced mandatory efficiency standards for televisions, which took effect in 2011, and in January 2012 the CEC announced mandatory efficiency standards for battery-charging systems, which took effect in 2013.
In 2010, the EU EcoDesign Directive implemented standards limiting standby power consumption on a wide range of electronic products; the limit was reduced by 50 percent beginning in 2013, with many products now limited to 500 milliwatts of standby usage. The EISA legislation also required substantial improvements in the efficiency of lighting technologies beginning
6
in 2012; as of 2014, traditional 100-, 75-, 60- and 40-watt bulbs may no longer be manufactured or sold in the United States. Plans to eliminate conventional incandescent bulbs have also been announced or enacted in other geographies such as Canada, Australia and Europe.
We believe we offer products that enable manufacturers to meet or exceed these regulations, and all other such regulations of which we are aware. Our EcoSmart technology, introduced in 1998, dramatically reduces waste in both operating and standby modes; we estimate that this technology has saved billions of dollars’ worth of standby power worldwide since 1998. In 2010 we introduced our CapZero and SenZero IC families, which eliminate additional sources of standby waste in some power supplies; we have also introduced a range of product families designed specifically for LED-lighting applications.
Products
Below is a brief description of our products:
• | AC-DC power conversion products |
TOPSwitch, our first commercially successful product family, was introduced in 1994. Since that time we have introduced a wide range of products (such as our TinySwitch, LinkSwitch and Hiper families) to increase the level of integration and improve upon the functionality of the original TOPSwitch, and to broaden the range of power levels we can address. In 2010 we introduced our CapZero and SenZero families, which reduce standby power consumption in certain applications by eliminating waste caused by so-called bleed resistors and sense resistors. We also offer a range of high-performance, high-voltage diodes known as Qspeed diodes.
In 2014 we introduced our InnoSwitch product family, the first-ever power-supply ICs to combine primary, secondary and feedback circuits into a single package. These ICs employ a proprietary technology known as FluxLink to enable precise control without the need for optical components, which tend to add cost and diminish the reliability of power supplies.
In January 2015 we further expanded our product portfolio with the acquisition of Cambridge Semiconductor Ltd., a producer of controller ICs for low-power AC-DC applications. Since 2010 we have also introduced products designed specifically for LED-lighting applications, including our LYTSwitch family.
This portfolio of power-conversion products generally addresses power supplies ranging from less than one watt of output up to approximately 500 watts of output, a market we refer to as the “low-power” market. This market consists of an extremely broad range of applications including mobile-device chargers, consumer appliances, utility meters, LCD monitors, main and standby power supplies for desktop computers and TVs, LED lamps, and numerous other consumer and industrial applications.
• | High-voltage gate drivers |
We offer a range of high-voltage gate-driver products sold primarily under the SCALE and SCALE-2 product-family names. These products are fully assembled circuit boards incorporating multiple ICs, electrical isolation components and other circuitry. We offer both ready-to-operate “plug-and-play” drivers designed specifically for use with particular IGBT modules, as well as “driver cores,” which provide more basic driver functionality that customers can customize to their own specifications after purchase. In May 2016 we introduced the SCALE-iDriver family of standalone ICs, which enables us to address applications between approximately 10 kilowatts and 100 kilowatts, whereas previously our sales of high-power products were primarily for applications above 100 kilowatts.
• | High-voltage DC-DC products |
The DPA-Switch family of products, introduced in June 2002, was the first monolithic high-voltage DC-DC power conversion IC designed specifically for use in distributed power architectures. Applications include power-over-Ethernet powered devices such as voice-over-IP phones and security cameras, as well as network hubs, line cards, servers, digital PBX phones, DC-DC converter modules and industrial controls.
7
Other Product Information
TOPSwitch, TinySwitch, LinkSwitch, DPA-Switch, EcoSmart, Hiper, Qspeed, InnoSwitch, SCALE, SCALE-II, SCALE-III, SCALE-iDriver, PeakSwitch, CAPZero, SENZero, ChiPhy, FluxLink, CONCEPT and PI Expert are trademarks of Power Integrations, Inc.
End Markets and Applications
Our net revenues consist primarily of sales of the products described above. When evaluating our net revenues, we categorize our sales into the following four major end-market groupings: communications, computer, consumer, and industrial.
The table below provides the approximate mix of our net sales by end market:
Year Ended December 31, | ||||||||
End Market | 2016 | 2015 | 2014 | |||||
Communications | 27 | % | 24 | % | 18 | % | ||
Computer | 6 | % | 7 | % | 10 | % | ||
Consumer | 36 | % | 36 | % | 37 | % | ||
Industrial | 31 | % | 33 | % | 35 | % | ||
Our products are used in a vast range of power-conversion applications in the above-listed end-market categories. The following chart lists the most prominent applications for our products in each category.
Market Category | Primary Applications |
Communications | Mobile-phone chargers, routers, cordless phones, broadband modems, voice-over-IP phones, other network and telecom gear |
Computer | Desktop PCs, LCD monitors, servers, LCD projectors, adapters for notebook computers |
Consumer | Major and small appliances, air conditioners, TV set-top boxes, digital cameras, TVs, video-game consoles |
Industrial | LED lighting, industrial controls, utility meters, motor controls, uninterruptible power supplies, tools, networked thermostats, power strips and other “smart home” devices, industrial motor drives, renewable energy systems, electric locomotives, electric buses and other electric vehicles, high-voltage DC transmission systems |
Sales, Distribution and Marketing
We sell our products to original equipment manufacturers, or OEMs, and merchant power-supply manufacturers through our direct sales staff and a worldwide network of independent sales representatives and distributors. We have sales offices in the United States, Switzerland, United Kingdom, Germany, Italy, India, China, Japan, South Korea, the Philippines, Singapore and Taiwan. Direct sales to OEMs and merchant power supply manufacturers represented approximately 25% of our net product revenues for each of 2016, 2015 and 2014, while sales to and through distributors accounted for approximately 75% for each of these years. Most of our distributors are entitled to return privileges based on sales revenue and are protected from price reductions affecting their inventories. Our distributors are not subject to minimum purchase requirements, and sales representatives and distributors can discontinue marketing our products at any time.
Our top ten customers, including distributors that resell to OEMs and merchant power supply manufacturers, accounted for 60% of our net revenues in each of 2016 and 2015, and 59% in 2014.
The following customers, both distributors, accounted for 10% or more of total net revenues in 2016, 2015 and 2014:
Year Ended December 31, | ||||||||
Customer | 2016 | 2015 | 2014 | |||||
Avnet | 18 | % | 21 | % | 19 | % | ||
Powertech Distribution Ltd. | 11 | % | 10 | % | * | |||
_______________
8
* Total customer revenue was less than 10% of net revenues
No other customers accounted for more than 10% of net revenues in these periods.
Sales to customers in the United States accounted for approximately 4% of our net revenues in 2016 and 5% in each of 2015 and 2014, and sales to customers outside of the United States accounted for approximately 96% of our net revenues in 2016 and 95% in each of 2015 and 2014. See Note 6, “Significant Customers and International Sales,” in our Notes to Consolidated Financial Statements in this Annual Report on Form 10-K regarding sales to customers located in foreign countries. See our consolidated financial statements in this Annual Report on Form 10-K regarding total revenues and profit for the last three fiscal years.
We are subject to risks stemming from the fact that most of our manufacturing and most of our customers are located in foreign jurisdictions. Risks related to our foreign operations are set forth in Item 1A of this Annual Report on Form 10-K, and include: potential weaker intellectual property rights under foreign laws, the burden of complying with foreign laws and foreign-currency exchange risk. See, in particular, the risk factor “Our international sales activities account for a substantial portion of our net revenues, which subjects us to substantial risks” in Item 1A of this Form 10-K.
Backlog
Our sales are primarily made pursuant to standard purchase orders. The quantity of products purchased by our customers as well as shipment schedules are subject to revisions that reflect changes in both the customers' requirements and in manufacturing availability. Historically, our business has been characterized by short-lead-time orders and quick delivery schedules; for this reason, and because orders in backlog are subject to cancellation or postponement, backlog is not necessarily a reliable indicator of future revenues.
Research and Development
Our research and development efforts are focused on improving our technologies, introducing new products to expand our addressable markets, reducing the costs of existing products, and improving the cost-effectiveness and functionality of our customers' power converters. We have assembled teams of highly skilled engineers to meet our research and development goals. These engineers have expertise in high-voltage device structure and process technology, analog IC design, system architecture and packaging.
In 2016, 2015 and 2014, we incurred costs of $62.3 million, $57.5 million and $55.0 million, respectively, for research and development (R&D). R&D expenses increased in 2016 compared to 2015 primarily due to increased stock-based compensation expense related to performance-based stock awards as a result of our 2016 performance. The expansion of headcount in support of our product-development efforts also contributed to the increase. R&D expenses increased in 2015 compared to 2014, driven primarily by the addition of employees in connection with our acquisition of Cambridge Semiconductor Limited (CamSemi) (refer to Note 11, Acquisitions, in our Notes to Consolidated Financial Statements in this Annual Report on From 10-K, for details); the increase in headcount caused a corresponding increase in salary and other employee-related expenses.
Intellectual Property and Other Proprietary Rights
We use a combination of patents, trademarks, copyrights, trade secrets and confidentiality procedures to protect our intellectual-property rights. Through continued innovating we are constantly adding new patents to our portfolio. In 2016 we added a total of 60 U.S. and 47 foreign patents. As of December 31, 2016, we held 682 U.S. patents and 473 foreign patents. The U.S. patents have expiration dates ranging from 2017 to 2037. We also hold trademarks in the U.S. and various other geographies including Taiwan, Korea, Hong Kong, China, Europe and Japan. While our propriety intellectual property portfolio as a whole is important to the success of our business, we are not materially dependent upon any one patent. From time to time we may not seek to renew expiring patents for legacy technology as it is no longer cost-effective.
We regard as proprietary some equipment, processes, information and knowledge that we have developed and used in the design and manufacture of our products. Our trade secrets include a high-volume production process that produces our patented high-voltage ICs. We attempt to protect our trade secrets and other proprietary-information through non-disclosure agreements, proprietary information agreements with employees and consultants, and other security measures.
9
Long-lived Assets
Our long-lived assets consist of property and equipment as well as intangible assets. Our intangible assets consist of developed and in-process technology, licenses, patents, customer relationships, trade name, domain name, in-place leases and goodwill. Our long-lived assets, including property and equipment and intangible assets, are located in the United States and in foreign countries. Approximately 40% of our long-lived assets were located in the United States in 2016, 2015 and 2014, while approximately 60% were held outside of the United States. A significant amount of our foreign long-lived assets were located in Switzerland, which held approximately 18% in each of 2016 and 2015, and 31% in 2014, respectively, of our total long-lived assets. See Note 2, Summary of Significant Accounting Policies, in our Notes to Consolidated Financial Statements in this Annual Report on Form 10-K regarding total property and equipment located in foreign countries.
Manufacturing
We contract with three foundries for the manufacture of the vast majority of our silicon wafers: (1) ROHM Lapis Semiconductor Co., Ltd., or Lapis, (formerly OKI Electric Industry), (2) Seiko Epson Corporation, or Epson, (3) X-FAB Semiconductor Foundries AG, or X-FAB. These contractors manufacture wafers using our proprietary high-voltage process technologies at fabrication facilities located in Japan, Germany and the United States.
Our IC products are assembled and packaged by independent subcontractors in China, Malaysia, Thailand and the Philippines. Our ICs are tested predominantly at the facilities of our packaging subcontractors in Asia and, to a small extent, at our headquarters facility in San Jose, California. Our IGBT-driver boards are assembled by an independent subcontractor in Sri Lanka and tested at our facility in Switzerland.
Our fabless manufacturing model enables us to focus on our engineering and design strengths, minimize capital expenditures and still have access to high-volume manufacturing capacity. We utilize both proprietary and standard IC packages for assembly. Some of the materials used in our packages and aspects of assembly are specific to our products. We require our assembly manufacturers to use high-voltage molding compounds which are more difficult to process than industry standard molding compounds. We work closely with our contractors on a continuous basis to maintain and improve our manufacturing processes.
Our proprietary high-voltage processes do not require leading-edge geometries for them to be cost-effective, and can therefore use our foundries’ older, low-cost facilities for wafer manufacturing. However, because of our highly sensitive high-voltage process, we must interact closely with our foundries to achieve satisfactory yields. Our wafer supply agreements with Lapis, Epson and X-FAB expire in April 2018, December 2025 and December 2020, respectively. Under the terms of the Lapis agreement, Lapis has agreed to reserve a specified amount of production capacity and to sell wafers to us at fixed prices, which are subject to periodic review jointly by Lapis and us. In addition, Lapis requires us to supply them with a rolling six-month forecast on a monthly basis. Our agreement with Lapis provides for the purchase of wafers in U.S. dollars, with mutual sharing of the impact of the fluctuations in the exchange rate between the Japanese yen and the U.S. dollar. Under the terms of the Epson agreement, Epson has agreed to reserve a specified amount of production capacity and to sell wafers to us at fixed prices, which are subject to periodic review jointly by Epson and us. The agreement with Epson also requires us to supply rolling six-month forecasts on a monthly basis, to provide for the purchase of wafers in U.S. dollars and to share the impact of the exchange rate fluctuation between the Japanese yen and the U.S. dollar. Under the terms of the X-FAB agreement, X-FAB has agreed to reserve a specified amount of production capacity and to sell wafers to us at fixed prices, which are subject to periodic review jointly by X-FAB and us. The agreement with X-FAB also requires us to supply them with rolling six-month forecasts on a monthly basis. Our purchases of wafers from X-FAB are denominated in U.S. dollars.
Although some aspects of our relationships with Lapis, Epson and X-FAB are contractual, some important aspects of these relationships are not written in binding contracts and depend on the suppliers' continued cooperation. We cannot assure that we will continue to work successfully with Lapis, Epson or X-FAB in the future, that they will continue to provide us with sufficient capacity at their foundries to meet our needs, or that any of them will not seek an early termination of their wafer supply agreement with us. Our operating results could suffer in the event of a supply disruption with one or more of our foundries if we were unable to quickly qualify alternative manufacturing sources for existing or new products or if these sources were unable to produce wafers with acceptable manufacturing yields.
We typically receive shipments from our foundries approximately four to six weeks after placing orders, and lead times for new products can be substantially longer. To provide sufficient time for assembly, testing and finishing, we typically need to receive wafers four weeks before the desired ship date to our customers. As a result of these factors and the fact that customers’
10
orders can be placed with little advance notice, we have only a limited ability to react to fluctuations in demand for our products. We try to carry a substantial amount of wafer and finished-goods inventory to help offset these risks and to better serve our markets and meet customer demand.
Competition
Competing alternatives to our high-voltage ICs for the power-supply market include monolithic and hybrid ICs from companies such as Fairchild Semiconductor (recently acquired by ON Semiconductor), STMicroelectronics, Infineon, ON Semiconductor and Sanken Electric Company, as well as PWM-controller chips paired with discrete high-voltage bipolar transistors and MOSFETs; such controller chips are produced by a large number of vendors, including those listed above as well as such companies as NXP Semiconductors, Diodes Inc., On-Bright Electronics and Dialog Semiconductor. Self-oscillating switchers, built with discrete components supplied by numerous vendors, are also commonly used. For some applications, line-frequency transformers are also a competing alternative to designs utilizing our products. Our IGBT-driver products compete with alternatives from such companies as Avago, Infineon and Semikron, as well as driver circuits made up of discrete devices.
Generally, our products enable customers to design power converters with total bill-of-materials (BOM) costs similar to those of competing alternatives. As a result, the value of our products is influenced by the prices of discrete components, which fluctuate in relation to market demand, raw-material prices and other factors, but have generally decreased over time.
While we vary the pricing of our ICs in response to fluctuations in prices of alternative solutions, we also compete based on a variety of other factors. Most importantly, the highly integrated nature of our products enables designs that utilize fewer total components than comparable discrete designs or designs using other integrated or hybrid products. This enables power converters to be designed more quickly and manufactured more efficiently and reliably than competing designs. We also compete on the basis of product functionality such as safety features and energy-efficiency features and on the basis of the technical support we provide to our customers. This support includes hands-on design assistance as well as a range of design tools and documentation such as software and reference designs. We also believe that our record of product quality and history of delivering products to our customers on a timely basis serve as additional competitive advantages.
Warranty
We generally warrant that our products will substantially conform to the published specifications for 12 months from the date of shipment. Under the terms of our purchase orders, our liability is limited generally to either a credit equal to the purchase price or replacement of the defective part.
Employees
As of December 31, 2016, we employed 626 full-time personnel, consisting of 86 in manufacturing, 214 in research and development, 273 in sales, marketing and applications support, and 53 in finance and administration.
Investor Information
We make available, free of charge, copies of our annual report on Form 10-K, quarterly reports on Form 10-Q, current reports on Form 8-K and amendments to those reports filed or furnished pursuant to Section 13(a) or 15(d) of the Exchange Act as soon as reasonably practicable after filing this material electronically or otherwise furnishing it to the SEC. Investors may obtain free electronic copies or request paper copies of these reports via the “For Investors” section of our website, www.power.com. Our website address is provided solely for informational purposes. We do not intend, by this reference, that our website should be deemed to be part of this Annual Report. The reports filed with the SEC are also available at www.sec.gov.
Our corporate governance guidelines, the charters of our board committees, and our code of business conduct and ethics, including ethics provisions that apply to our principal executive officer, principal financial officer, controller and senior financial officers, are also available via the investor website listed above. These items are also available in print to any stockholder who requests them by calling (408) 414-9200.
Power Integrations, Inc. was incorporated in California on March 25, 1988, and reincorporated in Delaware in December 1997.
11
Executive Officers of the Registrant
As of January 31, 2017, our executive officers, who are appointed by and serve at the discretion of the board of directors, were as follows:
Name | Position With Power Integrations | Age |
Balu Balakrishnan | President, Chief Executive Officer and Director | 62 |
Douglas Bailey | Vice President, Marketing | 50 |
Radu Barsan | Vice President, Technology | 64 |
David “Mike” Matthews | Vice President, Product Development | 52 |
Sandeep Nayyar | Vice President, Finance and Chief Financial Officer | 57 |
Ben Sutherland | Vice President, Worldwide Sales | 45 |
Raja Petrakian | Vice President, Operations | 52 |
Clifford Walker | Vice President, Corporate Development | 65 |
Balu Balakrishnan has served as president and chief executive officer and as a director of Power Integrations since January 2002. He served as president and chief operating officer from April 2001 to January 2002. From January 2000 to April 2001, he was vice president of engineering and strategic marketing. From September 1997 to January 2000, he was vice president of engineering and new business development. From September 1994 to September 1997, Mr. Balakrishnan served as vice president of engineering and marketing. Prior to joining Power Integrations in 1989, Mr. Balakrishnan was employed by National Semiconductor Corporation.
Douglas Bailey has served as our vice president of marketing since November 2004. From March 2001 to April 2004, he served as vice president of marketing at ChipX, a structured ASIC company. His earlier experience includes serving as business management and marketing consultant for Sapiential Prime, Inc., director of sales and business unit manager for 8x8, Inc., and serving in application engineering management for IIT, Inc. and design engineering roles with LSI Logic, Inmos, Ltd. and Marconi.
Radu Barsan has served as our vice president of technology since January 2013, leading our foundry engineering, technology development and quality organizations. Prior to joining Power Integrations, Mr. Barsan served as chairman and CEO at Redfern Integrated Optics, Inc., a supplier of single frequency narrow linewidth lasers, modules, and subsystems, from 2001 to 2013, where he was responsible for overseeing the operations of Redfern Integrated Optics. Previously, he served in a succession of engineering-management and technology-development roles at Phaethon Communications, Inc., a photonics technology company, Cirrus Logic, Inc., a high-precision analog and digital signal processing company, Advanced Micro Devices, a semiconductor design company, Cypress Semiconductor, Inc., a semiconductor company and Microelectronica a distributor of electronic components. Mr. Barsan has more than 30 years of commercial experience in semiconductor and optical components development, engineering and operations.
Mike Matthews has served as our vice president of product development since August 2012. Mr. Matthews joined Power Integrations in 1992, managing our European application-engineering group and then our European sales organization as managing director of Power Integrations (Europe). He has led our product-definition team since 2000, serving as director of strategic marketing prior to assuming his current role. Prior to joining Power Integrations, Mr. Matthews worked at several electric motor-drive companies and then at Siliconix, a semiconductor company, as a motor-control applications specialist.
Sandeep Nayyar has served as our vice president and chief financial officer since June 2010. Previously Mr. Nayyar served as vice president of finance at Applied Biosystems, Inc., a developer and manufacturer of life-sciences products, from 2002 to 2009. Mr. Nayyar was a member of the executive team with world-wide responsibilities for finance. From 1990 to 2001, Mr. Nayyar served in a succession of financial roles including vice president of finance at Quantum Corporation, a computer storage company. Mr. Nayyar also worked for five years in the public-accounting field at Ernst & Young LLP. Mr. Nayyar is a Certified Public Accountant, Chartered Accountant and has a Bachelor of Commerce from the University of Delhi, India.
Ben Sutherland has served as our vice president, worldwide sales since July 2011. Mr. Sutherland joined our company in May 2000 as a member of our sales organization in Europe. From May 2000 to July 2011, Mr. Sutherland served in various sales positions responsible primarily for our international sales, and more recently for domestic sales. From 1997 to 2000, Mr.
12
Sutherland served in various product marketing and sales roles at Vishay Intertechnology, Inc., a manufacturer and supplier of discrete semiconductors and passive electronic components.
Raja Petrakian has served as vice president of operations since May 2015. From 1995 to 2015, Dr. Petrakian served in a succession of roles in operations and supply chain management, most recently as senior vice president of worldwide operations, at Xilinx Inc. where he was responsible for manufacturing, supply chain management (fabrication through delivery), customer service, supplier relationships, purchasing, import/export compliance, new product introduction operations, and logistics. Prior to joining Xilinx he was a research staff member at the IBM T.J. Watson Research Center.
Clifford Walker has served as our vice president, corporate development since June 1995. From September 1994 to June 1995, Mr. Walker served as vice president of Reach Software Corporation, a software company. From December 1993 to September 1994, Mr. Walker served as president of Morgan Walker International, a consulting company.
Item 1A. Risk Factors.
In addition to the other information in this report, the following factors should be considered carefully in evaluating our business before purchasing shares of our stock.
Our operating results are volatile and difficult to predict. If we fail to meet the expectations of public market analysts or investors, the market price of our common stock may decrease significantly. Our net revenues and operating results have varied significantly in the past, are difficult to forecast, are subject to numerous factors both within and outside of our control, and may fluctuate significantly in the future. As a result, our operating results could fall below the expectations of public market analysts or investors. If that occurs, the price of our stock may decline.
Some of the factors that could affect our operating results include the following:
• | the demand for our products declining in the major end markets we serve, which may occur due to competitive factors, supply-chain fluctuations or changes in macroeconomic conditions; |
• | our products are sold through distributors, which limits our direct interaction with our end customers, which reduces our ability to forecast sales and increases the complexity of our business; |
• | the volume and timing of delivery of orders placed by us with our wafer foundries and assembly subcontractors, and their ability to procure materials; |
• | competitive pressures on selling prices; |
• | the ability of our products to penetrate additional markets; |
• | the volume and timing of orders received from customers; |
• | the inability to adequately protect or enforce our intellectual property rights; |
• | reliance on international sales activities for a substantial portion of our net revenues; |
• | fluctuations in exchange rates, particularly the exchange rate between the U.S. dollar and the Japanese yen, the Euro and the Swiss franc; |
• | expenses we are required to incur (or choose to incur) in connection with our intellectual property litigations; |
• | our ability to develop and bring to market new products and technologies on a timely basis; |
• | earthquakes, terrorists acts or other disasters; |
• | continued impact of changes in securities laws and regulations, including potential risks resulting from our evaluation of our internal controls over financial reporting; |
13
• | the lengthy timing of our sales cycle; |
• | undetected defects and failures in meeting the exact specifications required by our products; |
• | audits by the Internal Revenue Service, and potential future changes in tax laws may increase the amount of taxes we are required to pay; |
• | our ability to attract and retain qualified personnel; |
• | risks associated with acquisitions and strategic investments; |
• | our ability to successfully integrate, or realize the expected benefits from, our acquisitions; |
• | changes in environmental laws and regulations, including with respect to energy consumption and climate change; |
• | interruptions in our information technology systems; and |
• | uncertainties arising out of economic consequences of current and potential military actions or terrorist activities and associated political instability. |
If demand for our products declines in our major end markets, our net revenues will decrease. A limited number of applications of our products, such as cellphone chargers, LED lights, desktop PCs and consumer appliances make up a significant percentage of our net revenues. We expect that a significant level of our net revenues and operating results will continue to be dependent upon these applications in the near term. The demand for these products has been highly cyclical and has been impacted by economic downturns in the past. Any economic slowdown in the end markets that we serve could cause a slowdown in demand for our ICs. When our customers are not successful in maintaining high levels of demand for their products, their demand for our ICs decreases, which adversely affects our operating results. Any significant downturn in demand in these markets would cause our net revenues to decline and could cause the price of our stock to fall.
Our products are sold through distributors, which limits our direct interaction with our end customers, therefore reducing our ability to forecast sales and increasing the complexity of our business. Sales to distributors accounted for approximately 75% of net revenues in each of the years ended December 31, 2016, 2015 and 2014. Selling through distributors reduces our ability to forecast sales and increases the complexity of our business, requiring us to:
• | manage a more complex supply chain; |
• | monitor the level of inventory of our products at each distributor, and |
• | monitor the financial condition and credit-worthiness of our distributors, many of which are located outside of the United States and not publicly traded. |
Since we have limited ability to forecast inventory levels at our end customers, it is possible that there may be significant build-up of inventories in the distributor channel, with the OEM or the OEM’s contract manufacturer. Such a buildup could result in a slowdown in orders, requests for returns from customers, or requests to move out planned shipments. This could adversely impact our revenues and profits. Any failure to manage these complexities could disrupt or reduce sales of our products and unfavorably impact our financial results.
We depend on third-party suppliers to provide us with wafers for our products and if they fail to provide us sufficient quantities of wafers, our business may suffer. Our primary supply arrangements for the production of wafers are with Epson, Lapis, and X-FAB. Our contracts with these suppliers expire on varying dates, with the earliest to expire in April 2018. Although some aspects of our relationships with Lapis, X-FAB and Epson are contractual, many important aspects of these relationships depend on their continued cooperation. We cannot assure that we will continue to work successfully with Epson, Lapis and X-FAB in the future, and that the wafer foundries’ capacity will meet our needs. Additionally, one or more of these wafer foundries could seek an early termination of our wafer supply agreements. Any serious disruption in the supply of wafers from Epson, Lapis and X-
14
FAB could harm our business. We estimate that it would take 12 to 24 months from the time we identified an alternate manufacturing source to produce wafers with acceptable manufacturing yields in sufficient quantities to meet our needs.
Although we provide our foundries with rolling forecasts of our production requirements, their ability to provide wafers to us is ultimately limited by the available capacity of the wafer foundry. Any reduction in wafer foundry capacity available to us could require us to pay amounts in excess of contracted or anticipated amounts for wafer deliveries or require us to make other concessions to meet our customers’ requirements, or may limit our ability to meet demand for our products. Further, to the extent demand for our products exceeds wafer foundry capacity, this could inhibit us from expanding our business and harm relationships with our customers. Any of these concessions or limitations could harm our business.
If our third-party suppliers and independent subcontractors do not produce our wafers and assemble our finished products at acceptable yields, our net revenues may decline. We depend on independent foundries to produce wafers, and independent subcontractors to assemble and test finished products, at acceptable yields and to deliver them to us in a timely manner. The failure of the foundries to supply us wafers at acceptable yields could prevent us from selling our products to our customers and would likely cause a decline in our net revenues and gross margin. In addition, our IC assembly process requires our manufacturers to use a high-voltage molding compound that has been available from only a few suppliers. These compounds and their specified processing conditions require a more exacting level of process control than normally required for standard IC packages. Unavailability of assembly materials or problems with the assembly process can materially and adversely affect yields, timely delivery and cost to manufacture. We may not be able to maintain acceptable yields in the future.
In addition, if prices for commodities used in our products increase significantly, raw material costs would increase for our suppliers which could result in an increase in the prices our suppliers charge us. To the extent we are not able to pass these costs on to our customers; this would have an adverse effect on our gross margins.
Intense competition in the high-voltage power supply industry may lead to a decrease in our average selling price and reduced sales volume of our products. The high-voltage power supply industry is intensely competitive and characterized by significant price sensitivity. Our products face competition from alternative technologies, such as linear transformers, discrete switcher power supplies, and other integrated and hybrid solutions. If the price of competing solutions decreases significantly, the cost effectiveness of our products will be adversely affected. If power requirements for applications in which our products are currently utilized go outside the cost-effective range of our products, some of these alternative technologies can be used more cost effectively. In addition, as our patents expire, our competitors could legally begin using the technology covered by the expired patents in their products, potentially increasing the performance of their products and/or decreasing the cost of their products, which may enable our competitors to compete more effectively. Our current patents may or may not inhibit our competitors from getting any benefit from an expired patent. Our U.S. patents have expiration dates ranging from 2017 to 2037. We cannot assure that our products will continue to compete favorably or that we will be successful in the face of increasing competition from new products and enhancements introduced by existing competitors or new companies entering this market. We believe our failure to compete successfully in the high-voltage power supply business, including our ability to introduce new products with higher average selling prices, would materially harm our operating results.
If our products do not penetrate additional markets, our business will not grow as we expect. We believe that our future success depends in part upon our ability to penetrate additional markets for our products. We cannot assure that we will be able to overcome the marketing or technological challenges necessary to penetrate additional markets. To the extent that a competitor penetrates additional markets before we do, or takes market share from us in our existing markets, our net revenues and financial condition could be materially adversely affected.
We do not have long-term contracts with any of our customers and if they fail to place, or if they cancel or reschedule orders for our products, our operating results and our business may suffer. Our business is characterized by short-term customer orders and shipment schedules, and the ordering patterns of some of our large customers have been unpredictable in the past and will likely remain unpredictable in the future. Not only does the volume of units ordered by particular customers vary substantially from period to period, but also purchase orders received from particular customers often vary substantially from early oral estimates provided by those customers for planning purposes. In addition, customer orders can be canceled or rescheduled without significant penalty to the customer. In the past, we have experienced customer cancellations of substantial orders for reasons beyond our control, and significant cancellations could occur again at any time. Also, a relatively small number of distributors, OEMs and merchant power supply manufacturers account for a significant portion of our revenues. Specifically, our top ten customers, including distributors, accounted for 60% of our net revenues in each of the years ended December 31, 2016 and 2015. However, a significant portion of these revenues are attributable to sales of our products through distributors of electronic components. These
15
distributors sell our products to a broad, diverse range of end users, including OEMs and merchant power supply manufacturers, which mitigates the risk of customer concentration to a large degree.
If we are unable to adequately protect or enforce our intellectual property rights, we could lose market share, incur costly litigation expenses, suffer incremental price erosion or lose valuable assets, any of which could harm our operations and negatively impact our profitability. Our success depends upon our ability to continue our technological innovation and protect our intellectual property, including patents, trade secrets, copyrights and know-how. We are currently engaged in litigation to enforce our intellectual property rights, and associated expenses have been, and are expected to remain, material and have adversely affected our operating results. We cannot assure that the steps we have taken to protect our intellectual property will be adequate to prevent misappropriation, or that others will not develop competitive technologies or products. From time to time, we have received, and we may receive in the future, communications alleging possible infringement of patents or other intellectual property rights of others. Costly litigation may be necessary to enforce our intellectual property rights or to defend us against claimed infringement. The failure to obtain necessary licenses and other rights, and/or litigation arising out of infringement claims could cause us to lose market share and harm our business.
As our patents expire, we will lose intellectual property protection previously afforded by those patents. Additionally, the laws of some foreign countries in which our technology is or may in the future be licensed may not protect our intellectual property rights to the same extent as the laws of the United States, thus limiting the protections applicable to our technology.
Our international sales activities account for a substantial portion of our net revenues, which subjects us to substantial risks. Sales to customers outside of the United States of America account for, and have accounted for a large portion of our net revenues, including approximately 96% and 95% of our net revenues for the years ended December 31, 2016, and 2015, respectively. If our international sales declined and we were unable to increase domestic sales, our revenues would decline and our operating results would be harmed. International sales involve a number of risks to us, including:
• | potential insolvency of international distributors and representatives; |
• | reduced protection for intellectual property rights in some countries; |
• | the impact of recessionary environments in economies outside the United States; |
• | tariffs and other trade barriers and restrictions; |
• | the burdens of complying with a variety of foreign and applicable U.S. Federal and state laws; and |
• | foreign-currency exchange risk. |
Our failure to adequately address these risks could reduce our international sales and materially and adversely affect our operating results. Furthermore, because substantially all of our foreign sales are denominated in U.S. dollars, increases in the value of the dollar cause the price of our products in foreign markets to rise, making our products more expensive relative to competing products priced in local currencies.
Fluctuations in exchange rates, particularly the exchange rate between the U.S. dollar and the Japanese yen, Swiss franc and euro, may impact our gross margin and net income. Our exchange rate risk related to the Japanese yen includes two of our major suppliers, Epson and Lapis, with which we have wafer supply agreements based in U.S. dollars; however, these agreements also allow for mutual sharing of the impact of the exchange rate fluctuation between Japanese yen and the U.S. dollar. Each year, our management and these suppliers review and negotiate pricing; the negotiated pricing is denominated in U.S. dollars but is subject to contractual exchange rate provisions. The fluctuation in the exchange rate is shared equally between Power Integrations and each of these suppliers. We maintain cash denominated in Swiss francs and euros to fund the operations of our Swiss subsidiary. The functional currency of our Swiss subsidiary is the U.S. dollar; gains and losses arising from the re-measurement of non-functional currency balances are recorded in other income in our consolidated statements of income, and material unfavorable exchange-rate fluctuations with the Swiss franc could negatively impact our net income.
If we do not prevail in our litigation, we will have expended significant financial resources, potentially without any benefit, and may also suffer the loss of rights to use some technologies. We are currently involved in a number of patent litigation matters and the outcome of the litigation is uncertain. See Note 10, Legal Proceedings and Contingencies, in our Notes to Consolidated
16
Financial Statements included in this Annual Report on Form 10-K. For example, in one of our patent suits the infringing company has been found to infringe four of our patents. Despite the favorable court finding, the infringing party filed an appeal to the damages awarded. In another matter, we are being sued in an ongoing case for patent infringement. Should we ultimately be determined to be infringing another party’s patents, or if an injunction is issued against us while litigation is pending on those claims, such result could have an adverse impact on our ability to sell products found to be infringing, either directly or indirectly. In the event of an adverse outcome, we may be required to pay substantial damages, stop our manufacture, use, sale, or importation of infringing products, or obtain licenses to the intellectual property we are found to have infringed. We have also incurred, and expect to continue to incur, significant legal costs in conducting these lawsuits, including the appeal of the case we won, and our involvement in this litigation and any future intellectual property litigation could adversely affect sales and divert the efforts and attention of our technical and management personnel, whether or not such litigation is resolved in our favor. Thus, even if we are successful in these lawsuits, the benefits of this success may fail to outweigh the significant legal costs we will have incurred.
If our efforts to enhance existing products and introduce new products are not successful, we may not be able to generate demand for our products. Our success depends in significant part upon our ability to develop new ICs for high-voltage power conversion for existing and new markets, to introduce these products in a timely manner and to have these products selected for design into products of leading manufacturers. New product introduction schedules are subject to the risks and uncertainties that typically accompany development and delivery of complex technologies to the market place, including product development delays and defects. If we fail to develop and sell new products in a timely manner then our net revenues could decline.
In addition, we cannot be sure that we will be able to adjust to changing market demands as quickly and cost-effectively as necessary to compete successfully. Furthermore, we cannot assure that we will be able to introduce new products in a timely and cost-effective manner or in sufficient quantities to meet customer demand or that these products will achieve market acceptance. Our failure, or our customers’ failure, to develop and introduce new products successfully and in a timely manner would harm our business. In addition, customers may defer or return orders for existing products in response to the introduction of new products. When a potential liability exists we will maintain reserves for customer returns, however we cannot assure that these reserves will be adequate.
In the event of an earthquake, terrorist act or other disaster, our operations may be interrupted and our business would be harmed. Our principal executive offices and operating facilities are situated near San Francisco, California, and most of our major suppliers, which are wafer foundries and assembly houses, are located in areas that have been subject to severe earthquakes, such as Japan. Many of our suppliers are also susceptible to other disasters such as tropical storms, typhoons or tsunamis. In the event of a disaster, such as the earthquake and tsunami in Japan, we or one or more of our major suppliers may be temporarily unable to continue operations and may suffer significant property damage. Any interruption in our ability or that of our major suppliers to continue operations could delay the development and shipment of our products and have a substantial negative impact on our financial results.
Securities laws and regulations, including potential risk resulting from our evaluation of internal controls over financial reporting, will continue to impact our results. Complying with the requirements of the federal securities laws and NASDAQ’s conditions for continued listing have imposed significant legal and financial compliance costs, and are expected to continue to impose significant costs and management burden on us. These rules and regulations also may make it more expensive for us to obtain director and officer liability insurance, and we may be required to accept reduced coverage or incur substantially higher costs to obtain coverage. These rules and regulations could also make it more difficult for us to attract and retain qualified executive officers and members of our board of directors, particularly qualified members to serve on our audit committee. Further, the rules and regulations under the Dodd-Frank Wall Street Reform and Consumer Protection Act, which became effective in 2011, may impose significant costs and management burden on us.
Additionally, because these laws, regulations and standards are expected to be subject to varying interpretations, their application in practice may evolve over time as new guidance becomes available. This evolution may result in continuing uncertainty regarding compliance matters and additional costs necessitated by ongoing revisions to our disclosure and governance practices.
Because the sales cycle for our products can be lengthy, we may incur substantial expenses before we generate significant revenues, if any. Our products are generally incorporated into a customer’s products at the design stage. However, customer decisions to use our products, commonly referred to as design wins, can often require us to expend significant research and development and sales and marketing resources without any assurance of success. These significant research and development and sales and marketing resources often precede volume sales, if any, by a year or more. The value of any design win will largely depend upon the commercial success of the customer’s product. We cannot assure that we will continue to achieve design wins
17
or that any design win will result in future revenues. If a customer decides at the design stage not to incorporate our products into its product, we may not have another opportunity for a design win with respect to that product for many months or years.
Our products must meet exacting specifications, and undetected defects and failures may occur which may cause customers to return or stop buying our products. Our customers generally establish demanding specifications for quality, performance and reliability, and our products must meet these specifications. ICs as complex as those we sell often encounter development delays and may contain undetected defects or failures when first introduced or after commencement of commercial shipments. We have from time to time in the past experienced product quality, performance or reliability problems. If defects and failures occur in our products, we could experience lost revenue, increased costs, including warranty expense and costs associated with customer support and customer expenses, delays in or cancellations or rescheduling of orders or shipments and product returns or discounts, any of which would harm our operating results.
Audits of our tax returns and potential future changes in tax laws may increase the amount of taxes we are required to pay. Our operations are subject to income and transaction taxes in the United States and in multiple foreign jurisdictions and to review or audit by the U.S. Internal Revenue Service (IRS) and state, local and foreign tax authorities. In addition, the United States, countries in Asia and other countries where we do business have been considering changes in relevant tax, accounting and other laws, regulations and interpretations, including changes to tax laws applicable to multinational companies. These potential changes could adversely affect our effective tax rates or result in other costs to us.
We must attract and retain qualified personnel to be successful and competition for qualified personnel is intense in our market. Our success depends to a significant extent upon the continued service of our executive officers and other key management and technical personnel, and on our ability to continue to attract, retain and motivate qualified personnel, such as experienced analog design engineers and systems applications engineers. The competition for these employees is intense, particularly in Silicon Valley. The loss of the services of one or more of our engineers, executive officers or other key personnel could harm our business. In addition, if one or more of these individuals leaves our employ, and we are unable to quickly and efficiently replace those individuals with qualified personnel who can smoothly transition into their new roles, our business may suffer. We do not have long-term employment contracts with, and we do not have in place key person life insurance policies on, any of our employees.
We are exposed to risks associated with acquisitions and strategic investments. We have made, and in the future intend to make, acquisitions of, and investments in, companies, technologies or products in existing, related or new markets. Acquisitions involve numerous risks, including but not limited to:
• | inability to realize anticipated benefits, which may occur due to any of the reasons described below, or for other unanticipated reasons; |
• | the risk of litigation or disputes with customers, suppliers, partners or stockholders of an acquisition target arising from a proposed or completed transaction; |
• | impairment of acquired intangible assets and goodwill as a result of changing business conditions, technological advancements or worse-than-expected performance, which would adversely affect our financial results; and |
• | unknown, underestimated and/or undisclosed commitments, liabilities or issues not discovered in our due diligence of such transactions. |
We also in the future may have strategic relationships with other companies, which may decline in value and/or not meet desired objectives. The success of these strategic relationships depends on various factors over which we may have limited or no control and requires ongoing and effective cooperation with strategic partners. Moreover, these relationships are often illiquid, such that it may be difficult or impossible for us to monetize such relationships.
Our inability to successfully integrate, or realize the expected benefits from, our acquisitions could adversely affect our results. We have made, and in the future intend to make, acquisitions of other businesses and with these acquisitions there is a risk that integration difficulties may cause us not to realize expected benefits. The success of the acquisitions could depend, in part, on our ability to realize the anticipated benefits and cost savings (if any) from combining the businesses of the acquired companies and our business, which may take longer to realize than expected.
18
Changes in environmental laws and regulations may increase our costs related to obsolete products in our existing inventory. Changing environmental regulations and the timetable to implement them continue to impact our customers’ demand for our products. As a result there could be an increase in our inventory obsolescence costs for products manufactured prior to our customers’ adoption of new regulations. Currently we have limited visibility into our customers’ strategies to implement these changing environmental regulations into their business. The inability to accurately determine our customers’ strategies could increase our inventory costs related to obsolescence.
Interruptions in our information technology systems could adversely affect our business. We rely on the efficient and uninterrupted operation of complex information technology systems and networks to operate our business. Any significant system or network disruption, including but not limited to new system implementations, computer viruses, security breaches, or energy blackouts could have a material adverse impact on our operations, sales and operating results. We have implemented measures to manage our risks related to such disruptions, but such disruptions could still occur and negatively impact our operations and financial results. In addition, we may incur additional costs to remedy any damages caused by these disruptions or security breaches.
Uncertainties arising out of economic consequences of current and potential military actions or terrorist activities and associated political instability could adversely affect our business. Like other U.S. companies, our business and operating results are subject to uncertainties arising out of economic consequences of current and potential military actions or terrorist activities and associated political instability, and the impact of heightened security concerns on domestic and international travel and commerce. These uncertainties could also lead to delays or cancellations of customer orders, a general decrease in corporate spending or our inability to effectively market and sell our products. Any of these results could substantially harm our business and results of operations, causing a decrease in our revenues.
Item 1B. Unresolved Staff Comments.
Not applicable.
Item 2. Properties.
We own our principal executive, administrative, manufacturing and technical offices which are located in San Jose, California. We also own an R&D facility in New Jersey and a test facility in Biel, Switzerland. We lease administrative office space in Singapore and Switzerland, R&D facilities in Canada and the United Kingdom and a design center in Germany, in addition to sales offices in various countries around the world to accommodate our sales force. We believe that our current facilities are sufficient for our Company; however, if headcount increases above capacity we may need to lease additional space.
Item 3. Legal Proceedings.
Information with respect to this item may be found in Note 10, Legal Proceedings and Contingencies, in our Notes to Consolidated Financial Statements included later in this Annual Report on Form 10-K, which information is incorporated herein by reference.
Item 4. Mine Safety Disclosures.
Not applicable.
19
PART II
Item 5. Market for Registrant’s Common Equity, Related Stockholder Matters and Issuer Purchases of Equity Securities.
Our common stock trades on the NASDAQ Global Select Market under the symbol “POWI”. The following table shows the high and low closing sales prices per share of our common stock as reported on the NASDAQ Global Select Market for the periods indicated during which our common stock traded on the NASDAQ Global Select Market.
Year Ended December 31, 2016 | Year Ended December 31, 2015 | ||||||||||||||
High | Low | High | Low | ||||||||||||
First Quarter | $ | 49.75 | $ | 41.63 | $ | 57.52 | $ | 50.00 | |||||||
Second Quarter | $ | 54.36 | $ | 45.04 | $ | 53.48 | $ | 44.97 | |||||||
Third Quarter | $ | 63.03 | $ | 48.91 | $ | 44.67 | $ | 36.26 | |||||||
Fourth Quarter | $ | 69.55 | $ | 61.97 | $ | 52.74 | $ | 41.00 | |||||||
As of January 31, 2017, there were approximately 38 stockholders of record. Because brokers and other institutions hold many of our shares on behalf of stockholders, we are unable to estimate the total number of stockholders represented by these record holders.
Dividends Declared Per Common Share
The following table presents the quarterly dividends declared on our common stock for the periods indicated:
Year Ended December 31, | |||||||
2016 | 2015 | ||||||
First Quarter | $ | 0.13 | $ | 0.12 | |||
Second Quarter | $ | 0.13 | $ | 0.12 | |||
Third Quarter | $ | 0.13 | $ | 0.12 | |||
Fourth Quarter | $ | 0.13 | $ | 0.12 | |||
We paid a total of $15.1 million and $13.9 million in cash dividends during 2016 and 2015, respectively.
Issuer Purchases of Equity Securities
As of December 31, 2014 we had $23.7 million available to repurchase shares of our common stock under previous authorizations by our board of directors. In each of July 2015 and October 2015, our board of directors authorized the use of an additional $30.0 million for the repurchase of our common stock, with repurchases to be executed according to pre-defined price/volume guidelines. In the year ended December 31, 2016, we purchased 146,000 shares for $6.4 million. As of December 31, 2016, we had $23.6 million available for future stock repurchases. Authorization of future repurchase programs is at the discretion of the board of directors and will depend on our financial condition, results of operations, capital requirements, business conditions as well as other factors.
We did not repurchase any of our common stock during the fourth quarter of fiscal 2016.
20
Performance Graph (1)
The following graph shows the cumulative total stockholders return of an investment of $100 in cash on December 31, 2011 through December 31, 2016 in our common stock, the NASDAQ Composite Index and the NASDAQ Electronic Components Index and assuming that all dividends were reinvested. The stockholder return shown on the graph below is not necessarily indicative of future performance, and we do not make or endorse any predictions as to future stockholder returns.
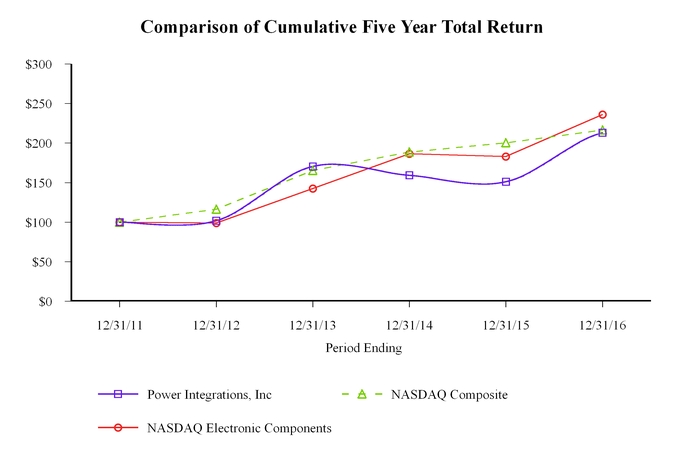
Company/Index | 12/31/11 | 12/31/12 | 12/31/13 | 12/31/14 | 12/31/15 | 12/31/16 | ||||||||||||
Power Integrations, Inc. | 100.00 | 101.92 | 170.44 | 159.27 | 151.19 | 212.99 | ||||||||||||
NASDAQ Composite | 100.00 | 116.41 | 165.47 | 188.69 | 200.32 | 216.54 | ||||||||||||
NASDAQ Electronic Components | 100.00 | 99.13 | 142.52 | 186.42 | 183.01 | 236.19 | ||||||||||||
_______________
(1) This Section is not “soliciting material,” is not deemed “filed” with the SEC and is not to be incorporated by reference in any filing of Power Integrations under the Securities Act of 1933, as amended, or the Securities Exchange Act of 1934, whether made before or after the date hereof and irrespective of any general incorporation language in any such filing.
21
Item 6. Selected Financial Data.
The following selected consolidated financial data should be read in conjunction with ‘’Management’s Discussion and Analysis of Financial Condition and Results of Operations’’ and the consolidated financial statements and the notes thereto included elsewhere in this Annual Report on Form 10-K to fully understand factors that may affect the comparability of the information presented below. The selected consolidated statement of income (loss) data for each of the years ended December 31, 2016, 2015 and 2014, and the consolidated balance sheet data as of December 31, 2016 and 2015, are derived from our audited consolidated financial statements, and accompanying notes, included in this Annual Report on Form 10-K. The selected consolidated statement of income (loss) data for each of the years ended December 31, 2013 and 2012, and the consolidated balance sheet data as of December 31, 2014, 2013 and 2012, are derived from our audited consolidated financial statements which are not included in this report. Our historical results are not necessarily indicative of results for any future period. In 2012, our net loss was affected by the impairment charges related our investment in SemiSouth Laboratories, and from our settlement with the IRS related to the examination of our tax returns for the years 2003 through 2006. In 2012, we acquired CT Concept Technologie AG (Concept), a Swiss company. In 2015, we acquired Cambridge Semiconductor Limited (CamSemi), a UK company (refer to Note 11, Acquisitions, in our Notes to Consolidated Financial Statements in this Annual Report on Form 10-K, for details).
Consolidated Statement of Income (Loss) Data | Year Ended December 31, | ||||||||||||||||||
(in thousands, except per share amounts) | 2016 | 2015 | 2014 | 2013 | 2012 | ||||||||||||||
Net revenues | $ | 387,393 | $ | 343,989 | $ | 348,797 | $ | 347,089 | $ | 305,370 | |||||||||
Income from operations | 47,844 | 38,993 | 55,796 | 54,066 | 11,352 | ||||||||||||||
Provision for (benefit from) income taxes | 1,032 | 271 | (2,730 | ) | (1,839 | ) | 13,622 | ||||||||||||
Net income (loss) | $ | 47,890 | $ | 39,147 | $ | 59,544 | $ | 57,266 | $ | (34,404 | ) | ||||||||
Earnings (loss) per share: | |||||||||||||||||||
Basic | $ | 1.66 | $ | 1.35 | $ | 1.99 | $ | 1.95 | $ | (1.20 | ) | ||||||||
Diluted | $ | 1.62 | $ | 1.32 | $ | 1.93 | $ | 1.88 | $ | (1.20 | ) | ||||||||
Shares used in per share calculation: | |||||||||||||||||||
Basic | 28,925 | 29,001 | 29,976 | 29,421 | 28,636 | ||||||||||||||
Diluted | 29,619 | 29,696 | 30,829 | 30,420 | 28,636 | ||||||||||||||
Dividend per share | $ | 0.52 | $ | 0.48 | $ | 0.44 | $ | 0.32 | $ | 0.20 | |||||||||
Consolidated Balance Sheet Data | Year Ended December 31, | ||||||||||||||||||
(in thousands) | 2016 | 2015 | 2014 | 2013 | 2012 | ||||||||||||||
Cash and cash equivalents | $ | 62,134 | $ | 90,092 | $ | 60,708 | $ | 92,928 | $ | 63,394 | |||||||||
Short-term marketable securities | 188,323 | 83,769 | 114,575 | 109,179 | 31,766 | ||||||||||||||
Cash, cash equivalents and short-term marketable securities | 250,457 | 173,861 | 175,283 | 202,107 | 95,160 | ||||||||||||||
Working capital | 258,649 | 188,410 | 210,752 | 227,004 | 124,297 | ||||||||||||||
Total assets | 555,338 | 487,537 | 493,663 | 501,421 | 399,130 | ||||||||||||||
Long-term liabilities | 7,380 | 6,925 | 7,827 | 14,317 | 17,514 | ||||||||||||||
Stockholders’ equity | $ | 488,105 | $ | 428,619 | $ | 430,676 | $ | 436,686 | $ | 341,049 | |||||||||
22
Item 7. Management’s Discussion and Analysis of Financial Condition and Results of Operations.
The following discussion and analysis of our financial condition and results of our operations should be read in conjunction with the consolidated financial statements and the notes to those statements included elsewhere in this Annual Report on Form 10-K. This discussion contains forward-looking statements that involve risks and uncertainties. See “Cautionary Note Regarding Forward-Looking Statements” at the beginning of this Form 10-K. Our actual results could differ materially from those contained in these forward-looking statements due to a number of factors, including those discussed in Part I, Item 1A “Risk Factors” and elsewhere in this report.
Business Overview
We design, develop and market analog and mixed-signal integrated circuits (ICs) and other electronic components and circuitry used in high-voltage power conversion. Our products are used in power converters that convert electricity from a high-voltage source (typically 48 volts or higher) to the type of power required for a specified downstream use. In most cases, this conversion entails, among other functions, converting alternating current (AC) to direct current (DC) or vice versa, reducing or increasing the voltage, and regulating the output voltage and/or current according to the customer’s specifications.
A large percentage of our products are ICs used in AC-DC power supplies, which convert the high-voltage AC from a wall outlet to the low-voltage DC required by most electronic devices. Power supplies incorporating our products are used with all manner of electronic products including mobile phones, computers, entertainment and networking equipment, appliances, electronic utility meters, industrial controls, and lights that utilize light-emitting diodes (LEDs) rather than incandescent or fluorescent light sources.
We also offer high-voltage gate drivers - either standalone ICs or circuit boards containing ICs, electrical isolation components and other circuitry - used to operate high-voltage switches such as insulated-gate bipolar transistors (IGBTs). These combinations of switches and drivers are used for power conversion in high-power applications (i.e., power levels ranging from a few kilowatts up to one gigawatt) such as industrial motors, solar- and wind-power systems, electric vehicles and high-voltage DC transmission systems.
Our net revenues were $387.4 million, $344.0 million and $348.8 million in 2016, 2015 and 2014, respectively. In 2016 revenues increased by $43.4 million due primarily to higher unit sales into the communications end-market, largely as a result of the success of our InnoSwitch products in mobile-device chargers. In addition, higher unit sales into the consumer market, particularly the consumer-appliance market, contributed to the increase in 2016. The increase was partially offset by lower unit sales into the computer end-market, reflecting reduced demand for power supplies for desktop computers. In 2015 revenues decreased by $4.8 million due primarily to lower unit sales into the computer end-market, reflecting reduced demand for power supplies for desktop computers, and the industrial end-market, reflecting a broad-based slowdown in demand from the industrial sector of the economy. These reductions were partially offset by higher unit sales into the communications end-market, largely as a result of the success of our InnoSwitch products in mobile-device chargers, and the effect of our acquisition of Cambridge Semiconductor Limited (CamSemi), whose products are used primarily in the communications end-market.
Our top ten customers, including distributors that resell to OEMs and merchant power supply manufacturers, accounted for 60% of our net revenues in each of 2016 and 2015, and 59% in 2014. Our top two customers, both distributors of our products, collectively accounted for approximately 29%, 31% and 28% of our net revenues in 2016, 2015 and 2014, respectively. International sales made up approximately 96% of net revenues in 2016 and 95% in each of 2015 and 2014.
Because our industry is intensely price-sensitive, our gross margin (gross profit divided by net revenues) is subject to change based on the relative pricing of solutions that compete with ours. Variations in product mix, end-market mix and customer mix can also cause our gross margin to fluctuate. Also, because we purchase a large percentage of our silicon wafers from foundries located in Japan, our gross margin is influenced by fluctuations in the exchange rate between the U.S. dollar and the Japanese yen. All else being equal, a 10% change in the value of the U.S. dollar compared to the Japanese yen would eventually result in a corresponding change in our gross margin of approximately 1.0%; this sensitivity may increase or decrease depending on the percentage of our wafer supply that we purchase from Japanese suppliers. Also, although our wafer fabrication and assembly operations are outsourced, as are most of our test operations, a portion of our production costs are fixed in nature. As a result, our unit costs and gross profit margin are impacted by the volume of units we produce.
23
Our gross profit, defined as net revenues less cost of revenues, was $191.2 million, or 49% of net revenues, in 2016, compared to $173.4 million, or 50% of net revenues in 2015, and $189.6 million, or 54% of net revenues, in 2014. The decrease in gross margin in each of 2016 and 2015 was due primarily to a change in end-market mix, with a greater percentage of revenues coming from lower-margin end-markets, particularly communications. In addition, in 2015 we incurred higher period costs resulting from the amortization of intangibles and inventory write-up related to our acquisition of CamSemi, which took place in the first quarter of 2015.
Total operating expenses in 2016, 2015 and 2014 were $143.3 million, $134.4 million and $133.8 million, respectively. The increase in operating expenses in 2016 was due primarily to increased stock-based compensation expense related to annual performance-based awards as a result of our financial performance in 2016 and the expansion of headcount in support of our product-development efforts. Operating expenses increased in 2015 primarily due to the addition of employees in connection with our acquisition of CamSemi; the increase in headcount caused a corresponding increase in salary and other employee-related expenses. Sales and marketing expenses decreased due primarily to a decrease in amortization of intangible assets, as our Concept trade name was fully amortized as of the second quarter of 2014, and lower advertising and promotional expenses in 2015.
Critical Accounting Policies and Estimates
The preparation of financial statements and related disclosures in conformity with accounting principles generally accepted in the United States of America, or U.S. GAAP, requires management to make estimates and assumptions that affect the reported amounts of assets and liabilities and disclosures of contingent assets and liabilities at the date of the financial statements and the reported amounts of revenues and expenses during the reporting period. On an ongoing basis, we evaluate our estimates, including those listed below. We base our estimates on historical facts and various other assumptions that we believe to be reasonable at the time the estimates are made. Actual results could differ from those estimates.
Our critical accounting policies are as follows:
• | revenue recognition; |
• | stock-based compensation; |
• | estimating write-downs for excess and obsolete inventory; |
• | income taxes; |
• | business combinations; and |
• | goodwill and intangible assets. |
Our critical accounting policies are important to the portrayal of our financial condition and results of operations, and require us to make judgments and estimates about matters that are inherently uncertain. A brief description of these critical accounting policies is set forth below. For more information regarding our accounting policies, see Note 2, Summary of Significant Accounting Policies, in our Notes to Consolidated Financial Statements in this Annual Report on Form 10-K.
Revenue recognition
Product revenues consist of sales to original equipment manufacturers, or OEMs, merchant power supply manufacturers and distributors. Approximately 75% of our net product sales were made to distributors in 2016. We apply the provisions of Accounting Standards Codification (ASC) 605-10, Revenue Recognition, and all related appropriate guidance. Revenue is recognized when all of the following criteria have been met: (1) persuasive evidence of an arrangement exists, (2) delivery has occurred, (3) the price is fixed or determinable, and (4) collectability is reasonably assured. Customer purchase orders are generally used to determine the existence of an arrangement. Delivery is considered to have occurred when title and risk of loss have transferred to our customer. We evaluate whether the price is fixed or determinable based on the payment terms associated with the transaction and whether the sales price is subject to refund or adjustment. With respect to collectability, we perform credit checks for new customers and perform ongoing evaluations of our existing customers’ financial condition and require letters of credit whenever deemed necessary.
Sales to international OEMs and merchant power supply manufacturers for shipments from our facility outside of the United States are pursuant to EX Works, or EXW, shipping terms, meaning that title to the product transfers to the customer upon shipment from our foreign warehouse. Sales to international OEM customers and merchant power supply manufacturers that are shipped from our facility in California are pursuant to Delivered at Frontier, or DAF, shipping terms. As such, title to the product passes to the customer when the shipment reaches the destination country and revenue is recognized upon the arrival of the product
24
in that country. Shipments to OEMs and merchant power supply manufacturers in the Americas are pursuant to Free on Board, or FOB, point of origin shipping terms meaning that title is passed to the customer upon shipment. Revenue is recognized upon title transfer for sales to OEMs and merchant power supply manufacturers, assuming all other criteria for revenue recognition are met.
Sales to most distributors are made under terms allowing certain price adjustments and rights of return on our products held by the distributors. As a result of these rights, we defer the recognition of revenue and the costs of revenues derived from sales to these distributors until our distributors report that they have sold our products to their customers. Our recognition of such distributor sell-through is based on point of sales reports received from the distributor, at which time the price is no longer subject to adjustment and is fixed, and the products are no longer subject to return to us except pursuant to warranty terms. The gross profit that is deferred upon shipment to the distributor is reflected as “deferred income on sales to distributors” in the accompanying consolidated balance sheets. The total deferred revenue as of December 31, 2016 and 2015, was approximately $28.1 million and $25.7 million, respectively. The total deferred cost as of December 31, 2016 and 2015, was approximately $11.9 million and $10.6 million, respectively.
Frequently, distributors need to sell at a price lower than the standard distribution price in order to win business. At the time the distributor invoices its customer or soon thereafter, the distributor submits a “ship and debit” price adjustment claim to us to adjust the distributor’s cost from the standard price to the pre-approved lower price. After we verify that the claim was pre-approved, a credit memo is issued to the distributor for the ship and debit claim. We maintain a reserve for these unprocessed claims and for estimated future ship and debit price adjustments. The reserves appear as a reduction to accounts receivable and deferred income on sales to distributors in our accompanying consolidated balance sheets. To the extent future ship and debit claims significantly exceed amounts estimated, there could be a material impact on the deferred revenue and deferred margin ultimately recognized. To evaluate the adequacy of our reserves, we analyze historical ship and debit payments and levels of inventory in the distributor channels.
Sales to certain of our distributors are made under terms that do not include rights of return or price concessions after the product is shipped to the distributor. Accordingly, product revenue is recognized upon shipment and title transfer assuming all other revenue recognition criteria are met.
Stock-based compensation
We apply the provisions of ASC 718-10, Share-Based Payment. Under the provisions of ASC 718-10, we recognize the fair value of stock-based compensation in our financial statements over the requisite service period of the individual grants, which generally equals a four-year vesting period. We use estimates of volatility, expected term, risk-free interest rate, dividend yield and forfeitures in determining the fair value of these awards and the amount of compensation expense to recognize. Changes in the estimated forfeiture rate could result in changes to our current compensation charges for historical grants.
For awards with performance conditions, we recognize compensation expense when it becomes probable that the performance target will be achieved. A probability assessment is performed on a quarterly basis and requires significant assumptions and estimates made by management related to the projected achievement of the performance targets, which consist of a combination of net revenue, non-GAAP operating earnings and strategic goals. Changes in the probability assessment of achieving the performance targets are accounted for in the period of change by recording a cumulative catch-up adjustment as if the new estimate had been applied since the service inception date. If the actual performance targets achieved differ significantly from those projected by management, additional compensation expense may be recorded for the performance-based awards due to the cumulative catch-up adjustment, which could have an adverse impact on our results of operations.
Estimating write-downs for excess and obsolete inventory
When evaluating the adequacy of our valuation adjustments for excess and obsolete inventory, we identify excess and obsolete products and also analyze historical usage, forecasted production based on demand forecasts, current economic trends and historical write-offs. This write-down is reflected as a reduction to inventory in the consolidated balance sheets and an increase in cost of revenues. If actual market conditions are less favorable than our assumptions, we may be required to take additional write-downs, which could adversely impact our cost of revenues and operating results.
Income taxes
Income tax expense is an estimate of current income taxes payable or refundable in the current fiscal year based on reported income before income taxes. Deferred income taxes reflect the effect of temporary differences and carry-forwards that are recognized for financial reporting and income tax purposes.
25
We account for income taxes under the provisions of ASC 740, Income Taxes. Under the provisions of ASC 740, deferred tax assets and liabilities are recognized based on the differences between the financial statement carrying amounts of existing assets and liabilities and their respective tax bases, utilizing the tax rates that are expected to apply to taxable income in the years in which those temporary differences are expected to be recovered or settled. We recognize valuation allowances to reduce any deferred tax assets to the amount that we estimate will more likely than not be realized based on available evidence and management’s judgment. We limit the deferred tax assets recognized related to some of our officers’ compensation to amounts that we estimate will be deductible in future periods based upon Internal Revenue Code Section 162(m). In the event that we determine, based on available evidence and management judgment, that all or part of the net deferred tax assets will not be realized in the future, we would record a valuation allowance in the period the determination is made. In addition, the calculation of tax liabilities involves significant judgment in estimating the impact of uncertainties in the application of complex tax laws. Resolution of these uncertainties in a manner inconsistent with our expectations could have a material impact on our results of operations and financial position.
As of December 31, 2016, we continue to maintain a valuation allowance on our California deferred tax assets as we believe that it is not more likely than not that the deferred tax assets will be fully realized. We also maintain a valuation allowance with respect to some of our deferred tax assets relating primarily to tax credits in Canada and the state of New Jersey as well as Federal capital loss carryforwards.
Business combinations
The purchase price of an acquisition is allocated to the underlying assets acquired and liabilities assumed based upon their estimated fair values at the date of acquisition. To the extent the purchase price exceeds the fair value of the net identifiable tangible and intangible assets acquired and liabilities assumed, such excess is allocated to goodwill. We determine the estimated fair values after review and consideration of relevant information, including discounted cash flows, quoted market prices and estimates made by management. We adjust the preliminary purchase price allocation, as necessary, during the measurement period of up to one year after the acquisition closing date as we obtain more information as to facts and circumstances existing at the acquisition date impacting asset valuations and liabilities assumed. Acquisition-related costs are recognized separately from the acquisition and are expensed as incurred.
Goodwill and intangible assets
In accordance with ASC 350-10, Goodwill and Other Intangible Assets, we evaluate goodwill for impairment on an annual basis, or as other indicators of impairment emerge. The provisions of ASC 350-10 require that we perform a two-step impairment test. In the first step, we compare the implied fair value of our single reporting unit to its carrying value, including goodwill. If the fair value of our reporting unit exceeds the carrying amount no impairment adjustment is required. If the carrying amount of our reporting unit exceeds the fair value, step two will be completed to measure the amount of goodwill impairment loss, if any exists. If the carrying value of our single reporting unit’s goodwill exceeds its implied fair value, then we record an impairment loss equal to the difference, but not in excess of the carrying amount of the goodwill. Under the amendments of ASC 350-10, Accounting Standards Update (ASU) 2011-08, Testing Goodwill for Impairment, we have the option to first assess qualitative factors to determine whether the existence of events or circumstances leads to a determination that it is more likely than not that the fair value of a reporting unit is less than its carrying amount. If, we elect this option and after assessing the totality of events or circumstances, we determine it is not more likely than not that the fair value of a reporting unit is less than its carrying amount, then performing the two-step impairment test is unnecessary. We have not elected this option to date. We evaluated goodwill for impairment in the fourth quarters of 2016 and 2015, and concluded that no impairment existed as of December 31, 2016, and December 31, 2015.
ASC 350-10 also requires that intangible assets with estimable useful lives be amortized over their respective estimated useful lives, and reviewed for impairment in accordance with ASC 360-10, Accounting for the Impairment or Disposal of Long-Lived Assets. We review long-lived assets, such as acquired intangibles and property and equipment, for impairment whenever events or changes in circumstances indicate that the carrying amount of an asset may not be recoverable. We measure recoverability of assets to be held and used by a comparison of the carrying amount of an asset to estimated undiscounted future cash flows expected to be generated by the asset. If the carrying amount of an asset exceeds its estimated future cash flows, we recognize an impairment charge by the amount by which the carrying amount of the asset exceeds the fair value of the asset.
26
Results of Operations
The following table sets forth statement of income data as a percentage of net revenues for the periods indicated:
Year Ended December 31, | ||||||||
2016 | 2015 | 2014 | ||||||
Net revenues | 100.0 | % | 100.0 | % | 100.0 | % | ||
Cost of revenues | 50.7 | 49.6 | 45.7 | |||||
Gross profit | 49.3 | 50.4 | 54.3 | |||||
Operating expenses: | ||||||||
Research and development | 16.1 | 16.7 | 15.8 | |||||
Sales and marketing | 12.4 | 13.6 | 13.7 | |||||
General and administrative | 8.5 | 8.7 | 8.9 | |||||
Total operating expenses | 37.0 | 39.0 | 38.4 | |||||
Income from operations | 12.3 | 11.4 | 16.0 | |||||
Other income | 0.3 | 0.1 | 0.3 | |||||
Income before income taxes | 12.6 | 11.5 | 16.3 | |||||
Provision for (benefit from) income taxes | 0.2 | 0.1 | (0.8 | ) | ||||
Net income | 12.4 | % | 11.4 | % | 17.1 | % | ||
Comparison of Years Ended December 31, 2016, 2015 and 2014
Net revenues. Net revenues consist of revenues from product sales, which are calculated net of returns and allowances. In 2016 revenues increased by $43.4 million due primarily to higher unit sales into the communications end-market, largely as a result of the success of our InnoSwitch products in mobile-device chargers. In addition, higher unit sales into the consumer market, particularly the consumer-appliance market, contributed to the increase in 2016. The increase was partially offset by lower unit sales into the computer end-market, reflecting reduced demand for power supplies for desktop computers. In 2015 revenue decreased by $4.8 million, due primarily to lower unit sales into the computer end-market, reflecting reduced demand for power supplies for desktop computers, and the industrial end-market, reflecting a broad-based slowdown in demand from the industrial sector of the economy. These reductions were partially offset by higher unit sales into the communications end-market, largely as a result of the success of our InnoSwitch products in mobile-device chargers and the effect of our acquisition of CamSemi, whose products are used primarily in the communications end-market.
Our approximate net revenue mix by end-markets served in 2016, 2015 and 2014 is as follows:
Year Ended December 31, | ||||||||
End Market | 2016 | 2015 | 2014 | |||||
Communications | 27 | % | 24 | % | 18 | % | ||
Computer | 6 | % | 7 | % | 10 | % | ||
Consumer | 36 | % | 36 | % | 37 | % | ||
Industrial | 31 | % | 33 | % | 35 | % | ||
Sales to customers outside of the United States were $372.8 million in 2016, compared to $327.5 million in 2015 and $332.8 million in 2014, representing approximately 96% of net revenues in 2016 and 95% in each of 2015 and 2014. Although power supplies using our products are designed and distributed worldwide, most of these power supplies are manufactured by our customers in Asia. As a result, sales to this region accounted for approximately 81% of our net revenues in 2016 and 80% in each of 2015 and 2014. We expect international sales to continue to account for a large portion of our net revenues for the foreseeable future.
Distributors accounted for 75% of our net product sales for each of the years ended December 31, 2016, 2015 and 2014, with direct sales to OEMs and merchant power supply manufacturers accounting for the remainder in each of the corresponding years. In each of 2016 and 2015 two distributors accounted for more than 10% of revenues. In 2014 only one of these distributors accounted for more than 10% of revenues.
27
The following customers each accounted for 10% or more of net revenues during these years:
Year Ended December 31, | ||||||||
Customer | 2016 | 2015 | 2014 | |||||
Avnet | 18 | % | 21 | % | 19 | % | ||
Powertech Distribution Ltd. | 11 | % | 10 | % | * | |||
_______________
* Total customer revenue was less than 10% of net revenues.
No other customers accounted for 10% or more of net revenues during these years.
Gross profit. Gross profit is net revenues less cost of revenues. Our cost of revenues consists primarily of the purchase of wafers from our contracted foundries, the assembly, packaging and testing of our products by sub-contractors, product testing performed in our own facility, overhead associated with the management of our supply chain and the amortization of acquired intangible assets. Gross margin is gross profit divided by net revenues. The table below compares gross profit and gross margin for the years ended December 31, 2016, 2015 and 2014:
(dollars in millions) | 2016 | Change | 2015 | Change | 2014 | ||||||||||||
Gross profit | $ | 191.2 | 10.3 | % | $ | 173.4 | (8.5 | )% | $ | 189.6 | |||||||
Gross margin | 49.3 | % | 50.4 | % | 54.3 | % | |||||||||||
The decrease in gross margin in each of 2016 and 2015 was due primarily to a change in end-market mix, with a greater percentage of revenue coming from lower-margin end-markets, particularly communications. In addition, in 2015 we incurred higher period costs resulting from the amortization of intangibles and inventory write-up related to our acquisition of CamSemi, which took place in the first quarter of 2015.
Research and development expenses. R&D expenses consist primarily of employee-related expenses including stock-based compensation and expensed material and facility costs associated with the development of new processes and new products. We also record R&D expenses for prototype wafers related to new products until the products are released to production. The table below compares R&D expenses for the years ended December 31, 2016, 2015 and 2014:
(dollars in millions) | 2016 | Change | 2015 | Change | 2014 | ||||||||||||
R&D expenses | $ | 62.3 | 8.3 | % | $ | 57.5 | 4.7 | % | $ | 55.0 | |||||||
Percentage of net revenues | 16.1 | % | 16.7 | % | 15.8 | % | |||||||||||
R&D expenses increased in 2016 compared to 2015 primarily due to increased stock-based compensation expense related to performance-based stock awards expected to vest as a result of our 2016 performance. The expansion of headcount in support of our product-development efforts also contributed to the increase. R&D expenses increased in 2015 as compared to 2014, driven primarily by the addition of employees in connection with our acquisition of CamSemi; the increase in headcount caused a corresponding increase in salary and other employee-related expenses.
Sales and marketing expenses. Sales and marketing expenses consist primarily of employee-related expenses, including stock-based compensation, commissions to sales representatives, amortization of acquired intangible assets and facilities expenses, including expenses associated with our regional sales and support offices. The table below compares sales and marketing expenses for the years ended December 31, 2016, 2015 and 2014:
Year Ended December 31, | |||||||||||||||||
(dollars in millions) | 2016 | Change | 2015 | Change | 2014 | ||||||||||||
Sales and marketing expenses | $ | 48.0 | 2.6 | % | $ | 46.8 | (2.1 | )% | $ | 47.8 | |||||||
Percentage of net revenues | 12.4 | % | 13.6 | % | 13.7 | % | |||||||||||
Sales and marketing expenses increased in 2016 compared to 2015 primarily due to increased stock-based compensation expense related to performance-based stock awards expected to vest as a result of our 2016 performance. Higher bonus and sales commissions also contributed to the increase. Sales and marketing expenses decreased in 2015 compared to 2014 due primarily
28
to lower amortization of acquisition-related intangible assets, as our Concept trade name was fully amortized in the second quarter of 2014, and also due to lower advertising and promotional expenses in 2015.
General and administrative expenses. General and administrative, or G&A, expenses consist primarily of employee-related expenses, including stock-based compensation expenses for administration, finance, human resources and general management, as well as consulting, professional services, legal and auditing expenses. The table below compares G&A expenses for the years ended December 31, 2016, 2015 and 2014:
Year Ended December 31, | |||||||||||||||||
(dollars in millions) | 2016 | Change | 2015 | Change | 2014 | ||||||||||||
G&A expenses | $ | 33.0 | 10.0 | % | $ | 30.0 | (3.1 | )% | $ | 31.0 | |||||||
Percentage of net revenues | 8.5 | % | 8.7 | % | 8.9 | % | |||||||||||
G&A expenses increased in 2016 compared to 2015 due primarily to increased stock-based compensation expense related to performance-based stock awards expected to vest as a result of our 2016 performance and due to increased legal expenses as a result of higher fees in connection with our litigations with ON Semiconductor which recently acquired Fairchild Semiconductor. G&A expenses decreased in 2015 compared to 2014 due primarily to a decrease in patent litigation expenses and decreased outside service fees relating to our CamSemi acquisition which was completed in January 2015. These decreases were partially offset by higher patent (non-litigation) attorney fees.
Other income. Other income consists primarily of interest income earned on cash and cash equivalents, marketable securities and other investments, and the impact of foreign exchange gains or losses. The table below compares other income for the years ended December 31, 2016, 2015 and 2014:
Year Ended December 31, | |||||||||||||||||
(dollars in millions) | 2016 | Change | 2015 | Change | 2014 | ||||||||||||
Other income | $ | 1.1 | 153.6 | % | $ | 0.4 | (58.3 | )% | $ | 1.0 | |||||||
Percentage of net revenues | 0.3 | % | 0.1 | % | 0.3 | % | |||||||||||
Other income increased in 2016 due primarily to the unfavorable impact in 2015 of foreign currency movements relative to the U.S. dollar and the related loss recognized from the remeasurement of monetary foreign currency assets and liabilities of our Swiss subsidiary. Other income decreased in 2015 compared to 2014 due primarily to the unfavorable impact of foreign currency movements relative to the U.S. dollar and the related loss recognized from the remeasurement of monetary foreign currency assets and liabilities of our Swiss subsidiary.
Provision for (benefit from)income taxes. Provision for (benefit from) income taxes represents federal, state and foreign taxes. The table below compares the provision for income taxes for the years ended December 31, 2016, 2015 and 2014:
Year Ended December 31, | |||||||||||||||||
(dollars in millions) | 2016 | Change | 2015 | Change | 2014 | ||||||||||||
Provision for (benefit from) income taxes | $ | 1.0 | 280.8 | % | $ | 0.3 | (109.9 | )% | $ | (2.7 | ) | ||||||
Percentage of net revenues | 0.2 | % | 0.1 | % | (0.8 | )% | |||||||||||
Effective tax rate | 2.1 | % | 0.7 | % | (4.8 | )% | |||||||||||
In 2016 and 2015, our effective tax rate was impacted by the geographic distribution of our world-wide earnings in lower tax jurisdictions and the federal R&D tax credit. The difference between the 2016 and 2015 tax rate is due to additional foreign earnings brought back to the U.S. in 2016. In 2014, our effective tax rate was impacted by an agreement reached with the United States Internal Revenue Service to conclude the examination of our income tax returns for the years 2007 through 2009. The resolution of the audit resulted in a federal tax benefit to us of $2.8 million; we also recorded a state tax benefit of $0.5 million. The one-time benefit included the reversal of $4.1 million of related unrecognized tax benefits that had been recorded as non-current liabilities in our consolidated balance sheets. Additionally, the rate was favorably impacted by federal research tax credits for 2016, 2015 and 2014.
29
Liquidity and Capital Resources
We had approximately $250.5 million in cash, cash equivalents and short-term marketable securities at December 31, 2016, compared to $173.9 million at December 31, 2015, and $175.3 million at December 31, 2014. As of December 31, 2016, 2015 and 2014, we had working capital, defined as current assets less current liabilities, of approximately $258.6 million, $188.4 million and $210.8 million, respectively.
On July 5, 2012, we entered into a credit agreement (the "Credit Agreement") with two banks. The Credit Agreement provides us with a $100.0 million revolving line of credit to use for general corporate purposes with a $20.0 million sub-limit for the issuance of standby and trade letters of credit. The Credit Agreement was amended on April 1, 2014, to extend the Credit Agreement termination date from July 5, 2015 to April 1, 2017, with all other terms of the Credit Agreement remaining the same.
On July 27, 2016, we terminated the Credit Agreement and entered into a new Credit Agreement with a bank (the "New Credit Agreement"). The New Credit Agreement provides us with a $75.0 million revolving line of credit to use for general corporate purposes with a $20.0 million sub-limit for the issuance of standby and trade letters of credit. Our ability to borrow under the revolving line of credit is conditioned upon our compliance with specified covenants, including reporting and financial covenants, primarily a minimum liquidity measure and a debt to earnings ratio, with which we are currently in compliance. The New Credit Agreement terminates on July 26, 2019; all advances under the revolving line of credit will become due on such date, or earlier in the event of a default. As of December 31, 2016, we had no amounts outstanding under our agreement.
Our operating activities generated cash of $97.9 million, $92.2 million, and $85.6 million in the years ended December 31, 2016, 2015 and 2014, respectively. In each of these years, cash was primarily generated from operating activities in the ordinary course of business.
In 2016, our net income was $47.9 million, which included stock-based compensation expenses, non-cash depreciation and amortization of $20.9 million, $16.8 million and $6.7 million, respectively. Sources of cash also included: (1) a $7.7 million increase in accounts payable due to the timing of payments; and (2) a $1.1 million increase in deferred income on sales to distributors due to increased inventory levels at our distributors in anticipation of end-customer demand. These sources of cash were partially offset by a $2.5 million increase in prepaid expenses and other assets due primarily to an increase in prepaid income taxes and a $1.1 million decrease in taxes payable and accrued liabilities.
In 2015, our net income was $39.1 million, which included non-cash depreciation, amortization and stock-based expenses of $16.5 million, $7.0 million and $14.8 million, respectively. Sources of cash also included: (1) a $13.5 million decrease in inventory due to ongoing reduction efforts; (2) a $4.1 million decrease in accounts receivable due to the timing of collections; and (3) a $3.4 million decrease in prepaid expenses and other assets due to income tax refunds received during the period. These sources of cash were partially offset by a $5.4 million increase in deferred taxes.
In 2014, our net income was $59.5 million, which included non-cash depreciation, amortization and stock-based compensation expenses of $15.9 million, $6.1 million and $14.3 million, respectively. Sources of cash also included: (1) a $8.2 million decrease in prepaid expenses and other assets as a result of lower payments related to legal and R&D services, in addition to tax refunds received during the year; (2) a $2.1 million decrease in accounts receivable as a result of lower sales in the fourth quarter of 2014 compared to 2013 and improved collections; and (3) a $2.3 million increase in accounts payable due to the timing of payments. These sources of cash were partially offset by a $21.7 million increase in our inventories as a result of lower-than expected sales, and by a $3.2 million decrease in taxes payable.
Our investing activities in the year ended December 31, 2016, resulted in a $117.4 million net use of cash, consisting primarily of $105.2 million from the purchase of marketable securities, net of maturities, and $12.2 million for purchases of property and equipment, primarily machinery and equipment for use in the manufacture of our products.
Our investing activities in the year ended December 31, 2015, resulted in a net $7.7 million use of cash, consisting primarily of $15.5 million in net cash paid for the acquisition of CamSemi, $10.4 million net cash paid for a building purchase (refer to Note 11, Acquisitions, in our Notes to Consolidated Financial Statements in this Annual Report on Form 10-K, for details) and $11.4 million for purchases of property and equipment, primarily machinery and equipment for use in the manufacture of our products. These uses of cash were partially offset by $29.6 million of proceeds from the sale and maturity of marketable securities, net of purchases.
30
Our investing activities in the year ended December 31, 2014, resulted in a net $38.1 million use of cash, consisting primarily of: (1) $7.2 million, net, for purchases of marketable securities; (2) $23.1 million for purchases of property and equipment, primarily machinery and equipment for production and R&D; (3) $1.3 million for the purchase of power.com, our domain name; and (4) a $6.6 million cash payment to CamSemi under a loan agreement (refer to Note 11, Acquisitions, in our Notes to Consolidated Financial Statements in this Annual Report on Form 10-K, for further details).
Our financing activities in the year ended December 31, 2016, resulted in a net use of $8.4 million of cash. Financing activities consisted primarily of $6.4 million for the repurchase of our common stock and $15.1 million for the payment of dividends to stockholders, partially offset by proceeds of $13.1 million from the issuance of common stock, including the exercise of employee stock options and the issuance of shares through our employee stock purchase plan.
Our financing activities in the year ended December 31, 2015, resulted in a net use of $55.1 million of cash. Financing activities consisted primarily of $53.7 million for the repurchase of our common stock and $13.9 million for the payment of dividends to stockholders, partially offset by proceeds of $12.6 million from the issuance of common stock, including the exercise of employee stock options and the issuance of shares through our employee stock purchase plan.
Our financing activities in the year ended December 31, 2014, resulted in a net use of $79.6 million of cash, consisting primarily of $80.8 million for the repurchase of our common stock, and $13.2 million for the payment of dividends to stockholders. The use of cash was partially offset by proceeds of $13.9 million from issuance of common stock, including the exercise of employee stock options and the issuance of shares through our employee stock purchase plan.
In October 2013, our board of directors declared four quarterly cash dividends in the amount of $0.10 per share to be paid to stockholders of record at the end of each quarter in 2014. In April 2014, our board of directors increased the quarterly dividends for the third and fourth quarters of 2014 to $0.12 per share. In January 2015, our board of directors extended the $0.12 quarterly dividend through each quarter in 2015. In January 2016, our board of directors declared four quarterly cash dividends in the amount of $0.13 per share to be paid to stockholders of record at the end of each quarter in 2016.
In January 2017, our board of directors declared four quarterly cash dividends in the amount of $0.14 per share to be paid to stockholders of record at the end of each quarter in 2017. The declaration of any future cash dividend is at the discretion of the board of directors and will depend on our financial condition, results of operations, capital requirements, business conditions and other factors, as well as a determination that cash dividends are in the best interest of our stockholders.
In the years ended December 31, 2014, and December 31, 2015, our board of directors authorized the use of $75.0 million and $60.0 million, respectively, for repurchase of our common stock, with repurchases to be executed according to pre-defined price/volume guidelines. In 2016, we purchased 146,000 shares for approximately $6.4 million. In the year ended December 31, 2015, we purchased 1.3 million shares for $53.7 million. In the year ended December 31, 2014, we purchased 1.6 million shares for $80.8 million. As of December 31, 2016, we had $23.6 million available for future stock repurchases. Authorization of future repurchase programs is at the discretion of the board of directors and will depend on our financial condition, results of operations, capital requirements and business conditions as well as other factors.
As of December 31, 2016, we had a contractual obligation related to income tax, consisting primarily of unrecognized tax benefits of approximately $15.4 million. The tax obligation was classified as long-term income taxes payable or recorded as contra deferred tax assets in our consolidated balance sheet.
Our cash, cash equivalents and investment balances may change in future periods due to changes in our planned cash outlays, including changes in incremental costs such as direct and integration costs related to future acquisitions. We expect continued sales growth in our foreign business and plan to use the earnings generated by our foreign subsidiaries to continue to fund both the working capital and growth needs of our foreign entities, along with providing funding for any future foreign acquisitions. We do not provide for U.S. taxes on undistributed earnings of our foreign subsidiaries that we intend to invest indefinitely outside the U.S., unless such taxes are otherwise required under U.S. tax law. Beginning in 2013, we determined that a portion of our foreign subsidiaries current and future earnings may be remitted prospectively to the U.S. for domestic cash flow purposes and, accordingly, provided for the related U.S. taxes in our consolidated financial statements. Currently the majority of our cash and marketable securities are held in the U.S. We may adjust our repatriation strategy depending on the U.S. cash needs and our ability to effectively utilize our deferred tax assets. If we change our intent to invest our undistributed earnings outside the U.S. indefinitely or if a greater amount of undistributed earnings are needed for U.S. operations than previously anticipated and for which U.S. taxes have not been recorded, we would be required to accrue or pay U.S. taxes (subject to an adjustment for
31
foreign tax credits, where applicable) and withholding taxes payable to various foreign countries on some or all of these undistributed earnings. As of December 31, 2016, we had approximately $265.0 million of undistributed earnings of foreign subsidiaries that are indefinitely invested outside of the U.S.
If our operating results deteriorate in future periods, either as a result of a decrease in customer demand or pricing pressures from our customers or our competitors, or for other reasons, our ability to generate positive cash flow from operations may be jeopardized. In that case, we may be forced to use our cash, cash equivalents and short-term investments, use our current financing or seek additional financing from third parties to fund our operations. We believe that cash generated from operations, together with existing sources of liquidity, will satisfy our projected working capital and other cash requirements for at least the next 12 months.
Off-Balance Sheet Arrangements
As of December 31, 2016 and 2015, we did not have any off-balance sheet arrangements or relationships with unconsolidated entities or financial partnerships, such as entities often referred to as structured finance or special purpose entities, which are typically established for the purpose of facilitating off-balance sheet arrangements or other contractually narrow or limited purposes.
Contractual Obligations
As of December 31, 2016, we had the following contractual obligations and commitments, consisting solely of non-cancelable operating lease agreements:
Payments Due by Period | |||||||||||||||||||
(in thousands) | Total | Less than 1 Year | 1 - 3 Years | 4 - 5 Years | Over 5 Years | ||||||||||||||
Operating lease obligations | $ | 4,387 | $ | 1,591 | $ | 1,979 | $ | 459 | $ | 358 | |||||||||
In addition to our contractual obligations noted above we have a contractual obligation related to income tax as of December 31, 2016, which primarily comprises unrecognized tax benefits of approximately $15.4 million, and was classified as long-term income taxes payable or recorded as contra deferred tax assets in our consolidated balance sheet.
Recently Issued Accounting Announcements
For recently issued accounting announcements, see “Recently Issued Accounting Announcements” in Note 2 to Consolidated Financial Statements included in this Annual Report on Form 10-K.
Item 7A. Quantitative and Qualitative Disclosures About Market Risk.
Interest Rate Risk. Our exposure to market risk for changes in interest rates relates primarily to our investment portfolio. We consider cash invested in highly liquid financial instruments with a remaining maturity of three months or less at the date of purchase to be cash equivalents. Investments in highly liquid financial instruments with maturities greater than three months are classified as short-term investments. We generally hold securities until maturity; however, they may be sold under certain circumstances, including, but not limited to, when necessary for the funding of acquisitions and other strategic investments. As a result of this policy, we classify our investment portfolio as available-for-sale. We invest in high-credit quality issuers and, by policy, limit the amount of credit exposure to any one issuer. As stated in our policy, we seek to ensure the safety and preservation of our invested principal funds by limiting default risk, market risk and reinvestment risk. We mitigate default risk by investing in safe and high-credit quality securities and by constantly positioning our portfolio to respond appropriately to a significant reduction in a credit rating of any investment issuer, guarantor or depository. The portfolio includes only marketable securities with active secondary or resale markets to facilitate portfolio liquidity. At December 31, 2016 and 2015, we held primarily cash equivalents and short-term investments with fixed interest rates. We do not hold any instruments for trading purposes.
Our investment securities are subject to market interest rate risk and will vary in value as market interest rates fluctuate. To minimize market risk, we invest in high-credit quality issuers and, by policy, limit the amount of credit exposure to any one issuer, and therefore if market interest rates were to increase or decrease by 10% from interest rates as of December 31, 2016, or December 31, 2015, the increase or decrease in the fair market value of our portfolio on these dates would not have been material.
32
We monitor our investments for impairment on a periodic basis. Refer to Note 2, Summary of Significant Accounting Policies, for a tabular presentation of our available-for-sale investments and the expected maturity dates.
Foreign Currency Exchange Risk. As of December 31, 2016, our primary transactional currency was the U.S. dollar; in addition, we hold cash in Swiss francs and euros to fund the operation of our Swiss subsidiary. Cash balances held in foreign countries are subject to local banking laws and may bear higher or lower risk than cash deposited in the United States. The following represents the potential impact on our pretax income from a change in the value of the U.S. dollar compared to the Swiss franc and euro as of December 31, 2016. This sensitivity analysis applies a change in the U.S. dollar value of 5% and 10%.
December 31, 2016 | |||||||
(in thousands of USD) | 5% | 10% | |||||
Swiss franc and euro foreign exchange impact | $ | 71 | $ | 142 | |||
The foreign exchange rate fluctuation between the U.S. dollar versus the Swiss franc and euro is recorded in other income in our consolidated statements of income.
We have sales offices in various other foreign countries in which our expenses are denominated in the local currency, primary Asia and Western Europe. From time to time we may enter into foreign currency hedging contracts to hedge certain foreign currency transactions. As of December 31, 2016, and December 31, 2015, we did not have an open foreign currency hedge program utilizing foreign currency forward exchange contracts.
With two of our major suppliers, Seiko Epson Corporation (Epson) and ROHM Lapis Semiconductor Co., Ltd. (Lapis) we have wafer supply agreements based in U.S. dollars; however, our agreements with Epson and Lapis also allow for mutual sharing of the impact of the exchange rate fluctuation between Japanese yen and the U.S. dollar. Each year, our management and these suppliers review and negotiate pricing; the negotiated pricing is denominated in U.S. dollars but is subject to contractual exchange rate provisions. The fluctuation in the exchange rate is shared equally between us and each of these suppliers.
Nevertheless, as a result of our above-mentioned supplier agreements, our gross margin is influenced by fluctuations in the exchange rate between the U.S. dollar and the Japanese yen. All else being equal, a 10% change in the value of the U.S. dollar compared to the Japanese yen would result in a corresponding change in our gross margin of approximately 1.0%; this sensitivity may increase or decrease depending on the percentage of our wafer supply that we purchase from some of our Japanese suppliers and could subject our gross profit and operating results to the potential for material fluctuations.
Item 8. Financial Statements and Supplementary Data.
The financial statements required by this item are set forth in the pages indicated in Item 15(a), and the supplementary data required by this item is included in Note 14, Selected Quarterly Information, in our notes to consolidated financial statements.
Item 9. Changes in and Disagreements with Accountants on Accounting and Financial Disclosure.
Not applicable.
Item 9A. Controls and Procedures.
Evaluation of Disclosure Controls and Procedures
Management is required to evaluate our disclosure controls and procedures, as defined in Rule 13a-15(e) under the Securities Exchange Act of 1934, as amended, or the Exchange Act. Disclosure controls and procedures are controls and other procedures designed to provide reasonable assurance that information required to be disclosed in our reports filed under the Exchange Act, such as this Annual Report on Form 10-K, is recorded, processed, summarized and reported within the time periods specified in the Securities and Exchange Commission's rules and forms. Disclosure controls and procedures include controls and procedures designed to provide reasonable assurance that such information is accumulated and communicated to our management, including our Chief Executive Officer and Chief Financial Officer as appropriate to allow timely decisions regarding required disclosure. Our disclosure controls and procedures include components of our internal control over financial reporting, which consists of control processes designed to provide reasonable assurance regarding the reliability of our financial reporting and the
33
preparation of financial statements in accordance with generally accepted accounting principles in the U.S. To the extent that components of our internal control over financial reporting are included within our disclosure controls and procedures, they are included in the scope of our periodic controls evaluation. Based on our management's evaluation (with the participation of our principal executive officer and principal financial officer), our principal executive officer and principal financial officer have concluded that our disclosure controls and procedures (as defined in Rules 13a-15(e) and 15d-15(e) under the Exchange Act) were effective as of the end of the period covered by this report.
Management’s Report on Internal Control Over Financial Reporting
Management is responsible for establishing and maintaining adequate internal control over financial reporting, as defined in Rule 13a-15(f) under the Exchange Act. Internal control over financial reporting is designed to provide reasonable assurance regarding the reliability of financial reporting and the preparation of financial statements for external reporting purposes in accordance with generally accepted accounting principles. Internal control over financial reporting includes those policies and procedures that:
• | pertain to the maintenance of records that, in reasonable detail, accurately and fairly reflect the transactions and dispositions of our assets; |
• | provide reasonable assurance that transactions are recorded as necessary to permit preparation of financial statements in accordance with generally accepted accounting principles and that receipts and expenditures are being made only in accordance with authorizations of our management and directors; and |
• | provide reasonable assurance regarding prevention or timely detection of unauthorized acquisition, use or disposition of our assets that could have a material effect on the financial statements. |
Internal control over financial reporting cannot provide absolute assurance of achieving financial reporting objectives because of its inherent limitations. Internal control over financial reporting is a process that involves human diligence and compliance and is subject to lapses in judgment and breakdowns resulting from human failures. Because of such limitations, there is a risk that material misstatements may not be prevented or detected on a timely basis by internal control over financial reporting.
Management conducted an assessment of Power Integrations' internal control over financial reporting as of December 31, 2016, based on the framework established by the Committee of Sponsoring Organization (COSO) of the Treadway Commission in Internal Control - Integrated Framework issued in 2013. Based on this assessment, management concluded that, as of December 31, 2016, our internal control over financial reporting was effective.
The effectiveness of Power Integrations' internal control over financial reporting as of December 31, 2016, has been audited by Deloitte & Touche LLP, an independent registered public accounting firm, as stated in their report which appears below.
Changes in Internal Control over Financial Reporting
There were no changes in our internal controls over financial reporting during the fourth quarter of 2016, which were identified in connection with management’s evaluation required by paragraph (d) of Rules 13a-15 and 15d-15 under the Exchange Act, that have materially affected or are reasonably likely to materially affect our internal control over financial reporting.
34
REPORT OF INDEPENDENT REGISTERED PUBLIC ACCOUNTING FIRM
To the Board of Directors and Stockholders of
Power Integrations, Inc.
San Jose, California
We have audited the internal control over financial reporting of Power Integrations, Inc. and subsidiaries (the "Company") as of December 31, 2016, based on criteria established in Internal Control - Integrated Framework (2013) issued by the Committee of Sponsoring Organizations of the Treadway Commission. The Company’s management is responsible for maintaining effective internal control over financial reporting and for its assessment of the effectiveness of internal control over financial reporting, included in the accompanying Management’s Report on Internal Control over Financial Reporting. Our responsibility is to express an opinion on the Company’s internal control over financial reporting based on our audit.
We conducted our audit in accordance with the standards of the Public Company Accounting Oversight Board (United States). Those standards require that we plan and perform the audit to obtain reasonable assurance about whether effective internal control over financial reporting was maintained in all material respects. Our audit included obtaining an understanding of internal control over financial reporting, assessing the risk that a material weakness exists, testing and evaluating the design and operating effectiveness of internal control based on the assessed risk, and performing such other procedures as we considered necessary in the circumstances. We believe that our audit provides a reasonable basis for our opinion.
A company’s internal control over financial reporting is a process designed by, or under the supervision of, the company’s principal executive and principal financial officers, or persons performing similar functions, and effected by the company’s Board of Directors, management, and other personnel to provide reasonable assurance regarding the reliability of financial reporting and the preparation of financial statements for external purposes in accordance with generally accepted accounting principles. A company’s internal control over financial reporting includes those policies and procedures that (1) pertain to the maintenance of records that, in reasonable detail, accurately and fairly reflect the transactions and dispositions of the assets of the company; (2) provide reasonable assurance that transactions are recorded as necessary to permit preparation of financial statements in accordance with generally accepted accounting principles, and that receipts and expenditures of the company are being made only in accordance with authorizations of management and directors of the company; and (3) provide reasonable assurance regarding prevention or timely detection of unauthorized acquisition, use, or disposition of the company’s assets that could have a material effect on the financial statements.
Because of the inherent limitations of internal control over financial reporting, including the possibility of collusion or improper management override of controls, material misstatements due to error or fraud may not be prevented or detected on a timely basis. Also, projections of any evaluation of the effectiveness of the internal control over financial reporting to future periods are subject to the risk that the controls may become inadequate because of changes in conditions, or that the degree of compliance with the policies or procedures may deteriorate.
In our opinion, the Company maintained, in all material respects, effective internal control over financial reporting as of December 31, 2016, based on the criteria established in Internal Control - Integrated Framework (2013) issued by the Committee of Sponsoring Organizations of the Treadway Commission.
We have also audited, in accordance with the standards of the Public Company Accounting Oversight Board (United States), the consolidated financial statements and consolidated financial statement schedule as of and for the year ended December 31, 2016 of the Company and our report dated February 8, 2017 expressed an unqualified opinion on those consolidated financial statements and consolidated financial statement schedule.
/s/ DELOITTE & TOUCHE LLP
San Jose, California
February 8, 2017
35
Item 9B. Other Information.
Compensation Matters
On February 2, 2017, the Compensation Committee of the Board of Directors of Power Integrations, Inc. (the “Company”) took the following compensation actions with respect to the Company’s chief executive officer, chief financial officer, and other “named executive officers” as defined in Rule 402 of SEC Regulation S-K (collectively, the “Officers”).
2017 Performance Based Incentive Plan
Approved the 2017 Performance Based Incentive Plan (the “2017 PSU Plan”) as follows:
Each officer, as described below, was granted performance stock units, referred to as “PSUs,” which will vest (referred to as a “payout” below) based on Company performance as against the 2017 PSU Plan’s established net revenue targets, non-GAAP operating income targets and strategic goals, each as established by the Compensation Committee. The 2017 target net revenue and non-GAAP operating income levels are intended to have difficulty in attainment levels consistent with the Company’s 2016 PSU Plan.
The portion of the performance stock units granted under the 2017 PSU Plan that will vest will be calculated independently for each of its net revenue, non-GAAP operating income and strategic goals components. “Net revenue” is as set forth in the Company’s annual report for 2017 to be filed with the Securities and Exchange Commission (“SEC”). “Non-GAAP operating income” means operating income for 2017 determined in accordance with GAAP but excluding the following items: (i) stock-based compensation expenses recorded under Accounting Standards Codification 718; (ii) amortization of acquisition-related intangible assets, and the fair-value write-up of acquired inventory; (iii) any other mergers and acquisitions related expenses; and (iv) any other adjustment made to arrive at the Company’s non-GAAP financial information as presented in the Company’s SEC filings. Further, in the event of any mergers, acquisitions or divestitures, or any patent or other litigation settlements or judgments, during the performance period, the net revenue and non-GAAP operating income targets shall be adjusted based on a revised plan approved by the Board of Directors. The strategic goals component is made up of five different strategic goals for the Company.
Weighting of the target components is as follows:
Net revenue | 40 | % |
Non-GAAP operating income | 30 | % |
Strategic goals | 30 | % |
Total | 100 | % |
Net Revenue Component of the 2017 PSU Plan:
No payout will be made under the net revenue component of the 2017 PSU Plan if the Company's 2017 actual net revenue does not exceed at least the established minimum amount of net revenue as set forth in the 2017 PSU Plan. To the extent 2017 actual net revenue is above the minimum amount of net revenue, the payout increases linearly from zero at the minimum amount of net revenue as set forth in the 2017 PSU Plan up to 100% of the net revenue component of the target when actual net revenue equals target net revenue in the 2017 PSU Plan. If 2017 actual net revenue is above the target amount of net revenue, then the payout for performance above target increases linearly from the target amount up to a maximum of 200% of the net revenue component of the target when actual net revenue equals or exceeds the established target to achieve the maximum amount payout under the net revenue component of the 2017 PSU Plan.
Non-GAAP Operating Income Component of the 2017 PSU Plan:
No payout will be made under the non-GAAP operating income component of the 2017 PSU Plan if the Company's 2017 actual non-GAAP operating income does not exceed at least the established minimum amount of non-GAAP operating income as set forth in the 2017 PSU Plan. To the extent 2017 actual non-GAAP operating income is above the minimum amount of non-GAAP operating income, the payout increases linearly from zero at the minimum amount of non-GAAP operating income as set forth in the 2017 PSU Plan up to 100% of the non-GAAP operating income component of the target when actual non-GAAP operating income equals target non-GAAP operating income in the 2017 PSU Plan. If 2017 actual non-GAAP operating income is above the target amount of non-GAAP operating income, then the payout for performance above target increases linearly from
36
the target amount up to a maximum of 200% of the non-GAAP operating income component of the target when actual non-GAAP operating income equals or exceeds the established target to achieve the maximum amount payout under the non-GAAP operating income component of the 2017 PSU Plan.
Strategic Goals Component of the 2017 PSU Plan:
Each of the five goals in the strategic goals component of the 2017 PSU Plan is assigned a percentage, which percentages range from 1% to 21%, and which collectively add up to 30%. Other than with respect to date-based goals, if the Company's 2017 actual achievement of a goal does not exceed at least the established minimum requirement for a particular goal, then no amount is earned for that goal. To the extent 2017 actual performance for a goal is better than the established minimum for the goal, then the payout increases linearly from zero at the minimum amount of performance as set forth in the 2017 PSU Plan up to 100% of the amount for that goal when actual performance equals target performance for that goal in the 2017 PSU Plan. Other than with respect to date-based goals, to the extent 2017 actual performance for a goal is better than the established target for the goal, then the payout for performance above target increasing linearly from the target amount actual performance, up to a maximum of 200% for the specific goal when actual performance equals or exceeds the established target to achieve the maximum payout under the specific goal as set forth in the 2017 PSU Plan.
2017 Target Performance Stock Units
Approved the 2017 target performance stock units for the Officers as follows:
Executive Officer | Title | 2017 Target PSUs | ||
Balu Balakrishnan | President and Chief Executive Officer | 10,000 | ||
Sandeep Nayyar | Chief Financial Officer | 3,000 | ||
Radu Barsan | Vice President, Technology | 2,500 | ||
Clifford Walker | Vice President, Corporate Development | 2,200 | ||
Raja Petrakian | Vice President, Operations | 2,200 | ||
The actual number of shares subject to the performance stock units is twice the target level shown in the table above to enable the payout of up to 200% of the target amount if the actual net revenue, non-GAAP operating income and strategic goals achievement equal or exceed the established levels to achieve the maximum amount of the 2017 PSU Plan.
2017 Restricted Stock Unit Grants
Approved restricted stock unit, referred to as RSU, grants to the following Officers:
Executive Officer | Title | 2017 RSU Grants | ||
Balu Balakrishnan | President and Chief Executive Officer | 48,000 | ||
Sandeep Nayyar | Chief Financial Officer | 10,500 | ||
Radu Barsan | Vice President, Technology | 9,000 | ||
Clifford Walker | Vice President, Corporate Development | 7,500 | ||
Raja Petrakian | Vice President, Operations | 7,500 | ||
The RSU grants will be effective on the grant date. Twenty-five percent (25%) of the RSUs vest on the one year anniversary of the vesting commencement date (as specified in the Officers' RSU award agreements), and an additional twenty-five percent (25%) of the RSUs vest annually over the next three (3) years thereafter, subject to the respective Officer's continuous service.
2017 Long Term Performance Based Incentive Plan
Approved the 2017 Long Term Performance Based Incentive Plan (“2017 PRSU Plan”) as follows:
Each officer, as described below, was granted long term performance stock units, referred to as “PRSUs,” which will vest (referred to as a “payout” below) based on Company performance as against the 2017 PRSU Plan's established 2019 net revenue target, as established by the Compensation Committee. The 2019 net revenue target level is intended to have a difficulty
37
in attainment level consistent with the Company’s 2016 PRSU Plan target net revenue level. The portion of the performance stock units that will vest will be calculated based on the Company’s 2019 net revenue and awarded in early 2020 upon approval by the Compensation Committee. “Net revenue” is as set forth in the Company’s annual report for 2019 to be filed with the SEC. Further, in the event of any mergers, acquisitions or divestitures, or any patent or other litigation settlements or judgments, during the performance period, the net revenue target shall be adjusted based on a revised plan approved by the Board of Directors.
No payout will be made in early 2020 under the 2017 PRSU Plan if the Company's 2019 actual net revenue does not exceed at least the established minimum amount of net revenue as set forth in the 2017 PRSU Plan. To the extent 2019 actual net revenue is above the minimum amount of net revenue, the payout increases linearly from zero at the minimum amount of net revenue as set forth in the 2017 PRSU Plan up to 100% of the net revenue component of the target when actual net revenue equals target net revenue in the 2017 PRSU Plan. If 2019 actual net revenue is above the target amount of net revenue, then the payout for performance above target increases linearly from the target amount up to a maximum of 200% of the net revenue component of the target when actual net revenue equals or exceeds the established target to achieve the maximum amount payout under the 2017 PRSU Plan. Except to the extent provided in the executive officer benefits agreements between the Company and each Officer, each Officer must be employed through the end of the performance period to receive stock pursuant to the PRSUs under the 2017 PRSU Plan.
2017 Target PRSUs
Approved the target 2017 PRSUs for the Officers as follows:
Executive Officer | Title | 2017 Target PRSUs | ||
Balu Balakrishnan | President and Chief Executive Officer | 16,000 | ||
Sandeep Nayyar | Chief Financial Officer | 3,500 | ||
Radu Barsan | Vice President, Technology | 3,000 | ||
Clifford Walker | Vice President, Corporate Development | 2,500 | ||
Raja Petrakian | Vice President, Operations | 2,500 | ||
The actual number of shares subject to the PRSUs is twice the target level shown in the table above to enable the payout of up to 200% of the target amount if actual net revenue equals or exceeds the established level to achieve the maximum amount of the 2017 PRSU Plan.
2017 Salaries
Approved the 2017 salaries for the Officers, to be effective March 27, 2017, as follows:
Executive Officer | Title | 2017 Salary | ||
Balu Balakrishnan | President and Chief Executive Officer | $575,000 | ||
Sandeep Nayyar | Chief Financial Officer | $350,000 | ||
Radu Barsan | Vice President, Technology | $325,000 | ||
Clifford Walker | Vice President, Corporate Development | $325,000 | ||
Raja Petrakian | Vice President, Operations | $300,000 | ||
38
PART III
Item 10. Directors, Executive Officers and Corporate Governance.
The names of our executive officers and their ages, titles and biographies as of the date hereof are incorporated by reference from Part I, Item 1, above.
The following information is included in our Notice of Annual Meeting of Stockholders and Proxy Statement to be filed within 120 days after our fiscal year end of December 31, 2016, or the Proxy Statement, and is incorporated herein by reference:
• | Information regarding our directors and any persons nominated to become a director is set forth under the caption “Proposal 1 Election of Directors.” |
• | Information regarding our audit committee and our designated “audit committee financial expert” is set forth under the captions “Information Regarding the Board and its Committees” and “Audit Committee” under “Proposal 1 Election of Directors” and “Report of the Audit Committee of the Board.” |
• | Information on our code of business conduct and ethics for directors, officers and employees is set forth under the caption “Code of Business Conduct and Ethics” under “Proposal 1 Election of Directors.” |
• | Information regarding Section 16(a) beneficial ownership reporting compliance is set forth under the caption “Section 16(a) Beneficial Ownership Reporting Compliance.” |
• | Information regarding procedures by which stockholders may recommend nominees to our board of directors is set forth under the caption “Nominating and Governance Committee” under “Proposal 1 Election of Directors.” |
Item 11. Executive Compensation.
Information regarding compensation of our named executive officers is set forth under the caption “Compensation of Executive Officers” in the Proxy Statement, which information is incorporated herein by reference.
Information regarding compensation of our directors is set forth under the caption “Compensation of Directors” in the Proxy Statement, which information is incorporated herein by reference.
Information relating to compensation policies and practices as they relate to risk management is set forth under the caption “Compensation Policies and Practices as They Relate to Risk Management” under “Proposal 1 Election of Directors” in the Proxy Statement, which information is incorporated herein by reference.
Information regarding compensation committee interlocks is set forth under the caption "Compensation Committee Interlocks and Insider Participation" in the Proxy Statement, which information is incorporated herein by reference.
The Compensation Committee Report is set forth under the caption “Compensation Committee Report” in the Proxy Statement, which report is incorporated herein by reference.
Item 12. Security Ownership of Certain Beneficial Owners and Management and Related Stockholder Matters.
Information regarding security ownership of certain beneficial owners, directors and executive officers is set forth under the caption “Security Ownership of Certain Beneficial Owners and Management” in the Proxy Statement, which information is incorporated herein by reference.
Information regarding our equity compensation plans, including both stockholder approved plans and non-stockholder approved plans, is set forth under the caption “Equity Compensation Plan Information” in the Proxy Statement, which information is incorporated herein by reference.
39
Item 13. Certain Relationships and Related Transactions, and Director Independence.
Information regarding certain relationships and related transactions is set forth under the caption “Certain Relationships and Related Transactions” in the Proxy Statement, which information is incorporated herein by reference.
Information regarding director independence is set forth under the caption “Proposal 1 - Election of Directors” in the Proxy Statement, which information is incorporated herein by reference.
Item 14. Principal Accounting Fees and Services.
Information regarding principal auditor fees and services is set forth under “Principal Accountant Fees and Services” in the Proposal with the caption “Ratification of Selection of Independent Registered Public Accounting Firm” in the Proxy Statement, which information is incorporated herein by reference.
40
PART IV
Item 15. Exhibits, Financial Statement Schedules
(a) The following documents are filed as part of this Form:
1. Financial Statements
Page | |
2. Financial Statement Schedules
Schedule II: Valuation and Qualifying Accounts.
All other schedules are omitted because they are not applicable or the required information is shown in the consolidated financial statements or notes thereto.
3. Exhibits
See Index to Exhibits at the end of this Report, which is incorporated herein by reference. The Exhibits listed in the accompanying Index to Exhibits are filed as part of this report.
41
REPORT OF INDEPENDENT REGISTERED PUBLIC ACCOUNTING FIRM
To the Board of Directors and Stockholders of
Power Integrations, Inc.
San Jose, California
We have audited the accompanying consolidated balance sheets of Power Integrations, Inc. and subsidiaries (the “Company”) as of December 31, 2016 and 2015, and the related consolidated statements of income, comprehensive income, stockholders’ equity, and cash flows for each of the three years in the period ended December 31, 2016. Our audits also included the consolidated financial statement schedule listed in the Index at Item 15. These consolidated financial statements and consolidated financial statement schedule are the responsibility of the Company’s management. Our responsibility is to express an opinion on the consolidated financial statements and consolidated financial statement schedule based on our audits.
We conducted our audits in accordance with the standards of the Public Company Accounting Oversight Board (United States). Those standards require that we plan and perform the audit to obtain reasonable assurance about whether the consolidated financial statements are free of material misstatement. An audit includes examining, on a test basis, evidence supporting the amounts and disclosures in the consolidated financial statements. An audit also includes assessing the accounting principles used and significant estimates made by management, as well as evaluating the overall consolidated financial statement presentation. We believe that our audits provide a reasonable basis for our opinion.
In our opinion, such consolidated financial statements present fairly, in all material respects, the financial position of Power Integrations, Inc. and subsidiaries at December 31, 2016 and 2015, and the results of their operations and their cash flows for each of the three years in the period ended December 31, 2016, in conformity with accounting principles generally accepted in the United States of America. Also, in our opinion, such consolidated financial statement schedule, when considered in relation to the basic consolidated financial statements taken as a whole, presents fairly, in all material respects, the information set forth therein.
We have also audited, in accordance with the standards of the Public Company Accounting Oversight Board (United States), the Company's internal control over financial reporting as of December 31, 2016 based on the criteria established in Internal Control-Integrated Framework (2013) issued by the Committee of Sponsoring Organizations of the Treadway Commission, and our report dated February 8, 2017 expressed an unqualified opinion on the Company’s internal control over financial reporting.
/s/ DELOITTE & TOUCHE LLP
San Jose, California
February 8, 2017
42
POWER INTEGRATIONS, INC.
CONSOLIDATED BALANCE SHEETS
December 31, | December 31, | |||||
(in thousands, except share amounts and par value) | 2016 | 2015 | ||||
ASSETS | ||||||
CURRENT ASSETS: | ||||||
Cash and cash equivalents | $ | 62,134 | $ | 90,092 | ||
Short-term marketable securities | 188,323 | 83,769 | ||||
Accounts receivable, net of allowance of $525 and $318 in 2016 and 2015, respectively | 6,961 | 7,818 | ||||
Inventories | 52,564 | 51,934 | ||||
Prepaid expenses and other current assets | 8,520 | 6,790 | ||||
Total current assets | 318,502 | 240,403 | ||||
PROPERTY AND EQUIPMENT, net | 95,296 | 99,381 | ||||
INTANGIBLE ASSETS, net | 31,502 | 38,165 | ||||
GOODWILL | 91,849 | 91,849 | ||||
DEFERRED TAX ASSETS | 12,032 | 11,843 | ||||
OTHER ASSETS | 6,157 | 5,896 | ||||
Total assets | $ | 555,338 | $ | 487,537 | ||
LIABILITIES AND STOCKHOLDERS’ EQUITY | ||||||
CURRENT LIABILITIES: | ||||||
Accounts payable | $ | 29,727 | $ | 21,660 | ||
Accrued payroll and related expenses | 10,756 | 9,327 | ||||
Taxes payable | 729 | 3,620 | ||||
Deferred income on sales to distributors | 16,207 | 15,101 | ||||
Other accrued liabilities | 2,434 | 2,285 | ||||
Total current liabilities | 59,853 | 51,993 | ||||
LONG-TERM INCOME TAXES PAYABLE | 2,639 | 2,511 | ||||
DEFERRED TAX LIABILITIES | 820 | 1,291 | ||||
OTHER LIABILITIES | 3,921 | 3,123 | ||||
Total liabilities | 67,233 | 58,918 | ||||
COMMITMENTS AND CONTINGENCIES (NOTES 8, 9 and 10) | ||||||
STOCKHOLDERS’ EQUITY: | ||||||
Common stock, $0.001 par value | ||||||
Authorized - 140,000,000 shares | ||||||
Outstanding - 29,249,635 and 28,652,178 shares in 2016 and 2015, respectively | 28 | 28 | ||||
Additional paid-in capital | 172,875 | 145,366 | ||||
Accumulated other comprehensive loss | (2,710 | ) | (1,851 | ) | ||
Retained earnings | 317,912 | 285,076 | ||||
Total stockholders’ equity | 488,105 | 428,619 | ||||
Total liabilities and stockholders’ equity | $ | 555,338 | $ | 487,537 | ||
The accompanying notes are an integral part of these consolidated financial statements.
43
POWER INTEGRATIONS, INC.
CONSOLIDATED STATEMENTS OF INCOME
Year Ended December 31, | |||||||||||
(in thousands, except per share amounts) | 2016 | 2015 | 2014 | ||||||||
NET REVENUES | $ | 387,393 | $ | 343,989 | $ | 348,797 | |||||
COST OF REVENUES | 196,232 | 170,602 | 159,227 | ||||||||
GROSS PROFIT | 191,161 | 173,387 | 189,570 | ||||||||
OPERATING EXPENSES: | |||||||||||
Research and development | 62,310 | 57,549 | 54,981 | ||||||||
Sales and marketing | 47,978 | 46,816 | 47,796 | ||||||||
General and administrative | 33,029 | 30,029 | 30,997 | ||||||||
Total operating expenses | 143,317 | 134,394 | 133,774 | ||||||||
INCOME FROM OPERATIONS | 47,844 | 38,993 | 55,796 | ||||||||
OTHER INCOME | 1,078 | 425 | 1,018 | ||||||||
INCOME BEFORE INCOME TAXES | 48,922 | 39,418 | 56,814 | ||||||||
PROVISION FOR (BENEFIT FROM) INCOME TAXES | 1,032 | 271 | (2,730 | ) | |||||||
NET INCOME | $ | 47,890 | $ | 39,147 | $ | 59,544 | |||||
EARNINGS PER SHARE: | |||||||||||
Basic | $ | 1.66 | $ | 1.35 | $ | 1.99 | |||||
Diluted | $ | 1.62 | $ | 1.32 | $ | 1.93 | |||||
SHARES USED IN PER SHARE CALCULATION: | |||||||||||
Basic | 28,925 | 29,001 | 29,976 | ||||||||
Diluted | 29,619 | 29,696 | 30,829 | ||||||||
The accompanying notes are an integral part of these consolidated financial statements.
44
POWER INTEGRATIONS, INC.
CONSOLIDATED STATEMENTS OF COMPREHENSIVE INCOME
Year Ended December 31, | |||||||||||
(in thousands) | 2016 | 2015 | 2014 | ||||||||
Net income | $ | 47,890 | $ | 39,147 | $ | 59,544 | |||||
Other comprehensive income (loss), net of tax | |||||||||||
Foreign currency translation adjustments, net of $0 tax in 2016, 2015 and 2014 | (384 | ) | (191 | ) | (79 | ) | |||||
Unrealized loss on marketable securities, net of $0 tax in 2016, 2015 and 2014 | (123 | ) | (180 | ) | (127 | ) | |||||
Unrealized actuarial loss on pension benefits, net of tax of $98, $96 and $128 in 2016, 2015 and 2014, respectively | (352 | ) | (344 | ) | (460 | ) | |||||
Total other comprehensive loss | (859 | ) | (715 | ) | (666 | ) | |||||
Total comprehensive income | $ | 47,031 | $ | 38,432 | $ | 58,878 | |||||
The accompanying notes are an integral part of these consolidated financial statements.
45
POWER INTEGRATIONS, INC.
CONSOLIDATED STATEMENTS OF STOCKHOLDERS’ EQUITY
Common Stock | Additional Paid-In | Accumulated Other Comprehensive | Retained | Total Stockholders’ | |||||||||||||
(in thousands) | Shares | Amount | Capital | Loss | Earnings | Equity | |||||||||||
BALANCE AT JANUARY 1, 2014 | 30,022 | $ | 30 | $ | 223,660 | $ | (470 | ) | $ | 213,466 | $ | 436,686 | |||||
Issuance of common stock under employee stock option and stock award plans | 697 | — | 9,571 | — | — | 9,571 | |||||||||||
Repurchase of common stock | (1,603 | ) | (1 | ) | (80,760 | ) | — | — | (80,761 | ) | |||||||
Issuance of common stock under employee stock purchase plan | 92 | — | 4,284 | — | — | 4,284 | |||||||||||
Income tax benefits from employee stock plans | — | — | 815 | — | — | 815 | |||||||||||
Stock-based compensation expense related to employee stock options and awards | — | — | 12,983 | — | — | 12,983 | |||||||||||
Stock-based compensation expense related to employee stock purchases | — | — | 1,385 | — | — | 1,385 | |||||||||||
Payment of dividends to stockholders | — | — | — | — | (13,165 | ) | (13,165 | ) | |||||||||
Unrealized actuarial loss on pension benefits | — | — | — | (460 | ) | — | (460 | ) | |||||||||
Unrealized gain on marketable securities | — | — | — | (127 | ) | — | (127 | ) | |||||||||
Foreign currency translation adjustment | — | — | — | (79 | ) | — | (79 | ) | |||||||||
Net income | — | — | — | — | 59,544 | 59,544 | |||||||||||
BALANCE AT DECEMBER 31, 2014 | 29,208 | 29 | 171,938 | (1,136 | ) | 259,845 | 430,676 | ||||||||||
Issuance of common stock under employee stock option and stock award plans | 578 | — | 8,133 | — | — | 8,133 | |||||||||||
Repurchase of common stock | (1,250 | ) | (1 | ) | (53,730 | ) | — | — | (53,731 | ) | |||||||
Issuance of common stock under employee stock purchase plan | 117 | — | 4,447 | — | — | 4,447 | |||||||||||
Income tax shortfall from employee stock plans | — | — | (189 | ) | — | — | (189 | ) | |||||||||
Stock-based compensation expense related to employee stock options and awards | — | — | 13,562 | — | — | 13,562 | |||||||||||
Stock-based compensation expense related to employee stock purchases | — | — | 1,205 | — | — | 1,205 | |||||||||||
Payment of dividends to stockholders | — | — | — | — | (13,916 | ) | (13,916 | ) | |||||||||
Unrealized actuarial loss on pension benefits | — | — | — | (344 | ) | — | (344 | ) | |||||||||
Unrealized loss on marketable securities | — | — | — | (180 | ) | — | (180 | ) | |||||||||
Foreign currency translation adjustment | — | — | — | (191 | ) | — | (191 | ) | |||||||||
Net income | — | — | — | — | 39,147 | 39,147 | |||||||||||
BALANCE AT DECEMBER 31, 2015 | 28,653 | 28 | 145,366 | (1,851 | ) | 285,076 | 428,619 | ||||||||||
Issuance of common stock under employee stock option and stock award plans | 615 | — | 8,479 | — | — | 8,479 | |||||||||||
Repurchase of common stock | (146 | ) | — | (6,435 | ) | — | — | (6,435 | ) | ||||||||
Issuance of common stock under employee stock purchase plan | 128 | — | 4,580 | — | — | 4,580 | |||||||||||
Stock-based compensation expense related to employee stock awards | — | — | 19,599 | — | — | 19,599 | |||||||||||
Stock-based compensation expense related to employee stock purchases | — | — | 1,286 | — | — | 1,286 | |||||||||||
Payment of dividends to stockholders | — | — | — | — | (15,054 | ) | (15,054 | ) | |||||||||
Unrealized actuarial loss on pension benefits | — | — | — | (352 | ) | — | (352 | ) | |||||||||
Unrealized loss on marketable securities | — | — | — | (123 | ) | — | (123 | ) | |||||||||
Foreign currency translation adjustment | — | — | — | (384 | ) | — | (384 | ) | |||||||||
Net income | — | — | — | — | 47,890 | 47,890 | |||||||||||
BALANCE AT DECEMBER 31, 2016 | 29,250 | $ | 28 | $ | 172,875 | $ | (2,710 | ) | $ | 317,912 | $ | 488,105 | |||||
The accompanying notes are an integral part of these consolidated financial statements.
46
POWER INTEGRATIONS, INC.
CONSOLIDATED STATEMENTS OF CASH FLOWS
Year Ended December 31, | |||||||||||
(in thousands) | 2016 | 2015 | 2014 | ||||||||
CASH FLOWS FROM OPERATING ACTIVITIES: | |||||||||||
Net income | $ | 47,890 | $ | 39,147 | $ | 59,544 | |||||
Adjustments to reconcile net income to net cash provided by operating activities: | |||||||||||
Depreciation | 16,812 | 16,464 | 15,884 | ||||||||
Amortization of intangibles | 6,663 | 7,039 | 6,072 | ||||||||
Loss on disposal of property and equipment | 332 | 361 | 250 | ||||||||
Stock-based compensation expense | 20,885 | 14,767 | 14,282 | ||||||||
Amortization of premium on marketable securities | 555 | 1,063 | 1,694 | ||||||||
Deferred income taxes | (660 | ) | (5,416 | ) | 157 | ||||||
Increase in accounts receivable allowances | 207 | 127 | 70 | ||||||||
Excess tax benefit from employee stock plans | — | — | (437 | ) | |||||||
Tax (shortfall) benefit associated with employee stock plans | — | (189 | ) | 815 | |||||||
Change in operating assets and liabilities: | |||||||||||
Accounts receivable | 650 | 4,131 | 2,133 | ||||||||
Inventories | (630 | ) | 13,500 | (21,703 | ) | ||||||
Prepaid expenses and other assets | (2,499 | ) | 3,391 | 8,211 | |||||||
Accounts payable | 7,714 | (2,000 | ) | 2,337 | |||||||
Taxes payable and accrued liabilities | (1,124 | ) | (76 | ) | (3,242 | ) | |||||
Deferred income on sales to distributors | 1,106 | (122 | ) | (505 | ) | ||||||
Net cash provided by operating activities | 97,901 | 92,187 | 85,562 | ||||||||
CASH FLOWS FROM INVESTING ACTIVITIES: | |||||||||||
Purchases of property and equipment | (12,198 | ) | (11,359 | ) | (23,071 | ) | |||||
Other assets | — | — | (1,261 | ) | |||||||
Payment for purchase of building (Note 11) | — | (10,389 | ) | — | |||||||
Payment for acquisition, net of cash acquired (Note 11) | — | (15,549 | ) | — | |||||||
Loans to third parties (Notes 11) | — | — | (6,600 | ) | |||||||
Purchases of marketable securities | (188,654 | ) | (29,748 | ) | (45,269 | ) | |||||
Proceeds from sales and maturities of marketable securities | 83,423 | 59,309 | 38,052 | ||||||||
Net cash used in investing activities | (117,429 | ) | (7,736 | ) | (38,149 | ) | |||||
CASH FLOWS FROM FINANCING ACTIVITIES: | |||||||||||
Issuance of common stock under employee stock plans | 13,059 | 12,580 | 13,855 | ||||||||
Repurchase of common stock | (6,435 | ) | (53,731 | ) | (80,760 | ) | |||||
Payments of dividends to stockholders | (15,054 | ) | (13,916 | ) | (13,165 | ) | |||||
Excess tax benefit from employee stock plans | — | — | 437 | ||||||||
Net cash used in financing activities | (8,430 | ) | (55,067 | ) | (79,633 | ) | |||||
NET INCREASE (DECREASE) IN CASH AND CASH EQUIVALENTS | (27,958 | ) | 29,384 | (32,220 | ) | ||||||
CASH AND CASH EQUIVALENTS AT BEGINNING OF PERIOD | 90,092 | 60,708 | 92,928 | ||||||||
CASH AND CASH EQUIVALENTS AT END OF PERIOD | $ | 62,134 | $ | 90,092 | $ | 60,708 | |||||
SUPPLEMENTAL DISCLOSURE OF NON-CASH INVESTING AND FINANCING ACTIVITIES: | |||||||||||
Unpaid property and equipment | $ | 1,825 | $ | 1,472 | $ | 1,733 | |||||
Loan applied to CamSemi purchase price (Note 11) | $ | — | $ | 6,600 | $ | — | |||||
SUPPLEMENTAL DISCLOSURE OF CASH FLOW INFORMATION: | |||||||||||
Cash paid (refund) for income taxes, net of refunds (Note 8) | $ | 6,613 | $ | 473 | $ | (3,121 | ) | ||||
The accompanying notes are an integral part of these consolidated financial statements.
47
POWER INTEGRATIONS, INC.
NOTES TO CONSOLIDATED FINANCIAL STATEMENTS
1. THE COMPANY:
Power Integrations, Inc. (“Power Integrations” or the “Company”), incorporated in California on March 25, 1988, and reincorporated in Delaware in December 1997, designs, develops, manufactures and markets analog and mixed-signal integrated circuits (ICs) and other electronic components and circuitry used in high-voltage power conversion. The Company’s products are used in power converters that convert electricity from a high-voltage source (typically 48 volts or higher) to the type of power required for a specified downstream use. A large percentage of the Company’s products are ICs used in AC-DC power supplies in a wide variety of end products, primarily in the consumer, communications, computer and industrial markets. The Company also offers IGBT drivers used to operate arrays of high-voltage, high-power transistors known as IGBT modules, which are used for power conversion in high-power applications such as industrial motors, solar- and wind-power systems, electric vehicles and high-voltage DC transmission systems.
2. SUMMARY OF SIGNIFICANT ACCOUNTING POLICIES:
Principles of Consolidation
The consolidated financial statements include the accounts of the Company and its wholly owned subsidiaries after elimination of all intercompany transactions and balances.
Estimates
The preparation of financial statements in conformity with U.S. GAAP requires management to make estimates and assumptions that affect the reported amounts of assets and liabilities and disclosures of contingent assets and liabilities at the date of the financial statements and the reported amounts of revenues and expenses during the reporting period. Actual results could differ from those estimates. On an ongoing basis, the Company evaluates its estimates, including those related to revenue recognition and allowances for receivables and inventories. These estimates are based on historical facts and various other factors, which the Company believes to be reasonable at the time the estimates are made. However, as the effects of future events cannot be determined with precision, actual results could differ significantly from management’s estimates.
Cash and Cash Equivalents
The Company considers cash invested in highly liquid financial instruments with maturities of three months or less at the date of purchase to be cash equivalents.
Marketable Securities
The Company generally holds securities until maturity; however, they may be sold under certain circumstances including, but not limited to, when necessary for the funding of acquisitions and other strategic investments. As a result the Company classifies its investment portfolio as available-for-sale. The Company classifies all investments with a maturity date greater than three months at the date of purchase as short-term marketable securities in its Consolidated Balance Sheet. As of December 31, 2016, and December 31, 2015, the Company’s marketable securities consisted primarily of commercial paper, corporate bonds and other high-quality commercial securities. The weighted average interest rate of investments at December 31, 2016 and December 31, 2015, was approximately 1.23% and 0.84%, respectively.
48
Amortized cost and estimated fair market value of investments classified as available-for-sale (excluding cash equivalents) at December 31, 2016, were as follows:
Amortized | Gross Unrealized | Estimated Fair | ||||||||||||
(in thousands) | Cost | Gains | Losses | Market Value | ||||||||||
Investments due in less than 3 months: | ||||||||||||||
Commercial paper | $ | 36,996 | $ | — | $ | — | $ | 36,996 | ||||||
Corporate securities | 9,342 | 2 | (2 | ) | 9,342 | |||||||||
Total | 46,338 | 2 | (2 | ) | 46,338 | |||||||||
Investments due in 4-12 months: | ||||||||||||||
Commercial paper | 19,186 | — | — | 19,186 | ||||||||||
Corporate securities | 59,714 | 15 | (76 | ) | 59,653 | |||||||||
Total | 78,900 | 15 | (76 | ) | 78,839 | |||||||||
Investments due 12 months or greater: | ||||||||||||||
Corporate securities | 63,305 | 21 | (180 | ) | 63,146 | |||||||||
Total | 63,305 | 21 | (180 | ) | 63,146 | |||||||||
Total investment securities | $ | 188,543 | $ | 38 | $ | (258 | ) | $ | 188,323 | |||||
Amortized cost and estimated fair market value of investments classified as available-for-sale (excluding cash equivalents) at December 31, 2015, were as follows:
Amortized | Gross Unrealized | Estimated Fair | ||||||||||||
(in thousands) | Cost | Gains | Losses | Market Value | ||||||||||
Investments due in less than 3 months: | ||||||||||||||
Corporate securities | $ | 38,586 | $ | 7 | $ | (10 | ) | $ | 38,583 | |||||
Total | 38,586 | 7 | (10 | ) | 38,583 | |||||||||
Investments due in 4-12 months: | ||||||||||||||
Corporate securities | 33,654 | 1 | (36 | ) | 33,619 | |||||||||
Total | 33,654 | 1 | (36 | ) | 33,619 | |||||||||
Investments due between 12 months or greater: | ||||||||||||||
Corporate securities | 11,626 | — | (59 | ) | 11,567 | |||||||||
Total | 11,626 | — | (59 | ) | 11,567 | |||||||||
Total investment securities | $ | 83,866 | $ | 8 | $ | (105 | ) | $ | 83,769 | |||||
As of December 31, 2016, and 2015, there were no individual securities that had been in a continuous loss position for 12 months or longer.
Inventories
Inventories (which consist of costs associated with the purchases of wafers from domestic and offshore foundries and of packaged components from offshore assembly manufacturers, as well as internal labor and overhead associated with the testing of both wafers and packaged components) are stated at the lower of cost (first-in, first-out) or market. Provisions, when required, are made to reduce excess and obsolete inventories to their estimated net realizable values. Inventories consist of the following:
(in thousands) | December 31, 2016 | December 31, 2015 | |||||
Raw materials | $ | 14,610 | $ | 19,090 | |||
Work-in-process | 15,194 | 12,770 | |||||
Finished goods | 22,760 | 20,074 | |||||
Total | $ | 52,564 | $ | 51,934 | |||
49
Additional Components of the Company’s Consolidated Balance Sheet
Accounts receivable:
(in thousands) | December 31, 2016 | December 31, 2015 | |||||
Accounts receivable trade | $ | 46,849 | $ | 43,622 | |||
Accrued ship and debit and rebate claims | (39,363 | ) | (35,486 | ) | |||
Allowance for doubtful accounts | (525 | ) | (318 | ) | |||
Total | $ | 6,961 | $ | 7,818 | |||
Prepaid expenses and other current assets:
(in thousands) | December 31, 2016 | December 31, 2015 | |||||
Prepaid legal fees | $ | 212 | $ | 2,023 | |||
Advance to suppliers | 69 | 324 | |||||
Prepaid income tax | 2,431 | 309 | |||||
Prepaid maintenance agreements | 1,399 | 736 | |||||
Interest receivable | 743 | 519 | |||||
Other | 3,666 | 2,879 | |||||
Total | $ | 8,520 | $ | 6,790 | |||
Property and Equipment
Property and equipment consist of the following:
(in thousands) | December 31, 2016 | December 31, 2015 | |||||
Land | $ | 20,288 | $ | 20,288 | |||
Construction-in-progress | 6,880 | 2,298 | |||||
Building and improvements | 52,156 | 51,941 | |||||
Machinery and equipment | 132,162 | 128,342 | |||||
Computer software and hardware and office furniture and fixtures | 45,951 | 43,383 | |||||
257,437 | 246,252 | ||||||
Accumulated depreciation | (162,141 | ) | (146,871 | ) | |||
Total | $ | 95,296 | $ | 99,381 | |||
Depreciation expense for property and equipment for fiscal years ended December 31, 2016, 2015 and 2014, was approximately $16.8 million, $16.5 million and $15.9 million, respectively, and was determined using the straight-line method over the following useful lives:
Building and improvements | 4-40 years |
Machinery and equipment | 2-8 years |
Computer software and hardware and office furniture and fixtures | 4-7 years |
Total property and equipment (excluding accumulated depreciation) located in the United States at December 31, 2016, 2015 and 2014, was approximately $155.1 million, $150.1 million and $140.0 million, respectively. In each of 2016 and 2015, approximately 12% of total property and equipment (excluding accumulated depreciation) was held in Thailand by one of the Company’s subcontractors. In 2014 approximately 13% of total property and equipment was held in Thailand by one of the Company’s subcontractors.
50
Accumulated Other Comprehensive Loss
Changes in accumulated other comprehensive income (loss) for the three years ended December 31, 2016:
(in thousands) | Unrealized Gains and Losses on Available-for-Sale Securities | Defined Benefit Pension Items | Foreign Currency Items | Total | |||||||||||
Balance at January 1, 2014 | $ | 210 | $ | (780 | ) | $ | 100 | $ | (470 | ) | |||||
Other comprehensive income (loss) before reclassifications | (127 | ) | (538 | ) | (79 | ) | (744 | ) | |||||||
Amounts reclassified from accumulated other comprehensive income (loss) | — | 78 | (1) | — | 78 | ||||||||||
Other comprehensive income loss | (127 | ) | (460 | ) | (79 | ) | (666 | ) | |||||||
Balance at December 31, 2014 | 83 | (1,240 | ) | 21 | (1,136 | ) | |||||||||
Other comprehensive income (loss) before reclassifications | (180 | ) | (469 | ) | (191 | ) | (840 | ) | |||||||
Amounts reclassified from accumulated other comprehensive income (loss) | — | 125 | (1) | — | 125 | ||||||||||
Other comprehensive loss | (180 | ) | (344 | ) | (191 | ) | (715 | ) | |||||||
Balance at December 31, 2015 | (97 | ) | (1,584 | ) | (170 | ) | (1,851 | ) | |||||||
Other comprehensive income (loss) before reclassifications | (123 | ) | (505 | ) | (384 | ) | (1,012 | ) | |||||||
Amounts reclassified from accumulated other comprehensive income (loss) | — | 153 | (1) | — | 153 | ||||||||||
Other comprehensive loss | (123 | ) | (352 | ) | (384 | ) | (859 | ) | |||||||
Balance at December 31, 2016 | $ | (220 | ) | $ | (1,936 | ) | $ | (554 | ) | $ | (2,710 | ) | |||
_______________
(1) This component of accumulated other comprehensive income (loss) is included in the computation of net periodic pension cost for the years ended December 31, 2016, 2015 and 2014.
Business Combinations
The purchase price of an acquisition is allocated to the underlying assets acquired and liabilities assumed based upon their estimated fair values at the date of acquisition. To the extent the purchase price exceeds the fair value of the net identifiable tangible and intangible assets acquired and liabilities assumed, such excess is allocated to goodwill. The Company determines the estimated fair values after review and consideration of relevant information, including discounted cash flows, quoted market prices and estimates made by management. The Company adjusts the preliminary purchase price allocation, as necessary, during the measurement period of up to one year after the acquisition closing date as it obtains more information as to facts and circumstances existing at the acquisition date impacting asset valuations and liabilities assumed. Acquisition-related costs are recognized separately from the acquisition and are expensed as incurred.
Goodwill and Intangible Assets
Goodwill and the Company's domain name are evaluated in accordance with ASC 350-10, Goodwill and Other Intangible Assets, and an impairment analysis is conducted on an annual basis, or sooner if indicators exist for a potential impairment.
In accordance with ASC 360-10, Accounting for the Impairment or Disposal of Long-Lived Assets, long-lived assets, such as property and equipment and intangible assets, are reviewed for impairment whenever events or changes in circumstances indicate that the carrying amount of an asset may not be recoverable. Recoverability of assets to be held and used is measured by a comparison of the carrying amount of an asset to estimated undiscounted future cash flows expected to be generated by the asset. If the carrying amount of an asset exceeds its estimated future cash flows, an impairment charge is recognized by the amount by which the carrying amount of the asset exceeds the fair value of the asset.
51
Employee Benefits Plan
The Company sponsors a 401(k) tax-deferred savings plan for all employees in the United States who meet certain eligibility requirements. Participants may contribute up to the amount allowable as a deduction for federal income tax purposes. The Company is not required to contribute; however, the Company contributes a certain percentage of employee annual salaries on a discretionary basis, not to exceed an established threshold. In each of 2016, 2015 and 2014, the Company provided for a contribution of approximately $1.1 million.
Retirement Benefit Obligations (Pension)
The Company recognizes the over-funded or under-funded status of a defined benefit pension or post-retirement plan as an asset or liability in the accompanying consolidated balance sheets. Actuarial gains and losses are recorded in accumulated other comprehensive loss, a component of stockholders’ equity, and are amortized as a component of net periodic cost over the remaining estimated service period of participants.
Revenue Recognition
Product revenues consist of sales to original equipment manufacturers (OEMs), merchant power supply manufacturers and distributors. Approximately 75% of the Company’s net product sales were made to distributors in 2016. The Company applies the provisions of ASC 605-10, Revenue Recognition, and all related appropriate guidance. Revenue is recognized when all of the following criteria have been met: (1) persuasive evidence of an arrangement exists, (2) delivery has occurred, (3) the price is fixed or determinable, and (4) collectability is reasonably assured. Customer purchase orders are generally used to determine the existence of an arrangement. Delivery is considered to have occurred when title and risk of loss have transferred to the Company’s customer. The Company evaluates whether the price is fixed or determinable based on the payment terms associated with the transaction and whether the sales price is subject to refund or adjustment. With respect to collectability, the Company performs credit checks for new customers and performs ongoing evaluations of its existing customers’ financial condition and requires letters of credit whenever deemed necessary.
Sales to international OEMs and merchant power supply manufacturers for shipments from the Company’s facility outside of the United States are pursuant to “EX Works” (EXW) shipping terms, meaning that title to the product transfers to the customer upon shipment from the Company’s foreign warehouse. Sales to international OEM customers and merchant power supply manufacturers that are shipped from the Company’s facility in California are pursuant to “delivered at frontier” (DAF) shipping terms. As such, title to the product passes to the customer when the shipment reaches the destination country and revenue is recognized upon the arrival of the product in that country. Shipments to OEMs and merchant power supply manufacturers in the Americas are pursuant to “free on board” (FOB) point of origin shipping terms meaning that title is passed to the customer upon shipment. Revenue is recognized upon title transfer for sales to OEMs and merchant power supply manufacturers, assuming all other criteria for revenue recognition are met.
Sales to most of the Company's distributors are made under terms allowing certain price adjustments and rights of return on the Company's products held by its distributors. As a result of these rights, the Company defers the recognition of revenue and the costs of revenues derived from these sales until the Company's distributors report that they have sold the Company's products to their customers. The Company's recognition of such distributor revenue is based on point of sale reports received from the distributors, at which time the price is no longer subject to adjustment and is fixed, and the products are no longer subject to return to the Company except pursuant to warranty terms. The gross profit that is deferred as a result of this policy is reflected as “deferred income on sales to distributors” in the accompanying consolidated balance sheets. The total deferred revenue as of December 31, 2016, and December 31, 2015, was approximately $28.1 million and $25.7 million, respectively. The total deferred cost as of December 31, 2016, and December 31, 2015, was approximately $11.9 million and $10.6 million, respectively.
Frequently, distributors need to sell at a price lower than the standard distribution price in order to win business. At or soon after the distributor invoices its customer, the distributor submits a “ship and debit” price adjustment claim to the Company to adjust the distributor's cost from the standard price to the pre-approved lower price. After verification by the Company, a credit memo is issued to the distributor for the ship and debit claim. The Company maintains a reserve for unprocessed claims and future ship and debit price adjustments. The reserves appear as a reduction to accounts receivable and deferred income on sales to distributors in the Company's accompanying consolidated balance sheets. To the extent future ship and debit claims significantly
52
exceed amounts estimated, there could be a material impact on the deferred revenue and deferred margin ultimately recognized. To evaluate the adequacy of its reserves, the Company analyzes historical ship and debit payments and levels of inventory in the distributor channels.
Sales to certain distributors of the Company are made under terms that do not include rights of return or price concessions after the product is shipped to the distributor. Accordingly, product revenue is recognized upon shipment and title transfer assuming all other revenue recognition criteria are met.
Foreign Currency Risk and Foreign Currency Translation
As of December 31, 2016, the Company’s primary transactional currency was U.S. dollars; in addition, the Company holds cash in Swiss francs and euros to fund the operations of the Company’s Swiss subsidiary. The foreign exchange rate fluctuation between the U.S. dollar versus the Swiss franc and euro is recorded in “other income” in the consolidated statements of income.
Gains and losses arising from the remeasurement of non-functional currency balances are recorded in ''other income'' in the accompanying consolidated statements of income. For the years ended December 31, 2016, 2015 and 2014 the Company realized foreign exchange transaction gains (losses) of $(0.1) million, $(0.5) million and $0.1 million, respectively.
The functional currencies of the Company’s other subsidiaries are the local currencies. Accordingly, all assets and liabilities are translated into U.S. dollars at the current exchange rates as of the applicable balance sheet date. Revenues and expenses are translated at the average exchange rate prevailing during the period. Cumulative gains and losses from the translation of the foreign subsidiaries’ financial statements have been included in stockholders’ equity.
Warranty
The Company generally warrants that its products will substantially conform to the published specifications for 12 months from the date of shipment. The Company’s liability is limited to either a credit equal to the purchase price or replacement of the defective part. Returns under warranty have historically been immaterial, and as a result, the Company does not record a specific warranty reserve.
Advertising
Advertising costs are expensed as incurred. Advertising costs amounted to $1.3 million, $1.1 million, and $1.5 million, in 2016, 2015 and 2014, respectively.
Research and Development
Research and development costs are expensed as incurred.
Income Taxes
Income tax expense is an estimate of current income taxes payable or refundable in the current fiscal year based on reported income before income taxes. Deferred income taxes reflect the effect of temporary differences and carry-forwards that are recognized for financial reporting and income tax purposes.
The Company accounts for income taxes under the provisions of ASC 740, Income Taxes. Under the provisions of ASC 740, deferred tax assets and liabilities are recognized based on the differences between the financial statement carrying amounts of existing assets and liabilities and their respective tax bases, utilizing the tax rates that are expected to apply to taxable income in the years in which those temporary differences are expected to be recovered or settled. The Company recognizes valuation allowances to reduce any deferred tax assets to the amount that it estimates will more likely than not be realized based on available evidence and management’s judgment. The Company limits the deferred tax assets recognized related to certain officers’ compensation to amounts that it estimates will be deductible in future periods based upon Internal Revenue Code Section 162(m). In the event that the Company determines, based on available evidence and management judgment, that all or part of the net deferred tax assets will not be realized in the future, it would record a valuation allowance in the period the determination is made. In addition, the calculation of tax liabilities involves significant judgment in estimating the impact of uncertainties in the application
53
of complex tax laws. Resolution of these uncertainties in a manner inconsistent with the Company’s expectations could have a material impact on the Company’s results of operations and financial position.
Common Stock Repurchases and Common Stock Dividend
In 2014 and 2015, the Company’s board of directors authorized the use of $75.0 million and $60.0 million, respectively, for repurchase of the Company’s common stock, with repurchases to be executed according to pre-defined price/volume guidelines. In 2014, the Company purchased 1.6 million shares for approximately $80.8 million. In 2015, the Company purchased 1.3 million shares for approximately $53.7 million. In 2016, the Company purchased 146,000 shares for approximately $6.4 million. As of December 31, 2016, the Company had $23.6 million available for future stock repurchases. Authorization of future stock repurchase programs is at the discretion of the board of directors and will depend on the Company's financial condition, results of operations, capital requirements and business conditions as well as other factors.
The following table presents the quarterly dividends declared on the Company’s common stock for the periods indicated:
Year Ended December 31, | |||||||||||
2016 | 2015 | 2014 | |||||||||
First Quarter | $ | 0.13 | $ | 0.12 | $ | 0.10 | |||||
Second Quarter | $ | 0.13 | $ | 0.12 | $ | 0.10 | |||||
Third Quarter | $ | 0.13 | $ | 0.12 | $ | 0.12 | |||||
Fourth Quarter | $ | 0.13 | $ | 0.12 | $ | 0.12 | |||||
The Company paid a total of approximately $15.1 million, $13.9 million and $13.2 million in cash dividends during 2016, 2015 and 2014, respectively.
In January 2017, the Company’s board of directors declared a $0.14 quarterly dividend for each quarter in 2017. The declaration of any future cash dividend is at the discretion of the board of directors and will depend on the Company’s financial condition, results of operations, capital requirements, business conditions and other factors, as well as a determination that cash dividends are in the best interest of the Company’s stockholders.
Indemnifications
The Company sells products to its distributors under contracts, collectively referred to as Distributor Sales Agreements (DSA). Each DSA contains the relevant terms of the contractual arrangement with the distributor, and generally includes certain provisions for indemnifying the distributor against losses, expenses, and liabilities from damages that may be awarded against the distributor in the event the Company’s products are found to infringe upon a patent, copyright, trademark, or other proprietary right of a third party (Customer Indemnification). The DSA generally limits the scope of and remedies for the Customer Indemnification obligations in a variety of industry-standard respects, including, but not limited to, limitations based on time and geography, and a right to replace an infringing product. The Company also, from time to time, has granted a specific indemnification right to individual customers.
The Company believes its internal development processes and other policies and practices limit its exposure related to such indemnifications. In addition, the Company requires its employees to sign a proprietary information and inventions agreement, which assigns the rights to its employees' development work to the Company. To date, the Company has not had to reimburse any of its distributors or customers for any losses related to these indemnifications and no material claims were outstanding as of December 31, 2016. For several reasons, including the lack of prior indemnification claims and the lack of a monetary liability limit for certain infringement cases, the Company cannot determine the maximum amount of potential future payments, if any, related to such indemnifications.
Recently Issued Accounting Pronouncements
In May 2014, the Financial Accounting Standards Board ("FASB") issued Accounting Standards Update ("ASU") 2014-09, Revenue from Contracts with Customers, amending the existing accounting standards for revenue recognition. The amendments
54
are based on the principle that revenue from the transfer of promised goods or services to customers should be recognized in an amount that reflects the consideration to which the entity expects to be entitled in exchange for those goods or services. The amendments may be applied retrospectively to each prior period presented (full retrospective method) or retrospectively with the cumulative effect recognized as of the date of initial application (modified retrospective method). The Company is required to adopt the amendments in the first quarter of 2018; early adoption is permitted beginning January 1, 2017. The Company will early adopt the new guidance, effective on January 1, 2017, using the full retrospective method under which it would recast prior reporting periods. Under the new standards the Company will recognize all revenue on sales to distributors upon shipment and transfer of control (known as “sell-in” revenue recognition), rather than deferring recognition until distributors report that they have sold the products to their customers (known as “sell-through” revenue recognition). Currently, a high percentage of the Company’s revenues on sales to distributors are recognized on sell-through. Because this change in methodology will cause a shift in the timing of when revenue is recognized, the Company expects that the quarterly seasonal pattern of its revenues will be affected by the new standards. Based on the Company’s analysis, under the new standards annual net revenues would increase by approximately $2 million and $1 million in 2016 and 2015, respectively.
In July 2015, the FASB amended the existing accounting standards for the measurement of inventory, ASU 2015-11, Inventory. The amendments require inventory to be measured at the lower of cost and net realizable value. Net realizable value is the estimated selling prices in the ordinary course of business, less reasonably predictable costs of completion, disposal, and transportation. The Company is required to adopt the amendments in the first quarter of 2017. The amendments should be applied prospectively with early adoption permitted as of the beginning of an interim or annual reporting period. The Company does not expect that the adoption of these amendments will have a material impact on its consolidated financial statements.
In February 2016, the FASB amended the existing accounting standards for leases, ASU 2016-02, Leases. The amendments require lessees to recognize, on the balance sheet, assets and liabilities for the rights and obligations created by leases of greater than twelve months. The accounting by lessors will remain largely unchanged from that applied under previous U.S. GAAP. The Company is required to adopt the amendments in the first quarter of fiscal 2019, with early adoption permitted. The amendments require a modified retrospective transition approach to recognize and measure leases at the beginning of the earliest period presented. The Company is currently evaluating the impact of these amendments and the transition alternatives on its consolidated financial statements.
In March 2016, the FASB amended the existing accounting standards for stock-based compensation, ASU 2016-09, Compensation-Stock Compensation (Topic 718): Improvements to Employee Share-Based Payment Accounting. The amendments impact several aspects of accounting for share-based payment transactions, including the income tax consequences, forfeitures, classification of awards as either equity or liabilities, and classification on the statement of cash flows. The Company is required to adopt the amendments in the first quarter of 2017. The manner of application varies by the various provisions of the guidance, with certain provisions applied on a retrospective or modified retrospective approach, while others are applied prospectively. Upon adoption, the Company expects to recognize a windfall tax benefit of approximately $7 million to $8 million, as a cumulative effect adjustment to opening retained earnings, together with a corresponding increase in deferred tax assets.
3. STOCK PLANS AND SHARE BASED COMPENSATION:
Stock Plans
As of December 31, 2016, the Company had three stock-based compensation plans (the “Plans”) which are described below.
2007 Equity Incentive Plan
The 2007 Equity Incentive Plan (2007 Plan) was adopted by the board of directors on September 10, 2007, and approved by the stockholders on November 7, 2007, as an amendment and restatement of the 1997 Stock Option Plan (1997 Plan). The 2007 Plan provides for the grant of incentive stock options, non-statutory stock options, restricted stock awards, restricted stock unit (RSU) awards, stock appreciation rights, performance-based (PSU) awards, long-term performance based (PRSU) awards and other stock awards to employees, directors and consultants. As of December 31, 2016, the total maximum remaining number of shares that may be issued under the 2007 Plan was 3.8 million shares, which includes 0.6 million options issued but not exercised
55
and 1.9 million awards granted but unvested. As of December 31, 2016, 1.9 million shares of common stock remain available for future grant under the 2007 Plan. Pursuant to the 2007 Plan, the exercise price for incentive stock options and non-statutory stock options is generally at least 100% of the fair market value of the underlying shares on the date of grant. Options generally vest over 48 months measured from the date of grant. Options generally expire no later than ten years after the date of grant, subject to earlier termination upon an optionee’s cessation of employment or service.
Beginning January 27, 2009, grants pursuant to the Directors Equity Compensation Program (which was adopted by the board of directors on January 27, 2009) to non-employee directors have been made primarily under the 2007 Plan. The Directors Equity Compensation Program provides for grants to outside directors as follows: effective annually, upon the first trading day of July, each outside director would receive a grant of an equity award with an aggregate value of $100,000. At each outside director’s election, such award would consist entirely of RSUs or entirely of stock options. The quantity of options would be calculated by dividing $100,000 by the Black-Scholes value on the date of grant. The quantity of RSUs issued would be calculated by dividing $100,000 by the grant date fair value. Further, on the date of election of a new outside director, such new director would receive such grant as continuing outside directors receive on the first trading day of July; provided, however, that such grant is prorated for the portion of the year that such new outside director will serve until the next first trading day of July. The Directors Equity Compensation Program will remain in effect at the discretion of the board of directors or the compensation committee.
On July 28, 2009, the 2007 Plan was amended generally to prohibit outstanding options or stock appreciation rights from being canceled in exchange for cash without stockholder approval.
2016 Incentive Award Plan
The 2016 Incentive Award Plan (2016 Plan) was adopted by the board of directors on March 17, 2016 and approved by the stockholders on May 13, 2016. The Plan provides for the grant of RSU awards, PSU awards and PRSU awards. No other forms of equity-based awards, including stock options and stock appreciation rights, may be granted under the Plan. As of December 31, 2016, no awards have been issued and 1.5 million shares of common stock remain available for future grant under the 2016 Plan. The 2016 Plan also provides for performance-based cash awards that qualify as “performance-based compensation” within the meaning of Section 162(m) of the Internal Revenue Code.
1997 Employee Stock Purchase Plan
Under the 1997 Employee Stock Purchase Plan (Purchase Plan), eligible employees may apply accumulated payroll deductions, which may not exceed 15% of an employee’s compensation, to the purchase of shares of the Company’s common stock at periodic intervals. The purchase price of stock under the Purchase Plan is equal to 85% of the lower of (i) the fair market value of the Company’s common stock on the first day of each offering period, or (ii) the fair market value of the Company’s common stock on the purchase date (as defined in the Purchase Plan). Each offering period consists of one purchase period of approximately six months duration. An aggregate of 3.5 million shares of common stock were reserved for issuance to employees under the Purchase Plan. As of December 31, 2016, of the shares reserved for issuance, 2.9 million shares had been purchased and 0.6 million shares were reserved for future issuance under the Purchase Plan.
Shares Reserved
As of December 31, 2016, the Company had approximately 3.4 million shares of common stock reserved for future grant under all stock plans.
Stock-Based Compensation
The Company applies the provisions of ASC 718-10, Stock Compensation. Under the provisions of ASC 718-10, the Company recognizes the fair value of stock-based compensation in its financial statements over the requisite service period of the individual grants, which generally equals a four-year vesting period. The Company uses estimates of volatility, expected term, risk-free interest rate, dividend yield and forfeitures in determining the fair value of these awards and the amount of compensation expense to recognize. The Company uses the straight-line method to amortize all stock awards granted over the requisite service period of the award.
56
The following table summarizes the stock-based compensation expense recognized in accordance with ASC 718-10 for the years ended December 31, 2016, 2015 and 2014:
Year Ended December 31, | |||||||||||
(in thousands) | 2016 | 2015 | 2014 | ||||||||
Cost of revenues | $ | 1,148 | $ | 933 | $ | 879 | |||||
Research and development | 7,309 | 5,255 | 4,784 | ||||||||
Sales and marketing | 4,489 | 3,644 | 3,540 | ||||||||
General and administrative | 7,939 | 4,935 | 5,079 | ||||||||
Total stock-based compensation expense | $ | 20,885 | $ | 14,767 | $ | 14,282 | |||||
The following table summarizes total compensation expense related to unvested awards not yet recognized, net of expected forfeitures, and the weighted average period over which it is expected to be recognized as of December 31, 2016:
Unrecognized Compensation Expense for Unvested Awards (in thousands) | Weighted Average Remaining Recognition Period (in years) | ||||
Long-term performance-based awards | $ | 2,562 | 1.52 | ||
Restricted stock units | 21,930 | 2.27 | |||
Purchase plan | 120 | 0.08 | |||
Total unrecognized compensation expense | $ | 24,612 | |||
Stock-based compensation expense in the year ended December 31, 2016, was approximately $20.9 million (comprising approximately $0.2 million related to stock options, $6.4 million related to performance-based awards, $13.0 million related to restricted stock units and $1.3 million related to the Company’s Purchase Plan).
Stock-based compensation expense in the year ended December 31, 2015, was approximately $14.8 million (comprising approximately $0.7 million related to stock options, $0.3 million related to performance-based awards, $12.7 million related to restricted stock units and $1.2 million related to the Company’s Purchase Plan).
Stock-based compensation expense in the year ended December 31, 2014, was approximately $14.3 million (comprising approximately $1.2 million related to stock options, $0.5 million related to long-term performance-based awards, $11.3 million related to restricted stock units and $1.3 million related to the Company’s Purchase Plan).
The Company did not grant stock options in the years ended December 31, 2016, 2015 and 2014, and therefore no fair-value assumptions are reported.
The fair value of employees’ stock purchase rights under the Purchase Plan was estimated using the Black-Scholes model with the following weighted-average assumptions used during the three years ended December 31, 2016, 2015 and 2014:
Year Ended December 31, | |||||
2016 | 2015 | 2014 | |||
Risk-free interest rates | 0.44% | 0.13% | 0.05% - 0.07% | ||
Expected volatility rates | 32% | 29% | 30% - 48% | ||
Expected dividend yield | 0.96% | 1.08% | 0.66% - 0.85% | ||
Expected term of purchase right (in years) | 0.5 | 0.5 | 0.5 | ||
Weighted-average estimated fair value of purchase rights | $12.23 | $10.18 | $14.40 | ||
57
A summary of stock option activity under the Plans as of December 31, 2016, and activity during three years then ended, is presented below:
(shares and intrinsic value in thousands) | Shares | Weighted Average Exercise Price | Weighted Average Remaining Contractual Term (in years) | Aggregate Intrinsic Value | ||||||||
Outstanding at January 1, 2014 | 1,691 | $ | 27.34 | |||||||||
Granted | — | — | ||||||||||
Exercised | (347 | ) | $ | 27.64 | ||||||||
Forfeited or expired | — | — | ||||||||||
Outstanding at December 31, 2014 | 1,344 | $ | 27.27 | |||||||||
Granted | — | — | ||||||||||
Exercised | (311 | ) | $ | 26.11 | ||||||||
Forfeited or expired | (3 | ) | $ | 37.97 | ||||||||
Outstanding at December 31, 2015 | 1,030 | $ | 27.58 | |||||||||
Granted | — | — | ||||||||||
Exercised | (333 | ) | $ | 25.41 | ||||||||
Forfeited or expired | — | — | ||||||||||
Outstanding at December 31, 2016 | 697 | $ | 28.62 | 2.82 | $ | 27,370 | ||||||
Exercisable at December 31, 2016 | 697 | $ | 28.62 | 2.82 | $ | 27,370 | ||||||
Vested and expected to vest at December 31, 2016 | 697 | $ | 28.62 | 2.82 | $ | 27,370 | ||||||
The total intrinsic value of options exercised during the year ended December 31, 2016, 2015 and 2014, was $11.5 million, $7.0 million and $9.9 million, respectively.
The following table summarizes the stock options outstanding at December 31, 2016:
Options Outstanding | Options Exercisable | |||||||||||||||
(shares in thousands) Range of Exercise Prices | Options Outstanding | Weighted Average Remaining Contractual Term (in years) | Weighted Average Exercise Price | Options Exercisable | Weighted Average Exercise Price | |||||||||||
$17.75 - $25.25 | 371 | 2.15 | $ | 21.31 | 371 | $ | 21.31 | |||||||||
$25.48 - $42.88 | 326 | 3.58 | $ | 36.94 | 326 | $ | 36.94 | |||||||||
697 | 2.82 | $ | 28.62 | 697 | $ | 28.62 | ||||||||||
PSU Awards
Under the performance-based awards program, the Company grants awards in the performance year in an amount equal to twice the target number of shares to be issued if the maximum performance metrics are met. The number of shares that are released at the end of the performance year can range from zero to 200% of the target number depending on the Company’s performance. The performance metrics of this program are annual targets consisting of a combination of net revenue, non-GAAP operating earnings and strategic goals. Each performance-based award share granted from the 2007 Plan will reduce the number of shares available for issuance under the 2007 Plan by two shares. Each performance-based award share granted from the 2016 Plan will reduce the number of shares available for issuance under the 2016 Plan by one share.
During the year ended December 31, 2016, the Company issued approximately 101,000 PSUs to employees and executives. As the net revenue, non-GAAP operating income and strategic goals are considered performance conditions, expense associated with these awards, net of estimated forfeitures, is recognized over the service period based on an assessment of the achievement of the performance targets. The fair value of these PSUs is determined using the fair value of the Company’s common stock on the date of the grant, reduced by the discounted present value of dividends expected to be declared before the awards
58
vest. If the performance conditions are not achieved, no compensation cost is recognized and any previously recognized compensation is reversed.
A summary of PSU awards outstanding as of December 31, 2016, and activity during the three years then ended is presented below:
(shares and intrinsic value in thousands) | Shares | Weighted Average Grant Date Fair Value Per Share | Weighted Average Remaining Contractual Term (in years) | Aggregate Intrinsic Value | ||||||||
Outstanding at January 1, 2014 | 100 | $ | 38.48 | |||||||||
Granted | 83 | $ | 53.93 | |||||||||
Vested | (83 | ) | $ | 38.48 | ||||||||
Forfeited or canceled | (100 | ) | $ | 51.30 | ||||||||
Outstanding at December 31, 2014 | — | — | ||||||||||
Granted | 89 | $ | 52.36 | |||||||||
Vested | — | — | ||||||||||
Forfeited or canceled | (78 | ) | $ | 52.35 | ||||||||
Outstanding at December 31, 2015 | 11 | $ | 52.35 | |||||||||
Granted | 101 | $ | 46.26 | |||||||||
Vested | (11 | ) | $ | 52.35 | ||||||||
Forfeited or canceled | (2 | ) | $ | 46.87 | ||||||||
Outstanding at December 31, 2016 | 99 | $ | 46.25 | 0 | $ | 6,714 | ||||||
Outstanding and expected to vest at December 31, 2016 | 99 | 0 | $ | 6,714 | ||||||||
The grant date fair value of PSU awards released, which were fully vested, in the year ended December 31, 2016 was approximately $0.6 million. There were no PSU awards released in the year ended December 31, 2015 (as the Company did not reach its minimum performance goals established for the 2014 PSUs). The grant date fair value of PSU awards released, which were fully vested, in the year ended December 31, 2014 was approximately $3.2 million.
PRSU Awards (Long-term Performance Based)
The Company's PRSU program provides for the issuance of PRSUs which will vest based on the Company's performance measured against the PRSU Plan's established revenue targets. The PRSUs were granted in an amount equal to twice the target number of shares to be issued if the maximum performance metrics are met. The actual number of shares the recipient receives is determined at the end of a three-year performance period based on results achieved versus the Company’s performance goals, and may range from zero to 200% of the target number. The performance goals for PRSUs granted in fiscal 2016, 2015 and 2014 were based on the Company’s annual revenue growth over the respective three-year performance period. Each PRSU granted from the 2007 Plan will reduce the number of shares available for issuance under the 2007 Plan by two shares. Each PRSU granted from the 2016 Plan will reduce the number of shares available for issuance under the 2016 Plan by one share.
Recipients of a PRSU award generally must remain employed by the Company on a continuous basis through the end of the applicable three-year performance period in order to receive shares subject to that award. Expenses associated with these awards, net of estimated forfeitures, are recorded throughout the year depending on the number of shares expected to vest based on progress toward the performance target. The fair value of PRSU awards is determined using the fair value of the Company’s common stock on the grant date, reduced by the discounted present value of dividends expected to be declared before the awards vest. If the performance conditions are not achieved, no compensation cost is recognized and any previously recognized compensation is reversed.
59
A summary of PRSU awards outstanding as of December 31, 2016, and activity during the three years then ended is presented below:
(shares and intrinsic value in thousands) | Shares | Weighted Average Grant Date Fair Value Per Share | Weighted Average Remaining Contractual Term (in years) | Aggregate Intrinsic Value | ||||||||
Outstanding at January 1, 2014 | — | — | ||||||||||
Granted | 61 | $ | 55.51 | |||||||||
Vested | — | — | ||||||||||
Forfeited or canceled | — | — | ||||||||||
Outstanding at December 31, 2014 | 61 | $ | 55.51 | |||||||||
Granted | 72 | $ | 52.47 | |||||||||
Vested | — | — | ||||||||||
Forfeited or canceled | (4 | ) | $ | 57.76 | ||||||||
Outstanding at December 31, 2015 | 129 | $ | 53.75 | |||||||||
Granted | 78 | $ | 43.26 | |||||||||
Vested | — | — | ||||||||||
Forfeited or canceled | (57 | ) | $ | 55.35 | ||||||||
Outstanding at December 31, 2016 | 150 | $ | 47.65 | 1.52 | $ | 10,177 | ||||||
Outstanding and expected to vest at December 31, 2016 | 113 | 1.51 | $ | 7,659 | ||||||||
RSU Awards
The Company grants restricted stock units to employees under the 2007 Plan and 2016 Plan. RSUs granted to employees typically vest ratably over a four-year period, and are converted into shares of the Company’s common stock upon vesting on a one-for-one basis subject to the employee’s continued service to the Company over that period. The fair value of RSUs is determined using the fair value of the Company’s common stock on the date of the grant, reduced by the discounted present value of dividends expected to be declared before the awards vest. Compensation expense is recognized on a straight-line basis over the requisite service period of each grant adjusted for estimated forfeitures. Each RSU award granted from the 2007 Plan will reduce the number of shares available for issuance under the 2007 Plan by two shares. Each RSU award granted from the 2016 Plan will reduce the number of shares available for issuance under the 2016 Plan by one share.
60
A summary of RSUs outstanding as of December 31, 2016, and activity during the three years then ended, is as follows:
(shares and intrinsic value in thousands) | Shares | Weighted Average Grant Date Fair Value Per Share | Weighted Average Remaining Contractual Term (in years) | Aggregate Intrinsic Value | ||||||||
Outstanding at January 1, 2014 | 714 | $ | 38.97 | |||||||||
Granted | 281 | $ | 51.12 | |||||||||
Vested | (267 | ) | $ | 38.57 | ||||||||
Forfeited | (36 | ) | $ | 42.74 | ||||||||
Outstanding at December 31, 2014 | 692 | $ | 43.86 | |||||||||
Granted | 319 | $ | 49.75 | |||||||||
Vested | (267 | ) | $ | 42.49 | ||||||||
Forfeited | (63 | ) | $ | 45.71 | ||||||||
Outstanding at December 31, 2015 | 681 | $ | 46.98 | |||||||||
Granted | 331 | $ | 46.70 | |||||||||
Vested | (270 | ) | $ | 45.13 | ||||||||
Forfeited | (24 | ) | $ | 47.21 | ||||||||
Outstanding at December 31, 2016 | 718 | $ | 47.54 | 1.25 | $ | 48,684 | ||||||
Outstanding and expected to vest at December 31, 2016 | 674 | 1.19 | $ | 45,711 | ||||||||
The grant date fair value of RSUs vested in the years ended December 31, 2016, 2015 and 2014, was approximately $12.2 million, $11.3 million and $10.3 million, respectively.
4. FAIR VALUE MEASUREMENTS:
ASC 820-10, Fair Value Measurements, clarifies that fair value is an exit price, representing the amount that would be received to sell an asset or paid to transfer a liability in an orderly transaction between market participants. As such, fair value is a market-based measurement that should be determined based on assumptions that market participants would use in pricing an asset or liability. As a basis for considering such assumptions, ASC 820-10 establishes a three-tier value hierarchy, which prioritizes the inputs used in measuring fair value as follows: (Level 1) observable inputs such as quoted prices for identical assets in active markets; (Level 2) inputs other than the quoted prices in active markets that are observable either directly or indirectly; and (Level 3) unobservable inputs in which there is little or no market data, which requires the Company to develop its own assumptions. This hierarchy requires the Company to use observable market data, when available, and to minimize the use of unobservable inputs when determining fair value.
The Company's cash equivalents and investment instruments are classified within Level 1 or Level 2 of the fair-value hierarchy because they are valued using quoted market prices, broker or dealer quotations, or alternative pricing sources with reasonable levels of price transparency. The type of instrument valued based on quoted market prices in active markets primarily includes money market securities. This type of instrument is generally classified within Level 1 of the fair-value hierarchy. The types of instruments valued based on other observable inputs (Level 2 of the fair-value hierarchy) include investment-grade corporate bonds and government, state, municipal and provincial obligations. Such types of investments are valued by using a multi-dimensional relational model, the inputs are primarily benchmark yields, reported trades, broker/dealer quotes, issuer spreads, two-sided markets, benchmark securities, bids, offers, and reference data including market research publications. The Company does not hold any instruments that would be classified within Level 3 of the fair-value hierarchy.
61
The fair value hierarchy of the Company’s cash equivalents and marketable securities at December 31, 2016, and December 31, 2015, was as follows:
Fair Value Measurement at | |||||||||||
December 31, 2016 | |||||||||||
(in thousands) | Total Fair Value | Quoted Prices in Active Markets for Identical Assets (Level 1) | Significant Other Observable Inputs (Level 2) | ||||||||
Commercial paper | $ | 58,031 | $ | — | $ | 58,031 | |||||
Money market funds | 1,916 | 1,916 | — | ||||||||
Corporate securities | 132,141 | — | 132,141 | ||||||||
Total | $ | 192,088 | $ | 1,916 | $ | 190,172 | |||||
Fair Value Measurement at | |||||||||||
December 31, 2015 | |||||||||||
(in thousands) | Total Fair Value | Quoted Prices in Active Markets for Identical Assets (Level 1) | Significant Other Observable Inputs (Level 2) | ||||||||
Commercial paper | $ | 21,194 | $ | — | $ | 21,194 | |||||
Money market funds | 104 | 104 | — | ||||||||
Corporate securities | 83,769 | — | 83,769 | ||||||||
Total | $ | 105,067 | $ | 104 | $ | 104,963 | |||||
The Company did not transfer any investments between level 1 and level 2 of the fair value hierarchy in the years ended December 31, 2016, and December 31, 2015.
5. GOODWILL AND INTANGIBLE ASSETS:
Goodwill increased during the year ended December 31, 2015, due to the Company's acquisition of Cambridge Semiconductor Limited (CamSemi) (refer to Note 11, Acquisitions, for details on the Company’s CamSemi acquisition). Changes in the carrying amount of goodwill during the years ended December 31, 2016 and 2015, are as follows:
(in thousands) | Goodwill | ||
Balance at December 31, 2014 | $ | 80,599 | |
Goodwill acquired during the period | 11,250 | ||
Balance at December 31, 2015 | 91,849 | ||
Goodwill acquired during the period | — | ||
Balance at December 31, 2016 | $ | 91,849 | |
Intangible assets consist primarily of developed technology, acquired licenses, customer relationships, trade name, domain name, in-process R&D and patent rights, and are reported net of accumulated amortization. In January 2015, the Company acquired CamSemi, resulting in the addition of the following intangible assets: developed technology of $6.6 million, which will be amortized over a period of three - seven years; and customer relationships of $2.4 million, which will be amortized over a period of five years. In August 2015, the Company purchased a building with existing third-party leases, resulting in the addition of in-place lease intangible assets of $0.7 million which will be amortized over a period of two years.
The Company amortizes the cost of all intangible assets over the shorter of the estimated useful life or the term of the developed technology, acquired licenses, customer relationships, trade name, patent rights and in-place leases, which range from
62
two to twelve years, with the exception of $4.7 million of in-process R&D and $1.3 million paid to acquire an internet domain name. In-process R&D is assessed for impairment until the development is completed and products are available for sale, at which time the Company will begin to amortize the in-process R&D. The Company does not expect the amortization of in-process R&D to begin in 2017. The Company acquired the rights to the internet domain name www.power.com, which is now the Company’s primary domain name; the cost to acquire the domain name has been recorded as an intangible asset and will not be amortized as it has an indefinite useful life. Amortization of acquired intangible assets was approximately $6.7 million, $7.0 million and $6.1 million in the years ended December 31, 2016, 2015 and 2014, respectively. The Company does not believe there is any significant residual value associated with the following intangible assets:
December 31, 2016 | December 31, 2015 | ||||||||||||||||||||||
(in thousands) | Gross | Accumulated Amortization | Net | Gross | Accumulated Amortization | Net | |||||||||||||||||
Domain name | $ | 1,261 | $ | — | $ | 1,261 | $ | 1,261 | $ | — | $ | 1,261 | |||||||||||
In-process research and development | 4,690 | — | 4,690 | 4,690 | — | 4,690 | |||||||||||||||||
Technology licenses | 3,000 | (3,000 | ) | — | 3,000 | (2,925 | ) | 75 | |||||||||||||||
Developed technology | 33,270 | (15,455 | ) | 17,815 | 33,270 | (11,670 | ) | 21,600 | |||||||||||||||
Customer relationships | 20,030 | (12,474 | ) | 7,556 | 20,030 | (10,031 | ) | 9,999 | |||||||||||||||
In-place leases | 660 | (480 | ) | 180 | 660 | (120 | ) | 540 | |||||||||||||||
Total intangible assets | $ | 62,911 | $ | (31,409 | ) | $ | 31,502 | $ | 62,911 | $ | (24,746 | ) | $ | 38,165 | |||||||||
The estimated future amortization expense related to definite-lived intangible assets at December 31, 2016, is as follows:
Fiscal Year | Estimated Amortization (in thousands) | ||
2017 | $ | 6,084 | |
2018 | 5,152 | ||
2019 | 4,753 | ||
2020 | 3,528 | ||
2021 | 2,662 | ||
Thereafter | 3,372 | ||
Total (1) | $ | 25,551 | |
_______________
(1) | The total above excludes $4.7 million of in-process R&D which will be amortized upon completion of development over the estimated useful life of the technology. |
6. SIGNIFICANT CUSTOMERS AND INTERNATIONAL SALES:
Segment Reporting
The Company is organized and operates as one reportable segment, the design, development, manufacture and marketing of analog and mixed-signal ICs and other electronic components and circuitry used in high-voltage power conversion. The Company’s chief operating decision maker, the chief executive officer, reviews financial information presented on a consolidated basis for purposes of making operating decisions and assessing financial performance.
Customer Concentration
The Company's top ten customers accounted for approximately 60% of net revenues in each of 2016 and 2015, and 59% in 2014. A significant portion of these revenues are attributable to sales of the Company’s products to distributors of electronic components. These distributors sell the Company’s products to a broad, diverse range of end users, including OEMs and merchant power supply manufacturers.
63
The following customers each accounted for 10% or more of total net revenues:
Year Ended December 31, | ||||||||
Customer | 2016 | 2015 | 2014 | |||||
Avnet | 18 | % | 21 | % | 19 | % | ||
Powertech Distribution Ltd. | 11 | % | 10 | % | * | |||
_______________
* Total customer revenue was less than 10% of net revenues
Avnet and Powertech Distribution Ltd. are distributors of the Company's products. No other customers accounted for 10% or more of the Company’s net revenues in those periods.
Concentration of Credit Risk
Financial instruments that potentially subject the Company to concentrations of credit risk consisted principally of cash investments and trade receivables. The Company has cash investment policies that limit cash investments to low-risk investments. With respect to trade receivables, the Company performs ongoing evaluations of its customers' financial conditions and requires letters of credit whenever deemed necessary. Additionally, the Company establishes an allowance for doubtful accounts based upon factors surrounding the credit risk of specific customers, historical trends related to past write-offs and other relevant information. Account balances are charged off against the allowance after all means of collection have been exhausted and the potential for recovery is considered remote. The Company does not have any off-balance-sheet credit exposure related to its customers. Financial instruments that potentially subject the Company to concentrations of credit risk consist principally of cash investments and trade receivables. As of December 31, 2016 and December 31, 2015, 70% and 66% of accounts receivable were concentrated with the Company’s top 10 customers.
The following customers each represented 10% or more of accounts receivable:
Customer | December 31, 2016 | December 31, 2015 | |||
Avnet | 24 | % | 20 | % | |
ATM Electronic Corporation | * | 10 | % | ||
_______________
* Total customer accounts receivable was less than 10%
Avnet and ATM Electronic Corporation are distributors of the Company’s products. No other customers accounted for 10% or more of the Company’s accounts receivable in these periods.
International Sales
The Company markets its products globally through its sales personnel and a worldwide network of independent sales representatives and distributors. As a percentage of total net revenues, international sales, which consist of sales to distributors and direct customers outside of the United States of America, based on "bill to" customer locations, comprise the following:
Year Ended December 31, | ||||||||
2016 | 2015 | 2014 | ||||||
Hong Kong/China | 51 | % | 50 | % | 47 | % | ||
Taiwan | 13 | % | 14 | % | 15 | % | ||
Korea | 11 | % | 10 | % | 11 | % | ||
Western Europe (excluding Germany) | 11 | % | 11 | % | 11 | % | ||
Japan | 5 | % | 5 | % | 5 | % | ||
Germany | 2 | % | 2 | % | 2 | % | ||
Other | 3 | % | 3 | % | 4 | % | ||
Total foreign revenue | 96 | % | 95 | % | 95 | % | ||
The remainder of the Company’s sales is to customers within the United States of America.
64
7. EARNINGS PER SHARE:
Basic earnings per share are calculated by dividing net income by the weighted-average shares of common stock outstanding during the period. Diluted earnings per share are calculated by dividing net income by the weighted-average shares of common stock and dilutive common equivalent shares outstanding during the period. Dilutive common equivalent shares included in this calculation consist of dilutive shares issuable upon the assumed exercise of outstanding common stock options, the assumed vesting of outstanding restricted stock units, the assumed issuance of awards under the stock purchase plan and contingently issuable performance-based awards, as computed using the treasury stock method.
A summary of the earnings per share calculation is as follows:
Year Ended December 31, | |||||||||||
(in thousands, except per share amounts) | 2016 | 2015 | 2014 | ||||||||
Basic earnings per share: | |||||||||||
Net income | $ | 47,890 | $ | 39,147 | $ | 59,544 | |||||
Weighted-average common shares | 28,925 | 29,001 | 29,976 | ||||||||
Basic earnings per share | $ | 1.66 | $ | 1.35 | $ | 1.99 | |||||
Diluted earnings per share (1): | |||||||||||
Net income | $ | 47,890 | $ | 39,147 | $ | 59,544 | |||||
Weighted-average common shares | 28,925 | 29,001 | 29,976 | ||||||||
Effect of dilutive securities: | |||||||||||
Employee stock plans | 694 | 695 | 853 | ||||||||
Diluted weighted-average common shares | 29,619 | 29,696 | 30,829 | ||||||||
Diluted earnings per share | $ | 1.62 | $ | 1.32 | $ | 1.93 | |||||
_______________
(1) | The Company includes the shares underlying performance-based awards in the calculation of diluted earnings per share if the performance conditions have been satisfied as of the end of the reporting period and excludes such shares when the necessary conditions have not been met. The Company has excluded all performance-based awards in the 2014 calculation as the performance conditions for those awards were not met as of the end of the period. The Company has included in the 2016 and 2015 calculations those shares that were contingently issuable upon the satisfaction of the performance conditions as of the end of the respective periods. |
In the year ended December 31, 2016 no outstanding stock awards were determined to be anti-dilutive and therefore were excluded from the computation of diluted earnings per share. In the years ended December 31, 2015 and 2014, approximately 8,000 and 37,000 outstanding stock awards were determined to be anti-dilutive, respectively, and therefore were excluded from the computation of diluted earnings per share.
8. PROVISION FOR INCOME TAXES:
Income Taxes
The Company accounts for income taxes under the provisions of ASC 740, Income Taxes. Under the provisions of ASC 740, deferred tax assets and liabilities are recognized based on the differences between the financial statement carrying amounts of existing assets and liabilities and their respective tax bases, utilizing the tax rates that are expected to apply to taxable income in the years in which those temporary differences are expected to be recovered or settled.
65
U.S. and foreign components of income before income taxes were:
Year Ended December 31, | |||||||||||
(in thousands) | 2016 | 2015 | 2014 | ||||||||
U.S. operations | $ | (880 | ) | $ | (2,113 | ) | $ | (5,064 | ) | ||
Foreign operations | 49,802 | 41,531 | 61,878 | ||||||||
Total pretax income | $ | 48,922 | $ | 39,418 | $ | 56,814 | |||||
The components of the provision for (benefit from) income taxes are as follows:
Year Ended December 31, | |||||||||||
(in thousands) | 2016 | 2015 | 2014 | ||||||||
Current provision (benefit): | |||||||||||
Federal | $ | — | $ | 443 | $ | (1,234 | ) | ||||
State | — | 83 | (137 | ) | |||||||
Foreign | 1,638 | 5,407 | 3,094 | ||||||||
1,638 | 5,933 | 1,723 | |||||||||
Deferred provision (benefit): | |||||||||||
Federal | (197 | ) | (1,699 | ) | (3,279 | ) | |||||
State | (27 | ) | (57 | ) | (284 | ) | |||||
Foreign | (382 | ) | (3,906 | ) | (890 | ) | |||||
(606 | ) | (5,662 | ) | (4,453 | ) | ||||||
Total | $ | 1,032 | $ | 271 | $ | (2,730 | ) | ||||
The Company is entitled to a deduction for federal and state tax purposes with respect to employees' stock option activity. The net reduction in taxes otherwise payable in excess of any amount credited to income tax expense has been reflected as an adjustment to additional paid-in capital. For 2015 and 2014, the benefit (deficiency) arising from employee stock option activity that resulted in an adjustment to additional paid in capital was approximately $(0.2) million and $0.8 million, respectively. No adjustment was recorded in 2016.
The provision for (benefit from) income taxes differs from the amount that would result by applying the applicable federal income tax rate to income before provision for (benefit from) income taxes, as follows:
Year Ended December 31, | ||||||||
2016 | 2015 | 2014 | ||||||
Provision computed at Federal statutory rate | 35.0 | % | 35.0 | % | 35.0 | % | ||
Business tax credits | (6.0 | ) | (6.8 | ) | (5.5 | ) | ||
Stock-based compensation | 2.2 | 0.8 | (2.9 | ) | ||||
Foreign income taxed at different rate | (33.1 | ) | (33.1 | ) | (28.6 | ) | ||
IRS audit settlement | — | — | (5.8 | ) | ||||
Valuation allowance | 1.8 | 2.6 | 2.0 | |||||
Other | 2.2 | 2.2 | 1.0 | |||||
Total | 2.1 | % | 0.7 | % | (4.8 | )% | ||
The effective tax rate for the year ended December 31, 2016 was favorably impacted by the geographic distribution of the Company’s world-wide earnings in lower-tax jurisdictions. Additionally, the rate was favorably impacted by the federal R&D tax credit which was extended permanently when the Protecting Americans from Tax Hikes Act was signed into law on December 18, 2015.
The Company reached a settlement with the IRS in the quarter ended June 30, 2014, to close out the examination of its federal income tax returns for the years 2007 through 2009. As a result, the Company adjusted its tax balances and the provision for income tax for the year ended December 31, 2014, includes a one-time benefit of $3.3 million comprising $2.8 million in
66
federal income taxes and interest, and state income taxes of approximately $0.5 million. The one-time benefit includes the reversal of $4.1 million of related unrecognized tax benefits that had been recorded as non-current liabilities in the Company’s consolidated balance sheets. The Company has now concluded all U.S. federal income tax matters for the years through 2009.
The components of the net deferred income tax asset (liabilities) were as follows:
December 31, | |||||||
(in thousands) | 2016 | 2015 | |||||
Deferred tax assets: | |||||||
Other reserves and accruals | $ | 1,880 | $ | 1,573 | |||
Tax credit carry-forwards | 26,895 | 22,826 | |||||
Stock compensation | 5,760 | 5,945 | |||||
Capital losses | 10,585 | 11,490 | |||||
Net operating loss | 2,671 | 3,677 | |||||
Other | 174 | — | |||||
Valuation allowance | (27,489 | ) | (26,918 | ) | |||
20,476 | 18,593 | ||||||
Deferred tax liabilities: | |||||||
Depreciation | (2,322 | ) | (2,968 | ) | |||
Unremitted earnings | (7,019 | ) | (4,626 | ) | |||
Other | — | (447 | ) | ||||
(9,341 | ) | (8,041 | ) | ||||
Net deferred tax asset | $ | 11,135 | $ | 10,552 | |||
In assessing the realizability of deferred tax assets, management considers whether it is more likely than not that some portion or all of the deferred tax assets will not be realized. The ultimate realization of deferred tax assets is dependent upon the generation of future taxable income during the periods in which those temporary differences become deductible. Management considers the scheduled reversal of deferred tax liabilities and projected future taxable income. In the event that the Company determines, based on available evidence and management judgment, that all or part of the net deferred tax assets will not be realized in the future, the Company would record a valuation allowance in the period the determination is made. In addition, the calculation of tax liabilities involves significant judgment in estimating the impact of uncertainties in the application of complex tax laws. Resolution of these uncertainties in a manner inconsistent with the Company’s expectations could have a material impact on its results of operations and financial position.
As of December 31, 2016, the Company continues to maintain a valuation allowance primarily as a result of capital losses for federal purposes, and on its California deferred tax assets as the Company believes that it is not more likely than not that the deferred tax assets will be fully realized. In addition, the Company maintains a valuation allowance with respect to certain of its deferred tax assets relating to tax credits in Canada and the state of New Jersey.
As of December 31, 2016, the Company had federal research and development tax credit carry-forwards of approximately $14.9 million, which will begin to expire in 2030 if unutilized; federal net operating losses of $31.3 million, which will begin to expire in 2024 if unutilized; California research and development tax credit carry-forwards of approximately $18.7 million (there is no expiration of research and development tax credit carry-forwards for the state of California) and California net operating losses of $45.5 million which will begin to expire in 2032. As of December 31, 2016, the Company had Canadian scientific research and experimental development tax credit carry-forwards of approximately $2.1 million and New Jersey research and experimental development tax credit carry-forwards of approximately $0.7 million, which will start to expire in 2026 and 2027, respectively.
The Company does not provide for U.S. taxes on its undistributed earnings of foreign subsidiaries that it intends to invest indefinitely outside the U.S., unless such taxes are otherwise required under U.S. tax law. Beginning in 2013, the Company determined that a portion of its foreign subsidiaries current and future earnings may be remitted prospectively to the U.S. for domestic cash flow purposes and, accordingly, provided for the related U.S. taxes in its consolidated financial statements. If the Company changes its intent to invest its undistributed foreign earnings indefinitely or if a greater amount of undistributed earnings are needed for U.S. operations than previously anticipated and for which U.S. taxes have not been recorded, the Company would
67
be required to accrue or pay U.S. taxes (subject to an adjustment for foreign tax credits, where applicable) and withholding taxes payable to various foreign countries on some or all of these undistributed earnings. As of December 31, 2016, the Company had undistributed earnings of foreign subsidiaries that are indefinitely invested outside of the U.S. of approximately $265.0 million. It is not practicable to determine the income tax liability that might be incurred if these earnings were to be distributed.
Unrecognized Tax Benefits
The Company applies the provisions of ASC 740-10, relating to accounting for uncertain income taxes. Reconciliation of the beginning and ending amount of unrecognized tax benefits:
(in thousands) | Unrecognized Tax Benefits | ||
Unrecognized Tax Benefits Balance at January 1, 2014 | $ | 12,694 | |
Gross Increases for Tax Positions of Current Year | 2,117 | ||
Gross Increases for Tax Positions of Prior Years | 710 | ||
Settlements | (4,361 | ) | |
Lapse of Statute of Limitations | — | ||
Unrecognized Tax Benefits Balance at December 31, 2014 | 11,160 | ||
Gross Increases for Tax Positions of Current Year | 3,063 | ||
Gross Decrease for Tax Positions of Prior Years | (663 | ) | |
Settlements | — | ||
Lapse of Statute of Limitations | — | ||
Unrecognized Tax Benefits Balance at December 31, 2015 | 13,560 | ||
Gross Increases for Tax Positions of Current Year | 1,856 | ||
Gross Decreases for Tax Positions of Prior Years | (23 | ) | |
Settlements | — | ||
Lapse of Statute of Limitations | — | ||
Unrecognized Tax Benefits Balance at December 31, 2016 | $ | 15,393 | |
The Company's total unrecognized tax benefits as of December 31, 2016, 2015 and 2014, were $15.4 million, $13.6 million and $11.2 million, respectively. An income tax benefit of $9.3 million, net of valuation allowance adjustments, would be recorded if these unrecognized tax benefits are recognized. The Company cannot reasonably estimate the amount of the unrecognized tax benefit that could be adjusted in the next twelve months.
The Company’s continuing practice is to recognize interest and/or penalties related to income tax matters in income tax expense. The Company had accrued interest and penalties of $0.1 million as of both December 31, 2016, and December 31, 2015, which have been recorded in long-term income taxes payable in the accompanying Consolidated Balance Sheets.
As of December 31, 2016, the Company has concluded all U.S. federal income tax matters for the years through 2012. However, due to tax attributes, the IRS may calculate tax adjustments for subsequent years for positions taken prior to 2012. The Company has finalized Swiss income tax returns for the years through 2012. There is currently no pending income tax audit.
On July 27, 2015, in Altera Corp. v. Commissioner, the U.S. Tax Court issued an opinion related to the treatment of stock-based compensation expense in an intercompany cost-sharing arrangement. A final decision was issued by the Tax Court in December 2015. In February 2016, the Commissioner appealed the Tax Court decision. At this time, the U.S. Department of the Treasury has not withdrawn the requirement to include stock-based compensation expense from IRS cost-sharing regulations. The Company has reviewed this case and its impact and concluded that no adjustment to the consolidated financial statements is appropriate at this time. The Company will continue to monitor ongoing developments and potential impacts to the consolidated financial statements.
68
9. COMMITMENTS:
Facilities
The Company owns its main executive, administrative, manufacturing and technical offices in San Jose, California. The Company also owns a research and development facility in New Jersey and a test facility in Biel, Switzerland. The Company leases administrative office space in Singapore and Switzerland, and R&D facilities in Canada and the United Kingdom, in addition to sales offices in various countries around the world.
Future minimum lease payments under all non-cancelable operating lease agreements as of December 31, 2016, are as follows:
Fiscal Year | (in thousands) | ||
2017 | $ | 1,591 | |
2018 | 1,414 | ||
2019 | 565 | ||
2020 | 248 | ||
2021 | 211 | ||
Thereafter | 358 | ||
Total minimum lease payments | $ | 4,387 | |
Total rent expense amounted to $1.9 million, $2.0 million and $1.8 million in the years ended December 31, 2016, 2015 and 2014, respectively.
Purchase Obligations
At December 31, 2016, the Company had no non-cancelable purchase obligations that were due beyond one year.
10. LEGAL PROCEEDINGS AND CONTINGENCIES:
From time to time in the ordinary course of business, the Company becomes involved in lawsuits, or customers and distributors may make claims against the Company. In accordance with ASC 450-10, Contingencies, the Company makes a provision for a liability when it is both probable that a liability has been incurred and the amount of the loss can be reasonably estimated.
On October 20, 2004, the Company filed a complaint against Fairchild Semiconductor International, Inc. and Fairchild Semiconductor Corporation (referred to collectively as “Fairchild”) in the United States District Court for the District of Delaware. In its complaint, the Company alleged that Fairchild has and is infringing four of Power Integrations’ patents pertaining to pulse width modulation (PWM) integrated circuit devices. Fairchild denied infringement and asked for a declaration from the court that it does not infringe any Power Integrations patent and that the patents are invalid. The Court issued a claim construction order on March 31, 2006 which was favorable to the Company. The Court set a first trial on the issues of infringement, willfulness and damages for October 2, 2006. At the close of the first trial, on October 10, 2006, the jury returned a verdict in favor of the Company finding all asserted claims of all four patents-in-suit to be willfully infringed by Fairchild and awarding $34.0 million in damages. Fairchild raised defenses contending that the asserted patents are invalid or unenforceable, and the Court held a second trial on these issues beginning on September 17, 2007. On September 21, 2007, the jury returned a verdict in the Company’s favor, affirming the validity of the asserted claims of all four patents-in-suit. Fairchild submitted further materials on the issue of enforceability along with various other post-trial motions, and the Company filed post-trial motions seeking a permanent injunction and increased damages and attorneys’ fees, among other things. On September 24, 2008, the Court denied Fairchild’s motion regarding enforceability and ruled that all four patents are enforceable. On December 12, 2008, the Court ruled on the remaining post-trial motions, including granting a permanent injunction, reducing the damages award to $6.1 million, granting Fairchild a new trial on the issue of willful infringement in view of an intervening change in the law, and denying the Company’s motion for increased damages and attorneys’ fees with leave to renew the motion after the resolution of the issue of willful infringement. On December
69
22, 2008, at Fairchild’s request, the Court temporarily stayed the permanent injunction for 90 days. On January 12, 2009, Fairchild filed a notice of appeal challenging the Court’s refusal to enter a more permanent stay of the injunction, and Fairchild filed additional motions requesting that both the Federal Circuit and the District Court extend the stay of injunction. The District Court temporarily extended the stay pending the Federal Circuit ruling on Fairchild’s pending motion, but the Federal Circuit dismissed Fairchild’s appeal and denied its motion on May 5, 2009, and the District Court issued an order on May 13, 2009 confirming the reinstatement of the permanent injunction as originally entered in December 2008. On June 22, 2009, the Court held a brief bench re-trial on the issue of willful infringement. On July 22, 2010, the Court found that Fairchild willfully infringed all four of the asserted patents, and the Court also invited briefing on enhanced damages and attorneys’ fees. Fairchild also filed a motion requesting that the Court amend its findings regarding willfulness. On January 18, 2011, the Court denied Fairchild’s request to amend the findings regarding Fairchild’s willful infringement and doubled the damages award against Fairchild but declined to award attorneys’ fees. On February 3, 2011, the Court entered final judgment in favor of the Company for a total damages award of $12.9 million. Fairchild filed a notice of appeal challenging the final judgment and a number of the underlying rulings, and the Company filed a cross-appeal seeking to increase the damages award. The appeal was argued on January 11, 2012, and the Federal Circuit issued a mixed ruling on March 26, 2013, affirming Fairchild’s infringement of certain claims that support the basis for the permanent injunction while reversing, vacating, and remanding the findings with respect to other claims, including the Company’s claim for damages. The Company filed a petition seeking Supreme Court review of the Federal Circuit’s ruling on damages issues, and the Supreme Court called for a response from Fairchild but ultimately declined to review the case. On remand, the Company intends to pursue its claim for financial compensation based on Fairchild’s infringement.
On May 9, 2005, the Company filed a Complaint with the U.S. International Trade Commission (ITC) under section 337 of the Tariff Act of 1930, as amended, 19 U.S.C. Section 1337 against System General (SG). The Company filed a supplement to the complaint on May 24, 2005. The Company alleged infringement of its patents pertaining to PWM integrated circuit devices produced by SG, which are used in power conversion applications such as power supplies for computer monitors. The Commission instituted an investigation on June 8, 2005 in response to the Company’s complaint. SG filed a response to the ITC complaint asserting that the patents-in-suit were invalid and not infringed. The Company subsequently and voluntarily narrowed the number of patents and claims in suit, which proceeded to a hearing. The hearing on the investigation was held before the Administrative Law Judge (ALJ) from January 18 to January 24, 2006. Post-hearing briefs were submitted and briefing concluded February 24, 2006. The ALJ’s initial determination was issued on May 15, 2006. The ALJ found all remaining asserted claims valid and infringed, and recommended the exclusion of the infringing products as well as certain downstream products that contain the infringing products. After further briefing, on June 30, 2006, the Commission decided not to review the initial determination on liability, but did invite briefs on remedy, bonding and the public interest. On August 11, 2006, the Commission issued an order excluding from entry into the United States the infringing SG PWM chips, and any liquid-crystal-display (LCD) computer monitors, AC printer adapters and sample/demonstration circuit boards containing an infringing SG chip. The U.S. Customs Service is authorized to enforce the exclusion order. On October 11, 2006, the presidential review period expired without any action from the President, and the ITC exclusion order is now in full effect. SG appealed the ITC decision, and on November 19, 2007, the Federal Circuit affirmed the ITC’s findings in all respects. On October 27, 2008, SG filed a petition to modify the exclusion order in view of a recent Federal Circuit opinion in an unrelated case, and the Company responded to oppose any modification, but the Commission modified the exclusion order on February 27, 2009. Nevertheless, the exclusion order still prohibits SG and related entities from importing the infringing SG chips and any LCD computer monitors, AC printer adapters, and sample/demonstration circuit boards containing an infringing SG chip.
On May 23, 2008, the Company filed a complaint against Fairchild Semiconductor International, Inc., Fairchild Semiconductor Corporation, and Fairchild’s wholly owned subsidiary System General Corporation (referred to collectively as “Fairchild”), in the United States District Court for the District of Delaware. In its complaint, the Company alleged that Fairchild has infringed and is infringing three patents pertaining to power supply controller integrated circuit devices. Fairchild answered the Company’s complaint on November 7, 2008, denying infringement and asking for a declaration from the Court that it does not infringe any Power Integrations patent and that the patents are invalid and unenforceable. Fairchild’s answer also included counterclaims accusing the Company of infringing three patents pertaining to primary side power conversion integrated circuit devices. Fairchild had earlier brought these same claims in a separate suit against the Company, also in Delaware, which Fairchild dismissed in favor of adding its claims to the Company’s already pending suit against Fairchild. The Company has answered Fairchild’s counterclaims, denying infringement and asking for a declaration from the Court that it does not infringe any Fairchild patent and that the Fairchild patents are invalid. Fairchild also filed a motion to stay the case, but the Court denied that motion on December 19, 2008. On March 5, 2009, Fairchild filed a motion for summary judgment to preclude any recovery for post-verdict sales of parts found to infringe in the parties’ other ongoing litigation, described above, and the Company filed its opposition and a cross-motion to preclude Fairchild from re-litigating the issues of infringement and damages for those same products. On June
70
26, 2009, the Court held a hearing on the parties’ motions, and on July 9, 2009 the Court issued an order denying the parties’ motions but staying proceedings with respect to the products that were found to infringe and which are subject to the injunction in the other Delaware case between the parties pending the entry of final judgment in that case; those products are expected to be addressed in the context of the parties’ remand proceedings following the appeal in their earlier litigation in Delaware, and the remainder of the case is proceeding. On December 18, 2009, the Court issued an order construing certain terms in the asserted claims of the Company’s and Fairchild’s patents in suit. Following the Court’s ruling on claim construction, Fairchild withdrew its claim related to one of its patents and significantly reduced the number of claims asserted for the remaining two patents. The parties thereafter filed and argued a number of motions for summary judgment, and the Court denied the majority of the parties’ motions but granted the Company’s motion to preclude Fairchild from re-arguing validity positions that were rejected in the prior case between the parties. Because the assigned Judge retired at the end of July 2010, the case was re-assigned to a different Judge, and the Court vacated the trial schedule and had the parties provide their input on the appropriate course of action. The Court thereafter set a trial schedule with the jury trial on infringement and validity to begin in July 2011. On April 18, 2011, the Court rescheduled the trial to begin in January 2012, and on June 2, 2011, the Court moved the trial date to April 2012 to permit the parties to address another patent the Company accused Fairchild of infringing. Following a trial in April 2012, the jury returned a verdict finding that Fairchild infringes two of the Company’s patents, that Fairchild has induced others to infringe the Company’s patents, and also upheld the validity of the infringed patents. Of the two remaining counterclaim patents Fairchild asserted in the case, one was found not to be infringed, but the jury found the second patent to be infringed by a limited number of the Company’s products, although the jury further found the Company did not induce infringement by any customers, including customers outside the United States. On March 29, 2013, the District Court denied most of the parties’ post-trial motions on liability but granted the Company’s motion for judgment as a matter of law finding that Fairchild infringed another of the Company’s patents. On April 25, 2013, the Court denied both parties’ motions regarding the unenforceability of each other’s patents. The Company is challenging adverse findings on appeal; nevertheless, the Company estimates that even if the verdict on Fairchild’s patent were ultimately upheld, the sales potentially impacted would amount to less than 0.5% of the Company’s revenues. The Company requested an injunction preventing further infringement of its own patents by Fairchild, and Fairchild requested an injunction as well. Following a hearing on the issue in June 2014, the Court denied Fairchild’s request for an injunction against the Company and granted the Company’s request for an injunction against Fairchild. On January 13, 2015, the District Court entered final judgment on the liability and validity issues discussed above, and both parties filed appeals with the Federal Circuit. After briefing was completed, oral argument on the appeal took place in early July 2016, and on December 12, 2016, the Federal Circuit issued its opinion in the appeal, overturning the lone infringement verdict against the Company, finding one of the Company’s patents invalid, and overturning the District Court’s jury instruction on inducement. In view of the Federal Circuit’s rejection of the District Court’s jury instruction on inducement, the Court also vacated the inducement findings and associated injunction against Fairchild and remanded the case for a retrial on inducement, but the underlying validity and infringement findings against Fairchild on those two patents remain intact. On remand, the Company will also be seeking financial damages, as well as enhanced damages for willful infringement; these issues are to be decided in separate proceedings at a later date.
On June 28, 2004, the Company filed a complaint for patent infringement in the U.S. District Court, Northern District of California, against SG Corporation, a Taiwanese company, and its U.S. subsidiary. The Company’s complaint alleged that certain integrated circuits produced by SG infringed and continue to infringe certain of its patents. On June 10, 2005, in response to the initiation of the International Trade Commission (ITC) investigation discussed above, the District Court stayed all proceedings. Subsequent to the completion of the ITC proceedings, the District Court temporarily lifted the stay and scheduled a case management conference. On December 6, 2006, SG filed a notice of appeal of the ITC decision as discussed above. In response, and by agreement of the parties, the District Court vacated the scheduled case management conference and renewed the stay of proceedings pending the outcome of the Federal Circuit appeal of the ITC determination. On November 19, 2007, the Federal Circuit affirmed the ITC’s findings in all respects, and SG did not file a petition for review. The parties subsequently filed a motion to dismiss the District Court case without prejudice. On November 4, 2009, the Company re-filed its complaint for patent infringement against SG and its parent corporations, Fairchild Semiconductor International, Inc. and Fairchild Semiconductor Corporation, to address their continued infringement of patents at issue in the original suit that recently emerged from SG requested reexamination proceedings before the U.S. Patent and Trademark Office (USPTO). The Company seeks, among other things, an order enjoining SG and Fairchild from infringing the Company’s patents and an award of damages resulting from the alleged infringement. Fairchild has denied infringement and asked for a declaration from the Court that it does not infringe any Power Integrations patent, that the patents are invalid, and that one of the two of the Company’s patents now at issue in the case is unenforceable. On May 5, 2010, SG and Fairchild filed an amended answer including counterclaims accusing the Company of infringing two patents, and since that time Fairchild has withdrawn its claim for infringement of one of the patents it originally asserted against the Company but added another patent to the case over the Company’s objections; the Company contests these claims vigorously. Both parties filed summary judgment motions and challenges to each other’s experts’ testimony, and the Court granted the Company’s motion for
71
summary judgment of non-infringement with respect to one of Fairchild’s two patents. Following a trial on the remaining claims in February 2014, the jury returned a verdict in the Company’s favor, affirming the validity of the asserted claims of the Company’s patents-in-suit, finding that SG and Fairchild infringed the Company’s asserted patents and induced infringement by others, and awarding $105.0 million in damages. The Jury also rejected Fairchild’s remaining counterclaims for infringement against the Company. Fairchild challenged these rulings in post-trial motions, but the judge confirmed the jury’s determinations on infringement and damages, although the Court declined to find Fairchild’s infringement willful. Fairchild also pressed its unenforceability claim with respect to one of the two patents it was found to infringe in post-trial briefing, but the Court rejected Fairchild’s unenforceability claim. Fairchild also requested reconsideration of the damages determinations, and the Court granted a new trial with respect to damages but none of the other issues addressed in the previous trial, with the retrial scheduled for December 2015. Thereafter, the parties completed pretrial proceedings challenging each other’s experts, and the Court granted portions of each party’s motions limiting the scope of expert testimony for purposes of the damages retrial, but neither party was successful in their efforts to prevent the other side’s experts from testifying at trial. Following a retrial on the issue of damages in December 2015, the jury returned a verdict in the Company’s favor, finding that the Company’s patented technology created the basis for customer demand for the infringing Fairchild products and awarding $139.8 million in damages. Although the jury awarded damages, at this stage of the proceedings the Company cannot state the amount, if any, it might ultimately recover from Fairchild, and no benefits have been recorded in the Company’s consolidated financial statements as a result of the damages verdict. Fairchild filed post-trial motions challenging the verdict, but the Court rejected Fairchild’s motions challenging the damages verdict in August 2016. The Company also filed motions requesting enhanced damages and attorney fees and reinstatement of the willfulness finding against Fairchild in view of an intervening change of law; on January 13, 2017, the District Court reinstated the finding that Fairchild’s infringement was willful but declined to enhance damages or award fees. Fairchild has filed a further challenge to the verdict, and a ruling on that remaining motion is expected in the coming months, along with Fairchild’s appeal on the merits.
In February 2010, Fairchild and System General (SG) filed suits for patent infringement against the Company, Power Integrations Netherlands B.V., and representative offices of Power Integrations Netherlands in Shanghai and Shenzhen with the Suzhou Intermediate Court in the People’s Republic of China. The suits asserted four Chinese patents and sought an injunction and damages of approximately $19.0 million. Power Integrations Netherlands filed invalidation proceedings for all four asserted SG patents in the People’s Republic of China Patent Reexamination Board (PRB) of the State Intellectual Property Office (SIPO), and all four challenges were accepted by the PRB, with hearings conducted in September 2010. In early January 2012, the Company received rulings from the PRB invalidating the majority of the claims Fairchild asserted in litigation. The Suzhou Court conducted evidentiary hearings in 2012 and issued rulings in late December 2012, finding that the Company did not infringe any of the asserted patents. Fairchild filed appeals challenging the Suzhou Court’s non-infringement rulings, and the appeals court in Nanjing held further hearings in the infringement proceedings in late 2014, but Fairchild has since dismissed its appeals, bringing the infringement proceedings to a close in the first quarter of 2015.
On July 11, 2011, the Company filed a complaint in the U.S. District Court, District of Columbia, against David Kappos in his capacity as Director of the United States Patent and Trademark Office (PTO) as part of the ongoing reexamination proceedings related to one of the patents asserted against Fairchild and SG in the Delaware litigation described above. The Company filed a motion for summary judgment on a preliminary jurisdictional issue, and the PTO filed a cross-motion to dismiss on this same issue; briefing on those motions was completed in October, 2011. On November 18, 2013, the Court granted the PTO’s motion and transferred the case to the Federal Circuit, where additional briefing took place. Following a hearing in May 2015, the Federal Circuit ruled in the Company’s favor on August 12, 2015, overturning the PTO’s claim construction and remanding the case for further proceedings. On remand, the PTO ignored the Federal Circuit’s guidance, so the party has filed another appeal to the Federal Circuit; further briefing and proceedings on the second appeal will take place in the coming months.
On May 1, 2012, Fairchild Semiconductor Corporation and Fairchild's wholly owned subsidiary, System General Corporation (referred to collectively as “Fairchild”), filed a complaint against the Company in the United States District Court for the District of Delaware. In its complaint, Fairchild alleged that the Company has infringed and is infringing four patents pertaining to power conversion integrated circuit devices. The Company answered Fairchild’s complaint, denying infringement and asking for a declaration from the Court that it does not infringe any Fairchild patent and that the Fairchild patents are invalid, and the Company also asserted counterclaims against Fairchild for infringement of five of the Company’s patents. Fairchild has withdrawn its claim for infringement of one of the patents it asserted against the Company after the Company’s preliminary challenge. The parties streamlined their contentions in view of the Court's pretrial rulings, and following a trial in late May and early June 2015, a jury returned a verdict finding that Fairchild infringed one of the Company's patents, that Fairchild has induced and contributed to others' infringement of the Company's patent, and that the Company induced infringement of a Fairchild patent that was previously found infringed in the 2012 trial described above, with a damages award of $2.4 million in favor of Fairchild. Both
72
parties filed post-trial motions and challenges to various portions of the jury verdicts, and the Court addressed the first wave of post-trial motions, denying each side’s challenges to the verdict and denying Fairchild’s request for an injunction. In parallel proceedings, the Federal Circuit overturned the underlying finding of infringement against the Company on the Fairchild patent-in-suit, and the Company moved to vacate the inducement and damages judgment against the Company, a motion that Fairchild did not oppose. Further proceedings and an appeal of the outstanding issues are expected in the coming months.
On October 21, 2015, the Company filed a complaint for patent infringement against Fairchild Semiconductor Corporation, Fairchild Semiconductor International, Inc., and wholly-owned subsidiary Fairchild (Taiwan) Corporation (referred to collectively as “Fairchild”) to address Fairchild’s continued infringement of two patents Fairchild was previously found to infringe in the three District Court cases the Company brought against Fairchild discussed above. In each of the three prior cases, Fairchild was found to infringe one of the patents at issue in the latest complaint, and Fairchild’s challenges to the validity of the patents were rejected during the course of the prior lawsuits as well. Fairchild has answered the Company’s complaint, denying infringement and asking for a declaration from the Court that it does not infringe any Power Integrations patent and that the patents are invalid. Fairchild’s answer also included counterclaims accusing the Company of infringing four patents pertaining to power conversion integrated circuit devices, including one patent the Company was found not to infringe in prior litigation. The Company has answered Fairchild’s counterclaims, denying infringement and asking for a declaration from the Court that it does not infringe any Fairchild patent and that the Fairchild patents are invalid. On December 15, 2016, the Court stayed the case pending resolution of the parties inter partes review (IPR) and reexamination proceedings regarding the patents-in-suit.
On March 10, 2016, Silver Star Capital, LLC filed a petition with the U.S. Patent & Trademark Office (PTO) requesting that the PTO conduct an inter partes review (IPR) of the validity of the Company’s U.S. Patent No. 6,212,079 (the ’079 patent), which the Company has asserted against Fairchild Semiconductor in the California litigation initiated in 2004, as discussed above. The Company’s ’079 patent is also asserted in the Company’s most recent lawsuit against Fairchild filed in October 2015, also discussed above. On March 29, 2016, ON Semiconductor Corporation filed another petition requesting inter partes review of the Company’s ’079 patent. Since that time, ON Semiconductor has filed eleven more IPR petitions requesting review of various patents that the Company previously asserted against Fairchild as described above. The PTO denied Silver Star Capital’s IPR petition on the ’079 patent but instituted IPR proceedings with respect to ON Semiconductor’s petition directed to the ’079 patent, with further proceedings expected in the coming months. Further proceedings are also expected with respect to ON Semiconductor’s other IPR petitions in the coming months. Although the validity of the Company’s challenged patents has previously been confirmed in the Company’s District Court litigation with Fairchild and in many cases in prior PTO reexamination proceedings as well, and though the Company intends to vigorously defend the validity of its patents, the outcome of the IPR proceedings is uncertain.
On April 1, 2016, Opticurrent, LLC filed a complaint against the Company in the United States District Court for the Eastern District of Texas. In its complaint, Opticurrent alleges that the Company has infringed and is infringing one patent pertaining to transistor switch devices. The Company has filed a motion to transfer the case to California, which will be addressed in the coming months. Further proceedings and discovery are expected over the course of the coming months, with trial currently scheduled for October 2017. The Company intends to vigorously defend itself against Opticurrent’s claims.
On August 11, 2016, ON Semiconductor filed a complaint against the Company in the United States District Court for the District of Arizona. In its complaint, ON Semiconductor alleges that the Company has infringed and is infringing five patents and requests injunctive relief, and the complaint also seeks a declaration of non-infringement with respect to three of the Company’s patents that were previously asserted against Fairchild Semiconductor. The Company has not yet answered ON Semiconductor’s complaint, but the Company has filed a motion to dismiss and/or transfer the case to the Northern District of California, which will be addressed in the coming months. No date has been set for trial, but the Company believes it has valid defenses and intends to vigorously defend itself against ON Semiconductor’s claims.
On November 1, 2016, the Company filed a lawsuit against ON Semiconductor in the United States District Court for the Northern District of California to address ON Semiconductor’s infringement of six patents. No date has been set for trial, but ON Semiconductor has filed a motion requesting that the case be transferred to Arizona, an issue that will be addressed in the coming months.
On December 27, 2016, ON Semiconductor filed a complaint against the Company in the United States District Court for the Eastern District of Texas. In its complaint, ON Semiconductor alleges that the Company has infringed and is infringing six patents and requests injunctive relief. The Company has not yet answered ON Semiconductor’s complaint, and no date has been
73
set for trial, but the Company believes it has valid defenses and intends to vigorously defend itself against ON Semiconductor’s claims.
The Company is unable to predict the outcome of legal proceedings with certainty, and there can be no assurance that Power Integrations will prevail in the above-mentioned unsettled litigations. These litigations, whether or not determined in Power Integrations’ favor or settled, will be costly and will divert the efforts and attention of the Company’s management and technical personnel from normal business operations, potentially causing a material adverse effect on the business, financial condition and operating results. Currently, the Company is not able to estimate a loss or a range of loss for the ongoing litigation disclosed above, however adverse determinations in litigation could result in monetary losses, the loss of proprietary rights, subject the Company to significant liabilities, require Power Integrations to seek licenses from third parties or prevent the Company from licensing the technology, any of which could have a material adverse effect on the Company’s business, financial condition and operating results.
11. ACQUISITIONS:
Cambridge Semiconductor Limited
In December 2014, the Company entered into a loan agreement with Cambridge Semiconductor Limited (CamSemi), a UK company, in which $6.6 million was outstanding as of December 31, 2014. The estimated fair value of the loan, which was a level 3 fair value measurement, approximated the carrying value of $6.6 million, as the loan was outstanding for less than a month and the interest rate approximated a market rate for such a loan. The loan was in anticipation of a definitive agreement the Company entered into to acquire CamSemi on January 2, 2015.
On January 2, 2015, the Company acquired 100% of the shares outstanding of CamSemi for total consideration of approximately $23.3 million, of which $16.7 million was paid in cash and $6.6 million was applied against the outstanding loan owed to the Company. The acquisition-related costs for the purchase of CamSemi totaled $1.0 million, with $0.8 million recognized in 2014 and $0.2 million recognized in 2015.
CamSemi was acquired to accelerate the Company's product development efforts for the low-power market. The acquisition also broadens the Company's technology and product portfolio for low-power applications, particularly in the mobility and LED lighting markets. The purchase price allocated to goodwill in the acquisition (as noted in the purchase price allocation below) is related largely to synergies and economies of scale expected from combining the operations of CamSemi with those of the Company.
The following table summarizes the purchase price and estimated fair values of the assets acquired and the liabilities assumed as of January 2, 2015, the completion of the acquisition of CamSemi:
(in thousands) | Total Amount | ||
Assets Acquired | |||
Cash | $ | 1,134 | |
Accounts receivable | 1,891 | ||
Inventories | 1,409 | ||
Prepaid expenses and other current assets | 408 | ||
Tax receivable | 1,093 | ||
Intangible assets: | |||
Developed technology | 6,600 | ||
Customer relationships | 2,420 | ||
Goodwill | 11,250 | ||
Total assets acquired | 26,205 | ||
Liabilities Assumed | |||
Current liabilities | 1,832 | ||
Taxes payable | 1,090 | ||
Total liabilities assumed | 2,922 | ||
Total purchase price | $ | 23,283 | |
74
The following table represents details of the purchased intangible assets:
Fair Value Amount (in thousands) | Estimated Useful Life (in years) | ||||||
Developed technology | $ | 6,600 | 3 | - | 7 | ||
Customer relationships | 2,420 | 5 | |||||
Total acquired CamSemi intangibles | $ | 9,020 | |||||
The fair value of the identifiable intangible assets: developed technology and customer relationships were determined based on the following approach.
Developed Technology. The income approach was used to value the acquired developed technology. Revenue attributable to the Company’s technology was estimated based on expected evolution of the technology over time. Expenses were assumed to reflect the costs necessary to support the developed technology. The present value was capitalized as developed technology as of the acquisition date and is being amortized using a straight-line method to cost of revenues over the estimated life of 3 - 7 years.
Customer Relationships. An intangible customer relationship asset was recognized to the extent that the Company was expected to benefit from future revenues reasonably anticipated given the historical customer relationships and operating practices of CamSemi. In order to determine the fair value of the customer relationships, the Company’s analysis assumed that the Company would immediately benefit from the economics generated by CamSemi’s existing customer relationships. This amount was reduced by the potential impact given no past customer relationships and the assumption that the Company could reacquire the customer relationships and ramp up to a similar level of revenue within two years. The fair value of customer relationships was capitalized as of the acquisition date and is being amortized on a straight line basis to sales and marketing expenses over the estimated life of 5 years.
Pro forma results of operations for this acquisition have not been presented because it is not material to the Company’s consolidated financial statements.
Corporate Headquarters Building
In August 2015, the Company purchased a building adjacent to its corporate headquarters in San Jose, California to support the continued growth of the business. The purchase has been accounted for using the acquisition method of accounting in accordance with ASC 805, Business Combinations, as the building had existing rental income resulting from in-place lease agreements with third-party tenants. The aggregate purchase price of $10.4 million, funded with cash on hand, was allocated as follows: $3.5 million for land, $6.3 million for building and improvements, $0.7 million for in-place leases and $(0.1) million for liabilities assumed. The building and improvements are being depreciated on a straight-line basis over an estimated useful life of up to 30 years. Additionally, as a result of the purchase, the Company acquired existing third-party leases that were valued as in-place lease intangible assets and are being amortized over the weighted average estimated life of two years. The valuation of the acquired in-place leases were estimated by the Company based on the amount of avoided cash outflows necessary to originate such leases. Acquisition-related costs in connection with the building purchase were included in other income in the consolidated statements of income and were not material for the periods presented.
Rental income from third-party leases, and the proportionate share of building expenses for those leases, are included in other income in the consolidated statements of income from the date of acquisition. These amounts were not material for the periods presented.
12. RETIREMENT PLANS:
The Company sponsors a defined benefit pension plan (Pension Plan) for its Swiss subsidiary in accordance with the legal requirements of Switzerland. The plan assets, which provide benefits in the event of an employee’s retirement, death or disability, are held in legally autonomous trustee-administered funds that are subject to Swiss law. Benefits are based on the employee’s age, years of service and salary, and the plan is financed by contributions by both the employee and the Company.
75
The net periodic benefit cost of the Pension Plan was not material to the Company's financial statements during the years ended December 31, 2016, 2015 and 2014. At December 31, 2016, the projected benefit obligation was $11.8 million, the plan assets were $7.9 million and the net pension liability was $3.9 million. As of December 31, 2015, the projected benefit obligation was $9.0 million, the plan assets were $6.0 million, and the net pension liability was $3.0 million. The Company has recorded the unfunded amount as a liability in its consolidated balance sheet at December 31, 2016 and 2015, under the other liabilities caption. The Company expects to make contributions to the Pension Plan of approximately $0.4 million during 2017. The unrealized actuarial loss on pension benefits, net of tax at December 31, 2016, 2015 and 2014 was $1.9 million, $1.6 million and $1.2 million, respectively. These amounts were reflected in Note 2 above under the caption accumulated other comprehensive loss.
In accordance with the Compensation-Retirement Benefits Topic of ASC 715-20, Defined Benefits Plan, the Company recognizes the over-funded or under-funded status of its defined post-retirement plan as an asset or liability in its statement of financial position. The company measured the plan assets and benefit obligations as of the date of the fiscal year-end.
13. BANK LINE OF CREDIT:
On July 5, 2012, the Company entered into a Credit Agreement with two banks. The Credit Agreement provides the Company with a $100.0 million revolving line of credit to use for general corporate purposes with a $20.0 million sublimit for the issuance of standby and trade letters of credit. The Credit Agreement was amended on April 1, 2014, to extend the Credit Agreement termination date from July 5, 2015, to April 1, 2017, with all other terms of the Credit Agreement remaining the same.
On July 27, 2016, the Company terminated the Credit Agreement and entered into a new Credit Agreement with a bank (the "New Credit Agreement"). The New Credit Agreement provides the Company with a $75.0 million revolving line of credit to use for general corporate purposes with a $20.0 million sub-limit for the issuance of standby and trade letters of credit. The Company’s ability to borrow under the revolving line of credit is conditioned upon the Company’s compliance with specified covenants, including reporting and financial covenants, primarily a minimum cash requirement and a debt to earnings ratio, with which the Company is currently in compliance. The New Credit Agreement terminates on July 26, 2019; all advances under the revolving line of credit will become due on such date, or earlier in the event of a default. As of December 31, 2016, the Company had no amount outstanding under the New Credit Agreement.
14. SELECTED QUARTERLY INFORMATION (Unaudited):
The following tables set forth certain data from the Company's consolidated statements of income for each of the quarters in the years ended December 31, 2016 and 2015.
The unaudited quarterly consolidated financial statements have been prepared on the same basis as the audited consolidated financial statements contained herein and include all adjustments that the Company considers necessary for a fair presentation of such information when read in conjunction with the Company's annual audited consolidated financial statements and notes thereto appearing elsewhere in this report. The operating results for any quarter are not necessarily indicative of the results for any subsequent period or for the entire fiscal year.
Three Months Ended | |||||||||||||||||||||||||||||||
(unaudited) | |||||||||||||||||||||||||||||||
Dec. 31, | Sept. 30, | June 30, | Mar. 31, | Dec. 31, | Sept. 30, | June 30, | Mar. 31, | ||||||||||||||||||||||||
(in thousands, except per share data) | 2016 | 2016 | 2016 | 2016 | 2015 | 2015 | 2015 | 2015 | |||||||||||||||||||||||
Net revenues | $ | 101,108 | $ | 103,790 | $ | 97,169 | $ | 85,326 | $ | 87,289 | $ | 88,878 | $ | 85,265 | $ | 82,557 | |||||||||||||||
Gross profit | $ | 49,384 | $ | 51,193 | $ | 47,637 | $ | 42,947 | $ | 42,916 | $ | 44,161 | $ | 44,018 | $ | 42,292 | |||||||||||||||
Net income | $ | 13,617 | $ | 14,165 | $ | 11,265 | $ | 8,843 | $ | 12,701 | $ | 11,513 | $ | 8,590 | $ | 6,343 | |||||||||||||||
Earnings per share | |||||||||||||||||||||||||||||||
Basic | $ | 0.47 | $ | 0.49 | $ | 0.39 | $ | 0.31 | $ | 0.45 | $ | 0.40 | $ | 0.29 | $ | 0.22 | |||||||||||||||
Diluted | $ | 0.46 | $ | 0.48 | $ | 0.38 | $ | 0.30 | $ | 0.44 | $ | 0.39 | $ | 0.29 | $ | 0.21 | |||||||||||||||
Shares used in per share calculation | |||||||||||||||||||||||||||||||
Basic | 29,196 | 28,972 | 28,850 | 28,679 | 28,483 | 28,855 | 29,368 | 29,309 | |||||||||||||||||||||||
Diluted | 29,914 | 29,625 | 29,422 | 29,244 | 29,126 | 29,298 | 30,034 | 30,058 | |||||||||||||||||||||||
76
On January 2, 2015, the Company acquired 100% of the shares outstanding of CamSemi for total consideration of approximately $23.3 million, of which $16.7 million was paid in cash and $6.6 million was applied against the outstanding loan owed to the Company. The acquisition-related costs for the purchase of CamSemi totaled $1.0 million, with $0.8 million recognized in 2014 and $0.2 million recognized in 2015. See Note 11, Acquisitions.
77
Schedule II
Valuation and Qualifying Accounts
The Company maintains an allowance for doubtful accounts for estimated losses resulting from the inability of customers to make required payments. This allowance is established using estimates formulated by the Company’s management based upon factors such as the composition of the accounts receivable aging, historical bad debt, changes in payments patterns, customer creditworthiness, and current economic trends. The Company maintains an allowance for the distributors’ ship and debit credits relating to the sell-through of the Company’s products. This reserve is established using the Company’s historical ship and debit amounts and levels of inventory in the distributor channels.
Following is a summary of the activity in the allowance for doubtful accounts and allowance for ship and debit credits:
(in thousands) | Balance at Beginning of Period | Charged to Costs and Expenses | Deductions(1) | Balance at End of Period | |||||||||||
Allowance for doubtful accounts: | |||||||||||||||
Year ended December 31, 2014 | $ | 120 | $ | 135 | $ | (64 | ) | $ | 191 | ||||||
Year ended December 31, 2015 | $ | 191 | $ | 133 | $ | (6 | ) | $ | 318 | ||||||
Year ended December 31, 2016 | $ | 318 | $ | 207 | $ | — | $ | 525 | |||||||
_______________
(1) Deductions relate to amounts written off against the allowance for doubtful accounts.
(in thousands) | Balance at Beginning of Period | Charged to Costs and Expenses | Deductions(2) | Balance at End of Period | |||||||||||
Allowance for ship and debit credits: | |||||||||||||||
Year ended December 31, 2014 | $ | 28,696 | $ | 177,260 | $ | (178,531 | ) | $ | 27,425 | ||||||
Year ended December 31, 2015 | $ | 27,425 | $ | 195,669 | $ | (188,679 | ) | $ | 34,415 | ||||||
Year ended December 31, 2016 | $ | 34,415 | $ | 262,501 | $ | (258,841 | ) | $ | 38,075 | ||||||
_______________
(2) Deductions relate to ship and debit credits issued which adjust the sell-in price from the standard distribution price to the pre-approved lower price. Refer to Note 2, Summary of Significant Accounting Policies, for the Company’s revenue recognition policy, including the Company’s accounting for ship and debit claims.
78
Item 16. Form 10-K Summary
Not provided.
79
SIGNATURES
Pursuant to the requirements of the Securities Exchange Act of 1934, the registrant has duly caused this report to be signed on its behalf by the undersigned thereunto duly authorized.
POWER INTEGRATIONS, INC. | |||
Dated: | February 8, 2017 | By: | /s/ SANDEEP NAYYAR |
Sandeep Nayyar Chief Financial Officer (Duly Authorized Officer, Principal Financial Officer and Chief Accounting Officer) | |||
80
POWER OF ATTORNEY
KNOW ALL PERSONS BY THESE PRESENTS, that each person whose signature appears below constitutes and appoints Balu Balakrishnan and Sandeep Nayyar his true and lawful attorney-in-fact and agent, with full power of substitution and, for him and in his name, place and stead, in any and all capacities to sign any and all amendments to this Report on Form 10-K, and to file the same, with all exhibits thereto and other documents in connection therewith, with the Securities and Exchange Commission, granting unto said attorney-in-fact and agent full power and authority to do and perform each and every act and thing requisite and necessary to be done in connection therewith, as fully to all intents and purposes as he might or could do in person, hereby ratifying and confirming all that said attorney-in-fact and agent, or his substitute or substitutes, may lawfully do or cause to be done by virtue hereof.
PURSUANT TO THE REQUIREMENTS OF THE SECURITIES EXCHANGE ACT OF 1934, THIS REPORT HAS BEEN SIGNED BY THE FOLLOWING PERSONS ON BEHALF OF THE REGISTRANT AND IN THE CAPACITIES AND ON THE DATES INDICATED.
Dated: | February 8, 2017 | By: | /s/ BALU BALAKRISHNAN |
Balu Balakrishnan | |||
President, Chief Executive Officer | |||
(Principal Executive Officer) | |||
Dated: | February 8, 2017 | By: | /s/ SANDEEP NAYYAR |
Sandeep Nayyar | |||
Chief Financial Officer | |||
(Principal Financial and Principal Accounting Officer) | |||
Dated: | February 8, 2017 | By: | /s/ ALAN D. BICKELL |
Alan D. Bickell | |||
Director | |||
Dated: | February 8, 2017 | By: | /s/ NICHOLAS E. BRATHWAITE |
Nicholas E. Brathwaite | |||
Director | |||
Dated: | February 8, 2017 | By: | /s/ E. FLOYD KVAMME |
E. Floyd Kvamme | |||
Director and Chairman of the Board | |||
Dated: | February 8, 2017 | By: | /s/ STEVEN J. SHARP |
Steven J. Sharp | |||
Director | |||
Dated: | February 8, 2017 | By: | /s/ BALAKRISHNAN S. IYER |
Balakrishnan S. Iyer | |||
Director | |||
Dated: | February 8, 2017 | By: | /s/ WILLIAM GEORGE |
William George | |||
Director | |||
81
POWER INTEGRATIONS, INC.
INDEX TO EXHIBITS
TO
FORM 10-K ANNUAL REPORT
For the Year Ended
December 31, 2016
Incorporation by Reference | |||||||||||||
Exhibit Number | Exhibit Description | Form | File Number | Exhibit/Appendix Reference | Filing Date | Filed Herewith | |||||||
3.1 | Restated Certificate of Incorporation | 10-K | 000-23441 | 3.1 | 2/29/2012 | ||||||||
3.2 | Amended and Restated Bylaws | 8-K | 000-23441 | 3.1 | 4/26/2013 | ||||||||
4.1 | Reference is made to Exhibits 3.1 to 3.2 | ||||||||||||
10.1* | Form of Indemnity Agreement for directors and officers | S-1 | 333-35421 | 10.1 | 9/11/1997 | ||||||||
10.2* | Power Integrations, Inc. Compliance Policy Regarding IRC Section 409A | 10-K | 000-23441 | 10.63 | 3/2/2009 | ||||||||
10.3* | 1997 Employee Stock Purchase Plan, as amended | DEF14A | 000-23441 | Appendix B | 3/25/2016 | ||||||||
10.4* | Forms of agreement under 1997 Employee Stock Purchase Plan | S-1 | 333-35421 | 10.5 | 9/11/1997 | ||||||||
10.5* | 1997 Stock Option Plan (as amended through January 25, 2005) | 10-Q | 000-23441 | 10.5 | 5/6/2005 | ||||||||
10.6* | Forms of Option Agreements under the 1997 Stock Option Plan | 10-K | 000-23441 | 10.41 | 8/8/2007 | ||||||||
10.7* | Forms of Option Agreements under the 1997 Stock Option Plan with Executive Officers in connection with the Chief Executive Officer Benefits Agreement and the Executive Officer Benefits Agreements | 10-K | 000-23441 | 10.40 | 8/8/2007 | ||||||||
10.8* | Amendment to Immediately Exercisable Non-Qualified Stock Option Agreement between Power Integrations, Inc. and Balu Balakrishnan, dated February 2, 2009 | 10-K | 000-23441 | 10.59 | 3/2/2009 | ||||||||
10.9* | 1997 Outside Directors Stock Option Plan | 10-Q | 000-23441 | 10.3 | 8/6/2009 | ||||||||
10.10* | Amendment No. 1 to the Power Integrations, Inc. 1997 Outside Directors Stock Option Plan, effective as of January 27, 2009 | 10-K | 000-23441 | 10.62 | 3/2/2009 | ||||||||
10.11* | Amendment No. 2 to the Power Integrations, Inc. 1997 Outside Directors Stock Option Plan, effective as of April 12, 2010 | 10-Q | 000-23441 | 10.2 | 5/6/2010 | ||||||||
10.12* | Forms of agreement under 1997 Outside Directors Stock Option Plan | S-1 | 333-35421 | 10.4 | 9/11/1997 | ||||||||
10.13* | Amendment No. 1 to Nonstatutory Stock Option Agreements for Outside Directors, dated February 20, 2007, between us and Alan Bickell | 10-K | 000-23441 | 10.35 | 3/8/2007 | ||||||||
10.14* | Amendment No. 1 to Nonstatutory Stock Option Agreements for Outside Directors, dated February 20, 2007, between us and Nicholas Brathwaite | 10-K | 000-23441 | 10.36 | 3/8/2007 | ||||||||
10.15* | Form of Director Option Grant Agreement. | 10-Q | 000-23441 | 10.9 | 5/6/2009 | ||||||||
10.16* | Director Equity Compensation Program, as revised in July 2012 and January 2013 | 10-K | 000-23441 | 10.36 | 2/22/2013 | ||||||||
10.17* | Forms of Stock Option Agreements to be used in Director Equity Compensation Program | 10-Q | 000-23441 | 10.5 | 11/7/2008 | ||||||||
10.18* | Outside Director Cash Compensation Arrangements | 10-Q | 000-23441 | 10.3 | 11/3/2010 | ||||||||
82
Incorporation by Reference | |||||||||||||
Exhibit Number | Exhibit Description | Form | File Number | Exhibit/Appendix Reference | Filing Date | Filed Herewith | |||||||
10.19* | 2007 Equity Incentive Plan, as amended and restated | 10-Q | 000-23441 | 10.2 | 8/7/2012 | ||||||||
10.20* | Forms of Option Agreements under the 2007 Equity Incentive Plan | Schedule TO | 000-23441 | 99.(D)(4) | 12/3/2008 | ||||||||
10.21* | Form of Restricted Stock Unit Grant Notice and Form of Restricted Stock Unit Award Agreement under the 2007 Equity Incentive Plan | 10-Q | 000-23441 | 10.1 | 5/6/2010 | ||||||||
10.22* | Form of Performance Stock Unit Grant Notice and Performance Stock Unit Agreement (as used after to January 1, 2013) under the 2007 Equity Incentive Plan | 10-K | 000-23441 | 10.29 | 2/22/2013 | ||||||||
10.23* | Form of Long Term Performance Stock Unit Notice and Agreement under the 2007 Equity Incentive Plan | 10-K | 000-23441 | 10.84 | 2/10/2015 | ||||||||
10.24* | Power Integrations, Inc. 2016 Incentive Award Plan | DEF14A | 000-23441 | Appendix A | 3/25/2016 | ||||||||
10.25* | Form of restricted Stock Unit Grant Notice and Agreement under the 2016 Incentive Award Plan | X | |||||||||||
10.26* | Form of Performance Stock Unit Notice and Agreement under the 2007 Equity Incentive Plan | X | |||||||||||
10.27* | Form of Long Term Performance Stock Unit Notice and Agreement under the 2007 Equity Incentive Plan | X | |||||||||||
10.28 | Technology License Agreement between us and Matsushita Electronics Corporation, dated as of June 29, 2000 | 10-Q | 000-23441 | 10.28 | 11/14/2000 | ||||||||
10.29† | Wafer Supply Agreement between us and ZMD Analog Mixed Signal Services GmbH & Co. KG, dated as of May 23, 2003 | 10-Q | 000-23441 | 10.32 | 8/7/2003 | ||||||||
10.30† | Amended and Restated Wafer Supply Agreement between us and OKI Electric Industry Co., Ltd., dated as of April 1, 2003 | 10-Q | 000-23441 | 10.31 | 8/7/2003 | ||||||||
10.31† | Amendment Number One to the Amended and Restated Wafer Supply Agreement between us and OKI Electric Industry Co., Ltd., effective as of August 11, 2004 | 8-K | 000-23441 | 10.22 | 4/18/2006 | ||||||||
10.32 | Amendment Number Two to the Amended and Restated Wafer Supply Agreement between Power Integrations International, Ltd. and OKI Electric Industry Co., Ltd., effective as of April 1, 2008 | 10-Q | 000-23441 | 10.5 | 8/8/2008 | ||||||||
10.33 | Amendment Number Three to the Amended and Restated Wafer Supply Agreement between Power Integrations International, Ltd. and OKI Electric Industry Co., Ltd., effective as of June 9, 2008 | 10-Q | 000-23441 | 10.5 | 8/8/2008 | ||||||||
10.34† | Amendment Number Four to the Amended and Restated Wafer Supply Agreement between Power Integrations International, Ltd. and OKI Electric Industry Co., Ltd., dated September 15, 2008 | 10-Q | 000-23441 | 10.2 | 11/7/2008 | ||||||||
10.35† | Amendment Number Five to the Amended and Restated Wafer Supply Agreement between Power Integrations International, Ltd. and OKI Semiconductor Co., Ltd., effective as of November 14, 2008 | 10-K | 000-23441 | 10.61 | 3/2/2009 | ||||||||
10.36† | Amendment Number Six to the Amended and Restated Wafer Supply Agreement between Power Integrations International, Ltd. and OKI Semiconductor Co., Ltd., effective as of November 1, 2015 | 10-K | 000-23441 | 10.32 | 2/11/2016 | ||||||||
83
Incorporation by Reference | |||||||||||||
Exhibit Number | Exhibit Description | Form | File Number | Exhibit/Appendix Reference | Filing Date | Filed Herewith | |||||||
10.37† | Amendment Number Seven to the Amended and Restated Wafer Supply Agreement between Power Integrations International, Ltd. and OKI Semiconductor Co., Ltd., effective as of August 8, 2016 | 10-Q | 000-23441 | 10.1 | 11/1/2016 | ||||||||
10.38† | Wafer Supply Agreement, between Seiko Epson Corporation and Power Integrations International, Ltd. effective as of April 1, 2005 | 10-Q | 000-23441 | 10.1 | 11/7/2008 | ||||||||
10.39† | Amendment Number One to the Wafer Supply Agreement between Power Integrations International, Ltd. and Seiko Epson Corporation, with an effective date of December 19, 2008 | 10-Q | 000-23441 | 10.1 | 5/6/2009 | ||||||||
10.40† | Amendment Number Two to Wafer Supply Agreement, between Seiko Epson Corporation and Power Integrations International, Ltd., entered into on January 5, 2011 | 10-K | 000-23441 | 10.47 | 2/25/2011 | ||||||||
10.41† | Amendment Number Three to Wafer Supply Agreement, effective as of February 1, 2012, by Power Integrations International Ltd. and Seiko Epson Corporation | 10-Q | 000-23441 | 10.1 | 5/8/2012 | ||||||||
10.42† | Development Addendum to Wafer Supply Agreement, dated September 22, 2013, between Seiko Epson Corporation and Power Integrations International Ltd | 10-Q | 000-23441 | 10.1 | 11/1/2013 | ||||||||
10.43† | Amendment Number Four to Wafer Supply Agreement, effective as of April 1, 2015, by Power Integrations International Ltd. and Seiko Epson Corporation | 10-K | 000-23441 | 10.38 | 2/11/2016 | ||||||||
10.44† | Amendment Number Five to Wafer Supply Agreement, effective as of November 2, 2015, by Power Integrations International Ltd. and Seiko Epson Corporation | 10-K | 000-23441 | 10.39 | 2/11/2016 | ||||||||
10.45† | Amendment Number Six to Wafer Supply Agreement, effective as of December 8, 2015, by Power Integrations International Ltd. and Seiko Epson Corporation | 10-K | 000-23441 | 10.40 | 2/11/2016 | ||||||||
10.46† | Amendment Number Seven to Wafer Supply Agreement, effective as of October 3, 2016, by Power Integrations International Ltd. and Seiko Epson Corporation | X | |||||||||||
10.47† | Amendment Number Eight to Wafer Supply Agreement, effective as of November 8, 2016 by Power Integrations International Ltd. and Seiko Epson Corporation | X | |||||||||||
10.48† | Amendment Number One to the Amended and Restated Wafer Supply Agreement between Power Integrations International, Ltd. and XFAB Dresden GmbH & Co. KG, effective as of July 20, 2005 | 10-K | 000-23441 | 10.66 | 2/26/2010 | ||||||||
10.49† | Wafer Supply Agreement, made and entered into as of October 1, 2010, by and between Power Integrations International, Ltd., and X-FAB Semiconductor Foundries AG | 10-Q | 000-23441 | 10.2 | 5/8/2012 | ||||||||
10.50† | Amendment Number One to Wafer Supply Agreement, effective as of January 1, 2014, between Power Integrations International, Ltd., and X-FAB Semiconductor Foundries AG | 10-Q/A | 000-23441 | 10.2 | 9/19/2014 | ||||||||
10.51 | Credit Agreement, dated July 5, 2012, by and between Power Integrations, Inc., Union Bank N.A. and Wells Fargo Bank, National Association | 10-Q | 000-23441 | 10.1 | 10/31/2012 | ||||||||
84
Incorporation by Reference | |||||||||||||
Exhibit Number | Exhibit Description | Form | File Number | Exhibit/Appendix Reference | Filing Date | Filed Herewith | |||||||
10.52 | First Amendment to Credit Agreement dated December 17, 2012, between Power Integrations, Inc., Union Bank, N.A. and Wells Fargo Bank, National Association | 10-K | 000-23441 | 10.61 | 2/22/2013 | ||||||||
10.53 | Second Amendment to Credit Agreement, dated April 1, 2014, by and between Power Integrations, Inc., Union Bank N.A. and Wells Fargo Bank, National Association | 10-Q | 000-23441 | 10.1 | 5/5/2014 | ||||||||
10.54 | Credit Agreement, dated July 27, 2016, by and between Power Integrations Inc. and Wells Fargo Bank, National Association | 10-Q | 000-23441 | 10.1 | 7/29/2016 | ||||||||
10.55* | 2016 Executive Officer Compensation Arrangements and 2016 Performance Based Incentive Plan | 8-K | 000-23441 | Item 5.02 | 2/1/2016 | ||||||||
10.56* | 2015 Executive Officer Cash Compensation Arrangements and 2015 Bonus Plan | 8-K | 000-23441 | Item 5.02 | 2/2/2015 | ||||||||
10.57* | Offer Letter, dated June 23, 2010, between Power Integrations, Inc. and Sandeep Nayyar | 10-Q | 000-23441 | 10.2 | 8/6/2010 | ||||||||
10.58* | Form of Restricted Stock Unit Grant Notice and Form of Restricted Stock Unit Award Agreement for executive officers for use prior to January 2013 | 10-Q | 000-23441 | 10.6 | 8/6/2010 | ||||||||
10.59* | Form of Restricted Stock Unit Grant Notice and Form of Restricted Stock Unit Award Agreement for executive officers for use after January 2013 | 10-K | 000-23441 | 10.48 | 2/22/2013 | ||||||||
10.60* | Amended and Restated Chief Executive Officer Benefits Agreement, dated as of May 1, 2014, between Power Integrations, Inc. and Balu Balakrishnan | 10-Q | 000-23441 | 10.3 | 5/5/2014 | ||||||||
10.61* | Amended and Restated Executive Officer Benefits Agreement, dated as of May 1, 2014, between Power Integrations, Inc. and Cliff Walker | 10-Q | 000-23441 | 10.5 | 5/5/2014 | ||||||||
10.62* | Amended and Restated Executive Officer Benefits Agreement, dated as of May 1, 2014, between Power Integrations, Inc. and Doug Bailey | 10-Q | 000-23441 | 10.6 | 5/5/2014 | ||||||||
10.63* | Amended and Restated Executive Officer Benefits Agreement, dated as of May 1, 2014, between Power Integrations, Inc. and Ben Sutherland | 10-Q | 000-23441 | 10.7 | 5/5/2014 | ||||||||
10.64* | Amended and Restated Executive Officer Benefits Agreement, dated as of May 1, 2014, between Power Integrations, Inc. and Sandeep Nayyar | 10-Q | 000-23441 | 10.8 | 5/5/2014 | ||||||||
10.65* | Amended and Restated Executive Officer Benefits Agreement, dated as of May 1, 2014, between Power Integrations, Inc. and Mike Matthews | 10-Q | 000-23441 | 10.10 | 5/5/2014 | ||||||||
10.66* | Amended and Restated Executive Officer Benefits Agreement, dated as of May 1, 2014, between Power Integrations, Inc. and Radu Barsan | 10-Q | 000-23441 | 10.11 | 5/5/2014 | ||||||||
10.67* | Executive Officer Benefits Agreement, dates as of April 23, 2015, between Power Integrations, Inc. and Raja Petrakian | 10-Q | 000-23441 | 10.1 | 7/31/2015 | ||||||||
10.68* | Compensation arrangement with Balu Balakrishnan | 10-Q | 000-23441 | Item 5 of Part II | 5/5/2014 | ||||||||
14.1 | Code of Business Conduct and Ethics | 8-K | 000-23441 | 14.1 | 2/4/2008 | ||||||||
21.1 | List of subsidiaries | X | |||||||||||
23.1 | Consent of Independent Registered Public Accounting Firm | X | |||||||||||
85
Incorporation by Reference | |||||||||||||
Exhibit Number | Exhibit Description | Form | File Number | Exhibit/Appendix Reference | Filing Date | Filed Herewith | |||||||
24.1 | Power of Attorney (See signature page) | X | |||||||||||
31.1 | Certification of Chief Executive Officer pursuant to Section 302 of the Sarbanes-Oxley Act of 2002 | X | |||||||||||
31.2 | Certification of Chief Financial Officer pursuant to Section 302 of the Sarbanes-Oxley Act of 2002 | X | |||||||||||
32.1** | Certification of Chief Executive Officer pursuant to Section 906 of the Sarbanes-Oxley Act of 2002 | X | |||||||||||
32.2** | Certification of Chief Financial Officer pursuant to Section 906 of the Sarbanes-Oxley Act of 2002 | X | |||||||||||
101.INS | XBRL Instance Document | X | |||||||||||
101.SCH | XBRL Taxonomy Extension Schema Document | X | |||||||||||
101.CAL | XBRL Taxonomy Extension Calculation Linkbase Document | X | |||||||||||
101.DEF | XBRL Taxonomy Extension Definition Linkbase Document | X | |||||||||||
101.LAB | XBRL Taxonomy Extension Label Linkbase Document | X | |||||||||||
101.PRE | XBRL Taxonomy Extension Presentation Linkbase Document | X | |||||||||||
All references in the table above to previously filed documents or descriptions are incorporating those documents and descriptions by reference thereto.
_____________
† | This Exhibit has been filed separately with the Commission pursuant to an application for confidential treatment. The confidential portions of this Exhibit have been omitted and are marked by an asterisk. |
* | Indicates a management contract or compensatory plan or arrangement. |
** | The certifications attached as Exhibits 32.1 and 32.2 accompanying this Form 10-K, are not deemed filed with the SEC, and are not to be incorporated by reference into any filing of Power Integrations, Inc. under the Securities Act of 1933, as amended, or the Securities Exchange Act of 1934, as amended, whether made before or after the date of this Form 10-K, irrespective of any general incorporation language contained in such filing. |
86