Attached files
| file | filename |
|---|---|
| 8-K - 8-K - FIRST HAWAIIAN, INC. | a17-4022_18k.htm |
Exhibit 99.1
Financial community presentation February 2017

Disclaimer Forward-Looking Statements This presentation contains forward-looking statements within the meaning of the Private Securities Litigation Reform Act of 1995. These forward-looking statements reflect our current views with respect to, among other things, future events and our financial performance. These statements are often, but not always, made through the use of words or phrases such as “may,” “might,” “should,” “could,” “predict,” “potential,” “believe,” “expect,” “continue,” “will,” “anticipate,” “contemplate,” “seek,” “estimate,” “intend,” “plan,” “target,” “project,” “would,” “annualized” and “outlook,” or the negative version of those words or other comparable words or phrases of a future or forward-looking nature. These forward-looking statements are not historical facts and are based on current expectations, estimates and projections about our industry, management's beliefs and certain assumptions made by management, many of which, by their nature, are inherently uncertain and beyond our control. Accordingly, we caution you that any such forward-looking statements are not guarantees of future performance and are subject to risks, assumptions, estimates and uncertainties that are difficult to predict. Although we believe that the expectations reflected in these forward-looking statements are reasonable as of the date made, actual results may prove to be materially different from the results expressed or implied by the forward-looking statements. For a discussion of some of the risks and important factors that could affect our future results and financial condition, see our U.S. Securities and Exchange Commission (“SEC”) filings, including, but not limited to, our prospectus dated January 31, 2017, filed with the SEC in accordance with Rule 424(b) of the Securities Act of 1933. Except as required by law, we assume no obligation to update these forward-looking statements or to update the reasons why actual results could differ materially from those anticipated in the forward-looking statements, even if new information becomes available in the future. Use of Non-GAAP Financial Measures The information provided herein includes certain non-GAAP financial measures. We believe that these core measures provide useful information about our operating results and enhance the overall understanding of our past performance and future performance. Although these non-GAAP financial measures are frequently used by stakeholders in the evaluation of a company, they have limitations as analytical tools and should not be considered in isolation or as a substitute for analysis of our results or financial condition as reported under GAAP. Investors should consider our performance and financial condition as reported under GAAP and all other relevant information when assessing our performance or financial condition. The reconciliation of such measures to the comparable GAAP figures are included in the appendix of this presentation. 1
R:79 G:129 B:189 Best-in-Class Franchise 2 Company Overview Financial Overview – FY 2016 ($ billions) Balance Sheet Assets $19.7 Deposits 16.8 Loans 11.5 Tangible Common Equity 1.5 Core Operating(1) NIM 2.88% Non-Interest Income / Total Revenue 27.9 Efficiency Ratio 47.3 ROATA(2) 1.18 ROATCE(2) 13.8 Credit NCOs (Recoveries) / Average Loans 0.08% Non-Accrual Loans / Total Loans 0.08 Reserves / Non-Accrual Loans 14.4x Capital CET1 / Tier 1 RBC 12.8% Total RBC 13.9 Tier 1 Leverage 8.4 Other AUA $12.1 Branches 62 Full-Time Equivalent Employees 2,179 Oldest and largest Hawaii-based bank Focused on relationship-based banking driven by deep ties to the communities we serve #1 deposit market share in Hawaii since 2004 #1 Hawaii-based lender by balance sheet loans for C&I, construction & land development, small business, and consumer $12.1bn of assets under administration The largest merchant processor in Hawaii with over $4.3bn of annual card spend processed in 2015 Recognized as one of Hawaii's best places to work, Hawaii’s most charitable company, and one of the top 200 healthiest U.S. banks Significant employee engagement / loyalty with average employee tenure of 12.5 years Source: DepositAccounts (Top 200 Healthiest U.S. banks) Core operating measures exclude certain gains, expenses and one-time items. See quarterly non-GAAP reconciliation of core net income, core net interest income, core noninterest income and core noninterest expense in the appendix. ROATA (return on average tangible assets) and ROATCE (return on average tangible common equity) are non-GAAP financial measures. A reconciliation to the comparable GAAP measurement is provided in the appendix. Loans: $11.5 billion 4Q16 Loan Yield: 3.85% Deposits: $16.8 billion 4Q16 Deposit Cost: 0.16% Loans – 4Q16 Deposits – 4Q16 Commercial 30% Commercial RE 24% Residential RE 33% Consumer 13% Demand 36% Savings 27% Money Market 15% Time 22%
4Q 2016 HIGHLIGHTS Solid Earnings Net income of $56.6mm, or $0.41 per diluted share Core net income(1) of $56.0mm, or $0.40 per diluted share Increased dividend by 10% to $0.22 per share; 4Q payout ratio of 54.3%³ Good Growth, Strong Balance Sheet Loan and lease growth of $124 million, or 1.1%, in 4Q Deposit decrease of $171 million, or (1.0%), in 4Q Net charge-off ratio: 0.12% annualized Capital ratios in excess of well-capitalized ratios at Dec 31, 2016 Strong Financial Performance Efficiency ratio of 45.8% ROATA(2) of 1.20%, core ROATA(1)(2) of 1.19% ROATCE(2) of 14.88%, core ROATCE(1)(2) of 14.73% Other Highlights 99% employee participation rate in the bank’s Kokua Mai annual giving campaign Over 30% of employees participated in employee stock purchase plan Core operating measures exclude certain gains, expenses and one-time items. See quarterly non-GAAP reconciliation of core net income, core net interest income, core noninterest income and core noninterest expense in the appendix. ROATA (return on average tangible assets) and ROATCE (return on average tangible common equity) are non-GAAP financial measures. A reconciliation to the comparable GAAP measurement is provided in the appendix. Dividend payout ratio based on earnings for the quarter ended December 31, 2016 and $0.22 per share cash dividend declared on January 23, 2017. 3
Full Suite of Products and Services 4 Largest commercial lender in Hawaii 55 commercial bankers(2) Relationship-based lending Primary focus on Hawaii, California C&I, leases, auto dealer flooring, CRE, and C&D Strong relationships with proven local real estate developers $12.1bn of AUA and 48 financial advisors(2) Personal services include financial planning, insurance, trust, estate, and private banking Institutional services include investment management, retirement plan administration, and custody Mutual funds provided by Bishop Street Capital Management #1 deposit market share in Hawaii (36.6%)(1) Retail deposit products offered through branch, online, mobile, direct channels Commercial deposits, treasury and cash management products Hawaii state and municipal relationships Commercial Lending Wealth Management Deposits Services provided to individuals and small to mid-sized businesses Full service branches, online and mobile channels Exclusively in-footprint focus First mortgages, home equity, indirect auto financing, and other consumer loans Consumer Lending Leading credit card issuer among Hawaii banks Approximately 158,000 accounts with more than $2.1bn annual spend(2) Consumer, small businesses, and commercial cards Issuer of both Visa and MasterCard Credit Cards Largest merchant processor in Hawaii Spans Hawaii, Guam and Saipan Over 6,000 terminals processed ~44.3mm transactions in 2015 Relationships with all major U.S. card companies and select foreign cards Merchant Processing First Hawaiian is a full service community bank focused on building relationships with our customers Source: FDIC as of 30-Jun-16 As of 30-Sep-16
Leading Market Share #1 Deposit Market Share in Hawaii Since 2004 — Top 50 bank by total deposits in the United States(1) 5 Market Statistics Footprint Primary Markets (92% of Deposits) Secondary Markets Market Branches Deposits ($bn) % of Total FHB Market Share Rank Total Hawaii 57 14.9 92.4 36.6 1 Guam 3 0.9 5.8 % 36.1 % 1 Saipan 2 0.3 1.8 % 38.0 % 1 Maui Kahoolawe Lanai Oahu Kauai Niihau Honolulu Hawaii Island Guam Saipan Source: FDIC and SNL Financial Note: Hawaii market statistics shown at county level; deposit market share data as of 30-Jun-16. (1) Regulated depositories in the United States excluding trust banks, investment banks, specialty finance companies, and merger targets as of 31-Dec-16. Molokai
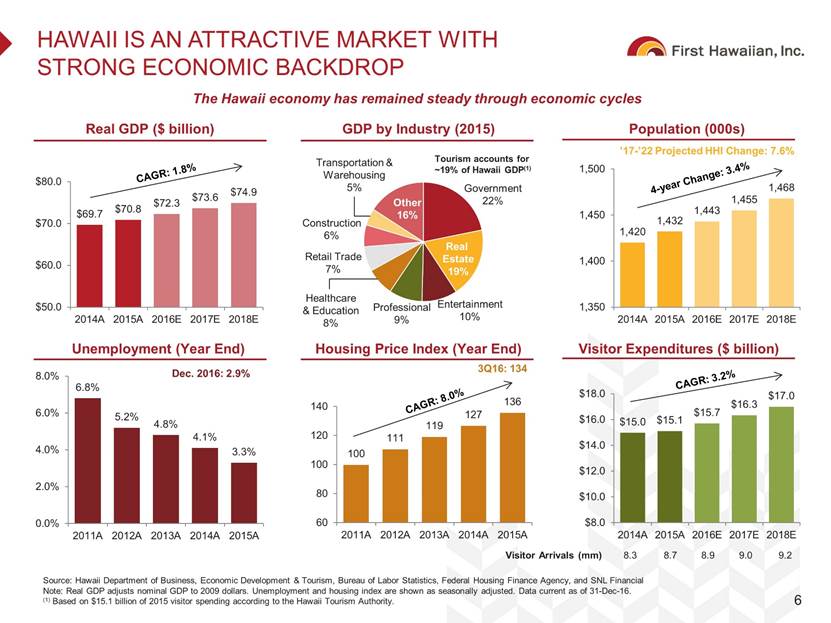
R:79 G:129 B:189 Hawaii is an Attractive Market with Strong Economic Backdrop 6 Real GDP ($ billion) Population (000s) Source: Hawaii Department of Business, Economic Development & Tourism, Bureau of Labor Statistics, Federal Housing Finance Agency, and SNL Financial Note: Real GDP adjusts nominal GDP to 2009 dollars. Unemployment and housing index are shown as seasonally adjusted. Data current as of 31-Dec-16. (1) Based on $15.1 billion of 2015 visitor spending according to the Hawaii Tourism Authority. The Hawaii economy has remained steady through economic cycles GDP by Industry (2015) Unemployment (Year End) Housing Price Index (Year End) Visitor Expenditures ($ billion) ’17-’22 Projected HHI Change: 7.6% Dec. 2016: 2.9% 3Q16: 134 Visitor Arrivals (mm) 8.3 8.7 8.9 9.0 9.2 Tourism accounts for ~19% of Hawaii GDP(1) 6.8% 5.2% 4.8% 4.1% 3.3% 0.0% 2.0% 4.0% 6.0% 8.0% 2011A 2012A 2013A 2014A 2015A $15.0 $15.1 $15.7 $16.3 $17.0 $8.0 $10.0 $12.0 $14.0 $16.0 $18.0 2014A 2015A 2016E 2017E 2018E 100 111 119 127 136 60 80 100 120 140 2011A 2012A 2013A 2014A 2015A 1,420 1,432 1,443 1,455 1,468 1,350 1,400 1,450 1,500 2014A 2015A 2016E 2017E 2018E Government 22% Real Estate 19% Residential RE 23% Other 16% Transportation & Warehousing 5% Entertainment 10% Professiona l 9 % Construction 6% Retail Trade 7 % Healthcare & Education 8%
The Clear Leader in Hawaii 7 The banking market in Hawaii is dominated by local banks with the top 6 banks accounting for ~97% of deposits; First Hawaiian is the clear leader among its Hawaii banking peers based on size and operating performance Source: SNL Financial and FDIC. For peer companies, peer company filings, SNL Financial and FDIC Note: Balance sheet and income statement data as of / for twelve months ended 31-Dec-16. Deposit market share as of 30-Jun-16. CPF FTEs for period ended 30-Sep-16. FHB net income and ROATA shown as core. Core excludes certain expenses, gains and one-time items. See annual non-GAAP reconciliation of core net income in the appendix. ROATA (return on average tangible assets) is a non-GAAP financial measure. A reconciliation to the comparable GAAP measurement is provided in the appendix. Branches 62 69 51 35 29 14 FTEs 2,179 2,122 1,093 788 271 173 Assets ($bn) $19.7 $16.5 $6.4 $5.4 $1.9 $0.7 Loans ($bn) 11.5 8.9 4.8 3.5 1.3 0.4 Deposits ($bn) 16.8 14.3 5.6 4.6 1.5 0.6 2016 Net Inc. ($mm) $217.1(¹) $181.5 $57.3 $47.0 $16.3 $0.5 2016 ROATA(2) 1.18%(¹) 1.14% 0.93% 0.93% 0.88% 0.08% Loan Portfolio Deposit Portfolio Hawaii Deposits Rank #1 #2 # 3 # 4 # 5 # 6 Share 36.6% 31.5% 13.0% 10.8% 3.7% 1.5% Commercial Commercial RE Residential RE Consumer & Other Transaction Accounts Savings / MMDA Time Deposits 13% 30% 24% 33% 15% 12% 23% 50% 5 % 14% 20% 62% 13% 14% 28% 45% 2 % 98% 1 % 31% 38% 30% 22% 36% 42% 9% 54% 38% 6 % 82% 12% 24% 14% 62% 16% 66% 18% 17% 72% 1 1 %
Growing, Low-Cost Core Deposit Base Strong brand, deep ties to the community and a leading market share position have driven an attractive, low-cost deposit base 8 CAGR: 6.3% Deposits: $16.8bn 4Q16 Deposit Cost: 0.16% Cost of Deposits 0.87% 1.52% 1.92% 1.19% 0.63% 0.38% 0.30% 0.25% 0.21% 0.16% 0.14% 0.16% Year Ended December 31, Deposit Portfolio Composition (4Q16) Consistent Deposit Growth ($bn) Geography (4Q16) Demand 36% Time 22% Money Market 15% Savings 27% Hawaii 83% Mainland 5% Foreign & Other 5% Guam / Saipan 7%
Steady Organic Growth and Balanced Loan Portfolio Steady through the cycle organic loan growth and balanced loan portfolio 9 Well positioned to serve clients during the financial crisis CAGR: 6.1% Loans: $11.5bn 4Q16 Loan Yield: 3.85% Loans / Deposits 70% 71% 72% 84% 78% 79% 69% 70% 70% 68% 67% 69% Year Ended December 31, Loan Portfolio Composition (4Q16) Steady Loan Growth ($bn) Geography (4Q16) Commercial 30% Consumer 13% Residential RE 33% Commercial RE 24% Hawaii 70% Mainland 20% Foreign & Other 1% Guam / Saipan 9%
Proven, Consistent, and Conservative Credit Risk Management Strong through the cycle credit performance driven by conservative approach to credit risk management 10 Year Ended December 31, Year Ended December 31, Year Ended December 31, Year Ended December 31, Source: SNL Financial as of 31-Jan-17 Note: Public U.S. Banks with $10-$50bn of Assets as of 31-Dec-15. NCOs / Average Loans NPAs + 90s / Loans + OREO Reserves / Loans Reserves / Non-Accrual Loans 75.0x 0.16% 0.63% 0.11% 0.45% 2.72% 0.77% 0.00% 1.00% 2.00% 3.00% '06 '07 '08 '09 '10 '11 '12 '13 '14 '15 '16 1.43% 1.45% 1.18% 1.24% 2.08% 1.03% 1.00% 1.50% 2.00% 2.50% '06 '07 '08 '09 '10 '11 '12 '13 '14 '15 '16 71.4x 14.4x 2.8x 1.5x 0.0x 10.0x 20.0x '06 '07 '08 '09 '10 '11 '12 '13 '14 '15 '16 First Hawaiian, Inc. Public U.S. Banks with $10-$50bn of Assets
R:79 G:129 B:189 Highly Efficient Cost Structure First Hawaiian has built a culture focused on prudent expense management 11 Source: SNL Financial as of 31-Jan-17 Note: Public U.S. Banks with $10-$50bn of Assets as of 31-Dec-15. (1) FHB ratios shown as core. Core excludes certain gains, expenses and one-time items. See annual and quarterly non-GAAP reconciliations of core net income, core net interest income, core noninterest income and core noninterest expense used to calculate core ratios in the appendix. Long-standing culture dedicated to expense discipline Hub and spoke branch model allows efficient management and utilization of resources Efficient management of corporate real estate Strong existing brand enables optimization of advertising spend Highly engaged and loyal employee base Continue to reinforce expense discipline in all employees Prudent innovation and modernization of delivery channels over time Ongoing branch analysis and optimization Year Ended December 31, Year Ended December 31, Disciplined Expense Culture Non-Interest Expense / Average Assets(1) Expense Management is a Primary Focus Efficiency Ratio(1) 46.2% 46.3% 45.9% 47.3% 49.6% 47.3% 60.3% 62.4% 63.5% 62.3% 62.4% 61.5% 40.0% 45.0% 50.0% 55.0% 60.0% 65.0% 2011 2012 2013 2014 2015 2016 First Hawaiian, Inc. Public U.S. Banks with $10-$50bn of Assets 2.01% 1.83% 1.74% 1.70% 1.70% 1.67% 2.95% 2.78% 2.74% 2.68% 2.52% 2.46% 1.50% 2.00% 2.50% 3.00% 3.50% 2011 2012 2013 2014 2015 2016
High quality customer relationships driving consistent growth through improved penetration and cross-selling Rebalanced investment portfolio for better utilization of liquidity Well-positioned for rising interest rate environment with annual net interest income estimated to increase 4.5% with +100bps change in interest rates(3) Leading deposit market share position Low cost funding base Sizeable floating rate loan portfolio Conservative credit risk management culture Diverse noninterest income sources provide stable revenue Culture focused on prudent expense management Compensation plans linked to earnings growth and long-term shareholder value creation Manage capital to appropriately support the business while providing operating flexibility R:79 G:129 B:189 Sustained, Consistent Track Record of Strong Profitability 12 Source: SNL Financial as of 31-Jan-17 Note: Public U.S. Banks with $10-$50bn of Assets as of 31-Dec-15. ROATA (return on average tangible assets) and ROATCE (return on average tangible common equity) are non-GAAP financial measures. A reconciliation to the comparable GAAP measurement is provided in the appendix. FHB ratios shown as core. Core excludes certain gains, expenses and one-time items. See annual and quarterly non-GAAP reconciliations of core net income, core net interest income, core noninterest income and core noninterest expense used to calculate core ratios in the appendix. Interest rate sensitivity data as of 9/30/16 Year Ended December 31, Year Ended December 31, ROATA(1),(2) ROATCE(1),(2) Profitability Remains our Focus Focused on maintaining peer leading profitability through stable growth and operating leverage 1.39% 1.30% 1.31% 1.22% 1.10% 1.18% 0.86% 0.99% 1.01% 1.04% 1.02% 0.91% 0.75% 1.00% 1.25% 1.50% 2011 2012 2013 2014 2015 2016 12.0% 11.8% 12.3% 11.8% 11.3% 13.8% 9.9% 10.8% 11.3% 11.1% 10.7% 10.9% 9.0% 11.0% 13.0% 15.0% 2011 2012 2013 2014 2015 2016 First Hawaiian, Inc. Public U.S. Banks with $10-$50bn of Assets
R:79 G:129 B:189 Attractive Shareholder Distribution Opportunity 13 Source: SNL Financial as of 31-Jan-17 Note: Public U.S. Banks with $10-$50bn of Assets as of 31-Dec-15. Totals may not sum due to rounding. (1) Dividends and share repurchases are subject to approval of FHB’s board of directors and applicable regulatory restrictions. (2) $10–$50bn includes publicly traded banks in the United States with $10–$50bn of assets. (3) FHB dividend payout ratio based on 4Q16 earnings and a $0.22 per share cash dividend declared on January 23, 2017. Tier 1 Leverage 8.4% 9.7% Robust capital levels and strong capital generation through earnings support an attractive return opportunity for shareholders through organic growth, dividends and share repurchases(1) Robust Capital Position Attractive Dividend Payout Ratio (LTM 4Q16)³ Top Tier Dividend Yield 12.8% 12.4% 0.5% 1.1% 1.6% 13.9% 14.5% 0.0% 5.0% 10.0% 15.0% First Hawaiian, Inc. $10-$50bn² CET 1 Non-Common Tier 1 Tier 2 54.3% 31.6% 0.0% 25.0% 50.0% 75.0% First Hawaiian, Inc. $10-$50bn² 2.7 % 1.8 % 0.0% 1.0% 2.0% 3.0% 4.0% First Hawaiian, Inc. $10-$50bn²
Our Forward Strategy Organically grow loan and deposit market share Leverage our brand, community presence and relationship banking strategy Drive increased cross-selling Utilize full service product offering and strong relationships Address changing customer needs and capitalize on market opportunities Selectively enhance our product offering Prudently invest in modernizing our delivery channels to enhance customer experience Implement omni-channel sales and support approach Increase customer adoption of internet, mobile and high-tech branch delivery channels Develop next generation talent Enhance leadership and career development initiatives Actively manage our expenses Increased self-service, branch optimization and end-to-end process improvement initiatives Serve our customers through all business and economic cycles Maintain prudent approach to balance sheet, credit and risk management 14 1 2 3 4 5 6 7
A Differentiated Story 15 First Hawaiian delivers excellent service and value to its customers while maintaining best-in-class performance Clear Leader in Attractive Markets Differentiated Service Offering Balance Sheet at Scale with History of Steady Growth Well-Diversified Loan Portfolio Strong Credit Performance Through-the-Cycle Growing, Low-Cost Core Deposit Franchise Best-in-Class Expense Management Superior Profitability Across Various Metrics Robust Capital Position with Attractive Distribution Potential
Appendix

Hawaii Banks have a Significant Deposit Advantage Hawaii-based banks have historically maintained a meaningful deposit pricing advantage vs. broader U.S. banks While that spread has shrunk in the current low rate environment, the unique structure of the Hawaii banking market combined with a community focused approach positions Hawaii-based banks to experience a similar advantage in the next rising rate cycle From 2Q 2004 to 2Q 2007 (most recent rising rate cycle), Hawaii banks experienced a deposit beta¹ of ~34% vs. ~47% for broader U.S. banks 17 Hawaii Banks Experience More Attractive Deposit Behavior / Costs Across All Rate Cycles Source: SNL Financial and the Federal Reserve website (1) Deposit beta is defined as the change in deposit costs as a percentage of the change in Fed Funds over a particular period. Deposit cost uses starting point (2Q04) to peak (3Q07); one quarter lag. (2) Includes First Hawaiian, Bank of Hawaii, American Savings, Central Pacific, Territorial Bancorp, Hawaii National. (3) Includes all U.S. bank holding companies excluding Hawaii-based banks. 0.00 % 0.50 % 1.00 % 1.50 % 2.00 % 2.50 % 3.00 % 3.50 % 4.00 % 4.50 % 5.00 % 5.50 % 6.00 % 1Q 2Q 3Q 4Q 1Q 2Q 3Q 4Q 1Q 2Q 3Q 4Q 1Q 2Q 3Q 4Q 1Q 2Q 3Q 4Q 1Q 2Q 3Q 4Q 1Q 2Q 3Q 4Q 1Q 2Q 3Q 4Q 1Q 2Q 3Q 4Q 1Q 2Q 3Q 4Q 1Q 2Q 3Q 4Q 1Q 2Q 3Q 4Q 1Q 2Q 3Q Hawaii Banks² U.S. Banks³ Fed Funds 19bps Current Funding Advantage 3.34% 1.97% 0.33% 0.14% 5.25% 137bps Funding Advantage 0.38% 2004 2005 2006 2007 2008 2009 2010 2011 2012 2013 2014 2015 2016
4Q 2016 Financial Results 18 Balance Sheet Core Income Statement¹ Core Operating Metrics¹ Credit / Capital Core excludes certain gains, expenses and one-time items. See annual and quarterly non-GAAP reconciliations of core net income, core net interest income, core noninterest income and core noninterest expense used to calculate core ratios in the appendix. ROATA (return on average tangible assets) and ROATCE (return on average tangible common equity) are non-GAAP financial measures. A reconciliation to the comparable GAAP measurement is provided in the appendix. 4Q 2016 vs. ($ in millions) 4Q 2016 3Q 2016 4Q2015 3Q 2016 4Q 2015 2016 2015 Balance Sheet Loans $11,520 $11,397 $10,722 1.1% 7.4% $11,520 $10,722 Deposits 16,795 16,966 16,062 (1.0) 4.6 16,795 16,062 Core Income Statement(1) Net Interest Income $131.3 $122.7 $116.2 7.0% 12.9% $491.7 $456.5 Provisions 3.9 2.1 2.5 85.7 56.0 8.6 9.9 Noninterest Income 47.5 48.7 46.6 (2.4) 2.0 190.4 188.2 Noninterest Expense 81.9 79.7 80.3 2.8 2.0 322.6 319.6 Net Income $56.0 $55.2 $49.8 1.5% 12.4% $217.1 $196.3 Earnings per Share $0.40 $0.40 $0.36 – % 11.1% $1.56 $1.41 Core Operating Metrics(1) Net Interest Margin 2.99% 2.87% 2.71% 12 bps 28 bps 2.88% 2.75% Noninterest Income / Total Revenue 26.6 28.4 28.6 (184) (204) 27.9 29.2 Efficiency Ratio 45.8 46.5 49.3 (69) (350) 47.3 49.6 ROATA(2) 1.19 1.20 1.09 (1) 10 1.18 1.10 ROATCE(2) 14.7 14.5 11.2 20 351 13.8 11.3 Credit / Capital NCOs / Average Loans 0.12% 0.12% 0.09% – bps 3 bps 0.08% 0.09% NALs / Total Loans 0.08 0.08 0.16 – b (8) 0.08 0.16 CET1 / Tier 1 12.8 12.5 15.3 27 (256) 12.8 15.3 Quarterly Results Annual Results
GAAP to non-gaap reconciliations 19 We present net interest income, noninterest income, noninterest expense, net income, earnings per share and the related ratios described below, on an adjusted, or ‘‘core,’’ basis, each a non-GAAP financial measure. These core measures exclude from the corresponding GAAP measure the impact of certain items that we do not believe are representative of our financial results. We believe that the presentation of these non-GAAP financial measures helps identify underlying trends in our business from period to period that could otherwise be distorted by the effect of certain expenses, gains and other items included in our operating results. Core net interest margin, core return on average total assets and core return on average total stockholders’ equity are non-GAAP financial measures. We compute our core net interest margin as the ratio of core net interest income to average earning assets. We compute our core return on average total assets as the ratio of core net income to average total assets. We compute our core return on average total stockholders’ equity as the ratio of core net income to average stockholders’ equity. Return on average tangible stockholders’ equity, core return on average tangible stockholders’ equity, return on average tangible assets, core return on average tangible assets and tangible stockholders’ equity to tangible assets are non-GAAP financial measures. We compute our return on average tangible stockholders’ equity as the ratio of net income to average tangible stockholders’ equity, which is calculated by subtracting (and thereby effectively excluding) amounts related to the effect of goodwill from our average total stockholders’ equity. We compute our core return on average tangible stockholders’ equity as the ratio of core net income to average tangible stockholders’ equity, which is calculated by subtracting (and thereby effectively excluding) amounts related to the effect of goodwill from our average total stockholders’ equity. We compute our return on average tangible assets as the ratio of net income to average tangible assets, which is calculated by subtracting (and thereby effectively excluding) amounts related to the effect of goodwill from our average total assets. We compute our core return on average tangible assets as the ratio of core net income to average tangible assets. We compute our tangible stockholders’ equity to tangible assets as the ratio of tangible stockholders’ equity to tangible assets, each of which we calculate by subtracting (and thereby effectively excluding) the value of our goodwill. We believe that these core measures provide useful information about our operating results and enhance the overall understanding of our past performance and future performance. Although these non-GAAP financial measures are frequently used by stakeholders in the evaluation of a company, they have limitations as analytical tools and should not be considered in isolation or as a substitute for analysis of our results or financial condition as reported under GAAP. Investors should consider our performance and financial condition as reported under GAAP and all other relevant information when assessing our performance or financial condition. The following tables provide a reconciliation of these non-GAAP financial measures with their most closely related GAAP measures.
GAAP to Non-GAAP Reconciliation 20 Note: Totals may not sum due to rounding. (1) Annualized for the three and nine month periods. As of and for the Twelve Months Ended December 31, As of and for the Three Months Ended (Dollars in millions, except per share data) 2016 2015 2014 2013 2012 2011 December 31, 2016 September 30, 2016 June 30, 2016 September 30, 2015 Net Income $230.2 $213.8 $216.7 $214.5 $211.1 $199.7 $56.6 $53.2 $54.9 $54.9 Average Total Stockholders’ Equity $2,568.2 $2,735.8 $2,698.4 $2,667.4 $2,664.2 $2,640.6 $2,507.5 $2,506.1 $2,491.1 $2,743.5 Less: Average Goodwill 995.5 995.5 995.5 995.5 995.5 995.5 995.5 995.5 995.5 995.5 Average Tangible Stockholders’ Equity $1,572.7 $1,740.3 $1,702.9 $1,672.0 $1,668.7 $1,645.1 $1,512.0 $1,510.6 $1,495.6 $1,748.0 Total Stockholders’ Equity 2,476.5 2,736.9 2,675.0 2,651.1 2,654.2 2,677.4 2,476.5 2,524.0 2,501.0 2,744.3 Less: Goodwill 995.5 995.5 995.5 995.5 995.5 995.5 995.5 995.5 995.5 995.5 Tangible Stockholders’ Equity $1,481.0 $1,741.4 $1,679.5 $1,655.6 $1,658.7 $1,681.9 $1,481.0 $1,528.5 $1,505.5 $1,748.8 Average Total Assets 19,334.7 18,785.7 17,493.2 16,653.6 16,085.7 15,246.8 19,778.9 19,314.7 18,950.0 18,739.9 Less: Average Goodwill 995.5 995.5 995.5 995.5 995.5 995.5 995.5 995.5 995.5 995.5 Average Tangible Assets $18,339.2 $17,790.2 $16,497.7 $15,658.1 $15,090.2 $14,251.3 $18,783.4 $18,319.2 $17,954.5 $17,744.4 Total Assets 19,661.8 19,352.7 18,133.7 17,118.8 16,646.7 15,839.4 19,661.8 19,892.7 19,052.6 18,870.8 Less: Goodwill 995.5 995.5 995.5 995.5 995.5 995.5 995.5 995.5 995.5 995.5 Tangible Assets $18,666.3 $18,357.2 $17,138.2 $16,123.3 $15,651.2 $14,843.9 $18,666.3 $18,897.2 $18,057.1 $17,875.3 Return on Average Total Stockholders’ Equity(1) 8.96% 7.81% 8.03% 8.04% 7.92% 7.56% 8.97% 8.45% 8.86% 7.94% Return on Average Tangible Stockholders’ Equity (non-GAAP) (1) 14.64% 12.28% 12.72% 12.83% 12.65% 12.14% 14.88% 14.02% 14.75% 12.46% Return on Average Total Assets(1) 1.19 1.14 1.24 1.29 1.31 1.31 1.14 1.10 1.16 1.16 Return on Average Tangible Assets (non-GAAP) (1) 1.26% 1.20% 1.31% 1.37% 1.40% 1.40% 1.20% 1.16% 1.23% 1.23%
GAAP to Non-GAAP Reconciliation 21 Note: Totals may not sum due to rounding. (1) Adjustments that are not material to our financial results have not been presented for certain periods. (2) Other adjustments include a one-time MasterCard signing bonus and a recovery of an investment that was previously written down. (3) One-time items include initial public offering related costs. (4) Represents the adjustments to net income, tax effected at the Company’s effective tax rate for the respective period. For the Fiscal Year Ended December 31, For the Three Months Ended (Dollars in millions, except per share data) 2016 2015 2014 2013 2012 2011 December 31, 2016 September 30, 2016 June 30, 2016 September 30, 2015 Net Interest Income $491.7 $461.3 $443.8 $439.0 $447.5 $470.0 $131.3 $122.7 $120.4 $113.6 Accounting Change (ASC 310 Adjustment) – – – (4.3) – – – – – – Early Buyout on Lease – – (3.1) – – – – – – – Early Loan Termination(1) – (4.8) – – – – – – – – Core Net Interest Income (Non-GAAP) $491.7 $456.5 $440.7 $434.7 $447.5 $470.0 $131.3 $122.7 $120.4 $113.6 Noninterest Income $217.6 $211.4 $209.2 $208.4 $212.8 $194.6 $49.0 $48.7 $46.4 $56.5 Gain on Sale of Securities (4.6) (7.7) – (0.2) (16.7) (1.7) (1.5) – – (2.4) Gain on Sale of Stock (Visa/MasterCard) (22.7) (4.6) (20.8) (11.1) – – – – – (1.8) Gain on Sale of Other Assets – (3.4) – (0.4) (6.4) – – – – (1.4) Other Adjustments(1),(2) – (7.5) – – – (0.9) – – – (2.9) Core Noninterest Income (Non-GAAP) $190.4 $188.2 $188.4 $196.6 $189.7 $192.0 $47.5 $48.7 $46.4 $48.0 Noninterest Expense $328.8 $319.6 $297.7 $290.7 295.6 306.1 $82.5 $82.8 $78.5 $79.4 One-Time Items(3) (6.2) – – (0.7) (0.7) – (0.6) (3.1) – – Core Noninterest Expense (Non-GAAP) $322.6 $319.6 $297.7 $290.0 $294.9 $306.1 $81.9 $79.7 $78.5 $79.4 Net Income $230.2 $213.8 $216.7 $214.5 $211.1 $199.7 $56.6 $53.2 $54.9 $54.9 Accounting Change (ASC 310 Adjustment) – – – (4.3) – – – – – – Early Buyout on Lease – – (3.1) – – – – – – – Early Loan Termination – (4.8) – – – – – – – – Gain on Sale of Securities (4.6) (7.7) – (0.2) (16.7) (1.7) (1.5) – – (2.4) Gain on Sale of Stock (Visa/MasterCard) (22.7) (4.6) (20.8) (11.1) – – – – – (1.8) Gain on Sale of Other Assets – (3.4) – (0.4) (6.4) – – – – (1.4) Other Adjustments(1),(2) – (7.5) – – – (0.9) – – – (2.9) One-Time Items(3) 6.2 – – 0.7 0.7 – 0.6 3.1 – – Tax Adjustments(4) 8.0 10.6 8.9 5.8 8.1 1.0 0.4 (1.1) – 3.2 Total Core Adjustments (13.1) (17.5) (15.0) (9.5) (14.3) (1.7) (0.6) 1.9 – (5.3) Core Net Income (Non-GAAP) $217.1 $196.3 $201.6 $205.0 $196.7 $198.0 $56.0 $55.2 $54.9 $49.6 Core Basic EPS (Non-GAAP) $1.56 $1.41 $1.45 $1.47 $1.57 $1.79 $0.40 $0.40 $0.39 $0.36 Core Diluted EPS (Non-GAAP) $1.56 $1.41 $1.45 $1.47 $1.57 $1.79 $0.40 $0.40 $0.39 $0.36