Attached files
| file | filename |
|---|---|
| EX-99.1 - EXHIBIT 99.1 - ALBANY INTERNATIONAL CORP /DE/ | a51507201ex99_1.htm |
| 8-K - ALBANY INTERNATIONAL CORP. 8-K - ALBANY INTERNATIONAL CORP /DE/ | a51507201.htm |
Exhibit 99.2

Q4 Financial Performance
February 8, 2017
Non-GAAP’ Items and Forward-Looking Statements This presentation contains the following non-GAAP measures: Percentage changes in net sales, excluding currency rate effects (for each segment, and the Company as a whole); Adjusted EBITDA (for each segment, and the Company as a whole); Net debt; and Net income per share attributable to the Company, excluding adjustments. We think such items provide useful information to investors regarding the Company’s core operational performance. See the Company’s earnings release (which accompanies this presentation) for additional information including reconciliations to GAAP measures. This presentation also may contain statements, estimates, or projections that constitute “forward-looking statements” as defined under U.S. federal securities laws. Forward-looking statements are subject to certain risks and uncertainties that could cause actual results to differ materially from the Company’s historical experience and our present expectations or projections. We disclaim any obligation to update any information in this presentation to reflect any changes or developments after the date on the cover page. Certain additional disclosures regarding our use of these ‘non-GAAP’ items and forward-looking statements are set forth in our fourth-quarter earnings press release dated February 8, 2017, and in our SEC filings, including our most recent quarterly reports and our annual reports for the years ended December 31, 2013, 2014, and 2015.Our use of such items in this presentation is subject to those additional disclosures, which we urge you to read. 2
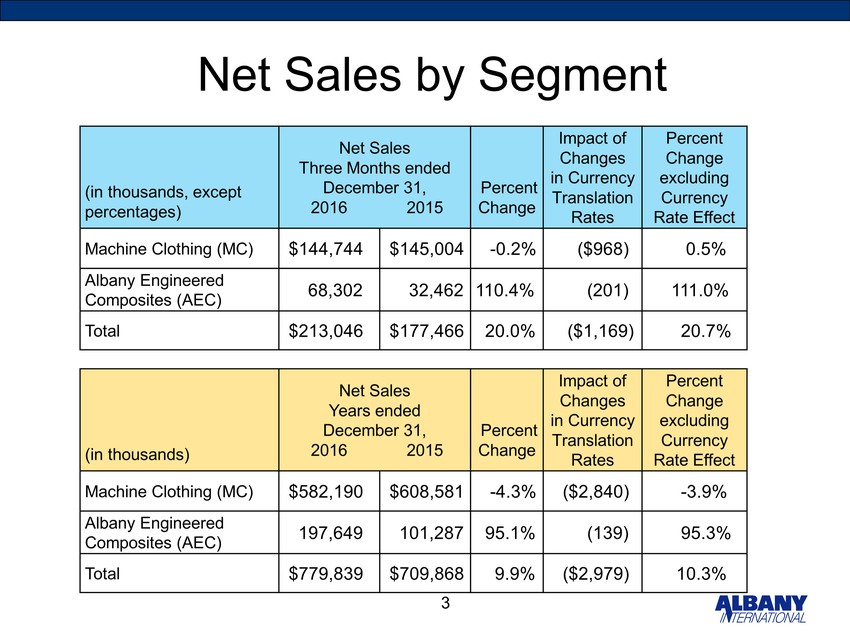
et Net Sales by Segment (in thousands, except percentages) Net Sales Three Months ended December 31, 2016 2015 Percent Change Impact of Changes in Currency Translation Rates Percent Change excluding Currency Rate Effect Machine Clothing (MC) $144,744 $145,004 -0.2% ($968) 0.5% Albany Engineered Composites (AEC) 68,302 32,462 110.4% (201) 111.0% Total $213,046 $177,466 20.0% ($1,169) 20.7% (in thousands) Net Sales Years ended December 31, 2016 2015 Percent Change Impact of Changes in Currency Translation Rates Percent Change excluding Currency Rate Effect Machine Clothing (MC) $582,190 $608,581 -4.3% ($2,840) -3.9% Albany Engineered Composites (AEC) 197,649 101,287 95.1% (139) 95.3% Total $779,839 $709,868 9.9% ($2,979) 10.3% 3by Segment
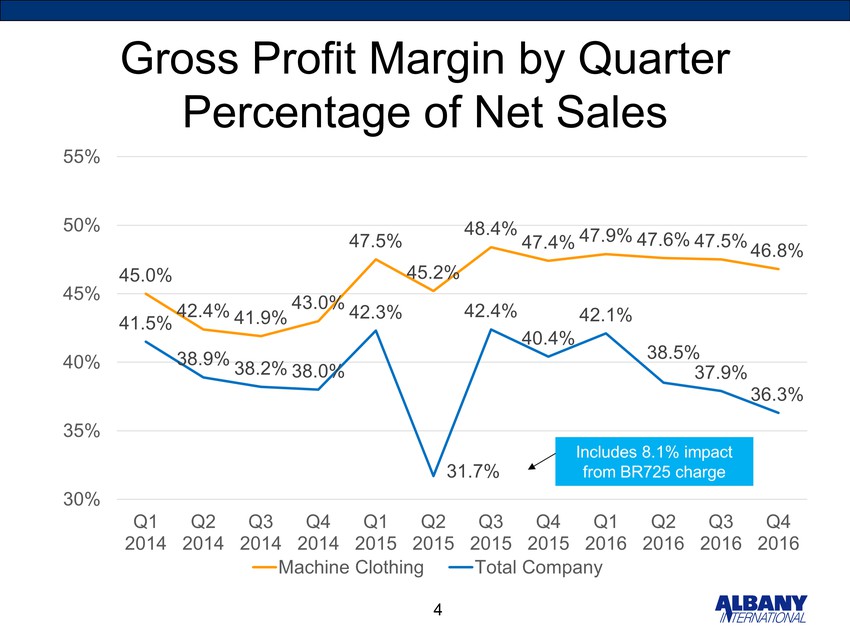
Gross Profit Margin by QuarterPercentage of Net Sales 45.0% 42.4% 41.9% 43.0% 47.5% 45.2% 48.4% 47.4% 47.9% 47.6% 47.5% 46.8% 41.5% 38.9% 38.2% 38.0% 42.3% 31.7% 42.4% 40.4% 42.1% 38.5% 37.9% 36.3% 30% 35% 40% 45% 50% 55% Q12014 Q22014 Q32014 Q42014 Q12015 Q22015 Q32015 Q42015 Q12016 Q22016Q32016 Q42016 Machine Clothing Total Company 4
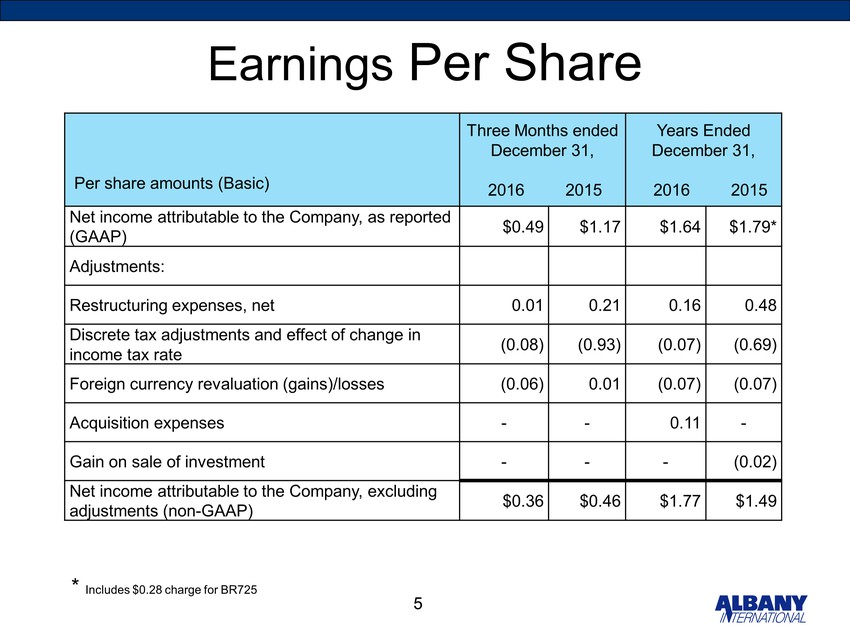
EarningsPer SharePer share amounts (Basic) Three Months ended December 31, 2016 2015 Years Ended December 31, 2016 2015 Netincome attributable to the Company, as reported (GAAP) $0.49 $1.17 $1.64 $1.79* Adjustments: Restructuring expenses, net 0.01 0.21 0.16 0.48 Discrete tax adjustments and effect of change in income tax rate (0.08) (0.93) (0.07) (0.69) Foreign currency revaluation (gains)/losses (0.06) 0.01 (0.07) (0.07) Acquisition expenses - - 0.11 - Gain on sale of investment - - - (0.02) Net income attributable to the Company, excluding adjustments (non-GAAP) $0.36 $0.46 $1.77 $1.49 * Includes $0.28 charge for BR725
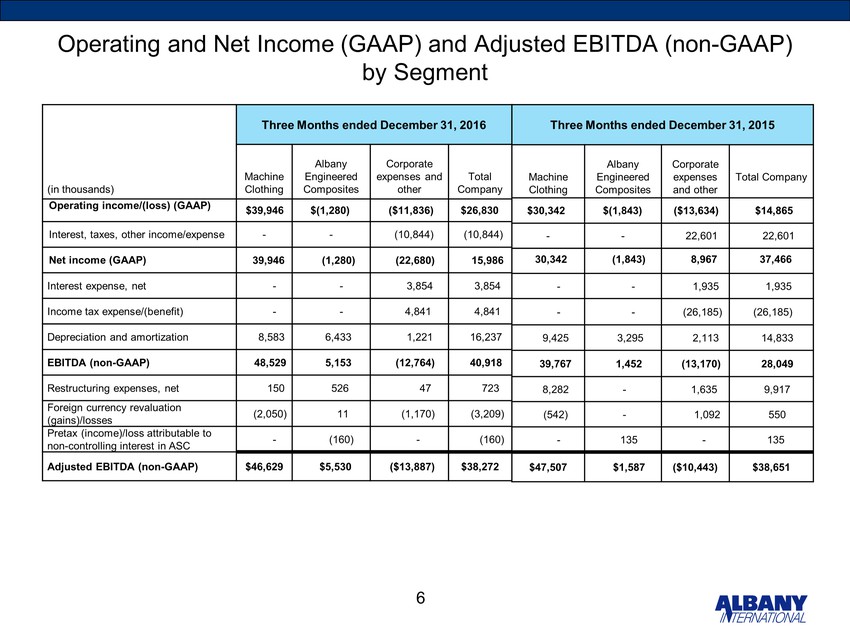
Operating and Net Income (GAAP) and Adjusted EBITDA (non-GAAP) by Segment 6 Three Months ended December 31, 2016 (in thousands) Machine Clothing Albany Engineered Composites Corporate expenses and other Total Company Operating income/(loss) (GAAP) $39,946 $(1,280) ($11,836) $26,830 Interest, taxes, other income/expense - - (10,844) (10,844) Net income (GAAP) 39,946 (1,280) (22,680) 15,986 Interest expense, net - - 3,854 3,854 Income tax expense/(benefit) - - 4,841 4,841 Depreciation and amortization 8,583 6,433 1,221 16,237 EBITDA (non-GAAP) 48,529 5,153 (12,764) 40,918 Restructuring expenses, net 150 526 47 723 Foreign currency revaluation (gains)/losses (2,050) 11 (1,170) (3,209) Pretax (income)/loss attributable to non-controlling interest in ASC - (160) - (160) Adjusted EBITDA (non-GAAP) $46,629 $5,530 ($13,887) $38,272 Three Months ended December 31, 2015 Machine Clothing Albany Engineered Composites Corporate expenses and other Total Company $30,342 $(1,843) ($13,634) $14,865 - - 22,601 22,601 30,342 (1,843) 8,967 37,466 - - 1,935 1,935 - - (26,185) (26,185) 9,425 3,295 2,113 14,833 39,767 1,452 (13,170) 28,049 8,282 - 1,635 9,917 (542) - 1,092 550 - 135 - 135 $47,507 $1,587 ($10,443) $38,651
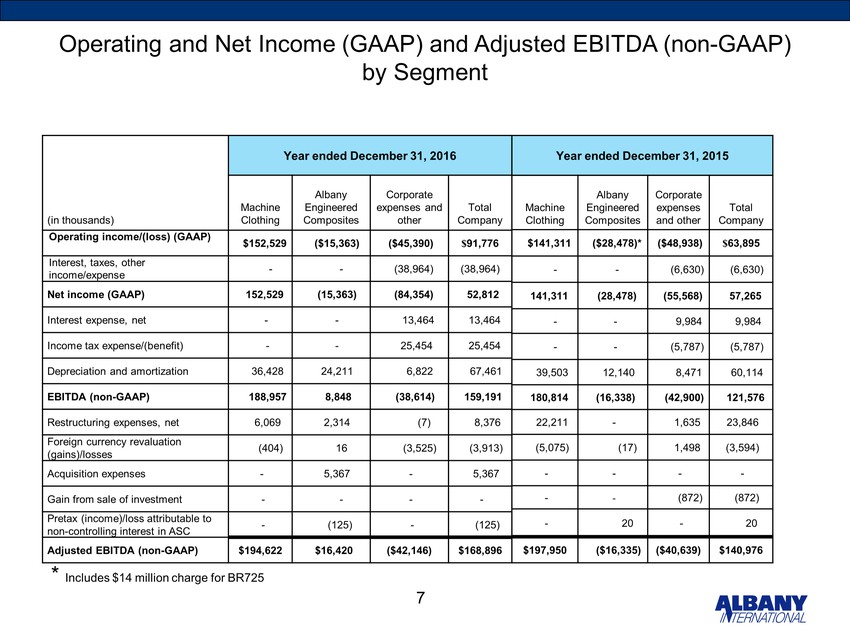
Operating and Net Income (GAAP) and Adjusted EBITDA (non-GAAP) by Segment 7 Year ended December 31, 2016 (in thousands) Machine Clothing Albany Engineered Composites Corporate expenses and other Total Company Operating income/(loss) (GAAP) $152,529 ($15,363) ($45,390) $91,776 Interest, taxes, other income/expense - - (38,964) (38,964) Net income (GAAP) 152,529 (15,363) (84,354) 52,812 Interest expense, net - - 13,464 13,464 Income tax expense/(benefit) - - 25,454 25,454 Depreciation and amortization 36,428 24,211 6,822 67,461 EBITDA (non-GAAP) 188,957 8,848 (38,614) 159,191 Restructuring expenses, net 6,069 2,314 (7) 8,376 Foreign currency revaluation (gains)/losses (404) 16 (3,525) (3,913) Acquisition expenses - 5,367 - 5,367 Gain from sale of investment - - - - Pretax (income)/loss attributable to non-controlling interest in ASC - (125) - (125) Adjusted EBITDA (non-GAAP) $194,622 $16,420 ($42,146) $168,896 Year ended December 31, 2015 Machine Clothing Albany Engineered Composites Corporate expenses and other Total Company $141,311 ($28,478)* ($48,938) $63,895 - - (6,630) (6,630) 141,311 (28,478) (55,568) 57,265 - - 9,984 9,984 - - (5,787) (5,787) 39,503 12,140 8,471 60,114 180,814 (16,338) (42,900) 121,576 22,211 - 1,635 23,846 (5,075) (17) 1,498 (3,594) - - - - - - (872) (872) - 20 - 20 $197,950 ($16,335) ($40,639) $140,976 * Includes $14 million charge for BR725
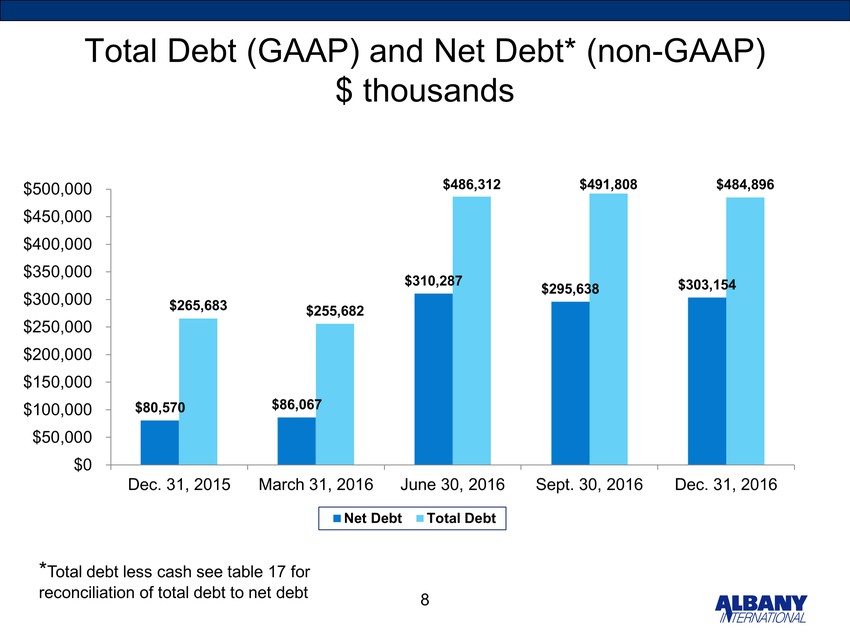
Total Debt (GAAP) and Net Debt* (non-GAAP)$ thousands $80,570 $86,067 $310,287 $295,638 $303,154 $265,683 $255,682 $486,312 $491,808 Dec. 31, 2015 March 31, 2016 June 30, 2016Sept. 30, 2016 Dec. 31, 2016 Net Debt Total Debt *Total debt less cash see table 17 for reconciliation of total debt to net debt