Attached files
| file | filename |
|---|---|
| EX-99.1 - EXHIBIT 99.1 - Lumentum Holdings Inc. | liteex991q2fy17.htm |
| 8-K - 8-K - Lumentum Holdings Inc. | lumentum_8kxq2fy17.htm |

Q2 FY17 Conference Call
February 7, 2017

© 2017 Lumentum Operations LLC
Forward Looking Statement and Financial Presentation
This presentation contains forward-looking statements within the meaning of Section 27A of the Securities Act of 1933 and Section
21E of the Securities Exchange Act of 1934. These statements include any anticipation or guidance as to future financial
performance, including future revenue, earnings per share, gross margin, operating expense, operating margin, profitability, cash flow
and other financial metrics, anticipated trends for our products, technologies and the markets in which we operate as well as our
strategies and position in our markets. These forward-looking statements involve risks and uncertainties that could cause actual
results to differ materially from those projected. In particular, the Company’s ability to predict future financial performance continues
to be difficult due to, among other things: (a) quarter-over-quarter product mix fluctuations, which can materially impact profitability
measures due to the broad gross margin ranges across our portfolio; (b) continued decline of average selling prices across our
businesses; (c) effects of seasonality; (d) the ability of our suppliers and contract manufacturers to meet production, quality and
delivery requirements for our forecasted demand; and (e) inherent uncertainty related to global markets and the effect of such
markets on demand for our products, and (f) ongoing risks related to our separation from Viavi in 2015. All forward-looking
statements involve risks and uncertainties that could cause actual events and terms to differ materially from those set forth herein,
including those related to our business and growth opportunities. For more information on these risks, please refer to the "Risk
Factors" section included in the Company’s Quarterly Report on Form 10-Q for the quarter ended December 31, 2016 filed with the
Securities and Exchange Commission, and our other filings with the Securities and Exchange Commission. In addition, the results
contained in this presentation are valid only as of today’s date except where otherwise noted. The forward-looking statements
contained in this presentation are made as of the date hereof and the Company assumes no obligation to update such statements,
except as required by applicable law.
Unless otherwise stated, all financial results and projections are on a non-GAAP basis. Our GAAP results, details about our non-
GAAP financial measures, and a reconciliation between GAAP and non-GAAP results can be found in our fiscal second quarter 2017
earnings press release which is available on our web site, www.lumentum.com, under the investors section. We have not provided
reconciliations from GAAP to non-GAAP measures for our outlook. A large portion of non-GAAP adjustments, such as derivative
liability adjustments, restructuring, stock-based compensation, litigation, and other costs and contingencies unrelated to current and
future operations are by their nature highly volatile and we have low visibility as to the range that may be incurred in the future.
2

© 2017 Lumentum Operations LLC
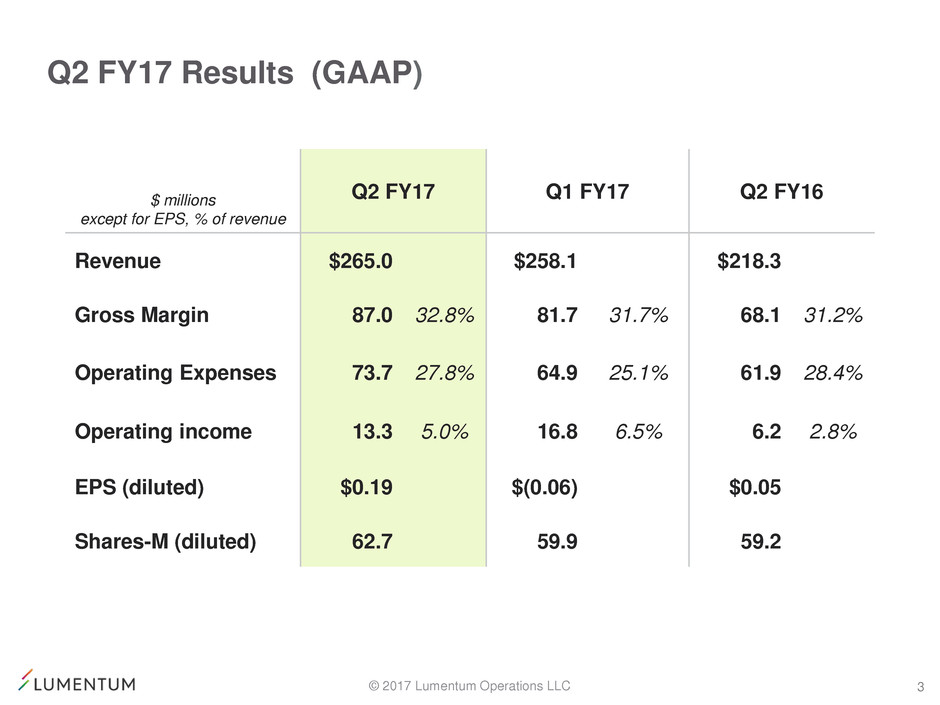
Q2 FY17 Results (GAAP)
$ millions
except for EPS, % of revenue
Q2 FY17 Q1 FY17 Q2 FY16
Revenue $265.0 $258.1 $218.3
Gross Margin 87.0 32.8% 81.7 31.7% 68.1 31.2%
Operating Expenses 73.7 27.8% 64.9 25.1% 61.9 28.4%
Operating income 13.3 5.0% 16.8 6.5% 6.2 2.8%
EPS (diluted) $0.19 $(0.06) $0.05
Shares-M (diluted) 62.7 59.9 59.2
3

© 2017 Lumentum Operations LLC
Q2 FY17 Results (Non-GAAP)
$ millions
except for EPS, % of revenue
Q2 FY17 Q1 FY17 Q2 FY16
Revenue $265.0 $258.1 $218.3
Gross Margin 97.9 36.9% 88.2 34.2% 71.3 32.7%
Operating Expenses 58.9 22.2% 55.5 21.5% 51.7 23.7%
Operating income 39.0 14.7% 32.7 12.7% 19.6 9.0%
EPS (diluted) $0.57 $0.49 $0.31
Shares-M (diluted) 62.7 62.4 60.7
4

© 2017 Lumentum Operations LLC
Q2 FY17 Highlights
(Non-GAAP – except balance sheet items)
Gross Margins up 270 bps and Operating Margin up 200 bps sequentially primarily due
to improved mix of products - 100G datacom, submarine, pumps, and WSS modules.
100G Datacom products up approximately 124% sequentially and 537% year-over-year.
Cash position of $155.9M was down $10.9M from last quarter.
Debt-free
5
Product Revenue - $ M Q2 FY17 Q1 FY17 Q/Q Y/Y
Telecom 160.1 165.6 (3.3)% 16.1%
Datacom 68.1 44.2 54.1% 94.6%
Industrial & Consumer 8.4 8.5 (1.2)% (34.9)%
Commercial Lasers 28.4 39.8 (28.6)% (12.6)%
Total LITE 265.0 258.1 2.7% 21.4%

© 2017 Lumentum Operations LLC
Q2 FY17 Segment Results (Non-GAAP)
$ millions
Q2 FY17 Q1 FY17 Q2 FY16
Revenue $265.0 $258.1 $218.3
Optical Communications 236.6 218.3 185.8
Telecom 160.1 165.6 137.9
Datacom 68.1 44.2 35.0
Industrial & Consumer(1) 8.4 8.5 12.9
Commercial Lasers 28.4 39.8 32.5
Gross Margin 36.9% 34.2% 32.7%
Optical Communications 36.6% 32.5% 30.7%
Commercial Lasers 39.4% 43.2% 43.7%
6
(1) Industrial & Consumer contains 3D sensing revenues as well as diode lasers sold into industrial applications.

© 2017 Lumentum Operations LLC
Balance Sheet
7
Selected Items - $ millions
Q2 FY17
Q1 FY17
Cash and Cash Equivalents $155.9 $166.8
Working Capital(1) 169.7 159.0
Property, Plant & Equipment, net 219.6 196.0
Total Assets 796.7 737.5
Total Liabilities 244.5 206.0
Shareholder’s Equity(2) 552.2 531.5
(1) Working capital excluding cash
(2) Includes convertible preferred stock of $35.8M

© 2017 Lumentum Operations LLC
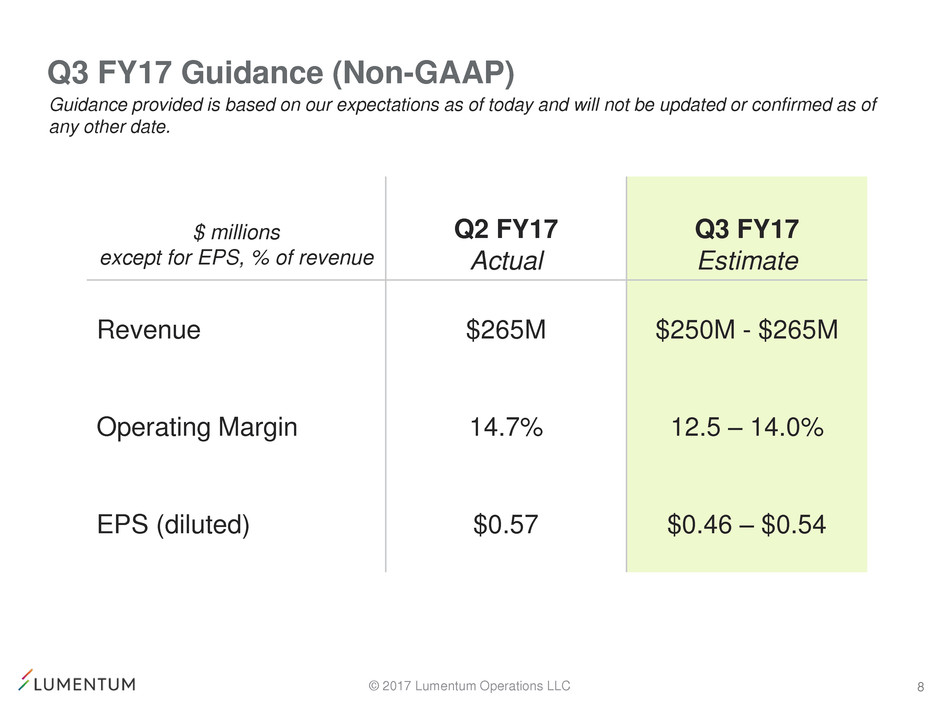
Q3 FY17 Guidance (Non-GAAP)
8
$ millions
except for EPS, % of revenue
Q2 FY17
Actual
Q3 FY17
Estimate
Revenue $265M $250M - $265M
Operating Margin 14.7% 12.5 – 14.0%
EPS (diluted) $0.57 $0.46 – $0.54
Guidance provided is based on our expectations as of today and will not be updated or confirmed as of
any other date.

