Attached files
| file | filename |
|---|---|
| 8-K - CAPITAL SOUTHWEST CORP | cswc-20170206x8k.htm |
| EX-99.1 - CAPITAL SOUTHWEST CORP | cswc-20170206ex991bd8c31.htm |
Exhibit 99.2
|
|
Capital Southwest Corporation Q3 2017 Earnings Presentation 5400 Lyndon B. Johnson Freeway, Suite 1300 Dallas, Texas 75240 214.238.5700 capitalsouthwest.com February 7, 2017 |

|
|
This presentation contains forward-looking statements within the meaning of The Private Securities Litigation Reform Act of 1995 relating to, among other things the business, financial condition and results of operations of Capital Southwest, the anticipated investment strategies and investments of Capital Southwest, and future market demand. Any statements preceded or followed by or that include the words "believe," "expect," "intend," "plan," "should" or similar words, phrases or expressions or the negative thereof, or any other statements that are not historical statements are forward-looking statements. These statements are made on the basis of the current beliefs, expectations and assumptions of the management of Capital Southwest. There are a number of risks and uncertainties that could cause Capital Southwest’s actual results to differ materially from the forward-looking statements included in this presentation. In light of these risks, uncertainties, assumptions, and other factors inherent in forward-looking statements, actual results may differ materially from those discussed in this presentation. Other unknown or unpredictable factors could also have a material adverse effect on Capital Southwest’s actual future results, performance, or achievements. For a further discussion of these and other risks and uncertainties applicable to Capital Southwest and its business, see Capital Southwest’s Annual Report on Form 10-K for the fiscal year ended March 31, 2016 and its subsequent filings with the Securities and Exchange Commission. As a result of the foregoing, readers are cautioned not to place undue reliance on these forward-looking statements, which speak only as of the date of this presentation. Capital Southwest does not assume any obligation revise or to update these forward-looking statements to reflect any new information, subsequent events or circumstances, or otherwise, except as may be required by law. Forward-Looking Statements |
|
|
Bowen S. Diehl President and Chief Executive Officer Michael S. Sarner Chief Financial Officer Chris Rehberger VP Finance / Treasurer Conference Call Participants |
|
|
In January 2015, CSWC refocused its investment strategy to become a lender to middle-market companies across the capital structure CSWC was formed in 1961, and became a BDC in 1988 Publicly-traded on Nasdaq under CSWC ticker Internally-managed BDC with RIC status for tax purposes In December 2014, announced intent to split into two separate companies with tax-free spin-off of industrial growth company (“CSW Industrials”; Nasdaq: CSWI) which was completed September 30th, 2015 17 employees based in Dallas, Texas Total Balance Sheet Assets of $312 MM as of December 31, 2016 CSWC has made significant strides towards rotating its investment portfolio from equity to credit CSWC Company Overview |

|
|
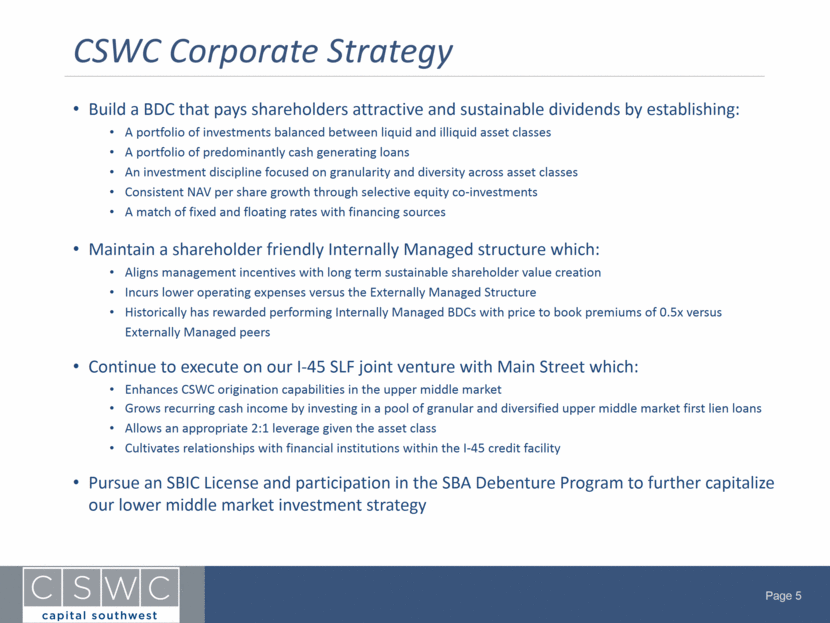
Build a BDC that pays shareholders attractive and sustainable dividends by establishing: A portfolio of investments balanced between liquid and illiquid asset classes A portfolio of predominantly cash generating loans An investment discipline focused on granularity and diversity across asset classes Consistent NAV per share growth through selective equity co-investments A match of fixed and floating rates with financing sources Maintain a shareholder friendly Internally Managed structure which: Aligns management incentives with long term sustainable shareholder value creation Incurs lower operating expenses versus the Externally Managed Structure Historically has rewarded performing Internally Managed BDCs with price to book premiums of 0.5x versus Externally Managed peers Continue to execute on our I-45 SLF joint venture with Main Street which: Enhances CSWC origination capabilities in the upper middle market Grows recurring cash income by investing in a pool of granular and diversified upper middle market first lien loans Allows an appropriate 2:1 leverage given the asset class Cultivates relationships with financial institutions within the I-45 credit facility Pursue an SBIC License and participation in the SBA Debenture Program to further capitalize our lower middle market investment strategy CSWC Corporate Strategy |
|
|
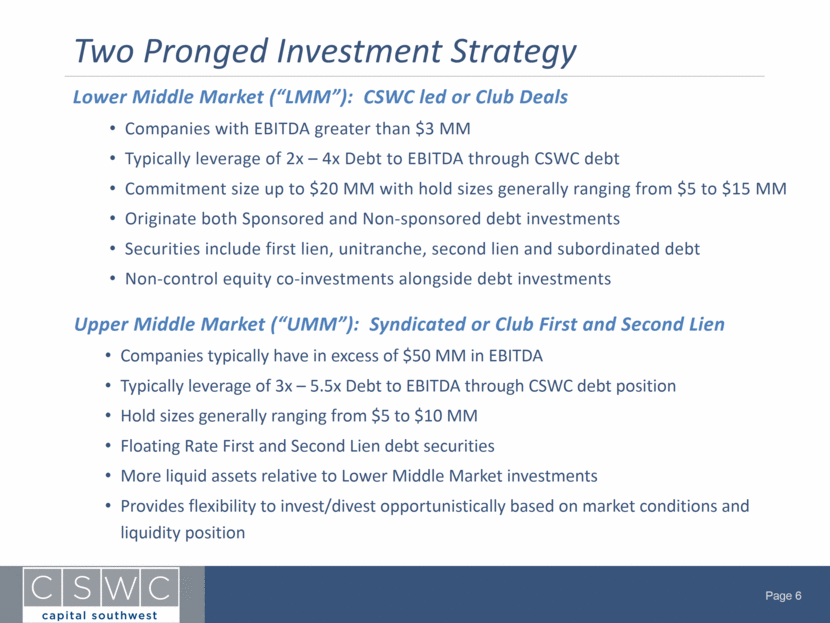
Lower Middle Market (“LMM”): CSWC led or Club Deals Companies with EBITDA greater than $3 MM Typically leverage of 2x – 4x Debt to EBITDA through CSWC debt Commitment size up to $20 MM with hold sizes generally ranging from $5 to $15 MM Originate both Sponsored and Non-sponsored debt investments Securities include first lien, unitranche, second lien and subordinated debt Non-control equity co-investments alongside debt investments Upper Middle Market (“UMM”): Syndicated or Club First and Second Lien Companies typically have in excess of $50 MM in EBITDA Typically leverage of 3x – 5.5x Debt to EBITDA through CSWC debt position Hold sizes generally ranging from $5 to $10 MM Floating Rate First and Second Lien debt securities More liquid assets relative to Lower Middle Market investments Provides flexibility to invest/divest opportunistically based on market conditions and liquidity position Two Pronged Investment Strategy |
|
|
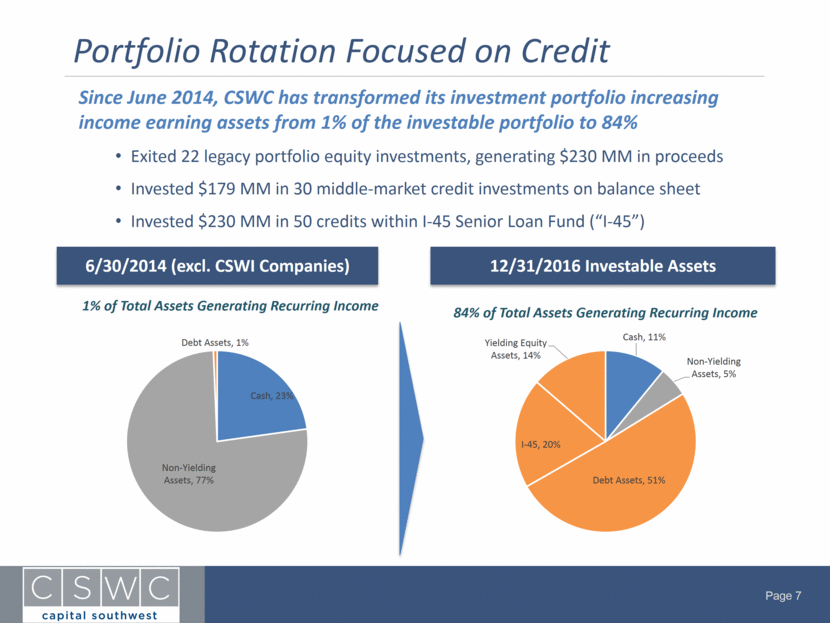
Portfolio Rotation Focused on Credit 6/30/2014 (excl. CSWI Companies) 12/31/2016 Investable Assets Since June 2014, CSWC has transformed its investment portfolio increasing income earning assets from 1% of the investable portfolio to 84% Exited 22 legacy portfolio equity investments, generating $230 MM in proceeds Invested $179 MM in 30 middle-market credit investments on balance sheet Invested $230 MM in 50 credits within I-45 Senior Loan Fund (“I-45”) Cash , 23% Non - Yielding Assets , 77% Debt Assets , 1% 1% of Total Assets Generating Recurring Income Cash , 11% Non - Yielding Assets , 5% Debt Assets , 51% I - 45 , 20% Yielding Equity Assets , 14% 84% of Total Assets Generating Recurring Income |
|
|
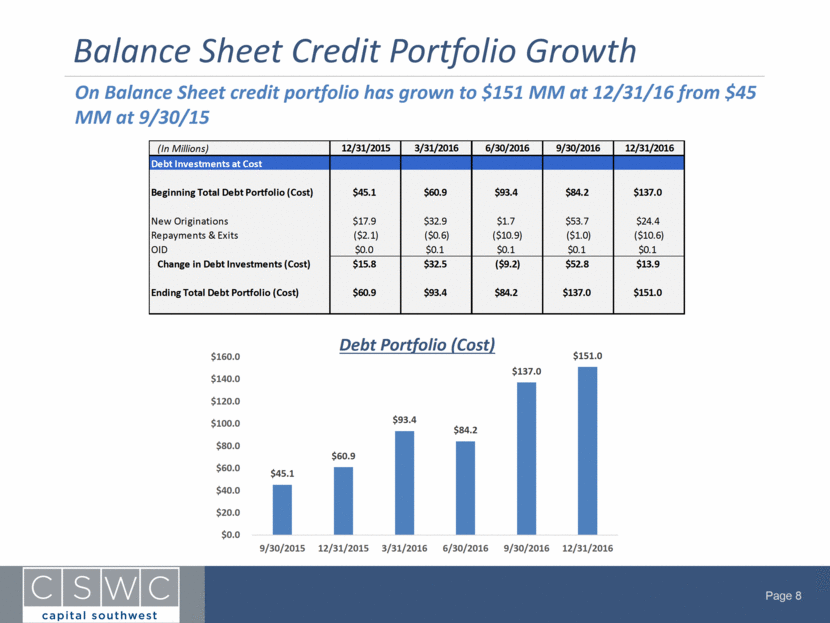
Balance Sheet Credit Portfolio Growth On Balance Sheet credit portfolio has grown to $151 MM at 12/31/16 from $45 MM at 9/30/15 Debt Portfolio (Cost) $45.1 $60.9 $93.4 $84.2 $137.0 $151.0 $0.0 $20.0 $40.0 $60.0 $80.0 $100.0 $120.0 $140.0 $160.0 9/30/2015 12/31/2015 3/31/2016 6/30/2016 9/30/2016 12/31/2016 (In Millions) 12/31/2015 3/31/2016 6/30/2016 9/30/2016 12/31/2016 Debt Investments at Cost Beginning Total Debt Portfolio (Cost) $45.1 $60.9 $93.4 $84.2 $137.0 New Originations $17.9 $32.9 $1.7 $53.7 $24.4 Repayments & Exits ($2.1) ($0.6) ($10.9) ($1.0) ($10.6) OID $0.0 $0.1 $0.1 $0.1 $0.1 Change in Debt Investments (Cost) $15.8 $32.5 ($9.2) $52.8 $13.9 Ending Total Debt Portfolio (Cost) $60.9 $93.4 $84.2 $137.0 $151.0 |
|
|
Portfolio Exits Since Launch of Credit Strategy $33 MM in Credit Portfolio exits generated 32% weighted average IRR 1Exits occurring after 12/31/16; Estimated realized gain and IRR Note: Market Segment refers to Upper Middle Market (“UMM”) and Lower Middle Market (“LMM”) Portfolio Originations - Since Quarter End Portfolio Exits Name Industry Type Market Date of Exit Proceeds Realized Gain IRR Freedom Truck Finance Last Out Unitranche LMM April 2016 $5,998 $0 14.2% Bob's Discount Furniture Retail 2nd Lien UMM June 2016 $5,000 $191 15.1% Vivid Seats Hotel, Gaming & Leisure 1st Lien UMM October 2016 $6,913 $446 21.5% Hygea (1) Healthcare & Pharmaceuticals 1st Lien w/ Warrants LMM January 2017 $10,804 $2,866 56.2% Polycom (1) Telecommunications 1st Lien UMM January 2017 $4,305 $74 32.2% Total / Wtd. Avg. $33,019 $3,577 31.9% |

|
|
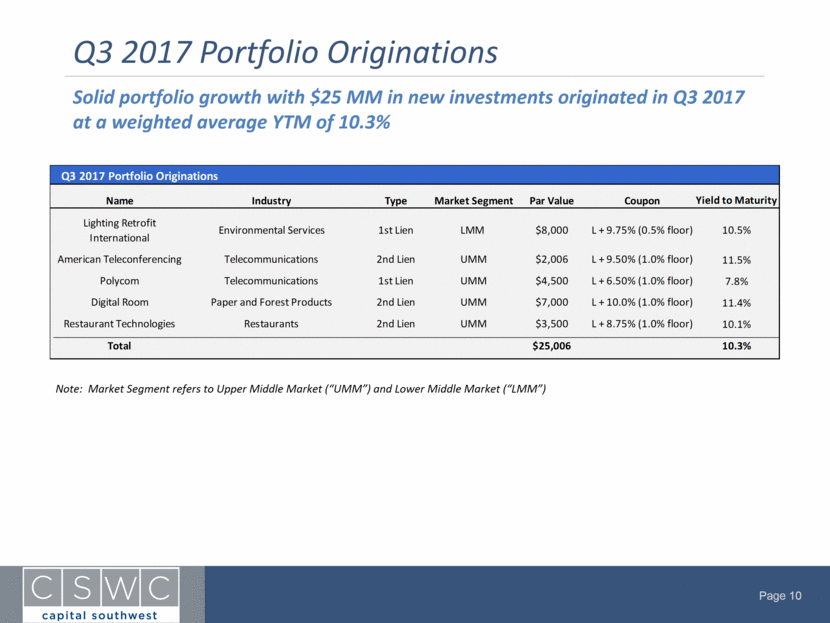
Q3 2017 Portfolio Originations Solid portfolio growth with $25 MM in new investments originated in Q3 2017 at a weighted average YTM of 10.3% Note: Market Segment refers to Upper Middle Market (“UMM”) and Lower Middle Market (“LMM”) Q3 2017 Portfolio Originations Name Industry Type Market Segment Par Value Coupon Yield to Maturity Lighting Retrofit International Environmental Services 1st Lien LMM $8,000 L + 9.75% (0.5% floor) 10.5% American Teleconferencing Telecommunications 2nd Lien UMM $2,006 L + 9.50% (1.0% floor) 11.5% Polycom Telecommunications 1st Lien UMM $4,500 L + 6.50% (1.0% floor) 7.8% Digital Room Paper and Forest Products 2nd Lien UMM $7,000 L + 10.0% (1.0% floor) 11.4% Restaurant Technologies Restaurants 2nd Lien UMM $3,500 L + 8.75% (1.0% floor) 10.1% Total $25,006 10.3% |
|
|
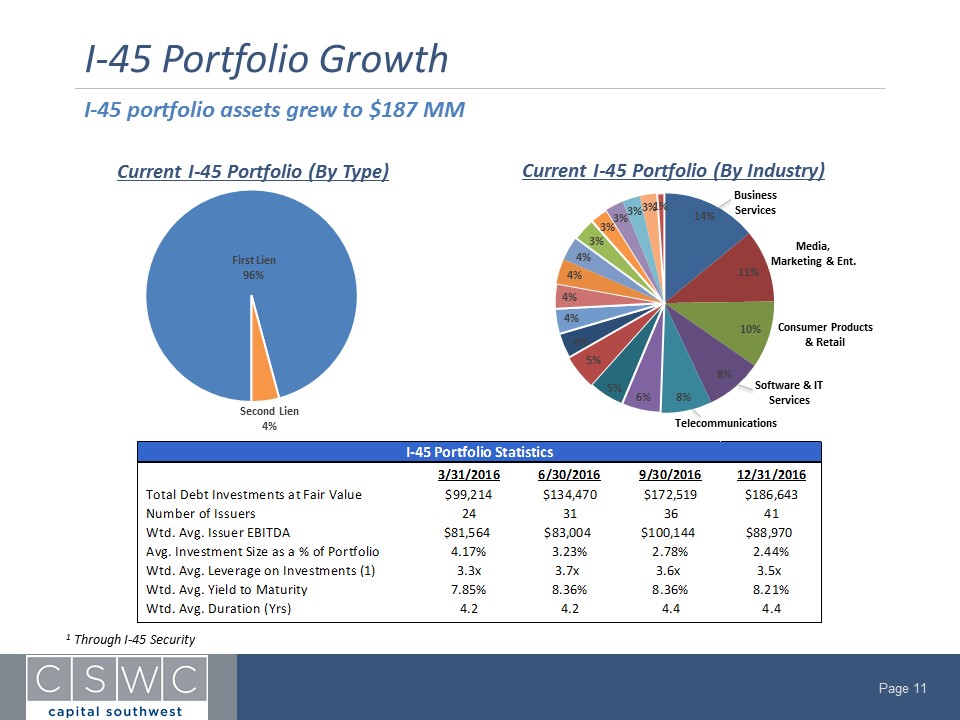
-45 Portfolio Growth I-45 portfolio assets grew to $187 MM Current I-45 Portfolio (By Type) Current I-45 Portfolio (By Industry) First Lien 96% Second Lien Current I-45 Portfolio (By Industry)Business Services Media, Marketing & Ent Consumer Products & Retail Software & IT Services Telecommunications 14% 11% 10% 8% 8% 6% 5% 5% 4% 4% 4% 4% 4% 3% 3% 3% 3% 3%2% I-45 Portfolio Statistics 3\31\2016 6\30\2016 9\30\2016 12\31\2016 Total Debt Investments at Fair Value $ 99,214 $134,470 $172,519 $186,643 Number of Issuers 24 31 36 41 Wtd. Avg. Issuer EBITDA $81,564 $ 83,004 $100,144 $88,970 Avg. Investment Size as a % of Portfolio 4.17% 3.23% 2.78% 2.44% Wtd. Avg. Leverage on Investments (1) 3.3x 3.7x 3.6x 3.5x Wtd. Avg. Yield to Maturity 7.85% 8.36% 8.36% 8.21% Wtd. Avg. Duration (Yrs) 4.2 4.2 4.4 4.4 1 Through I-45 Security CSWC capital southwest Page 11 |
|
|
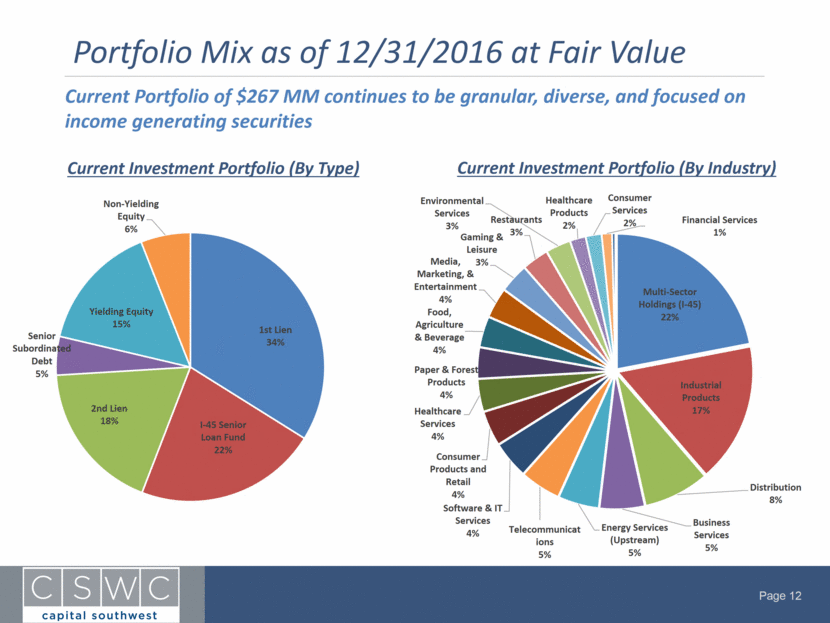
Portfolio Mix as of 12/31/2016 at Fair Value Current Investment Portfolio (By Type) Current Investment Portfolio (By Industry) Current Portfolio of $267 MM continues to be granular, diverse, and focused on income generating securities Multi - Sector Holdings (I - 45) 22% Industrial Products 17% Distribution 8% Business Services 5% Energy Services (Upstream) 5% Telecommunicat ions 5% Software & IT Services 4% Consumer Products and Retail 4% Healthcare Services 4% Paper & Forest Products 4% Food, Agriculture & Beverage 4% Media, Marketing, & Entertainment 4% Gaming & Leisure 3% Restaurants 3% Environmental Services 3% Healthcare Products 2% Consumer Services 2% Financial Services 1% 1st Lien 34% I - 45 Senior Loan Fund 22% 2nd Lien 18% Senior Subordinated Debt 5% Yielding Equity 15% Non - Yielding Equity 6% |
|
|
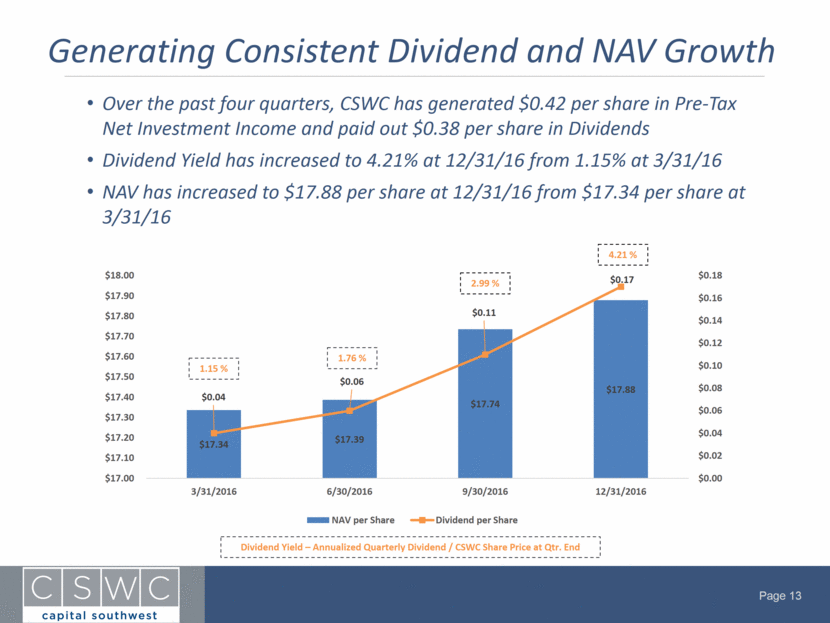
Generating Consistent Dividend and NAV Growth Over the past four quarters, CSWC has generated $0.42 per share in Pre-Tax Net Investment Income and paid out $0.38 per share in Dividends Dividend Yield has increased to 4.21% at 12/31/16 from 1.15% at 3/31/16 NAV has increased to $17.88 per share at 12/31/16 from $17.34 per share at 3/31/16 1.15 % 1.76 % 2.99 % 4.21 % Dividend Yield – Annualized Quarterly Dividend / CSWC Share Price at Qtr. End $17.34 $17.39 $17.74 $17.88 $0.04 $0.06 $0.11 $0.17 $0.00 $0.02 $0.04 $0.06 $0.08 $0.10 $0.12 $0.14 $0.16 $0.18 $17.00 $17.10 $17.20 $17.30 $17.40 $17.50 $17.60 $17.70 $17.80 $17.90 $18.00 3/31/2016 6/30/2016 9/30/2016 12/31/2016 NAV per Share Dividend per Share |
|
|
Financial Highlights Q3 2017 Pre-Tax Net Investment Income of $3.4 MM or $0.21 per weighted average diluted share Paid quarterly dividend in January of $0.17 per share Increased Investment Portfolio to $267 MM from $238 MM $25 MM deployed in five new originations $7 MM proceeds received in one prepayment $8 MM additional equity funded to I-45 Increased I-45 Senior Loan Fund investment portfolio to $187 MM from $173 MM I-45 distributed $2.4 MM dividend to CSWC, including $0.8 MM in gains from prepayments $39 MM deployed in nine new originations $18 MM proceeds received in four prepayments $32.7 MM in cash available for investment activity as of quarter end $85 MM available to draw on Credit Facility as of quarter end Q3 2017 Highlights |
|
|
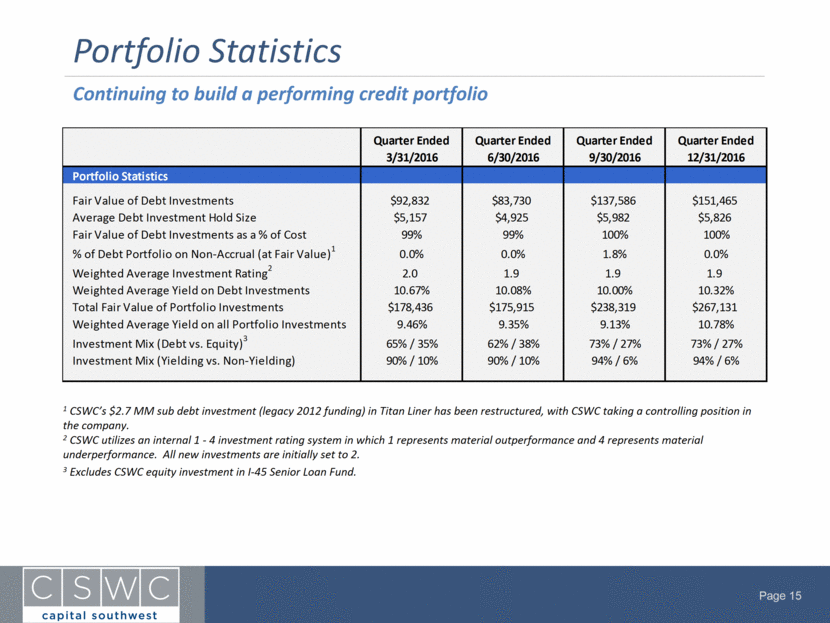
Portfolio Statistics 1 CSWC’s $2.7 MM sub debt investment (legacy 2012 funding) in Titan Liner has been restructured, with CSWC taking a controlling position in the company. 2 CSWC utilizes an internal 1 - 4 investment rating system in which 1 represents material outperformance and 4 represents material underperformance. All new investments are initially set to 2. 3 Excludes CSWC equity investment in I-45 Senior Loan Fund. Continuing to build a performing credit portfolio Quarter Ended 3/31/2016 Quarter Ended 6/30/2016 Quarter Ended 9/30/2016 Quarter Ended 12/31/2016 Portfolio Statistics Fair Value of Debt Investments $92,832 $83,730 $137,586 $151,465 Average Debt Investment Hold Size $5,157 $4,925 $5,982 $5,826 Fair Value of Debt Investments as a % of Cost 99% 99% 100% 100% % of Debt Portfolio on Non-Accrual (at Fair Value) 1 0.0% 0.0% 1.8% 0.0% Weighted Average Investment Rating 2 2.0 1.9 1.9 1.9 Weighted Average Yield on Debt Investments 10.67% 10.08% 10.00% 10.32% Total Fair Value of Portfolio Investments $178,436 $175,915 $238,319 $267,131 Weighted Average Yield on all Portfolio Investments 9.46% 9.35% 9.13% 10.78% Investment Mix (Debt vs. Equity) 3 65% / 35% 62% / 38% 73% / 27% 73% / 27% Investment Mix (Yielding vs. Non-Yielding) 90% / 10% 90% / 10% 94% / 6% 94% / 6% |
|
|
Financial Highlights Quarter Ended 3/31/2016 Quarter Ended 6/30/2016 Quarter Ended 9/30/2016 Quarter Ended 12/31/2016 Financial Highlights Pre-Tax Net Investment Income Per Wtd Avg Diluted Share $0.04 $0.06 $0.11 $0.21 Pre-Tax Net Investment Income Return on Equity (ROE) 1.03% 1.34% 2.54% 4.79% Dividends Per Share $0.04 $0.06 $0.11 $0.17 Earnings Per Wtd Avg Diluted Share $0.16 $0.17 $0.44 $0.49 Earnings Return on Equity (ROE) 3.67% 3.93% 9.87% 11.07% NAV Per Share $17.34 $17.39 $17.74 $17.88 Cash & Cash Equivalents $95,969 $96,957 $57,840 $32,671 Debt to Equity 0.0x 0.0x 0.0x 0.1x |

|
|
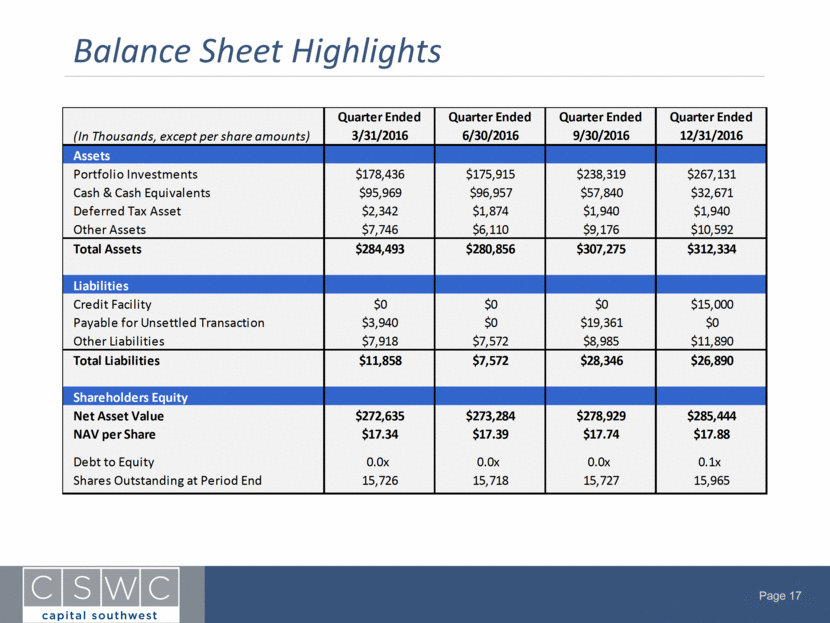
Balance Sheet Highlights (In Thousands, except per share amounts) Quarter Ended 3/31/2016 Quarter Ended 6/30/2016 Quarter Ended 9/30/2016 Quarter Ended 12/31/2016 Assets Portfolio Investments $178,436 $175,915 $238,319 $267,131 Cash & Cash Equivalents $95,969 $96,957 $57,840 $32,671 Deferred Tax Asset $2,342 $1,874 $1,940 $1,940 Other Assets $7,746 $6,110 $9,176 $10,592 Total Assets $284,493 $280,856 $307,275 $312,334 Liabilities Credit Facility $0 $0 $0 $15,000 Payable for Unsettled Transaction $3,940 $0 $19,361 $0 Other Liabilities $7,918 $7,572 $8,985 $11,890 Total Liabilities $11,858 $7,572 $28,346 $26,890 Shareholders Equity Net Asset Value $272,635 $273,284 $278,929 $285,444 NAV per Share $17.34 $17.39 $17.74 $17.88 Debt to Equity 0.0x 0.0x 0.0x 0.1x Shares Outstanding at Period End 15,726 15,718 15,727 15,965 |
|
|
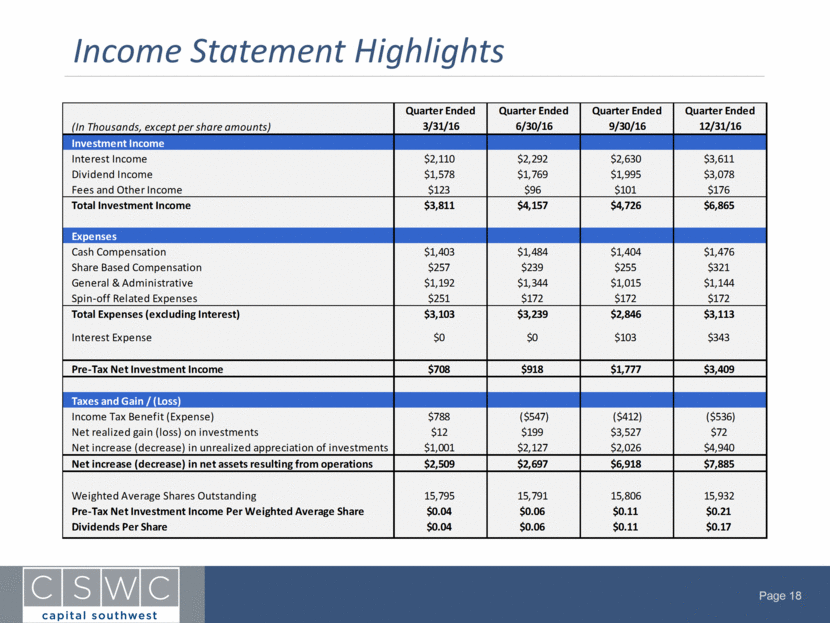
Income Statement Highlights (In Thousands, except per share amounts) Quarter Ended 3/31/16 Quarter Ended 6/30/16 Quarter Ended 9/30/16 Quarter Ended 12/31/16 Investment Income Interest Income $2,110 $2,292 $2,630 $3,611 Dividend Income $1,578 $1,769 $1,995 $3,078 Fees and Other Income $123 $96 $101 $176 Total Investment Income $3,811 $4,157 $4,726 $6,865 Expenses Cash Compensation $1,403 $1,484 $1,404 $1,476 Share Based Compensation $257 $239 $255 $321 General & Administrative $1,192 $1,344 $1,015 $1,144 Spin-off Related Expenses $251 $172 $172 $172 Total Expenses (excluding Interest) $3,103 $3,239 $2,846 $3,113 Interest Expense $0 $0 $103 $343 Pre-Tax Net Investment Income $708 $918 $1,777 $3,409 Taxes and Gain / (Loss) Income Tax Benefit (Expense) $788 ($547) ($412) ($536) Net realized gain (loss) on investments $12 $199 $3,527 $72 Net increase (decrease) in unrealized appreciation of investments $1,001 $2,127 $2,026 $4,940 Net increase (decrease) in net assets resulting from operations $2,509 $2,697 $6,918 $7,885 Weighted Average Shares Outstanding 15,795 15,791 15,806 15,932 Pre-Tax Net Investment Income Per Weighted Average Share $0.04 $0.06 $0.11 $0.21 Dividends Per Share $0.04 $0.06 $0.11 $0.17 |
|
|
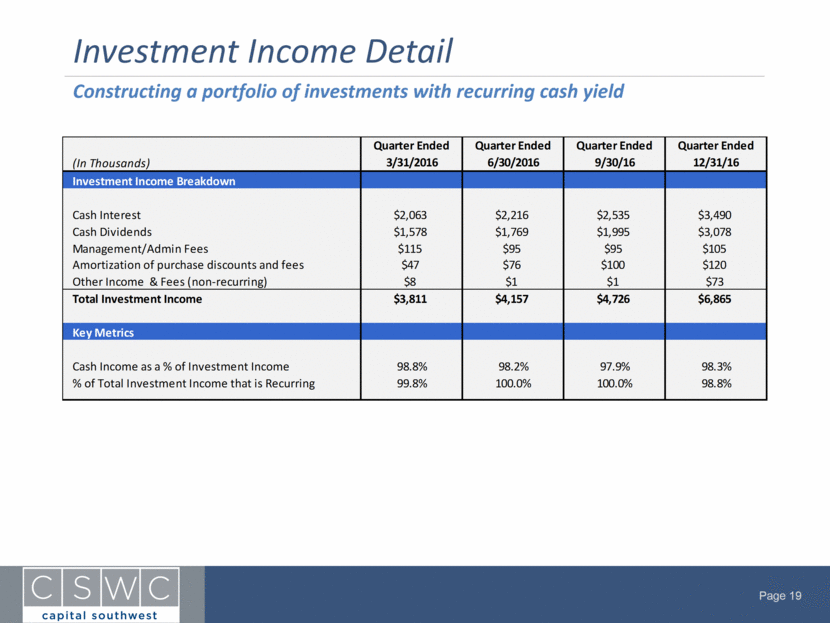
Investment Income Detail Constructing a portfolio of investments with recurring cash yield (In Thousands) Quarter Ended 3/31/2016 Quarter Ended 6/30/2016 Quarter Ended 9/30/16 Quarter Ended 12/31/16 Investment Income Breakdown Cash Interest $2,063 $2,216 $2,535 $3,490 Cash Dividends $1,578 $1,769 $1,995 $3,078 Management/Admin Fees $115 $95 $95 $105 Amortization of purchase discounts and fees $47 $76 $100 $120 Other Income & Fees (non-recurring) $8 $1 $1 $73 Total Investment Income $3,811 $4,157 $4,726 $6,865 Key Metrics Cash Income as a % of Investment Income 98.8% 98.2% 97.9% 98.3% % of Total Investment Income that is Recurring 99.8% 100.0% 100.0% 98.8% |
|
|
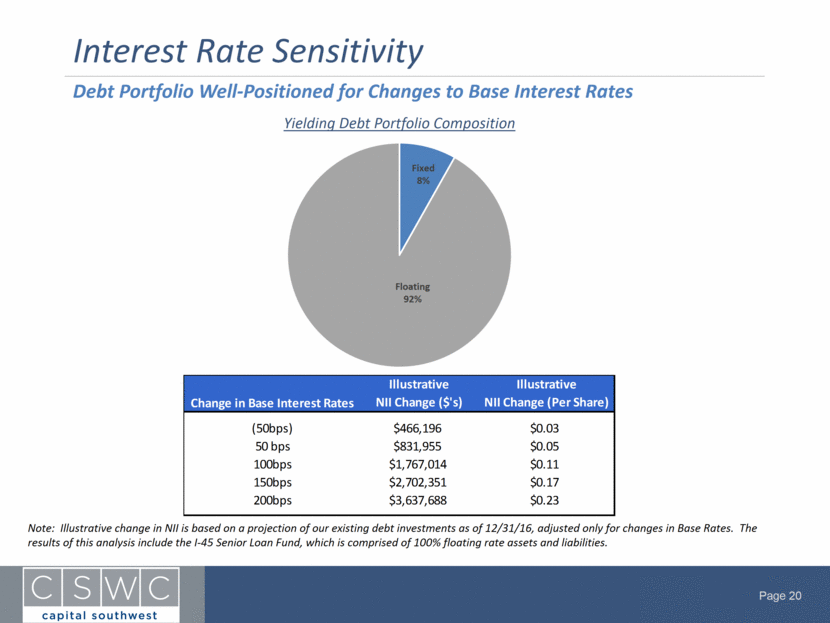
Interest Rate Sensitivity Yielding Debt Portfolio Composition Debt Portfolio Well-Positioned for Changes to Base Interest Rates Note: Illustrative change in NII is based on a projection of our existing debt investments as of 12/31/16, adjusted only for changes in Base Rates. The results of this analysis include the I-45 Senior Loan Fund, which is comprised of 100% floating rate assets and liabilities. Fixed 8% Floating 92% Change in Base Interest Rates Illustrative NII Change ($'s) Illustrative NII Change (Per Share) (50bps) $466,196 $0.03 50 bps $831,955 $0.05 100bps $1,767,014 $0.11 150bps $2,702,351 $0.17 200bps $3,637,688 $0.23 |
|
p |
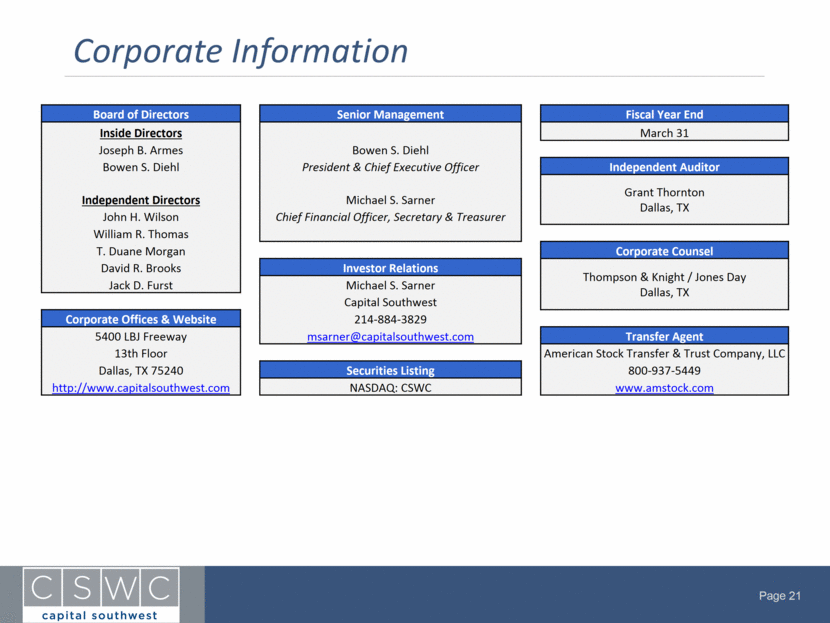
Corporate Information Board of Directors Senior Management Fiscal Year End Inside Directors March 31 Joseph B. Armes Bowen S. Diehl Bowen S. Diehl President & Chief Executive Officer Independent Auditor Grant Thornton Dallas, TX Independent Directors Michael S. Sarner John H. Wilson Chief Financial Officer, Secretary & Treasurer William R. Thomas T. Duane Morgan Corporate Counsel David R. Brooks Investor Relations Thompson & Knight / Jones Day Dallas, TX Jack D. Furst Michael S. Sarner Capital Southwest Corporate Offices & Website 214-884-3829 5400 LBJ Freeway msarner@capitalsouthwest.com Transfer Agent 13th Floor American Stock Transfer & Trust Company, LLC Dallas, TX 75240 Securities Listing 800-937-5449 http://www.capitalsouthwest.com NASDAQ: CSWC www.amstock.com |