Attached files
| file | filename |
|---|---|
| EX-23.8 - EX-23.8 - Foundation Building Materials, Inc. | d264719dex238.htm |
| EX-23.7 - EX-23.7 - Foundation Building Materials, Inc. | d264719dex237.htm |
| EX-23.6 - EX-23.6 - Foundation Building Materials, Inc. | d264719dex236.htm |
| EX-23.5 - EX-23.5 - Foundation Building Materials, Inc. | d264719dex235.htm |
| EX-23.4 - EX-23.4 - Foundation Building Materials, Inc. | d264719dex234.htm |
| EX-23.3 - EX-23.3 - Foundation Building Materials, Inc. | d264719dex233.htm |
| EX-23.2 - EX-23.2 - Foundation Building Materials, Inc. | d264719dex232.htm |
| EX-23.1 - EX-23.1 - Foundation Building Materials, Inc. | d264719dex231.htm |
| EX-21.1 - EX-21.1 - Foundation Building Materials, Inc. | d264719dex211.htm |
| EX-15.1 - EX-15.1 - Foundation Building Materials, Inc. | d264719dex151.htm |
| EX-5.1 - EX-5.1 - Foundation Building Materials, Inc. | d264719dex51.htm |
| EX-1.1 - EX-1.1 - Foundation Building Materials, Inc. | d264719dex11.htm |
Table of Contents
As filed with the Securities and Exchange Commission on February 3, 2017
Registration No. 333-215557
UNITED STATES
SECURITIES AND EXCHANGE COMMISSION
WASHINGTON, D.C. 20549
AMENDMENT NO. 2
TO
FORM S-1
REGISTRATION STATEMENT
UNDER
THE SECURITIES ACT OF 1933
Foundation Building Materials, Inc.
| Delaware | 5030 | 81-4259606 | ||
| (State or other jurisdiction of incorporation or organization) |
(Primary Standard Industrial Classification Code Number) |
(I.R.S. Employer Identification Number) |
2741 Walnut Avenue, Suite 200
Tustin, CA 92780
(714) 380-3127
(Address, including zip code, and telephone number, including area code, of registrant’s principal executive offices)
Ruben Mendoza
President and Chief Executive Officer
Foundation Building Materials, Inc.
2741 Walnut Avenue, Suite 200
Tustin, CA 92780
(714) 380-3127
(Name, address, including zip code, and telephone number, including area code, of agent for service)
Copies to:
| Jeffrey A. Chapman Peter W. Wardle Gibson, Dunn & Crutcher LLP 2100 McKinney Ave., Suite 1100 Dallas, TX 75201 tel: (214) 698-3100 fax: (214) 571-2900 |
Douglass M. Rayburn Samantha H. Crispin Baker Botts L.L.P. 2001 Ross Ave Dallas, TX 75201 tel: (214) 953-6500 fax: (214) 953-6503 |
Approximate date of commencement of proposed sale to the public: As soon as practicable after this registration statement is declared effective.
If any of the securities being registered on this Form are to be offered on a delayed or continuous basis pursuant to Rule 415 under the Securities Act of 1933, check the following box. ☐
If this Form is filed to register additional securities for an offering pursuant to Rule 462(b) under the Securities Act, please check the following box and list the Securities Act registration statement number of the earlier effective registration statement for the same offering. ☐
If this Form is a post-effective amendment filed pursuant to Rule 462(c) under the Securities Act, check the following box and list the Securities Act registration statement number of the earlier effective registration statement for the same offering. ☐
If this Form is a post-effective amendment filed pursuant to Rule 462(d) under the Securities Act, check the following box and list the Securities Act registration statement number of the earlier effective registration statement for the same offering. ☐
Indicate by check mark whether the registrant is a large accelerated filer, an accelerated filer, a non-accelerated filer, or a smaller reporting company. See the definitions of “large accelerated filer,” “accelerated filer” and “smaller reporting company” in Rule 12b-2 of the Exchange Act.
| Large accelerated filer | ☐ | Accelerated filer | ☐ | |||
| Non-accelerated filer | ☒ (Do not check if a smaller reporting company) | Smaller reporting company | ☐ | |||
CALCULATION OF REGISTRATION FEE
|
| ||||||||
| Title of Each Class of Securities to be Registered |
Amount to be Registered(1) |
Proposed Maximum Aggregate Offering Price Per Unit(2) |
Proposed Maximum Aggregate Offering Price(1)(2) |
Amount of Registration Fee(3) | ||||
| Common Stock, $0.001 par value per share |
14,720,000 | $19.00 | $279,680,000 | $32,414.92 | ||||
|
| ||||||||
|
| ||||||||
| (1) | Includes 1,920,000 shares of common stock that the underwriters have the option to purchase. See “Underwriting.” |
| (2) | Estimated solely for the purpose of calculating the registration fee under Rule 457(a) of the Securities Act of 1933, as amended. |
| (3) | Previously paid. |
The Registrant hereby amends this Registration Statement on such date or dates as may be necessary to delay its effective date until the Registrant shall file a further amendment which specifically states that this Registration Statement shall thereafter become effective in accordance with Section 8(a) of the Securities Act of 1933 or until the Registration Statement shall become effective on such date as the Commission, acting pursuant to said Section 8(a), may determine.
Table of Contents
The information in this preliminary prospectus is not complete and may be changed. These securities may not be sold until the registration statement filed with the Securities and Exchange Commission is effective. This preliminary prospectus is not an offer to sell nor does it seek an offer to buy these securities in any jurisdiction where the offer or sale is not permitted.
SUBJECT TO COMPLETION, DATED FEBRUARY 3, 2017
12,800,000 Shares

Foundation Building Materials, Inc.
Common Stock
$ per share
This is the initial public offering of our common stock. We are offering 12,800,000 shares of our common stock. Prior to this offering, there has been no public market for our common stock. It is currently estimated that the initial public offering price per share will be between $17.00 and $19.00.
The selling stockholder has granted to the underwriters an option to purchase up to 1,920,000 additional shares of common stock. We will not receive any proceeds from the sale of shares by the selling stockholder.
After the completion of this offering, Lone Star Fund IX (U.S.), L.P. and certain of its affiliates will continue to beneficially own a majority of the voting power of all outstanding shares of our common stock. As a result, we will be a “controlled company.”
We have applied to list our common stock on the New York Stock Exchange under the symbol “FBM.”
We are an “emerging growth company” as defined under the federal securities laws and, as such, may elect to comply with certain reduced public company reporting requirements for this filing and future filings. See “Prospectus Summary – Implications of Being an Emerging Growth Company.”
Investing in our common stock involves risks. See “Risk Factors” beginning on page 24 to read about factors you should consider before buying shares of our common stock.
Neither the Securities and Exchange Commission nor any other regulatory body has approved or disapproved of these securities or passed upon the accuracy or adequacy of this prospectus. Any representation to the contrary is a criminal offense.
| Per Share | Total | |||||||
| Initial public offering price |
$ | $ | ||||||
| Underwriting discount(1) |
$ | $ | ||||||
| Proceeds to us (before expenses) |
$ | $ | ||||||
| Proceeds to selling stockholder (before expenses) |
$ | $ | ||||||
| (1) | See “Underwriting” for a description of all underwriting compensation payable in connection with this offering. |
The underwriters expect to deliver the shares against payment to purchasers on or about , 2017 through the book-entry facilities of The Depository Trust Company.
| Joint Book-Running Managers | ||||
| Deutsche Bank Securities | Barclays | RBC Capital Markets | ||
| Citigroup | ||||
| Lead Manager | ||||||
| Baird
| ||||||
| Co-Managers | ||||||
| Raymond James | Stephens Inc. | SunTrust Robinson Humphrey | William Blair | |||
Prospectus dated , 2017
Table of Contents

Table of Contents
| Page | ||||
| ii | ||||
| 1 | ||||
| 24 | ||||
| 53 | ||||
| 55 | ||||
| 56 | ||||
| 57 | ||||
| 59 | ||||
| 61 | ||||
| Unaudited Pro Forma Condensed Combined Financial Information |
63 | |||
| Management’s Discussion and Analysis of Financial Condition and Results of Operations |
75 | |||
| 116 | ||||
| 134 | ||||
| 143 | ||||
| 150 | ||||
| 152 | ||||
| 157 | ||||
| 163 | ||||
| 166 | ||||
| 168 | ||||
| Underwriting (Conflicts of Interest) |
173 | |||
| 181 | ||||
| 181 | ||||
| 183 | ||||
| F-i | ||||
We are responsible for the information contained in this prospectus, in any amendment or supplement to this prospectus and in any free-writing prospectus we prepare or authorize. We have not authorized anyone to provide you with different information, and we take no responsibility for and cannot provide any assurance as to the reliability of any other information others may give you. We are not, the selling stockholder is not and the underwriters are not, making an offer to sell shares of our common stock in any jurisdiction where the offer or sale is not permitted. You should not assume that the information contained in this prospectus is accurate as of any date other than its date.
i
Table of Contents
Certain Definitions
As used in this prospectus, unless otherwise noted or the context otherwise requires:
| • | “we,” “our,” “us” and “the Company” refer to (i) for the Predecessor periods prior to the completion of the Lone Star Acquisition (as defined below), the business of FBM Intermediate Holdings, LLC, (ii) for the Successor periods after completion of the Lone Star Acquisition, but prior to the internal reorganization transaction described in the section entitled “Prospectus Summary – Reorganization,” the business of FBM and (iii) for the Successor periods after completion of the internal reorganization transaction, the business of Foundation Building Materials, Inc., in each case together with its consolidated subsidiaries; |
| • | “Cypress” refers only to LSF9 Cypress Parent, LLC, the direct parent of Cypress Holdings and the indirect parent of FBM; |
| • | “Cypress Holdings” refers to LSF9 Cypress Holdings, LLC; |
| • | “Cypress Parent” refers to LSF9 Cypress Parent 2 LLC, the direct parent of Foundation Building Materials, Inc. and the indirect parent of Cypress, Cypress Holdings and FBM; |
| • | “FBM” refers to FBM Intermediate Holdings LLC, a direct wholly-owned subsidiary of Cypress Holdings, and its subsidiaries, including Foundation Building Materials, LLC; |
| • | “Great Western” refers collectively to the business operations and assets acquired from Great Western Building Materials, Inc., Oxnard Building Materials, Inc. and ProWall Building Products, Inc.; |
| • | “GSCIL” refers to the business operations and assets acquired from Gypsum Supply Company; |
| • | “Ken API“ refers to the business operations and assets acquired from Ken Builders Supply, Inc.; |
| • | “Lone Star” or the “Sponsor” refers to Lone Star Fund IX (U.S.), L.P. together with certain of its affiliates and associates, but excluding us and other companies it owns as a result of its investment activities; |
| • | “Lone Star Acquisition” refers to the acquisition of the Company and its assets and operations by Cypress through a newly formed company, Cypress Holdings, on October 9, 2015; and |
| • | “Winroc-SPI” refers to the Construction Products Distribution business division of, and acquired from, Superior Plus Corp. |
We also use certain industry terms throughout this prospectus. Such terms include “mechanical insulation” to refer to the commercial and industrial insulation end market, each with respect to insulation. In addition, wallboard and drywall are used interchangeably in our industry.
When we refer to U.S. publicly traded building products distributors, we are referring to Beacon Roofing Supply (BECN), Boise Cascade Company (BCC), Builders First Source (BLDR), BMC Stock Holdings (BMCH), GMS (GMS), HD Supply (HDS), Pool Corp (POOL), SiteOne (SITE), TopBuild (BLD), Universal Forest Products (UFPI) and Watsco (WSO).
ii
Table of Contents
Basis of Presentation
The historical financial information presented and discussed in this prospectus is derived from the audited and unaudited financial statements of Cypress Holdings and its consolidated subsidiaries for the periods presented. Financial information for the nine months ended September 30, 2016 and for the period from October 9, 2015 through December 31, 2015 relates to the period succeeding the completion of the Lone Star Acquisition. Financial information for the nine months ended September 30, 2015 and for the period from January 1, 2015 to October 8, 2015 relate to the period preceding the completion of the Lone Star Acquisition. The terms “Predecessor” and “Successor” refer to the pre-and post-Lone Star Acquisition financial position and results of the Company, respectively.
Pro Forma Financial Information
In addition to our results and those of certain of the companies we have acquired presented under generally accepted accounting principles in the United States, or GAAP, or International Financing Reporting Standards, or IFRS, in this prospectus we also present certain pro forma financial information that gives effect to the following transactions, collectively referred to as the Pro Forma Transactions:
| • | the Lone Star Acquisition; |
| • | the acquisitions of each of Ken API, Great Western, GSCIL and Winroc-SPI; |
| • | the impacts of the Tax Receivable Agreement described in the section entitled “Certain Relationships and Related Party Transactions—Tax Receivable Agreement;” |
| • | the issuance of $575.0 million of senior secured notes due 2021, the entry into a new asset backed revolving credit facility in August 2016, as amended in September 2016, and borrowings thereunder of $190.0 million and the repayment in full of our then-outstanding indebtedness; and |
| • | the completion of this offering and the anticipated use of proceeds. |
The Pro Forma Transactions are discussed in greater detail in the section entitled “Unaudited Pro Forma Condensed Combined Financial Information.” Our historical financial results do not reflect any impact or the full impact, as applicable, of the Pro Forma Transactions, and our management believes it is important to discuss our pro forma financial information in addition to our historical results because it provides investors with additional context regarding our business. However, our pro forma financial information contains limitations. For example, the Pro Forma Transactions do not include, and our pro forma financial information does not reflect adjustments relating to, the acquisitions of United Drywall Supply, Inc., Kent Gypsum Supply, Inc., Mid America Drywall Supply, and Commercial Building Materials, or collectively, the Other Acquisitions, that we have completed since January 1, 2015 that are not considered significant under Article 11 of Regulation S-X. Our pro forma financial information should not be considered independent of our audited consolidated financial statements and the related notes thereto and unaudited condensed combined financial statements and the related notes thereto, in each case included elsewhere in this prospectus, and the pro forma financial statements and the related notes thereto included in the section entitled “Unaudited Pro Forma Condensed Combined Financial Information.”
Industry and Market Data
The data included in this prospectus and, in particular, in the sections entitled “Prospectus Summary” and “Business,” regarding markets and the industry in which we operate, including
iii
Table of Contents
the size of certain markets and our position and the position of our competitors within these markets, are based on publicly available information, reports of government agencies and published industry sources.
In this prospectus, when we refer to:
| • | “Dodge Data & Analytics” we are referring to Dodge Data & Analytics a provider of data, analytics, news and intelligence serving the North American construction industry; |
| • | “Longbow Research” we are referring to Longbow Securities, LLC; |
| • | “Ducker” we are referring to a due diligence report prepared by Ducker Worldwide Advisors, LLC for Lone Star in connection with the Lone Star Acquisition; and |
| • | “Gypsum Association” we are referring to statistical information obtained from the Gypsum Association, a non-profit trade association. |
Data regarding the industries in which we compete and our market position and market share within these industries are inherently imprecise and are subject to significant business, economic and competitive uncertainties beyond our control, but we believe that they generally indicate size and position and market share within these industries. We have not independently verified market data and industry forecasts provided by any of these or any other third-party sources referred to in this prospectus, although we believe such market data and industry forecasts included in this prospectus are reliable. This information cannot always be verified with complete certainty due to the limits on the availability and reliability of raw data, the voluntary nature of the data gathering process and other limitations and uncertainties inherent in surveys of market size.
Management estimates are derived from the information referred to above, as well as our internal research, calculations and assumptions made by us based on our analysis of such information and data and our knowledge of our industries and markets. We believe these estimates to be accurate as of the date of this prospectus. As a result, you should be aware that market, ranking and other similar industry data included in this prospectus, and estimates and beliefs based on that data, may not be reliable, and we cannot guarantee the accuracy or completeness of any such information contained in this prospectus. Assumptions, expectations and estimates of our future performance and the future performance of the industries and markets in which we operate are necessarily subject to a high degree of uncertainty and risk due to a variety of factors, including those described in the sections entitled “Risk Factors” and “Forward-Looking Statements.” These and other factors could cause results to differ materially from those expressed in the estimates made by the independent parties and by us.
Trademarks
We own or have the rights to use various trademarks, service marks and trade names that we use in connection with the operation of our business. This prospectus may also contain trademarks, service marks and trade names of third parties, which are the property of their respective owners. Our use or display of third parties’ trademarks, service marks, trade names or products in this prospectus is not intended to, and does not, imply a relationship with, or endorsement or sponsorship by, us. Solely for convenience, the trademarks, service marks and trade names presented in this prospectus may appear without the ®, TM or SM symbols, but such references are not intended to indicate, in any way, that we will not assert, to the fullest extent under applicable law, our rights or the rights of the applicable licensor to these trademarks, service marks and trade names.
iv
Table of Contents
The following is a summary of material information discussed in this prospectus. The summary is not complete and does not contain all of the information that you should consider before investing in our common stock. You should read this entire prospectus carefully, including the risks discussed in the section entitled “Risk Factors” and our audited and unaudited Predecessor and Successor financial statements and the related notes thereto, and our unaudited pro forma condensed combined financial information and the related notes thereto, each included elsewhere in this prospectus, before making an investment decision to purchase shares of our common stock. Some of the statements in this summary constitute forward-looking statements. See the section entitled “Forward-Looking Statements.”
Our Company
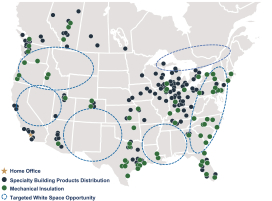
We are the second largest specialty distributor of wallboard and suspended ceiling systems in the United States and Canada, and the fastest growing by revenue and branch count since our founding in 2011. We are also the second largest specialty distributor and one of the largest fabricators of commercial and industrial mechanical insulation in the United States. We have expanded from a single branch in Southern California to 210 branches across the United States and Canada as of December 31, 2016, carrying a broad array of more than 35,000 SKUs. Our organic growth initiatives and disciplined acquisition strategy have enabled us to grow rapidly. Our net sales in 2013 were $113.7 million and we reached pro forma net sales of $1.42 billion for the nine months ended September 30, 2016. We have grown revenue faster than any U.S. publicly traded building products distributor over the same period. Our goal is to be the leading company within specialty building products distribution and to continue expanding into complementary markets.
We serve as a critical link between our supplier base and a diverse and highly fragmented base of over 30,000 customers. Our specialty building products segment, which distributes wallboard and accessories, metal framing, suspended ceiling systems and other products, accounted for approximately 85% of our pro forma net sales for the nine months ended September 30, 2016. Within this segment, we distribute products to contractors who install them in commercial and residential buildings for both new construction and repair and remodeling projects. Our mechanical insulation segment, which distributes commercial and industrial insulation products to provide insulation solutions for pipes and mechanical systems, accounted for approximately 15% of our pro forma net sales for the nine months ended September 30, 2016. We fabricate and distribute these products for specialty contractors seeking to improve or maintain energy efficiency in a diverse range of commercial and industrial buildings. Our customers use these products in new construction and maintenance, repair and operations, or MRO, of existing facilities.
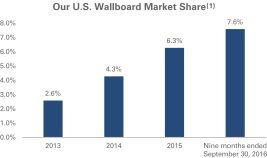
We have an expansive branch network that serves attractive markets across the United States and in Canada. The ability to leverage our expansive branch network, together with our organic growth initiatives and disciplined acquisition strategy, has allowed us to drive significant share gains in the wallboard distribution market. According to the Gypsum Association, the U.S. wallboard market experienced volume growth of 4.9% and 2.6% in 2014 and 2015, respectively. We experienced higher growth than the industry during this period, generating wallboard volume growth of 7.2% and 7.7% in 2014 and 2015, respectively (including volume for the Company and, with respect to each acquired entity, volume for each such entity
1
Table of Contents
for the entire year of acquisition and the year prior to acquisition). We have increased our U.S. wallboard market share from 2.6% in 2013 to 7.6% for the nine months ended September 30, 2016, and we see significant opportunity for additional market share gains.
|
|
| (1) | Market share for each period includes volume for the Company and, with respect to each acquired entity, volume for each such entity for the entire year of acquisition. |
We believe that our customers select and trust us because we have the expertise to efficiently and effectively handle and deliver a broad product offering, including wallboard, metal framing, suspended ceiling systems, mechanical insulation and complementary products, and to manage the complex logistics required to safely deliver and stock the right products to the appropriate locations at each jobsite. It is critical for our contractor customers to have the correct product, when they need it, in order to complete their projects on time and on budget without costly delays. We also provide our customers with technical product expertise, including proper installation techniques for new products. Our national scale gives us the ability to serve contractors and homebuilders that operate across multiple geographic markets. Most of our customer accounts are managed by salespeople and managers who communicate with customers on a regular basis and, as a result, have developed longstanding and trusted relationships. Our top 20 customers based on pro forma net sales for the nine months ended September 30, 2016, had an average tenure of 19 years with us or one of our acquired companies, and no one customer accounted for more than 1.5% of our pro forma net sales during this period.
We have close relationships with our suppliers at both the executive and local branch level. We believe we are a preferred distributor for our suppliers due to our scale, nationwide footprint, leading market positions, knowledgeable professionals, high service levels and strong relationships with a broad set of contractor customers. We also believe our suppliers seek our business because we are one of the highest growth distributors in our industry and have a demonstrated ability to achieve above market growth. In suspended ceiling systems, we have exclusive distribution relationships in select geographies for certain products. These relationships include contractual exclusivity with Armstrong World Industries, Inc., or Armstrong, and relationship-based exclusivity with USG Corporation, or USG. Armstrong has supported our expansion by renewing our contractual exclusivity or extending our contractual exclusivity into additional territories after we acquired companies. This contractual exclusivity makes us the sole distributor carrying Armstrong products in certain regions. We also possess semi-exclusive distribution rights in other regions. Supplier concentration remains low across
2
Table of Contents
all of our product categories, and our largest supplier accounted for approximately 14% of pro forma purchases for the nine months ended September 30, 2016.
We serve a balanced mix of end markets across the new non-residential construction, new residential construction and the non-residential repair and remodel sectors. Our products are used in the construction and repair and remodel of new commercial buildings, single-family and multi-family homes and industrial facilities. We believe activity in the new construction end markets will continue to grow, since new non-residential activity and residential housing starts in the United States remain below historical averages. Our products are used for the maintenance, repair and remodel of existing structures, including industrial MRO, which we believe provides a stable source of revenue across economic cycles.
The table below summarizes our major product categories, applications and end markets.
| Our Products | ||||||||||||
| Wallboard
& |
Metal Framing |
Ceilings |
Other Products |
Commercial | ||||||||
| % of Pro Forma Net Sales for the nine months ended September 30, 2016
|
42% | 14% | 16% | 18% | 10% | |||||||
| Applications |
Interior walls and ceilings | Wallboard structural support, typically sold as part of a package with wallboard, insulation, or suspended ceiling systems | Suspended ceiling systems | Stucco/exterior insulation and finishing system, building insulation, tools, safety accessories and fasteners | Insulation solutions for pipes and mechanical systems | |||||||
|
New Non-Residential
|
✓ | ✓ | ✓ | ✓ | ✓ | |||||||
| Primary End Markets |
New Residential
|
✓ | ✓ | ✓ | ||||||||
|
Non-Residential Repair and Remodel
|
✓ | ✓ | ✓ | ✓ | ✓ | |||||||
We were founded in 2011 by our President and Chief Executive Officer Ruben Mendoza, our Chief Financial Officer John Gorey and our California Regional Vice President Tom Fischbeck. Mr. Mendoza previously served as CEO of Acoustical Material Services where he oversaw the successful growth of the company before it was acquired by Allied Building Products, a subsidiary of CRH, in 2007. In founding our company, Mr. Mendoza applied a proven customer- centric operating model to an organization that would combine strong organic growth with an effective acquisition and integration program across a fragmented industry. In November 2013, we strengthened our management team with the addition of our Chief Operating Officer, Pete Welly, who has 37 years of experience in our industry. Other members of our management
3
Table of Contents
team have spent the majority of their careers in the wallboard and suspended ceiling systems distribution industry. As a result of long and close personal relationships with many of the private owners of wallboard and suspended ceiling systems distributors, our acquisitions generally have been completed on a privately negotiated, non-auction basis. Since 2013, the majority of senior level leaders who have sold us their businesses have elected to stay on as active employees and are often our best references to owners considering a sale to us. As of December 31, 2016, our management and employees owned approximately 10.2% of our parent, which, immediately following consummation of the offering, will own approximately 70.1% of our common stock (or 65.6% if the underwriters exercise in full their option to purchase additional shares).
For the year ended December 31, 2015, we had pro forma net sales of $1.76 billion, pro forma net loss of $13.2 million and pro forma Adjusted EBITDA of $112.4 million. For the nine months ended September 30, 2016, we had pro forma net sales of $1.42 billion, pro forma net loss of $9.4 million, and pro forma Adjusted EBITDA of $88.3 million. Adjusted EBITDA is a non-GAAP measure. See the section entitled “Management’s Discussion and Analysis of Financial Condition and Results of Operations—Non-GAAP Financial Information” for a discussion of how we define and calculate this measure, a reconciliation thereof to net loss, the most directly comparable GAAP measure and a discussion of why we believe this measure is important.
Our Industry
We participate in the U.S. and Canadian markets for the specialty distribution of wallboard, suspended ceiling systems, metal framing and other products, and the custom fabrication and distribution of mechanical insulation products. As distributor consolidation has continued, we believe scale has grown increasingly important. Larger distributors are generally able to achieve better pricing from manufacturers through scaled purchasing. We believe that larger distributors like us are better positioned to capture a greater share of volume growth given their extensive and diverse customer bases, and that larger distributors like us with variable cost structures will continue to see incremental margin improvement from increased volume through economies of scale.
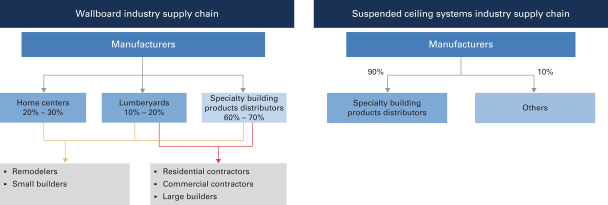
Wallboard and suspended ceiling systems
Based on industry research and public filings, we estimate the total United States and Canada market for the distribution of wallboard and suspended ceiling systems was approximately $14.0 billion in 2015, approximately 70% of which was served by specialty building products distributors rather than other channels such as big box retailers and lumberyards. Specialty distributors play a critical role in this industry by connecting a concentrated set of suppliers with a diverse and fragmented set of non-residential and residential construction contractors. Of the four largest national wallboard distributors, we are one of two actively consolidating wallboard specialty distributors. Our remaining competitors are generally smaller regional and local firms, many of which we view as attractive acquisition opportunities.
Companies in our industry compete based on key value-added services, including broad product selection, nearby branches, logistics planning, specialized and same-day delivery capabilities, stocking services, trade credit and technical product expertise in local markets. We believe these characteristics, combined with strong supplier and customer relationships, create
4
Table of Contents
significant barriers to entry for de novo market entrants. Barriers to entry, along with the highly fragmented nature of the industry (with hundreds of local or regional players), are catalysts for significant consolidation, and we believe we have been one of the most active acquirers of companies in our industry since January 2013.
Source: Management estimates
Comparison between wallboard and ceiling systems distribution and roofing distribution
We believe meaningful parallels exist between the specialty distribution markets for our wallboard and suspended ceiling systems products and roofing materials. Both markets exhibit a similar value proposition to customers and suppliers; enjoy a balanced mix of residential and commercial construction end markets; benefit from growth in new construction and the relative stability of repair and remodel activity; generate comparable margins; and utilize similar fleets of specialized delivery vehicles and logistical processes. There has been a significant consolidation of roofing material suppliers over the past 15 years, and our industry has begun to consolidate as the roofing distribution industry did over this period. We believe this lag in consolidation in the wallboard and suspended ceiling systems distribution industry as compared to the roofing distribution industry highlights the opportunity for us to continue to grow our business through acquisitions.
Mechanical insulation
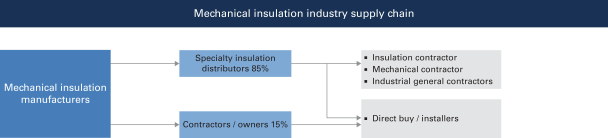
According to Ducker Worldwide, the mechanical insulation market for the distribution of commercial and industrial insulation in the United States was approximately $2.6 billion in 2015. Like wallboard and suspended ceiling systems, we believe specialty distributors of commercial and industrial insulation products hold a strong position in the value chain and provide a number of value-added capabilities to customers and suppliers, including the custom fabrication of mechanical insulation products such as fiberglass, metal cladding, mineral wool and foam. Custom fabricated products eliminate the specialty contractor’s need to cut and form insulation on site, thereby reducing waste and labor costs. We believe insulation contractors generally prefer to consolidate purchases with a single distributor and such contractors often choose their distributor based on custom fabrication capabilities.
Key end markets for mechanical insulation are non-residential new construction, non-residential repair and remodel and industrial MRO. Non-residential construction spending and
5
Table of Contents
changes in the energy efficiency standards are key drivers of demand for these types of applications. In particular, the need to meet stricter building codes and the certification of commercial buildings to achieve established energy efficiency standards have been positive contributors to industry growth the past few years.
Source: Management estimates
Our Competitive Strengths
Market leader with significant size and scale advantages
Our coast-to-coast footprint enables us to distribute our comprehensive product offering to a large, diverse set of customers and provides us with significant economies of scale that we believe give us cost advantages versus our smaller competitors. As a leading specialty building products distributor, we are able to negotiate volume discounts and preferential pricing terms with our key suppliers. As we continue to grow, we believe we will realize additional cost savings and other benefits from scale.
Smaller competitors generally lack the resources to properly handle the logistical complexities of large scale specialty building products distribution. We have been able to realize procurement discounts on our large fleet of over 2,725 vehicles, and we leverage this fleet to realize operational cost advantages from economies of scale. Additionally, our local market scale adds route density, which increases our profit margins. We believe our consolidated information technology systems and central administrative functions, which are shared nationally across our platform, generate additional operating cost efficiencies.
Proven operating model
We believe that our national operating model supported by local market expertise, entrepreneurial and customer centric-culture, acquisition and integration expertise and strong national brand has established us as the distributor of choice for leading suppliers and over 30,000 customers across a balanced mix of construction-related end markets. Our management team originally utilized elements of this operating model while overseeing AMS and has applied them to us. Since our inception, we have invested heavily in identifying, recruiting, training and retaining highly dedicated employees. We invest in ongoing talent development and focus on rewarding performance based on profitability goals instead of pursuing revenue growth at the expense of profit margins. We reposition talent across our branch network to manage and improve branch performance.
Our technology infrastructure and “One Company” platform allows us to manage our information technology efficiently. We have established a broad, integrated business platform
6
Table of Contents
that allows our branch network to leverage a centralized ERP system and other back office support functions to minimize costs, while retaining important and timely decision making authority at the local level where we conduct business with our customers and can tailor our service and product offerings to their needs. This autonomy at the local level has fostered our entrepreneurial culture, while our national infrastructure support allows employees to focus on customer-first solutions. In 2016 we completed an initiative that consolidated our entire company onto one ERP platform other than with respect to the acquisitions of Winroc-SPI, United Drywall Supply, Inc., or United Drywall, and Dominion Interior Supply.
Local market excellence
We are a national company focused on supplying the local building material needs of each geographical area we cover according to climate, building codes, customer preference and other considerations. We believe that we are able to maintain our local market excellence due to our longstanding customer and supplier relationships in local regions, dependable customer service, brand recognition and market-specific product offerings that cater to local trends and preferences. We actively track local and regional construction opportunities for our customers to help drive business for both them and ourselves, and our senior executives complement the local sales efforts by maintaining key relationships with major national and regional accounts. We seek to cultivate an entrepreneurial culture and empower branch managers with the independence and authority to make important business decisions locally under the FBM brand. We believe that this attracts highly dedicated employees who endeavor to provide our customers with dependable customer service that differentiates us from our competition. Our goal is to be the distributor of choice for our customers in all of the local markets we serve.
Strong customer relationships
We sell to a diverse and highly fragmented base of over 30,000 customers, including commercial, residential and other specialty contractors. In addition to local contractors, we maintain strong regional relationships with regional non-residential construction companies and leading national homebuilders. Most customer accounts are serviced by managers and salespeople who communicate regularly with these accounts and have developed meaningful relationships built over many years. We have deeply entrenched customer relationships lasting over 19 years on average with our top 20 customers based on pro forma net sales for the nine months ended September 30, 2016, including companies we have acquired. We believe customer loyalty has been built through our high-quality customer service and technical support, strong logistics capabilities, exclusive relationships to key suppliers in critical markets and product expertise across our comprehensive selection of premier products and brands. We are able to safely and efficiently deliver products to our customers at the right time and in the specified place. Based on our customer surveys, contractors often prioritize on-time delivery over price as they consider the negative repercussions that project delays create, particularly increased labor costs. We have an integrated delivery, dispatch and order tracking system that allows us to optimize routes and dispatch efficiencies. Optimization of delivery and dispatch results in lower costs for both delivery and also for fleet management. Additionally, for many of our products, we facilitate purchasing relationships between suppliers and our highly fragmented customer base by providing technical product knowledge, educating contractors on proper installation techniques for new products, enabling local product availability and extending trade credit.
7
Table of Contents
Longstanding relationships with leading suppliers
We maintain longstanding relationships with a base of over 4,000 suppliers that we provide with a direct channel to a large, diverse customer base and a national footprint. We are one of the largest customers for several of our top suppliers across wallboard, suspended ceiling systems and metal framing product categories. We believe that suppliers find our scale, rapid growth, nationwide footprint, leading market positions, knowledgeable professionals, quality customer service and strong relationships with a broad set of contractors attractive. All key supplier relationships are handled by our executive management team to foster long-term growth and maximize national pricing programs.
We have access to leading brands and maintain exclusive distribution relationships to sell key products, such as suspended ceiling systems, in selected markets. Interior contractors often purchase wallboard and suspended ceiling systems from the same distributor, and carrying our ceilings product line helps to drive sales of wallboard and other complementary products. We believe that our suppliers view us as a key facilitator to market and grow their businesses. We regularly discuss both our acquisition and greenfield expansion activities with our key suppliers, who may proactively recommend expansion opportunities to us.
Demonstrated ability to identify, execute and integrate acquisitions
Our management team has built the Company from a single branch in 2011 into one of the leading wallboard, suspended ceiling systems and mechanical insulation building products distributors in the United States and Canada. Since 2013, we have completed 19 acquisitions and believe that the large, highly fragmented nature of our market and our reputation throughout the industry provides us access to a robust acquisition pipeline at attractive valuations that will continue to supplement our strong organic growth. Our acquisitions generally have been initiated through our senior management team’s business relationships developed over their many years in the industry, and we believe we have become a buyer of choice for owners of specialty distribution companies because we offer them the opportunity to gain liquidity while remaining involved in the active management of their business going forward. We generally avoid auction processes and we believe we are often the only buyer involved in advanced discussions with these companies. This has led to a substantial pipeline of potential acquisition candidates that management is continuously cultivating.
We have dedicated integration leaders who work closely with acquired branch personnel to unify acquisitions under a single brand with a common ERP system. We consolidate our acquired companies’ purchasing into our supplier purchasing programs, which generally have had more advantageous terms due to our greater scale. Our objective is to integrate each acquired company into our back office accounting, human resources and IT systems within 90 days of closing. Post-acquisition, we transition acquired companies exclusively to the FBM brand, and we have typically achieved additional remaining cost savings from the elimination of redundant overhead costs and branch consolidations. Our acquisitions have historically realized purchasing synergies almost immediately by taking advantage of our volume discounts.
Since 2013, many of the owners and senior management of companies that we have acquired have elected to remain employed with us post-acquisition and most have chosen to invest in our parent company, which has proven to be successful in aligning incentives and ensuring smooth transitions. Currently, over 100 former owners, managers and employees of acquired businesses have an equity interest in our parent company and they remain engaged in the successful operation of our business.
8
Table of Contents
Experienced management team with strong track record of growth
Our management team, including our senior management and vice presidents, collectively have an average of 25 years of industry experience. Our founder, President and Chief Executive Officer Ruben Mendoza, is an accomplished leader with over 25 years of industry experience. Our Chief Financial Officer John Gorey brings over 30 years of industry experience, our Chief Operating Officer Pete Welly brings over 37 years of industry experience to the oversight of our operations and our Senior Vice President of Sales & Marketing Kirby Thompson has been working in the industry for over 35 years. By fostering an entrepreneurial and customer-centric culture and a proven ability to quickly and effectively integrate acquisitions under a common brand, this team has built the Company from a single branch into one of the leading specialty building products distributors in the United States and Canada.
Our Business Strategy
Our objective is to strengthen our competitive position, achieve profitable growth that exceeds market rates and increase shareholder value through the following key strategies:
Continue to drive organic growth through strategic initiatives. We believe there are significant opportunities to continue to expand our existing geographic footprint by opening new branches, expand our product offerings to existing customers, target new customers and expand our mechanical insulation platform.
| • | Expand product offerings across all branches. Our management team has identified opportunities in several of our regions for product line growth and expansion. We offer a number of products that are complementary to our wallboard sales including tools, fasteners and wallboard accessories, building insulation, exterior insulation finishing systems, stucco, plaster and fiberglass reinforced panels. These products typically generate higher profit margins than our core product offerings and we believe there is significant opportunity for additional expansion of our complementary product sales. We monitor sales of our complementary products and look for opportunities to introduce new products across our entire network that have been successful in a subset of our branches. We believe that through such efforts, for the nine months ended September 30, 2016, complementary product sales were up 28% year-over-year. |
| • | Target new customers and increasing share with existing customers. We believe our scale and supplier relationships allow us to more efficiently offer a full suite of products than many of our competitors. We believe these advantages help us to win new customers, and we have a proven track record of growing customer relationships and expanding wallboard market share. We plan to continue this growth by leveraging our experienced and driven salesforce of more than 325 field sales personnel who develop new customer relationships at the local level. We also believe our product breadth, extensive operating experience, technical knowledge and specialized delivery fleet will allow us to continue to capture new customers and expand our sales to those customers over time. In March of 2017, we plan to release a mobile application that will allow our customers to easily access critical information, such as order and delivery status. |
| • | Grow by selectively opening new branches. We believe that significant opportunities exist to continue to expand our geographic footprint by opening new branches that are adjacent to our existing operations. A greenfield has historically taken approximately $0.5 million in capital expenditures and working capital to open, and typically generates |
9
Table of Contents
| positive cash flow within one year. Key steps in the greenfield process include identifying growth markets where current customers or suppliers have identified a market need that we can support, conducting a market assessment, determining branch staffing and salesforce and developing a comprehensive forecast to determine if the location can meet profitability targets. In 2017 we plan to open three to five new branches. |
| • | Expand the mechanical insulation platform. Through the Winroc-SPI Acquisition, we gained exposure to the mechanical insulation market in the United States. This mechanical insulation distribution market has experienced several macroeconomic trends in recent years that are favorable to our business, including stable distribution channels, distributor consolidation and more stringent codes and regulations demanding more efficient processes and energy performance. Additionally, because mechanical insulation also targets the industrial end market, we believe this business can offer greater diversification and cyclical stability to our existing platform. |
In the mechanical insulation business segment, we are actively pursuing growth opportunities to further expand our operational footprint and drive financial results. Opportunities such as product line expansion, acquisition and new branches will allow us to expand our volumes and market share, enhancing the growth expected from the broader market expansion.
Continue to expand and strengthen existing relationships with key suppliers. We believe our established relationships with market-leading suppliers serve as a key competitive advantage and support continued volume growth and purchasing power. Our suppliers benefit from our position as a single point of contact to over 30,000 customers and our ability as a partner to market and introduce new products efficiently and on a national scale. We maintain a number of exclusive and semi-exclusive distribution rights in key regions. By expanding these relationships with suppliers, whether by adding more exclusive products or expanding exclusivity into new regions, we believe we will be able to further accelerate our growth. Additionally, our suppliers are critical partners in our growth and we regularly discuss greenfield candidates with them, with suppliers sometimes proactively identifying expansion opportunities.
Enhance financial performance through improved operational efficiencies. We believe we have the potential for continued operating margin improvement through operational initiatives including optimizing pricing, improving fleet utilization, maximizing working capital efficiency from inventory and accounts receivable management, and strategic procurement processes. In addition, as our end markets continue to grow, we expect to generate higher operating margins on incremental volume as we leverage our fixed costs base across our existing branch footprint.
We strive to continuously improve our operational efficiency, and are currently pursuing a number of initiatives to drive operating margin expansion, including:
| • | improve warehouse efficiencies in certain branches and reorganize these facilities; |
| • | deploy a GPS truck tracking system across our company to reduce fleet costs, track on time deliveries and improve route planning; and |
| • | leverage our increased investment in electronic data interchange to improve efficiency for both the purchasing and accounts payable teams. |
To further drive operational efficiencies, we unify all of our completed acquisitions under a single brand with a common ERP system. Our information technology systems are scalable and
10
Table of Contents
coordinated, which gives us operational efficiencies through the sharing of best practices and information across a common platform. We believe our information technology infrastructure allows for effective, data-driven management and is built to empower local decision-making and enhance visibility across our branch network.
We incentivize our branch managers and customer-facing branch level employees on a quarterly basis based on branch level operating income rather than doing so annually based on sales, which we believe leads to improved branch level performance.
Continue to be a leading industry consolidator. Since 2013, our management team has identified and closed 19 acquisitions. We have successfully integrated 16 of these acquisitions, and are currently working to complete the integration of Winroc-SPI, United Drywall and Dominion Interior Supply. We believe our national footprint, market leadership, entrepreneurial culture and ability to retain key leadership makes us an attractive buyer. We generally pursue selective acquisitions that both expand our footprint and generate synergies. We have a dedicated team of professionals to manage the acquisition and integration process. Due to the large and highly fragmented nature of our market and our reputation throughout the industry, we believe that we have access to a robust acquisition pipeline at attractive valuations that will continue to supplement our organic growth. We will consider expansion into complementary specialty distribution markets through selective acquisitions.
Focus on culture and continuous improvement. We believe that our employees are one of the key drivers of our success, and we intend to continue to recruit, train, promote and retain entrepreneurial and successful people. We believe that we have created a culture where our people feel valued and supported and see that their efforts are instrumental to our continued success. We are focused on providing our employees with regular training and development to improve customer service, workplace safety and job satisfaction. For example, in January 2016 we launched “FBM University” to provide our employees with extensive training and development programs, utilizing new learning management systems and in-person training programs, which we view as essential for new hires and the development of existing employees. We also invest substantially in leadership training and team building through our annual “Key Leaders Summit” meeting. By improving our employees’ knowledge base and sharing best practices, we are able to empower our people at the branch level to better serve local customers.
Our commitment to safety is one of our core foundation values. This effort begins immediately with new employees through a comprehensive onboarding orientation that focuses on safety awareness, risk identification and other essential safety protocols. Training is delivered through a variety of media, including online modules and classroom settings, so that managers can employ the method that bests fits the employee’s needs.
Recent Developments
Preliminary Estimated Unaudited Financial Results for the Three Months and Fiscal Year Ended December 31, 2016
The information set forth below represents our preliminary estimated unaudited financial results for the periods presented and is subject to revision based upon the completion of our year-end financial closing process as well as the related external audit of our results of operations for the fiscal year ended December 31, 2016. We have provided ranges, rather than specific amounts, for the financial results, primarily because our financial closing procedures and the external audit for the year ended December 31, 2016 are not yet complete.
11
Table of Contents
For the three months ended December 31, 2016, we expect to report net sales of between $450.0 million and $470.0 million, gross profit of between $122.5 million and $137.5 million, net loss of between $(16.6) million and $(4.3) million and Adjusted EBITDA of between $19.8 million and $29.4 million. For the year ended December 31, 2016, we expect to report net sales of between $1,380.3 million and $1,400.3 million, gross profit of between $387.0 million and $402.0 million, net loss of between $(36.2) million and $(23.9) million and Adjusted EBITDA of between $74.9 million and $84.5 million.
In our specialty building products segment, we estimate that we will generate, for the three months ended December 31, 2016, net sales of between $395.0 million and $405.0 million and gross profit of between $110.0 million and $120.0 million and, for the year ended December 31, 2016, net sales of between $1,288.0 million and $1,298.0 million and gross profit of between $366.7 million and $376.7 million.
In our mechanical insulation segment, we estimate that we will generate, for the three months ended December 31, 2016, net sales of between $55.0 million and $65.0 million and gross profit of between $12.5 million and $17.5 million and, for the year ended December 31, 2016, net sales of between $92.3 million and $102.3 million and gross profit of between $20.3 million and $25.3 million.
Sales for the three and twelve months ended December 31, 2016 were driven primarily by higher volumes in our specialty building products segment as a result of overall market growth in commercial and residential construction markets, offset by decreased demand in our mechanical insulation segment as a result of lower demand from industrial customers. Net income and Adjusted EBITDA for the three and twelve months ended December 31, 2016 were negatively impacted by the timing of recognition of vendor rebates, mechanical insulation product mix, higher warehousing and delivery costs, payroll costs associated with supporting our operations, costs associated with becoming a public company and interest expense due to higher debt levels as a result of our acquisitions.
Results for the three months ended December 31, 2016 include $2.2 million of acquisition-related expenses and $2.6 million of public company readiness costs. As we continue to integrate recently acquired entities into our operations, we expect to realize synergies through costs savings relating to the planned closure of the Winroc-SPI headquarters, continued strategic consolidation of branches and completion of the Winroc system implementation project. We estimate that these efforts would have resulted in expected cost savings of approximately $2.8 million for the three months ended December 31, 2016.
At December 31, 2016, we expect to report a cash and cash equivalents balance of between $25.7 million and $31.5 million and total net debt, which consists of the ABL Credit Facility, Notes and capital leases, of between $743.5 million and $755.5 million.
Adjusted EBITDA is a non-GAAP measure. Set forth below is a reconciliation of Adjusted EBITDA to net loss, the most directly comparable GAAP measure, for the ranges and periods presented. See the section entitled “Management’s Discussion and Analysis of Financial Condition and Results of Operations—Non-GAAP Financial Information” for a discussion of how we define and calculate Adjusted EBITDA and a discussion of why we believe this measure is important.
12
Table of Contents
The following is a reconciliation of our estimated net loss to our Adjusted EBITDA for the three months ended December 31, 2016 and year ended December 31, 2016 (in millions).
| Three Months Ended December 31, 2016 |
Year Ended December 31, 2016 |
|||||||||||||||
| Low | High | Low | High | |||||||||||||
| (estimated) | (estimated) | |||||||||||||||
| Net loss |
$ | (16.6 | ) | $ | (4.3 | ) | $ | (36.2 | ) | $ | (23.9 | ) | ||||
| Interest expense, net |
15.4 | 15.2 | 52.6 | 52.4 | ||||||||||||
| Income tax benefit |
(9.0 | ) | (7.0 | ) | (14.3 | ) | (12.3 | ) | ||||||||
| Depreciation and amortization expense |
19.0 | 17.5 | 52.6 | 51.1 | ||||||||||||
|
|
|
|
|
|||||||||||||
| EBITDA |
8.8 | 21.4 | 54.7 | 67.3 | ||||||||||||
|
|
|
|
|
|||||||||||||
| Non-cash purchase accounting effects(a) |
0.2 | 0.0 | 6.6 | 6.4 | ||||||||||||
| Loss on disposal of property and equipment(b) |
2.0 | 1.2 | 2.2 | 1.4 | ||||||||||||
| Management fees(c) |
0.8 | 0.8 | 3.5 | 3.5 | ||||||||||||
| Unrealized non-cash loss on derivative financial instruments(d) |
8.0 | 6.0 | 7.9 | 5.9 | ||||||||||||
|
|
|
|
|
|||||||||||||
| Adjusted EBITDA |
$ | 19.8 | $ | 29.4 | $ | 74.9 | $ | 84.5 | ||||||||
|
|
|
|
|
|||||||||||||
| (a) | Adjusts for the effect of the purchase accounting step-up in the value of inventory to fair value recognized in cost of goods sold as a result of a recent acquisition. |
| (b) | Represents non-cash losses on the sale of property and equipment. |
| (c) | Represents fees paid to the Sponsor and former private equity sponsors for services provided to us pursuant to past and present management agreements. These fees will no longer be incurred subsequent to the initial public offering. |
| (d) | Represents non-cash expense related to unrealized losses on derivative financial instruments. |
The estimated preliminary financial information set forth above has been prepared by, and is the responsibility of, our management. Deloitte & Touche LLP has not audited, reviewed or performed any procedures with respect to such preliminary financial information. Accordingly, Deloitte & Touche LLP does not express an opinion or any other form of assurance with respect thereto. These estimates are not a comprehensive statement of our financial results as of and for the three months and the fiscal year ended December 31, 2016, and should not be viewed as a substitute for full financial statements prepared in accordance with GAAP. In addition, these preliminary estimates as of and for the three months and the fiscal year ended December 31, 2016 are not necessarily indicative of the results to be achieved in any future period.
The estimated preliminary financial information and cost savings estimates described above and in “—Recent Acquisitions” below constitute forward-looking statements. Our estimates of results are based solely on information available to us as of the date of this prospectus and are inherently uncertain. While we believe that such information and estimates are based on reasonable assumptions and management’s reasonable judgment, our actual results may vary, and such variations may be material. Factors that could cause the actual results to differ include the discovery of new information that affects accounting estimates, management judgment, or impacts valuation methodologies underlying these estimated results; the completion of our audit for the fiscal year ended December 31, 2016; our inability to realize cost savings on the timeline or in the amount we currently anticipate; and a variety of business, economic and competitive risks and uncertainties, many of which are not within our control, and we undertake no obligation to update this information. Accordingly, you should not
13
Table of Contents
place undue reliance on this estimated preliminary data. Our actual consolidated financial statements and related notes as of and for the year ended December 31, 2016 are not expected to be filed with the SEC until after this offering is completed. See “Management’s Discussion and Analysis of Financial Condition and Results of Operations,” “Risk Factors” and “Forward-Looking Statements” below.
Recent Acquisitions
On November 30, 2016, we acquired United Drywall for a purchase price of $29.0 million subject to normal working capital adjustments. United Drywall is a supplier of building materials to commercial and residential developers in the Atlanta, Georgia metropolitan area.
The table below summarizes unaudited total net sales, net loss and EBITDA of United Drywall for the portion of the three months ended December 31, 2016 occurring prior to the acquisition:
| Pre-Acquisition Results Three Months Ended December 31, 2016 (In Thousands) Unaudited |
||||
| Net sales |
$ | 7,435 | ||
|
|
|
|||
| Net loss |
$ | (636 | ) | |
| Interest, net |
10 | |||
| Depreciation and amortization |
66 | |||
|
|
|
|||
| EBITDA |
$ | (560 | ) | |
|
|
|
|||
We expect to realize synergies in connection with the United Drywall acquisition through cost savings related to the elimination of redundant overhead costs and the application of volume discounts under our supplier programs. We estimate that these efforts would have resulted in cost savings of $1.4 million for the portion of the three months ended December 31, 2016 occurring prior to the acquisition.
The pre-acquisition unaudited financial data above has been prepared by management in place at United Drywall prior to its acquisition. The information presented does not include the effect of the purchase price allocation and as such is not reflective of the post-acquisition results to be recorded by us. Our independent registered public accounting firm, Deloitte & Touche LLP, has not audited, reviewed or performed any procedures with respect to the unaudited financial data for United Drywall. Pre-acquisition results are derived from unaudited historical financial information provided to us in connection with our due diligence review and has not been independently audited or reviewed. Any audit or review of this financial data may require adjustments to be made, and such adjustments could be material. We cannot assure you that the financial data presented above would not be materially different if independently audited or reviewed. See “Risk Factors—Risks Relating to Our Business and Industry.”
On January 1, 2017, we acquired Dominion Interior Supply Corporation and Dominion Interior Supply of Roanoke LLC for a purchase price of $13.1 million subject to normal working capital adjustments. Dominion Interior Supply is a supplier of building materials to commercial and residential developers in the Virginia and North Carolina areas.
14
Table of Contents
Our Corporate Structure
The following chart summarizes our organizational structure and equity ownership immediately following the consummation of the offering. This chart is provided for illustrative purposes only and does not show all of our legal entities.
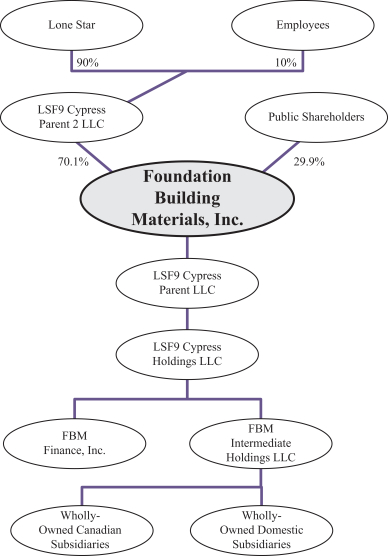
Reorganization
Foundation Building Materials, Inc., the registrant whose name appears on the cover page of this prospectus, does not currently have any operations and was formed in October 2016 for the purpose of an internal reorganization transaction. Prior to or concurrent with the consummation of this offering, Cypress Parent will transfer Cypress and, indirectly, FBM to Foundation Building Materials, Inc., thereby transferring the operations of the Company, the business which is described in this prospectus and the business for which historical and pro forma financial information is
15
Table of Contents
included elsewhere in this prospectus, to be indirectly held by Foundation Building Materials, Inc. Following this internal reorganization, or the Reorganization, Foundation Building Materials, Inc. will be a wholly owned subsidiary of Cypress Parent. Each of Cypress Parent, Cypress Holdings, Cypress and Foundation Building Materials, Inc. are affiliates of Lone Star Fund IX (U.S.), L.P. Shares of common stock of Foundation Building Materials, Inc. are being offered by the prospectus.
Tax Receivable Agreement
We will enter into a Tax Receivable Agreement that will provide for the payment by us to Lone Star of 90% of the amount of cash savings, if any, in U.S. federal, state, local and non-U.S. income tax that we realize (or in some circumstances are deemed to realize) as a result of the utilization of our and our subsidiaries’ (i) depreciation and amortization deductions, and any offset to taxable income and gain or increase to taxable loss, resulting from the tax basis we have in our assets at the consummation of this offering, (ii) net operating losses, (iii) tax credits and (iv) certain other tax attributes. We currently estimate that such payments will aggregate to between $190 and $220 million and we expect all payments to be made within 15 years of this offering. Because we will be a holding company with no operations of our own, our ability to make payments will depend on the ability of our subsidiaries to make distributions to us in an amount sufficient to cover our obligations under the Tax Receivable Agreement. See the sections entitled “Risk Factors” and “Certain Relationships and Related Party Transactions—Tax Receivable Agreement.”
Our Sponsor
Lone Star is part of a leading private equity firm that, since the establishment of its first fund in 1995, has organized 17 private equity funds with aggregate capital commitments totaling over $70.0 billion. The funds are structured as closed-end, private-equity limited partnerships, the limited partners of which include corporate and public pension funds, sovereign wealth funds, university endowments, foundations, funds of funds and high net worth individuals. Immediately prior to this offering, Lone Star beneficially owned all of our outstanding common stock, and will beneficially own approximately 70.1% of our common stock immediately following consummation of this offering (or 65.6% if the underwriters exercise in full their option to purchase additional shares). Therefore, we expect to be a “controlled company” under the corporate governance standards of the New York Stock Exchange, or the NYSE, and will take advantage of the related corporate governance exceptions for controlled companies. See the section entitled “Management—Controlled Company Exemption.”
Risks Affecting Our Business
Our business is subject to numerous risks and uncertainties, including, but not limited to, those arising from:
| • | changes in the construction industry or our end markets; |
| • | our ability to realize the anticipated financial and strategic goals of future acquisitions or investments, including the identification of acquisition targets and the integration of acquired businesses, including integration of financial systems; |
| • | our ability to achieve the intended benefits of our recent and pending acquisitions; |
| • | the loss of, significant decline in business with or changes with respect to our suppliers; |
16
Table of Contents
| • | our ability to effectively manage any changes in general economic, political and social conditions; |
| • | the consequences of any continued financial uncertainty following the recent worldwide recession and the impact on the markets we serve; |
| • | our ability to manage our growth effectively; |
| • | our ability to generate a sufficient amount of cash to service our indebtedness and fund our operations; |
| • | our ability to operate our business under agreements governing certain of our indebtedness containing financial covenants and other restrictions; and |
| • | our relationship with Lone Star and its significant ownership of our common stock. |
You should carefully consider all of the information set forth in this prospectus and, in particular, the information in the section entitled “Risk Factors” beginning on page 24 of this prospectus prior to making an investment in our common stock. These risks could, among other things, prevent us from successfully executing our strategies and could have a material adverse effect on our business, financial condition and results of operations.
Principal Executive Offices
Our principal executive offices are located at 2741 Walnut Avenue, Suite 200, Tustin, CA 92780 and our telephone number is (714) 380-3127. Our website address is www.fbmsales.com. Information contained on our website or linked therein or otherwise connected thereto does not constitute part of nor is it incorporated by reference into this prospectus or the registration statement of which this prospectus forms a part.
Implications of Being an Emerging Growth Company
As a company with less than $1.0 billion in revenue during our most recently completed fiscal year, we qualify as an “emerging growth company” as defined in Section 2(a) of the Securities Act of 1933, as amended, or the Securities Act, as modified by the Jumpstart Our Business Startups Act of 2012, or the JOBS Act. As an emerging growth company, we may take advantage of specified reduced disclosure and other requirements that are otherwise applicable generally to public companies that are not emerging growth companies. These provisions include:
| • | reduced disclosure about our executive compensation arrangements; |
| • | exemption from non-binding shareholder advisory votes on executive compensation or golden parachute arrangements; and |
| • | exemption from the auditor attestation requirement in the assessment of our internal control over financial reporting. |
We may take advantage of these exemptions for up to five years or such earlier time that we are no longer an emerging growth company. We will cease to be an emerging growth company upon the earliest of: (i) the end of the fiscal year following the fifth anniversary of this offering; (ii) the first fiscal year after our annual gross revenues are $1.0 billion or more; (iii) the date on which we have, during the previous three-year period, issued more than $1.0 billion in non-convertible debt securities; or (iv) the end of any fiscal year in which the market value of
17
Table of Contents
our common stock held by non-affiliates exceeded $700.0 million as of the end of the second quarter of that fiscal year. For the nine months ended September 30, 2016, our revenues were $930.3 million. We expect that our annual revenues will exceed $1.0 billion for the year ending December 31, 2016, and that we will no longer qualify as an emerging growth company subsequent to the completion of this offering.
We have taken advantage of reduced disclosure regarding executive compensation arrangements in this prospectus, and we may choose to take advantage of some but not all of these reduced disclosure obligations in future filings while we remain an emerging growth company. If we do, the information that we provide stockholders may be different than you might get from other public companies in which you hold stock.
The JOBS Act permits an emerging growth company such as us to take advantage of an extended transition period to comply with new or revised accounting standards applicable to public companies. We have chosen to “opt out” of this provision and, as a result, we will comply with new or revised accounting standards as required when they are adopted. This decision to opt out of the extended transition period under the JOBS Act is irrevocable.
18
Table of Contents
THE OFFERING
| Common stock offered by us |
12,800,000 shares |
| Common stock offered by the selling stockholder |
1,920,000 shares if the underwriters exercise in full their option to purchase additional shares |
| Common stock to be outstanding immediately after this offering |
42,774,239 shares |
| Use of proceeds |
We estimate our proceeds from this offering will be approximately $207.4 million, after deducting underwriting discounts and commissions and estimated offering expenses payable by us, based on the midpoint of the estimated initial public offering price range set forth on the cover page of this prospectus. We intend to use net proceeds from this offering to repay amounts outstanding under the ABL Credit Facility, which was $190.0 million as of September 30, 2016, and the remainder for working capital and other general corporate purposes. |
| We will not receive any of the proceeds from the sale of shares of common stock by the selling stockholder. See the sections entitled “Use of Proceeds,” “Principal and Selling Stockholders” and “Underwriting.” |
| Dividend policy |
We have no present intention to pay cash dividends on our common stock. Any determination to pay dividends to holders of our common stock will be at the discretion of our board of directors and will depend upon many factors, including our financial condition, results of operations, projections, liquidity, earnings, legal requirements, restrictions in our debt agreements and other factors that our board of directors deems relevant. See the section entitled “Dividend Policy.” |
| Directed share program |
At our request, the underwriters have reserved for sale, at the initial public offering price, up to 3% of the common stock offered by this prospectus for sale to our director, director nominees, officers and certain of our employees and other persons associated with us. The sales will be made by RBC Capital Markets, LLC, an underwriter of this offering, through a Directed Share Program. If these persons purchase common stock it will reduce the number of shares of common stock available for sale to the general public. Any reserved shares of common stock that are not so purchased will be offered by the underwriters to the general public on the same terms as the other shares of common stock offered by this prospectus. |
19
Table of Contents
| Risk factors |
You should carefully read and consider the information set forth in the section entitled “Risk Factors” beginning on page 24, together with all of the other information set forth in this prospectus, before deciding whether to invest in our common stock. |
| Conflicts of Interest |
An affiliate of RBC Capital Markets, LLC is a lender under our senior secured asset based revolving credit facility dated August 9, 2016, or the ABL Credit Facility. As described in the section entitled “Use of Proceeds,” a portion of the net proceeds from this offering will be used to repay borrowings under the ABL Credit Facility. Because more than 5% of the proceeds of this offering will be received by an affiliate of RBC Capital Markets, LLC, a lender under the ABL Credit Facility, this offering is being conducted in compliance with Rule 5121, as administered by the Financial Industry Regulatory Authority, or FINRA. Deutsche Bank Securities Inc. has agreed to act as the qualified independent underwriter with respect to this offering and has performed due diligence investigations and participated in the preparation of this registration statement. See the section entitled “Underwriting — Conflicts of Interest.” |
| NYSE Symbol |
“FBM” |
The number of shares of our common stock to be outstanding immediately after this offering as set forth above is based on the number of shares outstanding as of January 31, 2017 and excludes 3,636,000 shares reserved for issuance under our equity incentive plan (under which no equity awards have been granted as of such date). We intend to grant equity awards representing an aggregate of approximately 332,420 shares of common stock to our executive officers, certain employees and certain director nominees under our equity incentive plan at the time of the pricing of this offering. The awards to be granted to our executive officers and certain employees will be a mix of stock options with an exercise price equal to the offering price and restricted stock units, all of which will vest in four equal installments on the first four anniversaries of the grant date. The awards to be granted to certain of our directors will be restricted stock units which vest in full on the first anniversary of the grant date. In addition, in connection with or following the consummation of this offering, we intend to grant an aggregate of 94,220 shares of common stock to our non-executive officer employees under our equity incentive plan.
Unless otherwise indicated, this prospectus:
| • | assumes the completion of the Reorganization; |
| • | gives effect to a 29,974.239 for one stock split, which will occur prior to the effective date of the registration statement; |
| • | assumes an initial public offering price of $18.00 per share, the midpoint of the estimated initial public offering price range set forth on the cover page of this prospectus; and |
| • | assumes no exercise of the underwriters’ option to purchase up to an additional 1,920,000 shares of our common stock. |
20
Table of Contents
SUMMARY HISTORICAL AND UNAUDITED PRO FORMA CONDENSED COMBINED FINANCIAL AND OTHER INFORMATION
The following tables set forth, for the periods and dates indicated, certain summary historical and unaudited pro forma condensed combined financial information. The accompanying historical financial information of the Company is derived from the audited and unaudited financial statements for the periods presented and included elsewhere in this prospectus. Financial information for the nine months ended September 30, 2016 and for the period from October 9, 2015 to December 31, 2015 relate to the Successor. Financial information for the nine months ended September 30, 2015 and for the period from January 1, 2015 to October 8, 2015 relate to the Predecessor. We have prepared the unaudited condensed consolidated financial information set forth below on the same basis as our audited consolidated financial statements and have included all adjustments consisting of only normal recurring adjustments, that we consider necessary for a fair statement of our financial position and operating results for each period.
The unaudited pro forma condensed combined financial information set forth below presents certain unaudited pro forma condensed combined statements of operations data for the nine months ended September 30, 2016 and 2015 and for the year ended December 31, 2015, and certain unaudited pro forma condensed combined balance sheet data as of September 30, 2016. The unaudited pro forma condensed combined financial information has been prepared in accordance with Article 11 of Regulation S-X, by aggregating our historical Predecessor and Successor consolidated financial statements and the historical financial statements of Winroc-SPI, Ken API, GSCIL and Great Western, each contained elsewhere in this prospectus, and making pro forma adjustments to such aggregated financial data to give effect to each of the Pro Forma Transactions as discussed in greater detail in the section entitled “Unaudited Pro Forma Condensed Combined Financial Information.”
The results of any interim period are not necessarily indicative of the results that may be expected for a full year. Additionally, our historical results are not necessarily indicative of future results. You should read the information set forth below together with the sections entitled “Selected Historical Consolidated Financial Information,” “Management’s Discussion and Analysis of Financial Condition and Results of Operations,” “Use of Proceeds,” “Capitalization,” “Certain Relationships and Related Party Transactions,” “Description of Certain Indebtedness,” “Unaudited Pro Forma Condensed Combined Financial Information” and our audited consolidated financial statements and unaudited condensed consolidated financial statements and the related notes thereto included elsewhere in this prospectus.
21
Table of Contents
LSF9 CYPRESS HOLDINGS, LLC
Summary Historical and Unaudited Pro Forma Condensed Combined Financial and Other Information
| Successor | Predecessor | Successor | Predecessor | |||||||||||||||||||||||||
| (dollars in thousands) | Pro Forma Nine Months Ended September 30, 2016 |
Pro Forma Nine Months Ended September 30, 2015 |
Pro Forma Year Ended December 31, 2015 |
Nine Months Ended September 30, 2016 |
Nine Months Ended September 30, 2015 |
October 9 to December 31, 2015 |
January 1 to October 8, 2015 |
|||||||||||||||||||||
| Statements of Operations Data: |
||||||||||||||||||||||||||||
| Net sales |
$ | 1,417,357 | $ | 1,326,827 | $ | 1,761,093 | $ | 930,315 | $ | 608,964 | $ | 192,539 | $ | 628,066 | ||||||||||||||
| Cost of goods sold (exclusive of depreciation and amortization) |
1,022,836 | 965,352 | 1,281,866 | 665,767 | 440,539 | 143,333 | 452,909 | |||||||||||||||||||||
|
|
|
|
|
|
|
|
|
|
|
|
|
|
|
|||||||||||||||
| Gross profit |
394,521 | 361,475 | 479,227 | 264,548 | 168,425 | 49,206 | 175,157 | |||||||||||||||||||||
| Operating expenses: |
||||||||||||||||||||||||||||
| Selling, general and administrative expenses |
315,531 | 279,330 | 376,133 | 206,280 | 126,102 | 44,196 | 131,524 | |||||||||||||||||||||
| Depreciation and amortization |
48,898 | 43,208 | 57,554 | 33,605 | 15,125 | 7,170 | 15,615 | |||||||||||||||||||||
| Acquisition related expenses |
— | — | — | 12,478 | 12,542 | 3,464 | 39,691 | |||||||||||||||||||||
|
|
|
|
|
|
|
|
|
|
|
|
|
|
|
|||||||||||||||
| Total operating expenses |
364,429 | 322,538 | 433,687 | 252,363 | 153,769 | 54,830 | 186,830 | |||||||||||||||||||||
|
|
|
|
|
|
|
|
|
|
|
|
|
|
|
|||||||||||||||
| Income (loss) from operations |
30,092 | 38,937 | 45,540 | 12,185 | 14,656 | (5,624 | ) | (11,673 | ) | |||||||||||||||||||
| Interest expense |
(44,181 | ) | (43,496 | ) | (58,086 | ) | (37,202 | ) | (15,717 | ) | (7,044 | ) | (19,090 | ) | ||||||||||||||
| Other income (expense), net |
5,235 | (6,150 | ) | (6,547 | ) | 93 | 14 | 9 | 14 | |||||||||||||||||||
|
|
|
|
|
|
|
|
|
|
|
|
|
|
|
|||||||||||||||
| Loss before income taxes |
(8,854 | ) | (10,709 | ) | (19,093 | ) | (24,924 | ) | (1,047 | ) | (12,659 | ) | (30,749 | ) | ||||||||||||||
| Income tax expense (benefit) |
515 | (3,026 | ) | (5,846 | ) | (5,358 | ) | (1,325 | ) | (4,733 | ) | (1,294 | ) | |||||||||||||||
|
|
|
|
|
|
|
|
|
|
|
|
|
|
|
|||||||||||||||
| Net income (loss) |
$ | (9,369 | ) | $ | (7,683 | ) | $ | (13,247 | ) | $ | (19,566 | ) | $ | 278 | $ | (7,926 | ) | $ | (29,455 | ) | ||||||||
|
|
|
|
|
|
|
|
|
|
|
|
|
|
|
|||||||||||||||
| Pro forma basic and diluted net loss per share |
||||||||||||||||||||||||||||
| Basic |
$ | (0.22 | ) | $ | (0.18 | ) | $ | (0.31 | ) | $ | (0.65 | ) | (0.26 | ) | ||||||||||||||
| Diluted |
$ | (0.22 | ) | $ | (0.18 | ) | $ | (0.31 | ) | $ | (0.65 | ) | (0.26 | ) | ||||||||||||||
| Weighted average number of shares used in calculating net loss per share |
||||||||||||||||||||||||||||
| Basic |
42,774,239 | 42,774,239 | 42,774,239 | 29,974,239 | 29,974,239 | |||||||||||||||||||||||
| Diluted |
42,774,239 | 42,774,239 | 42,774,239 | 29,974,239 | 29,974,239 | |||||||||||||||||||||||
| Non-GAAP Measures: |
||||||||||||||||||||||||||||
| Adjusted EBITDA(1) |
$ | 88,251 | $ | 83,987 | $ | 112,424 | $ | 55,051 | $ | 31,623 | $ | 8,969 | $ | 5,849 | ||||||||||||||
| Adjusted EBITDA as a percentage of net sales |
6.2 | % | 6.3 | % | 6.4 | % | 5.9 | % | 5.2 | % | 4.7 | % | 0.9 | % | ||||||||||||||
| Balance Sheet Data (at period end): |
||||||||||||||||||||||||||||
| Cash and cash equivalents |
$ | 40,628 | $ | 23,393 | $ | 10,662 | ||||||||||||||||||||||
| Total assets |
1,291,558 | 1,274,323 | 763,387 | |||||||||||||||||||||||||
| Long-term obligations(2) |
740,123 | 725,123 | 300,315 | |||||||||||||||||||||||||
| Total equity |
340,622 | 338,198 | 290,751 | |||||||||||||||||||||||||
| Nine Months |
Year Ended |
|||||||
| Selected Operating Data: |
||||||||
| Branches (as of period end) |
219 | 86 | ||||||
| Employees (as of period end) |
3,401 | 1,491 | ||||||
| (1) | Adjusted EBITDA is a non-GAAP measure. See the section entitled “Management’s Discussion and Analysis of Financial Condition and Results of Operations—Non-GAAP Financial Information” for a discussion of how we define and calculate this measure and why we believe this is important. |
22
Table of Contents
The following is a reconciliation of Adjusted EBITDA to Net income (loss):
| Successor | Predecessor | Successor | Predecessor | |||||||||||||||||||||||||
| (in thousands) | Pro Forma Nine Months Ended September 30, 2016 |
Pro Forma Nine Months Ended September 30, 2015 |
Pro Forma Year Ended December 31, 2015 |
Nine Months Ended September 30, 2016 |
Nine Months Ended September 30, 2015 |
October 9 to December 31, 2015 |
January 1 to October 8, 2015 |
|||||||||||||||||||||
| Net income (loss) |
$ | (9,369 | ) | $ | (7,683 | ) | $ | (13,247 | ) | $ | (19,566 | ) | $ | 278 | $ | (7,926 | ) | $ | (29,455 | ) | ||||||||
| Interest expense, net |
44,163 | 43,405 | 58,063 | 37,184 | 15,703 | 7,035 | 19,076 | |||||||||||||||||||||
| Income tax expense (benefit) |
515 | (3,026 | ) | (5,846 | ) | (5,358 | ) | (1,325 | ) | (4,733 | ) | (1,294 | ) | |||||||||||||||
| Depreciation and amortization |
48,898 | 43,208 | 57,554 | 33,605 | 15,125 | 7,170 | 15,615 | |||||||||||||||||||||
|
|
|
|
|
|
|
|
|
|
|
|
|
|
|
|||||||||||||||
| EBITDA |
$ | 84,207 | $ | 75,904 | $ | 96,524 | $ | 45,865 | $ | 29,781 | $ | 1,546 | $ | 3,942 | ||||||||||||||
|
|
|
|
|
|
|
|
|
|
|
|
|
|
|
|||||||||||||||
| Non-cash, purchase accounting effects(a) |
6,372 | 1,606 | 9,059 | 6,372 | 1,606 | 7,453 | 1,606 | |||||||||||||||||||||
| (Gain) loss on disposal of property and equipment(b) |
243 | 216 | 251 | 243 | 216 | (30 | ) | 281 | ||||||||||||||||||||
| Management fees(c) |
2,719 | 20 | 20 | 2,719 | 20 | — | 20 | |||||||||||||||||||||
| Unrealized non-cash loss (gain) on derivative financial instruments(d) |
(5,290 | ) | 6,241 | 6,570 | (148 | ) | — | — | — | |||||||||||||||||||
|
|
|
|
|
|
|
|
|
|
|
|
|
|
|
|||||||||||||||
| Adjusted EBITDA |
$ | 88,251 | $ | 83,987 | $ | 112,424 | $ | 55,051 | $ | 31,623 | $ | 8,969 | $ | 5,849 | ||||||||||||||
|
|
|
|
|
|
|
|
|
|
|
|
|
|
|
|||||||||||||||
| (a) | Adjusts for the effect of the purchase accounting step-up in the value of inventory to fair value recognized in cost of goods sold as a result of recent acquisitions. For the nine months ended September 30, 2016, this adjustment relates primarily to the acquisitions of Winroc-SPI, GSCIL and Ken API. For the nine months ended September 30, 2015, this adjustment primarily relates to the acquisition of Great Western. For the Successor period ended December 31, 2015, the adjustment primarily relates to the Lone Star Acquisition. For the Predecessor period ended October 8, 2015, the adjustment primarily relates to the acquisition of Great Western. |
| (b) | Represents non-cash (gains) losses on the sale of property and equipment. |
| (c) | Represents fees paid to the Sponsor and former private equity sponsors for services provided to us pursuant to past and present management agreements. These fees will no longer be incurred subsequent to the initial public offering. |
| (d) | Represents non-cash expense related to unrealized gains or losses on Winroc-SPI derivative financial instruments. |
| (2) | Long-term obligations includes the Long-term portion of notes payable, net and inclusive of long-term capital lease obligations. For September 30, 2016, long-term obligations also includes the ABL Credit Facility of $190.0 million. For pro forma September 30, 2016 long-term obligations also includes the Tax Receivable Agreement. |
23
Table of Contents
Investing in our common stock involves a high degree of risk. You should carefully consider the risks and uncertainties described below, together with all of the other information in this prospectus, including the combined financial statements and the related notes appearing elsewhere in this prospectus, before making an investment decision. If any of the following risks actually occurs, our business, financial condition and results of operations could be materially and adversely affected and the trading price of our common stock could decline, causing you to lose all or part of your investment in our common stock.
Risks Relating to Our Business and Industry
Our business depends on the construction industry and general business, financial market and economic conditions.
The construction industry is cyclical and significantly affected by changes in general and local economic and real estate conditions, such as employment levels, consumer confidence, demographic trends, housing demand, inflation, deflation, interest rates and credit availability. Changes in these general and local economic conditions or deterioration in the broader economy could negatively impact the level of purchases, capital expenditures and creditworthiness of the Company’s direct and indirect customers and suppliers, and, therefore, the Company’s margins, earnings, orders and financial condition, results of operations and cash flows. Changes in these economic conditions may affect some of our regions or markets more than others. If adverse conditions affect our larger markets, such as California, Arizona, Texas and Florida, they could have a proportionately greater impact on us than on some other companies. In addition, current uncertainty regarding global economic conditions may have an adverse effect on the businesses, results of operations and financial condition of the Company and its customers, distributors and suppliers.
Our sales depend upon the commercial new construction market, the commercial repair and remodel market and the industrial construction and maintenance markets.
The recent downturn from 2008 to 2011 in the U.S. commercial new construction market was one of the most severe of the last 40 years. Previously, downturns in the construction industry have typically lasted about two to three years, but the downturn from 2008 to 2011 was much more severe, with a market decline of approximately 49% during those three years. According to Dodge Data & Analytics, square-footage for new commercial construction starts has increased by approximately 37% since 2011 but remains approximately 42% below the peak level of 1.67 billion achieved in 2007. We cannot predict the duration of the current market conditions or the timing or strength of any future recovery of commercial construction activity in our markets. Weakness in the commercial construction market and the commercial repair and remodel market would have a material adverse effect on our business, financial condition and operating results. Continued uncertainty about current economic conditions will continue to pose a risk to our businesses that serve the non-residential markets. If participants in these industries postpone spending in response to tighter credit, negative financial news and declines in income or asset values or other factors, this could have a material negative effect on the demand for our products and services and on our business, financial condition and results of operations.
Homebuilding activity and the mortgage markets affect the demand for products we distribute, which in turn affects our business condition.
The distribution of our products, particularly wallboard, to contractors serving the residential market represents a significant portion of our business. Wallboard demand is highly
24
Table of Contents
correlated with housing starts. Housing starts and repair and remodel activity, in turn, are dependent upon a number of factors, including housing demand, housing inventory levels, housing affordability, foreclosure rates, geographical shifts in the population and other changes in demographics, the availability of land, local zoning and permitting processes, the availability of construction financing and the health of the economy and mortgage markets. Unfavorable changes in any of these factors beyond our control could adversely affect consumer spending, result in decreased demand for homes and adversely affect our business.
Beginning in mid-2008 and continuing through late-2011, the U.S. homebuilding industry experienced a significant downturn. This decrease in homebuilding activity led to a steep decline in wallboard demand which, in turn, had a significant adverse effect on our industry. Since that time U.S. housing starts have recovered and, according to the U.S. Census Bureau, reached 1.1 million in 2015. Despite the growth over this period, U.S. housing start activity remains significantly below their long-term historical averages. According to the Canada Mortgage and Housing Corporation, Canadian housing starts have remained relatively flat from 2011 until 2015, with only minimal deviations in such five-year period. In addition, some analysts project that the demand for residential construction may be negatively impacted as the number of renting households has increased in recent years and a shortage in the supply of affordable housing is expected to result in lower home ownership rates. The timing and extent of the continued recovery, if any, in homebuilding and the resulting impact on demand for our products are uncertain. Further, even if homebuilding activity fully recovers, the impact of such recovery on our business may be suppressed if, for example, the average selling price or average size of new single-family homes decreases, which could cause homebuilders to decrease spending on our services and the products we distribute.
Beginning in 2007, the mortgage markets were also substantially disrupted as a result of increased defaults, primarily due to weakened credit quality of homeowners. In reaction to the disruption in the mortgage markets, stricter regulations and financial requirements were adopted and the availability of mortgages for potential homebuyers was significantly reduced as a result of a limited credit market and stricter standards to qualify for mortgages. Mortgage financing and commercial credit for smaller homebuilders, as well as for the development of new residential lots, continue to be constrained. If the residential construction industry continues to experience weakness and a reduction in activity, our business, financial condition and operating results could be significantly and adversely affected.
Our business relies on private investment and a slower than expected economy may adversely affect our results.
A significant portion of our sales are for projects with non-public owners, such as non-residential builders and home builders who make investments with private funds into their projects. Construction spending is affected by our customers’ ability to finance projects. Residential and nonresidential construction and industrial construction projects and maintenance could decline if companies and consumers are unable to finance construction projects or if the economy slows or is stalled, which could result in delays or cancellations of capital projects. If the economy or housing starts and nonresidential projects do not increase, sale of our products and related services may decline and our financial position, results of operations and liquidity could be materially adversely affected.
Within our local markets, we operate in a highly competitive industry and any failure to effectively compete could have a material adverse effect on us.
The U.S. and Canadian construction industries are highly fragmented with a large number of independent specialty building products distributors in a number of our markets.
25
Table of Contents
Additionally, in most markets, we compete against diversified distribution companies, which may be larger and have broader product lines. Competition with competitors that have greater financial resources and are better capitalized than us could lead to lower prices, lower sales volumes and higher costs in some markets, negatively affecting our financial position, results of operations and liquidity.
We also compete based on service, quality and range of products. Our competitors may be positioned to provide better service and thereby establish stronger relationships with customers and suppliers. Our competitors may also sell preferred products, develop a more comprehensive product portfolio or have more competitive prices. In addition, certain product manufacturers that sell and distribute their products directly to homebuilders may increase the volume of such direct sales.
There is intense competition in a number of markets in which we operate. If we are unable to compete effectively with our existing competitors or new competitors who enter the markets in which we operate, our financial position, results of operations and liquidity may be adversely affected.
The trend toward consolidation in our industry may negatively impact our business.
The trend toward consolidation in our industry could cause markets to become more competitive as greater economies of scale are achieved by distributors that are able to efficiently expand their operations. We believe these factors could result in fewer overall distributors operating multiple locations. There can be no assurance that we will be able to continue to execute our acquisition growth strategy, and any failure to do so may make it more difficult for us to maintain or increase our economies of scales, including the level of rebates we receive from suppliers, and adversely affect our operating margins. Consolidation could also increase the competition for acquisition targets in our industry, resulting in higher acquisition costs and prices.
The success of our business depends, in part, on our ability to execute on our acquisition strategy.
A significant portion of our historical growth has occurred through acquisitions, including our recent acquisition of Winroc-SPI, and our business plan provides for continued growth through acquisitions in the future. We are presently evaluating, and we expect to continue to evaluate on an ongoing basis, a variety of possible acquisition transactions, including both smaller acquisitions and larger acquisitions that would be material. We regularly make, and we expect to continue to make, acquisition proposals, and we may enter into letters of intent for acquisitions. We cannot predict the timing of any contemplated transactions, and there can be no assurances that we will identify suitable acquisition opportunities or, if we do identify such opportunities, that any transaction can be consummated on acceptable terms. Furthermore, a significant change in our business or the economy, an unexpected decrease in our cash flows or any restrictions imposed by our debt may limit our ability to obtain the necessary capital for acquisitions or otherwise impede our ability to complete an acquisition. Our recent growth and our acquisition strategy have placed, and will continue to place, significant demands on our management’s time, which may divert their attention from our business, and may lead to significant due diligence and other expenses regardless of whether we pursue or consummate any acquisition. Failure to identify suitable transaction partners and to consummate transactions on acceptable terms, as well as the commitment of time and resources in connection with such transactions, could have a material adverse effect on our business, financial condition and results of operations.
26
Table of Contents
Our acquisition strategy exposes us to significant risks and additional costs.
Acquisitions also involve risks that the businesses acquired will not perform as expected and that business judgments concerning the value, strengths and weaknesses of acquired businesses will prove incorrect. We may not accurately assess the value, strengths, weaknesses or potential profitability of an acquisition target. We may become liable for certain unforeseen pre-acquisition liabilities of an acquired business, including, among others, tax liabilities, product liabilities, asbestos liabilities, environmental liabilities, pension liabilities and liabilities for employment practices, and these liabilities could be significant. In addition, an acquisition could result in the impairment of customer relationships or certain acquired assets such as inventory and goodwill. We may also incur costs and inefficiencies to the extent an acquisition expands the industries, products, markets or geographies in which we operate due to our limited exposure to and experience in a given industry, market or region. Large or a number of smaller acquisitions may also require that we incur additional debt to finance the transaction, which could be substantial and limit our flexibility in using our cash flow from operations for other purposes. Acquisitions can also involve post-transaction disputes with the counter party regarding a number of matters, including a purchase price, inventory or other working capital adjustment, environmental liabilities or pension obligations. If any of these risks were to occur, our financial position, results of operations and liquidity may be adversely affected.
Any inability to successfully integrate our recent or future acquisitions could have a material adverse effect on us.
Acquisitions may require integration of acquired companies’ sales and marketing, distribution, purchasing, finance and administrative organizations, as well as exposure to different legal and regulatory regimes in jurisdictions in which we have not previously operated. We may not be able to integrate successfully any business we may acquire or have acquired into our existing business, or may not be able to do so in a timely, efficient and cost-effective manner. Our inability to complete the integration of new businesses in a timely and orderly manner could increase costs and lower profits. Factors affecting the successful integration of acquired businesses include, but are not limited to, the following:
| • | diverting the attention of our management and that of the acquired business; |
| • | merging or linking different accounting and financial reporting systems and systems of internal controls; |
| • | merging computer, technology and other information networks and systems; |
| • | assimilating personnel, human resources and other administrative departments and potentially contrasting corporate cultures; |
| • | incurring or guaranteeing additional indebtedness; |
| • | disrupting our relationship with or loss of key customers, suppliers or personnel; |
| • | interfering with, or loss of momentum in, our ongoing business or that of the acquired company; and |
| • | delays or cost-overruns in the integration process. |
We have not fully integrated Winroc-SPI and may encounter one or more of the issues discussed above, or others of which we are not yet aware during the integration process. In particular, we have not yet integrated the enterprise resource planning systems of Winroc-SPI with our systems. Any of these acquisition or other integration-related issues could divert management’s attention and resources from our day-to-day operations, cause significant
27
Table of Contents
disruption to our business and lead to substantial additional costs. Our inability to realize the anticipated benefits of an acquisition or to successfully integrate acquired companies as well as other transaction-related issues could have a material adverse effect on our business, financial condition and results of operations.
In addition, certain proposed acquisitions or dispositions may trigger a review by U.S. Department of Justice, or the DOJ, and the U.S. Federal Trade Commission, or FTC, and the State Attorneys General under their respective regulatory authority, focusing on the effects on competition, including the size or structure of the relevant markets and the pro-competitive benefits of the transaction. Any delay, prohibition or modification required by regulatory authorities could adversely affect the terms of a proposed acquisition or could require us to modify or abandon an otherwise attractive acquisition opportunity.
We cannot assure you that we will achieve synergies and cost savings in connection with acquisitions or that the unaudited financial data related to the Other Acquisitions presented herein would not be materially different if audited or reviewed.
We may not achieve anticipated cost savings described in this prospectus within the anticipated time frame or at all. In addition, many of the businesses that we have acquired and will acquire have unaudited financial statements that have been prepared by the management of such companies and have not been independently reviewed or audited. We present certain unaudited financial information in this prospectus for the Other Acquisitions that is derived from such unaudited financial statements prepared by management of such acquired businesses. We cannot assure you that the financial statements of companies we have acquired or will acquire would not be materially different if such statements were independently reviewed or audited. In addition, our results of operations from these acquisitions could, in the future, result in impairment charges for any of our intangible assets, including goodwill, or other long-lived assets, particularly if economic conditions worsen unexpectedly. These changes could materially negatively affect our results of operations, financial condition or liquidity.
The loss of, or a significant decline in business with, one or more of our suppliers, or the development of alternatives to distributors in the supply chain, could adversely affect our business, financial condition, results of operations and cash flows.
Much of our revenue is reliant upon maintaining our agreements and other relationships with suppliers of building products including wallboard, steel, suspended ceiling systems and commercial and industrial insulation materials. Some of these relationships with key suppliers, including Armstrong and USG with respect to suspended ceiling systems, provide us with exclusive distribution rights in certain areas while others provide us with access to leading brands in many of our key markets. The loss of distribution rights with any of our key suppliers would have a material adverse impact on our revenue and profitability. In addition, many of our suppliers could grant distribution rights in semi-exclusive markets to a competing distributor at any time, which could lead to a loss of market share in these markets, a loss of the share of a customer’s spend related to such products and a reduction in net sales. We cannot assure you that the current level of business with our suppliers can be maintained or that revenue and profit will remain at or near current levels.
In addition, our customers could begin purchasing more of their product needs directly from manufacturers, which would result in decreases in our net sales and earnings. Our suppliers could invest in infrastructure to expand their own sales forces and sell more products directly to our customers, which also would negatively impact our business. These changes in the supply chain could adversely affect our financial condition, operating results and cash flows.
28
Table of Contents
If we fail to qualify for supplier rebates or are unable to maintain or adequately renegotiate our rebate arrangements, our gross margins and income could be materially adversely affected.
Many of our products are purchased pursuant to rebate arrangements that entitle us to receive a rebate based on the volume of our purchases. Such arrangements generally require us to purchase minimum quantities in certain geographies or product categories and result in higher rebates with increased quantities of purchases. These rebates effectively reduce the costs of our products and we manage our business to take advantage of these programs. When assessing the desirability of acquisitions, we consider the effects of such acquisitions on our ability to qualify for rebates. Rebate arrangements are subject to renegotiation with our suppliers from time to time. In addition, consolidation of suppliers may result in the reduction or elimination of rebate programs in which we participate. If we are unable to qualify for these rebates, are unable to renew rebate programs on desirable terms or are unable to obtain the expected rebate benefits of our acquisitions, or a supplier materially reduces or stops offering rebates, our costs could materially increase and our gross margins and income could be materially adversely affected.
A material disruption at one of our suppliers’ facilities could prevent us from meeting customer demand, reduce our sales and negatively affect our overall financial results.
Any of the following events could cease or limit operations unexpectedly: fires, floods, earthquakes, hurricanes, on site or off site environmental incidents or other catastrophes; utility and transportation infrastructure disruptions; labor difficulties; other operational problems; or war, acts of terrorism or other unexpected events. Any downtime or facility damage at our suppliers, including one of the major wallboard or insulation suppliers, could prevent us from meeting customer demand for our products or require us to make more expensive purchases from a competing supplier. If our suppliers were to incur significant downtime, our ability to satisfy customer requirements could be impaired, resulting in customers seeking products from other distributors as well as decreased customer satisfaction and lower sales and operating income. Because we purchase from a limited number of wallboard manufacturing facilities, the effects of any particular shutdown or facility damage could be significant to our operations as a whole and pronounced in the markets near the facility affected.
In addition, our suppliers of synthetic wallboard are subject to the manufacturing facility disruption risks related to their associated coal plants slowing or shutting down. Our suppliers’ inability to produce or procure the necessary raw materials to supply finished goods to us may adversely impact our results of operations, cash flows and financial position.
Weather can materially affect our business and we are subject to seasonality.
Seasonal changes and other weather-related conditions can adversely affect our business and operations through a decline in both the use and production of our products and demand for our services. Adverse weather conditions, such as extended rainy and cold weather in the spring and fall, can reduce demand for our products and reduce sales or render our distribution operations less efficient. Major weather events such as hurricanes, tornadoes, tropical storms and heavy snows with quick rainy melts could adversely affect sales.
Construction materials production and shipment levels follow activity in the construction industry, which typically occurs in the spring, summer and fall. Warmer and drier weather during the second and third quarters typically result in higher activity and revenue levels during those quarters. The first quarter typically has lower levels of activity due to inclement weather conditions. The activity level during the second quarter varies greatly with variations in temperature and precipitation.
29
Table of Contents
Difficult and volatile conditions in the credit markets could affect our financial position, results of operations and liquidity.
In a slow economy, there is also a likelihood that we will not be able to collect on certain of our accounts receivable from our customers. We experienced payment delays and defaults from some of our customers during the recent economic downturn and subsequent slow recovery. Such delays and defaults could have a material adverse effect on our financial position, results of operations or liquidity.
Our mechanical insulation business is different from our historical business, and we may be unable to effectively integrate or operate such segment effectively.
Our mechanical insulation business, which we acquired in August 2016 in connection with Winroc-SPI Acquisition, differs from our historical lines of business. Operating and integrating this line of business may require a significant commitment of our management’s time and resources and we may not have the expertise, experience or resources to successfully or profitably operate it. If we are unable to effectively operate, integrate or grow this line of business, it may not be profitable or as profitable as we had expected and our operations could be adversely affected. In addition, we may not be able to integrate our mechanical insulation business successfully, and our inability to complete the integration of our mechanical insulation business in a timely and orderly manner could increase costs and lower profits.
Our mechanical insulation business involves certain risks which may be different than those risks that previously existed in the Company’s business.
The mechanical insulation market is driven largely by commercial and industrial construction and maintenance and repair spending, as well as economic growth. Demand is influenced by commercial construction and renovation, the construction, maintenance and expansion of industrial process facilities (such as oil refineries, petrochemical plants and power generation facilities) and institutional facilities in the government, healthcare and education sectors. The mechanical insulation business, including the distribution of commercial and industrial insulation products, such as fiberglass, involves additional risks, including risks related to manufacturing or fabricating such products. We have not traditionally been directly involved in the manufacturing or fabrication of products. Additional risks could include warranty claims, manufacturing accidents, product liability claims and production-related injuries to personnel. Such risks could have a material adverse effect upon our financial results.
Most of our facilities are held under long-term, non-cancelable leases and a substantial number of such properties are leased from the former owners of acquired businesses. The interests of such lessors may be in conflict with our interests and we may be unable to renew leases on favorable terms or at all.
Most of our facilities are leased premises, which leases generally are non-cancelable and have initial terms ranging from three to 20 years, with options to renew for specified periods of time. In addition, a substantial portion of such facilities are leased from former owners of businesses we have acquired, and our relationships with such lessors could be adversely affected by unrelated business decisions or conflicts arising from such acquisitions. We cannot assure you that we will be able to renew our current or future leases on favorable terms or at all. In addition, if we close or idle a facility, we generally remain committed to perform our obligations under the applicable lease, which include, among other things, payment of the base rent for the balance of the lease term.
30
Table of Contents
Any significant fuel cost increases or shortages in the supply of fuel could disrupt our ability to transport and distribute our products to customers, which could adversely affect our results of operations.
We currently use our own fleet of owned and leased vehicles to transport and distribute our products to our customers. The cost of fuel for these vehicles is largely unpredictable and has a significant effect on our business and results of operations. Prices and availability of petroleum products are subject to political, economic and market factors that are outside our control. Political events in petroleum-producing regions as well as hurricanes, floods and other weather-related events may cause the price of fuel to increase. A rise in fuel prices could make it unprofitable for us to service certain customers or regions. Significant increases in the cost of fuel or disruptions in the supply of fuel could materially adversely affect our business, revenues and results of operations.
Environmental, health and safety laws and regulations and any changes to, or liabilities arising under, such laws and regulations could have a material adverse effect on our financial condition, results of operations and liquidity.
We are subject to a variety of federal, state, provincial and local laws and regulations relating to, among other things: the release or discharge of materials into the environment; the management, use, generation, treatment, processing, handling, storage, transport or disposal of solid and hazardous wastes and materials; and the protection of public and employee health and safety and the environment. These laws and regulations impose strict liability in some cases without regard to negligence or fault and expose us to liability for the environmental condition of our currently or formerly owned, leased or operated facilities, and may expose us to liability for the conduct of others or for our actions, even if such actions complied with all applicable laws at the time these actions were taken. These laws and regulations may also expose us to liability for claims of personal injury or property or natural resource damage related to alleged exposure to, or releases of, regulated or hazardous materials. The existence of contamination at properties we own, lease or operate could also result in increased operational costs or restrictions on our ability to use those properties as intended, including for purposes of construction materials distribution. In addition, because our properties are generally situated adjacent to or near industrial companies, our properties may be at an increased risk of having environmental contaminants from other properties spill or migrate onto or otherwise affect our properties.
Despite our compliance efforts, there is an inherent risk of liability in the operation of our business, especially from an environmental standpoint, and, from time to time, we may be in noncompliance with environmental, health and safety laws and regulations. These potential liabilities or non-compliances could have an adverse effect on our operations and profitability. In some instances, we must have government approvals, certificates, permits or licenses in order to conduct our business, which may require us to make significant capital, operating and maintenance expenditures to comply with environmental, health and safety laws and regulations. Our failure to obtain and maintain required approvals, certificates, permits or licenses or to comply with applicable governmental requirements could result in sanctions, including substantial fines or possible revocation of our authority to conduct some or all of our operations. Future changes in law, resulting in stricter laws and regulations, more stringent interpretations of existing laws or regulations or the future discovery of environmental conditions may impose new liabilities on us, reduce operating hours, require additional investment by us in pollution control equipment or impede our ability to open new or expand existing plants or facilities. We have incurred, and may in the future incur, significant capital and operating expenditures to comply with such laws and regulations. The cost of complying with
31
Table of Contents
such laws could have a material adverse effect on our financial condition, results of operations and liquidity.
Legal, regulatory or market responses to potential global climate change could have a material adverse effect on our financial condition, results of operation and liquidity.
Concern over the potential for global climate change, has led to significant federal, state, provincial and international legislative, regulatory and treaty initiatives to limit greenhouse gas, or GHG, emissions. For example, in recent years, the U.S. Congress has considered but not passed legislation that would regulate GHG emissions. Nonetheless, some form of federal climate change legislation is possible in the future and, in the absence of such legislation, the U.S. Environmental Protection Agency, has taken action to regulate GHG emissions. Such regulation or other measures to limit GHG emissions could cause us to incur substantial costs, including an increase in the cost of the fuel and other energy we purchase and capital costs associated with updating or replacing our internal fleet of trucks and other vehicles prematurely. Further, new laws or future regulation could directly and indirectly affect our customers and suppliers (through an increase in the cost of production or their ability to produce satisfactory products) and our business (through the impact on our inventory availability, cost of sales, operations or demands for the products we sell). Until the timing, scope and extent of any future regulation becomes known, we cannot predict its effect on our cost structure or our operating results. but it is possible that such legislation or regulation potentially could impose material costs on us.
The exportation and importation of building materials into North America could expose us to additional risk.
Certain building materials that we distribute may come from foreign jurisdictions outside North America. Such materials may be imported because they may not be available for domestic purchase in the United States or Canada or because there may be a shortfall of inventory available locally. Despite our efforts to ensure the merchantability of these products, such products may not adhere to United States and Canadian standards or laws. Importation of such building materials could subject us to greater risk, including lawsuits buy customers or governmental entities. Furthermore, the Canadian government has instituted a review of pricing practices for wallboard produced in the United States and exported to Canada. The result of such review could result in higher prices of wallboard in Canada, which could affect construction projects and could affect our sales in Canada.
We may be adversely affected by uncertainty in the economy and financial markets and disruptions to the transportation network as a result of terrorism.
Instability in the economy and financial markets, including as a result of terrorism, may result in a decrease in construction, which would adversely affect our business. In the aftermath of terrorist attacks in the United States, federal, state and local authorities have implemented and continue to implement various security measures that affect many parts of the transportation network in the United States. Our customers typically need quick delivery and rely on our on-time delivery capabilities. If security measures disrupt or impede the timing of our deliveries, we may fail to meet the needs of our customers or may incur increased expenses to do so. In addition, domestic terrorist attacks may affect our ability to keep our operations and services functioning properly and could have a material adverse effect on our financial condition, operating results and cash flows.
32
Table of Contents
The results of the United Kingdom’s referendum on withdrawal from the European Union may have a negative effect on global economic conditions, financial markets and our business.
In June 2016, a majority of voters in the United Kingdom elected to withdraw from the European Union in a national referendum. The referendum was advisory and the terms of any withdrawal are subject to a negotiation period that could last at least two years after the government of the United Kingdom formally initiates a withdrawal process. Nevertheless, the referendum has created significant uncertainty about the future relationship between the United Kingdom and the European Union, including with respect to the laws and regulations that will apply as the United Kingdom determines which European Union laws to replace or replicate in the event of a withdrawal. The referendum has also given rise to calls for the governments of other European Union member states to consider withdrawal. These developments, or the perception that any of them could occur, have had and may continue to have a material adverse effect on global economic conditions and the stability of global financial markets and may significantly reduce global market liquidity and restrict the ability of key market participants to operate in certain financial markets. Any of these factors could depress economic activity, including activity within our end markets, and restrict our access to capital, which could have a material adverse effect on our ability to raise capital or our business, financial condition and results of operations.
Our business operations could suffer significant losses from natural disasters, catastrophes, fire or other unexpected events.
While we operate our business out of over 200 warehouse facilities and maintain insurance covering our facilities, including business interruption insurance, our facilities could be materially damaged by natural disasters, such as floods, tornadoes, hurricanes and earthquakes, or by fire, adverse weather conditions or other unexpected events or disruptions to our facilities. We could incur uninsured losses and liabilities arising from such events, including damage to our reputation, and/or suffer material losses in operational capacity, which could have a material adverse impact on our business, financial condition and results of operations.
We depend on our senior management, and our business may be adversely impacted if we lose any member of our senior management or are unable to recruit additional management and other personnel.
We are dependent upon the services of our senior management, especially our President and Chief Executive Officer Ruben Mendoza, our Chief Financial Officer John Gorey, our Chief Operating Officer Pete Welly and our Senior Vice President of Sales and Marketing Kirby Thompson. The loss of the services of one or more members of our senior management team could harm our business and future development. Our continued growth also will depend upon our ability to attract and retain additional skilled management personnel. We believe there is a limited number of qualified people in our business and the industry in which we compete. As such, there can be no assurance that we will be able to identify and retain the key personnel that may be necessary to grow our business effectively or successfully implement our growth strategy. If we are unable to attract and retain the requisite personnel as needed in the future, our operating results and growth could suffer.
Employee disputes or employee-related cost increases could disrupt operations of our businesses.
Although we believe our relationships with our employees are good, a failure to maintain good relationships with our employees could have a material adverse effect on the Company. A
33
Table of Contents
work disruption or stoppage at one of our facilities could cause us to lose sales, incur increased costs and adversely affect our ability to meet customers’ needs. Approximately 4% of our workforce are members of unions. However, if a larger number of our employees were to unionize, including in the wake of any future legislation that makes it easier for employees to unionize, our business could be negatively affected. Sometimes we must compete for employees with necessary skills and experience or in tight labor markets which can also increase costs. We have approximately 3,401 employees as of September 30, 2016. Various federal and state labor laws govern our relationships with our employees and affect our operating costs. These laws include employee classifications as exempt or non-exempt, minimum wage requirements, unemployment tax rates, workers’ compensation rates, overtime, family leave, anti-discrimination laws, safety standards, payroll taxes, citizenship requirements and other wage and benefit requirements for employees classified as non-exempt. As our employees may be paid at rates that relate to the applicable minimum wage, further increases in the minimum wage could increase our labor costs. Any such cost increases, work stoppages or disruptions could have a material adverse effect on our business, financial condition, results of operations and cash flows by limiting production, sales volumes and profitability.
In addition, we compete with other companies for many of our employees, and we invest significant resources to train and motivate our employees to maintain a high level of job satisfaction. If we are unable to effectively retain highly qualified employees in the future, it could adversely impact our operating results.
Our business is cyclical and requires significant working capital to fund operations.
Our business is cyclical and requires that we maintain significant working capital to fund our operations. Our ability to generate sufficient cash flow depends on future performance, which will be subject to general economic conditions, industry cycles and financial, business and other factors affecting our operations, many of which are beyond our control. If we are unable to generate sufficient cash to operate our business and service our outstanding debt and other obligations, we may be required, among other things, to further reduce or delay planned capital or operating expenditures, sell assets or take other measures, including the restructuring of all or a portion of our debt, which may only be available, if at all, on unsatisfactory terms.
A failure to implement or integrate, or a disruption in, our information technology systems could adversely affect our business and results of operations.
Integration of our acquisitions has required in the past, and will require in the future, significant attention from our employees and substantial resources. Among other matters, we are faced with migrating acquired companies’ information related to purchasing, sales, inventory management and rebates to our systems, or maintaining multiple systems.
As our operations grow in both size and scope, and as we integrate our acquisitions, we will continuously need to improve and upgrade our systems and infrastructure while maintaining the reliability and integrity of our information systems and infrastructure. In particular, we are currently seeking to upgrade our information technology systems. These and any other upgrades to our systems and information technology, or new technology, now and in the future, will require that our management and resources be diverted from our core business to assist in compliance with those requirements. In addition, we rely upon the capacity, reliability and security of our information technology infrastructure to maintain our existing business.
A disruption resulting from a problem with the implementation, integration or functioning of an important information technology system or a security breach of such a system could have an adverse effect on our business and results of operations.
34
Table of Contents
Our foreign operations could have a material adverse effect on us.
We distribute products in Canada and we are therefore subject to a number of risks specific to this country and may become subject to risks specific to countries where we complete acquisitions. These risks include social, political and economic instability, unexpected changes in regulatory requirements, tariffs and other trade barriers, currency exchange fluctuations, acts of war or terrorism and import/export requirements. Our financial statements are reported in U.S. dollars with international transactions being translated into U.S. dollars. There can be no assurances that any of these factors will not materially impact our production cost or otherwise have a material adverse effect on our business, financial condition and results of operations.
We are exposed to product liability, warranty, casualty, construction defect, contract, tort, employment and other claims and legal proceedings related to our business, the products we distribute, the services we provide and services provided for us by third parties.
In the ordinary course of business, we are subject to various claims and litigation. Any such claims, whether with or without merit, could be time consuming and expensive to defend and could divert management’s attention and resources. The building materials industry has been subject to personal injury and property damage claims arising from alleged exposure to raw materials contained in building products as well as claims for incidents of catastrophic loss, such as building fires. As a distributor of building materials, we face an inherent risk of exposure to product liability claims in the event that the use of the products we or our predecessor companies have distributed in the past or may in the future distribute are alleged to have resulted in economic loss, personal injury or property damage or violated environmental, health or safety or other laws. Product liability claims have included and may in the future include allegations of personal injury related to asbestos-containing products, defects in manufacturing, defects in design, a failure to warn of dangers inherent in the product, negligence, strict liability or a breach of warranties.
We are also from time to time subject to casualty, contract, tort and other claims relating to our business, the products we have distributed in the past or may in the future distribute, and the services we have provided in the past or may in the future provide, either directly or through third parties. If any claim were adversely determined, our financial condition, operating results and cash flows could be adversely affected if we were unable to seek indemnification for such claims or were not adequately insured for such claims. We rely on manufacturers and other suppliers to provide us with the wallboard, suspended ceiling systems, metal framing, commercial and industrial insulation and other products we sell or distribute. Since we do not have direct control over the quality of such products that are manufactured or supplied to us by third parties, we are particularly vulnerable to risks relating to the quality of such products. We are also exposed to risk due to our fabrication of materials in our mechanical insulation business. In addition, we are exposed to potential claims arising from the conduct of our employees, builders and their subcontractors and third-party installers for which we may be liable. We and they are subject to regulatory requirements and risks applicable to general contractors, which include management of licensing, permitting and quality of third-party installers. As they apply to our business, if we fail to manage these processes effectively or provide proper oversight of these services, we could suffer lost sales, fines and lawsuits, as well as damage to our reputation, which could adversely affect our business and the results of our operations.
Although we believe we currently maintain suitable and adequate insurance, there can be no assurance that we will be able to maintain such insurance on acceptable terms or that such insurance will provide adequate protection against potential liabilities and the cost of any
35
Table of Contents
litigation or other proceeding, even if resolved in our favor, could be substantial. Additionally, we do not carry insurance for all categories of risk that our business may encounter and we also self-insure for certain other risks. Any significant uninsured or self-insured liability may require us to pay substantial amounts. There can be no assurance that any current or future claims will not adversely affect our financial position, cash flows or results of operations.
Our operations are subject to special hazards that may cause personal injury or property damage, subjecting us to liabilities and possible losses which may not be covered by insurance.
Operating hazards, such as unloading heavy products, operating large machinery and driving hazards, inherent in our business, some of which may be outside of our control, can cause personal injury and loss of life, damage to or destruction of property, plant and equipment and environmental damage. We maintain insurance coverage in amounts and against the risks we believe are consistent with industry practice, but this insurance may not be adequate or available to cover all losses or liabilities we may incur in our operations. Our insurance policies are subject to varying levels of deductibles. Losses up to our deductible amounts are accrued based upon our estimates of the ultimate liability for claims incurred and an estimate of claims incurred but not reported. However, liabilities subject to insurance are difficult to estimate due to unknown factors, including the severity of an injury, the determination of our liability in proportion to other parties, the number of incidents not reported and the effectiveness of our safety programs. If we were to experience insurance claims or costs above our estimates, we might also be required to use working capital to satisfy these claims rather than using working capital to maintain or expand our operations.
Unexpected factors affecting reserve estimates could adversely affect our business.
We use third-party insurance to provide for potential liabilities for completed operations, product liability, workers’ compensation, cargo, general liability, vehicle accident, property and medical benefit claims. Although we believe we have minimized our exposure on individual claims, for the benefit of costs savings we have accepted the risk of multiple independent material claims arising. We estimate the projected losses and liabilities associated with the risks retained by us, in part, by considering historical claims experience, demographic and severity factors and other actuarial assumptions which, by their nature, are subject to a high degree of variability. Among the causes of this variability are unpredictable external factors affecting future inflation rates, discount rates, litigation trends, legal interpretations, benefit level changes and claim settlement patterns. Any such matters could have a material adverse effect on our financial condition, results of operations and liquidity.
Our financial results may be affected by various legal and regulatory proceedings involving us or our suppliers.
We and our suppliers are subject to litigation and regulatory proceedings in the normal course of business and could become subject to additional claims in the future, some of which could materially and adversely affect our results of operations. For instance, during 2015, various lawsuits were filed against certain of our suppliers alleging that such manufacturers had conspired to fix the price of wallboard in violation of antitrust and unfair competition, had agreed to abolish the use of job quotes and had agreed to restrict the supply of wallboard in order to support allegedly collusive price increases. We are not a party to these proceedings, but these proceedings could adversely affect the business and financial condition of our suppliers or result in changes to our suppliers’ business practices that could adversely affect our supply chain. In addition, we may in the future be made party to these or similar lawsuits to the extent we distributed products from affected manufacturers. These events could adversely affect our business or results of operations.
36
Table of Contents
In addition, claims and investigations may arise related to distributor relationships, commercial contracts, antitrust or competition law requirements, employment matters, employee benefits issues and other compliance and regulatory matters, including anticorruption and anti-bribery matters. While we have processes and policies designed to mitigate these risks and to investigate and address such claims as they arise, we cannot predict or, in some cases, control the costs to defend or resolve such claims.
The pro forma financial statements and other estimated, post-acquisition financial and operating metrics presented in this prospectus are not necessarily indicative of our future financial condition or results of operations.
This prospectus contains unaudited pro forma condensed combined financial statements for historical periods assuming that during the relevant periods we had operated our historical operations and the businesses of Great Western, GSCIL, Ken API and Winroc-SPI and had completed the other transactions described in the Pro Forma Transactions. The prospectus also includes estimates of certain financial and operating metrics for historical periods. Such information is provided for illustrative purposes only, is not intended to represent or be indicative of the consolidated results of operations or financial position that would have been reported had the Pro Forma Transactions been completed as of the dates indicated and may not be indicative of our future financial condition or results of operations. Such information has been derived from the historical financial statements of the Company and of Great Western, GSCIL, Ken API and Winroc-SPI and, in the case of estimated financial and operating metrics, from other records and information available to the Company. The preparation of this information requires us to make judgments and assumptions, and such judgments and assumptions are difficult to make with complete accuracy. As a result, our actual financial condition and results of operations may not be consistent with, or evident from, the pro forma financial statements or our estimates.
Our business may be subject to additional obligations to collect and remit sales tax and other taxes and we may be subject to tax liability for past sales. Any successful action by state, foreign or other authorities to collect additional or past sales tax could adversely harm our business.
States and some local taxing jurisdictions have differing rules and regulations governing sales and use taxes and these rules and regulations are subject to varying interpretations that may change over time. In particular, the applicability of sales taxes to our subscription services in various jurisdictions is unclear. We recorded sales tax accruals of $4.4 million and $2.9 million as of December 31, 2015 and 2014, respectively, with respect to sales and use tax liabilities in various states and local jurisdictions. It is possible that we could incur additional liabilities that exceed our estimates and we could assume tax liabilities through our acquisitions. Other state tax authorities could still assert that we are obligated to collect additional amounts as taxes from our customers and remit those taxes to those authorities. We could also be subject to audits with respect to states and foreign jurisdictions for which we have not accrued tax liabilities. A successful assertion that we should be collecting additional sales or other taxes on our services in jurisdictions where we have not historically done so and do not accrue for sales taxes could result in substantial tax liabilities for past sales, discourage customers from purchasing our products or otherwise adversely affect our business and results of operations.
37
Table of Contents
Risks Relating to our Indebtedness
Our substantial leverage could adversely affect our ability to raise additional capital to fund our operations, limit our ability to react to changes in the economy or our industry, expose us to interest rate risk and exchange rate risk to the extent of our variable rate and foreign currency debt, give creditors secured claims to any collateral securing the debt owed to them and prevent us from meeting our obligations under our senior secured notes.
We are highly leveraged. As of September 30, 2016, the aggregate principal amount of our debt was approximately $765 million, which was comprised of $190 million under the ABL Credit Facility and $575 million in senior secured notes due 2021, or the Notes. Additionally, we may borrow additional funds under our ABL Credit Facility and increase the borrowing capacity thereunder, each as described in greater detail in the section entitled “Description of Certain Indebtedness—ABL Credit Facility.”
Our high degree of leverage could have important consequences for you, including:
| • | making it more difficult for us to make payments on our existing indebtedness; |
| • | increasing our vulnerability to general economic and industry conditions; |
| • | requiring a substantial portion of cash flow from operations to be dedicated to the payment of principal and interest on our indebtedness, thereby reducing our ability to use our cash flow to fund our operations, capital expenditures and future business opportunities; |
| • | exposing us to the risk of increased interest rates on our borrowings under our ABL Credit Facility, which is at variable rates of interest; |
| • | restricting us from making strategic acquisitions or causing us to make non-strategic divestitures; |
| • | limiting our ability to obtain additional financing for working capital, capital expenditures, debt service requirements, acquisitions and general corporate or other purposes; and |
| • | limiting our ability to adjust to changing market conditions and placing us at a competitive disadvantage compared to our competitors who are less highly leveraged. |
Our ability to make payments on debt, to repay existing indebtedness when due and to fund operations and significant planned capital expenditures will depend on our ability to generate cash in the future. Our ability to produce cash from operations is, and will be, subject to a number of risks, including those described in the section entitled “Risk Factors” and elsewhere in this prospectus.
Borrowings under our ABL Credit Facility are at variable rates of interest and allow certain borrowings in Canadian dollars, which may expose us to interest rate and currency risk. If interest rates increase, our debt service obligations on the variable rate indebtedness will increase even though the amount borrowed remained the same, and our net income and cash flows, including cash available for servicing our indebtedness, will correspondingly decrease.
Additional financing, if required, may not be available on commercially reasonable terms, if at all. In addition, our ability to borrow under our ABL Credit Facility is subject to significant conditions, as described in the section entitled “Description of Certain Indebtedness—ABL Credit Facility.”
38
Table of Contents
Despite our current level of indebtedness, we and our subsidiaries may incur more debt.
We and our subsidiaries may be able to incur significant additional indebtedness in the future. For example, we expect to incur additional indebtedness in connection with many future acquisitions. Although the Indenture dated August 9, 2016 pursuant to which the Notes were issued, or the Indenture, and the credit agreement governing our ABL Credit Facility, or the ABL Credit Agreement, contain restrictions on the incurrence of additional indebtedness, these restrictions are subject to a number of qualifications and exceptions, and the additional indebtedness incurred in compliance with these restrictions could be substantial. These restrictions also do not prevent us from incurring obligations that do not constitute indebtedness. In addition, as of September 30, 2016, our ABL Credit Facility provided for an unused commitment of $110 million (without giving effect to any outstanding letters of credit, and subject to borrowing base limitations). See the section entitled “Description of Certain Indebtedness.”
We will require a significant amount of cash to service our indebtedness. The ability to generate cash or refinance our indebtedness as it becomes due depends on many factors, some of which are beyond our control.
Our ability to make scheduled payments on, or to refinance our respective obligations under, our indebtedness, and to fund planned capital expenditures and other corporate expenses will depend on our future operating performance and on economic, financial, competitive, legislative, regulatory and other factors and any legal and regulatory restrictions on the payment of distributions and dividends to which we may be subject. Many of these factors are beyond our control. We cannot assure you that our business will generate sufficient cash flow from operations, that currently anticipated cost savings and operating improvements will be realized or that future borrowings will be available to us in an amount sufficient to enable us to satisfy our respective obligations under our indebtedness or to fund our other needs. In order for us to satisfy our obligations under our indebtedness and fund planned capital expenditures, we must continue to execute our business strategy. If we are unable to do so, we may need to reduce or delay our planned capital expenditures or refinance all or a portion of our indebtedness on or before maturity. Significant delays in our planned capital expenditures may materially and adversely affect our future revenue prospects. In addition, we cannot assure you that we will be able to refinance any of our indebtedness on commercially reasonable terms or at all. Our tax receivable agreement requires that, after Lone Star no longer controls us, any senior debt document that refinances or replaces our existing indebtedness permit our subsidiaries to make dividends to us, without any conditions, to the extent required for us to make payments under the tax receivable agreement, unless Lone Star otherwise consents. At the time of any such refinancing, it may not be possible to include this term in such senior debt documents, and as a result, we may need Lone Star’s consent to complete such refinancing.
We may not be able to generate sufficient cash to service all of our indebtedness and may be forced to take other actions to satisfy our obligations under our indebtedness, which may not be successful.
Our ability to make scheduled payments on or to refinance our debt obligations depends on our financial condition and operating performance, which is subject to prevailing economic and competitive conditions and to certain financial, business and other factors beyond our control. We may not be able to maintain a level of cash flows from operating activities sufficient to permit us to pay the principal, premium, if any, and interest on our indebtedness. See the section entitled “Management’s Discussion and Analysis of Financial Condition and Results of Operations—Liquidity and Capital Resources.” If our cash flows and capital resources are insufficient to fund our debt service obligations, we may be forced to reduce or delay
39
Table of Contents
investments and capital expenditures, seek additional capital, restructure or refinance our indebtedness or sell assets. These alternative measures may not be successful and may not permit us to meet our scheduled debt service obligations. Our ability to restructure or refinance our debt will depend on the condition of the capital markets and our financial condition at such time. Any refinancing of our debt could be at higher interest rates and may require us to comply with more onerous covenants, which could further restrict our business operations. The ABL Credit Facility and the Indenture restrict our ability to consummate or use the proceeds from asset sales. We may not be able to consummate those asset sales to raise capital or sell assets at prices that we believe are fair and proceeds that we do receive may not be adequate to meet any debt service obligations then due. In addition, any failure to make payments of interest and principal on our outstanding indebtedness on a timely basis would likely result in a reduction of our credit rating, which could harm our ability to incur additional indebtedness. See the section entitled “Description of Certain Indebtedness.”
The Indenture and the ABL Credit Agreement restrict our ability and the ability of most of our subsidiaries to engage in some business and financial transactions.
Indenture. The Indenture contains restrictive covenants that, among other things, limit our ability to:
| • | incur additional indebtedness or issue certain preferred shares; |
| • | pay dividends, redeem its or their stock or make other distributions; |
| • | make certain investments; |
| • | create restrictions on the ability of its restricted subsidiaries to pay dividends or make other intercompany transfers; |
| • | create liens; |
| • | sell or transfer certain assets; |
| • | consolidate, merge, sell or otherwise dispose of all or substantially all of our assets; |
| • | enter into certain transactions with our affiliates; and |
| • | designate subsidiaries as unrestricted subsidiaries. |
ABL Credit Facility. The ABL Credit Agreement contains a number of covenants that among other things, limit our ability and the ability of our restricted subsidiaries to:
| • | incur additional indebtedness or guarantees; |
| • | create liens on assets; |
| • | change our fiscal year; |
| • | enter into sale and leaseback transactions; |
| • | engage in mergers or consolidations; |
| • | incur additional liens; |
| • | pay dividends and make other restricted payments; |
| • | make investments, loans or advances; |
| • | repay subordinated indebtedness; |
| • | make certain acquisitions; |
40
Table of Contents
| • | engage in certain transactions with affiliates; |
| • | change our lines of business; |
| • | restrict distributions by our restricted subsidiaries; |
| • | engage in sale and leaseback transactions; |
| • | permit Cypress to engage in certain activities; |
| • | amend or otherwise modify organizational documents or certain debt agreements; and |
| • | manage cash and other assets in our deposit accounts and securities accounts. |
In addition, the ABL Credit Agreement requires us to maintain a minimum fixed charge coverage ratio set at a level of 1.00:1.00, which will only be tested at times when availability under the ABL Credit Agreement is less than a certain threshold.
The ABL Credit Agreement also contains certain customary representations and warranties, affirmative covenants and events of default (including, among others, an event of default upon a change of control). If an event of default occurs, the lenders under the ABL Credit Facility will be entitled to take various actions, including the acceleration of amounts due under our ABL Credit Facility and all actions permitted to be taken by a secured creditor.
Any future debt that we incur may contain additional negative covenants and financial maintenance covenants. These restrictions could limit our ability to obtain debt financing, repurchase stock, refinance or pay principal on our outstanding debt, complete acquisitions for cash or debt or react to changes in our operating environment or the economy.
Our failure to comply with obligations under the Indenture, the ABL Credit Agreement or the agreements governing any other indebtedness we may enter into in the future, may result in an event of default under the applicable agreement. A default, if not cured or waived, may permit acceleration of some or all of our indebtedness. We cannot be certain that we will be able to remedy any defaults. If our indebtedness is accelerated, we cannot be certain that we will have sufficient funds available to pay the accelerated indebtedness or that we will have the ability to refinance the accelerated indebtedness on terms favorable to us or at all. See the section entitled “Description of Certain Indebtedness.”
Risks Related to this Offering and Ownership of Our Common Stock
There is currently no public market for shares of our common stock and an active trading market for our common stock may never develop following this offering.
Prior to this offering, there has been no market for shares of our common stock. Although we have applied to list our common stock on the NYSE under the symbol “FBM,” an active trading market for our common stock may never develop or, if one develops, it may not be sustained following this offering. Accordingly, no assurance can be given as to the following:
| • | the likelihood that an active trading market for our common stock will develop or be sustained; |
| • | the liquidity of any such market; |
| • | the ability of our stockholders to sell their shares of common stock; or |
| • | the price that our stockholders may obtain for their common stock. |
41
Table of Contents
If an active market for our common stock with meaningful trading volume does not develop or is not maintained, the market price of our common stock may decline materially below the offering price and you may not be able to sell your shares.
The trading price of our common stock may be volatile and could decline substantially following this offering.
The market price of our common stock following this offering may be highly volatile and subject to wide fluctuations. Some of the factors that could negatively affect the market price of our common stock or result in significant fluctuations in price, regardless of our actual operating performance, include:
| • | actual or anticipated variations in our quarterly operating results; |
| • | changes in market valuations of similar companies; |
| • | changes in the markets in which we operate; |
| • | additions or departures of key personnel; |
| • | actions by stockholders, including the sale by Lone Star of any of its shares of our common stock; |
| • | speculation in the press or investment community; |
| • | general market, economic and political conditions, including an economic slowdown; |
| • | uncertainty regarding economic events, including in Europe in connection with the United Kingdom’s possible departure from the European Union; |
| • | changes in interest rates; |
| • | our operating performance and the performance of other similar companies; |
| • | our ability to accurately project future results and our ability to achieve those and other industry and analyst forecasts; and |
| • | new legislation or other regulatory developments that adversely affect us, our markets or our industry. |
Furthermore, in recent years, the stock market has experienced significant price and volume fluctuations. This volatility has had a significant impact on the market price of securities issued by many companies, including companies in our industry, and often occurs without regard to the operating performance of the affected companies. Therefore, factors that have little or nothing to do with us could cause the price of our common stock to fluctuate, and these fluctuations or any fluctuations related to our company could cause the market price of our common stock to decline materially below the public offering price.
We are an emerging growth company, and any decision on our part to comply with certain reduced reporting and disclosure requirements applicable to emerging growth companies could make our common stock less attractive to investors.
We are an emerging growth company, and, for as long as we continue to be an emerging growth company, we currently intend to take advantage of exemptions from various reporting requirements applicable to other public companies but not to emerging growth companies, including, but not limited to, not being required to have our independent registered public accounting firm audit our internal control over financial reporting under Section 404 of the Sarbanes-Oxley Act, reduced disclosure obligations regarding executive compensation in our
42
Table of Contents
registration statements, periodic reports and proxy statements, and exemptions from the requirements of holding a nonbinding advisory vote on executive compensation and stockholder approval of any golden parachute payments not previously approved. We will cease to be an emerging growth company upon the earliest of: (i) the end of the fiscal year following the fifth anniversary of this offering; (ii) the first fiscal year after our annual gross revenues are $1.0 billion or more; (iii) the date on which we have, during the previous three-year period, issued more than $1.0 billion in non-convertible debt securities; or (iv) the end of any fiscal year in which the market value of our common stock held by non-affiliates exceeded $700.0 million as of the end of the second quarter of that fiscal year. For the nine months ended September 30, 2016, our revenues were $930.3 million. We expect that our annual revenues will exceed $1.0 billion for the year ended December 31, 2016, and that we will no longer qualify as an emerging growth company.
We cannot predict if investors will find our common stock less attractive if we choose to rely on these exemptions. If some investors find our common stock less attractive as a result of any choices to reduce future disclosure, there may be a less active trading market for our common stock and the price of our common stock may be more volatile.
Under the JOBS Act, emerging growth companies can also delay adopting new or revised accounting standards until such time as those standards apply to private companies. We have irrevocably elected not to avail ourselves of this accommodation allowing for delayed adoption of new or revised accounting standards, and, therefore, we will be subject to the same new or revised accounting standards as other public companies that are not emerging growth companies.
Our internal controls over financial reporting may not be effective and our independent registered public accounting firm may not be able to certify as to their effectiveness, which could have a significant and adverse effect on our business and reputation.
As a public company, we are required to comply with the U.S. Securities and Exchange Commission’s, or the SEC’s, rules implementing Sections 302 and 404 of the Sarbanes-Oxley Act, which require management to certify financial and other information in our quarterly and annual reports and provide an annual management report on the effectiveness of controls over financial reporting. As an emerging growth company, our independent registered public accounting firm will not be required to formally attest to the effectiveness of our internal controls over financial reporting pursuant to Section 404 until the date we are no longer an emerging growth company. At such time, our independent registered public accounting firm may issue a report that is adverse in the event that it is not satisfied with the level at which our controls are documented, designed or operating.
To comply with the requirements of being a public company, we may need to undertake various actions, such as implementing additional internal controls and procedures and hiring additional accounting or internal audit staff. Testing and maintaining internal controls can divert our management’s attention from other matters that are important to the operation of our business. If we identify material weaknesses in our internal controls over financial reporting or are unable to comply with the requirements of Section 404 or assert that our internal controls over financial reporting is effective, or if our independent registered public accounting firm is unable to express an opinion as to the effectiveness of our internal controls over financial reporting, investors may lose confidence in the accuracy and completeness of our financial reports and the market price of our common stock could be negatively affected, and we could become subject to investigations by the SEC or other regulatory authorities, which could require additional financial and management resources.
43
Table of Contents
The offering price per share of our common stock offered under this prospectus may not accurately reflect the value of your investment.
Prior to this offering, there has been no market for our common stock. The offering price per share of our common stock offered by this prospectus was negotiated among Lone Star, the underwriters and us. Factors considered in determining the price of our common stock include:
| • | the history and prospects of companies whose principal business is similar; |
| • | market valuations of those companies; |
| • | our capital structure; |
| • | general conditions of the securities markets at the time of this offering; and |
| • | other factors that we and they deemed relevant. |
The offering price may not accurately reflect the value of our common stock and may not be realized upon any subsequent disposition of the shares.
The coverage of our business or our common stock by securities or industry analysts or the absence thereof could adversely affect our stock price and trading volume.
The trading market for our common stock will be influenced in part by the research and other reports that industry or securities analysts may publish about us or our business or industry. We do not currently have, and may never obtain, research coverage by industry or financial analysts. If no or few analysts commence coverage of us, the trading price and volume of our stock would likely be negatively impacted. If analysts do cover us and one or more of them downgrade our stock, or if they issue other unfavorable commentary about us or our industry or inaccurate research, our stock price would likely decline. Furthermore, if one or more of these analysts cease coverage or fail to regularly publish reports on us, we could lose visibility in the financial markets. Any of the foregoing would likely cause our stock price and trading volume to decline.
Lone Star may have conflicts of interest with other stockholders and may limit your ability to influence corporate matters.
Immediately after this offering, Lone Star will beneficially own approximately 70.1% (or 65.6% if the underwriters’ option to purchase additional shares is exercised in full) of our outstanding common stock. See the section entitled “Principal and Selling Stockholders” for more information on the beneficial ownership of our common stock. As a result of this concentration of stock ownership, Lone Star acting on its own has sufficient voting power to effectively control all matters submitted to our stockholders for approval, including director elections and proposed amendments to our bylaws or certificate of incorporation. We currently expect that, as discussed in the section entitled “Management,” seven of the eleven members of our board of directors following this offering will be employees or affiliates of Lone Star.
In addition, this concentration of ownership may delay or prevent a merger, consolidation or other business combination or change in control of our company and make some transactions that might otherwise give you the opportunity to realize a premium over the then-prevailing market price of our common stock more difficult or impossible without the support of Lone Star. Because we have opted out of Section 203 of the Delaware General Corporation Law, or the DGCL, regulating certain business combinations with interested stockholders, Lone Star may transfer control of us to a third party, which may limit the price that investors are willing to pay in the future for shares of our common stock. After the lock-up period discussed in the
44
Table of Contents
section entitled “Underwriting” expires, Lone Star will be able to transfer control of us to a third-party by transferring its common stock, which would not require the approval of our board of directors or other stockholders. The interests of Lone Star may not always coincide with our interests as a company or the interests of other stockholders. Accordingly, Lone Star could cause us to enter into transactions or agreements of which you would not approve or make decisions with which you would disagree. This concentration of ownership may also adversely affect our share price.
Lone Star is in the business of making investments in companies and may from time to time acquire and hold interests in businesses that compete directly or indirectly with us, although it does not currently hold any such interests. Lone Star may also pursue acquisition opportunities that may be complementary to our business, and as a result, those acquisition opportunities may not be available to us. In recognition that principals, members, directors, managers, partners, stockholders, officers, employees and other representatives of Lone Star and its affiliates and investment funds may serve as our directors or officers, our amended and restated certificate of incorporation will provide, among other things, that none of Lone Star or any principal, member, director, manager, partner, stockholder, officer, employee or other representative of Lone Star has any duty to refrain from engaging directly or indirectly in the same or similar business activities or lines of business that we do. In the event that any of these persons or entities acquires knowledge of a potential transaction or matter which may be a corporate opportunity for itself and us, we will not have any expectancy in such corporate opportunity, and these persons and entities will not have any duty to communicate or offer such corporate opportunity to us and may pursue or acquire such corporate opportunity for themselves or direct such opportunity to another person. These potential conflicts of interest could have a material adverse effect on our business, financial condition and results of operations if, among other things, attractive corporate opportunities are allocated by Lone Star to themselves or their other affiliates. The terms of our amended and restated certificate of incorporation are described in full in the section entitled “Description of Capital Stock—Corporate Opportunities and Transactions with Lone Star.”
Lone Star may also have conflicts of interest with the Company and other stockholders as a result of its status as a party to the tax receivable agreement. For example, the tax receivable agreement gives us the right to terminate the tax receivable agreement with approval of a majority of our independent directors and with Lone Star’s consent by making a payment equal to the present value of future payments under the tax receivable agreement (based on certain assumptions and deemed events in the agreement, including those relating to our and our subsidiaries’ future taxable income). Lone Star may determine to withhold its consent to terminate the tax receivable agreement at a time when such a termination would be favorable to us and the other stockholders or Lone Star may elect to terminate the tax receivable agreement upon certain changes of control or at any time following the fifteenth anniversary of this offering at a time when such a termination would not be favorable to us and the other stockholders. Furthermore, the tax receivable agreement prohibits us from settling any tax audit without Lone Star’s consent (not to be unreasonably withheld, conditioned or delayed) if the outcome of the audit is reasonably expected to affect Lone Star’s rights under the tax receivable agreement. Therefore, Lone Star may determine to withhold consent to a settlement that reduces the payments Lone Star will receive under the tax receivable agreement, even though the settlement might be favorable to us and our stockholders. See the section entitled “Certain Relationships and Related Party Transactions—Tax Receivable Agreement.”
45
Table of Contents
We will be required to pay Lone Star for certain tax benefits, and these amounts are expected to be material.
In connection with this offering, we will enter into a tax receivable agreement with Lone Star that will provide for the payment by us to Lone Star of 90% of the amount of cash savings, if any, in U.S. federal, state, local and non-U.S. income tax that we and our subsidiaries realize (or in some circumstances are deemed to realize) as a result of the utilization of certain tax benefits, together with interest accrued at a rate of LIBOR plus 300 basis points from the date the applicable tax return is due (without extension) until paid. See the section entitled “Certain Relationships and Related Party Transactions—Tax Receivable Agreement.” These tax benefits, or collectively the Covered Tax Benefits, include: (i) all depreciation and amortization deductions, and any offset to taxable income and gain or increase to taxable loss, resulting from the tax basis that we have in our assets as of the time of the consummation of this offering, (ii) the utilization of our and our subsidiaries’ net operating losses and tax credits, if any, attributable to periods prior to this offering, (iii) deductions in respect of payments made, funded or reimbursed by Lone Star under the LSF9 Cypress Parent, LLC Long Term Incentive Plan, or LTIP, (iv) deductions in respect of transaction expenses attributable to certain acquisitions made by us prior to this offering, (v) deductions in respect of the debt issuance costs and original issue discount associated with certain of our financing agreements, and (vi) deductions in respect of offering-related expenses and (vii) certain other tax benefits attributable to payments made under the tax receivable agreement.
We expect that the payments we make under the tax receivable agreement could be substantial. Assuming no material changes in the relevant tax law, and that we and our subsidiaries earn sufficient income to realize the full tax benefits subject to the tax receivable agreement, we currently estimate that future payments under the agreement will aggregate to between $190 million and $220 million. This amount, as well as the amount of tax receivable agreement liability reflected in our pro forma financial statements, excludes any payments that may be made to Lone Star under the tax receivable agreement as a result of tax benefits recognized in connection with payments under the LTIP and, thus, the actual payments we ultimately are required to make under the tax receivable agreement could be greater, potentially materially greater, than these amounts. These payment obligations are our obligations and are not obligations of any of our subsidiaries. Furthermore, these payment obligations are not conditioned upon Lone Star maintaining a continued direct or indirect ownership interest in us. The actual utilization of Covered Tax Benefits as well as the timing of any payments under the tax receivable agreement will vary depending upon a number of factors, including the amount, character and timing of our and our subsidiaries’ taxable income in the future.
We will not be reimbursed for any payments made to Lone Star under the tax receivable agreement in the event that the tax benefits are disallowed.
Lone Star will not reimburse us for any payments previously made under the tax receivable agreement if such benefits are subsequently disallowed upon a successful challenge by the Internal Revenue Service, although future payments under the agreement would be adjusted to the extent possible to reflect the result of such disallowance. As a result, in certain circumstances, payments could be made under the tax receivable agreement in excess of our cash tax savings if any, from the Covered Tax Benefits, and we may not be able to recoup those payments, which could adversely affect our liquidity.
46
Table of Contents
In certain cases, payments made by us under the tax receivable agreement may be accelerated and/or significantly exceed the actual benefits we realize in respect of the Covered Tax Benefits.
The term of the tax receivable agreement will continue until all Covered Tax Benefits have been utilized or expired, unless we exercise our right to terminate the agreement with approval of a majority of our independent directors and with Lone Star’s consent, we breach any of our material obligations under the agreement, certain credit events occur with respect to us, Lone Star elects to terminate the tax receivable agreement upon certain changes of control or Lone Star exercises its right after the fifteenth anniversary of this offering to terminate the tax receivable agreement, in any of which cases we will be required to make an accelerated payment to Lone Star equal to the present value of future payments under the tax receivable agreement. Such payment would be based on certain assumptions, including the assumption that we have sufficient taxable income and tax liability to fully utilize all Covered Tax Benefits. The tax receivable agreement also provides that upon certain changes of control, in the event that Lone Star does not elect to terminate the tax receivable agreement, our (or our successor’s) payments under the tax receivable agreement for each taxable year after any such event would be based on certain valuation assumptions, including the assumption that we and our subsidiaries have sufficient taxable income to fully utilize the Covered Tax Benefits. Accordingly, payments under the tax receivable agreement may be made years in advance of the actual realization, if any, of the anticipated future tax benefits and may be significantly greater than the benefits we realize in respect of the Covered Tax Benefits.
Even if the payments under the tax receivable agreement are not accelerated as described above, such payments may be significantly greater than the benefits we realize in respect of the Covered Tax Benefits, due to the manner in which payments are calculated under the tax receivable agreement. For example, for purposes of calculating the payments to be made to Lone Star:
| • | it is assumed that we will pay state and local taxes at a rate of 5%, even though our actual effective state and local tax rate may be materially lower; |
| • | tax benefits existing at the time of the offering are deemed to be utilized before any post-closing/after-acquired tax benefits and, as a result, we could be required to make payments to Lone Star for a particular tax year even if our tax liability for such year would have been materially reduced or eliminated by reason of our utilization of the post-closing/after-acquired tax benefits; |
| • | a non-taxable transfer of assets by us to a non-consolidated entity is treated under the tax receivable agreement as a taxable sale at fair market value and, as a result, we could be required to make payments to Lone Star even though such non-taxable transfer would not generate any actual tax benefits to us or our non-consolidated entity; and |
| • | a taxable sale or other taxable transfer of subsidiary stock by us is (in cases where the subsidiary’s tax basis in its assets exceeds our tax basis in the subsidiary’s stock) treated under the tax receivable agreement as a taxable sale of the subsidiary’s assets and, as a result, we could be required to make payments to Lone Star that materially exceed the actual tax benefit we realize from such stock sale. |
Because of the foregoing, our obligations under the tax receivable agreement could have a substantial negative impact on our liquidity and could have the effect of delaying, deferring or preventing certain mergers, asset sales, other forms of business combinations or other changes of control.
47
Table of Contents
Certain provisions of the tax receivable agreement limit our ability to incur additional indebtedness, which could adversely affect our business and growth strategy.
For so long as the tax receivable agreement remains outstanding, without the prior written consent of Lone Star (not to be unreasonably withheld, conditioned or delayed), we are restricted from (x) entering into any agreement or amendment, after Lone Star ceases to control the Company, that would materially restrict (or in the case of amendments, further restrict beyond the restrictions in the Company’s existing financing agreements) our ability to make payments under the tax receivable agreement, or (y) unless permitted by the terms of the Indenture and the ABL Credit Agreement or any replacement senior debt document to the extent that the terms thereof are no less restrictive in this regard than the Indenture and the ABL Credit Agreement, incurring debt that would cause our consolidated total leverage ratio (the ratio of consolidated total indebtedness for borrowed money less balance sheet cash to consolidated EBITDA) to exceed 6.00 to 1.00. In addition, we are prohibited under the tax receivable agreement from replacing our existing financing agreements with any senior debt document that does not permit our subsidiaries to make dividends to us to the extent necessary to make the payments under the tax receivable agreement, without conditions, unless Lone Star otherwise consents. These restrictions on the incurrence of debt could adversely affect our business, including by preventing us from pursuing an acquisition or other strategic transaction that we believe is in the best interests of our company and our stockholders, thereby impeding our growth strategy. Lone Star has no fiduciary duties to us when deciding whether to enforce these covenants under the tax receivable agreement. Moreover, these restrictions on amending or refinancing our existing indebtedness could result in a requirement to obtain Lone Star’s consent for any such amendment or refinancing. Furthermore, the provision in the tax receivable agreement that requires that we make an accelerated payment to Lone Star equal to the present value of all future payments due under the tax receivable agreement if we breach any of our material obligations under the agreement or certain credit events occur with respect to us, might make it harder for us to obtain financing from third party lenders on favorable terms.
We would be required to make tax gross-up payments to Lone Star if we consummate a corporate inversion or similar transaction that causes payments under the tax receivable agreement to be subject to withholding taxes.
If we were to consummate a change of control transaction that causes us (or our successor) to become a non-U.S. person (e.g., a corporate inversion transaction), and such transaction causes payments under the tax receivable agreement to become subject to withholding taxes, we would be required under the tax receivable agreement to make tax gross-up payments to Lone Star in respect of such withholding taxes in amounts that may exceed the tax savings realized by the Company from the Covered Tax Benefits. Any such tax gross-up payments could have a negative impact on our liquidity and our ability to finance our growth.
Because of Lone Star’s significant ownership and control of us, we could become liable for obligations of Lone Star or its affiliates, including other companies Lone Star owns or controls.
As a result of Lone Star’s current beneficial ownership of 100% of our common stock, a court, applying tests based on common control or otherwise, could determine that Lone Star and its affiliates, including us and other companies Lone Star now or in the future may own or control, constitute a “partnership-in-fact,” a “controlled group” or other similar collective. Such a finding could be used to impose on us and other members of the group joint and several liability for the obligations of any Lone Star affiliate that is part of the group, including in respect of pension liabilities under the Employee Retirement Income Security Act of 1974, as amended,
48
Table of Contents
or ERISA, and related laws. These pension liabilities could include an obligation to make ongoing contributions to fund a pension plan for another group member and for any unfunded liabilities that may exist at the time a group member terminates or withdraws from an underfunded single employer or multiemployer pension plan, as well as result in the creation of liens against our assets and the assets of other members of the group. Under this theory, we could incur significant liabilities for events beyond our control that are not related to or known by us. Additionally, to the extent a group member maintains an underfunded pension plan, ERISA imposes reporting obligations on group members regarding certain events, including if a member ceases to be a member of the controlled group or if it makes certain dividends, distributions or stock repurchases. These reporting obligations could cause us or Lone Star to seek to delay or reconsider pursuing one or more strategic actions with respect to our company or our common stock.
Following this offering, we will be a controlled company within the meaning of the NYSE rules and, as a result, will qualify for, and intend to rely on, exemptions from certain corporate governance requirements.
Upon completion of this offering, Lone Star will continue to control a majority of the voting power of our outstanding common stock. As a result, we will be a controlled company within the meaning of the corporate governance standards of the NYSE. Under the NYSE rules, a company of which more than 50% of the voting power is held by a person or group is a controlled company and need not comply with certain requirements, including the requirement that a majority of the board of directors consist of independent directors and the requirements that the compensation and nominating and corporate governance committees be composed entirely of independent directors. Following this offering, we intend to utilize these exemptions. As a result, among other things, we may not have a majority of independent directors and our compensation and nominating and corporate governance committees may not consist entirely of independent directors. Accordingly, you will not have the same protections afforded to stockholders of companies that are subject to all of the NYSE corporate governance requirements.
Future sales of our common stock in the public market could cause our stock price to fall.
Following completion of this offering, Lone Star will beneficially own approximately 29,974,239 shares or 70.1% of our outstanding shares of common stock (or 28,054,239 shares and 65.6% if the underwriters exercise their option to purchase additional shares in full). We, Lone Star and our officers and directors have signed lock-up agreements with the underwriters that will, subject to certain exceptions, restrict the sale of shares of our common stock held by them for 180 days following the date of this prospectus. The underwriters may, without notice except in certain limited circumstances, release all or any portion of the shares of common stock subject to lock-up agreements. See the section entitled “Underwriting” for a description of these lock-up agreements. The market price of our common stock may decline materially when these restrictions on resale by Lone Star and our other affiliates lapse or if they are waived.
Upon the expiration of the lock-up agreements, all shares held by our affiliates will be eligible for resale in the public market, subject to applicable securities laws, including the Securities Act. Therefore, unless shares owned by any of our affiliates are registered under the Securities Act, these shares may only be resold into the public markets in accordance with the requirements of an exemption from registration or safe harbor, including Rule 144 and the volume limitations, manner of sale requirements and notice requirements thereof. See the section entitled “Shares Eligible for Future Sale.” Lone Star will be considered an affiliate of ours after this offering based on their expected share ownership and representation of our
49
Table of Contents
board of directors. However, after completion of this offering, pursuant to the terms of a registration rights agreement between Lone Star and us, Lone Star will have the right to demand that we register its shares under the Securities Act as well as the right to include its shares in any registration statement that we file with the SEC subject to certain exceptions. See the section entitled “Shares Eligible for Future Sale.” Any registration of Lone Star’s shares would enable those shares to be sold in the public market, subject to certain restrictions in the registration rights agreement and the restrictions under the lock-up agreements referred to above. Any sale by Lone Star or other affiliates or any perception in the public markets that such a transaction may occur could cause the market price of our common stock to decline materially.
Following this offering, we intend to file a registration statement on Form S-8 under the Securities Act registering shares under our stock incentive plan. Subject to the terms of the awards pursuant to which these shares may be granted and except for shares held by affiliates who will be subject to the resale restrictions described above, the shares issuable pursuant to our stock incentive plan will be available for sale in the public market immediately after the registration statement is filed. See the section entitled “Shares Eligible for Future Sale.”
If you purchase shares of common stock sold in this offering, you will experience immediate and substantial dilution and you may suffer additional dilution in the future.
If you purchase shares our common stock in this offering, the value of your shares based on our actual book value will immediately be less than the price you paid. This reduction in the value of your equity is known as dilution. This dilution occurs in large part because Lone Star paid substantially less than the then-equivalent of the initial public offering price when it purchased the Company in the Lone Star Acquisition. If you purchase shares in this offering, you will suffer, as of September 30, 2016, immediate dilution of $24.32 per share in the net tangible book value after giving effect to the sale of common stock in this offering at an assumed initial public offering price of $18.00 per share, which is the midpoint of the estimated price range appearing on the cover of this prospectus, less underwriting discounts and commissions and the estimated expenses payable by us, and the application of the net proceeds as described in the section entitled “Use of Proceeds.” We also expect to grant stock options, restricted stock and other forms of stock-based compensation to our directors, officers and employees and you will experience additional dilution in the future when these equity awards are exercised or vest, as applicable. If we raise funds in the future by issuing additional securities, any newly issued shares or shares issued upon conversion or exercise of such securities will further dilute your ownership.
We have no present intention to pay dividends on our common stock.
We have no present intention to pay dividends on our common stock. Any determination to pay dividends to holders of our common stock will be at the discretion of our board of directors and will depend upon many factors, including our financial condition, results of operations, projections, liquidity, earnings, legal requirements, restrictions in our credit facilities and agreements governing any other indebtedness we may enter into and other factors that our board of directors deems relevant. See the section entitled “Dividend Policy.” Accordingly, you may need to sell your shares of our common stock to realize a return on your investment, and you may not be able to sell your shares at or above the price you paid for them.
Our ability to raise capital in the future may be limited.
Our business and operations may consume resources faster than we anticipate. In the future, we may need to raise additional funds through the issuance of new equity securities,
50
Table of Contents
debt or a combination of both. However, the lapse or waiver of the lock up restrictions discussed above or any sale or perception of a possible sale by Lone Star, and any related decline in the market price of our common stock, could impair our ability to raise capital. Separately, additional financing may not be available on favorable terms, or at all. If adequate funds are not available on acceptable terms, we may be unable to fund our capital requirements. If we issue new debt securities, the debt holders would have rights senior to common stockholders to make claims on our assets, and the terms of any debt could restrict our operations, including our ability to pay dividends on our common stock. If we issue additional equity securities, existing stockholders will experience dilution, and the new equity securities could have rights senior to those of our common stock. Because our decision to issue securities in any future offering will depend on market conditions and other factors beyond our control, we cannot predict or estimate the amount, timing or nature of our future offerings. Thus, our stockholders bear the risk of our future securities offerings reducing the market price of our common stock and diluting their interest.
We are a holding company and depend on the cash flow of our subsidiaries.
We are a holding company with no material assets other than the equity interests of our subsidiaries. Our subsidiaries conduct substantially all of our operations and own substantially all of our assets and intellectual property. Consequently, our cash flow and our ability to meet our obligations and pay any future dividends to our stockholders depends upon the cash flow of our subsidiaries and their ability to make payments, directly or indirectly, to us in the form of dividends, distributions and other payments. Any inability on the part of our subsidiaries to make payments to us could have a material adverse effect on our business, financial condition and results of operations.
Provisions of our amended and restated governing documents, Delaware law and other documents could discourage, delay or prevent a merger or acquisition at a premium price.
Provisions in our amended and restated certificate of incorporation and amended and restated bylaws that we intend to adopt prior to the consummation of this offering may have the effect of delaying or preventing a change of control or changes in our management. For example, our amended and restated certificate of incorporation and amended and restated bylaws will include provisions that:
| • | permit us to issue, without stockholder approval, preferred stock in one or more series and, with respect to each series, fix the number of shares constituting the series and the designation of the series, the voting powers, if any, of the shares of the series and the preferences and other special rights, if any, and any qualifications, limitations or restrictions, of the shares of the series; |
| • | prevent stockholders from calling special meetings; |
| • | restrict the ability of stockholders to act by written consent after such time as Lone Star owns less than a majority of our common stock; |
| • | limit the ability of stockholders to amend our certificate of incorporation and bylaws; |
| • | require advance notice for nominations for election to the board of directors and for stockholder proposals; |
| • | do not permit cumulative voting in the election of our directors, which means that the holders of a majority of our common stock may elect all of the directors standing for election; and |
| • | establish a classified board of directors with staggered three-year terms. |
51
Table of Contents
These provisions may discourage, delay or prevent a merger or acquisition of our company, including a transaction in which the acquirer may offer a premium price for our common stock.
Our amended and restated certificate of incorporation will include an exclusive forum clause, which could limit our stockholders’ ability to obtain a favorable judicial forum for disputes with us.
Our amended and restated certificate of incorporation will provide that, unless we consent in writing to the selection of an alternative forum, the sole and exclusive forum for any stockholder (including any beneficial owner) to bring (i) any derivative action or proceeding brought on our behalf, (ii) any action asserting a claim of breach of a fiduciary duty owed by any of our directors, officers or employees to us or to our stockholders, (iii) any action asserting a claim arising pursuant to any provision of the DGCL or our certificate of incorporation or bylaws or (iv) any action asserting a claim governed by the internal affairs doctrine, will be a state court located within the State of Delaware (or, if no state court located within the State of Delaware has jurisdiction, the federal district court for the District of Delaware); in all cases subject to such court having personal jurisdiction over the indispensable parties named as defendants. Any person or entity purchasing or otherwise acquiring any interest in shares of our capital stock is deemed to have notice of and consented to the foregoing provisions. The exclusive forum clause may limit our stockholders’ ability to obtain a favorable judicial forum for disputes with us. It is also possible that, notwithstanding such exclusive forum clause, a court could rule that such a provision is inapplicable or unenforceable. See the section entitled “Description of Capital Stock—Exclusive Forum Clause.”
We will incur increased costs and obligations as a result of being a publicly-traded company.
As a company with publicly-traded securities, we will be subject to the requirements of the Securities Exchange Act of 1934, as amended, or the Exchange Act, the Sarbanes-Oxley Act, the Dodd-Frank Wall Street Reform and Consumer Protection Act, the listing requirements of the NYSE and other applicable securities rules and regulations. These rules and regulations require that we adopt additional controls and procedures and disclosure, corporate governance and other practices thereby significantly increasing our legal, financial and other compliance costs. These new obligations will also make other aspects of our business more difficult, time-consuming or costly and increase demand on our personnel, systems and other resources. For example, to maintain and improve the effectiveness of our disclosure controls and procedures and internal control over financial reporting, we will need to commit significant resources, hire additional staff and provide additional management oversight. Furthermore, as a result of disclosure of information in this prospectus and in our Exchange Act and other filings required of a public company, our business and financial condition will become more visible, which we believe may give some of our competitors who may not be similarly required to disclose this type of information a competitive advantage. In addition to these added costs and burdens, if we are unable to satisfy our obligations as a public company, we could be subject to delisting of our common stock, fines, sanctions, other regulatory actions and civil litigation, any of which could negatively affect the price of our common stock.
52
Table of Contents
This prospectus contains “forward-looking statements.” These forward-looking statements are included throughout this prospectus, including in the sections entitled “Prospectus Summary,” “Risk Factors,” “Use of Proceeds,” “Management’s Discussion and Analysis of Financial Condition and Results of Operations,” “Business” and “Certain Relationships and Related Party Transactions,” and relate to matters such as our industry, business strategy, goals and expectations concerning our market position, rebates, future operations, margins, profitability, capital expenditures, liquidity, capital resources and other financial and operating information. We have used the words “approximately,” “anticipate,” “assume,” “believe,” “contemplate,” “continue,” “could,” “estimate,” “expect,” “future,” “intend,” “may,” “plan,” “potential,” “predict,” “project,” “seek,” “should,” “target,” “will” and similar terms and phrases to identify forward-looking statements in this prospectus. All of our forward-looking statements are subject to risks and uncertainties that may cause actual results to differ materially from those that we are expecting, including:
| • | our ability to effectively manage any downturns in the commercial new construction market, the commercial repair and remodel market and the industrial construction and maintenance markets; |
| • | the consequences of any continued financial uncertainty following the recent worldwide recession and the impact on the markets we serve; |
| • | our ability to effectively manage any changes in economic, political and social conditions; |
| • | fluctuating demand for the products and services we offer; |
| • | our ability to effectively compete in a highly competitive industry; |
| • | our ability to realize the anticipated financial and strategic goals of future acquisitions or investments, including the identification of acquisition targets and the integration and performance of acquired stores and businesses, including integration of financial systems; |
| • | our ability to achieve the intended benefits of our recent and pending acquisitions, including the realization of synergies; |
| • | diversion of management’s attention from ongoing business concerns to matters related to acquisitions we may make in the future; |
| • | our ability to maintain our existing contractual and business relationships; |
| • | the change in any exclusive rights or relationships we have with suppliers that provide us access to leading brands; |
| • | a material disruption at our suppliers’ facilities due to weather, environmental incidents, transportation disruption and other operational problems; |
| • | our ability to manage the unique risks involved with the mechanical insulation business; |
| • | the effects of any changes in environmental, health and safety laws and regulations on our operations and liquidity |
| • | our ability to attract and retain key management personnel and other talent required for our business; |
| • | our exposure to legal claims and proceedings related to our business; |
| • | our ability to manage the impact of debt and equity financing transactions; |
53
Table of Contents
| • | our ability to generate a sufficient amount of cash to service our indebtedness and fund our operations; |
| • | our ability to operate our business under agreements governing certain of our indebtedness containing financial covenants and other restrictions; |
| • | the effects of incurring a substantial amount of indebtedness under the ABL Credit Facility and the Notes; |
| • | the volatility of the trading price of our common stock |
| • | our relationship with Lone Star and its significant ownership of our common stock; and |
| • | additional factors discussed under the sections entitled “Risk Factors,” “Management’s Discussion and Analysis of Financial Condition and Results of Operations” and “Business.” |
The forward-looking statements contained in this prospectus are based on historical performance and management’s current plans, estimates and expectations in light of information currently available to us and are subject to uncertainty and changes in circumstances. There can be no assurance that future developments affecting us will be those that we have anticipated. Actual results may differ materially from these expectations due to changes in global, regional or local political, economic, business, competitive, market, regulatory and other factors, many of which are beyond our control, as well as the other factors described in the section entitled “Risk Factors.” Additional factors or events that could cause our actual results to differ may also emerge from time to time, and it is not possible for us to predict all of them. Comparisons of results for current and any prior periods are not intended to express any future trends, or indications of future performance, unless expressed as such, and should only be viewed as historical data. Should one or more of these risks or uncertainties materialize, or should any of our assumptions prove to be incorrect, our actual results may vary in material respects from what we may have expressed or implied by these forward-looking statements. We caution that you should not place undue reliance on any of our forward-looking statements. Any forward-looking statement made by us in this prospectus speaks only as of the date on which we make it. We undertake no obligation to publicly update any forward-looking statement, whether as a result of new information, future developments or otherwise, except as may be required by applicable securities laws.
54
Table of Contents
We estimate that our proceeds from this offering will be approximately $207.4 million, after deducting underwriting discounts and commissions and estimated offering expenses payable by us, based on an assumed offering price of $18.00 per share, the midpoint of the estimated initial public offering price range set forth on the cover of this prospectus. We intend to use the net proceeds from this offering as follows:
| • | to repay amounts outstanding under the ABL Credit Facility, which was $190.0 million as of September 30, 2016; and |
| • | the remainder for working capital and other general corporate purposes. |
The terms of the ABL Credit Facility, including the interest rate and maturity thereof, are described in detail in the section entitled “Description of Certain Indebtedness—ABL Credit Facility.”
Pending use of the net proceeds from this offering described above, we may invest the net proceeds in short- and intermediate-term interest-bearing obligations, investment-grade instruments, certificates of deposit or direct or guaranteed obligations of the United States government.
Each $1.00 increase or decrease in the assumed initial public offering price of $18.00 per share, the midpoint of the estimated initial public offering price range set forth on the cover page of this prospectus, would increase or decrease the net proceeds to us from this offering by approximately $12.0 million, assuming the number of shares offered, as set forth on the cover page of this prospectus, remains the same, and after deducting underwriting discounts and commissions and estimated offering expenses payable by us.
The selling stockholder will receive approximately $34.6 million in gross proceeds from this offering if the underwriters exercise in full their option to purchase additional shares, based on an assumed offering price of $18.00 per share, the midpoint of the estimated initial public offering price range set forth on the cover of this prospectus. We will not receive any proceeds from the sale of shares by the selling stockholder.
An affiliate of RBC Capital Markets, LLC is a lender under the ABL Credit Facility. A portion of the net proceeds from this offering will be used to repay borrowings under the ABL Credit Facility. As a result, more than 5% of the net proceeds from this offering will be paid to an affiliate of RBC Capital Markets, LLC. Therefore, this offering is being made in compliance with FINRA Rule 5121. As a result of this conflict of interest, Deutsche Bank Securities Inc. has agreed to act as the qualified independent underwriter with respect to this offering. See the section entitled “Underwriting—Conflicts of Interest.”
55
Table of Contents
We have no present intention to pay cash dividends on our common stock. Any determination to pay dividends to holders of our common stock will be at the discretion of our board of directors and will depend upon many factors, including our financial condition, results of operations, projections, liquidity, earnings, legal requirements, restrictions in the agreements governing our existing indebtedness and any other indebtedness we may enter into and other factors that our board of directors deems relevant.
The agreements governing our existing indebtedness contain, and debt instruments that we enter into in the future may contain, covenants that place limitations on the amount of dividends we may pay. See the section entitled “Description of Certain Indebtedness.” In addition, under Delaware law, our board of directors may declare dividends only to the extent of our surplus, which is defined as total assets at fair market value minus total liabilities, minus statutory capital, or, if there is no surplus, out of our net profits for the then current and immediately preceding year.
56
Table of Contents
The following table sets forth our cash and cash equivalents and capitalization as of September 30, 2016:
| • | on an actual basis; and |
| • | on a pro forma basis to give effect to the following: |
| • | the Reorganization; |
| • | a 29,974.239 for one stock split, which will occur prior to the effective date of the registration statement; |
| • | the issuance and sale of 12,800,000 shares of our common stock offered by us in this offering, based on an assumed offering price of $18.00 per share, the midpoint of the estimated initial public offering price range set forth on the cover of this prospectus, after deducting underwriting discounts and commissions and estimated offering expenses payable by us, and the application of such proceeds as described in the section entitled “Use of Proceeds;” and |
| • | the execution of the tax receivable agreement as discussed in greater detail in the section entitled “Certain Relationships and Related Party Transactions—Tax Receivable Agreement.” |
You should read this table together with the information in this prospectus in the sections entitled “Use of Proceeds,” “Selected Historical Financial and Operating Data,” “Unaudited Pro Forma Condensed Combined Financial Information,” “Management’s Discussion and Analysis of Financial Condition and Results of Operations” and “Description of Capital Stock,” and with the audited and unaudited combined financial statements and the related notes included elsewhere in this prospectus.
57
Table of Contents
LSF9 CYPRESS HOLDINGS, LLC
CAPITALIZATION
| As of September 30, 2016 |
||||||||
| Actual | Pro Forma Total (as adjusted) |
|||||||
| (in thousands) | ||||||||
| Cash and cash equivalents |
$ | 23,393 | $ | 40,628 | ||||
|
|
|
|
|
|||||
| Debt: |
||||||||
| Senior Secured Notes due 2021 |
523,403 | $ | 523,403 | |||||
| ABL Credit Facility(1) |
190,000 | — | ||||||
| Capital lease obligations |
14,195 | 14,195 | ||||||
|
|
|
|
|
|||||
| Total debt:(2) |
727,598 | 537,598 | ||||||
|
|
|
|
|
|||||
| Stockholders’ equity: |
||||||||
| Undesignated preferred stock, par value $0.001 per share: no shares authorized, issued or outstanding, actual; 10,000,000 shares authorized, no shares issued and outstanding pro forma |
— | — | ||||||
| Common stock, par value $0.001 per share; no shares authorized, issued or outstanding, actual; 190,000,000 shares authorized, 29,974,239 shares issued and outstanding pro forma |
— | 43 | ||||||
| Members’ equity |
364,815 | — | ||||||
| Additional paid in capital |
— | 367,196 | ||||||
| Accumulated deficit |
(27,492 | ) | (27,492 | ) | ||||
| Accumulated other comprehensive income |
875 | 875 | ||||||
|
|
|
|
|
|||||
| Total stockholders’ equity: |
338,198 | 340,622 | ||||||
|
|
|
|
|
|||||
| Total capitalization: |
$ | 1,065,796 | $ | 878,220 | ||||
|
|
|
|
|
|||||
| (1) | Balance at December 31, 2016 was $208.5 million. |
| (2) | We will enter into a Tax Receivable Agreement with Lone Star that will result in an additional liability and reduction to equity. We currently estimate that liability to be between $190 million and $220 million. See the sections entitled “Risk Factors” and “Certain Relationships and Related Party Transactions—Tax Receivable Agreement.” |
58
Table of Contents
Dilution represents the difference between the amount per share paid by investors in this offering and the as adjusted net tangible book value per share of our common stock immediately after this offering. The data in this section have been derived from our condensed combined balance sheet as of September 30, 2016. Net tangible book value per share is equal to our total tangible assets less the amount of our total liabilities, divided by the sum of the number of our shares of common stock outstanding. Our net tangible book value as of September 30, 2016 was $(272.8) million, or $(9.10) per share of common stock.
After giving effect to our receipt of the estimated net proceeds from our sale of common stock in this offering, based on an assumed offering price of $18.00 per share, the midpoint of the estimated initial public offering price range set forth on the cover page of this prospectus, and after deducting the underwriting discounts and commissions and other estimated offering expenses payable by us and the application of such proceeds as described in the section entitled “Use of Proceeds,” our net tangible book value, pro forma, as of September 30, 2016 would have been $(270.3) million, or $(6.32) per share of common stock. This represents an immediate increase in net tangible book value to our existing stockholders of $2.78 per share and an immediate dilution to new investors in this offering of $24.32 per share. The following table illustrates this per share dilution:
| Assumed initial public offering price per share |
$ | 18.00 | ||||||
| Net tangible book value per share of common stock as of September 30, 2016 |
$ | (9.10 | ) | |||||
| Pro forma increase in net tangible book value per share attributable to new investors |
$ | 2.78 | ||||||
| Pro forma net tangible book value per share after the offering |
$ | (6.32 | ) | |||||
|
|
|
|||||||
| Dilution per share to new investors |
$ | 24.32 | ||||||
|
|
|
The following table shows on a pro forma basis at September 30, 2016, after giving effect to the stock split and the Reorganization which will occur prior to the effective date of the registration statement, the total cash consideration paid to us and the average price per share paid by Lone Star and by new investors in this offering before deducting underwriting discounts and commissions and estimated offering expenses payable by us.
| Shares purchased | Total consideration | Average price per share |
||||||||||||||||||
| (in millions, except share and per share data) |
Number | % | $ | % | ||||||||||||||||
| LSF9 Cypress Parent 2 LLC |
29,974,239 | 70.1 | % | $ | 338.2 | 59.5 | % | $ | 11.28 | |||||||||||
| New investors |
12,800,000 | 29.9 | % | 230.4 | 40.5 | % | $ | 18.00 | ||||||||||||
|
|
|
|
|
|
|
|
|
|
|
|||||||||||
| Total |
42,774,239 | 100 | % | $ | 568.6 | 100 | % | $ | 13.29 | |||||||||||
The information in the preceding table is based on an assumed offering price of $18.00 per share, the midpoint of the estimated initial public offering price range set forth on the cover page of this prospectus. A $1.00 increase or decrease in the assumed initial public offering price per share would increase or decrease, respectively, the pro forma net tangible book value after this offering by $12.0 million and increase or decrease the dilution per share of common stock to new investors in this offering by $0.72 per share, in each case calculated as described above and assuming that the number of shares offered by us, as set forth on the cover page of this prospectus, remains the same.
If the underwriters exercise their option to purchase additional shares in full, Lone Star would beneficially own approximately 65.6% and our new investors would own approximately
59
Table of Contents
34.4% of the total number of shares of our common stock outstanding immediately after this offering (or 70.1% and 29.9%, respectively, if the underwriters do not exercise in full their option to purchase additional shares), based on shares outstanding after this offering.
An aggregate of 3,636,000 additional shares of our common stock will initially be available for future awards under the equity incentive plan that we intend to implement in connection with this offering and are not included in the above discussion and table. To the extent that we grant awards in the future with exercise prices below the initial public offering price in this offering, investors purchasing in this offering will incur additional dilution. See the section entitled “Shares Eligible for Future Sale.”
60
Table of Contents
SELECTED HISTORICAL CONSOLIDATED FINANCIAL INFORMATION
The selected historical consolidated financial information of the Company presented and discussed below is derived from our audited and unaudited financial statements and the notes thereto, included elsewhere in this prospectus. Financial information for the nine months ended September 30, 2016 and the period from October 9, 2015 to December 31, 2015 relate to the Successor. Financial information for the period from January 1, 2015 to October 8, 2015, the nine months ended September 30, 2015 and the year ended December 31, 2014 relate to the Predecessor.
We have prepared the unaudited condensed consolidated financial information set forth below on the same basis as our audited consolidated financial statements and have included all adjustments, consisting of only normal recurring adjustments, that we consider necessary for a fair statement of our financial position and operating results for such periods.
The results for any interim period are not necessarily indicative of the results that may be expected for a full year. Additionally, our historical results are not necessarily indicative of future results. You should read the information set forth below together with the sections entitled “Management’s Discussion and Analysis of Financial Condition and Results of Operations,” “Certain Relationships and Related Party Transactions” and “Description of Certain Indebtedness” and our audited and unaudited condensed combined financial statements and the related notes and the other financial information included elsewhere in this prospectus.
61
Table of Contents
LSF9 CYPRESS HOLDINGS, LLC
Selected Historical Financial Data
| Successor | Predecessor | Successor | Predecessor | |||||||||||||||||
| (dollars in thousands) |
Nine Months Ended September 30, 2016 |
Nine Months Ended September 30, 2015 |
October 9 to December 31, 2015 |
January 1 to October 8, 2015 |
Year Ended December 31, 2014 |
|||||||||||||||
| Statements of Operations Data: |
||||||||||||||||||||
| Net sales |
$ | 930,315 | $ | 608,964 | $ | 192,539 | $ | 628,066 | $ | 508,853 | ||||||||||
| Cost of goods sold (exclusive of depreciation and amortization) |
665,767 | 440,539 | 143,333 | 452,909 | 368,064 | |||||||||||||||
|
|
|
|
|
|
|
|
|
|
|
|||||||||||
| Gross profit |
264,548 | 168,425 | 49,206 | 175,157 | 140,789 | |||||||||||||||
| Operating expenses: |
||||||||||||||||||||
| Selling, general and administrative expenses |
206,280 | 126,102 | 44,196 | 131,524 | 115,462 | |||||||||||||||
| Depreciation and amortization |
33,605 | 15,125 | 7,170 | 15,615 | 11,729 | |||||||||||||||
| Acquisition related expenses |
12,478 | 12,542 | 3,464 | 39,691 | 4,683 | |||||||||||||||
|
|
|
|
|
|
|
|
|
|
|
|||||||||||
| Total operating expenses |
252,363 | 153,769 | 54,830 | 186,830 | 131,874 | |||||||||||||||
|
|
|
|
|
|
|
|
|
|
|
|||||||||||
| Income (loss) from operations |
12,185 | 14,656 | (5,624 | ) | (11,673 | ) | 8,915 | |||||||||||||
| Interest expense |
(37,202 | ) | (15,717 | ) | (7,044 | ) | (19,090 | ) | (9,980 | ) | ||||||||||
| Other income, net |
93 | 14 | 9 | 14 | 36 | |||||||||||||||
|
|
|
|
|
|
|
|
|
|
|
|||||||||||
| Loss before income taxes |
(24,924 | ) | (1,047 | ) | (12,659 | ) | (30,749 | ) | (1,029 | ) | ||||||||||
| Income tax (benefit) expense |
(5,358 | ) | (1,325 | ) | (4,733 | ) | (1,294 | ) | 812 | |||||||||||
|
|
|
|
|
|
|
|
|
|
|
|||||||||||
| Net loss |
$ | (19,566 | ) | $ | 278 | $ | (7,926 | ) | $ | (29,455 | ) | $ | (1,841 | ) | ||||||
|
|
|
|
|
|
|
|
|
|
|
|||||||||||
| Balance Sheet Data (at period end): |
||||||||||||||||||||
| Cash and cash equivalents |
$ | 23,393 | $ | 10,662 | $ | 2,216 | ||||||||||||||
| Total assets |
$ | 1,274,323 | $ | 763,387 | $ | 274,280 | ||||||||||||||
| Long-term obligations(1) |
$ | 725,123 | $ | 300,315 | $ | 178,301 | ||||||||||||||
| Total member's equity |
$ | 338,198 | $ | 290,751 | $ | 45,912 | ||||||||||||||
| (1) | Long-term obligations includes long-term portion of notes payable, net of debt issuance costs and inclusive of long-term capital lease obligations. For September 30, 2016, long-term obligations also includes the asset-based credit facility of $190.0 million. |
62
Table of Contents
UNAUDITED PRO FORMA CONDENSED COMBINED FINANCIAL INFORMATION
The following unaudited pro forma condensed combined financial information presents our unaudited pro forma condensed combined statements of operations for the nine months ended September 30, 2016 and 2015 and for the year ended December 31, 2015 and our unaudited pro forma condensed combined balance sheet as of September 30, 2016. The unaudited pro forma condensed combined statements of operations give effect to the Pro Forma Transactions, as described below, as if they occurred on January 1, 2015. The unaudited pro forma condensed combined balance sheet gives effect to the impacts of this offering as if it had occurred on September 30, 2016.
The unaudited pro forma condensed combined financial information has been prepared in accordance with Article 11 of Regulation S-X, by aggregating our historical predecessor and successor consolidated financial statements and the historical financial statements of Winroc-SPI, Ken API, GSCIL and Great Western, each contained elsewhere in this prospectus, and making pro forma adjustments to such aggregated financial data to give effect to each of the Pro Forma Transactions. The pro forma adjustments are based on the information available at the time of the preparation of this prospectus and give effect to events that are directly attributable to the Pro Forma Transactions, are factually supportable and, with respect to our statements of operations, are expected to have a continuing impact.
The Pro Forma Transactions consist of each of the following:
| • | the Lone Star Acquisition; |
| • | the acquisition of Winroc-SPI which occurred on August 9, 2016, or the Winroc-SPI Acquisition, and the conversion of Winroc-SPI’s financial statements from IFRS to GAAP; |
| • | the acquisition of Ken API which occurred on May 31, 2016; |
| • | the acquisition of GSCIL which occurred on December 30, 2015; |
| • | the acquisition of Great Western which occurred on March 13, 2015; |
| • | the issuance of the $575.0 million of Notes, the entry into the ABL Credit Facility and borrowings thereunder of $190.0 million and the repayment in full of the outstanding indebtedness under our then-existing asset based revolving credit facility and senior term loan and junior term loan facilities, or collectively, the 2015 Credit Facilities, or collectively, the Refinancing Transactions; |
| • | the impacts of the tax receivable agreement described in the section entitled “Certain Relationships and Related Party Transactions—Tax Receivable Agreement;” and |
| • | the completion of this offering and the anticipated use of proceeds as described in greater detail in the section entitled “Use of Proceeds.” |
The pro forma adjustments for the Lone Star Acquisition and other acquisitions above include the removal of the associated acquisition related expenses and inclusion of depreciation of acquired fixed assets and amortization of definite lived intangible assets in the unaudited pro forma condensed combined statements of operations for each of the periods presented.
The Other Acquisitions are not reflected in the unaudited pro forma condensed combined financial information as they were not considered significant acquisitions as defined by Regulation S-X. The post-acquisition net sales of the Other Acquisitions for the nine months ended September 30, 2016 totaled $17.2 million. The table below summarizes unaudited total net sales, net income and EBITDA of the Other Acquisitions for the respective portions of the nine months ended September 30, 2016 and 2015, and the year ended December 31, 2015
63
Table of Contents
occurring prior to our acquisition of such businesses. As it relates to these acquisitions, we expect to realize synergies through cost savings related to compensation and headcount reductions and application of favorable pricing terms under our supplier programs that we expect would have resulted in approximately $2.4 million, $3.8 million and $6.2 million of cost savings for the nine months ended September 30, 2016 and 2015 and the year ended December 31, 2015, respectively.
| Unaudited (In Thousands) | ||||||||||||
| Nine Months Ended 9/30/2016 |
Nine Months Ended 9/30/2015 |
Year Ended 12/31/2015 |
||||||||||
| Net sales |
$ | 38,128 | $ | 52,440 | $ | 70,039 | ||||||
| Net Income |
$ | 2,384 | $ | 3,408 | $ | 3,554 | ||||||
| Interest |
120 | 134 | 223 | |||||||||
| Taxes |
51 | 345 | 385 | |||||||||
| Depreciation and amortization |
447 | 533 | 756 | |||||||||
|
|
|
|
|
|
|
|||||||
| EBITDA |
$ | 3,002 | $ | 4,420 | $ | 4,917 | ||||||
|
|
|
|
|
|
|
|||||||
The pre-acquisition unaudited financial data for the Other Acquisitions has been prepared by management in place at each acquired entity prior to their respective acquisition dates. The information presented does not include the effect of the purchase price allocation and as such is not reflective of the post-acquisition results to be recorded by us. Our independent registered public accounting firm, Deloitte & Touche LLP, has not audited, reviewed or performed any procedures with respect to the unaudited financial data for the Other Acquisitions. Pre-acquisition results for the Other Acquisitions are derived from unaudited historical financial information provided to us in connection with our due diligence review of the Other Acquisitions and has not been independently audited or reviewed. Any audit or review of this financial data may require adjustments to be made to the unaudited financial results presented above for the Other Acquisitions, and such adjustments could be material. We cannot assure you that the financial data presented above would not be materially different if independently audited or reviewed. See “Risk Factors—Risks Relating to Our Business and Industry.”
The unaudited pro forma condensed combined financial information is presented for illustrative and informative purposes only and is not intended to represent or be indicative of what our results of operations or financial position would have been had the Pro Forma Transactions actually occurred on the dates indicated. In addition, the unaudited pro forma condensed combined financial information for any interim period is not necessarily indicative of what our results of operations will be for the complete period. The unaudited pro forma condensed combined financial information should be read in conjunction with the information contained in the sections entitled “Selected Historical Consolidated Financial Data,” “Capitalization” and “Management’s Discussion and Analysis of Financial Condition and Results of Operations” and the audited and unaudited financial statements and the notes thereto included elsewhere in this prospectus. The unaudited pro forma condensed combined financial information should not be considered representative of our future results of operations or financial position.
Our recent acquisitions have been accounted for as business combinations in accordance with Accounting Standards Codification 805, Business Combinations. For business combinations, the total purchase price for an acquisition is allocated to the tangible and intangible assets acquired based upon their respective fair values measured on the applicable closing date. Specifically as it relates to the acquisitions of Winroc-SPI and Ken API, the amounts reflected in the unaudited pro forma condensed combined financial information below
64
Table of Contents
reflect our preliminary estimates of the purchase price allocation and are therefore subject to adjustment. The results of the final purchase price allocation for these entities could be materially different from the preliminary allocation set forth in this prospectus.
Cost Not Included in Pro Forma Financial Information
While the accompanying pro forma condensed financial statements give effect to the Pro Forma Transactions, they do not reflect the full impact of planned cost savings or other synergies following the consummation of the acquisitions nor do they reflect adjustments for charges that have been or will be incurred in connection with these transactions other than adjustments to the pro forma statements of operations for transaction-related expenses of $12.7 million, $17.6 million and $48.9 million for the nine months ending September 30, 2016 and September 30, 2015 and year ending December 31, 2015, respectively, which were included in the historical financial statements of the Company and the acquired entities.
Assumptions underlying the pro forma adjustments are described in the accompanying notes, which should be read in conjunction with these unaudited pro forma condensed combined financial statements.
65
Table of Contents
LSF9 CYPRESS HOLDINGS, LLC
UNAUDITED PRO FORMA CONDENSED COMBINED BALANCE SHEET
AS OF SEPTEMBER 30, 2016
(in thousands)
| Historical LSF9 Cypress Holdings, LLC and Subsidiaries |
Offering Adjustments(11) |
Pro Forma Total (as adjusted) |
||||||||||
| ASSETS |
||||||||||||
| Current assets: |
||||||||||||
| Cash |
$ | 23,393 | $ | 17,235 | $ | 40,628 | ||||||
| Accounts receivable, net of allowance for doubtful accounts |
287,567 | — | 287,567 | |||||||||
| Other receivables |
35,686 | — | 35,686 | |||||||||
| Related party receivables |
— | — | — | |||||||||
| Inventories |
153,855 | — | 153,855 | |||||||||
| Prepaids and other current assets |
9,959 | — | 9,959 | |||||||||
|
|
|
|
|
|
|
|||||||
| Total current assets |
510,460 | 17,235 | 527,695 | |||||||||
| Property and equipment, net |
145,007 | — | 145,007 | |||||||||
| Intangible assets |
214,430 | — | 214,430 | |||||||||
| Goodwill |
396,532 | — | 396,532 | |||||||||
| Other assets |
7,894 | — | 7,894 | |||||||||
|
|
|
|
|
|
|
|||||||
| Total assets |
$ | 1,274,323 | $ | 17,235 | $ | 1,291,558 | ||||||
|
|
|
|
|
|
|
|||||||
| LIABILITIES AND MEMBER'S EQUITY |
||||||||||||
| Current liabilities: |
||||||||||||
| Accounts payable |
$ | 132,087 | $ | — | $ | 132,087 | ||||||
| Accrued payroll and employee benefits |
25,699 | — | 25,699 | |||||||||
| Accrued taxes |
9,844 | — | 9,844 | |||||||||
| Other current liabilities |
28,741 | (189 | ) | 28,552 | ||||||||
|
|
|
|
|
|
|
|||||||
| Total current liabilities |
196,371 | — | 196,182 | |||||||||
| Asset-based credit facility |
190,000 | (190,000 | ) | — | ||||||||
| Long-term portion of notes payable, net |
523,403 | — | 523,403 | |||||||||
| Tax receivable agreement liability |
— | 205,000 | 205,000 | |||||||||
| Deferred income taxes, net |
8,413 | — | 8,413 | |||||||||
| Other liabilities |
17,938 | — | 17,938 | |||||||||
|
|
|
|
|
|
|
|||||||
| Total liabilities |
936,125 | 14,811 | 950,936 | |||||||||
| Commitments and contingencies |
||||||||||||
| Undesignated preferred stock, par value $0.001 per share: no shares authorized, issued or outstanding, actual; 10,000,000 shares authorized, no shares issued and outstanding pro forma |
— | — | — | |||||||||
| Common stock, par value $0.001 per share; no shares authorized, issued or outstanding, actual; 190,000,000 shares authorized, 42,774,239 shares issued and outstanding pro forma |
— | 43 | 43 | |||||||||
| Member's equity |
364,815 | (364,815 | ) | — | ||||||||
| Additional paid in capital |
— | 367,196 | 367,196 | |||||||||
| Accumulated other comprehensive income |
875 | — | 875 | |||||||||
| Accumulated deficit |
(27,492 | ) | — | (27,492 | ) | |||||||
|
|
|
|
|
|
|
|||||||
| Total liabilities and member's equity |
$ | 1,274,323 | $ | 17,235 | $ | 1,291,558 | ||||||
|
|
|
|
|
|
|
|||||||
See accompanying notes to the unaudited pro forma condensed combined financial information.
66
Table of Contents
LSF9 CYPRESS HOLDINGS, LLC
UNAUDITED PRO FORMA CONDENSED COMBINED STATEMENT OF OPERATIONS
FOR THE NINE MONTHS ENDED SEPTEMBER 30, 2016
(in thousands)
| Historical LSF9 Cypress Holdings, LLC and Subsidiaries |
Winroc-SPI | Ken API | Acquisition Related Adjustments |
Pro Forma Related to Acquisitions |
Offering Adjustments(11) |
Pro Forma Total (as adjusted) |
||||||||||||||||||||||
| Net sales |
$ | 930,315 | $ | 463,398 | $ | 23,644 | $ | — | $ | 1,417,357 | $ | — | $ | 1,417,357 | ||||||||||||||
| Cost of goods sold (exclusive of depreciation and amortization) |
665,767 | 345,567 | 16,413 | (4,911 | )(1)(2) | 1,022,836 | — | 1,022,836 | ||||||||||||||||||||
|
|
|
|
|
|
|
|
|
|
|
|
|
|
|
|||||||||||||||
| Gross profit |
264,548 | 117,831 | 7,231 | 4,911 | 394,521 | — | 394,521 | |||||||||||||||||||||
| Operating expenses: |
||||||||||||||||||||||||||||
| Selling, general and administrative expenses |
206,280 | 104,459 | 5,123 | (331 | )(2)(3)(4)(5) | 315,531 | — | 315,531 | ||||||||||||||||||||
| Depreciation and amortization |
33,605 | — | 517 | 14,776 | (2)(6)(7)(8) | 48,898 | — | 48,898 | ||||||||||||||||||||
| Acquisition related expenses |
12,478 | — | — | (12,478 | )(4) | — | — | — | ||||||||||||||||||||
|
|
|
|
|
|
|
|
|
|
|
|
|
|
|
|||||||||||||||
| Total operating expenses |
252,363 | 104,459 | 5,640 | 1,967 | 364,429 | — | 364,429 | |||||||||||||||||||||
| Income from operations |
12,185 | 13,372 | 1,591 | 2,944 | 30,092 | — | 30,092 | |||||||||||||||||||||
| Interest expense |
(37,202 | ) | (8,259 | ) | (100 | ) | (1,114 | )(3)(9) | (46,675 | ) | 2,494 | (44,181 | ) | |||||||||||||||
| Other income (expense), net |
93 | 5,142 | — | — | 5,235 | — | 5,235 | |||||||||||||||||||||
|
|
|
|
|
|
|
|
|
|
|
|
|
|
|
|||||||||||||||
| Income (loss) before income taxes |
(24,924 | ) | 10,255 | 1,491 | 1,830 | (11,348 | ) | 2,494 | (8,854 | ) | ||||||||||||||||||
| Income tax (benefit) expense |
(5,358 | ) | 3,837 | — | 1,163 | (10) | (358 | ) | 873 | 515 | ||||||||||||||||||
|
|
|
|
|
|
|
|
|
|
|
|
|
|
|
|||||||||||||||
| Net income (loss) |
$ | (19,566 | ) | $ | 6,418 | $ | 1,491 | $ | 667 | $ | (10,990 | ) | 1,621 | $ | (9,369 | ) | ||||||||||||
|
|
|
|
|
|
|
|
|
|
|
|
|
|
|
|||||||||||||||
| Pro forma net loss per share(12) |
||||||||||||||||||||||||||||
| Basic |
$ | (0.22 | ) | |||||||||||||||||||||||||
| Diluted |
$ | (0.22 | ) | |||||||||||||||||||||||||
| Pro forma weighted average shares outstanding(12) |
||||||||||||||||||||||||||||
| Basic |
42,774,239 | |||||||||||||||||||||||||||
| Diluted |
42,774,239 | |||||||||||||||||||||||||||
See accompanying notes to the unaudited pro forma condensed combined financial information.
67
Table of Contents
LSF9 CYPRESS HOLDINGS, LLC
UNAUDITED PRO FORMA CONDENSED COMBINED STATEMENT OF OPERATIONS
FOR THE NINE MONTHS ENDED SEPTEMBER 30, 2015
(in thousands)
| Historical LSF9 Cypress Holdings, LLC and Subsidiaries |
Winroc-SPI | Ken API | GSCIL | Great Western |
Acquisition Related Adjustments |
Pro Forma Related to Acquisitions |
Offering Adjustments(11) |
Pro Forma Total (as adjusted) |
||||||||||||||||||||||||||||
| Net sales |
$ | 608,964 | $ | 562,841 | $ | 41,136 | $ | 81,412 | $ | 32,474 | $ | — | $ | 1,326,827 | $ | — | $ | 1,326,827 | ||||||||||||||||||
| Cost of goods sold (exclusive of depreciation and amortization) |
440,539 | 422,565 | 29,412 | 56,515 | 24,078 | (7,757 | )(1)(2) | 965,352 | — | 965,352 | ||||||||||||||||||||||||||
|
|
|
|
|
|
|
|
|
|
|
|
|
|
|
|
|
|
|
|||||||||||||||||||
| Gross profit |
168,425 | 140,276 | 11,724 | 24,897 | 8,396 | 7,757 | 361,475 | — | 361,475 | |||||||||||||||||||||||||||
| Operating expenses: |
||||||||||||||||||||||||||||||||||||
| Selling, general and administrative expenses |
126,102 | 119,557 | 8,729 | 18,595 | 13,645 | (7,298 | )(2)(3)(4)(5) | 279,330 | — | 279,330 | ||||||||||||||||||||||||||
| Depreciation and amortization |
15,125 | — | 900 | 1,182 | 233 | 25,768 | (2)(6)(7)(8) | 43,208 | — | 43,208 | ||||||||||||||||||||||||||
| Acquisition related expenses |
12,542 | — | — | — | — | (12,542 | )(4) | — | — | — | ||||||||||||||||||||||||||
|
|
|
|
|
|
|
|
|
|
|
|
|
|
|
|
|
|
|
|||||||||||||||||||
| Total operating expenses |
153,769 | 119,557 | 9,629 | 19,777 | 13,878 | 5,928 | 322,538 | — | 322,538 | |||||||||||||||||||||||||||
| Income (loss) from operations |
14,656 | 20,719 | 2,095 | 5,120 | (5,482 | ) | 1,829 | 38,937 | — | 38,937 | ||||||||||||||||||||||||||
| Interest expense |
(15,717 | ) | (10,121 | ) | (279 | ) | (163 | ) | (120 | ) | (19,590 | )(3)(9) | (45,990 | ) | 2,494 | (43,496 | ) | |||||||||||||||||||
| Other income (expense), net |
14 | (6,241 | ) | — | 77 | — | — | (6,150 | ) | — | (6,150 | ) | ||||||||||||||||||||||||
|
|
|
|
|
|
|
|
|
|
|
|
|
|
|
|
|
|
|
|||||||||||||||||||
| Income (loss) before income taxes |
(1,047 | ) | 4,357 | 1,816 | 5,034 | (5,602 | ) | (17,761 | ) | (13,203 | ) | 2,494 | (10,709 | ) | ||||||||||||||||||||||
| Income tax (benefit) expense |
(1,325 | ) | 2,246 | — | — | — | (4,820 | )(10) | (3,899 | ) | 873 | (3,026 | ) | |||||||||||||||||||||||
|
|
|
|
|
|
|
|
|
|
|
|
|
|
|
|
|
|
|
|||||||||||||||||||
| Net income (loss) |
$ | 278 | $ | 2,111 | $ | 1,816 | $ | 5,034 | $ | (5,602 | ) | $ | (12,941 | ) | $ | (9,304 | ) | $ | 1,621 | $ | (7,683 | ) | ||||||||||||||
|
|
|
|
|
|
|
|
|
|
|
|
|
|
|
|
|
|
|
|||||||||||||||||||
| Pro forma net loss per share(12) |
||||||||||||||||||||||||||||||||||||
| Basic |
$ | (0.18 | ) | |||||||||||||||||||||||||||||||||
| Diluted |
$ | (0.18 | ) | |||||||||||||||||||||||||||||||||
| Pro forma weighted average shares outstanding(12) |
||||||||||||||||||||||||||||||||||||
| Basic |
42,774,239 | |||||||||||||||||||||||||||||||||||
| Diluted |
42,774,239 | |||||||||||||||||||||||||||||||||||
See accompanying notes to the unaudited pro forma condensed combined financial information.
68
Table of Contents
LSF9 CYPRESS HOLDINGS, LLC
UNAUDITED PRO FORMA CONDENSED COMBINED STATEMENT OF OPERATIONS
FOR THE YEAR ENDED DECEMBER 31, 2015
(in thousands)
| Historical LSF9 Cypress Holdings, LLC and Subsidiaries |
Winroc-SPI | Ken API |
GSCIL | Great Western |
Acquisition Related Adjustments |
Pro Forma Related to Acquisitions |
Offering Adjustments(11) |
Pro Forma Total (as adjusted) |
||||||||||||||||||||||||||||
| Net sales |
$ | 820,605 | $ | 745,309 | $ | 54,990 | $ | 107,715 | $ | 32,474 | $ | — | $ | 1,761,093 | $ | — | $ | 1,761,093 | ||||||||||||||||||
| Cost of goods sold (exclusive of depreciation and amortization) |
596,242 | 560,283 | 38,661 | 72,741 | 24,078 | (10,139 | )(1)(2) | 1,281,866 | — | 1,281,866 | ||||||||||||||||||||||||||
|
|
|
|
|
|
|
|
|
|
|
|
|
|
|
|
|
|
|
|||||||||||||||||||
| Gross profit |
224,363 | 185,026 | 16,329 | 34,974 | 8,396 | 10,139 | 479,227 | — | 479,227 | |||||||||||||||||||||||||||
| Operating expenses: |
||||||||||||||||||||||||||||||||||||
| Selling, general and administrative expenses |
175,720 | 157,535 | 11,520 | 26,689 | 13,645 | (8,976 | )(2)(3)(4)(5) | 376,133 | — | 376,133 | ||||||||||||||||||||||||||
| Depreciation and amortization |
22,785 | — | 1,159 | 1,551 | 233 | 31,826 | (2)(6)(7)(8) | 57,554 | — | 57,554 | ||||||||||||||||||||||||||
| Acquisition related expenses |
43,155 | — | — | — | — | (43,155 | )(4) | — | — | — | ||||||||||||||||||||||||||
|
|
|
|
|
|
|
|
|
|
|
|
|
|
|
|
|
|
|
|||||||||||||||||||
| Total operating expenses |
241,660 | 157,535 | 12,679 | 28,240 | 13,878 | (20,305 | ) | 433,687 | — | 433,687 | ||||||||||||||||||||||||||
|
|
|
|
|
|
|
|
|
|
|
|
|
|
|
|
|
|
|
|||||||||||||||||||
| Income (loss) from operations |
(17,297 | ) | 27,491 | 3,650 | 6,734 | (5,482 | ) | 30,444 | 45,540 | — | 45,540 | |||||||||||||||||||||||||
| Interest expense |
(26,134 | ) | (13,515 | ) | (368 | ) | (183 | ) | (120 | ) | (21,091 | )(3)(9) | (61,411 | ) | 3,325 | (58,086 | ) | |||||||||||||||||||
| Other income (expense)—net |
23 | (6,570 | ) | — | — | — | — | (6,547 | ) | — | (6,547 | ) | ||||||||||||||||||||||||
|
|
|
|
|
|
|
|
|
|
|
|
|
|
|
|
|
|
|
|||||||||||||||||||
| Income (loss) before income taxes |
(43,408 | ) | 7,406 | 3,282 | 6,551 | (5,602 | ) | 9,353 | (22,418 | ) | 3,325 | (19,093 | ) | |||||||||||||||||||||||
| Income tax expense (benefit) |
(6,027 | ) | 3,251 | — | — | — | (4,234 | )(10) | (7,010 | ) | 1,164 | (5,846 | ) | |||||||||||||||||||||||
|
|
|
|
|
|
|
|
|
|
|
|
|
|
|
|
|
|
|
|||||||||||||||||||
| Net income (loss) |
$ | (37,381 | ) | $ | 4,155 | $ | 3,282 | $ | 6,551 | $ | (5,602 | ) | $ | 13,587 | $ | (15,408 | ) | $ | 2,161 | $ | (13,247 | ) | ||||||||||||||
|
|
|
|
|
|
|
|
|
|
|
|
|
|
|
|
|
|
|
|||||||||||||||||||
| Pro forma net loss per share(12) |
||||||||||||||||||||||||||||||||||||
| Basic |
$ | (0.31 | ) | |||||||||||||||||||||||||||||||||
| Diluted |
$ | (0.31 | ) | |||||||||||||||||||||||||||||||||
| Pro forma weighted average shares outstanding(12) |
||||||||||||||||||||||||||||||||||||
| Basic |
42,774,239 | |||||||||||||||||||||||||||||||||||
| Diluted |
42,774,239 | |||||||||||||||||||||||||||||||||||
See accompanying notes to the unaudited pro forma condensed combined financial information.
69
Table of Contents
NOTES TO THE UNAUDITED PRO FORMA CONDENSED COMBINED FINANCIAL STATEMENTS
| (1) | Reflects the immediate application of the Company’s more favorable supplier purchasing program to the pre-acquisition inventory purchases of the businesses acquired by the Company. The adjustment reflects renegotiated vendor rebate programs as a result of the acquisitions. The impact of the adjustment is recorded in Cost of goods sold (exclusive of depreciation and amortization). |
| Nine months ended September 30, 2016 |
Nine months ended September 30, 2015 |
Year ended December 31, 2015 |
||||||||||
| (in thousands) | ||||||||||||
| Purchase cost savings |
$ | 2,520 | $ | 3,400 | $ | 4,587 | ||||||
| (2) | Reflects adjustments to conform the financial statements of Winroc-SPI to the accounting policies of the Company. The adjustments include a reclassification of freight and delivery costs from Costs of goods sold (exclusive of depreciation and amortization) to Selling, general and administrative expenses and a reclassification of depreciation expense from Selling, general and administrative expenses to Depreciation and amortization. |
| Nine months ended September 30, 2016 |
Nine months ended September 30, 2015 |
Year ended December 31, 2015 |
||||||||||
| (in thousands) | ||||||||||||
| Winroc -SPI reclassifications |
||||||||||||
| Freight and delivery |
$ | 2,391 | $ | 4,357 | $ | 5,552 | ||||||
| Depreciation |
3,684 | 4,360 | 5,826 | |||||||||
| (3) | Reflects adjustments to conform accounting for leases in the Winroc-SPI historical financial statements presented under IFRS to GAAP. The result is the reclassification of certain finance leases to operating leases under GAAP. |
| Nine months ended September 30, 2016 |
Nine months ended September 30, 2015 |
Year ended December 31, 2015 |
||||||||||
| (in thousands) | ||||||||||||
| Increase (decrease) under GAAP |
||||||||||||
| Rental Expense(a) |
$ | 947 | $ | 1,350 | $ | 1,842 | ||||||
| Interest Expense(a) |
(138 | ) | (174 | ) | (232 | ) | ||||||
| (a) | Under IFRS, the leases were recorded as finance leases which resulted in recording of amortization and interest expense. The leases are accounted for as operating leases under GAAP. As the Winroc-SPI property, plant and equipment was valued on a GAAP basis, no adjustment is needed for amortization within this pro forma financial information. Rental expense is recorded in Selling, general and administrative expenses and interest expense is reflected in Interest expense. |
| (4) | Represents the elimination of acquisition related expenses associated with the acquisitions of Winroc-SPI, Ken API, Great Western and GSCIL and the Lone Star Acquisition. Acquisition related expenses have been reflected on a separate line item as well as within Selling, general and administrative expenses. The adjustment to Selling, general and administrative expenses was $0.2 million, $5.1 million and $5.7 million for the periods ended September 30, 2016, September 30, 2015 and December 31, 2015, respectively. |
| (5) | Represents compensation adjustments related to a contractual reduction in post-acquisition salaries and the discontinued executive incentive compensation plan associated with the acquisitions of GSCIL and Winroc-SPI. The discontinued executive compensation plan was |
70
Table of Contents
| tied to the Winroc-SPI parent company’s stock price, and resulted in a $0.2 million gain recorded in the historical financial statements for the nine months ended September 30, 2016, compared to expenses in the historical financial statements for the nine months ended September 30, 2015 and year ended December 31, 2015. |
| Nine months ended September 30, 2016 |
Nine months ended September 30, 2015 |
Year ended December 31, 2015 |
||||||||||
| (in thousands) | ||||||||||||
| Contractual reduction in post acquisition salaries |
$ | — | $ | (2,168 | ) | $ | (3,287 | ) | ||||
| Discontinued executive incentive compensation plan |
240 | (1,377 | ) | (1,517 | ) | |||||||
|
|
|
|
|
|
|
|||||||
| Pro forma adjustment |
$ | 240 | $ | (3,545 | ) | $ | (4,804 | ) | ||||
|
|
|
|
|
|
|
|||||||
| (6) | Represents adjustments for amortization of intangibles associated with the Lone Star Acquisition and acquisitions of Winroc-SPI, Ken API and GSCIL. The amortization periods for trade names and customer relationships are approximately five years and six years, respectively. The estimate is preliminary, subject to change and could vary materially from the actual adjustment at the time purchase accounting is completed. For each 10% increase in the fair value adjustment to intangibles, the Company would expect an annual increase in amortization expense approximating $4.0 million, assuming a weighted-average life across trade names and customer relationships of approximately 6 years. |
| Nine months ended September 30, 2016 |
Nine months ended September 30, 2015 |
Year ended December 31, 2015 |
||||||||||
| (in thousands) | ||||||||||||
| Trade names |
$ | — | $ | 2,415 | $ | 3,220 | ||||||
| Customer relationships |
9,424 | 27,470 | 36,627 | |||||||||
|
|
|
|
|
|
|
|||||||
| Total pro forma amortization |
9,424 | 29,885 | 39,847 | |||||||||
| Less: historical amortization |
— | (7,753 | ) | (13,273 | ) | |||||||
|
|
|
|
|
|
|
|||||||
| Net pro forma adjustment |
$ | 9,424 | $ | 22,132 | $ | 26,574 | ||||||
|
|
|
|
|
|
|
|||||||
| (7) | Represents adjustments to depreciation expense for the Lone Star Acquisition and the acquisitions of Winroc-SPI, Ken API and GSCIL. The impact to total depreciation expense is as follows: |
| Nine months ended September 30, 2016 |
Nine months ended September 30, 2015 |
Year ended December 31, 2015 |
||||||||||
| (in thousands) | ||||||||||||
| Buildings |
$ | 26 | $ | 338 | $ | 450 | ||||||
| Leasehold improvements |
556 | 1,178 | 1,571 | |||||||||
| Computer hardware and software |
282 | 455 | 606 | |||||||||
| Vehicles and equipment |
4,273 | 9,849 | 13,132 | |||||||||
| Furniture and fixtures |
70 | 160 | 213 | |||||||||
| Machinery and equipment |
580 | 991 | 1,321 | |||||||||
|
|
|
|
|
|
|
|||||||
| Total pro forma depreciation |
5,787 | 12,971 | 17,293 | |||||||||
| Less: historical depreciation |
4,201 | 14,006 | 18,281 | |||||||||
|
|
|
|
|
|
|
|||||||
| Net pro forma adjustment |
$ | 1,586 | $ | (1,035 | ) | $ | (988 | ) | ||||
|
|
|
|
|
|
|
|||||||
71
Table of Contents
| (8) | Represents the additional amortization expense associated with favorable/unfavorable leases related to the Lone Star Acquisition and the Winroc-SPI Acquisition. The pro forma adjustment for each period reflects the amortization of the net favorable lease asset over the expected lives of the leases, which approximates the period of time that the favorable / unfavorable lease terms will be in effect. The weighted average expected life of the favorable leases was 8.3 years whereas the weighted average expected life of the unfavorable leases was 5.3 years. |
| (in thousands) | Nine months ended September 30, 2016 |
Nine months ended September 30, 2015 |
Year ended December 31, 2015 |
|||||||||
| Favorable leases amortization expense |
$ | 166 | $ | 421 | $ | 561 | ||||||
| Unfavorable leases amortization expense |
(84 | ) | (110 | ) | (147 | ) | ||||||
|
|
|
|
|
|
|
|||||||
| Net pro forma adjustment |
$ | 82 | $ | 311 | $ | 414 | ||||||
|
|
|
|
|
|
|
|||||||
| (9) | Represents adjustments to reflect: |
| • | recognition of interest expense attributable to the Notes and the ABL Credit Facility; |
| • | amortization of fees and expenses attributable to the Notes; and |
| • | recognition of commitment fees on unused amounts attributable to the ABL Credit Facility. |
| (in thousands) | Principal | Weighted average interest rate |
Weighted average term of debt |
|||||||||
| Senior Secured Notes due 2021 |
$ | 575,000 | 8.25 | % | 5 years | |||||||
| ABL Credit Facility |
190,000 | 2.00 | % | 4.5 years | ||||||||
|
|
|
|||||||||||
| Total |
$ | 765,000 | ||||||||||
|
|
|
|||||||||||
For the purposes of the unaudited pro forma combined statements of operations, we have assumed that the outstanding borrowings under the ABL Credit Facility will bear interest at an interest rate of 2.00%. The ABL Credit Facility has a floating interest rate based on LIBOR plus a spread that is defined by borrowing availability under the facility.
For the purposes of the unaudited pro forma condensed combined statements of operations, we have assumed that the commitment fee on the ABL Credit Facility, which is payable quarterly in arrears, is at a rate of 0.25% on the unused commitments.
72
Table of Contents
The following table summarizes the adjustments in the unaudited pro forma condensed combined statements of operations to reflect the adjustments to interest expense on third party debt:
| Nine months ended September 30, 2016 |
Nine months ended September 30, 2015 |
Year ended December 31, 2015 |
||||||||||
| Senior Secured Notes due 2021 |
$ | 35,578 | $ | 35,578 | $ | 47,438 | ||||||
| ABL Credit Facility |
3,056 | 3,056 | 4,075 | |||||||||
|
|
|
|
|
|
|
|||||||
| Cash interest expense |
38,634 | 38,634 | 51,513 | |||||||||
| Interest expense on existing indebtedness |
(45,023 | ) | (25,846 | ) | (39,562 | ) | ||||||
| Amortization of debt discounts and debt issuance costs |
7,641 | 6,976 | 9,372 | |||||||||
|
|
|
|
|
|
|
|||||||
| Net pro forma adjustment |
$ | 1,252 | $ | 19,764 | $ | 21,323 | ||||||
|
|
|
|
|
|
|
|||||||
Fees and expenses attributable to the Notes are amortized on an effective yield basis over the life of the related debt. Fees and expenses attributable to the ABL Credit Facility are amortized on a straight-line basis over the term of the facility. A change of one-eighth of 1% (12.5 basis points) in the interest rate associated with the floating rate borrowings would result in an additional annual interest expense of approximately $0.2 million (in the case of an increase to the rate) or an annual reduction of interest expense of approximately $0.2 million (in the case of a decrease in the rate).
| (10) | The U.S. federal statutory tax rate of 35% has been used to reflect the additional estimated income tax expense related to acquired entities that were previously pass through tax entities, including Ken API, GSCIL and Great Western, as well as the impact of pro forma adjustments. This rate does not reflect the Company’s effective tax rate, which includes other tax adjustments, such as state and foreign taxes, as well as other tax charges or benefits, and does not take into account any historical or possible future tax events that may impact the Company. |
| (11) | Upon completion of this offering, we will issue and sell shares of common stock and receive net proceeds, after deducting estimated offering expenses payable by us and underwriting discounts and commissions of approximately $207.4 million, assuming an initial offering price of $18.00 per share (the midpoint of the estimated initial public offering price range set forth on the cover page of this prospectus) in connection therewith and the use of proceeds as described in greater detail in the section entitled “Use of Proceeds.” |
We intend to use $190.0 million of the net proceeds received by us from this offering to repay amounts outstanding under the ABL Credit Facility. This results in an increase to Cash of $17.2 million, a decrease in long-term indebtedness of $190.0 million and an increase of $42,774 and $207.4 million to Common stock and Additional paid in capital, respectively, in the unaudited pro forma condensed combined balance sheet. We intend to use the remaining net proceeds for working capital and for general corporate purposes. For more detail, see the section entitled “Use of Proceeds.” The repayment would result in the following pro forma adjustments to eliminate interest expense and the related income tax benefit in the unaudited pro forma condensed combined statement of operations.
73
Table of Contents
| Nine months ended September 30, 2016 |
Nine months ended September 30, 2016 |
Year ended December 31, 2015 |
||||||||||
| (in thousands) | ||||||||||||
| (Increase) decrease |
||||||||||||
| Interest expense |
$ | 2,494 | $ | 2,494 | $ | 3,325 | ||||||
| Income tax (benefit) expense |
873 | 873 | 1,164 | |||||||||
As described in greater detail in the section entitled “Certain Relationships and Related-Party Transactions—Tax Receivable Agreement,” in connection with this offering, we will enter into a tax receivable agreement with Lone Star that will provide for the payment by us to Lone Star of 90% of the amount of Covered Tax Benefits. The anticipated payments under the tax receivable agreement that are related to the Covered Tax Benefits have been reflected in the pro forma adjustments.
For purposes of the tax receivable agreement, the aggregate reduction in income tax payable by us will be computed by comparing our assumed income tax liability with our hypothetical liability had we not been able to utilize the Covered Tax Benefits. The agreement will become effective upon completion of this offering and will remain in effect until all such Covered Tax Benefits remain.
Adjustment also reflects the impact of the tax receivable agreement, as described in the section entitled “Certain Relationships and Related-Party Transactions—Tax Receivable Agreement,” which results in an increase of $205 million in liability to Lone Star and a decrease of $205 million in Additional paid in capital to reflect the distribution to Lone Star. Based upon our preliminary estimates, we estimate that the liability will be between $190 million and $220 million. We considered the following tax attributes when calculating the range of liability in respect of the tax receivable agreement: estimates of net operating losses for the year ended December 31, 2016 and the period from January 1, 2017 through the date of this offering, availability of net operating losses to offset taxable income, valuation metrics which determine the timing and amount of payments under the LTIP, timing of depreciation and amortization deductions related to recently acquired assets and interest calculations under the tax receivable agreement in connection with these factors. We have assumed a liability of $205 million for the pro forma adjustment as of the offering date, which is subject to change. We have provided a range of potential values because there could be movement in any of the tax attributes listed above between now and the date of this offering based on our operating activity through the date of this offering. The liability under the tax receivable agreement will be recorded at the time of this offering, and payments under the agreement generally will be made as covered tax assets are utilized in such a way as to result in a reduction of cash tax paid by us. Payments under the tax receivable agreement generally are determined based on the filing of income tax returns. Unless benefit calculations are contested pursuant to the terms of the tax receivable agreement, payments are expected to be made within three months of the tax filing which gave rise to the payment. Our liability under the tax receivable agreement is not expected to result in material deferred taxes given that this offering does not result in a step up in tax basis. However, deferred taxes associated with the imputed interest component of the tax receivable agreement are expected to result in a deferred tax asset that is less than $10.0 million.
| (12) | The pro forma earnings per share data for the nine months ended September 30, 2016 and September 30, 2015 and year ended December 31, 2015 is based on our historical combined statement of operations after giving effect to the following as if they occurred at the beginning of the period: (1) a 29,974.239 to 1 stock split which will occur prior to the effective date of the registration statement; (2) the Reorganization in which all entities will be consolidated under a new parent entity (Foundation Building Materials, Inc.); and (3) the issuance and sale of the shares of common stock to be issued in the offering. |
74
Table of Contents
MANAGEMENT’S DISCUSSION AND ANALYSIS OF FINANCIAL CONDITION AND RESULTS OF OPERATIONS
You should read the following discussion and analysis of our financial condition and results of operations with the sections entitled “Unaudited Pro Forma Condensed Combined Financial Information” and “Selected Historical Consolidated Financial Information” and the audited and unaudited historical financial statements and related notes included elsewhere in this prospectus. This discussion contains forward-looking statements and involves numerous risks and uncertainties, including but not limited to those described in the section entitled “Risk Factors,” and elsewhere in this prospectus. Actual results may differ materially from those contained in any forward-looking statements.
Overview
We are the second largest specialty distributor of wallboard and suspended ceiling systems in the United States and Canada, and the fastest growing by revenue and branch count since our founding in 2011. We are also the second largest specialty distributor and one of the largest fabricators of commercial and industrial mechanical insulation in the United States. We have expanded from a single branch in Southern California to 210 branches across North America as of December 31, 2016, carrying a broad array of more than 35,000 SKUs. Our organic growth initiatives and disciplined acquisition strategy have enabled us to grow rapidly. Our net sales in 2013 were $113.7 million and we reached pro forma net sales of $1.4 billion for the nine months ended September 30, 2016. We have grown revenue faster than any U.S. publicly traded building products distributor over the same period. Our goal is to be the leading company within specialty building products distribution and to continue expanding into complementary markets.
We were founded in 2011 by our President and Chief Executive Officer Ruben Mendoza, our Chief Financial Officer John Gorey and our California Regional Vice President Tom Fischbeck. Mr. Mendoza previously served as CEO of Acoustical Material Services where he oversaw the successful growth of the company before it was acquired by Allied Building Products, a subsidiary of CRH, in 2007. In founding our company, Mr. Mendoza applied a proven customer-centric operating model to an organization that would combine strong organic growth with an effective acquisition and integration program across a fragmented industry, where he and other members of management had long and close personal relationships with many private acquisition candidates in our industry. In our early years we were focused on opening or acquiring new branches to leverage our founders’ customer focus and strong supplier relationships. In 2012 and 2013, we began rapidly growing through both organic growth and acquisitions, and, by the end of 2013, we significantly increased our number of branches and geographic footprint, and expanded from California into the Midwest, Florida and Arizona. This rapid growth resulted in the acquisition of our current ERP platform and information technology structure and added a deep bench of leaders from the acquired companies to prepare for future growth. In addition, in November 2013, we strengthened our management team with the addition of our Chief Operating Officer Pete Welly, who has 37 years of experience in our industry.
In 2014 and 2015, we expanded into Texas through three acquisitions, and added branches in Iowa, Illinois, Wisconsin, Colorado, Kansas, Missouri, Ohio and Pennsylvania. We also increased our market position in California and Arizona with wallboard and metal framing customers. These acquisitions further strengthened our relationship with key suppliers such as Armstrong and USG, and we became a top customer for Armstrong during this period. To further support our growth and to ensure our sales methodology was used consistently across our branches we implemented a company-wide sales force training curriculum called FBM
75
Table of Contents
University. Our nationwide presence, as well as our ability to achieve operating efficiencies while leveraging a national purchasing platform, led to favorable margin improvement. Beginning in 2015, we also implemented our “One Company” initiative, unifying our brand and culture, centralizing our accounting functions and consolidating our operations under one ERP system.
In August 2016, we entered the Canadian market through our acquisition of Winroc-SPI for cash consideration of $314.1 million, subject to customary working capital adjustments, which increased our revenue and expanded our relationship with Armstrong. Winroc-SPI’s net sales for the year ended December 31, 2015 were $745.3 million. We also became the second largest specialty distributor and one of the largest fabricators of commercial and industrial mechanical insulation in the United States. The expansion into commercial and industrial insulation products both diversified our customer base and allowed us to capitalize on some of the strengths of our proven operating model given that the wallboard and commercial and industrial insulation products have similar business models. The Winroc-SPI Acquisition opened new strategic markets in both the United States and Canada, and added industry leading suspended ceiling systems line to complete the full product package in our key U.S. markets.
Description of Segments
We have defined our operating segments based on management structure and product offerings, concluding we have two reportable segments. Resources are allocated and performance is assessed by our CEO, whom we have determined to be our Chief Operating Decision Maker, or CODM. Management evaluates performance based on gross profit. The reportable segments are described below.
Specialty Building Products
Specialty building products, or SBP, distributes wallboard and accessories, metal framing, suspended ceiling systems and other products. Other products include stucco and EIFS, as well as complimentary offerings, such as tools, safety accessories and fasteners. The primary end markets served are new non-residential, new residential and non-residential repair and remodel construction markets.
Mechanical Insulation
Mechanical insulation, or MI, includes insulation solutions for pipes and mechanical systems and the primary end markets served are new non-residential construction, non- residential repair and remodel construction and industrial markets.
Our Customers
We sell to a diverse and highly fragmented base of over 30,000 customers, which includes commercial, residential and other specialty contractors. In addition to local contractors, we maintain strong relationships with regional construction companies. Further, as we continue to grow nationally and scale our operations, we believe we will continue to enhance our relationship with national homebuilders.
We do not have significant customer concentration, and no one customer accounted for more than 1.5% of our pro forma net sales for the nine months ended September 30, 2016. While our customer base remains fragmented, we have deeply entrenched customer relationships. We have long standing relationships with our customers spanning a period of
76
Table of Contents
19 years on average for our top 20 customers, based on pro forma net sales in 2015 and for the nine months ended September 30, 2016. We believe the tenure of these relationships is a direct result of our well-earned reputation for high-quality customer service and product support.
Our Suppliers
We have been able to foster and sustain key relationships with suppliers as our business has grown. Our increased scale has allowed us to improve our procurement programs, particularly with wallboard, metal framing and commercial and industrial insulation suppliers. In suspended ceiling systems, we maintain exclusive and semi-exclusive distribution rights in key regions, including contractual exclusivity with Armstrong. Our relationship with Armstrong began with our senior management even prior to our founding in 2011, and our acquisitions continued to strengthen this key relationship, particularly our recent acquisition of Winroc-SPI. Throughout this period, Armstrong has supported our growth strategy by renewing or awarding distribution rights following our acquisitions. We are one of the largest customers for each of our top suppliers across wallboard, suspended ceiling systems, metal framing and commercial and industrial insulation.
Our Products
Our early operations started with a narrow product line and group of suppliers, and primarily included wallboard, metal framing and stucco product offerings. The rapid growth from our 2013 acquisitions expanded our product offerings to include suspended ceiling systems supplied by Armstrong and EIFS supplied by Sto. We continue to focus on increasing our sales of other product offerings that enhance our gross margins and create value for our customers. In addition, we continually add to our product offerings to provide our customers with the correct product and when they need it.
In August 2016, the Winroc-SPI Acquisition allowed us to expand our relationship with Armstrong and increase our suspended ceiling systems product line. The acquisition also brought us long-term relationships with commercial and industrial insulation product manufacturers and access to all product lines within their distribution and custom fabrication network.
Factors and Trends Affecting Our Business and Results of Operations
General Economic Conditions and Outlook
Demand for our products is impacted by changes in general economic conditions, including, in particular, conditions in the U.S. commercial construction and housing markets. Our end markets are broadly categorized as new non-residential construction, new residential construction and non-residential repair and remodel construction. We believe each of our end markets is currently in an extended period of recovery following a deep and prolonged recession.
New Non-Residential Construction
Non-residential construction encompasses all construction other than residential structures. Non-residential construction growth is primarily influenced by economic growth, business investment, job growth, vacancy rates and availability and cost of capital. Based on U.S. Census Bureau data, growth in commercial construction spending generally lags new residential spending by approximately 18 months and we believe the commercial construction market
77
Table of Contents
remains in the early stages of a strong recovery. According to Dodge Data & Analytics, non-residential construction starts were 962 million square feet in 2015 and would need to increase by 32.2% to achieve the historical annual market average of 1,273 million square feet since 1970. Given the recent growth in the residential market, management believes that non-residential construction remains in the early stages of its recovery and expects volumes to gain momentum in the coming years. According to Dodge Data & Analytics, non-residential construction starts are expected to grow at approximately a compound annual growth rate, or CAGR, of 5.4% from 2016 to 2018 driven by accommodative underlying macroeconomic growth, greater availability of financing, underinvestment during the downturn and increasing office utilization rates.
New Residential Construction
Job growth is an important factor for a healthy housing market and unemployment has fallen from its peak of 10.0% in 2009 to 5.0% as of September 2016 according to the U.S. Bureau of Labor Statistics. According to the U.S. Bureau of Labor Statistics, total housing starts in 2015 were 1.11 million, an eight-year high and an increase of 10.8% as compared to 2014. While housing starts have significantly recovered from the 0.55 million seen in 2009, they are still 29.8% below the 50-year average of 1.44 million starts per year. The National Association of Homebuilders expect housing starts will grow to approximately 1.37 million by 2018, but still below long-term historical average as reported by the U.S. Census Bureau.
Non-residential Repair and Remodel Construction
Non-residential repair and remodeling spending tends to be resilient through economic downturns as new construction spending slows and investments in existing infrastructure increase. From 2011 to 2015 non-residential repair and remodeling starts grew at a 5.6% CAGR and are expected to continue to grow at a 2.1% annual growth rate through 2018 according to Dodge Data & Analytics.
Industrial
Industrial end markets represent a portion of the U.S. mechanical insulation market. Commercial and industrial insulation products are used in industrial end markets for piping and ducting in facilities. Management estimates that power generation facilities make up the largest component of the industrial end market. Stable demand for insulation is expected as power generators construct new facilities and expand old ones. Global energy consumption has historically grown at a consistent 2.0% CAGR since 1990 and is expected to continue to grow at a 1.7% CAGR through 2020, according to the U.S. Energy and Information Administration.
Volume, Costs and Pricing Programs
Our product costs are directly impacted by fluctuations in supplier pricing and our purchasing capacity. As one of the leading wallboard, suspended ceiling systems and commercial and industrial insulation distributors in the United States and Canada, we are able to negotiate volume discounts and favorable pricing terms with our suppliers. Our acquisitions have historically realized purchasing synergies almost immediately by taking advantage of our volume discounts. Applying our volume discounts to historical purchases of our more significant acquisitions would have resulted in cost savings of $2.5 million and $3.4 million for the nine months ended September 30, 2016 and 2015, respectively, and $4.6 million for the year ended December 31, 2015. As we have continued to grow, we have negotiated with our suppliers on a national level in an effort to maximize these programs across our entire branch network, and expect to continue this trend in the future.
78
Table of Contents
Acquisitions
We supplement our organic growth strategy with selective acquisitions, and since 2013, we have completed 19 acquisitions. We believe that significant opportunities exist to continue to expand our geographic footprint by executing additional strategic acquisitions, and we consistently strive to maintain an extensive and active acquisition pipeline. We generally are evaluating several acquisition opportunities at any given time. In executing our acquisition strategy and integrating acquired companies, we focus on the cost savings we can achieve through integrated procurement and pricing programs and brand consolidation. The table below reflects branches at the acquisition date, some of which have been consolidated as of the date of this offering.
| Company |
Date of Acquisition | # Branches Acquired |
||||||
| Dominion Interior Supply Corporation and Dominion Interior Supply of Roanoke LLC |
January 1, 2017 | 4 | ||||||
| United Drywall Supply, Inc. |
November 30, 2016 | 1 | ||||||
| Winroc-SPI |
August 9, 2016 | 127 | ||||||
| Ken API |
May 31, 2016 | 8 | ||||||
| Kent Gypsum Supply, Inc. |
May 31, 2016 | 4 | ||||||
| Mid America Drywall Supply, Inc. |
April 29, 2016 | 1 | ||||||
| GSCIL |
December 30, 2015 | 14 | ||||||
| Commercial Building Materials, LLC |
December 30, 2015 | 1 | ||||||
| J&B Assets LLC |
July 10, 2015 | 1 | ||||||
| Great Western |
March 13, 2015 | 10 | ||||||
| Bloomington branch of Rose & Walker, Inc. |
January 2, 2015 | 1 | ||||||
| BAV, Inc. |
December 5, 2014 | 2 | ||||||
| Wholesale Builders Supply, Inc. |
May 30, 2014 | 5 | ||||||
| Wagner Distribution Holding Company, Inc. |
May 30, 2014 | 8 | ||||||
| Central Building Materials, LLC |
May 1, 2014 | 2 | ||||||
| Gypsum Supply, Ltd. |
January 31, 2014 | 4 | ||||||
| Home Acres Building Supply Co., LLC |
November 1, 2013 | 34 | ||||||
| Southwest Building Materials, LLC |
November 1, 2013 | 2 | ||||||
| Wallboard & Supply Co., Inc. |
July 31, 2013 | 4 | ||||||
|
|
|
|||||||
| Total |
233 | |||||||
As part of our accounting for our business combinations, we are required to value inventory acquired in the business combination at its net realizable value. The inventory adjustment is typically fully recognized in cost of goods sold within the first two months after completion of an acquisition. We expect this step up in basis and expense of the amount to have a negative effect on margins until fully recognized.
In addition to cost savings related to our supplier programs as discussed above, and in connection with our acquisitions of Winroc-SPI, Ken API, GSCIL and Great Western, we expect to realize synergies through cost savings relating to elimination of redundant overhead costs for corporate functions associated with the planned closure of the Winroc-SPI headquarters and strategic consolidation of branches. We expect these eliminations, combined with the compensation savings described in Note 5 to our Unaudited Pro Forma Condensed Combined Financial Statements, would have resulted in approximately $9.1 million, $14.4 million and $19.5 million in cost savings for the nine months ended September 30, 2016 and 2015, and the year ended December 31, 2015, respectively. We anticipate that the planned closure and consolidations will be completed in the first six months of 2017. We cannot assure you that we will be able to realize such cost savings on this timeline or in the amount we currently anticipate. See “Risk Factors—Risks Relating to Our Business and Industry” and “Forward Looking Statements.”
79
Table of Contents
Seasonality
Our operating results are typically affected by seasonality. Warmer and drier weather during the second and third quarters typically result in higher activity and revenue levels. The first quarter typically has lower levels of activity and lower working capital requirements due to inclement weather conditions.
Financing and Public Company Readiness
As a result of this initial public offering, we will incur additional legal, accounting and other expenses that we did not previously incur, including costs associated with SEC reporting and corporate governance requirements. These requirements include compliance with the Sarbanes-Oxley Act as well as other rules implemented by the SEC and the New York Stock Exchange. Our financial statements following this offering will reflect the impact of these expenses. We have also undertaken the Notes offering described below and other activities in preparation for this initial public offering that involved significant expenses.
Basis of Presentation
On October 9, 2015, investment funds, or affiliates of investment funds, advised, managed or controlled by Lone Star, along with certain members of management, acquired 100% of the outstanding equity of FBM Intermediate Holdings LLC in the Lone Star Acquisition.
The period from January 1, 2015 through October 8, 2015 and the period from October 9, 2015 through December 31, 2015 relate, respectively, to the periods in 2015 preceding and succeeding the completion of the Lone Star Acquisition. The terms Predecessor and Successor refer to the pre- and post-Lone Star Acquisition financial position and results of the Company, respectively. Due to the Lone Star Acquisition, the basis of accounting changed and reflects the application of the acquisition method. The new basis of accounting primarily impacted the values of our inventory, long-lived assets and intangible assets, and resulted in increased depreciation and amortization.
For all periods presented below, we have reclassified certain expenses related to the warehousing and delivery of our products. The previous accounting classification recorded these amounts in costs of goods sold within our statements of operations. The new accounting classification moves these amounts to selling, general and administrative expenses, with separate presentation of depreciation and amortization expense. Accordingly, the respective balances for all periods presented in the financial statements were reclassified in order to be consistent and comparable. The details of the reclassification are included in Note 2 of the audited annual and unaudited interim financial statements included elsewhere in this prospectus.
Unaudited Pro Forma for the Nine Months Ended September 30, 2016 Compared to Unaudited Pro Forma for the Nine Months Ended September 30, 2015 and Unaudited Pro Forma for the Year Ended December 31, 2015 Compared to the Year Ended December 31, 2014 Results of Operations Discussion
The Lone Star Acquisition in October 2015 created a new basis of accounting for financial reporting purposes, which resulted in the Successor reporting period of October 9, 2015 to December 31, 2015 and the Predecessor period of January 1, 2015 to October 8, 2015. These periods are not comparable due to the application of purchase accounting. In addition, our recent acquisitions of Winroc-SPI, Ken API, GSCIL and Great Western resulted in significant
80
Table of Contents
expansion of our business and our audited and unaudited financial statements and the related notes included elsewhere in this prospectus do not present our full business as it currently stands or will stand at the consummation of this offering. Accordingly, we have presented, in addition to the narrative discussion of our historical results of operations set forth below, a narrative discussion of our unaudited pro forma results of operations for the nine months ended September 30, 2016 compared to the unaudited pro forma results of operations for the nine months ended September 30, 2015 and the unaudited pro forma results of operations for the year ended December 31, 2015 compared to historical results for the year ended December 31, 2014. We believe this comparison provides investors with additional information regarding our recent acquisitions and other strategic transactions when considering our historical results of operations. However, our pro forma results of operations for these periods should be read along with our audited and unaudited combined financial statements and the related notes thereto included elsewhere in this prospectus and the pro forma financial statements included in the section entitled “Unaudited Pro Forma Condensed Combined Financial Information.”
Results of Operations
Nine Months Ended September 30, 2016 (Successor) and 2015 (Predecessor)
The following table summarizes certain financial information relating to our operating results for the nine months ended September 30, 2016 and 2015.
| Successor | Predecessor | |||||||||||
| Nine Months Ended September 30, 2016 |
Nine Months Ended September 30, 2015 |
|||||||||||
| (in thousands)
|
||||||||||||
| Statements of operations data: |
||||||||||||
| Net sales |
$ | 930,315 | $ | 608,964 | ||||||||
| Cost of goods sold (exclusive of depreciation and amortization) |
665,767 | 440,539 | ||||||||||
|
|
|
|
|
|||||||||
| Gross profit |
264,548 | 168,425 | ||||||||||
|
|
|
|
|
|||||||||
| Operating expenses: |
||||||||||||
| Selling, general and administrative expenses |
206,280 | 126,102 | ||||||||||
| Depreciation and amortization |
33,605 | 15,125 | ||||||||||
| Acquisition related expenses |
12,478 | 12,542 | ||||||||||
|
|
|
|
|
|||||||||
| Total operating expenses |
252,363 | 153,769 | ||||||||||
|
|
|
|
|
|||||||||
| Income from operations |
12,185 | 14,656 | ||||||||||
| Interest expense |
(37,202 | ) | (15,717 | ) | ||||||||
| Other income, net |
93 | 14 | ||||||||||
|
|
|
|
|
|||||||||
| Loss before income taxes |
(24,924 | ) | (1,047 | ) | ||||||||
| Income tax benefit |
(5,358 | ) | (1,325 | ) | ||||||||
|
|
|
|
|
|||||||||
| Net income (loss) |
$ | (19,566 | ) | $ | 278 | |||||||
|
|
|
|
|
|||||||||
| Non-GAAP measures: |
||||||||||||
| Adjusted EBITDA(1) |
$ | 55,051 | $ | 31,623 | ||||||||
| (1) | Adjusted EBITDA is a non-GAAP measure. See the section entitled “Non-GAAP Financial Information” for a discussion of how we define and calculate this measure, a reconciliation thereof to net loss, the most directly comparable GAAP measure, and a discussion of why we believe this measure is important. |
81
Table of Contents
Net Sales
Net sales were $930.3 million and $609.0 million for the nine months ended September 30, 2016 and 2015, respectively, representing a total increase of $321.3 million. The increase was primarily attributable to incremental net sales from branches acquired in 2015 and 2016 totaling $295.2 million, primarily through our acquisition of Winroc-SPI in August 2016, GSCIL in December 2015 and Great Western in March 2015. Our base business net sales (net sales from branches that were owned by us since January 1, 2015 and branches that were opened by us during such period) increased $39.3 million, or 8.4%, period over period.
The table below highlights our growth by base business net sales and branches acquired and includes the impact of branches strategically consolidated or closed.
| (in thousands) | ||||
| Net sales for the nine months ended September 30, 2015 |
$ | 608,964 | ||
| Increase (decrease) in net sales due to: |
||||
| Base business net sales(1) |
39,293 | |||
| Branches closed(2) |
(13,148 | ) | ||
| Branches acquired(3) |
295,206 | |||
|
|
|
|||
| Net sales for the nine months ended September 30, 2016 |
$ | 930,315 | ||
|
|
|
|||
| (1) | Represents net sales from branches that were owned by us since January 1, 2015 and branches that were opened by us during such period. Base business net sales for the nine months ended September 30, 2015 was $468.3 million. |
| (2) | Represents branches closed after January 1, 2015, primarily as a result of our strategic consolidation of branches. |
| (3) | Represents branches acquired after January 1, 2015. This includes increases in net sales from branches that assumed operations of closed branches. |
SBP. Net sales were $893.0 million and $609.0 million for the nine months ended September 30, 2016 and 2015, respectively, representing an increase of $284.0 million, which was primarily due to an increase in volume driven by the overall market growth in both the commercial and residential construction markets and our increased market share. The Winroc-SPI Acquisition, which occurred in August 2016, contributed $80.3 million to the SBP segment. Wallboard and accessories accounted for the majority of SBP sales for both the nine months ended September 30, 2016 and 2015, and grew by 44.4%, and excluding Winroc-SPI, was primarily due to an increase in average wallboard unit volume of 30.0%, as well as an increase in average wallboard unit price of 1.2%. Metal framing grew by 37.6% excluding Winroc-SPI, primarily due to an increase in average volume of 29.3%, as well as an increase in average price of 6.4%. Suspended ceiling systems grew by 63.4%, which was primarily driven by both the Winroc-SPI Acquisition and an increase in volume as a result of an increase in non-residential construction spend. Other products grew by 45.6%, which is primarily due to our focus on expanding our product offerings across branches as well as the increased wallboard sales mentioned above, which it complements.
MI. Net sales were $37.3 million for the nine months ended September 30, 2016. We entered the mechanical insulation market as a result of the Winroc-SPI Acquisition in August 2016.
Gross Profit
Gross profit increased by $96.1 million, or 57.1%, to $264.5 million for the nine months ended September 30, 2016 from $168.4 million for the same period in 2015. Gross margins were negatively impacted by inventory fair value adjustments of $6.4 million and $1.6 million for the nine months ended September 30, 2016 and 2015, respectively. Excluding these adjustments, gross margin for the respective periods was 29.1% and 27.9%, respectively, representing an increase of 120 bps. The increase in gross margin excluding inventory fair value adjustments
82
Table of Contents
was driven by favorable pricing terms with our suppliers as a result of increased purchase volumes, partially offset by the change in our product mix, lower gross margins in our MI business, and an increase of $6.4 million in customer rebates.
SBP. Gross margin was 28.7% and 27.7% for the nine months ended September 30, 2016 and 2015, respectively, which is an increase of 100 bps. The increase was primarily due to favorable pricing terms with our suppliers as a result of increased purchase volumes.
MI. Gross margin was 21.0% for the nine months ended September 30, 2016.
Selling, General and Administrative Expenses
Selling, general and administrative expenses was $206.3 million and $126.1 million, and as a percent of net sales, was 22.2% and 20.7% for the nine months ended September 30, 2016 and 2015, respectively. The increase of $80.2 million is primarily due to an increase of $39.9 million in warehousing and delivery costs driven by increased net sales and acquired branches. Warehousing costs remained relatively consistent as a percentage of net sales at 12.1% and 11.9% for the 2016 and 2015 periods, respectively. In addition, payroll related and other expenses increased by $24.0 million and $16.3 million, respectively, as we continued to invest in our infrastructure and support of our operations. Selling, general and administrative expenses primarily consists of warehousing and delivery costs, which support net sales, and payroll related expenses. Other expenses include certain office expenses, legal and professional fees and other costs. Selling, general and administrative expenses are expected to continue to increase in the short term as a result of our anticipated growth, as well as costs related to being a public company. As we are able to leverage these investments, we expect these expenses to decrease as a percentage of total net sales over time.
Depreciation and Amortization
Depreciation and amortization increased $18.5 million to $33.6 million for the nine months ended September 30, 2016, from $15.1 million for the same period in 2015. This increase was driven by an increase in property and equipment and intangible assets as a result of the acquisitions in 2015 and 2016. Additionally, the fair value of property and equipment and intangible assets increased as a result of the Lone Star Acquisition.
Acquisition Related Expenses
Acquisition related expenses were $12.5 million for both the nine months ended September 30, 2016 and 2015. The expenses are due to acquisitions during each respective period.
Interest Expense
Interest expense increased by $21.5 million to $37.2 million for the nine months ended September 30, 2016, from $15.7 million for the same period in 2015, due to an increase in outstanding indebtedness from the offering of the Notes in August 2016. In addition, we incurred a loss of $7.0 million related to the refinancing of the 2015 Credit Facilities in August 2016.
Income Tax Benefit
The income tax benefit was $5.4 million and $1.3 million for the nine months ended September 30, 2016 and 2015, representing an increase of $4.1 million. During the fourth quarter of 2015, we became a taxable C-corporation from previously having subsidiaries that were either nontaxable limited liability companies or taxable C-corporations. The effective tax rate for the nine months ended September 30, 2016 was 21.5% and is lower than the statutory rate primarily due to
83
Table of Contents
certain non-deductible costs, including acquisition expenses. The effective tax rate for the nine months ended September 30, 2015 was significantly higher than the statutory rate primarily due to losses incurred from certain C-corporations acquired in March 2015.
Net Income (Loss)
Net loss was $19.6 million for the nine months ended September 30, 2016 and net income was $0.3 million for the nine months ended September 30, 2015, representing a decrease of $19.9 million, primarily due to an increase in interest expense of $21.5 million, a decrease in income from operations of $2.5 million, partially offset by an increase in income tax benefit of $4.1 million.
Adjusted EBITDA
Adjusted EBITDA was $55.1 million and $31.6 million, and as a percent of net sales, was 5.9% and 5.2%, for the nine months ended September 30, 2016 and 2015, respectively. The increase in Adjusted EBITDA as a percentage of net sales was primarily due to our favorable pricing terms with our suppliers as a result of increased purchase volumes driven by the SBP segment, partially offset by lower margins from the Winroc-SPI business and investment in our infrastructure and support of operations. Adjusted EBITDA is a non-GAAP measure. See the section entitled ‘‘Non-GAAP Financial Information’’ for a discussion of how we calculate this measure, a reconciliation thereof to net loss, the most directly comparable GAAP measure, and a discussion of why we believe this measure is important.
Unaudited Pro Forma Nine Months Ended September 30, 2016 Compared to Unaudited Pro Forma Nine Months Ended September 30, 2015
The following table summarizes certain financial information relating to our operating results for the unaudited pro forma nine months ended September 30, 2016 and 2015. See the section entitled “Unaudited Pro Forma Condensed Combined Financial Information” for detail and notes regarding pro forma amounts and related pro forma adjustments.
| Unaudited Pro Forma | ||||||||
| (in thousands) | Nine months ended September 30, 2016 |
Nine
months ended September 30, 2015 |
||||||
| Net sales |
$ | 1,417,357 | $ | 1,326,827 | ||||
| Cost of goods sold (exclusive of depreciation and amortization) |
1,022,836 | 965,352 | ||||||
|
|
|
|
|
|||||
| Gross profit |
394,521 | 361,475 | ||||||
| Operating expenses: |
||||||||
| Selling, general and administrative expenses |
315,531 | 279,330 | ||||||
| Depreciation and amortization |
48,898 | 43,208 | ||||||
| Acquisition related expenses |
— | — | ||||||
|
|
|
|
|
|||||
| Total operating expenses |
364,429 | 322,538 | ||||||
|
|
|
|
|
|||||
| Income from operations |
30,092 | 38,937 | ||||||
| Interest expense |
(44,181 | ) | (43,496 | ) | ||||
| Other income (expense), net |
5,235 | (6,150 | ) | |||||
|
|
|
|
|
|||||
| Loss before income taxes |
(8,854 | ) | (10,709 | ) | ||||
| Income tax expense (benefit) |
515 | (3,026 | ) | |||||
|
|
|
|
|
|||||
| Net loss |
$ | (9,369 | ) | $ | (7,683 | ) | ||
|
|
|
|
|
|||||
| Non-GAAP Measure: |
||||||||
| Adjusted EBITDA(1) |
$ | 88,251 | $ | 83,987 | ||||
| (1) | Adjusted EBITDA is a non-GAAP measure. See the section entitled “Non-GAAP Financial Information” for a discussion of how we calculate this measure, a reconciliation thereof to net loss, the most directly comparable GAAP measure and a discussion of why we believe this measure is important. |
84
Table of Contents
Net Sales
Pro forma net sales were $1,417.4 million and $1,326.8 million for the nine months ended September 30, 2016 and 2015, respectively, representing an increase of $90.6 million, or 6.8%. The increase in net sales is driven by the increased demand for our products as a result of improved residential and commercial construction activity.
SBP. Net sales were $1,217.5 million and $1,115.0 million for the nine months ended September 30, 2016 and 2015, respectively, representing an increase of $102.5 million, or 9.2%. This increase is primarily due to wallboard and accessories driven by improved residential and commercial construction activity.
MI. Net sales were $199.9 million and $211.8 million for the nine months ended September 30, 2016 and 2015, respectively, representing a decrease of $11.9 million. This decrease is primarily due to a decrease in export opportunities driven by a reduction in the oil and gas industry activity.
Gross Profit
Pro forma gross profit for the nine months ended September 30, 2016 and 2015 was $394.5 million and $361.5 million, respectively, representing an increase of $33.0 million. Pro forma gross margins remained relatively consistent at 27.8% and 27.2% for the respective periods. The slight increase in gross margin is primarily due to favorable pricing terms with our suppliers as a result of increased purchase volumes.
SBP. Gross margin remained relatively consistent at 28.1% and 27.2% for the nine months ended September 30, 2016 and 2015, respectively. This increase is primarily due to favorable pricing terms with our suppliers as a result of increased purchase volumes, partially offset by the negative impact of the inventory fair value adjustments which primarily related to the Winroc-SPI Acquisition.
MI. Gross margin remained relatively consistent at 26.0% and 27.4% for the nine months ended September 30, 2016 and 2015, respectively. This decrease includes the negative impact of the inventory fair value adjustments related to the Winroc-SPI Acquisition.
Selling, General and Administrative Expenses
Pro forma selling, general and administrative expenses were $315.5 million and $279.3 million, representing an increase of $36.2 million, and as a percent of net sales was 22.3% and 21.1%, for the nine months ended September 30, 2016 and 2015, respectively. The increase in selling, general and administrative expenses was primarily driven by an increase in payroll and other expenses at the Company. During the nine months ended September 30, 2016, the Company and Winroc-SPI incurred approximately $5.5 million in incremental audit, legal, consulting and other fees related to acquisition and public company readiness. Additionally, Winroc-SPI expenses included changes related to its ERP software implementation of $3.4 million and $1.1 million for the 2016 and 2015 periods, respectively.
Depreciation and Amortization
Pro forma depreciation and amortization was $48.9 million and $43.2 million for the nine months ended September 30, 2016 and 2015, respectively.
85
Table of Contents
Interest Expense
Pro forma interest expense remained relatively consistent at $44.2 million and $43.5 million for the nine months ended September 30, 2016 and 2015, respectively. Interest expense relates to borrowings under the Notes and ABL Credit Facility entered into in conjunction with the Winroc-SPI Acquisition.
Other Income (Expense), Net
Pro forma other income, net was $5.2 million for the nine months ended September 30, 2016, and pro forma other expense, net was $6.2 million for the nine months ended September 30, 2015, and represents the change in financial derivative instruments related to the Winroc-SPI business.
Income Tax Expense (Benefit)
Pro forma income tax expense was $0.5 million and pro forma income tax benefit was $3.0 million for the nine months ended September 30, 2016 and 2015, respectively, with an effective tax rate of 5.8% and 28.3% for the respective periods.
Net Loss
Pro forma net loss was $9.4 million and $7.7 million for the nine months ended September 30, 2016 and 2015, respectively, and represented an unfavorable change of $1.7 million. This is primarily due to an increase in total operating expense of $41.9 million, a decrease in income tax benefit of $3.5 million, an increase in interest expense of $0.7 million, offset by an increase in gross profit of $33.0 million and an increase in other income, net of $11.4 million.
Adjusted EBITDA
Pro forma Adjusted EBITDA was $88.3 million and $84.0 million for the nine months ended September 30, 2016 and 2015. Pro forma Adjusted EBITDA remained relatively consistent at 6.2% and 6.3% of net sales for the nine months ended September 30, 2016 and 2015, respectively. Adjusted EBITDA is a non-GAAP measure. See the section entitled ‘‘Non-GAAP Financial Information’’ for a discussion of how we calculate this measure, a reconciliation of Adjusted EBITDA to net loss, the most directly comparable GAAP measure, and a discussion of why we believe this measure is important, and the section entitled “Summary Historical and Unaudited Pro Forma Condensed Combined Financial and Other Information” for a reconciliation of unaudited pro forma Adjusted EBITDA to unaudited pro forma net loss.
86
Table of Contents
Period from October 9, 2015 to December 31, 2015 (Successor)
The following table summarizes certain financial information relating to our operating results for the periods from October 9, 2015 to December 31, 2015 (Successor). Also included is certain information relating to the operating results as a percentage of net sales.
| Successor | % of Net Sales |
|||||||
| (in thousands) | October 9, 2015 to December 31, 2015 |
|||||||
| Statements of operations data: |
||||||||
| Net sales |
$ | 192,539 | 100.0 | % | ||||
| Cost of goods sold (exclusive of depreciation and amortization) |
143,333 | 74.4 | % | |||||
|
|
|
|
|
|||||
| Gross profit |
49,206 | 25.6 | % | |||||
|
|
|
|
|
|||||
| Operating expenses: |
||||||||
| Selling, general and administrative expenses |
44,196 | 23.0 | % | |||||
| Depreciation and amortization |
7,170 | 3.7 | % | |||||
| Acquisition related expenses |
3,464 | 1.8 | % | |||||
|
|
|
|
|
|||||
| Total operating expenses |
54,830 | 28.5 | % | |||||
|
|
|
|
|
|||||
| Loss from operations |
(5,624 | ) | (2.9 | )% | ||||
| Interest expense |
(7,044 | ) | (3.7 | )% | ||||
| Other income, net |
9 | 0.0 | % | |||||
|
|
|
|
|
|||||
| Loss before income taxes |
(12,659 | ) | (6.6 | )% | ||||
| Income tax (benefit) |
(4,733 | ) | (2.5 | )% | ||||
|
|
|
|
|
|||||
| Net loss |
$ | (7,926 | ) | (4.1 | )% | |||
|
|
|
|
|
|||||
| Non-GAAP measures: |
||||||||
| Adjusted EBITDA(1) |
$ | 8,969 | 4.7 | % | ||||
| (1) | Adjusted EBITDA is a non-GAAP measure. See the section entitled ‘‘Non-GAAP Financial Information’’ for a discussion of how we calculate this measure, a reconciliation thereof to net loss, the most directly comparable GAAP measure, and a discussion of why we believe this measure is important. |
Net sales were $192.5 million, all from the SBP segment, which primarily consisted of wallboard and accessories.
The table below shows allocation of net sales between base business net sales and branches acquired.
| (in thousands) | ||||
| Base business net sales(1) |
$ | 90,552 | ||
| Branches acquired(2) |
101,987 | |||
|
|
|
|||
| Net sales for October 9, 2015 to December 31, 2015 |
$ | 192,539 | ||
|
|
|
|||
| (1) | Represents net sales from branches that were owned by us prior to October 9, 2015 or branches that were opened by us during the period October 9, 2015 to December 31, 2015. |
| (2) | Represents branches acquired during the period October 9, 2015 to December 31, 2015. This includes net sales from branches that assumed operations of closed branches. |
Cost of goods sold was $143.3 million, which included $7.5 million of inventory fair value adjustments, and resulted in gross profit of $49.2 million, or gross margin of 25.6%. Excluding inventory fair value adjustments, gross margin was 29.4%.
87
Table of Contents
Selling, general and administrative expenses was $44.2 million, and represented 23.0% of net sales. Selling, general and administrative expenses will be affected in the short term as a result of these costs and others related to our anticipated growth, as well as costs related to being a public company. As we are able to leverage these investments, we expect these expenses to decline over time as a percentage of net sales.
Depreciation and amortization was $7.2 million, and represented 3.7% of net sales. Depreciation and amortization includes the impact of the step up in fair value as a result of the Lone Star Acquisition in October 2015.
Acquisition related expenses were $3.5 million due to acquisition activity in the period.
Interest expense was $7.0 million as a result of our outstanding indebtedness, which includes the debt incurred to finance the Lone Star Acquisition.
Income tax benefit was $4.7 million. As of October 9, 2015, we were considered a C-corporation for tax purposes while for periods prior to such date we had subsidiaries that were either nontaxable limited liability companies or taxable C-corporations. The effective tax rate for the period was 37.4%, which differed from the statutory rate primarily due to state taxes.
The net loss of $7.9 million was primarily driven by operating expenses of $54.8 million and interest expense of $7.0 million, partially offset by gross profit of $49.2 million and income tax benefit of $4.7 million.
Adjusted EBITDA was $9.0 million and represented 4.7% of net sales. Adjusted EBITDA is primarily the result of gross profit of $56.7 million excluding the impact of the inventory fair value adjustment, partially offset by selling, general and administrative expenses of $44.2 million and acquisition related expenses of $3.5 million. Adjusted EBITDA is a non-GAAP measure. See the section entitled ‘‘Non-GAAP Financial Information’’ for a discussion of how we calculate this measure, a reconciliation thereof to net loss, the most directly comparable GAAP measure and a discussion of why we believe this measure is important.
88
Table of Contents
Period from January 1, 2015 to October 8, 2015 (Predecessor)
The following table summarizes certain financial information relating to our operating results for the period from January 1, 2015 to October 8, 2015 (Predecessor). Also included is certain information relating to the operating results as a percentage of net sales.
| Predecessor | % of Net Sales |
|||||||
| (in thousands) | January 1, 2015 to October 8, 2015 |
|||||||
| Statements of operations data: |
||||||||
| Net sales |
$ | 628,066 | 100.0 | % | ||||
| Cost of goods sold (exclusive of depreciation and amortization) |
452,909 | 72.1 | % | |||||
|
|
|
|
|
|||||
| Gross profit |
175,157 | 27.9 | % | |||||
|
|
|
|
|
|||||
| Operating expenses: |
||||||||
| Selling, general and administrative expenses |
131,524 | 20.9 | % | |||||
| Depreciation and amortization |
15,615 | 2.5 | % | |||||
| Acquisition related expenses |
39,691 | 6.3 | % | |||||
|
|
|
|
|
|||||
| Total operating expenses |
186,830 | 29.7 | % | |||||
|
|
|
|
|
|||||
| Loss from operations |
(11,673 | ) | (1.8 | )% | ||||
| Interest expense |
(19,090 | ) | (3.0 | )% | ||||
| Other income, net |
14 | 0.0 | % | |||||
|
|
|
|
|
|||||
| Loss before income taxes |
(30,749 | ) | (4.9 | )% | ||||
| Income tax (benefit) |
(1,294 | ) | (0.2 | )% | ||||
|
|
|
|
|
|||||
| Net loss |
$ | (29,455 | ) | (4.7 | )% | |||
|
|
|
|
|
|||||
| Non-GAAP measures: |
||||||||
| Adjusted EBITDA(1) |
$ | 5,849 | 0.9 | % | ||||
| (1) | Adjusted EBITDA is a non-GAAP measure. See the section entitled ‘‘Non-GAAP Financial Information’’ for a discussion of how we calculate this measure, a reconciliation thereof to net loss, the most directly comparable GAAP measure, and a discussion of why we believe this measure is important. |
Net sales were $628.1 million, all from the SBP segment, which primarily consisted of wallboard and accessories.
The table below shows the allocation base business net sales and branches acquired, and includes the impact of branches closed.
| (in thousands) | ||||
| Base business net sales(1) |
$ | 305,463 | ||
| Branches acquired(2) |
322,603 | |||
|
|
|
|||
| Net sales for January 1, 2015 to October 8, 2015 |
$ | 628,066 | ||
|
|
|
|||
| (1) | Represents net sales from branches that were owned by us prior to January 1, 2015 or branches that were opened by us during the period January 1, 2015 to October 8, 2015. |
| (2) | Represents branches acquired during the period January 1, 2015 to October 8, 2015. This includes net sales from branches that assumed operations of closed branches. |
Cost of goods sold was $452.9 million, which included $1.6 million of inventory fair value adjustments, and resulted in gross profit of $175.2 million, or gross margin of 27.9%. Excluding inventory fair value adjustments, gross margin was 28.1%.
89
Table of Contents
Selling, general and administrative expenses was $131.5 million, and represented 20.9% of net sales. Selling, general and administrative expenses will be affected in the short term as a result of these costs and others related to our anticipated growth, as well as costs related to being a public company. As we are able to leverage these investments, we expect these expenses to decline over time as a percentage of net sales.
Depreciation and amortization was $15.6 million, and represented 2.5% of net sales. Depreciation and amortization includes the impact of the addition of property and equipment and intangible assets acquired.
Acquisition related expenses was $39.7 million and represents the related acquisition activity, including amounts related to the by Lone Star Acquisition.
Interest expense was $19.1 million as a result of our outstanding indebtedness.
Income tax benefit was $1.3 million and reflected the fact that we had subsidiaries that were either nontaxable limited liability companies or taxable C-corporations.
The net loss of $29.5 million was primarily driven by operating expenses of $186.8 million and interest expense of $19.1 million, partially offset by gross profit of $175.2 million and income tax benefit of $1.3 million.
Adjusted EBITDA was $5.8 million and represented 0.9% of net sales. Adjusted EBITDA as a percentage of net sales was primarily the result of gross margin excluding inventory fair value adjustments of 28.1%, partially offset by selling, general and administrative margin of 20.9% and acquisition related expense margin of 6.3%. Adjusted EBITDA is a non-GAAP measure. See the section entitled ‘‘Non-GAAP Financial Information’’ for a discussion of how we calculate this measure, a reconciliation thereof to net loss, the most directly comparable GAAP measure and a discussion of why we believe this measure is important.
90
Table of Contents
Year Ended December 31, 2014 (Predecessor)
The following table summarizes certain financial information relating to our operating results for the year ended December 31, 2014 (Predecessor). Also included is certain information relating to the operating results as a percentage of net sales.
| Predecessor | % of Net Sales |
|||||||
| (in thousands) | Year Ended December 31, 2014 |
|||||||
| Statements of operations data: |
||||||||
| Net sales |
$ | 508,853 | 100.0 | % | ||||
| Cost of goods sold (exclusive of depreciation and amortization) |
368,064 | 72.3 | % | |||||
|
|
|
|
|
|||||
| Gross profit |
140,789 | 27.7 | % | |||||
|
|
|
|
|
|||||
| Operating expenses: |
||||||||
| Selling, general and administrative expenses |
115,462 | 22.7 | % | |||||
| Depreciation and amortization |
11,729 | 2.3 | % | |||||
| Acquisition related expenses |
4,683 | 0.9 | % | |||||
|
|
|
|
|
|||||
| Total operating expenses |
131,874 | 25.9 | % | |||||
|
|
|
|
|
|||||
| Income from operations |
8,915 | 1.8 | % | |||||
| Interest expense |
(9,980 | ) | (2.0 | )% | ||||
| Other income, net |
36 | 0.0 | % | |||||
|
|
|
|
|
|||||
| Loss before income taxes |
(1,029 | ) | (0.2 | )% | ||||
| Income tax (expense) |
812 | 0.2 | % | |||||
|
|
|
|
|
|||||
| Net loss |
$ | (1,841 | ) | (0.4 | )% | |||
|
|
|
|
|
|||||
| Non-GAAP measures: |
||||||||
| Adjusted EBITDA(1) |
$ | 20,926 | 4.1 | % | ||||
| (1) | Adjusted EBITDA is a non-GAAP measure. See the section entitled ‘‘Non-GAAP Financial Information’’ for a discussion of how we calculate this measure, a reconciliation thereof to net loss, the most directly comparable GAAP measure, and a discussion of why we believe this measure is important. |
Net sales were $508.9 million, all from the SBP segment, which primarily consisted of wallboard and accessories.
The table below highlights our growth during the period by base business net sales and branches acquired, and includes the impact of branches closed.
| (in thousands) | ||||
| Base business net sales(1) |
$ | 355,484 | ||
| Branches closed(2) |
1,159 | |||
| Branches acquired(3) |
152,210 | |||
|
|
|
|||
| Net sales for the year ended December 31, 2014 |
$ | 508,853 | ||
|
|
|
|||
| (1) | Represents net sales from branches that were owned by us prior to January 1, 2014 or were opened by us during the year ended December 31, 2014. |
| (2) | Represents branches closed during the year ended December 31, 2014, primarily as a result of our strategic consolidation of branches. |
| (3) | Represents branches acquired during the year ended January 1, 2014. This includes net sales from branches that assumed operations of closed branches. |
Cost of goods sold was $368.1 million and resulted in gross profit of $140.8 million, or gross margin of 27.7%.
91
Table of Contents
Selling, general and administrative expenses was $115.5 million, and represented 22.7% of net sales. Selling, general and administrative expenses will be affected in the short term as a result of these costs and others related to our anticipated growth, as well as costs related to being a public company. As we are able to leverage these investments, we expect these expenses to decline over time as a percentage of net sales.
Depreciation and amortization was $11.7 million, and represented 2.3% of net sales. Depreciation and amortization includes the impact of the addition of property and equipment and intangible assets acquired.
Acquisition related expenses was $4.7 million and represents the related acquisition activity.
Interest expense was $10.0 million as a result of our outstanding indebtedness.
Income tax expense was $0.8 million and reflected the fact that we had subsidiaries that were either nontaxable limited liability companies or taxable C-corporations.
The net loss of $1.8 million was primarily driven by operating expenses of $131.9 million, interest expense of $10.0 million and income tax expense of $0.8 million, partially offset by gross profit of $140.8 million.
Adjusted EBITDA was $20.9 million and represented 4.1% of net sales. Adjusted EBITDA as a percentage of net sales was primarily the result of gross margin of 27.7%, partially offset by selling, general and administrative margin of 22.7% and acquisition related expense margin of 0.9%. Adjusted EBITDA is a non-GAAP measure. See the section entitled ‘‘Non-GAAP Financial Information’’ for a discussion of how we calculate this measure, a reconciliation thereof to net loss, the most directly comparable GAAP measure and a discussion of why we believe this measure is important.
92
Table of Contents
Unaudited Pro Forma Year Ended December 31, 2015 Compared to Year Ended December 31, 2014 (Predecessor)
The following table summarizes certain financial information relating to our operating results for the unaudited pro forma year ended December 31, 2015 and the year ended December 31, 2014. See the section entitled “Unaudited Pro Forma Condensed Combined Financial Information.”
| Unaudited Pro Forma Year Ended December 31, 2015 |
Predecessor | |||||||
| (in thousands) | Year Ended December 31, 2014 |
|||||||
| Statements of operations data: |
||||||||
| Net sales |
$ | 1,761,093 | $ | 508,853 | ||||
| Cost of goods sold (exclusive of depreciation and amortization) |
1,281,866 | 368,064 | ||||||
|
|
|
|
|
|||||
| Gross profit |
479,227 | 140,789 | ||||||
|
|
|
|
|
|||||
| Operating expenses: |
||||||||
| Selling, general and administrative expenses |
376,133 | 115,462 | ||||||
| Depreciation and amortization |
57,554 | 11,729 | ||||||
| Acquisition related expenses |
— | 4,683 | ||||||
|
|
|
|
|
|||||
| Total operating expenses |
433,687 | 131,874 | ||||||
|
|
|
|
|
|||||
| Income from operations |
45,540 | 8,915 | ||||||
| Interest expense |
(58,086 | ) | (9,980 | ) | ||||
| Other income (expense), net |
(6,547 | ) | 36 | |||||
|
|
|
|
|
|||||
| Loss before income taxes |
(19,093 | ) | (1,029 | ) | ||||
| Income tax (benefit) expense |
(5,846 | ) | 812 | |||||
|
|
|
|
|
|||||
| Net loss |
$ | (13,247 | ) | $ | (1,841 | ) | ||
|
|
|
|
|
|||||
| Non-GAAP measures: |
||||||||
| Adjusted EBITDA(1) |
$ | 112,424 | $ | 20,926 | ||||
| (1) | Adjusted EBITDA is a non-GAAP measure. See the section entitled ‘‘Non-GAAP Financial Information’’ for a discussion of how we calculate this measure, a reconciliation thereof to net loss, the most directly comparable GAAP measure, and a discussion of why we believe this measure is important. |
Net Sales
Net sales were $1,761.1 million and $508.9 million for the unaudited pro forma year ended December 31, 2015 and the year ended December 31, 2014, respectively, representing an increase of $1,252.2 million. This increase was primarily attributable to $940.5 million of pre-acquisition net sales from the Winroc-SPI, Ken API, GSCIL and Great Western acquisitions. The remaining increase of $311.7 million was driven by increases in our net sales. The increase in our net sales occurred across all products within the SBP segment, and was driven by increased demand for our products as a result of improved residential and commercial construction activity.
Our historical wallboard and accessories sales increased by $143.0 million, representing an increase of 51.7%. This increase was primarily attributable to an increase in average wallboard unit volume of 47.6%, which was primarily driven by activity from entities acquired, and average wallboard unit price increases of 2.8%.
93
Table of Contents
Our historical metal framing sales increased by $57.7 million, representing an increase of 67.7%. This increase was primarily attributable to an increase in average volume of 65.3% driven by acquisitions and increased commercial activity.
Our historical other product categories increased by $111.0 million due to other product groups driven by our continued strategic focus on growing market share as demand increases in the residential and non-residential markets.
Gross Profit
Gross profit for the unaudited pro forma year ended December 31, 2015 and the year ended December 31, 2014 was $479.2 million and $140.8 million, respectively, representing an increase of $338.4 million and relatively consistent gross margins of 27.2% and 27.7% for the respective periods. The slight decrease in gross profit is primarily due to lower pre-acquisition gross margins from the Winroc-SPI, Ken API, GSCIL and Great Western acquisitions of 27.0%. Our historical gross margin was 27.3% and 27.7% for the year ended December 31, 2015 and the year ended December 31, 2014, respectively. The slight decrease of 0.4% is primarily due to inventory fair value adjustments of $9.1 million, which negatively impacted gross margin by 1.1% for the combined year ended December 31, 2015, partially offset by favorable pricing terms with our suppliers as our purchasing volumes increase, and growth in higher margin products as we continued to focus on expanding our product lines.
Selling, General and Administrative Expenses
Selling, general and administrative expenses was $376.1 million and $115.5 million, representing an increase of $260.6 million, and as a percent of net sales was 21.4% and 22.7%, for the unaudited pro forma year ended December 31, 2015 and the year ended December 31, 2014, respectively. Approximately $200.4 million of the increase was driven by the acquired entities, including acquisition related adjustments, and $1.9 million of third-party costs incurred in connection with Winroc-SPI’s enterprise resource planning software implementation process. The remaining $60.2 million of the increase was driven by our business, primarily due to warehousing and delivery costs, which increased by $36.6 million. In addition, payroll related and other expenses increased by $13.8 million and $9.8 million, respectively, as we continue to invest in our infrastructure and support of our operations. Selling, general and administrative expenses are expected to continue to increase in the short term as a result of these costs and others related to our anticipated growth, as well as costs related to being a public company. As we are able to leverage these investments, we expect these expenses to decrease as a percentage of total revenues over time.
Depreciation and Amortization
Depreciation and amortization was $57.6 million and $11.7 million for the unaudited pro forma year ended December 31, 2015 and the year ended December 31, 2014, respectively. The increase of $45.9 million was primarily due to acquired property and equipment and intangible assets as a result of our acquisition activity, as well as an increase in the fair value of property and equipment and intangible assets as a result of the Lone Star Acquisition.
Interest Expense
Interest expense was $58.1 million and $10.0 million for the unaudited pro forma year ended December 31, 2015 and the year ended December 31, 2014, respectively. The pro forma interest expense of $58.1 million in 2015 was the result of additional borrowings incurred in connection with the Winroc-SPI Acquisition.
94
Table of Contents
Other (Expense) Income, Net
Other expense, net was $6.5 million for the unaudited pro forma year ended December 31, 2015, and represented unrealized losses from Winroc-SPI derivative financial instruments. We did not have similar derivative financial instruments in the year ended December 31, 2014.
Income Tax (Benefit) Expense
Income tax benefit was $5.8 million for the unaudited pro forma year ended December 31, 2015 and income tax expense was $0.8 million for the year ended December 31, 2014, and the effective tax rate was 30.3% and 78.9% for the respective periods. The pro forma tax expense assumes that entities previously considered pass-through tax entities were taxable as C-corporations for the full year.
For the year ended December 31, 2014, the effective tax rate of 78.9% was primarily due to return to provision adjustments resulting from entities acquired in 2013, and state income tax expenses in excess of federal tax benefits for certain entities taxed at the federal level.
Net Loss
Net loss was $13.2 million and $1.8 million for the unaudited pro forma year ended December 31, 2015 and the year ended December 31, 2014, respectively, and represented an unfavorable change of $11.4 million. This decrease is primarily due to an increase in total operating expense of $301.8 million, an increase in interest expense of $48.1 million and an increase in other expense, net of $6.6 million, partially offset by the increase in gross profit of $338.4 million and an increase in income tax benefit of $6.6 million.
Adjusted EBITDA
Unaudited Pro Forma Adjusted EBITDA was $112.4 million, or 6.4% of net sales, for the unaudited pro forma year ended December 31, 2015 and Adjusted EBITDA was $20.9 million, or 4.1% of net sales, for the year ended December 31, 2014. The increase in Adjusted EBITDA of 2.3% is primarily due to our ability to leverage investments in our infrastructure and support of our operations as we integrate our acquisitions. In addition, there were no acquisition related expenses for the unaudited pro forma year ended December 31, 2015, while there were $4.7 million of acquisition related expenses in the year ended December 31, 2014. Adjusted EBITDA is a non-GAAP measure. See the section entitled ‘‘Non-GAAP Financial Information’’ for a discussion of how we calculate this measure, a reconciliation thereof to net loss, the most directly comparable GAAP measure and a discussion of why we believe this measure is important, and the section entitled “Summary Historical and Unaudited Pro Forma Condensed Combined Financial and Other Information” for a reconciliation of unaudited pro forma Adjusted EBITDA to unaudited pro forma net loss.
Liquidity and Capital Resources
Summary
We depend on cash flow from operations, cash on hand and funds available under our ABL Credit Facility, and in the future may depend on other debt financings allowed under the terms of the Notes and ABL Credit Facility and equity financings, to finance our acquisition strategy, working capital needs and capital expenditures. We believe that these sources of funds will be adequate to fund debt service requirements and provide cash, as required, to support our strategy, ongoing operations, capital expenditures, lease obligations and working capital for at
95
Table of Contents
least the next twelve months. However, we cannot assure you that we will be able to obtain future debt or equity financings adequate for our future cash requirements on commercially reasonable terms or at all. The tax receivable agreement may also have a negative impact on our liquidity if, among other things, payments we make under the tax receivable agreement exceed the actual cash savings we and our subsidiaries realize in respect of the tax benefits covered by the tax receivable agreement after we have paid our taxes and other obligations. In addition, as a result of either an early termination of the tax receivable agreement or a change of control, we could be required to make payments under the agreement that exceed our actual cash savings under the tax receivable agreement. In these situations, our obligations under the tax receivable agreement could have a substantial negative impact on our liquidity and could have the effect of delaying, deferring or preventing, among other things, capital expenditures and acquisitions. See the section entitled “Certain Relationships and Related Party Transactions—Tax Receivable Agreement.”
If our cash flows and capital resources are insufficient to fund our debt service obligations, we may be forced to reduce or delay additional acquisitions, future investments and capital expenditures, seek additional capital, restructure or refinance our indebtedness, including the Notes, or sell assets. Significant delays in our ability to finance planned acquisitions or capital expenditures may materially and adversely affect our future revenue prospects. In addition, we cannot assure you that we will be able to refinance any of our indebtedness, including the Notes and our ABL Credit Facility, on commercially reasonable terms or at all. Our ability to restructure or refinance our debt will depend on the condition of the capital markets and our financial condition at such time. Our tax receivable agreement requires that, after Lone Star no longer controls us, any senior debt document that refinances or replaces our existing indebtedness permit our subsidiaries to make dividends to us, without any conditions, to the extent required for us to make its payments under the tax receivable agreement, unless Lone Star otherwise consents. At the time of any such refinancing, it may not be possible to include this term in such senior debt documents, and as a result, we may need Lone Star’s consent to complete such refinancing. The ABL Credit Facility and the Indenture restrict our ability to enter into certain asset sales transactions. We may not be able to consummate those asset sales to raise capital or sell assets at prices that we believe are fair, and proceeds that we do receive may not be adequate to meet any debt service obligations then due. See the sections entitled “Description of Certain Indebtedness” and “Risk Factors—Risks Relating to Our Indebtedness.”
As of September 30, 2016, we had available aggregate undrawn borrowing capacity of approximately $110.0 million under the ABL Credit Facility. For the periods presented, our use of cash was primarily driven by our investing activities, specifically our investments in acquisitions.
96
Table of Contents
Cash Flows
A summary of net cash provided by, or used in, operating, investing and financing activities is shown in the following table.
| Successor | Predecessor | Successor | Predecessor | |||||||||||||||||||||||||
| Nine Months Ended September 30, 2016 |
Nine Months Ended September 30, 2015 |
October 9, 2015 to December 31, 2015 |
January 1, 2015 to October 8, 2015 |
Year Ended December 31, 2014 |
||||||||||||||||||||||||
| (in thousands)
|
||||||||||||||||||||||||||||
| Net cash provided by (used in) operating activities |
$ | 7,922 | $ | 13,863 | $ | 17,610 | $ | 19,176 | $ | (3,989 | ) | |||||||||||||||||
| Net cash used in investing activities |
$ | (394,896 | ) | $ | (97,076 | ) | $ | (660,323 | ) | $ | (97,266 | ) | $ | (102,436 | ) | |||||||||||||
| Net cash provided by financing activities |
$ | 399,773 | $ | 88,426 | $ | 642,682 | $ | 86,567 | $ | 104,473 | ||||||||||||||||||
Operating Activities
Net cash provided by, or used in, operating activities consists primarily of net loss adjusted for non-cash items, including depreciation and amortization, provision for doubtful accounts, deferred income taxes and the effects of changes in working capital.
Net loss decreased $19.8 million to $19.6 million for the nine months ended September 30, 2016 compared to a net income of $0.3 million for the nine months ended September 30, 2015. Non-cash items for the nine months ended September 30, 2016 increased $28.6 million to $45.8 million compared to $17.1 million for the nine months ended September 30, 2015. Working capital accounts used $19.0 million of cash for the nine months ended September 30, 2016 compared to $4.3 million for the nine months ended September 30, 2015. Primary working capital changes consisted of increases in accounts receivable, other receivables and inventory and a decrease in accounts payable. The increase in accounts receivable was due to an increase in sales. The other receivables and inventory increase was due to an increase in product demand and an expansion of our product lines.
Net loss increased $21.5 million to $7.9 million for the 2015 Successor period compared to a net loss of $29.5 million for the 2015 Predecessor period and a net loss of $1.8 million for the year ended December 31, 2014. Non-cash items for the 2015 Successor period increased $1.9 million to $22.4 million compared to $20.5 million for the 2015 Predecessor period and $14.4 million for the year ended December 31, 2014. Working capital accounts used $7.0 million of cash in the 2015 Successor period compared to the working capital accounts providing $29.1 million of cash for the 2015 Predecessor period, and working capital used of $15.9 million for the year ended December 31, 2014. Primary working capital changes for the 2015 Successor and Predecessor periods consisted of a decrease in accounts receivable and a decrease in accounts payable. The decreases in accounts receivable and accounts payable were due to timing of collections and payments between periods. Primary working capital changes for the 2015 Predecessor period and the year ended December 31, 2014 consisted of a decrease in accounts receivable and an increase in inventory and accounts payable. The decrease in accounts receivable and increase in accounts payable was driven by the timing of collections and payments between periods. The increase in inventory was due to an increase in product demand.
97
Table of Contents
Investing Activities
Net cash used in investing activities consists primarily of acquisitions and capital expenditures, including purchases of land, buildings, leasehold improvements, fleet assets, information technology and other equipment.
Net cash used in investing activities was $394.9 million for the nine months ended September 30, 2016 and $97.1 million for the nine months ended September 30, 2015, which is an increase of $297.8 million. During the nine months ended September 30, 2016, we acquired Winroc-SPI, Ken API, Kent Gypsum Supply, Inc. and Mid America Drywall Supply, Inc. for aggregate consideration of $372.1 million. During the nine months ended September 30, 2015, we acquired Great Western for consideration of $87.5 million. In addition, there was an increase of $13.2 million in capital expenditures.
Net cash used in investing activities for the 2015 Successor period was $660.3 million and primarily related to $549.3 million used to acquire FBM and $103.2 million to acquire GSCIL. Cash used for capital expenditures was $2.8 million.
Net cash used in investing activities for the 2015 Predecessor period was $97.3 million and primarily related to $87.5 million used to acquire Great Western. Cash used for capital expenditures was $9.8 million.
Net cash used in investing activities for the year ended December 31, 2014 was $102.4 million, of which $93.2 million related to acquisitions during the period. Cash used for capital expenditures was $9.2 million.
Capital expenditures vary depending on prevailing business factors, including current and anticipated market conditions. Historically, capital expenditures generally have been made at relatively low levels in comparison to the operating cash flows generated during the corresponding periods. We expect our annual 2016 capital expenditures to be approximately $15.0 million to $18.0 million (excluding acquisitions) primarily related to fleet and equipment purchases and IT investments to support our operations and our “One Company” initiative. In addition, we expect an additional $11.0 million to purchase new real estate for facilities in Texas and Wisconsin.
Financing Activities
Net cash provided by, or used in, financing activities consists primarily of borrowings and related repayments under our financing agreements and proceeds from capital contributions.
Net cash provided by financing activities was $399.8 million and $88.4 million for the nine months ended September 30, 2016 and 2015, respectively. The $399.8 million for the nine months ended September 30, 2016 was a result of financing the acquisitions completed during the period, primarily in connection with the Winroc-SPI Acquisition, and included $894.2 million of net borrowings, offset by repayments of $558.6 million primarily related to the repayment of the 2015 Credit Facilities. In addition, there were capital contributions of $66.2 million and payments on capital lease obligations related to Winroc-SPI and Ken API of $2.0 million. For the nine months ended September 30, 2015, the $88.4 million was primarily related to the increase in debt to finance the Great Western acquisition.
Net cash provided by financing activities for the 2015 Successor period was $642.7 million, and primarily consisted of net borrowings of $379.8 million to finance the Lone Star Acquisition and capital contributions of $272.9 million, offset by $10.0 million in debt repayments.
98
Table of Contents
Net cash provided by financing activities for the 2015 Predecessor period was $86.6 million was primarily due to financing related to the Great Western acquisition.
For the year ended December 31, 2014, cash provided by financing activities of $104.5 million was primarily due to financing the 2014 acquisitions.
Contractual Obligations
The following table summarizes our significant contractual obligations as of September 30, 2016. Some of the amounts included in the table are based on management’s estimates and assumptions about these obligations, including their duration, the possibility of renewal, anticipated actions by third parties and other factors. Because these estimates and assumptions are necessarily subjective, our actual payments may vary from those reflected in the table.
| (in thousands) | 2016 | 2017 | 2018 | 2019 | 2020 | Thereafter | Total | |||||||||||||||||||||
| Long-term debt |
$ | — | $ | — | $ | — | $ | — | $ | — | $ | 713,403 | $ | 713,403 | ||||||||||||||
| Interest |
$ | 13,338 | $ | 53,095 | $ | 52,927 | $ | 52,815 | $ | 52,662 | $ | 30,410 | $ | 255,247 | ||||||||||||||
| Operating leases |
$ | 6,483 | $ | 22,747 | $ | 19,132 | $ | 13,600 | $ | 9,390 | $ | 7,388 | $ | 78,740 | ||||||||||||||
| Capital leases |
$ | 1,333 | $ | 3,355 | $ | 3,269 | $ | 3,074 | $ | 2,596 | $ | 2,946 | $ | 16,573 | ||||||||||||||
|
|
|
|
|
|
|
|
|
|
|
|
|
|
|
|||||||||||||||
| Total Commitments |
$ | 21,154 | $ | 79,197 | $ | 75,328 | $ | 69,489 | $ | 64,648 | $ | 754,147 | $ | 1,063,963 | ||||||||||||||
|
|
|
|
|
|
|
|
|
|
|
|
|
|
|
|||||||||||||||
We lease certain facilities and equipment under various operating lease agreements with expiration dates through 2026. These products typically contain renewal options of five to ten years. Additionally, with the acquisitions of Winroc-SPI and Ken API in 2016, we assumed capital lease obligations with lease terms ranging from five to 15 years.
ABL Credit Facility
On August 9, 2016, we entered into the ABL Credit Facility, a senior secured asset-based revolving credit facility, and on September 23, 2016, we entered into an incremental facility amendment to the ABL Credit Facility, increasing the size of the revolving commitments thereunder by $50.0 million. The ABL Credit Facility provides for a $300.0 million revolving credit facility and matures on February 9, 2021. The ABL Credit Facility includes an option to further increase the maximum commitments up to an aggregate amount not to exceed the greater of (i) $50.0 million and (ii) such amount as would not cause the total revolving commitments under the ABL Credit Facility to exceed the aggregate borrowing base under the ABL Credit Facility by more than $50.0 million, in each case as of the date of such incurrence, subject to the conditions set forth in the ABL Credit Agreement.
Interest on borrowings under the ABL Credit Agreement accrues at a rate equal to LIBOR or CDOR (as applicable, based on the currency of the borrowing) plus a margin of 1.25% to 1.75% based on average daily availability for the most recent fiscal year, or if selected by the borrower, ABR or the Canadian prime rate (as applicable, based on the currency of the borrowings) plus a margin of 0.25% to 0.75% based on average daily availability for the most recent fiscal quarter, in all such cases subject to an additional 2.0% on overdue amounts during certain default events.
The ABL Credit Agreement contains customary covenants, representations and warranties and events of default, including covenants which generally restrict our business and limit our ability to, among other things: dispose of certain assets; incur or guarantee additional indebtedness; enter into new lines of business; make certain investments, intercompany loans
99
Table of Contents
or payments in respect of indebtedness; incur or maintain liens; modify certain terms of our or their organizational documents, certain agreements or certain debt instruments; declare or pay dividends or make other restricted payments (including redemption of our stock); engage in certain transactions with affiliates; enter into certain sale leaseback transactions; modify the terms of certain of our existing contractual agreements; and engage in mergers, consolidations or the sale or disposition of substantially all of its assets. The ABL Credit Agreement also includes representations and warranties which we must be able to make in order to obtain borrowings under the facility, and a financial maintenance covenant and events of default related to, among other things: the non-payment of principal, interest or fees; violations of covenants; material inaccuracy of representations or warranties; failure to timely deliver a borrowing base certificate; certain bankruptcy events; certain events under the Employee Retirement Income Security Act of 1974, as amended; invalidity of guarantees or security interests; default in payment under or the acceleration of other indebtedness; material judgments; and certain change of control events, each of which could result in the facility being terminated and any outstanding debt becoming due prior to its scheduled maturity. The financial maintenance covenant under the ABL Credit Agreement is a minimum fixed charge coverage ratio test set at a level of 1.00:1.00, which is based in part on our adjusted EBITDA as calculated pursuant to the ABL Credit Agreement. At September 30, 2016, the fixed charge coverage ratio was 2.70:1.00, exceeding the minimum requirement. This covenant is only tested at times when availability under the ABL Credit Facility is less than a certain threshold, which was $30.0 million at September 30, 2016.
We believe the ABL Credit Facility is a material agreement that impacts our liquidity. As of September 30, 2016, the majority of our liquidity was from the $110.0 million available under the ABL Credit Facility. The fixed charge coverage ratio is a material term of the ABL Credit Facility and we believe information about how the covenant is calculated is material to an investor’s understanding of the Company’s financial condition and liquidity.
Should we not comply with the fixed charge coverage ratio, we would be in technical default of our ABL Credit Facility which could result in the facility being terminated and any outstanding debt becoming due prior to its scheduled maturity. Should all amounts become due immediately, we may be unable to pay all amounts due under the ABL Credit Facility without a material impact to our business, as we may be forced to liquidate assets to pay for all amounts due under the ABL Credit Facility.
Notes
In August 2016, we completed a private offering of $575.0 million in aggregate principal amount of Notes. In the offering we received net proceeds of approximately $563.5 million, which were used in part to repay and terminate the 2015 Credit Facility. The Notes carry a coupon of 8.25% per annum and mature August 15, 2021. The Indenture contains customary covenants, representations and warranties and events of default, including covenants which generally restrict our business and limit our ability to incur additional indebtedness, issue certain preferred shares, pay dividends, redeem our stock or make other distributions, make certain investments, limit the ability of our restricted subsidiaries to pay dividends to us or make other intercompany transfers, create liens, sell or transfer certain assets, engage in certain transactions with respect to all or substantially all of our assets, enter into certain transactions with affiliates and designate subsidiaries as unrestricted subsidiaries. The Indenture also contains events of default related to, among other things: the non-payment of principal, premium or interest on any Note; violations of any agreement or obligation contained in the Indenture and related documents; certain bankruptcy events; invalidity of guarantees or security interests; default in payment under or the acceleration of other indebtedness; and material judgments, any of which could result in the trustee for the Notes declaring the principal of the Notes together with all accrued and unpaid interest thereon to be immediately due and payable.
100
Table of Contents
Off-Balance Sheet Arrangements
As of September 30, 2016 and December 31, 2015, we had no material off-balance sheet arrangements or similar obligations, such as financing or unconsolidated variable interest entities.
Critical Accounting Policies
Our management’s discussion and analysis of our financial condition and results of operations is based on our consolidated financial statements, which have been prepared in accordance with GAAP. The preparation of these financial statements requires management to make estimates and assumptions that affect the reported amounts of assets and liabilities, disclosure of contingent assets and liabilities at the date of the financial statements and the reported amounts of revenue and expenses during the reported period.
On an ongoing basis, management evaluates its estimates, including those related to revenue recognition, allowance for doubtful accounts, inventories, taxes, and goodwill. We base our estimates and judgments on historical experience and on various other factors that we believe to be reasonable under the circumstances, the results of which form the basis for making judgments about the carrying values of assets and liabilities that are not readily apparent from other sources. Actual results may materially differ from these estimates under different assumptions or conditions.
Use of Estimates
The preparation of financial statements in conformity with GAAP requires management to make estimates and assumptions that affect the reported amounts of assets and liabilities and disclosure of contingent assets and liabilities as of the date of the financial statements and the reported amounts of revenues and expenses during the reporting period. Estimates that are more susceptible to change in the near term are the allowance for doubtful accounts, the allowance for excess and obsolete inventory and recoverability of long-lived assets. Actual results could materially differ from those estimates.
Revenue Recognition
We recognize revenue when the risks and obligations of ownership have been transferred to the customer, which generally occurs at the time of delivery to the customer. At the time that revenue is recognized we record reductions in sales for customer rebates and discounts including volume, cash and other discounts. Rebates and discounts are recorded based on management’s best estimate when products are sold based on historical experience for similar programs and products. Management reviews these rebates and discounts on an ongoing basis and the related accruals are adjusted, if necessary, as additional information becomes available. Historically, our actual customer rebates and discounts have not been materially different from management’s original estimates.
Accounts Receivable
We sell to customers using credit terms customary in its industry. Accounts receivables are recorded at net realizable value. This value includes an appropriate allowance for estimated uncollectible accounts to reflect any loss anticipated on the trade accounts receivable balances and charged to the provision for doubtful accounts. The allowance for doubtful accounts reflects our estimate of credit exposure, determined principally on the basis of our collection
101
Table of Contents
experience, aging of our receivables and significant individual account credit risk. If the actual uncollected amounts significantly exceed the estimated allowance, our operating results would be significantly adversely affected.
Other Receivables
Other receivables primarily consist of vendor rebates receivables. Typical arrangements with vendors provide for us to receive a rebate of a specified amount after achieving any of a number of measures generally related to the volume of purchases over a period of time. We record these rebates to effectively reduce the cost of sales in the period in which the product is sold. Throughout the year, our estimates include the amount of rebates receivable for the vendor programs based on the expected level of purchases. We accrue for vendor rebates earned based on purchase volumes and adjust inventories to reflect the reduction in the cost basis for inventories purchased that are subject to vendor rebates. Historically, our actual vendor rebates have not been materially different from management’s original estimates.
Inventories
Inventories, consisting substantially of finished goods, are valued at the lower of cost or market (net realizable value). Cost is determined using the moving weighted-average cost method. We routinely evaluate inventory for excess or obsolescence and consider factors such as historical usage and purchase rates and record a provision for excess and obsolete inventory. If we determine that a smaller or larger reserve is appropriate, we will record a credit or a charge to cost of sales in the period in which we make such a determination.
Impairment of Long-Lived Assets
We review property and equipment for impairment when events or circumstances indicate these assets may not be recoverable. Factors considered include significant underperformance relative to expected historical or projected future operating results, significant changes in the manner of use of the acquired assets or the strategy for the overall business and significant negative industry or economic trends. In performing the review for recoverability, future cash flows expected to result from the use of the asset and its eventual disposition are estimated. If the sum of expected future undiscounted cash flows is less than the carrying amount of the asset, an impairment loss is recorded for the amount by which the carrying amount exceeds the estimated fair value. We use our best judgment based on current facts and circumstances related to its business when making these estimates.
Intangible Assets and Goodwill
Intangible assets consist of tradenames, customer relationships and favorable and unfavorable leases under market rent, and are amortized using the straight-line method, which reflects the pattern in which the economic benefits of the assets are expected to be consumed. Intangible assets with definite lives are amortized over their respective estimated useful lives. For favorable and unfavorable leases under market rent, amounts are amortized over their contractual terms.
We review intangible assets with finite lives for impairment when events or circumstances indicate these assets may not be recoverable. In performing the review for recoverability, future cash flows expected to result from the use of the asset are estimated. If the sum of expected future undiscounted cash flows is less than the carrying amount of the asset, an impairment loss is recorded for the amount by which the carrying amount exceeds the estimated fair value.
102
Table of Contents
Goodwill represents the excess of purchase price over fair value of assets acquired and liabilities assumed in a business combination.
We perform our impairment test annually at the reporting unit level or more frequently if impairment indicators arise. We have defined our reporting units consistently with our operating segments. For our goodwill impairment assessment we have adopted a standard that provides an entity the option to first assess qualitative factors to determine whether the existence of events or circumstances leads to a determination that it is more likely than not (greater than 50 percent chance) that the fair value of a reporting unit is less than its carrying amount. Such qualitative factors may include the following: macroeconomic conditions; industry and market considerations; cost factors; overall financial performance; consistency of customer base; and other relevant entity-specific events. In the absence of sufficient qualitative factors, goodwill impairment is determined utilizing a two-step process. This process involves comparing the fair value to the carrying value of the reporting unit. If the carrying value of the net assets assigned to the reporting unit exceeds the fair value of the reporting unit, then we must determine the implied fair value of the reporting unit’s goodwill and compare it to the carrying value of the reporting unit’s goodwill. We determine the fair value of its reporting units using combinations of both the income and market valuation approaches.
During 2015, we performed our annual impairment assessment of goodwill, which did not indicate that an impairment existed.
Acquisition Accounting
We account for business combinations using the purchase method, which requires us to allocate the cost of an acquired business to the acquired assets and liabilities based on their estimated fair values at the acquisition date. We recognize the excess of an acquired business’s cost over the fair value of the acquired assets and liabilities as goodwill. Determining the fair value of certain assets and liabilities acquired is judgmental in nature and often involves the use of significant estimates and assumptions. We use a variety of information sources to determine the fair value of acquired assets and liabilities and we generally use third party appraisers to assist us in the determination of the fair value and useful lives of identifiable intangible assets.
Income Taxes
We use the asset and liability method of accounting for income taxes. Under this method, we recognize income tax expense for the amount of taxes payable or refundable for the current year and for the amount of deferred tax liabilities and assets for the future tax consequences of events that have been recognized in our financial statements or tax returns. We make assumptions, judgments and estimates to determine our current provision for income taxes, our deferred tax assets and liabilities, and our uncertain tax positions. Our judgments, assumptions and estimates relative to the current provision for income tax take into account current tax laws, our interpretation of current tax laws and possible outcomes of current and future audits conducted by foreign and domestic tax authorities. Changes in tax law or our interpretation of tax laws and the resolution of current and future tax audits could significantly affect the amounts provided for income taxes in our consolidated financial statements. Our assumptions, judgments and estimates relative to the value of a deferred tax asset take into account predictions of the amount and category of future taxable income. Actual operating results and the underlying amount and category of income in future years could cause our current assumptions, judgments and estimates of recoverable net deferred taxes to be inaccurate. Changes in any of the assumptions, judgments and estimates mentioned above could cause our actual income tax obligations to differ from our estimates, which could materially affect our
103
Table of Contents
financial position and results of operations. Our tax provision for interim periods is determined using an estimate of our annual effective tax rate, adjusted for discrete items, if any, that are taken into account in the relevant period. As the calendar year progresses, we periodically refine our estimate based on actual events and earnings by jurisdiction. This ongoing estimation process can result in changes to our expected effective tax rate for the full calendar year. When this occurs, we adjust the income tax provision during the quarter in which the change in estimate occurs so that our year-to-date provision equals our expected annual effective tax rate.
Recently Issued Accounting Standards
In May 2014, the FASB issued ASU 2014-09, Revenue from Contracts with Customers (Topic 606), or ASU 2014-09. ASU 2014-09 amends the guidance for revenue recognition to replace numerous, industry-specific requirements. The core principle of the ASU is that an entity should recognize revenue for the transfer of goods or services equal to the amount that it expects to be entitled to receive for those goods or services. The ASU implements a five-step process for customer contract revenue recognition that focuses on transfer of control, as opposed to transfer of risk and rewards. The amendment also requires enhanced disclosures regarding the nature, amount, timing and uncertainty of revenues and cash flows arising from contracts with customers. Additional ASUs have been issued to amend or clarify the ASU as follows:
| • | ASU No. 2016-12 Revenue from Contracts with Customers (Topic 606): Narrow-Scope Improvements and Practical Expedients was issued in May 2016. ASU No. 2016-12 amends the new revenue recognition standard to clarify the guidance on assessing collectability, presenting sales taxes, measuring noncash consideration, and certain transition matters. |
| • | ASU No. 2016-10 Revenue from Contracts with Customers (Topic 606): Identifying Performance Obligations and Licensing was issued in April 2016. ASU No. 2016-10 addresses implementation issues identified by the FASB-International Accounting Standards Board Joint Transition Resource Group for Revenue Recognition (TRG). |
| • | ASU No. 2016-08 Revenue from Contracts with Customers (Topic 606): Principal versus Agent Considerations (Reporting Revenue Gross versus Net) was issued in March 2016. ASU No. 2016-08 requires an entity to determine whether the nature of its promise to provide goods or services to a customer is performed in a principal or agent capacity and to recognize revenue in a gross or net manner based on its principal/agent designation. |
The guidance in these ASUs is effective for annual reporting periods beginning after December 15, 2017, including interim periods within that reporting period, and early adoption is permitted for interim and annual periods beginning after December 15, 2016. We are currently evaluating the impact of adopting ASU 2014-09, 2016-12, 2016-10 and 2016-08.
In August 2014, the FASB issued ASU 2014-15, Presentation of Financial Statements—Going Concern (Subtopic 205-40): Disclosures of Uncertainties about an Entity’s Ability to Continue as a Going Concern, or ASU 2014-15. ASU 2014-15 requires management to evaluate whether there are conditions or events that raise substantial doubt about the entity’s ability to continue as a going concern within one year after the date that the financial statements are issued or are available to be issued. This ASU also requires management to disclose certain information depending on the results of the going concern evaluation. The provisions of this ASU are effective for annual periods ending after December 15, 2016, including interim reporting periods thereafter. The Company is currently evaluating the impact of this accounting guidance and does not expect any material impact on its consolidated financial statements.
104
Table of Contents
In July 2015, the FASB issued ASU 2015-11, Simplifying the Measurement of Inventory, or ASU 2015-11, which applies to inventory valued at first-in, first-out (FIFO) or average cost. ASU 2015-11 requires inventory to be measured at the lower of cost and net realizable value, rather than at the lower of cost or market. ASU 2015-11 is effective on a prospective basis for annual periods beginning after December 15, 2016, and interim periods within those fiscal years. The Company reports inventory on an average-cost basis and thus will be required to adopt the standard; however, the provisions of ASU 2015-11 are not expected to have a material effect on the Company’s consolidated financial condition.
In September 2015, the FASB issued ASU 2015-16, Business Combinations (Topic 805): Simplifying the Accounting for Measurement-Period Adjustments, or ASU 2015-16. ASU 2015-16 eliminates the requirement to restate prior period financial statements for measurement period adjustments. The new guidance requires that the cumulative impact of a measurement period adjustment (including the impact on prior periods) be recognized in the reporting period in which the adjustment is identified. In addition, separate presentation on the face of the income statement or disclosure in the notes is required regarding the portion of the adjustment recorded in the current period earnings, by line item, which would have been recorded in previous reporting periods if the adjustment to the provisional amounts had been recognized as of the acquisition date. ASU 2015-16 is to be applied prospectively for measurement period adjustments that occur after the effective date. ASU 2015-16 is effective for annual reporting periods beginning after December 15, 2015, including interim periods within those fiscal years. Early adoption is permitted and the Company intends to adopt in fiscal year 2016. Since it is prospective, the impact of ASU 2015-16 on the Company’s financial condition and earnings will depend upon the nature of any measurement period adjustments identified in future periods.
In November 2015, the FASB issued ASU 2015-17, Income Taxes (Topic 740): Balance Sheet Classifications of Deferred Taxes. Companies are required to classify all deferred tax assets and liabilities as noncurrent on the balance sheet instead of separating deferred taxes into current and noncurrent amounts. Also, companies will no longer allocate valuation allowances between current and noncurrent deferred tax assets because those allowances also will be classified as noncurrent. The guidance is effective for financial statements issued for annual periods beginning after December 15, 2016, and interim periods within those annual periods. Companies can adopt the guidance either prospectively or retrospectively. The Company is evaluating the impact of this accounting guidance on its consolidated financial statements.
In February 2016, the FASB issued ASU 2016-02, Leases (Topic 842), or ASU 2016-02. ASU 2016-02 establishes a right-of-use model that requires a lessee to record a right-of-use asset and a lease liability on the balance sheet for all leases with terms longer than twelve months. Leases will be classified as either “finance” or “operating,” with classification affecting the pattern of expense recognition in the income statement. This update requires a modified retrospective transition as of the beginning of the earliest comparative period presented in the financial statements. This update is effective for fiscal years beginning after December 15, 2018, and interim periods within those fiscal years. Early adoption is permitted. The Company is evaluating the impact of this guidance on its consolidated financial statements.
In August 2016, the FASB issued ASU 2016-15, Statement of Cash Flows (Topic 230): Classification of Certain Cash Receipts and Cash Payments. ASU 2016-15 amended the existing accounting standards for the statement of cash flows. The amendments provide guidance on eight classification issues related to the statement of cash flows. This update is effective for fiscal years beginning after December 15, 2017, and interim periods within those fiscal years. Early adoption is permitted. The Company is evaluating the impact of this guidance on its consolidated financial statements.
105
Table of Contents
Quantitative and Qualitative Disclosures about Market Risk
Interest Rate and Currency Risk
Our indebtedness other than borrowings under the ABL Credit Facility principally bear a fixed rate of interest.
Borrowings under our ABL Credit Facility are at variable rates of interest and allow certain borrowings in Canadian dollars, which may expose us to interest rate and currency risk. If interest rates increase, our debt service obligations on the variable rate indebtedness will increase even though the amount borrowed remained the same, and our net income and cash flows, including cash available for servicing our indebtedness, will correspondingly decrease. Our pro forma interest expense for the year ended December 31, 2015, would have been $58.1 million, a portion of which would have been based on a floating rate index. An increase of 12.5 basis points in the floating rates on the funded amounts under our ABL Credit Facility would have increased annual interest expense by approximately $0.2 million. Assuming the full available amount of $300.0 million was drawn under our ABL Credit Facility, a change of 12.5 basis points in the floating rate would result in an additional $0.4 million increase in our annual interest expense.
Derivative Financial Instruments
In August 2016, we executed an $88.0 million, 3-year foreign exchange forward contract to hedge the risk of depreciation in the Canadian dollar related to our net investment in our newly acquired Canadian subsidiaries. We have determined that this derivative qualifies for hedge accounting. As such, the effective portion of changes in the fair value of this hedging instrument are included in our statement of comprehensive income in accumulated other comprehensive income at each period end. The ineffective portion of this hedging instrument, which is insignificant, is recognized directly in our statement of operations at each period end. There is no significant credit risk associated with the net investment hedge. Refer to Note 9 in our unaudited interim financial statements included elsewhere in this prospectus.
In August 2016, we completed the private offering of the Notes. The Notes include a contingent call option whereby we can use the proceeds of an equity offering to prepay a portion of the Notes at a premium, which constitutes an embedded derivative. We bifurcated this embedded derivative from the host debt instrument, the Notes, and have determined that the initial fair value was $6.2 million. As of September 30, 2016, the fair value of the embedded derivative was $6.1 million, and therefore we recognized $0.1 million in other income, net in the statement of operations. Refer to Note 9 in our unaudited interim financial statements included elsewhere in this prospectus.
Impact of Inflation
We believe that our results of operations have not been materially impacted by the moderate changes in the economic inflation rate over the past three fiscal years.
Non-GAAP Financial Information
In addition to our results under GAAP, in this prospectus we also present EBITDA and Adjusted EBITDA for historical periods and on a pro forma basis. EBITDA and Adjusted EBITDA are non-GAAP financial measures and have been presented in this prospectus as supplemental measures of financial performance that are not required by, or presented in accordance with, GAAP. We calculate EBITDA as net income (loss) before interest expense, income tax benefit (expense), depreciation and amortization. We calculate Adjusted EBITDA as EBITDA before
106
Table of Contents
certain non-recurring adjustments such as purchase accounting adjustments impacting margins, non-cash (gains) losses on the sale of property and equipment and derivative financial instruments, management fees paid to current and former private equity sponsors, ERP implementation costs, transition period compensation, supplier program adjustments and as further adjusted to reflect cost savings in connection with the closing of the Winroc-SPI headquarters and planned branch consolidation. We present these measures for the historical periods covered by our audited annual and unaudited interim financial statements as well as on a pro forma basis for the periods reflected in and the transactions accounted for in the section entitled “Unaudited Pro Forma Condensed Combined Financial Information.”
EBITDA and Adjusted EBITDA are presented in this prospectus because they are important metrics used by management as one of the means by which it assesses our financial performance. EBITDA and Adjusted EBITDA are also frequently used by analysts, investors and other interested parties to evaluate companies in our industry. These measures, when used in conjunction with related GAAP financial measures, provide investors with an additional financial analytical framework that may be useful in assessing our company and its results of operations.
EBITDA and Adjusted EBITDA have certain limitations. EBITDA and Adjusted EBITDA should not be considered as alternatives to net income, or as any other measures of financial performance derived in accordance with GAAP. These measures also should not be construed as an inference that our future results will be unaffected by unusual or nonrecurring items for which these non-GAAP measures make adjustments. Additionally, EBITDA and Adjusted EBITDA are not intended to be liquidity measures because of certain limitations such as:
| • | they do not reflect our cash outlays for capital expenditures or future contractual commitments; |
| • | they do not reflect changes in, or cash requirements for, working capital; |
| • | they do not reflect interest expense or the cash requirements necessary to service interest or principal payments on indebtedness; |
| • | they do not reflect income tax expense or the cash necessary to pay income taxes; and |
| • | although depreciation and amortization are non-cash charges, the assets being depreciated and amortized will often have to be replaced in the future, and these non-GAAP measures do not reflect cash requirements for such replacements. |
Other companies, including other companies in our industry, may not use such measures or may calculate one or more of the measures differently than as presented in this prospectus, limiting their usefulness as a comparative measure.
In evaluating EBITDA and Adjusted EBITDA, you should be aware that in the future we will incur expenses that are the same as or similar to some of the adjustments made in our calculations and our presentation of EBITDA and Adjusted EBITDA should not be construed to mean that our future results will be unaffected by such adjustments. Management compensates for these limitations by using EBITDA and Adjusted EBITDA as supplemental financial metrics and in conjunction with our results prepared in accordance with GAAP. The non-GAAP information below and elsewhere in this prospectus should be read in conjunction with our audited annual and unaudited interim financial statements and the related notes, the historical financial statements of Winroc-SPI, Ken API, Great Western and GSCIL and the related notes included elsewhere in this prospectus and the information set forth in the section entitled “Unaudited Pro Forma Condensed Combined Financial Information.”
107
Table of Contents
The following is a reconciliation of EBITDA and Adjusted EBITDA to the nearest GAAP measure, net income (loss):
| Successor | Predecessor | Successor | Predecessor | |||||||||||||||||
| Nine Months Ended September 30, 2016 |
Nine Months Ended September 30, 2015 |
October 9 to December 31, 2015 |
January 1 to October 8, 2015 |
Year Ended December 31, 2014 |
||||||||||||||||
| (in thousands) |
||||||||||||||||||||
| Net income (loss) |
$ | (19,566 | ) | $ | 278 | $ | (7,926 | ) | $ | (29,455 | ) | $ | (1,841 | ) | ||||||
| Interest expense, net(a) |
37,184 | 15,703 | 7,035 | 19,076 | 9,944 | |||||||||||||||
| Income tax (benefit) expense |
(5,358 | ) | (1,325 | ) | (4,733 | ) | (1,294 | ) | 812 | |||||||||||
| Depreciation and amortization |
33,605 | 15,125 | 7,170 | 15,615 | 11,729 | |||||||||||||||
|
|
|
|
|
|
|
|
|
|
|
|||||||||||
| EBITDA |
$ | 45,865 | $ | 29,781 | $ | 1,546 | $ | 3,942 | $ | 20,644 | ||||||||||
|
|
|
|
|
|
|
|
|
|
|
|||||||||||
| Unrealized non-cash gains on derivative financial instruments(b) |
(148 | ) | — | — | — | — | ||||||||||||||
| Non-cash, purchase accounting effects(c) |
6,372 | 1,606 | 7,453 | 1,606 | — | |||||||||||||||
| (Gain) loss on disposal of property and equipment(d) |
243 | 216 | (30 | ) | 281 | 202 | ||||||||||||||
| Management fees(e) |
2,719 | 20 | — | 20 | 80 | |||||||||||||||
|
|
|
|
|
|
|
|
|
|
|
|||||||||||
| Adjusted EBITDA |
$ | 55,051 | $ | 31,623 | $ | 8,969 | $ | 5,849 | $ | 20,926 | ||||||||||
|
|
|
|
|
|
|
|
|
|
|
|||||||||||
| (a) | Represents interest expense and interest income. In addition, included in interest expense, the Company incurred a loss of $7.0 million related to the refinancing of the 2015 Credit Facilities. |
| (b) | Represents non-cash expense related to unrealized gains on derivative financial instruments. |
| (c) | Adjusts for the effect of the purchase accounting step-up in the value of inventory to fair value recognized in cost of goods sold as a result recent acquisitions. |
| (d) | Represents non-cash (gains) losses on the sale of property and equipment. |
| (e) | Represents fees paid to the Sponsor and former private equity sponsors for services provided pursuant to past and present management agreements. These fees will no longer be incurred subsequent to the initial public offering. |
108
Table of Contents
Selected Acquisitions
The following is a reconciliation of net income to EBITDA and Adjusted EBITDA for Winroc-SPI, Ken API, GSCIL and Great Western for the latest fiscal year audited financial statements. See the audited and unaudited financial statements and the related notes included elsewhere in this prospectus for each acquisition noted.
| Winroc-SPI | Ken API | GSCIL | Great Western | |||||||||||||
| Year Ended December 31, 2015 |
Year Ended December 31, 2015 |
January 1, 2015 to December 30, 2015 |
Year Ended December 31, 2014 |
|||||||||||||
| (in thousands) | ||||||||||||||||
| Revenue, reported |
$ | 745,309 | $ | 54,990 | $ | 107,715 | $ | 166,169 | ||||||||
| Net income, reported |
4,155 | 3,282 | 6,551 | 6,466 | ||||||||||||
| Interest expense, net |
13,515 | 368 | 183 | 549 | ||||||||||||
| Income tax expense |
3,251 | — | — | — | ||||||||||||
| Depreciation and amortization |
5,826 | 1,159 | 1,551 | 1,013 | ||||||||||||
|
|
|
|
|
|
|
|
|
|||||||||
| EBITDA |
$ | 26,747 | $ | 4,809 | $ | 8,285 | $ | 8,028 | ||||||||
| Unrealized non-cash losses on derivative financial instruments(a) |
6,570 | — | — | — | ||||||||||||
| (Gain) loss on sale of fixed assets(b) |
100 | (43 | ) | 4 | — | |||||||||||
|
|
|
|
|
|
|
|
|
|||||||||
| Adjusted EBITDA |
$ | 33,417 | $ | 4,766 | $ | 8,289 | $ | 8,028 | ||||||||
|
|
|
|
|
|
|
|
|
|||||||||
| (a) | Represents non-cash expense related to unrealized losses on derivative financial instruments. |
| (b) | Represents non-cash (gains) losses on the sale of property and equipment. |
109
Table of Contents
INDUSTRY
We participate in the U.S. and Canadian markets for the specialty distribution of wallboard, suspended ceiling systems, metal framing and other products, and the custom fabrication and distribution of commercial and industrial insulation products. As distributor consolidation has continued, we believe scale has grown increasingly important. Larger distributors are generally able to achieve better pricing from manufacturers through scaled purchasing. We believe that larger distributors like us are better positioned to capture a greater share of volume growth given their more extensive and diverse customer bases, and that larger distributors like us with variable cost structures will continue to see incremental margin improvement from increased volume through economies of scale.
Wallboard and suspended ceiling systems
Based on industry research and public filings, we estimate the total United States and Canada market for the distribution of wallboard and suspended ceiling systems was approximately $14.0 billion in 2015, approximately 70% of which was served by specialty building products distributors rather than other channels such as big box retailers and lumberyards. Specialty distributors play a critical role in this industry by connecting a concentrated set of suppliers with a diverse and fragmented set of non-residential and residential construction contractors. Of the four largest national wallboard distributors, we are one of two actively consolidating wallboard specialty distributors. Our remaining competitors are generally smaller regional and local firms, many of which we view as attractive acquisition opportunities.
Companies in our industry compete based on key value-added services, including broad product selection, nearby branches, logistics planning, specialized and same-day delivery capabilities, stocking services, trade credit and technical product expertise in local markets. We believe these characteristics, combined with strong supplier and customer relationships, create significant barriers to entry for de novo market entrants. Barriers to entry, along with the highly fragmented nature of the industry (with hundreds of local or regional players), are catalysts for significant consolidation, and we believe we have been one of the most active acquirers of companies in our industry since January 2013.
Source: Management estimates
110
Table of Contents
Wallboard
The cost, ease of installation, fire-resistance and sound absorption capabilities of wallboard make it the preferred wall covering of choice for most residential and commercial applications. According to the Gypsum Association, wallboard is now used in over 97% of new single- and multi-family homes and given its low price point relative to other alternative materials, we believe there is no economical substitute for either residential or commercial applications. Approximately half of all wallboard demand is due to repair and remodel activity versus new construction. The wallboard manufacturing industry has experienced significant consolidation over the past 15 years, and currently the four largest manufacturers, USG, National Gypsum, Georgia Pacific and CertainTeed, control an estimated 67% of industry capacity according to IBISWORLD. As the wallboard manufacturing industry has consolidated, manufacturing capacity has been rationalized below peak levels. As the housing recovery has progressed, reduced capacity in combination with improved utilization has allowed wallboard manufacturers and distributors to implement substantial price increases. While we believe price increases can be a tailwind to wallboard distributors, we also believe price changes impact distributors’ profit margins less than wallboard manufacturers as a result of distributors’ generally more variable cost structure.
Demand for wallboard is highly correlated to the construction cycle. Over the last four years, the recovery of the U.S. housing market has driven a significant rebound in demand as industry wallboard volumes increased at a 6.4% CAGR between 2011 and 2015, according to the Gypsum Association. Wallboard manufacturing capacity utilization has also improved as a result of the rebound in volumes, increasing from 52% in 2011 to 67% in 2015, according to the Gypsum Association. A continued increase in activity and demand over the next few years is expected to further improve utilization levels, with total capacity utilization projected to rebound to approximately 81% by 2018 as forecasted by Longbow Research.
When demand increases, manufacturers typically gain more leverage in terms of product allocations to their distributors. However, we have been able to maintain preferred product allocations during periods of increased demand due to our scale as well as our longstanding relationships with various manufacturers.
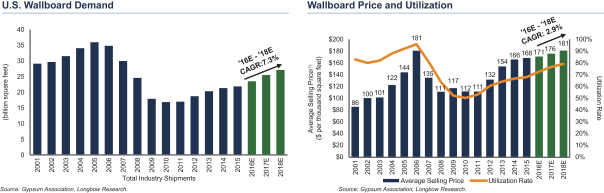
| (1) | Reflects producer prices for wallboard only. |
Management estimates that approximately 60% to 70% of wallboard is sold through specialty building products distributors, of which we are one. The remainder is sold through big-box home centers and independent lumber yards which service the “do-it-yourself” market and direct to modular home manufacturers. Distributors serve as the vital intermediaries between manufacturers and wallboard contractors, builders, remodelers, residential contractors
111
Table of Contents
and non-residential contractors. Manufacturers rely on distributors for their broad geographic reach, service and delivery capabilities, inventory management, customer credit screening and end market connectivity.
Distribution of wallboard is typically regionally based due to high transportation costs for both raw materials and finished wallboard products. As a result, our industry is highly fragmented and we believe the top three distributors represent only about a third of the overall market. Large specialty building products distributors have significant advantages, including economies of scale, broad product offering, geographic reach, brand recognition and in certain instances, exclusive contractual or relationship-based distribution rights.
As distributor consolidation has continued, we believe scale has grown increasingly important. Larger distributors are generally able to achieve better pricing from manufacturers through scaled purchasing. We believe that larger distributors like us are better positioned to capture a greater share of volume growth given their extensive and diverse customer bases, and that larger distributors like us with variable cost structures will continue to see incremental margin improvement from increased volume through economies of scale.
Suspended ceiling systems
Suspended ceiling systems are used primarily in commercial construction applications and are often specified by architects and engineers seeking certain aesthetic and acoustical performance properties for the spaces they design. Consequently, suspended ceiling systems come in a variety of specialized SKUs and have less product standardization than many other types of building products. The vast majority of suspended ceiling systems sold in the United States and Canada are produced by two manufacturers, Armstrong and USG, who collectively have approximately 80% market share, according to industry research and public filings. Distributors of suspended ceiling systems often operate at the local branch level with a specific manufacturer who provides exclusive or semi-exclusive contractual or relationship-based distribution rights within a given geographic area. These relationships tend to be stable over time and are an important source of pull-through demand for wallboard and accessory sales as contractors seek specific suspended ceiling system products and then consolidate their purchases of wallboard and other products with that distributor for convenience. Due to its consolidated manufacturing base, the continued improvement in suspended ceiling systems features and performance and the fact that approximately 75% of suspended ceiling systems demand is for replacement and renovation work according to industry research and public filings, pricing for suspended ceiling systems has been relatively stable across economic cycles with average selling price increases of approximately 3% per square foot from 2013 to 2015.
Comparison between wallboard and ceiling systems distribution and roofing distribution
We believe meaningful parallels exist between the specialty distribution markets for our wallboard and suspended ceiling systems products and roofing materials. Both markets exhibit a similar value proposition to customers and suppliers; enjoy a balanced mix of residential and commercial construction end markets; benefit from growth in new construction and the relative stability of repair and remodel activity; generate comparable margins; and utilize similar fleets of specialized delivery vehicles and logistical processes. There has been a significant consolidation of roofing material suppliers over the past 15 years, and our industry has begun to consolidate as the roofing distribution industry did over this period. We believe this lag in consolidation in the wallboard and suspended ceiling systems distribution industry as compared to the roofing distribution industry highlights the opportunity for us to continue to grow our business through acquisitions.
112
Table of Contents
Comparison between wallboard and ceiling systems distribution and lumber distribution
We believe wallboard and suspended ceiling systems distribution is significantly differentiated from lumber distribution because wallboard and suspended ceiling systems distribution often requires a fleet of specialized delivery vehicles and meaningful logistical expertise whereas lumber distribution uses standardized equipment and requires limited expertise. In addition, wallboard and suspended ceiling systems supplier bases are consolidated and provide predictable future pricing, whereas lumber suppliers are highly fragmented with pricing volatility. Finally, wallboard and suspended ceiling systems distributors generally generate higher margins than lumber distributors due, in part, to the specialization and expertise involved in wallboard and suspended ceiling systems distribution.
Mechanical insulation
According to Ducker Worldwide, the mechanical insulation market for the distribution of commercial and industrial insulation in the United States was approximately $2.6 billion in 2015. Like wallboard and suspended ceiling systems, we believe specialty distributors of commercial and industrial insulation products hold a strong position in the value chain and provide a number of value-added capabilities to customers and suppliers, including the custom fabrication of commercial and industrial insulation products such as fiberglass, metal cladding, mineral wool and foam. Custom fabricated products eliminate the specialty contractor’s need to cut and form insulation on site, thereby reducing waste and labor costs. We believe insulation contractors generally prefer to consolidate purchases with a single distributor and such contractors often choose their distributor based on custom fabrication capabilities. As a result, custom fabrication of commercial and industrial insulation products by distributors provides the potential to grow revenues for distributors through an increased demand for other insulation products and accessories. Key end markets for commercial and industrial insulation are non-residential new construction, non-residential repair and remodel and industrial MRO. Four manufacturers of fiberglass represent approximately 80% of the branch locations in the United States and Canada according to the North America Insulation Manufacturers Association.
Source: Management estimates
Commercial and industrial insulation is used in non-residential construction to wrap pipes, equipment and ductwork in HVAC systems for the purpose of improving energy efficiency. Non-residential construction spending and changes in the energy efficiency standards are key drivers of demand for these types of applications. In particular, the need to meet stricter building codes and the certification of commercial buildings to achieve established energy efficiency standards have been positive contributors to industry growth the past few years. In the industrial markets, commercial and industrial insulation is used primarily to insulate and protect piping and equipment in manufacturing plants and processing facilities. The key drivers of commercial and industrial insulation demand are capital spending, both new and replacement, and MRO spending for facility maintenance.
113
Table of Contents
End market overview
New Non-Residential Construction
Non-residential construction encompasses all construction other than residential structures, including commercial construction. Non-residential construction growth is primarily influenced by economic growth, business investment, job growth, vacancy rates and availability and cost of capital. Based on U.S. Census Bureau data, growth in commercial construction spending generally lags new residential spending by approximately 18 months and we believe the commercial construction market remains in the early stages of a strong recovery. According to Dodge Data & Analytics, non-residential construction starts were 962 million square feet in 2015 and would need to increase by 32.2% to achieve the historical annual market average of 1,273 million square feet since 1970. Given the recent growth in the residential market, management believes that non-residential construction in the early stages of its recovery and expects volumes to gain momentum in the coming years. According to Dodge Data & Analytics, non-residential construction starts are expected to grow at approximately a 5.4% CAGR from 2016 to 2018 driven by accommodative underlying macroeconomic growth, greater availability of financing, underinvestment during the downturn and increasing office utilization rates.
New Non-Residential Construction
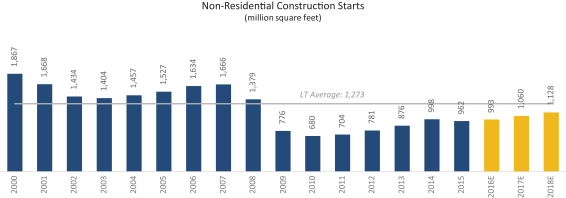
Source: Dodge Data & Analytics
New Residential Construction
Job growth is an important factor for a healthy housing market and unemployment has fallen from its peak of 10.0% in 2009 to 5.0% as of September 2016 according to the U.S. Bureau of Labor Statistics. According to the U.S. Bureau of Labor Statistics, total housing starts in 2015 were 1.11 million, an eight-year high and an increase of 10.8% as compared to 2014. While housing starts have significantly recovered from the 0.55 million seen in 2009, they are still 29.8% below the 50-year average of 1.44 million starts per year. The National Association of Homebuilders expects housing starts will grow to approximately 1.37 million by 2018, but still below long-term historical average as reported by the U.S. Census Bureau.
114
Table of Contents
New Residential Construction
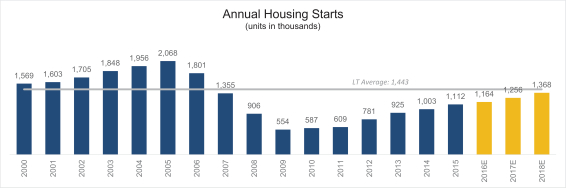
Source: U.S. Census Bureau and National Association of Homebuilders
Non-residential Repair and Remodel Construction
Non-residential repair and remodeling spending tends to be resilient through economic downturns. From 2011 to 2015 non-residential repair and remodeling spending grew at a 5.6% CAGR and are expected to continue to grow at a 2.1% CAGR through 2018 according to Dodge Data & Analytics.
Non-residential Repair and Remodel Construction
Non-Residential Alterations Spend
($ in billions)
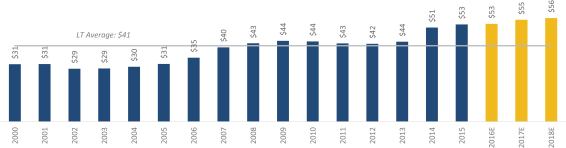
Source: Dodge Data & Analytics
115
Table of Contents
Our Company
We are the second largest specialty distributor of wallboard and suspended ceiling systems in the United States and Canada, and the fastest growing by revenue and branch count since our founding in 2011. We are also the second largest specialty distributor and one of the largest fabricators of commercial and industrial mechanical insulation in the United States. We have expanded from a single branch in Southern California to 210 branches across the United States and Canada as of December 31, 2016, carrying a broad array of more than 35,000 SKUs. Our organic growth initiatives and disciplined acquisition strategy have enabled us to grow rapidly. Our net sales in 2013 were $113.7 million and we reached pro forma net sales of $1.4 billion for the nine months ended September 30, 2016. We have grown revenue faster than any U.S. publicly traded building products distributor over the same period. Our goal is to be the leading company within specialty building products distribution and to continue expanding into complementary markets.
We serve as a critical link between our supplier base and a diverse and highly fragmented base of over 30,000 customers. Our specialty building products segment, which distributes wallboard and accessories, metal framing, suspended ceiling systems and other products, accounted for approximately 85% of our pro forma net sales for the nine months ended September 30, 2016. Within this segment, we distribute products to contractors who install them in commercial and residential buildings for both new construction and repair and remodeling projects. Our mechanical insulation segment, which distributes commercial and industrial insulation products to provide insulation solutions for pipes and mechanical systems, accounted for approximately 15% of our pro forma net sales for the nine months ended September 30, 2016. We fabricate and distribute these products for specialty contractors seeking to improve or maintain energy efficiency in a diverse range of commercial and industrial buildings. Our customers use these products in MRO and new construction.
We have an expansive branch network that serves attractive markets across the United States and in Canada, as shown in the map below.
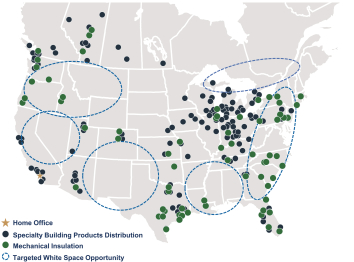
The ability to leverage our expansive branch network, together with our organic growth initiatives and disciplined acquisition strategy, has allowed us to drive significant share gains in
116
Table of Contents
the wallboard distribution market. According to the Gypsum Association, the U.S. wallboard market experienced volume growth of 4.9% and 2.6% in 2014 and 2015, respectively. We experienced higher growth than the industry during this period, generating wallboard volume growth of 7.2% and 7.7% in 2014 and 2015, respectively (including volume for the Company and, with respect to each acquired entity, volume for each such entity for the entire year of acquisition and the year prior to acquisition). We have increased our U.S. wallboard market share from 2.6% in 2013 to 7.6% for the nine months ended September 30, 2016, and we see significant opportunity for additional market share gains.
| (1) | Market share for each period includes volume for the Company and, with respect to each acquired entity, volume for each such entity for the entire year of acquisition. |
We believe that our customers select and trust us because we have the expertise to efficiently and effectively handle and deliver a broad product offering, including wallboard, metal framing, suspended ceiling systems, commercial and industrial insulation and complementary products, and to manage the complex logistics required to safely deliver and stock the right products to the appropriate locations at each jobsite. It is critical for our contractor customers to have the correct product, when they need it, in order to complete their projects on time and on budget without costly delays. We also provide our customers with technical product expertise, including proper installation techniques for new products. With an average weight of 90 pounds per 12-foot sheet, wallboard has a high weight-to-value ratio and is challenging to physically maneuver. We typically deliver wallboard and other products directly to the floor where it will be installed, from the first floor to the penthouse of a major high rise. For delivery to higher floors we use specialized equipment, including crane loaders. For ceiling contractors, we carry a wide range of products and have the technical sales expertise to assist our customers in selecting the appropriate acoustical product for their project. For our commercial and industrial insulation customers, we often fabricate the insulation into specific shapes and sizes prior to delivery and not on site depending on its ultimate application, thereby decreasing our customers’ labor costs. Our national scale gives us the ability to serve contractors and homebuilders that operate across multiple geographic markets. Most of our customer accounts are managed by salespeople and managers who communicate with customers on a regular basis and, as a result, have developed longstanding and trusted relationships. Our top 20 customers based on pro forma net sales for the nine months ended September 30, 2016, had an average tenure of 19 years with us or one of our acquired companies, and no one customer accounted for more than 1.5% of our pro forma net sales during this period.
We have close relationships with our suppliers at both the executive and local branch level. We believe we are a preferred distributor for our suppliers due to our scale, nationwide footprint, leading market positions, knowledgeable professionals, high service levels and strong
117
Table of Contents
relationships with a broad set of contractor customers. We also believe our suppliers seek our business because we are one of the highest growth distributors in our industry and have a demonstrated ability to achieve above market growth. In suspended ceiling systems, we have exclusive distribution relationships in select geographies for certain products. These relationships include Armstrong and USG. Armstrong has supported our expansion by renewing our contractual exclusivity or extending our contractual exclusivity into additional territories after we acquired companies. This contractual exclusivity makes us the sole distributor carrying Armstrong products in certain regions. We also possess semi-exclusive distribution rights in other regions. Supplier concentration remains low across all of our product categories, and our largest supplier accounted for approximately 14% of pro forma purchases for the nine months ended September 30, 2016.
We serve a balanced mix of end markets across the new non-residential construction, new residential construction and the non-residential repair and remodel sectors. Our products are used in the construction and repair and remodel of new commercial buildings, single-family and multi-family homes and industrial facilities. We believe activity in the new construction end markets will continue to grow, since new non-residential activity and residential housing starts in the United States remain below historical averages. Our products are used for the maintenance, repair and remodel of existing structures, including industrial MRO, which we believe provides a stable source of revenue across economic cycles.
The table below summarizes our major product categories, applications and end markets.
| Our Products | ||||||||||||
| Wallboard
& |
Metal Framing |
Ceilings |
Other Products |
Commercial | ||||||||
| % of Pro Forma Net Sales for the nine months ended September 30, 2016
|
42% | 14% | 16% | 18% | 10% | |||||||
| Applications |
Interior walls and ceilings | Wallboard structural support, typically sold as part of a package with wallboard, insulation, or suspended ceiling systems | Suspended ceiling systems | Stucco/exterior insulation and finishing system, building insulation, tools, safety accessories and fasteners | Insulation solutions for pipes and mechanical systems | |||||||
|
New Non-Residential
|
✓ | ✓ | ✓ | ✓ | ✓ | |||||||
| Primary End Markets |
New Residential
|
✓ | ✓ | ✓ | ||||||||
|
Non-Residential Repair and Remodel
|
✓ | ✓ | ✓ | ✓ | ✓ | |||||||
We were founded in 2011 by our President and Chief Executive Officer Ruben Mendoza, our Chief Financial Officer John Gorey and our California Regional Vice President Tom Fischbeck.
118
Table of Contents
Mr. Mendoza previously served as CEO of Acoustical Material Services where he oversaw the successful growth of the company before it was acquired by Allied Building Products, a subsidiary of CRH, in 2007. In founding our company, Mr. Mendoza applied a proven customer- centric operating model to an organization that would combine strong organic growth with an effective acquisition and integration program across a fragmented industry. In November 2013, we strengthened our management team with the addition of our Chief Operating Officer, Pete Welly, who has 37 years of experience in our industry. Other members of our management team have spent the majority of their careers in the wallboard and suspended ceiling systems distribution industry. As a result of long and close personal relationships with many of the private owners of wallboard and suspended ceiling systems distributors, our acquisitions generally have been completed on a privately negotiated, non-auction basis. Since 2013, the majority of senior level leaders who have sold us their businesses have elected to stay on as active employees and are often our best references to owners considering a sale to us. As of December 31, 2016, our management and employees owned approximately 10.2% of our parent, which, immediately following consummation of the offering, will own approximately 70.1% of our common stock (or 65.6% if the underwriters exercise in full their option to purchase additional shares).
For the year ended December 31, 2015, we had pro forma net sales of $1.76 billion, pro forma net loss of $13.2 million and pro forma Adjusted EBITDA of $112.4 million. For the nine months ended September 30, 2016, we had pro forma net sales of $1.4 billion, pro forma net loss of $9.4 million and pro forma Adjusted EBITDA of $88.3 million. Adjusted EBITDA is a non-GAAP measure. See the section entitled “Management’s Discussion and Analysis of Financial Condition and Results of Operations—Non-GAAP Financial Information” for a discussion of how we define and calculate this measure, a reconciliation thereof to net loss, the most directly comparable GAAP measure, and a discussion of why we believe this measure is important.
Our Competitive Strengths
Market leader with significant size and scale advantages
We are the second largest specialty distributor of wallboard and suspended ceiling systems in the United States and Canada and the fastest growing by revenue and branch count since our founding in 2011. Our coast-to-coast footprint enables us to distribute our comprehensive product offering to a large, diverse set of customers and provides us with significant economies of scale that we believe give us cost advantages versus our smaller competitors.
As a leading specialty building products distributor, we are able to negotiate volume discounts and preferential pricing terms with our key suppliers. Pricing programs are negotiated nationally by our senior management who oversee supplier purchasing volumes in an effort to maximize these programs across the entire network. As we continue to grow, we believe we will realize additional cost savings and other benefits from scale.
Smaller competitors generally lack the resources to properly handle the logistical complexities of large scale specialty building products distribution. We have been able to realize procurement discounts on our large fleet of over 2,725 vehicles, and we leverage this fleet to realize operational cost advantages from economies of scale. Additionally, our local market scale adds route density, which increases our profit margins. We believe our consolidated information technology systems and central administrative functions, which are shared nationally across our platform, generate additional operating cost efficiencies.
Proven operating model
We believe that our national operating model supported by local market expertise, entrepreneurial and customer centric-culture, acquisition and integration expertise and strong
119
Table of Contents
national brand has established us as the distributor of choice for leading suppliers and over 30,000 customers across a balanced mix of construction-related end markets. Our management team originally utilized elements of this operating model while overseeing AMS and has applied them to us. Since our inception, we have invested heavily in identifying, recruiting, training and retaining highly dedicated employees. We invest in ongoing talent development and focus on rewarding performance based on profitability goals instead of pursuing revenue growth at the expense of profit margins. We reposition talent across our branch network to manage and improve branch performance.
Our technology infrastructure and “One Company” platform allows us to manage our information technology efficiently. We have established a broad, integrated business platform that allows our branch network to leverage a centralized ERP system and other back office support functions to minimize costs, while retaining important and timely decision making authority at the local level where we conduct business with our customers and can tailor our service and product offerings to their needs. This autonomy at the local level has fostered our entrepreneurial culture, while our national infrastructure support allows employees to focus on customer-first solutions. In 2016 we completed an initiative that consolidated our entire company onto one ERP platform other than with respect to the acquisitions on Winroc-SPI, United Drywall and Dominion Interior Supply.
Our operating model has been critical to our track record of above market growth and, in particular, the increase in our volume share of the U.S. wallboard market from 2.6% in 2013 to 7.6% for the nine month period ended September 30, 2016.
Local market excellence
We are a national company focused on supplying the local building material needs of each geographical area we cover according to climate, building codes, customer preference and other considerations. As of December 31, 2016, we operated 143 wallboard and suspended ceiling systems branches across 22 states in the United States and five Canadian provinces, and we had 53 mechanical insulation branches across the United States and Canada, including 14 custom fabrication facilities. We have strategically targeted attractive, high growth markets, with approximately 39% of pro forma net sales for the year ended December 31, 2015 being derived from markets within California, Arizona, Texas and Florida that collectively averaged 17.0% annual growth in building permits for new private housing units from 2010 through 2015. According to the U.S. Census Bureau, the national average for building permit growth over this time period was 13.2%.
We believe that we are able to maintain our local market excellence due to our longstanding customer and supplier relationships in local regions, dependable customer service, brand recognition and market-specific product offerings that cater to local trends and preferences. We actively track local and regional construction opportunities for our customers to help drive business for both them and ourselves, and our senior executives complement the local sales efforts by maintaining key relationships with major national and regional accounts. We seek to cultivate an entrepreneurial culture and empower branch managers with the independence and authority to make important business decisions locally under the FBM brand. We believe that this attracts highly dedicated employees who endeavor to provide our customers with dependable customer service that differentiates us from our competition. Our goal is to be the distributor of choice for our customers in all of the local markets we serve.
Strong customer relationships
We sell to a diverse and highly fragmented base of over 30,000 customers, including commercial, residential and other specialty contractors. In addition to local contractors, we
120
Table of Contents
maintain strong regional relationships with regional non-residential construction companies and leading national homebuilders. Most customer accounts are serviced by managers and salespeople who communicate regularly with these accounts and have developed meaningful relationships built over many years. We have deeply entrenched customer relationships lasting over 19 years on average with our top 20 customers based on pro forma net sales for the nine months ended September 30, 2016, including companies we have acquired. No one customer accounted for more than 1.5% of our pro forma net sales for the nine months ended September 30, 2016 and our top ten customers in the aggregate accounted for less than 6% of pro forma net sales for the nine months ended September 30, 2016. As a result, we believe the loss of any single customer would not have a meaningful impact on our financial performance.
We believe customer loyalty has been built through our high-quality customer service and technical support, strong logistics capabilities, exclusive relationships with key suppliers in critical markets, and product expertise across our comprehensive selection of premier products and brands. We are able to safely and efficiently deliver products to our customers at the right time and in the specified place. Based on our customer surveys, contractors often prioritize on-time delivery over price as they consider the negative repercussions that project delays create, particularly increased labor costs. We have an integrated delivery, dispatch and order tracking system that allows us to optimize routes and dispatch efficiencies. Optimization of delivery and dispatch results in lower costs for both delivery and also for fleet management. Additionally, for many of our products, we facilitate purchasing relationships between suppliers and our highly fragmented customer base by providing technical product knowledge, educating contractors on proper installation techniques for new products, enabling local product availability and extending trade credit.
Longstanding relationships with leading suppliers
We maintain longstanding relationships with a base of over 4,000 suppliers, with no single supplier accounting for more than approximately 14% of our pro forma purchases for the nine months ended September 30, 2016. We are one of the largest customers for several of our top suppliers across wallboard, suspended ceiling systems and metal framing product categories. We believe that suppliers find our scale, rapid growth, nationwide footprint, leading market positions, knowledgeable professionals, quality customer service and strong relationships with a broad set of contractors attractive. All key supplier relationships are handled by our executive management team to foster long-term growth and maximize national pricing programs. We have strong relationships with leading wallboard, suspended ceiling systems and metal framing manufacturers and we are able to provide them with a direct channel to a large, diverse customer base and a national footprint.
We have access to leading brands and maintain exclusive distribution relationships to sell key products, such as suspended ceiling systems, in selected markets. Interior contractors often purchase wallboard and suspended ceiling systems from the same distributor, and carrying our ceilings product line helps to drive sales of wallboard and other complementary products. In the exterior insulation and finishing systems market, we provide exclusive distribution for industry leaders Sto and Dryvit in select counties in eight states and across Canada. We believe that our suppliers view us as a key facilitator to market and grow their businesses. We regularly discuss both our acquisition and greenfield expansion activities with our key suppliers, who may proactively recommend expansion opportunities to us.
In August 2016, we acquired Winroc-SPI, which, in addition to being a wallboard and suspended ceiling systems distributor, was one of the largest distributors of commercial and industrial insulation products in the United States. This acquisition brought us long-term
121
Table of Contents
relationships with commercial and industrial insulation product manufacturers and access to all product lines within their distribution and custom fabrication network. We believe that most major commercial and industrial insulation product manufacturers use a limited number of distributors, which increases the importance of key supplier relationships. For example, Pittsburgh Corning Corporation manufactures cellular glass under the trade name Foamglas® Insulation and sells only to approved fabricators in the United States and Canada. Likewise, Johns Manville manufactures calcium silicate, expanded perlite, mineral wool and InsulTHIN™, hydrophobic blanket insulations and also sells only to select distributors and fabricators. Similar key distributor and manufacturer alignment exists in most other markets.
Demonstrated ability to identify, execute and integrate acquisitions
Our management team has built the Company from a single branch in 2011 into one of the leading wallboard, suspended ceiling systems and commercial and industrial insulation building products distributors in the United States and Canada. Since 2013, we have completed 19 acquisitions and believe that the large, highly fragmented nature of our market and our reputation throughout the industry provides us access to a robust acquisition pipeline at attractive valuations that will continue to supplement our strong organic growth. Our acquisitions generally have been initiated through our senior management team’s business relationships developed over their many years in the industry, and we believe we have become a buyer of choice for owners of specialty distribution companies because we offer them the opportunity to gain liquidity while remaining involved in the active management of their business going forward. We generally avoid auction processes and we believe we are often the only buyer involved in advanced discussions with these companies. This has led to a substantial pipeline of potential acquisition candidates that management is continuously cultivating.
We have dedicated integration leaders who work closely with acquired branch personnel to unify acquisitions under a single brand with a common ERP system. We consolidate our acquired companies’ purchasing into our supplier purchasing programs, which generally have had more advantageous terms due to our greater scale. Our objective is to integrate each acquired company into our back office accounting, human resources and IT systems within 90 days of closing. Post-acquisition, we transition acquired companies exclusively to the FBM brand, and we have typically achieved additional remaining cost savings from the elimination of redundant overhead costs and branch consolidations. Our acquisitions have historically realized purchasing synergies almost immediately by taking advantage of our volume discounts.
Since 2013, many of the owners and senior management of companies that we have acquired have elected to remain employed with us post-acquisition and most have chosen to invest in our parent company, which has proven to be successful in aligning incentives and ensuring smooth transitions. Currently, over 100 former owners, managers and employees of acquired businesses have an equity interest in our parent company and they remain engaged in the successful operation of our business.
Experienced management team with strong track record of growth
Our management team, including our senior management and vice presidents, collectively have an average of 25 years of industry experience. Our founder, President and Chief Executive Officer Ruben Mendoza, is an accomplished leader with over 25 years of industry experience. Our Chief Financial Officer John Gorey brings over 30 years of industry experience, our Chief Operating Officer Pete Welly brings over 37 years of industry experience to the oversight of our operations and our Senior Vice President of Sales & Marketing Kirby Thompson has been working in the industry for over 35 years. By fostering an entrepreneurial and customer-centric
122
Table of Contents
culture and a proven ability to quickly and effectively integrate acquisitions under a common brand, this team has built the Company from a single branch into one of the leading specialty building products distributors in the United States and Canada.
Our Business Strategy
Our objective is to strengthen our competitive position, achieve profitable growth that exceeds market rates and increase shareholder value through the following key strategies:
Continue to drive organic growth through strategic initiatives. We believe there are significant opportunities to continue to expand our existing geographic footprint by opening new branches, expand our product offerings to existing customers, target new customers and expand our mechanical insulation platform.
| • | Expand product offerings across all branches. Our management team has identified opportunities in several of our regions for product line growth and expansion. We offer a number of products that are complementary to our wallboard sales including tools, fasteners and wallboard accessories, building insulation, exterior insulation finishing systems, stucco, plaster and fiberglass reinforced panels. One of our growth opportunities is to increase sales of light density fiberglass insulation batts, blowing wool and mineral fiber insulation. We monitor sales of our complementary products and look for opportunities to introduce new products across our entire network that have been successful in a subset of our branches. We believe that through such efforts, for the nine months ended September 30, 2016, complementary product sales were up approximately 28% year-over-year. These products typically generate higher profit margins than our core product offerings and we believe there is significant opportunity for additional expansion of our complementary product sales. We believe our increasingly broad product offerings will allow us to expand and further penetrate existing customer relationships. |
| • | Target new customers and increasing share with existing customers. We believe our scale and supplier relationships allow us to more efficiently offer a full suite of products than many of our competitors. We believe these advantages help us to win new customers, and we have a proven track record of growing customer relationships and expanding wallboard market share. We plan to continue this growth by leveraging our experienced and driven salesforce of more than 325 field sales personnel who develop new customer relationships at the local level. These representatives have an average tenure of almost 10 years in the industry and are responsible for driving new customer sales and maintaining and growing existing customer relationships. While both the commercial and residential sales processes are largely relationship-driven, the commercial sales process is highly technical and requires sophisticated product knowledge and precise execution of complex delivery plans. We also believe our product breadth, extensive operating experience, technical knowledge and specialized delivery fleet will allow us to continue to capture new customers and expand our sales to those customers over time. In March of 2017, we plan to release a mobile application that will allow our customers to easily access critical information, such as order and delivery status. |
| • | Grow by selectively opening new branches. We believe that significant opportunities exist to continue to expand our geographic footprint by opening new branches. Our management team is highly experienced in identifying and implementing profitable greenfield opportunities. Our strategy for opening new branches is to further penetrate markets that are adjacent to our existing operations. Typically, we have pre-existing |
123
Table of Contents
| customer or supplier relationships in these markets, but require a new branch to fully capitalize on those relationships. These markets are generally underserved by our competitors. Key steps in the greenfield process include identifying growth markets where current customers or suppliers have identified a market need that we can support, conducting a market assessment, determining branch staffing and salesforce and developing a comprehensive forecast to determine if the location can meet profitability targets. We believe our existing infrastructure is capable of supporting a larger branch network, and in 2017 we plan to open three to five new branches. |
| • | Expand the mechanical insulation platform. Through the Winroc-SPI Acquisition, we gained exposure to the approximately $2.6 billion distribution of mechanical insulation market in the United States, according to Ducker Worldwide. This market is expected to exhibit steady growth through 2021, according to Ducker Worldwide. The mechanical insulation distribution market has experienced several macroeconomic trends in recent years that are favorable to our business, including stable distribution channels, distributor consolidation and more stringent codes and regulations demanding more efficient processes and energy performance. Additionally, because mechanical insulation also targets the industrial end market, we believe this business can offer greater diversification and cyclical stability to our existing platform. |
In the mechanical insulation business segment, we are actively pursuing growth opportunities to further expand our operational footprint and drive financial results. The following opportunities will allow us to expand our volumes and market share, enhancing the growth expected from the broader market expansion.
| • | Product Line Expansion—Several of our fabrication facilities produce specialized products used in commercial applications, such as parking garage (PG) board, curtain wall and metal building insulation. Additionally, we fabricate some trademarked, patented products across our network. These products can be customized to meet a customer’s specific needs and some have been certified and tested by Underwriters Laboratories. We believe our ability to develop, test and certify these products has enabled us to gain additional customer loyalty and business. Examples of these products include: Pamrod® Heads, Absorption Plus®, Safelite®, FirePlug® and FireStrip®. We expect to continue to expand these products across our network. |
| • | Acquisitions—There are several attractive candidates within the mechanical insulation market for tuck-in acquisitions which would create meaningful synergies. Our management team has relationships with a large number of industry players similar to the wallboard and suspended ceiling systems distribution, and maintains an active dialogue with many of the most attractive bolt-on candidates. |
| • | Open New Branches—Opportunities exist to open new branches in several key mechanical insulation markets. We review opportunities in markets with significant growth opportunities and favorable competitive dynamics. |
Continue to expand and strengthen existing relationships with key suppliers. We believe our established relationships with market-leading suppliers serve as a key competitive advantage and support continued volume growth and purchasing power. Our suppliers benefit from our position as a single point of contact to over 30,000 customers and our ability as a partner to market and introduce new products efficiently and on a national scale. We maintain a number of exclusive and semi-exclusive distribution rights in key markets. By expanding these relationships with suppliers, whether by adding more exclusive products or expanding exclusivity into new regions, we believe we will be able to further accelerate our growth. Additionally, our suppliers
124
Table of Contents
are critical partners in our growth and we regularly discuss greenfield candidates with them, with suppliers sometimes proactively identifying expansion opportunities.
Enhance financial performance through improved operational efficiencies. We believe we have the potential for continued operating margin improvement through operational initiatives including optimizing pricing, improving fleet utilization, maximizing working capital efficiency from inventory and accounts receivable management, and strategic procurement processes. In addition, as our end markets continue to grow, we expect to generate higher operating margins on incremental volume as we leverage our fixed costs base across our existing branch footprint.
We strive to continuously improve our operational efficiency, and are currently pursuing a number of initiatives to drive operating margin expansion, including:
| • | improve warehouse efficiencies in certain branches and reorganize these facilities; |
| • | deploy a GPS truck tracking system across our company to reduce fleet costs, track on time deliveries and improve route planning; and |
| • | leverage our increased investment in electronic data interchange to improve efficiency for both the purchasing and accounts payable teams. |
To further drive operational efficiencies, we unify all of our completed acquisitions under a single brand with a common ERP system. Our information technology systems are scalable and coordinated, which gives us operational efficiencies through the sharing of best practices and information across a common platform. We believe our information technology infrastructure allows for effective, data-driven management and is built to empower local decision-making and enhance visibility across our branch network.
We incentivize our branch managers and customer-facing branch level employees on a quarterly basis based on branch level operating income rather than doing so annually based on sales, which we believe leads to improved branch level performance.
Continue to be a leading industry consolidator. Since 2013, our management team has identified and closed 19 acquisitions. We have successfully integrated 16 of these acquisitions, and are currently working to complete the integration of Winroc-SPI, United Drywall and Dominion Interior Supply. We believe our national footprint, market leadership, entrepreneurial culture and ability to retain key leadership makes us an attractive buyer. We generally pursue selective acquisitions that both expand our footprint and generate synergies. We have a dedicated team of professionals to manage the acquisition and integration process. Due to the large and highly fragmented nature of our market and our reputation throughout the industry, we believe that we have access to a robust acquisition pipeline at attractive valuations that will continue to supplement our organic growth. We will consider expansion into complementary specialty distribution markets through selective acquisitions.
Focus on culture and continuous improvement. We believe that our employees are one of the key drivers of our success, and we intend to continue to recruit, train, promote and retain entrepreneurial and successful people. We believe that we have created a culture where our people feel valued and supported and see that their efforts are instrumental to our continued success. We are focused on providing our employees with regular training and development to improve customer service, workplace safety and job satisfaction. For example, in January 2016 we launched “FBM University” to provide our employees with extensive training and development programs, utilizing new learning management systems and in-person training programs, which we view as essential for new hires and the development of existing
125
Table of Contents
employees. We also invest substantially in leadership training and team building through our annual “Key Leaders Summit” meeting. By improving our employees’ knowledge base and sharing best practices, we are able to empower our people at the branch level to better serve local customers.
Our commitment to safety is one of our core foundation values. This effort begins immediately with new employees through a comprehensive onboarding orientation that focuses on safety awareness, risk identification and other essential safety protocols. Training is delivered through a variety of media, including online modules and classroom settings, so that managers can employ the method that bests fits the employee’s needs.
Our Products
We are a leading specialty distributor of a diversified mix of building products, including wallboard, suspended ceiling systems, metal framing, commercial and industrial insulation and other products. We are one of the two largest wallboard and suspended ceiling systems distributors in the United States and Canada based on our pro forma net sales for the year ended December 31, 2015. We provide customers with a comprehensive product offering, with over 35,000 SKUs. Our product breadth, combined with our commitment to quality customer service, has solidified our position as a supplier of choice. Our diversified product offering provides balanced exposure to several construction end markets that are growing.
Pro Forma Product Mix for the nine months ended September 30, 2016(1)
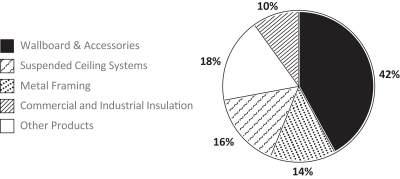
(1)Based on pro forma net sales for the period.
Wallboard and Accessories
We specialize in the distribution of high-quality wallboard used to finish the interior walls and ceilings in residential and commercial construction projects. Wallboard is used in the vast majority of new construction and renovation projects due to its ease of installation and superior performance in providing comfort, fire resistance, thermal and sound insulation, mold and moisture resistance, impact resistance and aesthetic and design elements. It is available in a number of standard lengths, widths and thicknesses with a range of characteristics. Panels with greater thickness provide increased durability and sound insulation. In non-residential construction projects, architectural specifications and building codes provide requirements related to the thickness of the panels and, in some cases, other characteristics, such as fire resistance, mold and moisture resistance.
Wallboard is an essential building product, with approximately 10,000 square feet of wallboard used on average in each new home. Given the importance of wallboard to the overall
126
Table of Contents
building process, contractors have very precise delivery expectations which can only be met by experienced specialty building products distributors with a local presence and specialized equipment.
Wallboard accessories are generally sold as a package in conjunction with wallboard and include most products used for the installation and finishing of wallboard. Key products include joint compounds, trims, tapes and various other accessories.
Ceilings
Suspended ceiling systems and grid help ensure and enhance the integrity, protection and decorative finishing of interior spaces. Ceilings consist of a higher number of specialized SKUs and less product standardization than the wallboard market. We believe ceiling product availability often pulls in additional business to our branches, as contractors often look to source additional interior products from a single distributor. The Ceilings industry has enjoyed price stability through various cycles. Commoditization risk is limited as customers often seek specific design and aesthetic characteristics unique to their space. The market is characterized by high manufacturer concentration, as the top two players, Armstrong and USG, account for approximately 80% of the market, according to the public filings of Armstrong. Ceilings are sold into both non-residential repair and remodel and new non-residential construction markets.
We maintain exclusive distribution rights in certain markets with Armstrong, the leading manufacturer of suspended ceiling systems in the United States and Canada. According to Armstrong, it has approximately 55% North American market share, and its products are highly sought after by designers, contractors, builders and distributors. We have exclusive distribution rights for Armstrong ceilings in select markets across three states and seven Canadian provinces and non-exclusive distribution rights with Armstrong in multiple markets across ten other states and one other Canadian province. Armstrong closely oversees the marketing of its products, leading to its preference for granting distribution rights to only one or two companies in a given market. In addition, we have relationship-based exclusivity with USG in select markets in three states and non-exclusive relationships with USG in select markets across two states.
Metal Framing
We provide metal framing and other framing products for multiple uses, including interior partitions and load bearing walls. We source our products from local, regional and national manufacturers in accordance with building standards and codes. Commercial contractors typically purchase these materials with wallboard, suspended ceiling systems, building insulation and other related building products as part of a commercial package.
Commercial and Industrial Insulation
We fabricate and distribute commercial and industrial insulation products through 53 branches in the United States and Canada as of December 31, 2016. Commercial and industrial insulation products are marketed on a wholesale basis to insulation contractors, HVAC contractors, general contractors and to operators of large industrial facilities.
Commercial and industrial insulation products are used to protect and insulate HVAC systems and piping and equipment systems for commercial buildings, metal buildings and industrial facilities. Other commercial and industrial insulation products include fire protection and wall and ceiling specialty products. Across our commercial and industrial insulation
127
Table of Contents
distribution network, we provide insulation fabrication services that customize products to fit specific systems. We believe our customers value our fabrication capabilities and quality as well as the labor savings they create. We believe these factors are particularly important for our international customers. Fabrication provides significant value to our contract customers and ensures significant pull-through revenue.
Other Products
We offer various other products, tools and accessories such as stucco and exterior insulation and finishing systems, building insulation, safety accessories, fasteners, doors and roofing products. Certain products are provided on a regional basis to address local preferences. These complementary products allow us to provide a full suite of products across our entire business, enhancing our margins and creating value for our customers.
Customers and Suppliers
Customers
We sell to a diverse and highly fragmented base of over 30,000 customers, including commercial, residential and other specialty contractors. In addition to local contractors, we maintain strong relationships with regional construction companies and leading national homebuilders. Most customer accounts are serviced by managers and salespeople who communicate regularly with these accounts and have developed meaningful relationships built over many years. No one customer accounted for more than 1.5% of our pro forma net sales for the nine months ended September 30, 2016 and our top ten customers in the aggregate accounted for less than 6% of pro forma net sales for the nine months ended September 30, 2016.
Suppliers
We maintain longstanding relationships with a base of over 4,000 suppliers, with no single supplier accounting for more than 14% of our pro forma purchases for the nine months ended September 30, 2016. We are one of the largest customers for several of our top suppliers across wallboard, suspended ceiling systems and metal framing. We believe that suppliers find our scale, rapid growth, nationwide footprint, leading market positions, knowledgeable professionals, quality customer service and strong relationships with a broad set of contractors attractive. We have strong relationships with leading wallboard, suspended ceiling systems and metal framing manufacturers and we are able to provide them with a direct channel to a large, diverse customer base and a national footprint. In addition, the Winroc-SPI Acquisition in August 2016 brought us long-term relationships with commercial and industrial insulation product manufacturers and access to all product lines within their distribution and custom fabrication network.
Sales and Marketing
We utilize a sales strategy that enables our salesforce to develop strong customer relationships at the local level. The sales effort is managed by individual branch managers and executed by both inside and outside sales teams. Due to the service-oriented and relationship-driven nature of the sales process, it is important to have experienced teams in each local market. To ensure customer expectations are met, our sales teams consist of both product sales specialists and sales managers who focus on specific products and regions. We also tailor our
128
Table of Contents
sales approach to best suit customer needs within each end market. Both the commercial and residential sales processes are largely relationship-driven, although the commercial sales process is also highly technical and requires product knowledge and a sophisticated delivery plan.
We employed more than 275 inside sales personnel and more than 325 field sales personnel as of September 30, 2016. Inside sales personnel primarily sell by phone or email, while field sales personnel primarily sell to customers face-to-face. These representatives have an average tenure of nearly 10 years and are responsible for driving new customer sales and maintaining and growing existing customer relationships. Our executives complement the local sales efforts by maintaining key relationships with major national and regional accounts and have significant experience with various sales organizations with a customer-centric philosophy. We also coordinate closely with our major suppliers to optimize specific sales strategies. In addition to providing customer relationship support, our executive team also coordinates the go-to-market strategy and provides ongoing job and product training.
Given the importance of strong local relationships, we thoroughly vet the strength of an acquisition target’s long-term customer relationships. Our management views these local relationships and the sales team of any acquired company to be critical to a successful integration.
We employ various marketing strategies to reach our customers in the most efficient and effective manner. We market our products and services through our website, sample kits, brochures and trade shows. Employees are encouraged to participate in industry associations as another point of customer connectivity. Certain of our employees are members and have served as officers and directors of numerous industry associations, including the Association of the Wall and Ceiling Industry, Ceilings & Interior Systems Construction Association, EIFS Industry Members Association and selected other regional associations. Furthermore, we sponsor a number of annual conventions and trade shows. Management believes that our most effective marketing is “word-of-mouth” given our reputation for high-quality products, superior customer service and product expertise and stellar delivery performance. We also benefit from the marketing and brand strength of several key suppliers, especially those with whom we hold exclusive arrangements.
Employees
As of September 30, 2016, we had a total of 3,401 employees, 87.6% of whom are customer-facing and approximately 145 of whom are unionized. We enjoy a strong relationship with our employees, including our unionized employees. We have not experienced a work stoppage, and we currently have no ongoing labor disputes.
We believe that training and development improve customer service, workplace safety and job satisfaction. In January 2016 we launched “FBM University” to provide our employees with online training and development programs, utilizing new learning management systems, and in-person training programs, which we view as essential for new hires and the development of existing employees. We also provide extensive training on Armstrong suspended ceiling systems to maintain our relationship as one of their key distributors. Further, our Manager of Training & Development leads our efforts to ensure employees of acquired companies are properly trained in accordance with our operating standards and best practices. We also invest significantly in leadership training through our annual “Key Leaders Summit” meeting. By improving our employees’ knowledge base and sharing best practices, we are able to empower our people at the branch level to better serve local customers.
129
Table of Contents
Our employees and board members have equity ownership in our parent company as co-investors with Lone Star. As of December 31, 2016, our management and employees owned approximately 10.2% of our parent.
We offer a comprehensive and competitive benefits package to employees, including a bonus system that aligns employee and Company interests and supports strategic initiatives. approximately one-third of our employees are salaried while approximately two-thirds are hourly.
Health and Safety
We approach health and safety through an operationally driven safety program utilizing a common approach encouraging the sharing of best practices across the specialty building products distributor, mechanical insulation and fabrication business. Our safety resources have an operational background and work closely with all levels of management on developing and managing the safety program. We have a strong management commitment in place from the CEO and COO through to the branch operating level.
We have a clearly defined safety structure that includes dedicated Regional Safety Coordinators to drive harmonization of safety protocols across the entire branch network. The Regional Safety Coordinators support branch Safety Champions whose duties are integrated as a shared responsibility within their operations role. Through branch ownership of the safety program, the Safety Champion works with their local management and Regional Safety Coordinator on day-to-day safety issues including incident reporting and investigation, inspections and training needs.
Through our internal protocols and safety training programs, we strive to be an industry leader in developing and promoting a strong safety culture. The effort begins immediately with new employees through a comprehensive orientation that focuses on safety awareness, risk identification, hazard communication and other essential safety protocols. We deliver training through a variety of media, including online modules, hands on training and classroom settings. Our employees share the responsibility to work in a manner that safeguards themselves, their coworkers and the communities they serve. We work diligently with our employees and continually advocate adherence to the highest safety standards. Management’s expectations and policy toward safety is clearly communicated and is supported by our “Safety Absolutes,” which are key rules that all of our employees are required to follow.
Fleet
We operate an extensive fleet of 2,729 vehicles as of September 30, 2016, including 542 flatbeds and 415 boom trucks, which are specialty trucks with mechanical arms that lift drywall from the truck and can place it through the windows of multi-story buildings. We own more than 85% of our fleet, and we believe our fleet creates a competitive advantage as compared to our smaller competitors who may lack the capital required for such an investment. For example, a new boom truck costs approximately $250,000, which is a significant investment for smaller, undercapitalized distributors.
An extensive, specialized fleet is required to service customer logistical needs as a significant portion of our net sales for the year ended December 31, 2015 are delivered to customer worksites, while the remainder constitutes will-call sales.
130
Table of Contents
Our fleet director ensures compliance with all rules and regulations governing fleet operations, including the U.S. Department of Transportation, or DOT, and Federal Motor Carrier Safety Administration regulations for vehicle inspections. Fleet maintenance is critical to ensure safety and operational reliability, and we inspect of our commercial vehicles regularly.
| Vehicle Category |
Total | % of Total | ||||||
| Trucks |
1,332 | 49 | % | |||||
| Forklifts |
955 | 35 | % | |||||
| Trailers |
428 | 15 | % | |||||
| Service Vehicles |
14 | 1 | % | |||||
|
|
|
|
|
|||||
| Total |
2,729 | 100 | % | |||||
|
|
|
|
|
|||||
Our fleet is operated by experienced, customer-focused drivers. We require our drivers to adhere to strict safety policies, and have a comprehensive program designed to prevent distracted driving. Drivers are further trained to provide value-added service to the customers throughout the delivery process.
Properties
As of December 31, 2016, our 210 branches, 14 of which we own, were located across 31 states and five Canadian provinces enabling us to serve customers across a nationwide footprint in the United States and Canada.
| Number of Branches | ||||||||||||
| Location |
SBP | MI | Total | |||||||||
| United States |
||||||||||||
| Arizona |
5 | 1 | 6 | |||||||||
| California |
10 | — | 10 | |||||||||
| Colorado |
2 | 2 | 4 | |||||||||
| Connecticut |
— | 1 | 1 | |||||||||
| Florida |
9 | 6 | 15 | |||||||||
| Georgia |
2 | 3 | 5 | |||||||||
| Idaho |
— | 2 | 2 | |||||||||
| Illinois |
7 | 3 | 10 | |||||||||
| Indiana |
11 | 2 | 13 | |||||||||
| Iowa |
4 | — | 4 | |||||||||
| Kansas |
3 | 1 | 4 | |||||||||
| Kentucky |
4 | 1 | 5 | |||||||||
| Louisiana |
— | 2 | 2 | |||||||||
| Massachusetts |
— | 1 | 1 | |||||||||
| Michigan |
14 | — | 14 | |||||||||
| Minnesota |
1 | — | 1 | |||||||||
| Missouri |
1 | 1 | 2 | |||||||||
| Nebraska |
2 | — | 2 | |||||||||
| New Jersey |
2 | 1 | 3 | |||||||||
| New York |
— | 3 | 3 | |||||||||
| North Carolina | — | 5 | 5 | |||||||||
| Ohio | 7 | 1 | 8 | |||||||||
| Oklahoma | — | 1 | 1 | |||||||||
| Oregon | — | 3 | 3 | |||||||||
131
Table of Contents
| Number of Branches | ||||||||||||
| Location |
SBP | MI | Total | |||||||||
| Pennsylvania | 4 | 4 | 8 | |||||||||
| South Carolina | — | 1 | 1 | |||||||||
| Tennessee | 4 | 2 | 6 | |||||||||
| Texas | 12 | 12 | 24 | |||||||||
| Utah | 4 | 1 | 5 | |||||||||
| Washington | 4 | 3 | 7 | |||||||||
| Wisconsin | 6 | — | 6 | |||||||||
|
|
|
|
|
|
|
|||||||
| Total U.S. | 118 | 63 | 181 | |||||||||
|
|
|
|
|
|
|
|||||||
| Canada | ||||||||||||
| Alberta | 9 | 3 | 12 | |||||||||
| British Columbia | 7 | 1 | 8 | |||||||||
| Manitoba | 1 | — | 1 | |||||||||
| Ontario | 6 | — | 6 | |||||||||
| Saskatchewan | 2 | — | 2 | |||||||||
|
|
|
|
|
|
|
|||||||
| Total Canada | 25 | 4 | 29 | |||||||||
|
|
|
|
|
|
|
|||||||
| Total | 143 | 67 | 210 | |||||||||
|
|
|
|
|
|
|
|||||||
While all branches have access to the full product suite, the sales mix varies across regions due to differences relating to weather and other end market preferences. Some locations distribute multiple products to multiple end markets, while other locations distribute selected products to one end market based on local demand. The warehouse space of our distribution centers range from 3,000 to 115,000 square feet with an average of 26,500 square feet.
Competition
We compete against other specialty distributors as well as big box retailers and lumberyards. Among specialty building products distributors, we compete against a small number of large distributors and many small, local, privately-owned distributors. Of the four large national wallboard distributors in our industry, we are one of two active consolidators. Our remaining competitors are generally smaller regional and local firms, many of which we view as attractive acquisition opportunities. The principal competitive factors in our business include, but are not limited to, availability of materials and supplies; technical product knowledge and expertise; advisory or other service capabilities; delivery capabilities; pricing of products; and availability of credit.
Seasonality
Use and consumption of our products fluctuate due to seasonality. Nearly all of the products we sell and our customers use are exposed to outdoor elements during delivery or installation. Therefore, seasonal changes and other weather-related conditions, in particular extended rainy and cold weather in the spring and fall and major weather events, such as hurricanes, tornadoes, tropical storms and heavy snows, can adversely affect our business and operations. Our shipment levels also follow activity in the construction industry, which typically occurs in the more moderate seasons of spring, summer and fall.
132
Table of Contents
Government Regulations
Although we are not engaged in a “regulated industry,” we are subject to various federal, state and local government regulations applicable to the business generally in the jurisdictions in which we operate, including laws and regulations relating to our relationships with our employees, public health and safety, work place safety, transportation, zoning and fire codes. We focus on operating each of our branches in accordance with applicable laws, codes and regulations. We believe we are in compliance in all material respects with existing applicable environmental laws and regulations and our employment, workplace health and workplace safety practices.
Our operations in domestic interstate commerce are subject to the regulatory jurisdiction of the DOT, which has broad administrative powers with respect to our transportation operations. We are subject to safety requirements governing interstate operations prescribed by the DOT. Vehicle dimension and driver hours of service also are subject to both federal and state regulation. See the section entitled “Risk Factors.” Our operations are also subject to the regulatory jurisdiction of the Occupational Safety and Health Administration, which has broad administrative powers with respect to workplace and jobsite safety.
Legal Proceedings
We are not currently involved in any legal proceedings that we believe could reasonably be expected to have a material adverse effect on our business, financial condition or results of operations. However, we are party to litigation or legal proceeds that we consider to be part of the ordinary course of our business, including various lawsuits and liens related to delinquent payments or non-payment by certain of our customers. We may become involved in material legal proceedings in the future.
133
Table of Contents
The following table sets forth certain information regarding our directors, director nominees and executive officers as of the date of this prospectus.
| Name |
Age | Position | ||||
| Ruben Mendoza |
52 | President and Chief Executive Officer; Director Nominee | ||||
| John Gorey |
56 | Chief Financial Officer | ||||
| Pete Welly |
59 | Chief Operating Officer | ||||
| Kirby Thompson |
57 | Senior Vice President of Sales & Marketing | ||||
| Ray Sears |
51 | Senior Vice President of Mechanical Insulation | ||||
| Jim Carpenter |
59 | Vice President of Business Development | ||||
| Richard Tilley |
41 | Vice President, Secretary and General Counsel | ||||
| Kevin Barner |
35 | Director Nominee | ||||
| Nick Beevers |
37 | Director Nominee | ||||
| Court Carruthers |
44 | Director Nominee | ||||
| Fareed Khan |
50 | Director Nominee | ||||
| Dominic LaValle |
39 | Director Nominee | ||||
| Samuel D. Loughlin |
44 | Director Nominee, Chairman Nominee | ||||
| Chris Meyer |
46 | Director Nominee | ||||
| James Underhill |
61 | Director Nominee | ||||
| Kyle Volluz |
48 | Director | ||||
| Grant Wilbeck |
35 | Director Nominee | ||||
Our Executive Officers
Ruben Mendoza – Mr. Mendoza is the founder, President and Chief Executive Officer of our company and has 25 years of industry experience. Prior to founding our company in 2011, Mr. Mendoza served as the Chief Executive Officer of AMS, a leading distributor of wallboard, acoustical suspended ceiling systems, lath and plaster products, doors and other building products. Mr. Mendoza originally joined AMS in 1991 and assumed the Chief Executive Officer role in 2003 after several years as AMS’ Vice President and Sales Manager. AMS grew significantly under Mr. Mendoza’s leadership, particularly across the West Coast and Northern Mexico through greenfields and strategic acquisitions. Mr. Mendoza attended California State University and has completed executive education at Harvard Business School (Strategy), Wharton School of Business (Management) and Northwestern (Marketing). Mr. Mendoza will also become a director upon the listing of our common stock.
As our Chief Executive Officer and founder, Mr. Mendoza brings a deep understanding of our business, operations and strategic planning to the board. Mr. Mendoza also has extensive industry experience gained over 25 years, including through his prior service as Chief Executive Officer of AMS. Mr. Mendoza’s board service will also provide a direct and open channel of communications between the board and management.
John Gorey – Mr. Gorey is our Chief Financial Officer and has 30 years of industry experience. Prior to starting the Company in 2011 with Mr. Mendoza, Mr. Gorey served as the Chief Financial Officer of AMS, a leading distributor of drywall, acoustical suspended ceiling systems and other related building products. Mr. Gorey originally joined AMS in 1986 and assumed the Chief Financial Officer role in 2001 after several years as AMS’ Controller. Prior to AMS, Mr. Gorey worked for Barry McKinley and Associates, an accounting firm. He graduated from the University of Southern California with a Bachelor of Science in Accounting.
134
Table of Contents
Pete Welly – Mr. Welly is our Chief Operating Officer and has 37 years of industry experience. Prior to joining the Company as Chief Operating Officer in 2013, Mr. Welly served as Vice President of U.S. Operations for Winroc-SPI from 2001 to 2013. Prior to Winroc-SPI, Mr. Welly served in executive sales and marketing roles at AMS beginning in 1987. He has served on numerous Armstrong, Chicago Metallic and Sto advisory councils. He graduated from Miami University of Ohio with a Bachelor of Arts in Marketing Communications. He has also attended the Executive Management Program at Kellogg School at Northwestern.
Kirby Thompson – Mr. Thompson is our Senior Vice President of Sales & Marketing. Prior to joining the Company in 2013, Mr. Thompson was Vice President of Sales for Home Acres Building Supply Co., LLC (a company we acquired), a distributor of drywall, acoustical suspended ceiling systems and other related building products, from 2002 until 2013. Mr. Thompson was previously President of Michigan Acoustical Supply House from 1984 until 1993, which was an acoustical suspended ceiling systems and wallboard distributor. He attended Wittenberg University and has a Bachelor of Arts in Business Administration.
Ray Sears – Mr. Sears is our Vice President of MI, a position he has held since August 2016 when he joined the Company in connection with the Winroc-SPI Acquisition. Mr. Sears joined Winroc-SPI as Vice President of Supply Chain in September 2012. In January 2015 he became Vice President of Commercial & Industrial insulation operations, assuming leadership of the Commercial & Industrial insulation business segment for the company. Prior to joining Winroc-SPI, Mr. Sears was Vice President of Supply Chain for Roofing Supply Group LLC, or RSG, one of the largest distributors of roofing supplies in the United States. Before joining RSG, Mr. Sears worked for 21 years at Southwest Airlines, spending 14 years in positions of increasing responsibility in Finance. He held the position of Vice President of Procurement for the last seven years of his career at Southwest. Mr. Sears holds a Bachelor of Science in Computer Information Systems from Oklahoma Christian University in Oklahoma City, Oklahoma.
Jim Carpenter – Mr. Carpenter is our Vice President of Business Development, a position he has held since 2015. Prior to that, Mr. Carpenter was a Regional Vice President from 2013 to 2015. Prior to joining the Company in 2013, Mr. Carpenter was President of Southwest Building Materials LLC, a position he held from 2005 to 2013. Southwest Building Materials LLC (a company we acquired) was a distributor of wallboard, metal framing, acoustical suspended ceiling systems and other related building products. From 2000 until 2005, Mr. Carpenter was a Manager of Center Operation for L&W Supply Corporation, which had purchased Mr. Carpenter’s previous drywall distribution business. Mr. Carpenter attended University of Nebraska at Omaha and received a Bachelor of Science in Business Administration with an emphasis in Marketing.
Richard Tilley – Mr. Tilley is our Vice President, Secretary and General Counsel. Prior to joining the Company in 2016, Mr. Tilley was the Vice President of Legal Affairs for Mophie, a technology company, and led the sale of Mophie to ZAGG, Inc. From 2009 until 2015, when he joined Mophie, Mr. Tilley was Assistant General Counsel for Multi-Fineline Electronix, Inc., a flexible printed circuit board manufacturer with operations in the United States, Asia and Europe. Mr. Tilley graduated from the Dale E. Fowler School of Law at Chapman University and has a Bachelor of Arts in History from California State University, Long Beach.
Our Director and Director Nominees
Kevin Barner – Mr. Barner will become a director upon the listing of our common stock. Mr. Barner is a Managing Director of Lone Star North America Acquisitions, LLC, an affiliate of
135
Table of Contents
ours and Lone Star, where he focuses on origination and underwriting activities related to corporate private equity and debt investments throughout the North America region. Previously, Mr. Barner served as a Director of Lone Star North America Acquisitions, LLC from June 2014 to December 2016 and a Vice President at Hudson Americas L.P., an affiliate of ours and Lone Star, from August 2012 to June 2014, serving in an origination, underwriting and asset management role on various operating company investments made by several of Lone Star’s funds. Prior to joining Hudson Americas, from March 2006 to August 2012, Mr. Barner served as a Vice President and Associate at The Halifax Group, a middle-market private equity firm, where he was responsible for identifying, evaluating and sourcing private equity investment opportunities and was a board member or board observer for several of Halifax’s portfolio companies. Previously, Mr. Barner was an Analyst with BB&T Capital Markets Investment Banking specializing in mergers and acquisitions across a variety of industries. Mr. Barner served as a member of the board of directors of Continental Building Products, Inc. from March 2015 to March 2016 and currently serves as a member of the board of directors Forterra, Inc. and a number of privately held companies.
Mr. Barner brings broad expertise in financial management to the board of directors. His extensive experience in private equity and the financial markets also allows him to make valuable contributions with respect to our capital structure and financing, acquisition and investing activities.
Nick Beevers – Mr. Beevers will become a director upon the listing of our common stock. Since March 2013, Mr. Beevers has served as a Senior Managing Director of Lone Star Global Acquisitions, Ltd., an affiliate of ours and Lone Star, where he is responsible for investor relations, fundraising activities and communications globally. Prior to his current role, Mr. Beevers served as a Managing Director and Senior Vice President of Lone Star Global Acquisitions, Ltd. from July 2012 to March 2013 and September 2011 to July 2012, respectively, in each case with similar areas of responsibility as his current position. Mr. Beevers is also a member of Lone Star’s Senior Management and Global Risk Committees and is Chairman of the Legal and Compliance Risk Committee. Prior to joining Lone Star in 2011, Mr. Beevers spent eight years as an investment banker with JPMorgan in New York and London, where he focused on equity capital market transactions. Mr. Beevers holds a Bachelor of Arts in Business from the University of West of England, Bristol Business School.
Mr. Beevers brings extensive experience in communications and investor relations matters to the board of directors, which will be invaluable in helping management form and maintain investor relationships. His prior investment banking and capital markets experience will also allow him to provide insight regarding our capital structure and financing and investing activities. His service on Lone Star’s risk committees will also help guide the board with respect to its oversight of risk management.
Court Carruthers – Mr. Carruthers will become a director upon the listing of our common stock. Mr. Carruthers is the founder and principal of CKAL Advisory Partners, LLC., where he advises companies in the distribution, eCommerce, and supply chain sectors. He previously served as Senior Vice President and Group President, Americas, of W.W. Grainger, Inc., a broad-line supplier of maintenance, repair and operating (MRO) products, from 2013 until July 2015. Prior to that time, he had served Grainger as President, Grainger U.S., from 2012 until 2013; President, Grainger International, from 2009 until 2012; and President, Acklands-Grainger, from 2006 until 2009. He was appointed a Senior Vice President of Grainger in 2007. Mr. Carruthers serves as a Director of US Foods Holding Corp., Ryerson Holding Corporation, Follett Corporation, PSS Companies, and Shoes For Crews. He is a previous Director of MonotaRO Co. Ltd. Mr. Carruthers currently serves as president of the Montessori School of Lake Forest, a
136
Table of Contents
trustee of Cristo Rey St. Martin College Prep., and a member of the Board of Governors of the Lake Forest Winter Club. He is a Chartered Professional Accountant (CPA, CMA, Canada), holds a Bachelor of Commerce degree from the University of Alberta and a Masters of Business Administration from Queens University.
Mr. Carruthers brings a significant level of operational and sales experience to the board of directors, which will add meaningful value for a business focused on customer relationships. Mr. Carruthers’ service as the President of multiple companies will help the board better understand management’s day-to-day actions and responsibilities. His service on other boards of directors will also add a depth of knowledge to our board of directors regarding best practices in corporate governance.
Fareed Khan – Mr. Kahn will become a director upon the listing of our common stock. Mr. Kahn is currently the Chief Financial Officer of U.S. Foods Holding Corp., a position he has held since September 2013. He has over 20 years of experience working in financial and operational roles, leading teams in accounting, corporate strategy, information technology, supply chain, M&A and investor relations activities. Prior to U.S. Foods, he was with U.S. Stationers Inc., a $5.0 billion publically traded business product wholesaler, where he served as a Senior Vice President and the Chief Financial Officer beginning in July 2011. Prior to United Stationers, Mr. Khan spent twelve years with USG Corporation where he most recently served as Executive Vice President, Finance and Strategy. Mr. Khan has an MBA from the University of Chicago and holds a Bachelor’s Degree in Mechanical Engineering from Carleton University, where he graduated with distinction.
Mr. Khan brings extensive financial and accounting expertise to the board of directors developed during his professional career, including through his service as a chief financial officer for multiple companies. His public company experience also provides the board with valuable insight regarding public company reporting matters, as well as a first-hand view of management’s day-to-day duties and responsibilities.
Dominic LaValle – Mr. LaValle will become a director upon the listing of our common stock. Mr. LaValle has been a Director with Hudson Americas, LLC, an affiliate of Lone Star, since July 2015. In such capacity, he is responsible for sourcing, executing and managing private equity investments. Prior to Hudson Americas, Mr. LaValle was a Managing Director at Sowell & Company September 2013 to July 2015 and a Managing Director at Wynnchurch Capital May 2011 to June 2013. Mr. LaValle holds an MBA from the Wharton School of the University of Pennsylvania and a Bachelor of Arts degree in Economics from Dartmouth College, where he graduated Phi Beta Kappa. Mr. LaValle also serves as a member of the board of directors of a number of privately held companies.
Mr. LaValle brings broad expertise in financial and operational management to the board of directors. His extensive experience in private equity and the financial markets also allows him to make valuable contributions with respect to our growth initiatives, capital structure and financing, acquisition and investing activities.
Samuel D. Loughlin – Mr. Loughlin will become a director and Chairman of the Board upon the listing of our common stock. Mr. Loughlin currently serves as President of Lone Star North America Acquisitions, LLC, an affiliate of ours and Lone Star, where he is responsible for the management and oversight of all originations initiatives in North America. Previously, from 2011 to 2013, he served as Managing Director and Senior Managing Director of Lone Star U.S. Acquisitions, LLC. Mr. Loughlin joined Hudson Americas L.P., an affiliate of ours and Lone Star, in 2008 and focused on directing the management of the corporate assets located in North
137
Table of Contents
America. From 2008 to 2011, he served in various capacities at Hudson Americas, with responsibility for its retail and restaurant operating companies, in addition to leading teams in special originations initiatives. Mr. Loughlin has more than 18 years of finance and legal experience, including mergers and acquisitions, financing, private equity investment, originations and asset management transactions. Prior to joining Hudson Americas, Mr. Loughlin was a Partner of a Texas-based private equity firm with real estate, operating company and securities holdings, where he was responsible for legal oversight, deal structuring, asset evaluation, acquisitions and sales. Prior to that, Mr. Loughlin served as an attorney at Vinson & Elkins LLP, where he was a member of the Business and Corporate Securities group, with experience in venture capital and mezzanine financing transactions, private and public securities offerings, mergers and acquisitions, management buyouts and debt financing transactions. Mr. Loughlin previously served as chairman of the board of directors of Del Frisco’s Restaurant Group, Inc. from July 2012 through December 2013 and as chairman of the board of directors of Continental Building Products, Inc. from February 2014 through March 2015. Since October 2016, Mr. Loughlin has served as chairman of the board of directors of Forterra, Inc. Mr. Loughlin also serves on the boards of a number of privately held companies.
Mr. Loughlin has significant experience with the strategic, financial and operational requirements facing operating companies in various industries, allowing him to guide the board in analyzing, shaping and overseeing our execution of important operational and policy issues. His responsibilities for Lone Star’s operating companies in North America, including our company, also provide Mr. Loughlin with a working knowledge of our business and operations that are important to the development of the board. His service on other boards of directors will also add a depth of knowledge to our board as to best practices in corporate governance.
Chris Meyer – Mr. Meyer will become a director upon the listing of our common stock. Mr. Meyer has been a Managing Director of Hudson Americas L.P., an affiliate of ours and Lone Star, since February 2015. Mr. Meyer has oversight responsibility for a number of Lone Star’s private equity investments, including our company, and also assists with the due diligence and underwriting of potential operating company investments. Prior to joining Hudson Americas, Mr. Meyer held a number of positions with McKinsey & Company, Inc., a global management consulting firm, most recently serving as a Director (Senior Partner). While at McKinsey, Mr. Meyer managed the Dallas office, co-led the Consumer Practice group and co-founded McKinsey’s Consumer Marketing Analytics Center. Mr. Meyer currently serves as a member of the board of directors of Forterra, Inc. and a number of privately held companies, including several for which he serves as chairman. Mr. Meyer earned a Bachelor of Science degree in Industrial Engineering from North Carolina State University and a Masters of Business Administration degree from Harvard Business School.
Mr. Meyer’s background, including as a management consultant in a wide range of industries, allows him to assist the board in understanding and addressing a wide variety of the issues it faces. Mr. Meyer also brings significant financial and operational expertise developed through his past and current leadership and oversight roles. His responsibilities for Lone Star’s companies, including our company, also provide Mr. Meyer with a deep working knowledge of our business and operations.
James Underhill – Mr. Underhill will become a director upon the listing of our common stock. Mr. Underhill was a senior executive at MRC Global (McJunkin Red Man Corporation) for over 30 years serving in both financial and operational roles. Most recently, Mr. Underhill was the chief operating officer and executive vice president of MRC Global’s United States / North America division, its largest segment with approximately $6.0 billion in revenue, from
138
Table of Contents
November 2012 through August 2013 and November 2011 to November 2012, respectively. Prior to that, he served as MRC Global’s Chief Financial Officer and Executive Vice President from May 2006 through October 2011. He serves on the boards of U.S. Security Associates Holding Corp., Pipeline Supply & Service, Inc., SCADA Products, LLC., and Adventure West Virginia Resorts, LLC. Mr. Underhill holds a Bachelor’s Degree in Accounting and Economics from Lehigh University and is a Certified Public Accountant.
Mr. Underhill brings broad financial and operational management expertise to the board from his prior executive positions. His service on other boards of directors, including audit and compensation committees, will also add a depth of knowledge to our board of directors as to best practices in corporate governance.
Kyle Volluz – Mr. Volluz has been a member of our board of directors since October 2016. Mr. Volluz has been a Managing Director with Hudson Advisors L.P., an affiliate of ours and Lone Star, since January 2015, and for the five years prior to that, a Director with Hudson Advisors, in each case, with responsibility for the management of the Legal Department. In such capacity, Mr. Volluz oversees all legal issues impacting operating companies that are affiliates of Lone Star within North America, as well as other corporate investments for which Hudson Advisors or its subsidiaries provide asset management services in North America. In particular, Mr. Volluz has been actively involved in the negotiation and closing of numerous lending transactions, acquisitions and asset sales for us and other Lone Star portfolio companies since joining Hudson Advisors in 2009. Previously, Mr. Volluz was Senior Vice President and Director of Legal Services for Goldman Sachs Specialty Lending Group, an affiliate of Goldman, Sachs & Co., a position he held from 2005 to 2009. Prior thereto, Mr. Volluz was an attorney with Baker Botts L.L.P. and Thompson & Knight LLP, where he supported clients in various types of commercial banking transactions, mergers and acquisitions, private and public securities offerings and debt financing transactions. Mr. Volluz served as a member of the board of directors of Continental Building Products, Inc. from February 2014 to March 2016 and currently serves as a member of the board of directors of Forterra, Inc. and a number of privately held companies. Mr. Volluz graduated from the University of Texas at Austin in Austin, Texas. He holds a Master of Business Administration degree from the Thunderbird School of Global Management in Glendale, Arizona, and a Juris Doctor degree from the Dedman School of Law at Southern Methodist University in Dallas, Texas.
Mr. Volluz’s knowledge of our company allows him to bring a well-informed perspective to the board of directors regarding our operations and the associated legal risks. His extensive experience with capital market transactions, both involving our company and other affiliates of Lone Star, also allows him to make valuable contributions with respect to our capital structure and financing and investing activities. His legal background also provides valuable insight to the board regarding issues we may face.
Grant Wilbeck – Mr. Wilbeck will become a director upon the listing of our common stock. Mr. Wilbeck is a Senior Managing Director of Lone Star North America Acquisition LLC, an affiliate of ours and Lone Star, where he focuses on origination and underwriting activities related to corporate private equity and debt investments. From 2013 to December 2016, Mr. Wilbeck served as Managing Director of Lone Star North America Acquisitions, LLC. Previously, from 2007 to 2013, he served in various capacities at Hudson Americas L.P., an affiliate of ours and Lone Star, with asset management responsibility across all retail and restaurant operating companies focusing on operational performance, capital structure and acquisition opportunities. Prior to joining Hudson Americas, Mr. Wilbeck was at APS Financial Corp. where he was a research analyst focused on distressed debt and special situations. Mr. Wilbeck served as a member of the board of directors of Continental Building Products, Inc.
139
Table of Contents
from February 2014 to March 2016 and currently serves as a member of the board of directors of Forterra, Inc. and a number of privately held companies.
Mr. Wilbeck brings broad expertise in financial management to the board of directors. His extensive experience in the financial markets also allows him to make valuable contributions with respect to our capital structure and financing and investing activities.
There are no family relationships among any of our directors or executive officers.
Director Compensation
In 2016, each of Messrs. Carruthers, Khan and Underhill received $75,000 in respect of their service as a member of the board of directors of Cypress Holdings. In addition, in January of 2016, each of Messrs. Carruthers, Khan and Underhill received a grant of 5,000 pool units under the LTIP. A total of 500 pool units subject to each such grant vests on each of the first three anniversaries of the grant date, subject to the relevant director’s continuous service on our board of directors. All pool units are generally forfeited on a termination of continuous service for cause or a resignation without good reason. Unvested pool units are forfeited on the date that is 6 months following a termination of continuous service without cause, with good reason or as a result of the participant’s death or disability. Potential payments under the LTIP are described in the section entitled “Executive Compensation—Narrative Disclosure to the Summary Compensation Table—Incentive Compensation—Long-Term Incentives Following the Lone Star Acquisition.”
Following completion of this offering, we intend to pay our independent directors an annual retainer of $65,000 per year for his or her services, with an additional $20,000 annual fee for service as chair of the audit committee, $12,000 for service as a member of the audit committee and $10,000 for service as a member of the compensation committee. In addition, we expect to pay any lead independent director an annual fee of $20,000. We also expect independent directors to receive an annual equity grant of restricted stock units or other equity awards valued at approximately $25,000, which awards will vest in full one year from the grant date. Such cash fees are expected to be paid quarterly in arrears.
Board of Directors
Our amended and restated certificate of incorporation will provide that our board of directors will be divided into three classes of directors, with the classes to be as nearly equal in number as possible. The members of each class will serve for a three-year term. As a result, one-third of our board of directors will be elected each year. Messrs. LaValle, Loughlin, Meyer and Wilbeck will be class I directors, up for election in 2018, Messrs. Barner, Beevers, Mendoza and Volluz will be class II directors, up for election in 2019, and Messrs. Carruthers, Khan and Underhill will be class III directors, up for election in 2020. See the section entitled “Description of our Capital Stock—Provisions of Our Certificate of Incorporation and Bylaws to be Adopted and Delaware Law That May Have an Anti-Takeover Effect—Classified Board of Directors.”
Before the completion of this offering, our board of directors will establish an audit committee, a compensation committee and a nominating and corporate governance committee, each of which will operate pursuant to a charter that will be adopted by our board of directors. Upon the closing of this offering, the composition and functioning of all of our committees will comply with all applicable requirements of the Sarbanes-Oxley Act, SEC rules and regulations and the rules of the NYSE.
140
Table of Contents
Controlled Company Exemption
Following this offering, Lone Star will continue to control more than 50% of the voting power of our common stock in the election of directors. Accordingly, we intend to avail ourselves of the controlled company exception available under NYSE rules which eliminates certain requirements, such as the requirements that a company have a majority of independent directors on its board of directors, that compensation of executive officers be determined, or recommended to the board of directors for determination, by a majority of the independent directors or a compensation committee composed solely of independent directors, and that director nominees be selected, or recommended for the board of directors’ selection, by a majority of the independent directors or a nominations committee composed solely of independent directors. In the event that we cease to be a controlled company, we will be required to comply with these provisions within the transition periods specified in the applicable rules. These exemptions do not modify the independence requirements for our audit committee, and we intend to comply with the applicable requirements of the SEC and the NYSE with respect to our audit committee within the applicable time frame.
Committees of the Board of Directors
Audit Committee
The primary responsibilities of our audit committee will be to oversee the accounting and financial reporting processes of our company as well as our subsidiary companies and to oversee the internal and external audit processes. The audit committee will also assist the board of directors in fulfilling its oversight responsibilities by reviewing the financial information provided to stockholders and others and the system of internal controls established by management and the board of directors. The audit committee will oversee the independent auditors, including their independence and objectivity. However, committee members will not act as professional accountants or auditors, and their functions are not intended to duplicate or substitute for the activities of management and the independent auditors. The audit committee will be empowered to retain independent legal counsel and other advisors as it deems necessary or appropriate to assist it in fulfilling its responsibilities and to approve the fees and other retention terms of the advisors.
The audit committee will be composed of three members, Fareed Khan, James Underhill and Dominic LaValle, with James Underhill serving as chair. Our board of directors has determined that each of Fareed Khan and James Underhill is independent, as defined under and required by the federal securities laws and NYSE rules. Our board of directors has determined that each of Fareed Khan and James Underhill qualifies as an audit committee financial expert under the federal securities laws and that each member of the audit committee has the financial sophistication required under NYSE rules. The rules of the SEC and the NYSE requires us to have a fully independent audit committee within one year of the date of the effectiveness of the registration statement of which this prospectus is a part and the listing of our common stock, respectively.
Compensation Committee
The primary responsibilities of our compensation committee will be to periodically review and approve the compensation and other benefits for our employees, officers and independent directors. This will include reviewing and approving corporate goals and objectives relevant to the compensation of our executive officers in light of those goals and objectives and setting
141
Table of Contents
compensation for these officers based on those evaluations. Our compensation committee will also administer and have discretionary authority over the issuance of equity awards under our equity incentive plan.
The compensation committee may delegate authority to review and approve the compensation of our employees to certain of our executive officers, including with respect to awards made under our equity incentive plan. Even where the compensation committee does not delegate authority, our executive officers will typically make recommendations to the compensation committee regarding compensation to be paid to our employees and the size of equity grants under our equity incentive plan.
The compensation committee will be composed of three members, Chris Meyer, Court Carruthers and Dominic LaValle, with Chris Meyer serving as chair. Our board of directors has determined that Court Carruthers is independent, as defined under NYSE rules. For so long as we are a controlled company, we are not required to have a compensation committee composed entirely of independent directors under NYSE rules.
Nominating and Corporate Governance Committee
Our nominating and corporate governance committee will oversee all aspects of our corporate governance functions. The committee will make recommendations to our board of directors regarding director candidates and assist our board of directors in determining the composition of our board of directors and its committees. The nominating and corporate governance committee will be composed of three members, Kyle Volluz, Court Carruthers and Dominic LaValle, with Kyle Volluz serving as chair. For so long as we are a controlled company, we are not required to have a nominating and corporate governance committee composed entirely of independent directors under NYSE rules.
Code of Conduct and Ethics
Our board of directors will adopt a code of conduct and ethics that establishes the standards of ethical conduct applicable to all directors, officers and employees of our company. The code will address, among other things, conflicts of interest, compliance with disclosure controls and procedures and internal control over financial reporting, corporate opportunities and confidentiality requirements. The audit committee will be responsible for applying and interpreting our code of conduct and ethics in situations where questions are presented to it. We expect that any amendments to the code or any waivers of its requirements applicable to our principal executive, financial or accounting officer, or controller will be disclosed on our website at www.fbmsales.com. Our website is not part of this prospectus.
Compensation Committee Interlocks and Insider Participation
Our compensation committee will be composed of Messrs. Meyer, Carruthers and LaValle. None of our executive officers currently serves, or has served during the last completed fiscal year, as a member of the board of directors, or as a member of the compensation or similar committee, of any entity that has one or more executive officers who served on our board of directors. For a description of the transactions between us and members of the compensation committee and entities affiliated with such members see the transactions described in the section entitled “Certain Relationships and Related Party Transactions.”
142
Table of Contents
Introduction
The executive compensation disclosure that follows explains the compensation awarded to, earned by or paid to Ruben Mendoza, our President and Chief Executive Officer, and John Gorey and Pete Welly, our two most highly compensated executive officers other than our chief executive officer for 2016. We refer to these individuals in this section as our named executive officers or NEOs. The compensation committee of our board of directors will make all decisions regarding the compensation of our NEOs.
Summary Compensation Table
The following table summarizes information concerning the compensation awarded to, earned by or paid to our NEOs in 2015 and 2016.
| Name and principal |
Year | Salary ($)(1) | Bonus ($)(2) | Stock Awards ($) |
Option Awards ($) |
Non- Equity Incentive Plan Compensation ($)(3) |
All Other Compensation ($)(4)(5)(6) |
Total ($) | ||||||||||||||||||||||||
| Ruben Mendoza |
2016 | $ | 428,846 | $ | — | $ | — | $ | — | $ | 400,000 | $ | 49,117 | $ | 877,963 | |||||||||||||||||
| President and Chief Executive Officer |
2015 | $ | 321,154 | $ | 1,129,917 | $ | — | $ | — | $ | 300,000 | $ | 24,827 | $ | 1,775,898 | |||||||||||||||||
| John Gorey |
2016 | $ | 313,654 | $ | — | $ | — | $ | — | $ | 225,000 | $ | 19,775 | $ | 558,429 | |||||||||||||||||
| Chief Financial Officer |
2015 | $ | 221,154 | $ | 420,465 | $ | — | $ | — | $ | 160,000 | $ | 8,119 | $ | 809,738 | |||||||||||||||||
| Pete Welly |
2016 | $ | 313,654 | $ | — | $ | — | $ | — | $ | 225,000 | $ | 27,549 | $ | 566,203 | |||||||||||||||||
| Chief Operating Officer |
2015 | $ | 221,154 | $ | — | $ | — | $ | — | $ | 160,000 | $ | 17,662 | $ | 398,816 | |||||||||||||||||
| (1) | Each executive received an increase in his annual salary during the 2015 and 2016 calendar years, as described in more detail below. The amount in this column reflects the amount of salary actually paid during the calendar year. |
| (2) | Each of Mr. Mendoza and Mr. Gorey entered into a letter agreement on December 7, 2012 with CI (FBM) Holdings LLC, or CI Holdings, the former owner of Foundation Buildings Materials, LLC. Under such letter agreements, Messrs. Mendoza and Gorey were entitled to receive a bonus in connection with any transaction where CI Capital Partners II, L.P., or CI Capital, received a transaction fee, so long as Messrs. Mendoza and Gorey maintained a minimum ownership percentage in CI Holdings. The amount of each bonus was equal to the transaction fee received by CI Capital multiplied by the percentage equal to Messrs. Mendoza and Gorey’s respective ownership percentage in CI Holdings as of the date of the transaction. The amount in this column represents the bonus received by each of Mr. Mendoza and Mr. Gorey in connection with the Lone Star Acquisition pursuant to his letter agreement. |
| (3) | We maintain a bonus plan for executives, as described in more detail below. For 2016, these figures represent an estimated payout under the bonus plan, however, the actual bonuses earned for 2016 has not yet been determined. |
| (4) | Mr. Mendoza’s other compensation for 2016 includes an auto allowance of $12,600, a 401(k) company match of $12,000 and golf club membership dues paid by the Company in the amount of $24,517. |
| (5) | Mr. Gorey’s other compensation for 2016 includes an auto allowance of $7,775 and a 401(k) company match of $12,000. |
| (6) | Mr. Welly’s other compensation for 2016 includes a 401(k) company match of $12,000 and golf club membership dues paid by the Company in the amount of $15,549. |
Narrative Disclosure to the Summary Compensation Table
Base Salary
Mr. Mendoza entered into a new employment agreement with Foundation Buildings Materials, LLC effective as of October 9, 2015. Pursuant to this employment agreement, Mr. Mendoza’s base salary was increased from $300,000 to $400,000. Mr. Mendoza’s base salary was further increased to $500,000 on September 1, 2016. Mr. Gorey entered into a new employment agreement with Foundation Buildings Materials, LLC effective as of October 9,
143
Table of Contents
2015. Pursuant to this employment agreement, Mr. Gorey’s base salary was increased from $200,000 to $300,000. Mr Gorey’s base salary was further increased to $350,000 on September 1, 2016. Mr. Welly entered into a new employment agreement with Foundation Buildings Materials, LLC effective as of October 9, 2015. Pursuant to this employment agreement, Mr. Welly’s base salary was increased from $200,000 to $300,000. Mr. Welly’s base salary was further increased to $350,000 on September 1, 2016. These increased base salaries reflected each NEOs increased role and duties after the Lone Star Acquisition. All salaries are subject to review on an annual basis by our board of directors or a committee thereof and may be subject to future change.
Incentive Compensation
Annual Cash Incentives
Each of our NEOs was eligible to earn an annual cash incentive for calendar year 2016 based upon the achievement of a pre-established adjusted EBITDA target, as well as within other strategic goals, set by the board of directors. The adjusted EBITDA target for 2016 was set at $83.6 million. The strategic goals for the NEOs consisted of goals tied to product category growth and expansion (applicable to all NEOs), information technology projects (applicable to Mr. Mendoza and Mr. Welly), branch openings (applicable to Mr. Mendoza) and corporate finance projects (applicable to Mr. Mendoza and Mr. Gorey).
Pursuant to the annual cash incentive plan for 2016, the target amount for Mr. Mendoza’s annual cash performance bonus was set at 120% of his base salary for 2016 and the target amount for each of Mr. Gorey and Mr. Welly’s annual cash performance bonus was set at 100% of the respective executive’s base salary for 2016. Actual bonus payouts for 2016 have not yet been determined.
Equity Incentive Compensation
Prior to the implementation of the 2017 Stock Incentive Plan, as described below, the Company has not granted equity compensation awards to its NEOs.
Long-Term Incentives Following the Lone Star Acquisition
Following the Lone Star Acquisition, Lone Star implemented the LTIP. Under the LTIP, participants were granted pool units entitling them, subject to the terms of the LTIP, to a potential cash payout upon a monetization event. Cypress maintains and is obligated for all payments under the LTIP. The LTIP was effective October 9, 2015. Each of our NEOs participates in the LTIP.
Mr. Mendoza was awarded 155,000 pool units under the LTIP, and Mr. Gorey and Mr. Welly were each awarded 60,000 pool units under the LTIP. In addition, the other members of management and independent directors hold an aggregate of 650,000 pool units under the LTIP. The total number of pool units authorized under the LTIP is 1,000,000. The LTIP will remain outstanding following this offering. As of December 31, 2016, 925,000 pool units (out of the 1,000,000 maximum) had been granted.
Ten percent of the pool units granted to each NEO vest on each of the first three anniversaries of the LTIP award agreement, with the remaining 70% of the pool units remaining unvested until the award expires. In general, unvested Pool Units will be forfeited upon any termination of employment (provided that if the termination is without Cause or for Good Reason (in each case, as defined in the LTIP) or due to death or disability, the pool units will
144
Table of Contents
nonetheless remain outstanding for six months). In addition, in general, vested pool units will automatically be forfeited on the later of the fifth anniversary of the grant date or the date the participant terminates employment. The value of a participant’s pool units is determined as of the closing date of each monetization event relative to that participant’s interest in the incentive pool, calculated as the number of outstanding pool units (whether or not vested) then held by the individual participant, divided by 1,000,000 (the total number of pool units authorized under the LTIP). The amount of proceeds received by Lone Star in connection with a monetization event that is to be credited to the incentive pool under the LTIP in connection with such monetization event will be based upon the cumulative internal rate of return realized upon a monetization event by Lone Star. In addition, the incentive pool will not be credited with any amounts and no payouts will be made unless such internal rate of return is at least 15%. Payments under the LTIP, if any, will be made in cash within sixty days after the closing of each applicable monetization event. As of December 31, 2016, no such monetization event had occurred. This offering is not expected to trigger any payouts under the LTIP. The amount that will be credited to the incentive pool upon each monetization event is summarized in the table and footnotes below:
| Cumulative IRR(1) |
Amount to Credit to Incentive Pool | |
| 14.99% or less |
$0 | |
| 15% up to 20.0% |
9.5% of marginal Proceeds that result in Cumulative IRR in excess of 15% | |
| 20.1% up to 25.0% |
12.0% of marginal Proceeds that result in Cumulative IRR in excess of 20.1% | |
| 25.1% up to 35.0% |
14.0% of marginal Proceeds that result in Cumulative IRR in excess of 25.1% | |
| 35.1% up to 50% |
17.0% of marginal Proceeds that result in Cumulative IRR in excess of 35.1% | |
| 50.1% up to 100.0% |
19.0% of marginal Proceeds that result in Cumulative IRR in excess of 50.1% | |
| Over 100% |
9.5% of marginal Proceeds that result in Cumulative IRR in excess of 100% | |
| (1) | Cumulative IRR means the aggregate cumulative after tax internal rate of return, compounded annually, that is realized by Lone Star from its direct or indirect investment in the Company from the effective date through the date of the applicable monetization event, as reported by Lone Star. |
Generally, for purposes of the LTIP, a monetization event occurs if and when:
| • | Lone Star sells, transfers or otherwise disposes of all or a portion of their direct and indirect ownership interests in the Company or a respective successor entity (whether through a direct sale, merger, consolidation, reorganization, or other similar transaction) to an unrelated third party for cash; |
| • | a firm commitment underwritten public offering of the equity interests of the Company or a respective successor entity that is registered under the Securities Act of 1933 in which Lone Star sells all or a portion of their direct and indirect ownership interests in the Company or a respective successor entity, as applicable, in such public offering; or |
| • | the direct or indirect payment by the Company of any cash distributions to Lone Star (including in connection with a sale of the assets of the Company or a respective successor entity). |
145
Table of Contents
Retirement Plans
We maintain a tax qualified 401(k) defined contribution plan, for the benefit of our employees. Under the 401(k) plan, employees (including the current NEOs) are permitted to elect to reduce their current compensation by up to the statutorily prescribed annual limit and to have the amount of such reduction contributed to the 401(k) plan. We are also permitted to make contributions up to the legally prescribed limits on behalf of all eligible employees to the 401(k) plan, and the amount of any such contribution made on behalf of an NEO is reflected in the “All Other Compensation” column of the Summary Compensation Table above.
Employment Agreements
Each of our NEOs has an employment agreement with the Company. The provisions of such agreements are summarized below.
Ruben Mendoza. Pursuant to his employment agreement, Mr. Mendoza is entitled to a base salary of at least $400,000 per annum, which may be decreased only in the event of a general cost reduction by the Company and in such case, by no more than 10%. Mr. Mendoza’s target bonus under his employment agreement shall be no less than 120% of his base salary. Mr. Mendoza is entitled to participate in the LTIP and the benefits plans of the Company. Mr. Mendoza is entitled to receive a Company vehicle with a lease payment of no more than $2,300 per month. The Company is also responsible to reimburse Mr. Mendoza for his golf club membership dues and other business related costs. Pursuant to his employment agreement, in the event that Mr. Mendoza’s employment is terminated by the Company without Cause or he resigns for Good Reason (in each case, as defined in such agreement), then subject to Mr. Mendoza’s execution and non-revocation of a waiver and general release of claims in a form provided by the Company and Mr. Mendoza’s compliance with the confidentiality, non-solicitation and non-disparagement restrictive covenants contained in his employment agreement, he would be entitled to (a) any accrued payments or benefits, including any then-unpaid annual cash performance bonus earned by Mr. Mendoza for the year prior to Mr. Mendoza’s termination, (b) continued payment of his base salary for a period of 24 months, (c) a monthly amount equal to (1) the monthly premium to cover Mr. Mendoza and his dependents for continuation coverage under COBRA minus (2) the amount Mr. Mendoza would have had to pay to receive group health coverage based on the cost sharing levels in effect on his date of termination for twelve months (or if earlier, until he becomes eligible to receive healthcare coverage through subsequent employment or self-employment), and (d) payment of a pro-rata annual cash performance bonus for the period of the year that Mr. Mendoza was employed by the Company, based on actual performance during such year.
John Gorey. Pursuant to his employment agreement, Mr. Gorey is entitled to a base salary of at least $300,000 per annum, which may be decreased only in the event of a general cost reduction by the Company and in such case, by no more than 10%. Mr. Gorey’s target bonus under his employment agreement shall be no less than 100% of his base salary. Mr. Gorey is entitled to participate in the benefits plans of the Company. Pursuant to his employment agreement, in the event that Mr. Gorey’s employment is terminated by the Company without Cause or he resigns for Good Reason (in each case, as defined in such agreement), then subject to Mr. Gorey’s execution and non-revocation of a waiver and general release of claims in a form provided by the Company and Mr. Gorey’s compliance with the confidentiality, non-solicitation and non-disparagement restrictive covenants contained in his employment agreement, he would be entitled to (a) any accrued payments or benefits, including any then-unpaid annual cash performance bonus earned by Mr. Gorey for the year prior to Mr. Gorey’s termination, (b) continued payment of his base salary for a period of 12 months and (c) payment of a pro-rata
146
Table of Contents
annual cash performance bonus for the period of the year that Mr. Gorey was employed by the Company, based on actual performance during such year.
Pete Welly. Pursuant to his employment agreement, Mr. Welly is entitled to a base salary of at least $300,000 per annum, which may be decreased only in the event of a general cost reduction by the Company and if such decrease is no more than 10%. Mr. Welly’s target bonus under his employment agreement shall be no less than 100% of his base salary. Mr. Welly is entitled to participate in the benefits plans of the Company. The Company is also responsible to reimburse Mr. Welly for his golf club membership dues and other business related costs. Pursuant to his employment agreement, in the event that Mr. Welly’s employment is terminated by the Company without Cause or he resigns for Good Reason (in each case, as defined in such agreement), then subject to Mr. Welly’s execution and non-revocation of a waiver and general release of claims in a form provided by the Company and Mr. Welly’s compliance with the confidentiality, non-solicitation and non-disparagement restrictive covenants contained in his employment agreement, he would be entitled to (a) any accrued payments or benefits, including any then-unpaid annual cash performance bonus earned by Mr. Welly for the year prior to Mr. Welly’s termination, (b) continued payment of his base salary for a period of 12 months and (c) payment of a pro-rata annual cash performance bonus for the period of the year that Mr. Welly was employed by the Company, based on actual performance during such year.
Outstanding Equity Awards at Fiscal Year End
There were no outstanding equity awards made to the NEOs as of December 31, 2016.
2017 Stock Incentive Plan
Prior to completion of this offering, we will adopt the Foundation Building Materials, Inc. 2017 Stock Incentive Plan, or the 2017 Plan. The purpose of the 2017 Plan is to promote and closely align the interests of our employees, officers, non-employee directors and other service providers and our stockholders by providing stock-based compensation and other performance-based compensation. The objectives of the 2017 Plan are to attract and retain the best available personnel for positions of substantial responsibility and to motivate participants to optimize the profitability and growth of the Company through incentives that are consistent with the Company’s goals and that link the personal interests of participants to those of the Company’s stockholders. The 2017 Plan will allow for the grant of stock options, both incentive stock options and “non-qualified” stock options; stock appreciation rights, or SARs, alone or in conjunction with other awards; restricted stock and restricted stock units, or RSUs; and incentive bonuses, which may be paid in cash or stock or a combination thereof.
The following description of the 2017 Plan is not intended to be complete and is qualified in its entirety by the complete text of the 2017 Plan, a copy of which will be filed as an exhibit to the registration statement of which this prospectus forms a part. Stockholders and potential investors are urged to read the 2017 Plan in its entirety. Any capitalized terms which are used in this summary description but not defined here or elsewhere in this registration statement have the meanings assigned to them in the 2017 Plan.
Administration
The 2017 Plan will be administered by the compensation committee of the board of directors, or such other committee designated by the Company’s board of directors to administer the plan. The compensation committee will have broad authority, subject to the provisions of the 2017 Plan and to administer and interpret the 2017 Plan. All decisions and actions of the compensation committee will be final.
147
Table of Contents
Stock Subject to 2017 Plan
The maximum number of shares that may be issued under the 2017 Plan will not exceed , subject to certain adjustments in the event of a change in the Company’s capitalization. Shares of common stock issued under the 2017 Plan may be either authorized and unissued shares or previously issued shares acquired by the Company. On termination or expiration of an unexercised option, SAR or other stock-based award under the 2017 Plan, in whole or in part, the number of shares of common stock subject to such award will again become available for grant under the 2017 Plan.
Stock Options
All stock options granted under the 2017 Plan will be evidenced by a written agreement with the participant, which provides, among other things, whether the option is intended to be an incentive stock option or a non-qualified stock option, the number of shares subject to the option, the exercise price, exercisability (or vesting), the term of the option, which may not generally exceed ten years, and other terms and conditions. Subject to the express provisions of the 2017 Plan, options generally may be exercised over such period, in installments or otherwise, as the compensation committee may determine. The exercise price for any stock option granted may not generally be less than the fair market value of the common stock subject to that option on the grant date. The exercise price may be paid in cash or such other method as determined by the compensation committee, including an irrevocable commitment by a broker to pay over such amount from a sale of the shares issuable under an option, the delivery of previously owned shares and withholding of shares deliverable upon exercise. Other than in connection with a change in the Company’s capitalization, we will not, without stockholder approval, reduce the exercise price of a previously awarded option, and, at any time when the exercise price of a previously awarded option is above the fair market value of a share of common stock, we will not, without stockholder approval, cancel and re-grant or exchange such option for cash or a new award with a lower (or no) exercise price.
Stock Appreciation Rights
SARs may be granted alone or in conjunction with all or part of a stock option. Upon exercising a SAR, the participant is entitled to receive the amount by which the fair market value of the common stock at the time of exercise exceeds the exercise price of the SAR. This amount is payable in common stock, cash, restricted stock or a combination thereof, at the compensation committee’s discretion.
Restricted Stock and RSUs
Awards of restricted stock consist of shares of stock that are transferred to the participant subject to restrictions that may result in forfeiture if specified conditions are not satisfied. RSUs result in the transfer of shares of cash or stock to the participant only after specified conditions are satisfied. The compensation committee will determine the restrictions and conditions applicable to each award of restricted stock or RSUs, which may include performance vesting conditions.
Incentive Bonuses
Each incentive bonus will confer upon the participant the opportunity to earn a future payment tied to the level of achievement with respect to one or more performance criteria established for a specified performance period. The compensation committee will establish the
148
Table of Contents
performance criteria and level of achievement versus these criteria that will determine the threshold, target and maximum amount payable under an incentive bonus, which criteria may be based on financial performance and/or personal performance evaluations. Payment of the amount due under an incentive bonus may be made in cash or shares, as determined by the compensation committee.
Performance Criteria
The compensation committee may specify certain performance criteria which must be satisfied before stock options, SARs, restricted stock, RSUs and incentive bonuses will be granted or will vest. The performance goals may vary from participant to participant, group to group, and period to period.
Transferability
Awards generally may not be sold, transferred for value, pledged, assigned or otherwise alienated or hypothecated by a participant other than by will or the laws of descent and distribution, and each option or SAR may be exercisable only by the participant during his or her lifetime.
Amendment and Termination
The board of directors has the right to amend, alter, suspend or terminate the 2017 Plan at any time, provided certain enumerated material amendments may not be made without stockholder approval. No amendment or alteration to the 2017 Plan or an award or award agreement will be made that would materially impair the rights of the holder, without such holder’s consent, however, no consent will be required if the compensation committee determines in its sole discretion and prior to the date of any change in control that such amendment or alteration either is required or advisable in order for us, the 2017 Plan or the award to satisfy any law or regulation or to meet the requirements of or avoid adverse financial accounting consequences under any accounting standard, or is not reasonably likely to significantly diminish the benefits provided under such award, or that any such diminishment has been adequately compensated. The 2017 Plan will be adopted by the board of directors and the Company’s sole equity holder in connection with this offering and will automatically terminate, unless earlier terminated by the board of directors, ten years after approval by the board of directors.
149
Table of Contents
PRINCIPAL AND SELLING STOCKHOLDERS
The following table presents information concerning the beneficial ownership of the shares of our common stock as of the date of this prospectus by (1) each person known to us to beneficially own more than 5% of the outstanding shares of our common stock, (2) the selling stockholder, (3) each of our directors and named executive officers and (4) all of our directors and executive officers as a group. The table also contains information about beneficial ownership, as adjusted, to reflect the sale of common stock in this offering assuming:
| • | 29,974,239 shares of common stock outstanding as of January 31, 2017 and 42,774,239 shares outstanding immediately following the completion of this offering; and |
| • | no exercise of the underwriters’ option to purchase additional shares of our common stock. |
Beneficial ownership is determined under the rules of the SEC and generally includes voting or investment power over securities. Except in cases where community property laws apply or as indicated in the footnotes to this table, we believe that each stockholder identified in the table possesses sole voting and investment power over all shares of common stock shown as beneficially owned by the stockholder. Shares of common stock subject to options and warrants that are exercisable or exercisable within 60 days of the date of this prospectus are considered outstanding and beneficially owned by the person holding the options for the purpose of computing the percentage ownership of that person but are not treated as outstanding for the purpose of computing the percentage ownership of any other person. Unless indicated below, the address of each individual listed below is c/o Foundation Building Materials, Inc., 2741 Walnut Avenue, Suite 200, Tustin, CA 92780.
The selling stockholder may be deemed an underwriter in connection with this offering.
150
Table of Contents
| Name of Beneficial Owner |
Shares of common stock beneficially owned prior to this offering |
Shares of common stock beneficially owned after this offering assuming no exercise of underwriters’ option |
Shares of common stock beneficially owned after this offering assuming full exercise of underwriters’ option |
|||||||||||||||||||||||||
| Shares of common stock |
Percentage of Total Outstanding Common Stock (%) |
Number of Shares Being Sold in this Offering |
Shares of common stock |
Percentage of Total Outstanding Common Stock (%) |
Shares of common stock |
Percentage of Total Outstanding Common Stock (%) |
||||||||||||||||||||||
| 5% Stockholder and Selling Stockholder |
||||||||||||||||||||||||||||
| Cypress Parent(1) |
29,974,239 | 100 | % | — | 29,974,239 | 70.1 | % | 28,054,239 | 65.6 | % | ||||||||||||||||||
| Named Executive Officers |
||||||||||||||||||||||||||||
| Ruben Mendoza(2) |
— | — | — | — | — | — | — | |||||||||||||||||||||
| John Gorey(2) |
— | — | — | — | — | — | — | |||||||||||||||||||||
| Pete Welly(2) |
— | — | — | — | — | — | — | |||||||||||||||||||||
| Director and Director Nominees |
||||||||||||||||||||||||||||
| Ruben Mendoza(2) |
— | — | — | — | — | — | — | |||||||||||||||||||||
| Kevin Barner(2) |
— | — | — | — | — | — | — | |||||||||||||||||||||
| Nick Beevers(2) |
— | — | — | — | — | — | — | |||||||||||||||||||||
| Court Carruthers |
— | — | — | — | — | — | — | |||||||||||||||||||||
| Fareed Khan |
— | — | — | — | — | — | — | |||||||||||||||||||||
| Dominic LaValle(2) |
— | — | — | — | — | — | — | |||||||||||||||||||||
| Samuel D. Loughlin(2) |
— | — | — | — | — | — | — | |||||||||||||||||||||
| Chris Meyer(2) |
— | — | — | — | — | — | — | |||||||||||||||||||||
| James Underhill |
— | — | — | — | — | — | — | |||||||||||||||||||||
| Kyle Volluz(2) |
— | — | — | — | — | — | — | |||||||||||||||||||||
| Grant Wilbeck(2) |
— | — | — | — | — | — | — | |||||||||||||||||||||
| All Directors, Director Nominees and Executive Officers as a group (17 persons) |
— | — | — | — | — | — | — | |||||||||||||||||||||
| (1) | Cypress Parent will directly own 100% of our common stock prior to this offering. Cypress Parent is a Delaware limited liability company and prior to this offering will be wholly owned by LSF9 Cypress LP, a Delaware limited partnership, which is controlled by its general partner, LSF9 GenPar LLC, a Delaware limited liability company, which is controlled by Lone Star Fund IX (U.S.), L.P., a Delaware limited partnership, which is controlled by its general partner, Lone Star Partners IX, L.P., a Bermuda exempted limited partnership, which is controlled by its general partner, Lone Star Management Co. IX, Ltd., a Bermuda exempted company, which is controlled by its sole owner (shareholder) John P. Graken. The address for such persons is 2711 North Haskell Avenue, Suite 1700, Dallas, Texas 75204. |
| (2) | Owns interests in Cypress Parent or entities which own direct or indirect non-controlling interests in Cypress Parent and therefore expressly disclaims any beneficial ownership of our common stock owned by Cypress Parent. |
151
Table of Contents
CERTAIN RELATIONSHIPS AND RELATED PARTY TRANSACTIONS
Relationships with Lone Star and Affiliates
Lone Star currently owns all of our outstanding equity interests. Upon completion of this offering, Lone Star will beneficially own 70.1% of our outstanding common stock (or 65.6% if the underwriters exercise in full their option to purchase additional shares).
For as long as Lone Star and its affiliates continue to beneficially own shares of common stock representing more than a majority of the voting power of our common stock, they will be able to direct the election of all of the members of our board of directors and exercise a controlling influence over our business and affairs, including any determinations with respect to mergers or other business combinations, the acquisition or disposition of assets, the incurrence of indebtedness, the issuance of any additional common stock or other equity securities, the repurchase or redemption of common stock and the payment of dividends. Similarly, Lone Star will have the power to determine matters submitted to a vote of our stockholders without the consent of our other stockholders, will have the power to prevent a change in our control and could take other actions that might be favorable to them. See the section entitled “Risk Factors.”
Lone Star is not subject to any contractual obligations to retain its controlling interest, except that it has agreed, subject to certain exceptions, not to sell or otherwise dispose of any shares of common stock for a period of 180 days after the date of this prospectus without the prior written consent of the representatives. Except for this period, there can be no assurance as to the period of time during which Lone Star will maintain its beneficial ownership of our common stock following this offering. See the section entitled “Risk Factors.” Following this period, Lone Star will have rights to cause us to register its shares as described under “—Registration Rights Agreement” below.
Asset Advisory Agreement
In connection with the Lone Star Acquisition, on October 9, 2015, Cypress and Hudson Americas L.P., or the Manager, an affiliate of Lone Star, entered into an Asset Advisory Agreement, or the Asset Advisory Agreement. Pursuant to the Asset Advisory Agreement, the Manager provides certain asset management services with respect to the Company, its subsidiaries and its and their respective assets or acquired equity interests, or the Assets collectively, including: (i) communicating and coordinating with any personnel or other service providers hired by Cypress or its subsidiaries with respect to the Assets; (ii) assisting and advising Cypress in the pursuit of the Company’s long-term plan developed and adopted by Cypress with respect to the Assets; (iii) subject to the availability of sufficient funds, implementing the long-term plan and managing the Assets in accordance with the long-term plan; and (iv) taking any actions as it deems necessary or appropriate to protect the interests of Cypress with respect to the Assets in response to certain emergency situations. Pursuant to the Asset Advisory Agreement, Cypress pays the Manager an amount equal to 110% of the hourly billing rates of the individuals performing management services, and all expenses incurred by the Manager on behalf of Cypress will be paid by Cypress. The Asset Advisory Agreement is terminable by Cypress, the Manager or Lone Star upon 30 days’ notice from one party to the others.
We expect to terminate the Asset Advisory Agreement in connection with the consummation of the offering.
152
Table of Contents
Registration Rights Agreement
We will enter into a registration rights agreement with Lone Star in connection with the consummation of this offering. The terms of the registration rights agreement will include provisions for demand registration rights and piggyback registration rights in favor of Lone Star. The registration rights agreement will not provide for the payment of any consideration by us to Lone Star if a registration statement for the resale of shares of common stock held by Lone Star is not declared effective or if the effectiveness is not maintained. We expect that 29,974,239 shares of our common stock will be entitled to these registration rights following completion of this offering (or 28,054,239 shares if the underwriters exercise in full their option to purchase additional shares). However, the underwriting agreement prohibit us from a filing any registration statement for the resale of shares of common stock held by Lone Star for a period of 180 days after the date of this prospectus without the prior consent of the representatives. Shares registered with the SEC pursuant to these registration rights will be eligible for sale in the public markets, as described in the section entitled “Shares Eligible for Future Sale,” subject to the lock-up agreement described in the section entitled “Underwriting.”
Tax Receivable Agreement
In connection with this offering, we will enter into a tax receivable agreement with Lone Star. We and our subsidiaries have generated, or are expected to generate, the Covered Tax Benefits, which may reduce the actual liability for certain taxes that we might otherwise be required to pay. These Covered Tax Benefits include: (i) all depreciation and amortization deductions, and any offset to taxable income and gain or increase to taxable loss, resulting from the tax basis that we have in our assets as of the time of the consummation of this offering, (ii) the utilization of our and our subsidiaries’ net operating losses and tax credits, if any, attributable to periods prior to this offering, (iii) deductions in respect of payments made, funded or reimbursed by Lone Star under the LTIP, (iv) deductions in respect of transaction expenses attributable to certain acquisitions made by us prior to this offering, (v) deductions in respect of the debt issuance costs and original issue discount associated with certain of our financing agreements, (vi) deductions in respect of offering-related expenses and (vii) certain other tax benefits attributable to payments made under the tax receivable agreement. The tax receivable agreement provides for payments to Lone Star in an amount equal to 90% of the aggregate reduction in U.S. federal, state, local and non-U.S. income taxes payable realized by us and our subsidiaries (using an assumed combined state and local tax rate of 5%) from the utilization of such Covered Tax Benefits.
The obligations under the tax receivable agreement will be our obligations and not obligations of our subsidiaries and are not conditioned upon Lone Star maintaining a continued direct or indirect ownership interest in us. For purposes of the tax receivable agreement, the aggregate reduction in income tax payable by us will be computed by comparing our actual income tax liability with our hypothetical liability had we not been able to utilize the Covered Tax Benefits, taking into account several assumptions and adjustments, including, for example, that:
| • | we will pay state and local tax at a rate of 5%, even though our actual effective state and local tax rate may be materially lower; |
| • | tax benefits existing at the time of the offering are deemed to be utilized before any post-closing/after-acquired tax benefits; |
| • | a non-taxable transfer of assets by us to a non-consolidated entity is treated under the tax receivable agreement as a taxable sale at fair market value; and |
153
Table of Contents
| • | a taxable sale or other taxable transfer of subsidiary stock by us (in cases where the subsidiary’s tax basis in its assets exceeds our tax basis in the subsidiary’s stock) is treated under the tax receivable agreement as a taxable sale of the subsidiary’s assets. |
The foregoing assumptions and adjustments could cause us to be required to make payments under the tax receivable agreement that are significantly greater than the benefits we realize in respect of the Covered Tax Benefits.
The tax receivable agreement will become effective upon the completion of this offering and will remain in effect until all such Covered Tax Benefits have been used or expired, unless the agreement is terminated early, as described below.
We expect that the payments we make under the tax receivable agreement could be substantial. Assuming no material changes in the relevant tax law, and that we and our subsidiaries earn sufficient taxable income to realize the full tax benefits subject to the tax receivable agreement, we expect that future payments under the tax receivable agreement will total between approximately $190 million and $220 million (excluding any payments that may be made to Lone Star under the tax receivable agreement as a result of tax benefits recognized in connection with payments under the LTIP). Depending on the amount and timing of our future earnings (if any) and on other factors, including the effect of any limitations imposed on our ability to use the Covered Tax Benefits, it is possible that all payments required under the tax receivable agreement could become due within a relatively short period of time. The actual amount and utilization of the Covered Tax Benefits, as well as the amount and timing of any payments under the tax receivable agreement, will vary depending upon a number of factors, including the amount, character and timing of our and our subsidiaries’ taxable income in the future.
Payments under the tax receivable agreement are generally due within a specified period of time following the filing of our tax return for the taxable year with respect to which the payment obligation arises, but interest on such payments will begin to accrue at a rate of LIBOR plus 300 basis points from the due date (without extensions) of such tax return. Late payments will generally accrue interest at a rate of LIBOR plus 625 basis points.
The tax receivable agreement provides that if, at any time, we elect an early termination of the tax receivable agreement with approval of a majority of our independent directors and with Lone Star’s consent, we are in material breach of our obligations under the agreement, certain credit events described in the tax receivable agreement occur with respect to us, Lone Star elects to terminate the tax receivable agreement following certain changes of control or Lone Star elects to terminate the tax receivable agreement on or after the fifteenth anniversary of this offering, we would be required to make an immediate payment equal to the present value of the anticipated future tax benefits to Lone Star. Such payment would be based on certain valuation assumptions, including the assumption that we and our subsidiaries have sufficient taxable income and tax liabilities to fully utilize such tax benefits. We may elect to completely terminate the tax receivable agreement early only with the written approval of Lone Star. The tax receivable agreement also provides that, in the event that Lone Star does not elect to terminate the tax receivable agreement upon certain changes of control, our (or our successor’s) payments under the tax receivable agreement for each taxable year after any such event would be based on certain valuation assumptions, including the assumption that we and our subsidiaries have sufficient taxable income to fully utilize the Covered Tax Benefits. Accordingly, payments under the tax receivable agreement may be made years in advance of the actual realization, if any, of the anticipated future tax benefits and may be significantly greater than the benefits we realize in respect of the tax attributes subject to the tax receivable agreement.
154
Table of Contents
In addition, were the Internal Revenue Service to successfully challenge the availability or amount of any of the Covered Tax Benefits, Lone Star would not reimburse us for any payments previously made under the tax receivable agreement, but future payments under the tax receivable agreement, if any, would be netted against any unreimbursed payments to reflect the result of any such successful challenge by the Internal Revenue Service. As a result, we could make payments under the tax receivable agreement in excess of our actual cash savings in income tax.
We have full responsibility and sole discretion over all tax matters concerning the Company. However, we will be required to notify Lone Star of any audit by a taxing authority, the outcome of which is reasonably expected to affect Lone Star’s rights under the tax receivable agreement. We will not have the right to enter into any settlement of such an audit without the consent of Lone Star (not to be unreasonably withheld, conditioned or delayed).
For so long as the tax receivable agreement remains outstanding, without the prior written consent of Lone Star (not to be unreasonably withheld, conditioned or delayed), we are restricted from (x) entering into any agreement or amendment, after Lone Star ceases to control the Company, that would materially restrict (or in the case of amendments, further restrict beyond the restrictions in the Company’s existing financing agreements) our ability to make payments under the tax receivable agreement, or (y) unless permitted by the terms of the Indenture and the ABL Credit Agreement or any replacement senior debt document to the extent that the terms thereof are no less restrictive in this regard than the Indenture and the ABL Credit Agreement, incurring debt that would cause our consolidated total leverage ratio (the ratio of consolidated total indebtedness for borrowed money less balance sheet cash to consolidated EBITDA) to exceed 6.00 to 1.00. In addition, we are prohibited under the tax receivable agreement from replacing our existing financing agreements with any senior debt document that does not permit our subsidiaries to make dividends to us to the extent necessary to make the payments under the tax receivable agreement, without conditions, unless Lone Star otherwise consents.
Certain risks related to the tax receivable agreement are discussed in greater detail above in the section entitled “Risk Factors.”
Real Property Leases with Former Owners of Acquired Companies
We lease certain properties from the former owners of acquired companies, some of whom became our employees following the acquisition. Such post-acquisition leases are common within our industry. We conduct these leases as arm’s-length transactions. Management reviews and approves all such leases.
Executive Officer and Director Indemnification Agreements
Our amended and restated bylaws will permit us to indemnify our executive officers and directors to the fullest extent permitted by law, subject to limited exceptions. We will enter into indemnification agreements with each of our executive officers and directors prior to the consummation of this offering that will provide, in general, that we will indemnify them to the fullest extent permitted by law in connection with their service to us or on our behalf.
Review and Approval of Related Party Transactions
We will implement a written policy in connection with this offering pursuant to which the audit committee will review and approve transactions with our directors, officers and holders of
155
Table of Contents
more than 5% of our voting securities and their affiliates. Prior to approving any transaction with a related party, the audit committee will consider the material facts as to the related party’s relationship with us or interest in the transaction. Related party transactions will not be approved unless the audit committee has approved of the transaction. We did not have a formal review and approval policy for related party transactions at the time of any transaction described above.
156
Table of Contents
The following is a summary of the material provisions of our capital stock, as well as other material terms of our amended and restated certificate of incorporation and our amended and restated bylaws, each of which as will be in effect as of the consummation of this offering. This summary does not purport to be complete and is subject to and qualified in its entirety by our amended and restated certificate of incorporation and our amended and restated bylaws, copies of which will be filed as exhibits to the registration statement of which this prospectus is a part.
General
Upon consummation of this offering, our authorized capital stock will consist of 190,000,000 shares of common stock, par value $0.001 per share, and 10,000,000 shares of preferred stock, par value $0.001 per share.
Common Stock
Our amended and restated certificate of incorporation will authorize the issuance of up to 190,000,000 shares of common stock. All outstanding shares of common stock are validly issued, fully paid and nonassessable, and the shares of common stock to be issued in connection with this offering will be validly issued, fully paid and nonassessable.
The holders of our common stock will be entitled to one vote per share on all matters submitted to a vote of stockholders and our amended and restated certificate of incorporation will not provide for cumulative voting in the election of directors. Subject to preferences that may be applicable to any outstanding series of preferred stock, the holders of our common stock will receive ratably any dividends declared by our board of directors out of funds legally available for the payment of dividends. In the event of our liquidation, dissolution or winding-up, the holders of our common stock will be entitled to share ratably in all assets remaining after payment of or provision for any liabilities, subject to prior distribution rights of preferred stock, if any, then outstanding.
Preferred Stock
Our amended and restated certificate of incorporation will provide that our board of directors has the authority, without further action by the stockholders, to issue up to 10,000,000 shares of preferred stock. Our board of directors will be able to issue preferred stock in one or more series and determine the rights, preferences, privileges, qualifications and restrictions granted to or imposed upon our preferred stock, including dividend rights, conversion rights, voting rights, rights and terms of redemption, liquidation preferences and sinking fund terms, any or all of which may be greater than the rights of our common stock. Issuances of preferred stock could adversely affect the voting power of holders of our common stock and reduce the likelihood that holders of our common stock will receive dividend payments and payments upon liquidation. Any issuance of preferred stock could also have the effect of decreasing the market price of our common stock and could delay, deter or prevent a change in control of our company. Our board of directors does not presently have any plans to issue shares of preferred stock.
Limitations on Directors’ Liability
Our governing documents will limit the liability of, and require us to indemnify, our directors to the fullest extent permitted by the DGCL. The DGCL permits a corporation to limit or
157
Table of Contents
eliminate a director’s personal liability to the corporation or the holders of its capital stock for breach of fiduciary duty. This limitation is generally unavailable for acts or omissions by a director which (i) were not in good faith, (ii) were the result of intentional misconduct or a knowing violation of law, (iii) the director derived an improper personal benefit from (such as a financial profit or other advantage to which the director was not legally entitled) or (iv) breached the director’s duty of loyalty. The DGCL also prohibits limitations on director liability under Section 174 of the DGCL, which relates to certain unlawful dividend declarations and stock repurchases. The limitation of liability and indemnification provisions in our amended and restated certificate of incorporation and amended and restated bylaws may discourage stockholders from bringing a lawsuit against directors for breach of their fiduciary duties. These provisions may also have the effect of reducing the likelihood of derivative litigation against directors and officers, even though such an action, if successful, might otherwise benefit us and our stockholders. In addition, your investment may be adversely affected to the extent we pay the settlement costs and damage awards against directors and officers pursuant to these indemnification provisions.
We maintain insurance that insures our directors and officers against certain losses and which insures us against our obligations to indemnify the directors and officers. We also intend to enter into indemnification agreements with our directors and executive officers.
Exclusive Forum Clause
Our amended and restated certificate of incorporation will provide that, unless we consent in writing to the selection of an alternative forum, to the fullest extent permitted by law, the sole and exclusive forum for any stockholder (including any beneficial owner) to bring (i) any derivative action or proceeding brought on our behalf, (ii) any action asserting a claim of breach of a fiduciary duty owed by any of our directors, officers or employees to us or to our stockholders, (iii) any action asserting a claim arising pursuant to any provision of the DGCL or our certificate of incorporation or bylaws or (iv) any action asserting a claim governed by the internal affairs doctrine, will be a state court located within the State of Delaware (or, if no state court located within the State of Delaware has jurisdiction, the federal district court for the District of Delaware); in all cases subject to such court having personal jurisdiction over the indispensable parties named as defendants. Any person or entity purchasing or otherwise acquiring any interest in shares of our capital stock is deemed to have notice of and consented to the foregoing provisions. See the section entitled “Risk Factors.”
Delaware Takeover Statute
Under our amended and restated certificate of incorporation, we will opt out of the provisions of Section 203 of the DGCL regulating corporate takeovers. This section prevents certain Delaware corporations, under certain circumstances, from engaging in a “business combination” with a stockholder who owns 15% or more of our outstanding voting stock, or an Interested Stockholder, an affiliate of an Interested Stockholder or an associate of an Interested Stockholder, in each case for three years following the date that the stockholder became an Interested Stockholder.
Provisions of Our Certificate of Incorporation and Bylaws to be Adopted and Delaware Law That May Have an Anti-Takeover Effect
Provisions of the DGCL and our amended and restated certificate of incorporation and amended and restated bylaws could make it more difficult to acquire our company by means of
158
Table of Contents
a tender offer, a proxy contest or otherwise, or to remove incumbent officers and directors. These provisions, summarized below, are intended to discourage coercive takeover practices and inadequate takeover bids and to encourage persons seeking to acquire control of us to first negotiate with our board of directors. We believe that the benefits of these provisions outweigh the disadvantages of discouraging certain takeover or acquisition proposals because, among other things, negotiation of these proposals could result in an improvement of their terms and enhance the ability of our board of directors to maximize stockholder value. However, these provisions may delay, deter or prevent a merger or acquisition of us that a stockholder might consider is in its best interest, including those attempts that might result in a premium over the prevailing market price of our common stock.
Requirements for Advance Notification of Stockholder Meetings, Nominations and Proposals
Our amended and restated bylaws will provide that special meetings of the stockholders may be called only by or at the direction of the board of directors, the chairman of our board or the chief executive officer with the concurrence of a majority of the board of directors. Our amended and restated bylaws will prohibit the conduct of any business at a special meeting other than as specified in the notice for such meeting. These provisions may have the effect of deferring, delaying or discouraging hostile takeovers or changes in control or management of our company.
Our amended and restated bylaws will establish advance notice procedures with respect to stockholder proposals and the nomination of candidates for election as director. In order for any matter to be “properly brought” before a meeting, a stockholder will have to comply with such advance notice procedures and provide us with certain information. Our amended and restated bylaws will allow the presiding officer at a meeting of stockholders to adopt rules and regulations for the conduct of meetings which may have the effect of precluding the conduct of certain business at a meeting if such rules and regulations are not followed. These provisions may also defer, delay or discourage a potential acquirer from conducting a solicitation of proxies to elect the acquirer’s own slate of directors or otherwise attempting to influence or obtain control of our company.
Supermajority Voting for Amendments to Our Governing Documents
Any amendment to our amended and restated certificate of incorporation will require the affirmative vote of at least 66 2/3% of the voting power of all shares of our common stock then outstanding. Our amended and restated certificate of incorporation will provide that the board of directors is expressly authorized to adopt, amend or repeal our bylaws and that our stockholders may amend our bylaws only with the approval of at least 66 2/3% of the voting power of all shares of our common stock then outstanding.
No Cumulative Voting
The DGCL provides that a stockholder’s right to vote cumulatively in the election of directors does not exist unless the certificate of incorporation specifically provides otherwise. Our amended and restated certificate of incorporation will not provide for cumulative voting.
Classified Board of Directors
Our amended and restated certificate of incorporation will provide that our board of directors will initially be divided into three classes of directors, with the classes to be as nearly equal in number as possible, designated Class I, Class II and Class III. Class I directors shall
159
Table of Contents
initially serve until the first annual meeting of stockholders following the effectiveness of our amended and restated certificate of incorporation; Class II directors shall initially serve until the second annual meeting of stockholders following the effectiveness of our amended and restated certificate of incorporation; and Class III directors shall initially serve until the third annual meeting of stockholders following the effectiveness of our amended and restated certificate of incorporation. Commencing with the first annual meeting of stockholders following the effectiveness of our amended and restated certificate of incorporation and ending with the third annual meeting of stockholders thereafter, directors of each class the term of which shall then expire shall be elected to hold office for a three-year term. Beginning with the fourth annual meeting of stockholders following the effectiveness of our amended and restated certificate of incorporation, directors of each class the term of which shall then expire shall be elected to hold office for a one-year term. The classification of directors will have the effect of making it more difficult for stockholders to change the composition of our board of directors. Our amended and restated certificate of incorporation will provide that the number of directors will be fixed from time to time exclusively pursuant to a resolution adopted by the board of directors, but must consist of not less than three or more than 15 directors.
Removal of Directors; Vacancies
Our amended and restated certificate of incorporation and amended and restated bylaws will provide that (i) prior to the date on which Lone Star and its affiliates cease to beneficially own, in the aggregate, at least a majority of the voting power of all outstanding shares entitled to vote generally in the election of directors, directors may be removed with or without cause upon the affirmative vote of holders of at least a majority of the voting power of all the then outstanding shares of stock entitled to vote generally in the election of directors, voting together as a single class and (ii) on and after the date Lone Star and its affiliates cease to beneficially own, in the aggregate, at least a majority of the voting power of all outstanding shares entitled to vote generally in the election of directors, directors may be removed only for cause and only upon the affirmative vote of holders of at least 66 2/3% of the voting power of all the then outstanding shares of stock entitled to vote generally in the election of directors, voting together as a single class. In addition, our amended and restated certificate of incorporation and amended and restated bylaws will provide that any newly created directorships and any vacancies on our board of directors will be filled only by the affirmative vote of the majority of remaining directors.
Stockholder Action by Written Consent
The DGCL permits any action required to be taken at any annual or special meeting of the stockholders to be taken without a meeting, without prior notice and without a vote if a consent or consents in writing, setting forth the action so taken, is signed by the holders of outstanding stock having not less than the minimum number of votes that would be necessary to authorize or take such action at a meeting at which all shares of stock entitled to vote thereon were present and voted, unless the certificate of incorporation provides otherwise. Our amended and restated certificate of incorporation and amended and restated bylaws will preclude stockholder action by written consent after the date on which Lone Star and its affiliates cease to beneficially own, in the aggregate, at least a majority of the voting power of all outstanding shares of our stock entitled to vote generally in the election of directors.
Limitations on Liability and Indemnification of Officers and Directors
The DGCL authorizes corporations to limit or eliminate the personal liability of officers and directors to corporations and their stockholders for monetary damages for breaches of directors’
160
Table of Contents
fiduciary duties. Our amended and restated certificate of incorporation and amended and restated bylaws will include provisions that eliminate, to the extent allowable under the DGCL, the personal liability of officers and directors for monetary damages for actions taken as an officer or a director, as the case may be. Our amended and restated certificate of incorporation and amended and restated bylaws will also provide that we must indemnify and advance reasonable expenses to our officers and directors to the fullest extent authorized by the DGCL. We will also be expressly authorized to carry directors’ and officers’ insurance for our officers and directors as well as certain employees for certain liabilities.
The limitation of liability and indemnification provisions in our amended and restated certificate of incorporation and amended and restated bylaws may discourage stockholders from bringing a lawsuit against officers and directors for breach of their fiduciary duty. These provisions may also have the effect of reducing the likelihood of derivative litigation against officers and directors, even though such an action, if successful, might otherwise benefit our company and our stockholders. In addition, your investment may be adversely affected to the extent that, in a class action or direct suit, we pay the costs of settlement and damage awards against officers and directors pursuant to these indemnification provisions.
There is currently no pending litigation or proceeding involving any of our officers, directors or employees for which indemnification is being sought.
Authorized but Unissued Shares
Our authorized but unissued shares of common stock and preferred stock will be available for future issuance without your approval. The DGCL does not require stockholder approval for any issuance of authorized shares. However, NYSE listing requirements require stockholder approval of certain issuances equal to or exceeding 20% of the then-outstanding voting power or the then-outstanding number of shares of common stock. No assurances can be given that our shares will remain so listed. We may use additional shares for a variety of corporate purposes, including future public offerings to raise additional capital, corporate acquisitions and employee benefit plans. As discussed above, our board of directors has the ability to issue preferred stock with voting rights or other preferences, without stockholder approval. The existence of authorized but unissued shares of common stock and preferred stock could render more difficult or discourage an attempt to obtain control of our company by means of a proxy contest, tender offer, merger or otherwise.
Corporate Opportunities and Transactions with Lone Star
In recognition that principals, members, directors, managers, partners, stockholders, officers, employees and other representatives of Lone Star may serve as our directors or officers, and that the Lone Star may engage in similar activities or lines of business that we do, our amended and restated certificate of incorporation will provide for the allocation of certain corporate opportunities between us and the Lone Star. Specifically, none of Lone Star or any principal, member, director, manager, partner, stockholder, officer, employee or other representative of Lone Star has any duty to refrain from engaging directly or indirectly in the same or similar business activities or lines of business that we do. In the event that Lone Star or any of the foregoing acquire knowledge of a potential transaction or matter which may be a corporate opportunity for itself and us, we will not have any expectancy in the corporate opportunity and neither Lone Star nor such party will have any duty to communicate or offer the corporate opportunity to us and may pursue or acquire such corporate opportunity for itself or direct such opportunity to another person. In addition, if one of our directors or officers who is
161
Table of Contents
also a principal, member, director, manager, partner, stockholder, officer, employee or other representative of Lone Star acquires knowledge of a potential transaction or matter which may be a corporate opportunity for us and Lone Star, we will not have any expectancy in the corporate opportunity unless the corporate opportunity is expressly offered to the person solely in his or her capacity as one of our directors or officers. See the section entitled “Risk Factors.”
In recognition that we may engage in material business transactions with Lone Star, from which we are expected to benefit, our amended and restated certificate of incorporation will provide that any of our directors or officers who are also principals, members, directors, managers, partners, stockholders, officers, employees or other representatives of Lone Star will have fully satisfied and fulfilled his or her fiduciary duty to us and our stockholders with respect to such transaction, if:
| • | the transaction was approved, after being made aware of the material facts of the relationship between each of us or one of our subsidiaries and Lone Star and the material terms and facts of the transaction, by (1) an affirmative vote of a majority of the members of our board of directors who do not have a material financial interest in the transaction, or disinterested persons or (2) an affirmative vote of a majority of the members of a committee of our board of directors consisting of members who are disinterested persons; |
| • | the transaction was fair to us at the time we entered into the transaction; or |
| • | the transaction was approved by an affirmative vote of the holders of a majority of shares of our common stock entitled to vote, excluding Lone Star and any holder who has a material financial interest in the transaction. |
By becoming a stockholder in our company, you will be deemed to have received notice of and consented to these provisions of our amended and restated certificate of incorporation.
Transfer Agent and Registrar
The Transfer Agent and Registrar for our common stock will be Computershare Trust Company, N.A.
Listing
We have applied to list our common stock on the NYSE under the symbol “FBM.”
162
Table of Contents
DESCRIPTION OF CERTAIN INDEBTEDNESS
Set forth below are summaries of certain terms of our existing indebtedness. These summaries are not complete and are qualified in their entirety by reference to the complete text of the applicable agreement, copies of which are filed as exhibits to the registration statement of which this prospectus forms a part.
ABL Credit Facility
On August 9, 2016, we entered into the ABL Credit Facility with Goldman Sachs Bank USA, as administrative agent, and a syndicate of lenders, which provided for initial borrowings of up to $250.0 million, and on September 23, 2016, we entered into an incremental facility amendment to the ABL Credit Facility, increasing the size of the revolving commitments thereunder by $50.0 million. The ABL Credit Facility provides for a $300.0 million revolving credit facility and matures on February 9, 2021. The ABL Credit Facility includes an option to further increase the maximum commitments up to an aggregate amount (which includes the September 2016 incremental of $50.0 million referenced above) not to exceed the greater of (i) $50.0 million and (ii) such amount as would not cause the total revolving commitments under the ABL Credit Facility to exceed the aggregate borrowing base under the ABL Credit Facility by more than $50.0 million, in each case as of the date of such incurrence, subject to the conditions set forth in the ABL Credit Agreement.
Interest on borrowings under the ABL Credit Facility accrues at a rate equal to LIBOR or CDOR (as applicable, based on the currency of the borrowing) plus a margin of 1.25% to 1.75% based on average daily availability for the most recent fiscal year, or if selected by the borrower, ABR or the Canadian prime rate (as applicable, based on the currency of the borrowing) plus a margin of 0.25% to 0.75% based on average daily availability for the most recent fiscal quarter, in all such cases subject to an additional 2.0% on overdue amounts during certain default events. There are currently $190.0 million of borrowings and no letters of credit outstanding under the ABL Credit Facility, resulting in available capacity under the ABL Credit Facility of $110.0 million.
The ABL Credit Agreement contains customary covenants, representations and warranties and events of default, including covenants which generally restrict our business and limit our ability to, among other things: dispose of certain assets; incur or guarantee additional indebtedness; enter into new lines of business; make certain investments, intercompany loans or payments in respect of indebtedness; incur or maintain liens; modify certain terms of our or their organizational documents, certain agreements or certain debt instruments; declare or pay dividends or make other restricted payments (including redemption of our stock); engage in certain transactions with affiliates; enter into certain sale leaseback transactions; modify the terms of certain of our existing contractual agreements; and engage in mergers, consolidations or the sale or disposition of substantially all of its assets. The ABL Credit Agreement also includes representations and warranties which we must be able to make in order to obtain borrowings under the facility and a financial maintenance covenant and events of default related to, among other things: the non-payment of principal, interest or fees; violations of covenants; material inaccuracy of representations or warranties; failure to timely deliver a borrowing base certificate; certain bankruptcy events; certain events under the Employee Retirement Income Security Act of 1974, as amended; invalidity of guarantees or security interests; default in payment under or the acceleration of other indebtedness; material judgments; and certain change of control events, each of which could result in the facility being terminated and any outstanding debt becoming due prior to its scheduled maturity. The financial maintenance covenant under the ABL Credit Agreement is a minimum fixed charge
163
Table of Contents
coverage ratio test set at a level of 1.00:1.00, which is only tested at times when availability under the ABL Credit Facility is less than a certain threshold.
Borrowings by Cypress Holdings and the other U.S. borrowers are guaranteed by Cypress and by each of its U.S. direct or indirect wholly-owned restricted subsidiaries (other than the applicable borrower and any Excluded Subsidiary (as defined in the Indenture)). Borrowings by the Canadian borrowers are guaranteed by Cypress Holdings, the U.S. guarantors and Cypress’s Canadian direct or indirect wholly-owned restricted subsidiaries (other than the applicable borrower, immaterial subsidiaries and certain other subsidiaries). The obligations of the U.S. borrowers and U.S. guarantors under the ABL Credit Facility are secured by substantially all the assets of the U.S. borrowers and the U.S. guarantors, with certain exceptions, and the obligations of the Canadian borrowers and the Canadian guarantors under the ABL Credit Facility are secured by substantially all the assets of the U.S. borrowers, the U.S. guarantors, the Canadian borrowers and the Canadian guarantors, with certain exceptions. The applicable agent under the ABL Credit Facility, for the benefit of the lenders under the ABL Credit Facility and certain other secured parties, such as holders of hedging and cash management obligations, has a first priority perfected lien on certain priority collateral of the grantors, generally consisting of current assets, including inventory, accounts receivable, deposit accounts, cash and certain related assets, subject to certain exceptions. Subject to certain exceptions and permitted liens, the ABL Credit Facility is secured on a second-priority basis by the Notes priority collateral described below.
The ABL Credit Facility restricts any person or group of persons that are not Lone Star Fund IX (U.S.) L.P., Hudson Americas L.P., certain of their affiliates and certain of our senior management members from owning more than the greater of 35% of the voting power of all outstanding shares of our common stock and the percentage of the voting power of all outstanding shares of our common stock held by Lone Star Fund IX (U.S.) L.P., Hudson Americas L.P., certain of their affiliates, and certain of our senior management members.
Notes
In August 2016, we completed a private offering of $575.0 million in aggregate principal amount of the Notes in reliance on Rule 144A and Regulation S under the Securities Act. In the offering we received net proceeds of approximately $563.5 million, which were used in part to repay and terminate the 2015 Credit Facilities. The Notes carry a coupon of 8.25% per annum and mature August 15, 2021.
The Indenture contains customary covenants, representations and warranties and events of default, including covenants which generally restrict our business and limit our ability to incur additional indebtedness, issue certain preferred shares, pay dividends, redeem our stock or make other distributions, make certain investments, limit the ability of our restricted subsidiaries to pay dividends to us or make other intercompany transfers, create liens, sell or transfer certain assets, engage in certain transactions with respect to all or substantially all of our assets, enter into certain transactions with affiliates and designate subsidiaries as unrestricted subsidiaries. The Indenture also contains events of default related to, among other things: the non-payment of principal, premium or interest on any Note; violations of any agreement or obligation contained in the Indenture and related documents; certain bankruptcy events; invalidity of guarantees or security interests; default in payment under or the acceleration of other indebtedness; and material judgments, any of which could result in the trustee for the Notes declaring the principal of the Notes together with all accrued and unpaid interest thereon to be immediately due and payable.
164
Table of Contents
The Notes are guaranteed on a senior secured basis by Cypress and its existing and future wholly-owned U.S. restricted subsidiaries (other than Cypress Holdings, FBM Finance, Inc. and any immaterial or other Excluded Subsidiary), with such guarantees subject to release under circumstances specified in the Indenture. The Notes are secured on a first-priority basis by a pledge of certain priority collateral of Cypress Holdings, Cypress Finance, Inc. and the guarantors of the Notes, generally consisting of fixed assets such as material intellectual property, material owned real property, equipment and fixtures and certain general intangibles, including equity interests in restricted subsidiaries held by the Cypress Holdings, FBM Finance, Inc. and the U.S. guarantors, and substantially all of Cypress Holding’s, FBM Finance, Inc.’s and the U.S. guarantors’ other assets, other than the priority collateral under the ABL Credit Facility, subject to certain exceptions. Subject to certain exceptions and permitted liens, the Notes are secured on a second-priority basis by the ABL Credit Facility priority collateral described above.
The Indenture restricts any person or group of persons that are not Lone Star Fund IX (U.S.) L.P. or certain of our senior management members from owning greater than 50% of the voting power of all outstanding shares of our common stock.
165
Table of Contents
SHARES ELIGIBLE FOR FUTURE SALE
Prior to this offering, there has been no public market for our common stock. Immediately following the consummation of the offering, we will have an aggregate of 42,774,239 shares of common stock outstanding. Of the outstanding shares, the 12,800,000 shares sold in this offering (or 14,720,000 shares if the underwriters exercise in full their option to purchase additional shares) will be freely tradable without restriction or further registration under the Securities Act, except that any shares held by our affiliates, as that term is defined in Rule 144 of the Securities Act, may generally be sold only in compliance with the limitations described below. The remaining outstanding shares of our common stock will be deemed restricted securities, as defined in Rule 144. We expect that Lone Star will be considered an affiliate of ours after this offering based on its expected share ownership and representation on our board of directors. Certain other of our stockholders may also be considered affiliates at that time.
We cannot predict what effect, if any, sales of shares of our common stock from time to time or the availability of shares of our common stock for future sale may have on the market price of our common stock. Sales of substantial amounts of common stock, or the perception that such sales could occur, could adversely affect prevailing market prices for our common stock and could impair our future ability to raise capital through an offering of equity securities or otherwise. See the section entitled “Risk Factors.”
Lock-Up Agreements
We, our officers and directors and the holder of all of our outstanding shares of common stock immediately prior to this offering will be subject to lock-up agreements with the underwriters that will restrict the sale of shares of our common stock held by them for 180 days after the date of this prospectus, subject to certain exceptions, as described in the section entitled “Underwriting.”
Sales of Restricted Securities
Other than the shares sold in this offering, all of the remaining shares of our common stock outstanding following the consummation of the offering will be available for sale, subject to the lock-up agreements described above, after the date of this prospectus in registered sales or pursuant to Rule 144 or another exemption from registration. Restricted shares may be sold in the public market only if registered or if they qualify for an exemption from registration, including under Rule 144 promulgated under the Securities Act, which is summarized below.
In general, under Rule 144, a person who is not our affiliate and has not been our affiliate at any time during the preceding three months will be entitled to sell any shares of our common stock beneficially owned thereby for at least one year without regard to the volume limitations summarized below. However, such non-affiliate need only have beneficially owned such shares to be sold for at least six months if we have been subject to the reporting requirements of the Exchange Act for at least 90 days at the time of such sale and there is adequate current public information about us available. In either case, a non-affiliate may include the holding period of any prior owner other than an affiliate of ours.
Beginning 90 days after the date of this prospectus, our affiliates who have beneficially owned shares of our common stock for at least six months, including the holding period of any prior owner other than one of our affiliates, would be entitled to sell within any three-month period a number of shares that does not exceed the greater of: (i) 1% of the number of shares of
166
Table of Contents
our common stock then-outstanding, which will equal approximately 427,743 shares immediately after the consummation of this offering; and (ii) the average weekly trading volume in our common stock on the applicable stock exchange during the four calendar weeks preceding the date of filing of a Notice of Proposed Sale of Securities Pursuant to Rule 144 with respect to the sale. Sales under Rule 144 by our affiliates are also subject to manner of sale provisions and notice requirements and to the availability of current public information about us.
As a result of the provisions of Rule 144, additional shares will be available for sale in the public market upon the expiration or, if earlier, the waiver of the lock-up period provided for in the lock-up agreements, subject, in some cases, to volume limitations.
Additional Registration Statements
In addition, 3,636,000 shares of common stock may be granted under the 2017 Stock Incentive Plan, including grants to be made in connection with this offering. We intend to file one or more registration statements under the Securities Act after this offering to register up to 3,636,000 shares of our common stock issued or reserved for issuance under our 2017 Stock Plan and any future equity incentive plans. These registration statements will become effective upon filing and shares covered by these registration statements will be eligible for sale in the public market immediately after the effective dates of these registration statements, subject to any vesting restrictions and limitations on exercise under the applicable equity incentive plan, the lock-up agreements described in the section entitled “Underwriting” and, with respect to affiliates, limitations under Rule 144.
Registration Rights Agreement
Prior to the consummation of this offering, we will enter into a registration rights agreement with Lone Star. The terms of the registration rights agreement will include provisions for demand registration rights and piggyback registration rights in favor of Lone Star. Demand registration rights require that, subject to the terms of the registration rights agreement, Lone Star will have the right to require that we register its shares under the Securities Act for sale to the public. Piggyback registration rights allow Lone Star to include its shares in any registration that we effect under the Securities Act, other than a registration effected pursuant to an exercise of demand registration rights, subject to specified exceptions. We must pay all expenses, except for underwriters’ discounts and commissions, incurred in connection with the exercise of these registration rights. The registration rights agreement will not provide however for the payment of any consideration by us to Lone Star if a registration statement for the resale of shares of common stock held by Lone Star is not declared effective or if the effectiveness is not maintained.
Immediately following consummation of this offering, all shares of our common stock held by Lone Star will be entitled to these registration rights. Shares registered with the SEC pursuant to these registration rights will be eligible for sale in the public markets upon effectiveness of the registration statement covering those shares. However, the underwriting agreement and lock-up agreements prohibit us from filing any registration statement for the resale of shares of common stock held by Lone Star for a period of 180 days after the date of this prospectus without the prior consent of the representatives. By exercising its registration rights and causing a large number of shares to be registered and sold in the public market, Lone Star could cause the price of the common stock to fall. In addition, any demand to include these shares in our registration statements could have a material adverse effect on our ability to raise needed capital. See the section entitled “Risk Factors.”
167
Table of Contents
U.S. FEDERAL TAX CONSIDERATIONS FOR NON-U.S. HOLDERS
The following is a general discussion of certain U.S. federal income tax consequences of the acquisition, ownership and disposition of our common stock purchased pursuant to this offering by a non-U.S. holder. As used in this prospectus, the term “non-U.S. holder” means a beneficial owner of 5% or less of our common stock that, for U.S. federal income tax purposes, is an individual, corporation, estate or trust and is not any of the following:
| • | an individual who is a citizen or resident of the United States; |
| • | a corporation (including any entity treated as a corporation for U.S. federal income tax purposes) created or organized in the United States or under the laws of the United States or any state thereof (including the District of Columbia); |
| • | an estate the income of which is subject to U.S. federal income taxation regardless of its source; or |
| • | a trust (i) whose administration is subject to the primary supervision of a U.S. court and which has one or more U.S. persons who have the authority to control all substantial decisions of the trust or (ii) that has a valid election in effect under applicable U.S. Treasury regulations to be treated as a U.S. person. |
An individual who is not a citizen of the United States may, subject to certain restrictions as well as limitations contained in any applicable income tax treaties, be deemed to be a resident of the United States by reason of being present in the United States for at least 31 days in the calendar year and an aggregate of at least 183 days during a three year period ending in the current calendar year (counting for such purposes all of the days present in the current year, one-third of the days present in the immediate preceding calendar year and one sixth of the days present in the second preceding calendar year). U.S. residents are generally taxed for U.S. federal income tax purposes in the same manner as U.S. citizens.
This discussion assumes that you will hold our common stock issued pursuant to this offering as a capital asset within the meaning of the Internal Revenue Code of 1986, as amended, or the Code (i.e., generally, property held for investment). This discussion does not address all aspects of U.S. federal taxation that may be relevant to a particular non-U.S. holder in light of the holder’s individual investment or tax circumstances, or to non-U.S. holders that are subject to special tax rules. In addition, this description of U.S. tax consequences does not address:
| • | U.S. state and local or non-U.S. tax consequences; |
| • | U.S. federal estate or gift tax consequences; |
| • | the U.S. net investment income tax that is imposed in addition to other U.S. income taxes (the Unearned Income Medicare Contribution) |
| • | specific facts and circumstances that may be relevant to a particular non-U.S. holder’s tax position; |
| • | the tax consequences for the stockholders, partners or beneficiaries of a non-U.S. holder; |
| • | special tax rules that may apply to some non-U.S. holders, including without limitation, banks, insurance companies, financial institutions, qualified foreign pension funds, hybrid entities, broker-dealers, tax-exempt entities, controlled foreign corporations, passive foreign investment companies or U.S. expatriates; or |
168
Table of Contents
| • | special tax rules that may apply to a non-U.S. holder that holds our common stock as part of a straddle, hedge or conversion transaction or other integrated investment. |
If a partnership (or other entity or arrangement treated as a partnership for U.S. federal income tax purposes) is a beneficial owner of our common stock, the treatment of a partner in the partnership generally will depend upon the status of the partner and the activities of the partnership. A beneficial owner of our common stock that is a partnership and partners in such a partnership should consult their tax advisors regarding the U.S. federal income tax consequences of acquiring, owning and disposing of our common stock.
This discussion is based on current provisions of the Code, final, temporary and proposed U.S. Treasury regulations, judicial opinions, published positions of the U.S. Internal Revenue Service, or IRS, and other applicable authorities, all as in effect on the date hereof and all of which are subject to differing interpretations or change, possibly with retroactive effect. We have not sought, and will not seek, any ruling from the IRS or any opinion of counsel with respect to the tax consequences discussed herein, and there can be no assurance that the IRS will not take a position contrary to the tax consequences discussed below or that any position taken by the IRS would not be sustained.
We strongly urge you to consult your tax advisor regarding the U.S. federal tax consequences of acquiring, owning or disposing our common stock, as well as any tax consequences that may arise under the laws of any foreign, state, local or other taxing jurisdiction or under any applicable tax treaty.
Dividends
We have no present intention to pay dividends on our common stock. However, if distributions of cash or property (other than certain stock distributions) are made to non-U.S. holders on shares of our common stock, such distributions generally will constitute dividends for U.S. federal income tax purposes to the extent paid from our current or accumulated earnings and profits, as determined under U.S. federal income tax principles. Distributions in excess of earnings and profits will constitute a return of capital that is applied against and reduces the non-U.S. holder’s adjusted tax basis in our common stock. Any remaining excess will be treated as gain realized on the sale or other disposition of the common stock and will be treated as described under “—Gain on Sale, Exchange or Other Taxable Disposition of Common Stock” below.
Dividends paid to a non-U.S. holder that are not effectively connected with the non-U.S. holder’s conduct of a trade or business in the United States generally will be subject to withholding of U.S. federal income tax at the rate of 30% or such lower rate as may be specified by an applicable income tax treaty. Non-U.S. holders should consult their tax advisors regarding their entitlement to benefits under an applicable income tax treaty and the requirements for and manner of claiming the benefits of such treaty (including, without limitation, the need to obtain a U.S. taxpayer identification number).
If the non-U.S. holder is engaged in a trade or business in the United States, either directly or through an entity treated as a partnership for U.S. tax purposes, and the dividends are effectively connected with the conduct of such trade or business, and, if provided in an applicable income tax treaty, are dividends attributable to a permanent establishment or fixed base maintained by the non-U.S. holder in the United States, then the dividends are not subject to the U.S. withholding tax, but instead are subject to U.S. federal income tax on a net income
169
Table of Contents
basis at applicable graduated U.S. federal income tax rates and in the manner applicable to U.S. persons. Certain certification and disclosure requirements must be complied with for effectively connected income or income attributable to a permanent establishment to be exempt from withholding. Any effectively connected dividends or dividends attributable to a permanent establishment received by a non-U.S. holder that is treated as a foreign corporation for U.S. tax purposes may be subject to an additional “branch profits tax” at a 30% rate, or such lower rate as may be specified by an applicable income tax treaty. To claim the benefit of a tax treaty or an exemption from withholding because dividends are effectively connected with the conduct of a trade or business in the United States, a non-U.S. holder generally must provide to the withholding agent a properly executed IRS Form W-8BEN or W-8BEN-E, as applicable, (or successor form) for treaty benefits or IRS Form W-8ECI (or successor form) for effectively connected income, before the payment of dividends, and, if claiming the benefit of a tax treaty, generally must certify under penalties of perjury on the appropriate forms that such non-U.S. holder is not a U.S. person and is eligible for treaty benefits. These forms may need to be periodically updated. Non-U.S. holders may obtain a refund of any excess amounts withheld by timely filing an appropriate claim for refund along with the required information. Special certification rules apply to certain partnerships and trusts. Accordingly, a non-U.S. holder that is a foreign partnership or a foreign trust is urged to consult its own tax advisor regarding its status under U.S. tax law and the certification requirements applicable to it.
Gain on Sale, Exchange or Other Taxable Disposition of Common Stock
A non-U.S. holder generally will not be subject to U.S. federal income tax, including by way of withholding, on gain recognized on a sale, exchange or other taxable disposition of our common stock unless any one of the following applies:
| 1. | The non-U.S. holder is a nonresident alien individual who is present in the United States for 183 days or more in the taxable year of the sale, exchange or other taxable disposition and certain other requirements are met; |
| 2. | The gain is effectively connected with the non-U.S. holder’s conduct of a trade or business in the United States, directly or through an entity treated as a partnership for U.S. tax purposes and, if an applicable tax treaty requires, attributable to a U.S. permanent establishment or fixed base of such non-U.S. holder; or |
| 3. | We are or have been, at any time during the five-year period preceding such disposition (or the non-U.S. holder’s holding period, if shorter) a “United States real property holding corporation,” within the meaning of Section 897(c)(2) of the Code, unless our common stock is regularly traded on an established securities market and the non-U.S. holder holds no more than 5% of our outstanding common stock, directly or indirectly, during the relevant period. Generally, a United States corporation is treated as a United States real property holding corporation within the meaning of Section 897(c)(2) of the Code if the fair market value of its United States real property interests equals or exceeds 50% of the sum of the fair market value of its worldwide real property interests plus its other assets used or held for use in a trade or business. |
We believe that we have not been and are not currently a United States real property holding corporation, and we do not expect to become a United States real property holding corporation. However, no assurances can be made in this regard. Furthermore, no assurances can be provided that our stock will be considered to be regularly traded on an established securities market for this purpose.
Non-U.S. holders described in clause (1) above are taxed on their gains (including gains from sales of our common stock and net of applicable U.S. losses from sales or exchanges of
170
Table of Contents
other capital assets incurred during the year) at a flat rate of 30% or such lower rate as may be specified by an applicable income tax treaty. Non- U.S. holders described in clause (2) or (3) above will be subject to tax on the net gain derived from the sale under regular graduated U.S. federal income tax rates and in the manner applicable to U.S. persons, unless an applicable income tax treaty provides otherwise. If a non-U.S. holder described in clause (2) is a corporation, it may be subject to the additional branch profits tax at a rate equal to 30% of its effectively connected earnings and profits or at such lower rate as may be specified by an applicable income tax treaty. In addition, if we are determined to be a United States real property holding corporation and our common stock is not regularly traded on an established securities market, then a purchaser may be required to withhold 15% of the proceeds payable to a non-U.S. holder from a sale or other taxable disposition of our common stock.
Foreign Account Tax Compliance Act
Withholding taxes may be imposed under Sections 1471 to 1474 of the Code, the Treasury Regulations promulgated thereunder and other official guidance (commonly referred to as “FATCA”) on certain types of payments made to non-U.S. financial institutions and certain other non-U.S. entities. Specifically, a 30% withholding tax may be imposed on dividends on, or gross proceeds from the sale or other disposition of, our common stock paid to a “foreign financial institution” or a “non-financial foreign entity” (each as defined in the Code), unless those entities comply with certain requirements under the Code and applicable U.S. Treasury regulations, which requirements may be modified by an “intergovernmental agreement” entered into between the United States and an applicable foreign country. Future Treasury Regulations or other official guidance may modify these requirements.
Under the applicable Treasury Regulations, withholding under FATCA generally applies to payments of dividends on our common stock, and the IRS has announced that FATCA withholding will apply to payments of gross proceeds from the sale or other disposition of such stock on or after January 1, 2019. The FATCA withholding tax will apply to all withholdable payments without regard to whether the beneficial owner of the payment would otherwise be entitled to an exemption from imposition of withholding tax pursuant to an applicable tax treaty with the United States. Under certain circumstances (including, for example, where an applicable tax treaty applies), a holder might be eligible for refunds or credits of such taxes.
Prospective investors should consult their tax advisors regarding the potential application of withholding under FATCA to their investment in our common stock.
Information Reporting and Backup Withholding
We must report annually to the IRS, and to each non-U.S. Holder, the amount of dividends paid to, and the tax withheld with respect to, each non-U.S. Holder. These reporting requirements apply regardless of whether withholding was reduced or eliminated by an applicable tax treaty. Copies of this information reporting may also be made available under the provisions of a specific tax treaty or agreement with the tax authorities in the country in which the non-U.S Holder resides or is established.
A non-U.S. Holder will generally be subject to backup withholding for dividends on our common stock paid to such holder (at the applicable rate), unless such holder certifies under penalties of perjury that, among other things, it is a non-U.S. Holder (and the payor does not have actual knowledge or reason to know that such holder is a U.S. person), and otherwise complies with all applicable legal requirements.
171
Table of Contents
Information reporting and backup withholding generally are not required with respect to the amount of any proceeds from the sale or other disposition of our common stock by a non-U.S. Holder outside the United States through a foreign office of a foreign broker that does not have certain specified connections to the United States. However, if a non-U.S. Holder sells or otherwise disposes its shares of our common stock through a U.S. broker or the U.S. office of a foreign broker, the broker will generally be required to report the amount of proceeds paid to the non-U.S. Holder to the IRS and also backup withhold on that amount, unless such non-U.S. Holder provides appropriate certification to the broker of its status as a non-U.S. person or otherwise establishes an exemption (and the payor does not have actual knowledge or reason to know that such holder is a U.S. person). Information reporting will also apply if a non-U.S. Holder sells its shares of our common stock through a foreign broker deriving more than a specified percentage of its income from U.S. sources or having certain other connections to the United States, unless such broker has documentary evidence in its records that such non-U.S. Holder is a non-U.S. person and certain other conditions are met, or such non-U.S. Holder otherwise establishes an exemption (and the payor does not have actual knowledge or reason to know that such holder is a U.S. person).
Backup withholding is not an additional tax. Any amounts withheld under the backup withholding rules from a payment to a non-U.S. Holder can be credited against the non-U.S. Holder’s U.S. federal income tax liability, if any, or refunded, provided that the required information is furnished to the IRS in a timely manner. Non-U.S. Holders should consult their tax advisors regarding the application of the information reporting and backup withholding rules to them.
The foregoing discussion is only a summary of certain U.S. federal income tax consequences of the acquisition, ownership and disposition of our common stock by non-U.S. holders. You are urged to consult your own tax advisor with respect to the particular tax consequences to you of ownership and disposition of our common stock, including the effect of any U.S., state, local, non-U.S. or other tax laws and any applicable income tax treaty.
172
Table of Contents
Subject to the terms and conditions of the underwriting agreement, the underwriters named below, through their representatives Deutsche Bank Securities Inc., Barclays Capital Inc. and RBC Capital Markets, LLC, have severally agreed to purchase from us the following number of shares of common stock at a public offering price less the underwriting discounts and commissions set forth on the cover page of this prospectus:
| Underwriters |
Number of Shares |
|||
| Deutsche Bank Securities Inc. |
||||
| Barclays Capital Inc. |
||||
| RBC Capital Markets, LLC |
||||
| Citigroup Global Markets Inc. |
||||
| Robert W. Baird & Co. Incorporated |
||||
| Raymond James & Associates, Inc. |
||||
| Stephens Inc. |
||||
| SunTrust Robinson Humphrey, Inc. |
||||
| William Blair & Company, L.L.C. |
||||
|
|
|
|||
| Total |
12,800,000 | |||
|
|
|
|||
The underwriting agreement provides that the obligations of the several underwriters to purchase the shares of common stock offered hereby are subject to certain conditions precedent and that the underwriters will purchase all of the shares of common stock offered by this prospectus, other than those covered by the underwriters’ option to purchase additional shares described below unless and until this option is exercised, if any of these shares are purchased.
We have been advised by the representatives of the underwriters that the underwriters propose to offer the shares of common stock to the public at the public offering price set forth on the cover of this prospectus and to dealers at a price that represents a concession not in excess of $ per share under the public offering price. After the initial public offering, representatives of the underwriters may change the offering price and other selling terms.
The selling stockholder has granted to the underwriters an option, exercisable not later than 30 days after the date of this prospectus, to purchase up to 1,920,000 additional shares of common stock at the public offering price less the underwriting discounts and commissions set forth on the cover page of this prospectus. To the extent that the underwriters exercise this option, each of the underwriters will become obligated, subject to conditions, to purchase approximately the same percentage of these additional shares of common stock as the number of shares of common stock to be purchased by it in the above table bears to the total number of shares of common stock offered by this prospectus. We and the selling stockholder will be obligated, pursuant to the option, to sell these additional shares of common stock to the underwriters to the extent the option is exercised. If any additional shares of common stock are purchased, the underwriters will offer the additional shares on the same terms as those on which the 1,920,000 shares are being offered.
The underwriting discounts and commissions per share are equal to the public offering price per share of common stock less the amount paid by the underwriters to us or the selling stockholder per share of common stock. The underwriting discounts and commissions are % of the initial public offering price. We and the selling stockholder have agreed to pay the
173
Table of Contents
underwriters the following discounts and commissions, assuming either no exercise or full exercise by the underwriters of the underwriters’ option to purchase additional shares:
| Total Fees | ||||||||||||
| Fee per share | Without Exercise of Underwriters’ Option |
With Full Exercise of Underwriters’ Option |
||||||||||
| Discounts and commissions paid by us |
$ | $ | $ | |||||||||
| Discounts and commissions paid by the selling stockholder |
$ | $ | $ | |||||||||
In addition, we estimate that our share of the total expenses of this offering, excluding underwriting discounts and commissions, will be approximately $8.0 million. We have agreed to reimburse the underwriters for certain of their expenses up to a maximum amount of $25,000.
We and the selling stockholder have agreed to indemnify the underwriters against some specified types of liabilities, including liabilities under the Securities Act, and to contribute to payments the underwriters may be required to make in respect of any of these liabilities.
We, our officers and directors and the selling stockholder have agreed with the underwriters, subject to certain exceptions, not to dispose of or hedge any of their common stock or securities convertible into or exchangeable for shares of common stock during the period from the date of this prospectus continuing through the date 180 days after the date of this prospectus, except with the prior written consent of the representatives. See the section entitled “Shares Eligible for Future Sale.”
The representatives of the underwriters have advised us that the underwriters do not intend to confirm sales to any account over which they exercise discretionary authority.
In connection with the offering, the underwriters may purchase and sell shares of our common stock in the open market. These transactions may include short sales, purchases to cover positions created by short sales and stabilizing transactions.
Short sales involve the sale by the underwriters of a greater number of shares than they are required to purchase in the offering. Covered short sales are sales made in an amount not greater than the underwriters’ option to purchase additional shares of common stock from the selling stockholder in the offering. The underwriters may close out any covered short position by either exercising their option to purchase additional shares or purchasing shares in the open market. In determining the source of shares to close out the covered short position, the underwriters will consider, among other things, the price of shares available for purchase in the open market as compared to the price at which they may purchase shares through their option to purchase additional shares.
Naked short sales are any sales in excess of the underwriters’ option to purchase additional shares. The underwriters must close out any naked short position by purchasing shares in the open market. A naked short position is more likely to be created if underwriters are concerned that there may be downward pressure on the price of the shares in the open market prior to the completion of the offering.
Stabilizing transactions consist of various bids for or purchases of our common stock made by the underwriters in the open market prior to the completion of the offering.
The underwriters may impose a penalty bid. This occurs when a particular underwriter repays to the other underwriters a portion of the underwriting discount received by it because the representatives of the underwriters have repurchased shares sold by or for the account of that underwriter in stabilizing or short covering transactions.
174
Table of Contents
Purchases to cover a short position and stabilizing transactions may have the effect of preventing or slowing a decline in the market price of our common stock. Additionally, these purchases, along with the imposition of the penalty bid, may stabilize, maintain or otherwise affect the market price of our common stock. As a result, the price of our common stock may be higher than the price that might otherwise exist in the open market. These transactions may be effected on the NYSE, in the over-the-counter market or otherwise.
Directed Share Program
At our request, the underwriters have reserved for sale, at the initial public offering price, up to 3% of the common stock offered by this prospectus for sale to our director, director nominees, officers and certain of our employees and other persons associated with us. Pursuant to the underwriting agreement, the sales will be made by RBC Capital Markets, LLC, an underwriter of this offering, through a Directed Share Program. If these persons purchase reserved common stock, it will reduce the number of shares of common stock available for sale to the general public. Any reserved shares of common stock that are not so purchased will be offered by the underwriters to the general public on the same terms as the other shares of common stock offered by this prospectus. Any shares sold in the Directed Share Program to a party who has entered into a lock-up agreement described above shall be subject to the provisions of such lock-up agreement.
Pricing of this Offering
Prior to this offering, there has been no public market for our common stock. Consequently, the initial public offering price of our common stock will be determined by negotiation among us, the selling stockholder and the representatives of the underwriters. Among the primary factors that will be considered in determining the public offering price are:
| • | prevailing market conditions; |
| • | our results of operations in recent periods; |
| • | the present stage of our development; |
| • | the market capitalizations and stages of development of other companies that we and the representatives of the underwriters believe to be comparable to our business; and |
| • | estimates of our business potential. |
Conflicts of Interest
The underwriters and their respective affiliates are full service financial institutions engaged in various activities, which may include sales and trading, commercial investment banking, advisory, investment management, investment research, principal investment, hedging, market making, brokerages and other financial and non-financial activities and services. Certain of the underwriters and their respective affiliates have provided, and may in the future provide, a variety of these services to the Company and to persons and entities with relationships with the issuer, for which they received or will receive customary fees and expenses. An affiliate of RBC Capital Markets, LLC is a lender under the ABL Credit Facility. A portion of the net proceeds from this offering will be used to repay borrowings under the ABL Credit Facility. As a result, more than 5% of the net proceeds from this offering will be paid to an affiliate of RBC Capital Markets, LLC. Therefore, this offering is being made in compliance with FINRA Rule 5121. Pursuant to that rule, a “qualified independent underwriter,” as defined by the FINRA rules, must have participated in the preparation of the registration statement and performed its usual standard of
175
Table of Contents
due diligence with respect to that registration statement. Deutsche Bank Securities Inc. is serving as a qualified independent underwriter and will assume the customary responsibilities of acting as a qualified independent underwriter in conducting due diligence and reviewing and participating in the preparation of this registration statement. Deutsche Bank Securities Inc. will not receive any additional compensation for acting as a qualified independent underwriter. We have agreed to indemnify Deutsche Bank Securities Inc. against certain liabilities incurred in connection with acting as a qualified independent underwriter, including liabilities under the Securities Act.
Notice to Investors in the European Economic Area
In relation to each Member State of the European Economic Area which has implemented the Prospectus Directive (each, a “Relevant Member State”) an offer to the public of any shares which are the subject of this offering may not be made in that Relevant Member State other than the offers contemplated in the prospectus once the prospectus has been approved by the competent authority in such Relevant Member State and published and passported in accordance with the Prospectus Directive as implemented in the Relevant Member State except that an offer to the public in that Relevant Member State of any shares may be made at any time under the following exemptions under the Prospectus Directive, if they have been implemented in that Relevant Member State:
| • | to any legal entity which is a qualified investor as defined in the Prospectus Directive; |
| • | to fewer than 100 or, if the Relevant Member State has implemented the relevant provisions of the 2010 Amending Directive, 150, natural or legal persons (other than qualified investors as defined in the Prospectus Directive) subject to obtaining the prior consent of the representatives for any such offer; or |
| • | in any other circumstances falling within Article 3(2) of the Prospectus Directive, |
provided that no such offer of shares shall result in a requirement for the publication by the Issuer or any underwriter of a prospectus pursuant to Article 3 of the Prospectus Directive.
For the purposes of this provision, the expression an “offer to the public” in relation to any shares in any Relevant Member State means the communication in any form and by any means of sufficient information on the terms of the offer and any shares to be offered so as to enable an investor to decide to purchase any shares, as the same may be varied in that member state by any measure implementing the Prospectus Directive in that member state and the expression “Prospectus Directive” means Directive 2003/71/EC and includes any relevant implementing measure in each Relevant Member State.
In the case of any shares being offered to a financial intermediary as that term is used in Article 3(2) of the Prospectus Directive, such financial intermediary will also be deemed to have represented, acknowledged and agreed that the shares acquired by it in the offer have not been acquired on a non-discretionary basis on behalf of, nor have they been acquired with a view to their offer or resale to, persons in circumstances which may give rise to an offer of shares to the public other than their offer or resale in a Relevant Member State to qualified investors as so defined or in circumstances in which the prior consent of the underwriters has been obtained to each such proposed offer or resale.
Notice to Investors in the United Kingdom
This prospectus is only being distributed to, and is only directed at, persons in the United Kingdom that are qualified investors within the meaning of Article 2(1)(e) of the Prospectus Directive that are also (i) investment professionals falling within Article 19(5) of the Financial
176
Table of Contents
Services and Markets Act 2000 (Financial Promotion) Order 2005 (the “Order”) or (ii) high net worth entities, and other persons to whom it may lawfully be communicated, falling within Article 49(2)(a) to (d) of the Order (each such person being referred to as a “relevant person”). This prospectus and its contents are confidential and should not be distributed, published or reproduced (in whole or in part) or disclosed by recipients to any other persons in the United Kingdom. The shares are only available to, and any invitation, offer or agreement to purchase or otherwise acquire shares will be engaged in only with, relevant persons. Any person in the United Kingdom that is not a relevant person should not act or rely on this document or any of its contents.
Notice to Prospective Investors in France
Neither this prospectus nor any other offering material relating to the shares described in this prospectus has been submitted to the clearance procedures of the Autorité des Marchés Financiers or of the competent authority of another member state of the European Economic Area and notified to the Autorité des Marchés Financiers. The shares have not been offered or sold and will not be offered or sold, directly or indirectly, to the public in France. Neither this prospectus nor any other offering material relating to the shares has been or will be:
| • | released, issued, distributed or caused to be released, issued or distributed to the public in France; or |
| • | used in connection with any offer for subscription or sale of the shares to the public in France. |
Such offers, sales and distributions will be made in France only:
| • | to qualified investors (investisseurs qualifiés) and/or to a restricted circle of investors (cercle restreint d’investisseurs), in each case investing for their own account, all as defined in, and in accordance with articles L.411-2, D.411-1, D.411-2, D.734-1, D.744-1, D.754-1 and D.764-1 of the French Code monétaire et financier; |
| • | to investment services providers authorized to engage in portfolio management on behalf of third parties; or |
| • | in a transaction that, in accordance with article L.411-2-II-1°-or-2°-or 3° of the French Code monétaire et financier and article 211-2 of the General Regulations (Règlement Général) of the Autorité des Marchés Financiers, does not constitute a public offer (appel public à l’épargne). |
The shares may be resold directly or indirectly, only in compliance with articles L.411-1, L.411-2, L.412-1 and L.621-8 through L.621-8-3 of the French Code monétaire et financier.
Notice to Prospective Investors in Canada
Resale Restrictions
The distribution of the shares in Canada is being made only in the provinces of Ontario, Quebec, Alberta and British Columbia on a private placement basis exempt from the requirement that we and the selling stockholder prepare and file a prospectus with the securities regulatory authorities in each province where trades of these securities are made. Any resale of the shares in Canada must be made under applicable securities laws which may vary depending on the relevant jurisdiction, and which may require resales to be made under available statutory exemptions or under a discretionary exemption granted by the applicable Canadian securities regulatory authority. Purchasers are advised to seek legal advice prior to any resale of the securities.
177
Table of Contents
Representations of Canadian Purchasers
By purchasing the shares in Canada and accepting delivery of a purchase confirmation, a purchaser is representing to us, the selling stockholder and the dealer from whom the purchase confirmation is received that:
| • | the purchaser is entitled under applicable provincial securities laws to purchase the shares without the benefit of a prospectus qualified under those securities laws as it is an “accredited investor” as defined under National Instrument 45-106—Prospectus Exemptions or subsection 73.3(1) of the Securities Act (Ontario), |
| • | the purchaser is a “permitted client” as defined in National Instrument 31-103—Registration Requirements, Exemptions and Ongoing Registrant Obligations, |
| • | where required by law, the purchaser is purchasing as principal and not as agent, and |
| • | the purchaser has reviewed the text above in the section entitled “– Resale Restrictions.” |
Conflicts of Interest
Canadian purchasers are hereby notified that each of the underwriters is relying on the exemption set out in section 3A.3 or 3A.4, if applicable, of National Instrument 33-105 – Underwriting Conflicts from having to provide certain conflict of interest disclosure in this prospectus.
Statutory Rights of Action
Securities legislation in certain provinces or territories of Canada may provide a purchaser with remedies for rescission or damages if the offering memorandum (including any amendment thereto) such as this document contains a misrepresentation, provided that the remedies for rescission or damages are exercised by the purchaser within the time limit prescribed by the securities legislation of the purchaser’s province or territory. The purchaser of these securities in Canada should refer to any applicable provisions of the securities legislation of the purchaser’s province or territory for particulars of these rights or consult with a legal advisor.
Enforcement of Legal Rights
All of our directors and officers as well as the experts named herein and the selling stockholder may be located outside of Canada and, as a result, it may not be possible for Canadian purchasers to effect service of process within Canada upon us or those persons. All or a substantial portion of our assets and the assets of those persons may be located outside of Canada and, as a result, it may not be possible to satisfy a judgment against us or those persons in Canada or to enforce a judgment obtained in Canadian courts against us or those persons outside of Canada.
Taxation and Eligibility for Investment
Canadian purchasers of the shares should consult their own legal and tax advisors with respect to the tax consequences of an investment in the shares in their particular circumstances and about the eligibility of the shares for investment by the purchaser under relevant Canadian legislation.
Notice to Prospective Investors in Hong Kong
The shares may not be offered or sold in Hong Kong by means of any document other than (i) in circumstances which do not constitute an offer to the public within the meaning of the
178
Table of Contents
Companies (Winding Up and Miscellaneous Provisions) Ordinance (Cap. 32 of the Laws of Hong Kong) (“Companies (Winding Up and Miscellaneous Provisions) Ordinance”) or which do not constitute an invitation to the public within the meaning of the Securities and Futures Ordinance (Cap. 571 of the Laws of Hong Kong) (“Securities and Futures Ordinance”), (ii) to “professional investors” as defined in the Securities and Futures Ordinance and any rules made thereunder, or (iii) in other circumstances which do not result in the document being a “prospectus” as defined in the Companies (Winding Up and Miscellaneous Provisions) Ordinance, and no advertisement, invitation or document relating to the shares may be issued or may be in the possession of any person for the purpose of issue (in each case whether in Hong Kong or elsewhere), which is directed at, or the contents of which are likely to be accessed or read by, the public in Hong Kong (except if permitted to do so under the securities laws of Hong Kong) other than with respect to shares which are or are intended to be disposed of only to persons outside Hong Kong or only to “professional investors” in Hong Kong as defined in the Securities and Futures Ordinance and any rules made thereunder.
Notice to Prospective Investors in Singapore
This prospectus has not been registered as a prospectus with the Monetary Authority of Singapore. Accordingly, this prospectus and any other document or material in connection with the offer or sale, or invitation for subscription or purchase, of the shares may not be circulated or distributed, nor may the shares be offered or sold, or be made the subject of an invitation for subscription or purchase, whether directly or indirectly, to persons in Singapore other than (i) to an institutional investor (as defined under Section 4A of the Securities and Futures Act, Chapter 289 of Singapore (the “SFA”)) under Section 274 of the SFA, (ii) to a relevant person (as defined in Section 275(2) of the SFA) pursuant to Section 275(1) of the SFA, or any person pursuant to Section 275(1A) of the SFA, and in accordance with the conditions specified in Section 275 of the SFA or (iii) otherwise pursuant to, and in accordance with the conditions of, any other applicable provision of the SFA, in each case subject to conditions set forth in the SFA.
Where the shares are subscribed or purchased under Section 275 of the SFA by a relevant person which is a corporation (which is not an accredited investor (as defined in Section 4A of the SFA)) the sole business of which is to hold investments and the entire share capital of which is owned by one or more individuals, each of whom is an accredited investor, the securities (as defined in Section 239(1) of the SFA) of that corporation shall not be transferable for 6 months after that corporation has acquired the shares under Section 275 of the SFA except: (1) to an institutional investor under Section 274 of the SFA or to a relevant person (as defined in Section 275(2) of the SFA), (2) where such transfer arises from an offer in that corporation’s securities pursuant to Section 275(1A) of the SFA, (3) where no consideration is or will be given for the transfer, (4) where the transfer is by operation of law, (5) as specified in Section 276(7) of the SFA or (6) as specified in Regulation 32 of the Securities and Futures (Offers of Investments) (Shares and Debentures) Regulations 2005 of Singapore (“Regulation 32”).
Where the shares are subscribed or purchased under Section 275 of the SFA by a relevant person which is a trust (where the trustee is not an accredited investor (as defined in Section 4A of the SFA)) whose sole purpose is to hold investments and each beneficiary of the trust is an accredited investor, the beneficiaries’ rights and interest (howsoever described) in that trust shall not be transferable for 6 months after that trust has acquired the shares under Section 275 of the SFA except: (1) to an institutional investor under Section 274 of the SFA or to a relevant person (as defined in Section 275(2) of the SFA), (2) where such transfer arises from an offer that is made on terms that such rights or interest are acquired at a consideration of not less than S$200,000 (or its equivalent in a foreign currency) for each transaction (whether such amount is
179
Table of Contents
to be paid for in cash or by exchange of securities or other assets), (3) where no consideration is or will be given for the transfer, (4) where the transfer is by operation of law, (5) as specified in Section 276(7) of the SFA or (6) as specified in Regulation 32.
Notice to Prospective Investors in Switzerland
The prospectus does not constitute an issue prospectus pursuant to Article 652a or Article 1156 of the Swiss Code of Obligations, and the shares will not be listed on the SIX Swiss Exchange. Therefore, the prospectus may not comply with the disclosure standards of the Swiss Code of Obligations and/or the listing rules (including any prospectus schemes) of the SIX Swiss Exchange. Accordingly, the shares may not be offered to the public in or from Switzerland, but only to a selected and limited circle of investors, which do not subscribe to the shares with a view to distribution.
Notice to Prospective Investors in Japan
The securities have not been and will not be registered under the Financial Instruments and Exchange Act of Japan (Act No. 25 of 1948, as amended), or the FIEA. The securities may not be offered or sold, directly or indirectly, in Japan or to or for the benefit of any resident of Japan (including any person resident in Japan or any corporation or other entity organized under the laws of Japan) or to others for reoffering or resale, directly or indirectly, in Japan or to or for the benefit of any resident of Japan, except pursuant to an exemption from the registration requirements of the FIEA and otherwise in compliance with any relevant laws and regulations of Japan.
Notice to Prospective Investors in Australia
No prospectus or other disclosure document (as defined in the Corporations Act 2001 (Cth) of Australia (“Corporations Act”)) in relation to the common stock has been or will be lodged with the Australian Securities & Investments Commission (“ASIC”). This document has not been lodged with ASIC and is only directed to certain categories of exempt persons. Accordingly, if you receive this document in Australia:
(a) you confirm and warrant that you are either:
(i) a “sophisticated investor” under section 708(8)(a) or (b) of the Corporations Act;
(ii) a “sophisticated investor” under section 708(8)(c) or (d) of the Corporations Act and that you have provided an accountant’s certificate to us which complies with the requirements of section 708(8)(c)(i) or (ii) of the Corporations Act and related regulations before the offer has been made;
(iii) a person associated with the Company under Section 708(12) of the Corporations Act; or
(iv) a “professional investor” within the meaning of section 708(11)(a) or (b) of the Corporations Act, and to the extent that you are unable to confirm or warrant that you are an exempt sophisticated investor, associated person or professional investor under the Corporations Act, any offer made to you under this document is void and incapable of acceptance; and
(b) you warrant and agree that you will not offer any of the common stock for resale in Australia within 12 months of that common stock being issued unless any such resale offer is exempt from the requirement to issue a disclosure document under section 708 of the Corporations Act.
180
Table of Contents
The validity of the shares of common stock offered hereby will be passed upon for us by Gibson, Dunn & Crutcher LLP. Certain legal matters in connection with the shares of common stock offered hereby will be passed upon for the underwriters by Baker Botts L.L.P.
Foundation Building Materials, Inc.
The financial statement of Foundation Building Materials, Inc. as of October 27, 2016 (inception), included in this Prospectus, have been audited by Deloitte & Touche LLP, independent auditor, as set forth in their report included therein. Such financial statement is included in reliance upon the report of such firm given upon their authority as experts in accounting and auditing.
Cypress Holdings
The financial statements of LSF9 Cypress Holdings, LLC and subsidiaries as of December 31, 2015 (Successor) and 2014 (Predecessor), and the related consolidated statements of operations, changes in member’s equity, and cash flows for the period from October 9, 2015 to December 31, 2015 (Successor), for the period from January 1, 2015 to October 8, 2015 (Predecessor), and for the year ended December 31, 2014 (Predecessor) included in this Prospectus, have been audited by Deloitte & Touche LLP, independent registered public accounting firm, as stated in their report appearing herein. Such financial statements are included in reliance upon the report of such firm given upon their authority as experts in accounting and auditing.
Winroc-SPI
The combined financial statements of Construction Products Distribution as of and for the years ended December 31, 2015, 2014 and 2013, included in this Prospectus, have been audited by Deloitte LLP, independent auditors, as stated in their report appearing herein and are included in reliance upon the report of such firm given upon their authority as experts in accounting and auditing.
Great Western
The combined financial statements of Great Western as of March 12, 2015, and December 31, 2014, and for the period from January 1, 2015, to March 12, 2015, and the year ended December 31, 2014, included in this Prospectus, have been audited by Deloitte & Touche LLP, independent auditor, as set forth in their report included therein and are included in reliance upon the report of such firm given upon their authority as experts in accounting and auditing.
GSCIL
The financial statements of GSCIL as of December 30, 2015 and December 31, 2014 and for the period from January 1, 2015 to December 30, 2015 and the year ended December 31, 2014, included in this Prospectus, have been audited by Deloitte & Touche LLP, independent auditor, as set forth in their report included and are included in reliance upon the report of such firm given upon their authority as experts in accounting and auditing.
181
Table of Contents
BAV
The abbreviated financial statements of BAV for the period from January 1, 2014 through December 5, 2014, included in this Prospectus have been audited by Deloitte & Touche LLP, independent auditors, as stated in their report appearing herein (which report expresses an unqualified opinion on the 2015 financial statements and includes an explanatory paragraph referring to the presentation of abbreviated financial statements), and are included in reliance upon the report of such firm given upon their authority as experts in accounting and auditing.
Ken API
The audited financial statements of Ken API as of December 31, 2015 and December 31, 2014 and for the years ended December 31, 2015 and 2014, included in this prospectus, have been included herein in reliance upon the report of VonLehman & Company Inc., independent auditor, as set forth in their reports included therein.
Wagner
The combined abbreviated financial statements of Wagner, a business of CDM Investment Group, Inc., for the period from January 1, 2014 through May 30, 2014, included in this prospectus, have been audited by RSM US LLP, independent auditor, as set forth in their reports included therein.
182
Table of Contents
WHERE YOU CAN FIND ADDITIONAL INFORMATION
We have filed with the SEC a registration statement on Form S-1, including exhibits, of which this prospectus forms a part, under the Securities Act with respect to the shares of common stock to be sold in this offering. This prospectus does not contain all of the information set forth in the registration statement and exhibits thereto. For further information with respect to our company and the shares of common stock to be sold in this offering, reference is made to the registration statement, including the exhibits thereto. Copies of the registration statement, including the exhibits thereto, may be examined without charge at the public reference room of the SEC, 100 F Street, N.E., Washington, DC 20549. Information about the operation of the public reference room may be obtained by calling the SEC at 1-800-SEC-0330. Copies of all or a portion of the registration statement can be obtained from the public reference room of the SEC upon payment of prescribed fees. Our SEC filings, including the registration statement of which this prospectus forms a part, are also available to you for free on the SEC’s website at www.sec.gov. Upon consummation of this offering we will become subject to the informational and reporting requirements of the Exchange Act and will be required to file reports and other information with the SEC. You will be able to inspect and copy these reports and other information at the public reference facilities maintained by the SEC at the address noted above or obtain copies of these materials from the Public Reference Room of the SEC upon payment of prescribed fees at the address noted above or inspect them without charge at the SEC’s website. We intend to make available to our common stockholders annual reports containing consolidated financial statements audited by our independent registered public accounting firm.
183
Table of Contents
F-i
Table of Contents
F-ii
Table of Contents
F-iii
Table of Contents
Materials, Inc.
Balance Sheet at October 27, 2016 (inception)
F-1
Table of Contents
REPORT OF INDEPENDENT REGISTERED PUBLIC ACCOUNTING FIRM
To the Board of Directors and Member
Foundation Building Materials, Inc.
We have audited the accompanying balance sheet of Foundation Building Materials, Inc. (the “Company”) as of October 27, 2016. This financial statement is the responsibility of the Company’s management. Our responsibility is to express an opinion on this financial statement based on our audit.
We conducted our audit in accordance with the standards of the Public Company Accounting Oversight Board (United States). Those standards require that we plan and perform the audit to obtain reasonable assurance about whether the financial statement is free of material misstatement. The Company is not required to have, nor were we engaged to perform, an audit of its internal control over financial reporting. Our audit included consideration of internal control over financial reporting as a basis for designing audit procedures that are appropriate in the circumstances, but not for the purpose of expressing an opinion on the effectiveness of the Company’s internal control over financial reporting. Accordingly, we express no such opinion. An audit also includes examining, on a test basis, evidence supporting the amounts and disclosures in the financial statements, assessing the accounting principles used and significant estimates made by management, as well as evaluating the overall financial statement presentation. We believe that our audit provides a reasonable basis for our opinion.
In our opinion, such financial statement presents fairly, in all material respects, the financial position of Foundation Building Materials, Inc. as of October 27, 2016, in conformity with accounting principles generally accepted in the United States of America.
/s/ Deloitte & Touche LLP
Costa Mesa, CA
November 4, 2016
(except for the second paragraph of Note 3, as to which the date is February 3, 2017)
F-2
Table of Contents
FOUNDATION BUILDING MATERIALS, INC.
Balance Sheet
At October 27, 2016 (inception)
| October 27, 2016 |
||||
| USD | ||||
| Assets |
||||
| Total assets |
$ | — | ||
|
|
|
|||
| Shareholder’s equity |
||||
| Common shares, $0.001 par value—190,000,000 shares authorized and 29,974,239 shares issued and outstanding |
$ | 30 | ||
| Additional paid in capital |
970 | |||
| Due from shareholder |
(1,000 | ) | ||
|
|
|
|||
| Total shareholder’s equity |
$ | — | ||
|
|
|
|||
The accompanying notes are an integral part of this balance sheet.
F-3
Table of Contents
FOUNDATION BUILDING MATERIALS, INC.
Notes to Balance Sheet
As of October 27, 2016 (inception)
1. Organization and Nature of the Business
Foundation Building Materials, Inc. (the “Company”) was formed on October 27, 2016 (inception). The initial stockholder of the Company is LSF9 Cypress Parent 2, LLC, (“Parent”) which holds all of the common shares authorized, issued and outstanding.
2. Summary of Significant Accounting Policies
Basis of Presentation
The accompanying statement of financial position is prepared in accordance with generally accepted accounting principles in the United States of America (“GAAP”). The preparation of the financial statements in conformity with GAAP requires management to make estimates or assumptions that affect the reported amounts and disclosures in the financial statements. Actual future results could differ from these estimates and assumptions. Separate statements of operations, changes in stockholder’s equity and cash flows have not been presented as there have been no activities for this entity. The Company’s year end is December 31.
On the date of incorporation, the sole shareholder, Parent, acquired 1,000 common shares of the Company’s authorized common shares for a consideration of $1.00 per share, or total consideration of $1,000. The amount of the subscription value in excess of the par value has been recorded as additional paid in capital.
The Company has recorded a note receivable from Parent company for the contracted subscription amount.
Offering Costs
In connection with the initial public offering (“IPO”), affiliates of the Company have or will incur legal, accounting, and related costs, which will be reimbursed by the Company upon the consummation of the IPO. Such costs will be deferred and will be recorded as a reduction of proceeds of the IPO or as an offset to equity issued, or expensed if the IPO is not consummated.
Organization Costs
Organization costs are expensed as incurred. Such costs are comprised of the legal and professional fees associated with the formation of the Company.
3. Subsequent Events
Management has performed an analysis of activities and transactions subsequent to October 27, 2016 through November 4, 2016, which is the date the financial statements were issued, to determine the need for any adjustments to or disclosures within these financial statements as of October 27, 2016 and has determined that there are no subsequent events requiring disclosure.
On January 25, 2017, the Company’s board of directors authorized and the Company’s sole shareholder approved an amendment and restatement of the Company’s certificate of incorporation to increase the number of shares of common stock, par value $0.001 per share, that the Company is authorized to issue up to 190,000,000 shares. In addition, the amendment and restatement of the certificate of incorporation will authorize the Company to issue 10,000,000 shares of preferred stock, par value $0.001 per share. On January 30, 2017 the Company’s board of directors authorized a 29,974.239 to 1 stock split of its outstanding common stock. The amendment and restatement of the certificate of incorporation will become effective prior to the effective date of the registration statement and the stock split will occur immediately following the effectiveness of the amendment and restatement of the certificate of incorporation. Accordingly, all common stock amounts in this financial statement and the notes thereto have been adjusted to reflect the 29,974.239 to 1 stock split as though it had occurred as of the date presented.
F-4
Table of Contents
Holdings, LLC and
Subsidiaries
Audited Consolidated Financial Statements
as of December 31, 2015 and 2014 and for the
Periods from October 9, 2015 (“Acquisition Date”)
to December 31, 2015 (Successor) and
January 1, 2015 to October 8, 2015 (Predecessor)
and for the Year Ended December 31, 2014 (Predecessor)
F-5
Table of Contents
LSF9 CYPRESS HOLDINGS, LLC AND SUBSIDIARIES
| Page # | ||||
| Consolidated Financial Statements |
||||
| F-7 | ||||
| F-8 | ||||
| F-9 | ||||
| F-10 | ||||
| F-11 | ||||
| F-12 | ||||
F-6
Table of Contents
REPORT OF INDEPENDENT REGISTERED PUBLIC ACCOUNTING FIRM
To the Board of Directors and Member of
LSF9 Cypress Holdings, LLC
We have audited the accompanying consolidated balance sheets of LSF9 Cypress Holdings, LLC and subsidiaries (the “Company”) as of December 31, 2015 (Successor) and 2014 (Predecessor), and the related consolidated statements of operations, changes in member’s equity, and cash flows for the period from October 9, 2015 to December 31, 2015 (Successor), for the period from January 1, 2015 to October 8, 2015 (Predecessor), and for the year ended December 31, 2014 (Predecessor). These consolidated financial statements are the responsibility of the Company’s management. Our responsibility is to express an opinion on these consolidated financial statements based on our audits.
We conducted our audits in accordance with the standards of the Public Company Accounting Oversight Board (United States). Those standards require that we plan and perform the audit to obtain reasonable assurance about whether the consolidated financial statements are free of material misstatement. The Company is not required to have, nor were we engaged to perform, an audit of its internal control over financial reporting. Our audits included consideration of internal control over financial reporting as a basis for designing audit procedures that are appropriate in the circumstances, but not for the purpose of expressing an opinion on the effectiveness of the Company’s internal control over financial reporting. Accordingly, we express no such opinion. An audit also includes examining, on a test basis, evidence supporting the amounts and disclosures in the consolidated financial statements, assessing the accounting principles used and significant estimates made by management, as well as evaluating the overall financial statement presentation. We believe that our audits provide a reasonable basis for our opinion.
In our opinion, such consolidated financial statements present fairly, in all material respects, the financial position of LSF9 Cypress Holdings, LLC and subsidiaries as of December 31, 2015 (Successor) and 2014 (Predecessor), and the results of their operations and their cash flows for the period from October 9, 2015 to December 31, 2015 (Successor), for the period from January 1, 2015 to October 8, 2015 (Predecessor), and for the year ended December 31, 2014 (Predecessor), in conformity with accounting principles generally accepted in the United States of America.
/s/ Deloitte & Touche LLP
November 4, 2016
Costa Mesa, CA
F-7
Table of Contents
LSF9 CYPRESS HOLDINGS, LLC AND SUBSIDIARIES
CONSOLIDATED STATEMENTS OF OPERATIONS
($ in thousands)
| Successor | Predecessor | |||||||||||||||
| October 9, 2015 to December 31, 2015 |
January 1, 2015 to October 8, 2015 |
Year Ended December 31, 2014 |
||||||||||||||
| Net sales |
$ | 192,539 | $ | 628,066 | $ | 508,853 | ||||||||||
| Cost of goods sold (exclusive of depreciation and amortization) |
143,333 | 452,909 | 368,064 | |||||||||||||
|
|
|
|
|
|
|
|||||||||||
| Gross profit |
49,206 | 175,157 | 140,789 | |||||||||||||
| Operating expenses: |
||||||||||||||||
| Selling, general and administrative expenses |
44,196 | 131,524 | 115,462 | |||||||||||||
| Depreciation and amortization |
7,170 | 15,615 | 11,729 | |||||||||||||
| Acquisition related expenses |
3,464 | 39,691 | 4,683 | |||||||||||||
|
|
|
|
|
|
|
|||||||||||
| Total operating expenses |
54,830 | 186,830 | 131,874 | |||||||||||||
|
|
|
|
|
|
|
|||||||||||
| (Loss) income from operations |
(5,624 | ) | (11,673 | ) | 8,915 | |||||||||||
| Interest expense |
(7,044 | ) | (19,090 | ) | (9,980 | ) | ||||||||||
| Other income, net |
9 | 14 | 36 | |||||||||||||
|
|
|
|
|
|
|
|||||||||||
| Loss before income taxes |
(12,659 | ) | (30,749 | ) | (1,029 | ) | ||||||||||
| Income tax (benefit) expense |
(4,733 | ) | (1,294 | ) | 812 | |||||||||||
|
|
|
|
|
|
|
|||||||||||
| Net loss |
$ | (7,926 | ) | $ | (29,455 | ) | $ | (1,841 | ) | |||||||
|
|
|
|
|
|
|
|||||||||||
| Pro forma basic and diluted loss per share (unaudited) (Note 17) |
$ | (0.26 | ) | |||||||||||||
See accompanying notes to consolidated financial statements.
F-8
Table of Contents
LSF9 CYPRESS HOLDINGS, LLC AND SUBSIDIARIES
CONSOLIDATED BALANCE SHEETS
($ in thousands)
| Successor | Predecessor | |||||||||||
| December 31, 2015 |
December 31, 2014 |
|||||||||||
| Assets |
||||||||||||
| Current assets: |
||||||||||||
| Cash and cash equivalents |
$ | 10,662 | $ | 2,216 | ||||||||
| Accounts receivables—net of allowance for doubtful accounts of 2015—$6,304 and 2014—$4,733 |
138,621 | 82,155 | ||||||||||
| Other receivables |
24,673 | 10,948 | ||||||||||
| Inventories |
71,876 | 51,409 | ||||||||||
| Prepaid expenses and other current assets |
4,666 | 1,797 | ||||||||||
|
|
|
|
|
|||||||||
| Total current assets |
250,498 | 148,525 | ||||||||||
| Property and equipment, net |
66,141 | 35,171 | ||||||||||
| Intangibles assets, net |
154,458 | 45,237 | ||||||||||
| Goodwill |
289,086 | 43,762 | ||||||||||
| Other assets |
3,204 | 1,585 | ||||||||||
|
|
|
|
|
|||||||||
| Total assets |
$ | 763,387 | $ | 274,280 | ||||||||
|
|
|
|
|
|||||||||
| Liabilities and member’s equity |
||||||||||||
| Current liabilities: |
||||||||||||
| Asset-based credit facility |
$ | 70,000 | $ | — | ||||||||
| Accounts payable |
59,193 | 35,907 | ||||||||||
| Accrued payroll and employee benefits |
10,942 | 6,047 | ||||||||||
| Accrued taxes |
5,765 | 3,145 | ||||||||||
| Other current liabilities |
9,501 | 4,092 | ||||||||||
| Current portion of notes payable |
1,492 | 28 | ||||||||||
|
|
|
|
|
|||||||||
| Total current liabilities |
156,893 | 49,219 | ||||||||||
| Long-term portion of notes payable, net |
300,315 | 178,301 | ||||||||||
| Deferred income taxes, net |
15,310 | 848 | ||||||||||
| Other liabilities |
118 | — | ||||||||||
|
|
|
|
|
|||||||||
| Total liabilities |
472,636 | 228,368 | ||||||||||
|
|
|
|
|
|||||||||
| Commitments and contingencies (Note 11 and 14) |
||||||||||||
| Member’s paid in capital |
298,677 | 49,186 | ||||||||||
| Accumulated deficit |
(7,926 | ) | (3,274 | ) | ||||||||
|
|
|
|
|
|||||||||
| Total member’s equity |
290,751 | 45,912 | ||||||||||
|
|
|
|
|
|||||||||
| Total liabilities and member’s equity |
$ | 763,387 | $ | 274,280 | ||||||||
|
|
|
|
|
|||||||||
See accompanying notes to the consolidated financial statements.
F-9
Table of Contents
LSF9 CYPRESS HOLDINGS, LLC AND SUBSIDIARIES
CONSOLIDATED STATEMENTS OF CASH FLOWS
($ in thousands)
| Successor | Predecessor | |||||||||||
| October 9, 2015 to December 31, 2015 |
January 1, 2015 to October 8, 2015 |
Year Ended December 31, 2014 |
||||||||||
| Cash flows from operating activities: |
||||||||||||
| Net loss |
$ | (7,926 | ) | $ | (29,455 | ) | $ | (1,841 | ) | |||
| Adjustments to reconcile net loss to net cash provided by operating activities: |
||||||||||||
| Depreciation |
1,973 | 7,808 | 7,586 | |||||||||
| Amortization of intangible assets |
5,197 | 7,807 | 4,143 | |||||||||
| Amortization and write-off of debt issuance costs and debt discount |
787 | 3,078 | 411 | |||||||||
| Inventory fair value adjustment |
7,453 | 1,606 | — | |||||||||
| Bad debt expense |
483 | 1,511 | 1,610 | |||||||||
| (Gain) loss on disposal of property and equipment |
(30 | ) | 281 | 202 | ||||||||
| Paid-in-kind interest |
— | 250 | 322 | |||||||||
| Deferred income taxes |
6,521 | (1,837 | ) | 113 | ||||||||
| Change in assets and liabilities, net of effects of acquisitions: |
||||||||||||
| Accounts receivables |
11,436 | (24,859 | ) | (9,375 | ) | |||||||
| Other receivables |
(5,973 | ) | (2,806 | ) | (5,293 | ) | ||||||
| Inventories |
89 | 4,862 | (6,267 | ) | ||||||||
| Prepaid expenses and other current assets |
942 | (1,252 | ) | 787 | ||||||||
| Other assets |
10,110 | (1,019 | ) | (651 | ) | |||||||
| Accounts payable |
(13,088 | ) | 21,437 | 1,304 | ||||||||
| Accrued payroll and employee benefits |
1,753 | 9,342 | 2,486 | |||||||||
| Accrued taxes |
(1,399 | ) | 4,019 | 1,147 | ||||||||
| Other current liabilities |
(718 | ) | 18,403 | (673 | ) | |||||||
|
|
|
|
|
|
|
|||||||
| Net cash provided by (used in) operating activities |
17,610 | 19,176 | (3,989 | ) | ||||||||
| Cash flows from investing activities: |
||||||||||||
| Capital expenditures |
(2,760 | ) | (9,776 | ) | (9,205 | ) | ||||||
| Acquisition of Foundation Building Materials—net of cash acquired |
(549,307 | ) | — | — | ||||||||
| Acquisition of Great Western Building Materials—net of cash acquired |
— | (87,490 | ) | — | ||||||||
| Acquisition of Gypsum Supply Company—net of cash acquired |
(103,156 | ) | — | — | ||||||||
| Acquisition of Commercial Building Materials |
(5,100 | ) | — | — | ||||||||
| Acquisition of FBM Gypsum, LLC |
— | — | (15,225 | ) | ||||||||
| Acquisition of Central Building Materials, LLC |
— | — | (8,900 | ) | ||||||||
| Acquisition of FBM Wholesale Builders Supply, LLC |
— | — | (19,315 | ) | ||||||||
| Acquisition of FBM Wagner, LLC |
— | — | (28,191 | ) | ||||||||
| Acquisition of FBM BAV, LLC |
— | — | (21,600 | ) | ||||||||
|
|
|
|
|
|
|
|||||||
| Net cash used in investing activities |
(660,323 | ) | (97,266 | ) | (102,436 | ) | ||||||
| Cash flows from financing activities: |
||||||||||||
| Proceeds from asset-based credit facility |
80,000 | 205,915 | 75,993 | |||||||||
| Repayments of asset-based credit facility |
(10,000 | ) | (199,299 | ) | (34,892 | ) | ||||||
| Principal borrowings on long-term debt |
307,950 | 80,000 | 65,000 | |||||||||
| Principal payments on long-term debt |
— | — | (194 | ) | ||||||||
| Debt issuance costs |
(8,172 | ) | (1,165 | ) | (904 | ) | ||||||
| Other financing activities |
— | — | (856 | ) | ||||||||
| Capital contributions |
272,904 | 1,116 | 326 | |||||||||
|
|
|
|
|
|
|
|||||||
| Net cash provided by financing activities |
642,682 | 86,567 | 104,473 | |||||||||
|
|
|
|
|
|
|
|||||||
| Net (decrease) increase in cash |
(31 | ) | 8,477 | (1,952 | ) | |||||||
| Cash and cash equivalents at beginning of period |
10,693 | 2,216 | 4,168 | |||||||||
|
|
|
|
|
|
|
|||||||
| Cash and cash equivalents at end of period |
$ | 10,662 | $ | 10,693 | $ | 2,216 | ||||||
|
|
|
|
|
|
|
|||||||
| Supplemental disclosures of cash flow information |
||||||||||||
| Cash paid during the period for income taxes |
$ | 1 | $ | 257 | $ | 736 | ||||||
|
|
|
|
|
|
|
|||||||
| Cash paid during the period for interest |
$ | 6,695 | $ | 15,649 | $ | 9,978 | ||||||
|
|
|
|
|
|
|
|||||||
| Supplemental disclosures of noncash investing and financing activities |
||||||||||||
| Fair value of stock issued in acquisitions |
$ | — | $ | — | $ | 800 | ||||||
|
|
|
|
|
|
|
|||||||
See accompanying notes to the consolidated financial statements.
F-10
Table of Contents
LSF9 CYPRESS HOLDINGS, LLC AND SUBSIDIARIES
CONSOLIDATED STATEMENTS OF CHANGES IN MEMBER’S EQUITY
(in $ thousands)
| Predecessor |
Member’s Paid In Capital |
Accumulated Deficit |
Total Member’s Equity |
|||||||||
| Balance at January 1, 2014 |
$ | 48,060 | $ | (1,433 | ) | $ | 46,627 | |||||
| Capital contributions from former parent |
1,126 | — | 1,126 | |||||||||
| Net loss |
— | (1,841 | ) | (1,841 | ) | |||||||
|
|
|
|
|
|
|
|||||||
| Balance at December 31, 2014 |
$ | 49,186 | $ | (3,274 | ) | $ | 45,912 | |||||
|
|
|
|
|
|
|
|||||||
| Predecessor |
Member’s Paid In Capital |
Accumulated Deficit |
Total Member’s Equity |
|||||||||
| Balance at January 1, 2015 |
$ | 49,186 | $ | (3,274 | ) | $ | 45,912 | |||||
| Capital contributions from former parent |
1,116 | — | 1,116 | |||||||||
| Net loss |
— | (29,455 | ) | (29,455 | ) | |||||||
|
|
|
|
|
|
|
|||||||
| Balance at October 8, 2015 |
$ | 50,302 | $ | (32,729 | ) | $ | 17,573 | |||||
|
|
|
|
|
|
|
|||||||
| Successor |
Member’s Paid In Capital |
Accumulated Deficit |
Total Member’s Equity |
|||||||||
| Balance at October 9, 2015 |
$ | — | $ | — | $ | — | ||||||
| Capital contributions from current parent |
298,677 | — | 298,677 | |||||||||
| Net loss |
— | (7,926 | ) | (7,926 | ) | |||||||
|
|
|
|
|
|
|
|||||||
| Balance at December 31, 2015 |
$ | 298,677 | $ | (7,926 | ) | $ | 290,751 | |||||
|
|
|
|
|
|
|
|||||||
See accompanying notes to the consolidated financial statements.
F-11
Table of Contents
LSF9 CYPRESS HOLDINGS, LLC AND SUBSIDIARIES
NOTES TO CONSOLIDATED FINANCIAL STATEMENTS
1. Description of Company and Basis of Presentation
Description of Company
LSF9 Cypress Holdings, LLC (“Company” or “LSF9” or “Successor”) was formed on August 10, 2015, as a Delaware limited liability company and is a wholly owned direct subsidiary of LSF9 Cypress Parent, LLC (“Parent”), an affiliate of Lone Star Fund IX (U.S.), L.P. (“Lone Star”).
LSF9 acquired FBM Intermediate Holdings, LLC and its consolidated subsidiaries (“Holdings” or “Predecessor”) on October 9, 2015. LSF9 had no operations prior to the acquisition, and therefore, Holdings is the predecessor to the Company.
The Company, through its subsidiaries, is engaged in the wholesale and retail distribution of wallboard, suspended ceiling systems, metal framing and other products to commercial and residential building contractors and subcontractors. The Company has branch locations in Arizona, California, Colorado, Florida, Illinois, Indiana, Iowa, Kansas, Michigan, Missouri, Nebraska, Ohio, Pennsylvania, Tennessee, Texas and Wisconsin.
The accompanying consolidated financial statements present the balance sheet as of December 31, 2015 (Successor) and December 31, 2014 (Predecessor), and the activity of the Successor for the period from October 9, 2015 to December 31, 2015 (“Successor Period”), and the activity of the Predecessor for the period from January 1, 2015 to October 8, 2015 and the year ended December 31, 2014 (“Predecessor Periods”). Operations of the Predecessor are presented based on its historical cost basis, which is not comparable to that of the Successor.
Principles of Consolidation
The consolidated financial statements of the Successor and Predecessor include the accounts of Foundation Building Materials, LLC and its consolidated subsidiaries. All significant intercompany balances and transactions have been eliminated in the consolidation.
Basis of Presentation
The accompanying consolidated financial statements have been prepared in accordance with accounting principles generally accepted in the United States of America (GAAP).
Comprehensive Income
The Company does not have any components of other comprehensive income recorded within its consolidated financial statements and, therefore, does not separately present a statement of comprehensive income in its consolidated financial statements.
2. Summary of Significant Accounting Policies
Use of Estimates
The preparation of financial statements in conformity with GAAP requires management to make estimates and assumptions that affect the reported amounts of assets and liabilities and
F-12
Table of Contents
LSF9 CYPRESS HOLDINGS, LLC AND SUBSIDIARIES
NOTES TO CONSOLIDATED FINANCIAL STATEMENTS—(Continued)
disclosure of contingent assets and liabilities as of the date of the financial statements and the reported amounts of revenues and expenses during the period. Estimates that are more susceptible to change in the near term are the allowance for doubtful accounts, the allowance for excess and obsolete inventory, and recoverability of long-lived assets. Actual results may differ from these estimates.
Cash and Cash Equivalents
Cash includes deposits in financial institutions. The Company has its cash deposits held at major banks that at times may exceed federally insured limits. Cash and cash equivalents are defined as highly liquid investments with maturities of three months or less when purchased.
Concentration of Risk
Financial instruments, which potentially subject the Company to concentration of credit risk, consist principally of accounts receivable. The Company’s accounts receivable are primarily from customers in the building industry located in the United States. Concentration of credit risk with respect to accounts receivable is limited due to the large number of customers comprising the Company’s customer base. The Company performs credit evaluations of its customers; however, the Company’s policy is not to require collateral. At December 31, 2015, the Company had no significant concentrations of credit risk.
Liquidity and Credit Risk
The primary sources of liquidity and capital resources are cash provided from operating activities and other borrowings. The primary requirements for liquidity and capital are to operate and fund current activities. The Company believes that cash and expected cash flow from operations are adequate to fund debt service requirements, operating lease obligations, capital expenditures and working capital obligations for the next twelve months.
Accounts Receivable
The Company sells to customers using credit terms customary in its industry. Accounts receivables are recorded at invoiced amounts and generally do not bear interest. The allowance for doubtful accounts reflects the Company’s estimate of credit exposure, determined principally on the basis of its collection experience, aging of its receivables and significant individual account credit risk.
Other Receivables
Other receivables primarily consist of vendor rebates receivables. The Company receives rebates from certain vendors based on the volume of inventory purchases. Throughout the year, the amount of rebates receivable for the periodic programs are estimated based upon the expected level of purchases. Vendor rebates are accrued at the time the inventory is received. The Company accounts for these rebates as a reduction of inventory until the period in which the product is sold, at which time the reduced costs are included in cost of goods sold. The Company continually revises these estimates to reflect actual rebates earned.
F-13
Table of Contents
LSF9 CYPRESS HOLDINGS, LLC AND SUBSIDIARIES
NOTES TO CONSOLIDATED FINANCIAL STATEMENTS—(Continued)
Inventories
Inventories, consisting substantially of finished goods, are valued at the lower of cost or market (net realizable value). Cost is determined using the moving weighted-average cost method. The Company routinely evaluates inventory for excess or obsolescence and considers factors such as historical usage rates and present demand.
Property and Equipment
All assets, including property and equipment, were recorded at fair value as of October 9, 2015. Property and equipment acquired outside of business combinations are stated at cost less accumulated depreciation during both the Successor and Predecessor periods. Major additions and improvements are capitalized and depreciated; maintenance and repairs are charged to expense when incurred. Assets held for sale are not depreciated. Upon disposition, the related cost and accumulated depreciation are removed from the accounts and any resulting gain or loss is recognized in selling, general, and administrative expense. Depreciation and amortization are computed using the straight-line method over the following estimated useful lives:
| Buildings | 5 to 39 years | |
| Vehicles and equipment | 5 to 10 years | |
| Computers | 3 to 5 years | |
| Furniture and fixtures | 7 years | |
| Machinery and Equipment | 3 to 10 years | |
| Leasehold improvements | Lesser of useful life or lease term |
Impairment of Long-Lived Assets
The Company reviews property and equipment for impairment when events or circumstances indicate these assets may not be recoverable. Factors considered include significant underperformance relative to expected historical or projected future operating results, significant changes in the manner of use of the acquired assets or the strategy for the overall business and significant negative industry or economic trends. In performing the review for recoverability, future cash flows expected to result from the use of the asset and its eventual disposition are estimated. If the sum of expected future undiscounted cash flows is less than the carrying amount of the asset, an impairment loss is recorded under the discounted cash flow method. As of December 31, 2015, there were no impairments.
The Company assesses impairment of long-lived assets at the lowest level for which identifiable cash flows are largely independent of the cash flows of other assets and liabilities.
Goodwill and Intangible Assets
Intangible assets consisted of tradenames, customer relationships, non-compete agreements and favorable and unfavorable leases, and are amortized using the straight-line method, which reflects the pattern in which the economic benefits of the assets are expected to be consumed. Intangible assets with definite lives are amortized over their respective estimated useful lives.
F-14
Table of Contents
LSF9 CYPRESS HOLDINGS, LLC AND SUBSIDIARIES
NOTES TO CONSOLIDATED FINANCIAL STATEMENTS—(Continued)
The following table summarizes the life of the intangible assets acquired:
| Trade names | 1 to 5 years | |
| Customer relationships | 5 to 6 years | |
| Other intangible assets | 1 to 13 years |
The Company reviews intangible assets with finite lives for impairment when events or circumstances indicate these assets may not be recoverable. In performing the review for recoverability, future cash flows expected to result from the use of the asset are estimated. If the sum of expected future undiscounted cash flows is less than the carrying amount of the asset, an impairment loss is recorded for the amount by which the carrying amount exceeds the estimated fair value.
Goodwill represents the excess of purchase price over the fair value of assets acquired and liabilities assumed in a business combination.
The Company performs an annual impairment test or more frequently if impairment indicators arise. Such review entails comparing the carrying value to the fair value. Impairment is determined utilizing a two-step process. This process involves comparing the fair value to the carrying value of the reporting unit. If the carrying value of the net assets assigned to the reporting unit exceeds the fair value of the reporting unit, then the Company must determine the implied fair value of the reporting unit’s goodwill and compare it to the carrying value of the reporting unit’s goodwill. The Company determines the fair value of its reporting units using combinations of both the income and market valuation approaches. No impairment was recorded during the Successor Period or Predecessor Periods.
Debt Issuance Costs
During 2015, the Company elected early adoption of Accounting Standards Update (ASU) 2015-03, Interest—Imputation of Interest (Subtopic 835-30), Simplifying the Presentation of Debt Issuance Costs, including retroactively applying the guidance to December 31, 2014. The guidance simplifies the presentation of debt issuance costs by requiring debt issuance costs to be presented as a deduction from the corresponding liability, consistent with debt discounts. The reclassification resulted in a decrease to other assets and long-term debt of $1.25 million in the Consolidated Balance Sheet as of December 31, 2014. The recognition and measurement guidance for debt issuance costs is not affected. Therefore, these costs will continue to be amortized as interest expense over the term of the corresponding debt issuance.
In August 2015, the FASB issued ASU 2015-15, Interest—Imputation of Interest (Subtopic 835-30): Presentation and Subsequent Measurement of Debt Issuance Costs Associated with Line-of-Credit Arrangements—Amendments to SEC Paragraphs Pursuant to Staff Announcement at June 18, 2015 EITF Meeting (SEC Update), or ASU 2015-15. ASU 2015-15 clarifies that companies may continue to present unamortized debt issuance costs associated with line of credit arrangements as an asset. Prior to the issuance of ASU 2015-15, the Company’s consolidated financial statements reflected this presentation and therefore, the adoption of ASU 2015-15 did not impact the Company’s consolidated financial statements.
F-15
Table of Contents
LSF9 CYPRESS HOLDINGS, LLC AND SUBSIDIARIES
NOTES TO CONSOLIDATED FINANCIAL STATEMENTS—(Continued)
Revenue Recognition
The Company recognizes revenue at the point of sale or upon delivery to the customer’s site when the following four basic criteria are met:
| • | persuasive evidence of an arrangement exists; |
| • | delivery has occurred or services have been rendered; |
| • | the price to the buyer is fixed or determinable; and |
| • | collectability is reasonably assured. |
Revenue is recognized when sales transactions occur and title is passed, the related product is delivered, and includes any applicable shipping and handling costs invoiced to the customer. The expense related to such costs is included in “Selling, general and administrative” expenses in the accompanying Consolidated Statements of Operations. All revenues recognized are net of sales taxes collected. Sales taxes collected are subsequently remitted to the appropriate government authorities.
Cost of Goods Sold
Cost of goods sold includes the cost of merchandise, inbound freight, inventory provisions, vendor discounts and vendor rebates.
Operating Expenses
Operating expenses include selling, general and administrative expenses, depreciation and amortization, and acquisition related expenses. Selling, general and administrative expenses include expenses related to the delivery and warehousing of our products, as well as employee compensation and benefits expenses for employees in our branches and yard support center, as well as other administrative expenses, such as legal, accounting, and information technology costs.
Depreciation and amortization expenses include depreciation expense on our property and equipment as well as amortization expense on our finite lived intangible assets.
Acquisition related expenses primarily comprise of legal, valuation, accounting and advisory costs related to the acquisitions.
Advertising
Advertising related costs are expensed as incurred. Total advertising expense was $0.4 million for October 9, 2015 to December 31, 2015 (Successor), $0.7 million for January 1, 2015 to October 8, 2015 (Predecessor), and $0.5 million for the year ended December 31, 2014 (Predecessor).
Income Taxes
The Predecessor as a limited liability company, under the provisions of the Internal Revenue Code and applicable state laws is generally not subject to taxation of income. However, included
F-16
Table of Contents
LSF9 CYPRESS HOLDINGS, LLC AND SUBSIDIARIES
NOTES TO CONSOLIDATED FINANCIAL STATEMENTS—(Continued)
in the Predecessor consolidated financial statements is Home Acres Holdings, LLC, a wholly-owned subsidiary of the Company, which made an entity classification election to be taxed as a C-corporation. The Successor has made an entity classification election to be taxed as a C-Corporation and under the provisions of the Internal Revenue Code and applicable state laws is subject to taxation of income. However, in the Successor consolidated financial statements Home Acres Holdings, LLC made an entity classification election as of October 9, 2015 to be disregarded as a separate entity and under the provisions of the Internal Revenue Code and applicable state laws is generally not subject to taxation.
The Company accounts for income taxes in accordance with ASC Topic 740, Accounting for Income Taxes. Under ASC Topic 740, income taxes are accounted for based upon the future tax consequences attributable to differences between the financial statement carrying amounts of existing assets and liabilities and their respective tax basis and operating loss and tax credit carry forwards. Deferred tax expense (benefit) results from the net change in deferred tax assets and liabilities during the year.
ASC Topic 740 prescribes a recognition threshold and measurement attribute for the financial statement recognition and measurement of a tax position taken or expected to be taken in a tax return. Based on this guidance, the Company analyzes its filing positions, as well as all open tax years in relevant jurisdictions. Tax benefits from uncertain tax positions are recognized if it is more likely than not that the position is sustainable based solely on its technical merits. The Company has no material uncertain tax positions to report at December 31, 2015 or 2014.
The Company recognizes interest related to income tax matters as interest expense and penalties related to income tax matters as other expense. The Company did not have any amounts accrued or expensed for interest and penalties as of December 31, 2015 (Successor) and December 31, 2014 (Predecessor), and for the periods from October 9, 2015 to December 31, 2015 (Successor), and January 1, 2015 to October 8, 2015 and the year ended December 31, 2014 (Predecessor Periods).
Fair Value of Financial Instruments
Fair value is defined as the price that would be received to sell an asset or price paid to transfer a liability in an orderly transaction between market participants at the measurement date. Authoritative guidance for fair value measurements establishes a hierarchy that prioritizes the inputs to valuation models based upon the degree to which they are observable. The three levels of the fair value measurement hierarchy are as follows:
Level 1: Inputs represent quoted prices in active markets for identical assets or liabilities at the measurement date.
Level 2: Inputs (other than quoted prices included in Level 1) that are either directly or indirectly observable for the asset or liability through correlation with market data at the measurement date for the duration of the instrument’s anticipated life.
Level 3: Inputs are unobservable and therefore reflect management’s best estimate of the assumptions that market participants would use in pricing the asset or liability.
F-17
Table of Contents
LSF9 CYPRESS HOLDINGS, LLC AND SUBSIDIARIES
NOTES TO CONSOLIDATED FINANCIAL STATEMENTS—(Continued)
The Company estimates the fair value of its assets and liabilities, which qualify as financial instruments, and includes this additional information in the notes to the consolidated financial statements when the fair value is different from the carrying value of these instruments.
Reclassification
For the period ended December 31, 2015, the Company changed the manner in which it presents certain expenses related to the delivery and warehousing of its products in order to conform financial statement presentation to its industry peer group for comparability. These costs include warehousing and delivery costs, depreciation expense, payroll, and other costs directly attributable to the delivery of products to customers. In accordance with ACS 605, the classification of shipping and handling costs on the consolidated statement of operations is an accounting policy decision. The previous accounting classification recorded these amounts in cost of goods sold within the consolidated statement of operations. The new accounting classification moves these amounts to selling, general, and administrative expenses, with separate presentation of depreciation and amortization expense.
Accordingly, the respective balances for all periods presented in these consolidated financial statements were reclassified in order to be consistent and comparable. The new account classification, as well as the reclassification for prior periods, had no effect on the consolidated balance sheets, statements of cash flows, or the statements of changes in member’s equity. Additionally, the reclassification did not impact (loss) income from operations or net loss. The details of the reclassification in the consolidated statements of operations for the period ended December 31, 2015 are included below:
| ($ in thousands) | Successor October 9, 2015 to December 31, 2015 |
|||||||||||
| Impact to Consolidated Statement of Operations |
As previously reported |
Reclassification | As reclassified | |||||||||
| Cost of goods sold |
$ | 170,092 | $ | (26,759 | ) | $ | 143,333 | |||||
| Gross profit |
$ | 22,447 | $ | 26,759 | $ | 49,206 | ||||||
| Selling, general and administrative expenses |
$ | 24,607 | $ | 19,589 | $ | 44,196 | ||||||
| Depreciation and amortization |
$ | — | $ | 7,170 | $ | 7,170 | ||||||
The details of the reclassification in the statements of operations for the period ended October 8, 2015 are included below:
| ($ in thousands) | Predecessor January 1, 2015 to October 8, 2015 |
|||||||||||
| Impact to Consolidated Statement of Operations |
As previously reported |
Reclassification | As reclassified | |||||||||
| Cost of goods sold |
$ | 535,237 | $ | (82,328 | ) | $ | 452,909 | |||||
| Gross profit |
$ | 92,829 | $ | 82,328 | $ | 175,157 | ||||||
| Selling, general and administrative expenses |
$ | 64,811 | $ | 66,713 | $ | 131,524 | ||||||
| Depreciation and amortization |
$ | — | $ | 15,615 | $ | 15,615 | ||||||
F-18
Table of Contents
LSF9 CYPRESS HOLDINGS, LLC AND SUBSIDIARIES
NOTES TO CONSOLIDATED FINANCIAL STATEMENTS—(Continued)
The details of the reclassification in the statements of operations for the year ended December 31, 2014 are included below:
| ($ in thousands) | Predecessor December 31, 2014 |
|||||||||||
| Impact to Consolidated Statement of Operations |
As previously reported |
Reclassification | As reclassified | |||||||||
| Cost of goods sold |
$ | 430,860 | $ | (62,796 | ) | $ | 368,064 | |||||
| Gross profit |
$ | 77,993 | $ | 62,796 | $ | 140,789 | ||||||
| Selling, general and administrative expenses |
$ | 64,395 | $ | 51,067 | $ | 115,462 | ||||||
| Depreciation and amortization |
$ | — | $ | 11,729 | $ | 11,729 | ||||||
Recently Adopted Accounting Standards
In November 2015, the FASB issued ASU 2015-17, Income Taxes (Topic 740): Balance Sheet Classifications of Deferred Taxes. Companies are required to classify all deferred tax assets and liabilities as noncurrent on the balance sheet instead of separating deferred taxes into current and noncurrent amounts. Also, companies will no longer allocate valuation allowances between current and noncurrent deferred tax assets because those allowances also will be classified as noncurrent. The guidance is effective for financial statements issued for annual periods beginning after December 15, 2016, and interim periods within those annual periods. Companies can adopt the guidance either prospectively or retrospectively. The Company early adopted ASU 2015-17 and applied the new guidance for all periods presented.
Recently Issued Accounting Standards
In May 2014, the FASB issued ASU 2014-09, Revenue from Contracts with Customers (Topic 606), or ASU 2014-09. ASU 2014-09 amends the guidance for revenue recognition to replace numerous, industry-specific requirements. The core principle of the ASU is that an entity should recognize revenue for the transfer of goods or services equal to the amount that it expects to be entitled to receive for those goods or services. The ASU implements a five-step process for customer contract revenue recognition that focuses on transfer of control, as opposed to transfer of risk and rewards. The amendment also requires enhanced disclosures regarding the nature, amount, timing and uncertainty of revenues and cash flows arising from contracts with customers. Additional ASUs have been issued to amend or clarify the ASU as follows:
| • | ASU No. 2016-12 Revenue from Contracts with Customers (Topic 606): Narrow-Scope Improvements and Practical Expedients was issued in May 2016. ASU No. 2016-12 amends the new revenue recognition standard to clarify the guidance on assessing collectability, presenting sales taxes, measuring noncash consideration, and certain transition matters. |
| • | ASU No. 2016-10 Revenue from Contracts with Customers (Topic 606): Identifying Performance Obligations and Licensing was issued in April 2016. ASU No. 2016-10 addresses implementation issues identified by the FASB-International Accounting Standards Board Joint Transition Resource Group for Revenue Recognition (TRG). |
| • | ASU No. 2016-08 Revenue from Contracts with Customers (Topic 606): Principal versus Agent Considerations (Reporting Revenue Gross versus Net) was issued in March 2016. ASU No. 2016-08 requires an entity to determine whether the nature of its promise to provide goods or services to a customer is performed in a principal or agent capacity |
F-19
Table of Contents
LSF9 CYPRESS HOLDINGS, LLC AND SUBSIDIARIES
NOTES TO CONSOLIDATED FINANCIAL STATEMENTS—(Continued)
| and to recognize revenue in a gross or net manner based on its principal/agent designation. |
The guidance in these ASUs is effective for annual reporting periods beginning after December 15, 2017, including interim periods within that reporting period, and early adoption is permitted for interim and annual periods beginning after December 15, 2016. The Company is currently evaluating the impact of adopting ASU 2014-09, 2016-12, 2016-10 and 2016-08.
In August 2014, the FASB issued ASU 2014-15, Presentation of Financial Statements—Going Concern (Subtopic 205-40): Disclosures of Uncertainties about an Entity’s Ability to Continue as a Going Concern, or ASU 2014-15. ASU 2014-15 requires management to evaluate whether there are conditions or events that raise substantial doubt about the entity’s ability to continue as a going concern within one year after the date that the financial statements are issued or are available to be issued. This ASU also requires management to disclose certain information depending on the results of the going concern evaluation. The provisions of this ASU are effective for annual periods ending after December 15, 2016, including interim reporting periods thereafter. The Company is currently evaluating the impact of this accounting guidance and does not expect any material impact on its consolidated financial statements.
In July 2015, the FASB issued ASU 2015-11, Simplifying the Measurement of Inventory, or ASU 2015-11, which applies to inventory valued at first-in, first-out (FIFO) or average cost. ASU 2015-11 requires inventory to be measured at the lower of cost and net realizable value, rather than at the lower of cost or market. ASU 2015-11 is effective on a prospective basis for annual periods beginning after December 15, 2016, and interim periods within those fiscal years. The Company reports inventory on an average-cost basis and thus will be required to adopt the standard; however, the provisions of ASU 2015-11 are not expected to have a material effect on the Company’s consolidated financial condition.
In September 2015, the FASB issued ASU 2015-16, Business Combinations (Topic 805): Simplifying the Accounting for Measurement-Period Adjustments, or ASU 2015-16. ASU 2015-16 eliminates the requirement to restate prior period financial statements for measurement period adjustments. The new guidance requires that the cumulative impact of a measurement period adjustment (including the impact on prior periods) be recognized in the reporting period in which the adjustment is identified. In addition, separate presentation on the face of the income statement or disclosure in the notes is required regarding the portion of the adjustment recorded in the current period earnings, by line item, which would have been recorded in previous reporting periods if the adjustment to the provisional amounts had been recognized as of the acquisition date. ASU 2015-16 is to be applied prospectively for measurement period adjustments that occur after the effective date. ASU 2015-16 is effective for annual reporting periods beginning after December 15, 2015, including interim periods within those fiscal years. Early adoption is permitted and the Company intends to adopt in fiscal year 2016. Since it is prospective, the impact of ASU 2015-16 on the Company’s consolidated financial statements will depend upon the nature of any measurement period adjustments identified in future periods.
In February 2016, the FASB issued ASU 2016-02, Leases (Topic 842), or ASU 2016-02. ASU 2016-02 establishes a right-of-use model that requires a lessee to record a right-of-use asset and a lease liability on the balance sheet for all leases with terms longer than twelve months. Leases
F-20
Table of Contents
LSF9 CYPRESS HOLDINGS, LLC AND SUBSIDIARIES
NOTES TO CONSOLIDATED FINANCIAL STATEMENTS—(Continued)
will be classified as either “finance” or “operating,” with classification affecting the pattern of expense recognition in the income statement. This update requires a modified retrospective transition as of the beginning of the earliest comparative period presented in the financial statements. This update is effective for fiscal years beginning after December 15, 2018, and interim periods within those fiscal years. Early adoption is permitted. The Company is currently evaluating the impact of this guidance on its consolidated financial statements.
In August 2016, the FASB issued ASU 2016-15, Statement of Cash Flows (Topic 230): Classification of Certain Cash Receipts and Cash Payments. ASU 2016-15 amended the existing accounting standards for the statement of cash flows. The amendments provide guidance on eight classification issues related to the statement of cash flows. This update is effective for fiscal years beginning after December 15, 2017, and interim periods within those fiscal years. Early adoption is permitted. The Company is currently evaluating the impact of this guidance on its consolidated financial statements.
3. Acquisitions
The Company accounts for its acquisitions under the acquisition method, and accordingly the results of operations of the acquired entities were included in the Company’s consolidated financial statements from the acquisition dates. The purchase price was allocated to the assets acquired based on estimated fair values at the acquisition date, with the excess of purchase price over the estimated fair value of the net assets acquired recorded as goodwill. Purchase accounting adjustments associated with the intangible asset valuations have been recorded as of December 31, 2015 and 2014. The fair value of acquired intangible assets primarily related to tradenames and customer relationships and was estimated by applying an income approach. That measure is based on significant Level 3 inputs not observable in the market. Key assumptions developed based on the Company’s historical experience, future projections and comparable market data include future cash flows, long-term growth rates, royalty rates, attrition rates and discount rates.
2015 Acquisitions
Great Western Building Materials, Inc. (Predecessor)
On March 13, 2015, Holdings acquired certain assets and the operations of Great Western Building Materials (“GWBM”) for $87.5 million in cash. The GWBM acquisition consists of operations of Great Western Building Materials, Inc. and ProWall Building Products, Inc. both Arizona corporations and Oxnard Building Materials, Inc., a California corporation. With operations in California and Arizona, GWBM is a supplier of building materials to commercial and residential contractors in Arizona and California. GWBM operated as a building products distributor offering wallboard, metal framing, and other products.
Foundation Building Materials, LLC (Successor)
On October 9, 2015, the Company acquired Holdings from CI Capital Partners for an aggregate consideration of $560.0 million (the “Lone Star Acquisition”). This transaction was financed by third-party loans and equity contributions by Lone Star. The Lone Star Acquisition was accounted for as a business combination under the acquisition method of accounting. Accordingly, the assets acquired and liabilities assumed were recorded at fair value with the
F-21
Table of Contents
LSF9 CYPRESS HOLDINGS, LLC AND SUBSIDIARIES
NOTES TO CONSOLIDATED FINANCIAL STATEMENTS—(Continued)
remaining purchase price recorded as goodwill. The Company estimated the fair value of the assets acquired and liabilities assumed as part of the business combination, including working capital, property and equipment, and intangible assets. Intangible assets acquired in the Lone Star Acquisition include $15.7 million attributable to the Foundations Building Materials tradename and $113.5 million for customer relationships. The tradename was determined to have an estimated useful life of 5 years. The customer relationships are being amortized over 5.8 years.
The fair value of the tradename was estimated using an income approach, specifically known as the relief from royalty method. The relief from royalty method calculates the approximate royalty saved that is attributable to the sale of products and services using the tradename. The forecasted revenue expected to be generated under the tradename were based on the projected revenue of the Successor. The fair value of the customer relationships was determined using the excess earnings method under the income approach.
The Company recognized at fair value both favorable lease assets and unfavorable lease liabilities, representing the difference between the market rates in effect for acquired leases compared to the various lease payments on individual operating leases. These assets and liabilities are amortized to rent expense on a straight-line basis over each respective operating lease term. The weighted average amortization period for the favorable lease assets is 8.6 years, and for the unfavorable lease liabilities is 5.0 years.
Commercial Building Materials, LLC (Successor)
On December 30, 2015, the Company acquired certain assets and the operations of Commercial Building Materials, LLC (“CBM”) for $5.1 million in cash (including certain adjustments). Based in Ypsilanti, Michigan, CBM was a supplier of building materials to commercial and residential contractors throughout southeast Michigan, specifically the Detroit metropolitan area and Northeast Ohio, specializing in interior products such as wallboard, suspended ceiling systems, metal framing, and other products.
Gypsum Supply, LLC (Successor)
On December 30, 2015, the Company acquired certain assets and the operations of Gypsum Supply Company (“GSC”) for $103.2 million in cash (including certain adjustments). Based in Rockford, Illinois, GSC was a supplier of building materials to commercial and residential contractors throughout the Midwest supplying wallboard, suspended ceiling systems, metal framing, and other products.
F-22
Table of Contents
LSF9 CYPRESS HOLDINGS, LLC AND SUBSIDIARIES
NOTES TO CONSOLIDATED FINANCIAL STATEMENTS—(Continued)
The following table summarizes the estimated fair values of the assets acquired and liabilities assumed during 2015 as of the acquisition date ($ in thousands).
| Great Western Building Materials, Inc. |
Commercial Building Materials, LLC |
Gypsum Supply, LLC |
Foundation Building Materials, LLC |
|||||||||||||
| Assets acquired: |
||||||||||||||||
| Cash |
$ | 10 | $ | — | $ | 15 | $ | 10,693 | ||||||||
| Accounts receivables |
29,843 | 1,415 | 18,593 | 149,230 | ||||||||||||
| Inventories |
13,544 | 1,000 | 11,036 | 67,381 | ||||||||||||
| Prepaid expenses and other current assets |
245 | — | 1,020 | 6,526 | ||||||||||||
| Property and equipment |
5,200 | 998 | 20,948 | 44,235 | ||||||||||||
| Goodwill |
32,854 | 931 | 31,870 | 256,020 | ||||||||||||
| Intangible assets |
34,180 | 1,380 | 26,320 | 129,200 | ||||||||||||
| Leases under market rent |
— | — | — | 2,755 | ||||||||||||
| Other assets |
— | — | 23 | 2,231 | ||||||||||||
|
|
|
|
|
|
|
|
|
|||||||||
| Total assets acquired |
$ | 115,876 | $ | 5,724 | $ | 109,825 | $ | 668,271 | ||||||||
|
|
|
|
|
|
|
|
|
|||||||||
| Liabilities assumed: |
||||||||||||||||
| Accounts payable |
(8,889 | ) | (610 | ) | (5,438 | ) | (66,232 | ) | ||||||||
| Accrued expenses and other current liabilities |
(19,487 | ) | (14 | ) | (1,216 | ) | (42,039 | ) | ||||||||
|
|
|
|
|
|
|
|
|
|||||||||
| Total liabilities assumed |
(28,376 | ) | (624 | ) | (6,654 | ) | (108,271 | ) | ||||||||
|
|
|
|
|
|
|
|
|
|||||||||
| Total net assets acquired |
$ | 87,500 | $ | 5,100 | $ | 103,171 | $ | 560,000 | ||||||||
|
|
|
|
|
|
|
|
|
|||||||||
2014 Acquisitions (Predecessor)
Gypsum Supply, Ltd.
On January 31, 2014, Holdings acquired certain assets and operations of Gypsum Supply, Ltd (“Gypsum Supply”). for total consideration of $15.6 million. Consideration for the acquisition included cash and certain equity interests in the Predecessor. With operations in Texas, Gypsum Supply, Ltd. was a supplier of building materials to commercial and residential contractors.
Central Building Materials, LLC
On May 1, 2014, Holdings acquired certain assets and operations of Central Building Materials, LLC (“Central Building Materials”) for total cash and equity consideration of $9.0 million. Consideration for the acquisition included cash and certain equity interests in the Predecessor. With operations in Texas, Central Building Materials, LLC was a supplier of building materials to commercial and residential contractors.
Wholesale Builders Supply, LLC
On May 30, 2014, Holdings acquired certain assets and operations of Wholesale Builders Supply, Inc. (“Wholesale Builders Supply”) for total cash and equity consideration of $21.3 million (net of $2.2 million holdback). Consideration for the acquisition included cash and certain equity interests in the Predecessor. Included within the agreement was a holdback amount of $2.2 million to provide for the satisfaction of any liability of the seller and was
F-23
Table of Contents
LSF9 CYPRESS HOLDINGS, LLC AND SUBSIDIARIES
NOTES TO CONSOLIDATED FINANCIAL STATEMENTS—(Continued)
included in other current liabilities in the consolidated balance sheet at December 31, 2014. With operations in Ohio and Pennsylvania, Wholesale Building Supply, LLC is a supplier of building materials to commercial and residential contractors.
Wagner Distribution Holding Company, Inc.
On May 30, 2014, Holdings acquired certain assets and operations of Wagner Distribution Holding Company, Inc. (“Wagner Distribution”) for total cash consideration of $29.2 million (net of holdback). Included within agreement was a holdback amount for $1.0 million to provide for the satisfaction of any liability of the seller of which $0.5 million remained and was included in other current liabilities in the consolidated balance sheet at December 31, 2014. With operations in Colorado, Kansas, Missouri and Nebraska, Wagner Distribution Holding Company, Inc., was a supplier of building materials to commercial and residential contractors.
BAV, Inc.
On December 5, 2014, Holdings acquired substantially all business assets of BAV, Inc. (“BAV”) for total cash consideration of $21.2 million. With operations in Texas, BAV was a supplier of building materials to commercial and residential contractors.
The following table summarizes the estimated fair values of the assets acquired and liabilities assumed during 2014 as of the acquisition date based on the purchase price ($ in thousands).
| Gypsum Supply | Central Building Materials |
Wholesale Builders Supply |
Wagner Distribution |
BAV | ||||||||||||||||
| Assets acquired: |
||||||||||||||||||||
| Accounts receivables |
$ | 4,525 | $ | 6,958 | $ | 6,560 | $ | 13,279 | $ | 3,705 | ||||||||||
| Inventories |
1,750 | 850 | 4,551 | 7,868 | 2,407 | |||||||||||||||
| Prepaid expenses and other current assets |
122 | — | — | 157 | — | |||||||||||||||
| Property and equipment |
2,096 | 157 | 3,938 | 4,809 | 509 | |||||||||||||||
| Goodwill |
4,709 | 2,091 | 5,054 | 3,368 | 6,974 | |||||||||||||||
| Intangible assets |
5,029 | 1,993 | 4,511 | 4,275 | 8,927 | |||||||||||||||
|
|
|
|
|
|
|
|
|
|
|
|||||||||||
| Total assets acquired |
$ | 18,231 | $ | 12,049 | $ | 24,614 | $ | 33,756 | $ | 22,522 | ||||||||||
|
|
|
|
|
|
|
|
|
|
|
|||||||||||
| Liabilities assumed: |
||||||||||||||||||||
| Accounts payable |
(2,541 | ) | (3,071 | ) | (2,641 | ) | (4,408 | ) | (1,369 | ) | ||||||||||
| Accrued expenses and other current liabilities |
(114 | ) | (6 | ) | (638 | ) | (158 | ) | — | |||||||||||
|
|
|
|
|
|
|
|
|
|
|
|||||||||||
| Total liabilities assumed |
(2,655 | ) | (3,077 | ) | (3,279 | ) | (4,566 | ) | (1,369 | ) | ||||||||||
|
|
|
|
|
|
|
|
|
|
|
|||||||||||
| Total net assets acquired |
$ | 15,576 | $ | 8,972 | $ | 21,335 | $ | 29,190 | $ | 21,153 | ||||||||||
|
|
|
|
|
|
|
|
|
|
|
|||||||||||
The excess of purchase price over the fair value amounts assigned to the assets acquired and liabilities assumed represents the goodwill amount resulting from the 2015 and 2014 acquisitions. The goodwill attributable to the acquisitions has been recorded as a non-current asset and is not amortized, but is subject to review at least on an annual basis for impairment. The goodwill recognized was primarily attributable to expected operating efficiencies and
F-24
Table of Contents
LSF9 CYPRESS HOLDINGS, LLC AND SUBSIDIARIES
NOTES TO CONSOLIDATED FINANCIAL STATEMENTS—(Continued)
expansion opportunities in the businesses acquired. Goodwill and intangible assets recognized from the acquisitions are expected to be deductible for tax purposes. The acquisitions will be treated as an asset purchase for tax purposes.
The operating results of the acquired businesses have been included in the consolidated statements of operations from their acquisition dates through December 31, 2015. For the period from October 9, 2015 to December 31, 2015, entities acquired in the period contributed net sales of $41 million and net income of $2 million. For the period from January 1, 2015 to October 8, 2015, entities acquired in the period contributed net sales of $115 million and net income of $7 million. For the year ended December 31, 2014, entities acquired in the period contributed net sales of $153 million and net income of $8 million.
Supplemental Unaudited Pro Forma Information
In accordance with ASC 805, the following information for the years ended December 31, 2015 and 2014 presents the results of operations of the Company as if all 2015 and 2014 acquisitions occurred as of January 1, 2014. The supplemental pro forma information has been adjusted to include:
| • | the pro forma impact of additional amortization and depreciation related to the fair value of acquired tangible and intangible assets, |
| • | the pro forma impact of acquisition costs which consisted of legal, advisory, and due diligence fees and expenses, and |
| • | the pro forma tax effect of the pro forma adjustments, calculated using a statutory tax rate of 35% for the year ended December 31, 2015 and 2014. |
The Company incurred charges related to the inventory fair value adjustment and acquisition expenses of $7.5 million and $3.5 million, respectively, for the period from October 9, 2015 to December 31, 2015 and $1.6 million and $39.7 million, respectively for the period from January 1, 2015 to October 8, 2015. These expenses are reflected in pro forma earnings for the year ended December 31, 2014.
The pro forma results are presented for illustrative purposes only and are not necessarily indicative of, or intended to represent, the results that would have been achieved had the various acquisitions been completed on the dates indicated. For example, the pro forma results do not reflect any operating efficiencies and associated cost savings that the Company might have achieved with respect to the acquisitions.
| Pro Forma | ||||||||
| Year Ended December 31, 2015 |
Year Ended December 31, 2014 |
|||||||
| (unaudited, $ in thousands) | ||||||||
| Net Sales |
$ | 972,841 | $ | 884,706 | ||||
| Net (Loss) |
$ | (22,469 | ) | $ | (49,862 | ) | ||
F-25
Table of Contents
LSF9 CYPRESS HOLDINGS, LLC AND SUBSIDIARIES
NOTES TO CONSOLIDATED FINANCIAL STATEMENTS—(Continued)
4. Accounts receivables—net of allowance for doubtful accounts
Accounts receivables consisted of the following ($ in thousands):
| Successor | Predecessor | |||||||||||||||
| December 31, 2015 |
December 31, 2014 |
|||||||||||||||
| Trade receivables |
$ | 144,705 | $ | 85,569 | ||||||||||||
| Other receivables |
220 | 1,319 | ||||||||||||||
|
|
|
|
|
|||||||||||||
| Total receivables |
$ | 144,925 | $ | 86,888 | ||||||||||||
| Less: Allowance for doubtful accounts |
(6,304 | ) | (4,733 | ) | ||||||||||||
|
|
|
|
|
|||||||||||||
| Accounts receivables, net |
$ | 138,621 | $ | 82,155 | ||||||||||||
|
|
|
|
|
|||||||||||||
The Company records provisions for doubtful accounts in selling, general and administrative expenses in the consolidated statements of operations. The table below summarizes the Company’s allowance for doubtful accounts for the Predecessor and Successor periods presented in the consolidated financial statements ($ in thousands):
| Predecessor |
Allowance for doubtful accounts |
|||
| Balance at January 1, 2014 |
$ | (2,902 | ) | |
| Provisions for doubtful accounts |
(1,610 | ) | ||
| Write-offs and adjustments |
(221 | ) | ||
|
|
|
|||
| Balance at December 31, 2014 |
(4,733 | ) | ||
|
|
|
|||
| Provisions for doubtful accounts |
(1,511 | ) | ||
| Write-offs and adjustments |
726 | |||
|
|
|
|||
| Balance at October 8, 2015 |
$ | (5,518 | ) | |
|
|
|
|||
| Successor |
Allowance for doubtful accounts |
|||
| Balance at October 9, 2015 |
$ | (5,518 | ) | |
| Provisions for doubtful accounts |
(483 | ) | ||
| Write-offs and adjustments |
(303 | ) | ||
|
|
|
|||
| Balance at December 31, 2015 |
$ | (6,304 | ) | |
|
|
|
|||
F-26
Table of Contents
LSF9 CYPRESS HOLDINGS, LLC AND SUBSIDIARIES
NOTES TO CONSOLIDATED FINANCIAL STATEMENTS—(Continued)
5. Goodwill and Intangible Assets
Identifiable intangible assets that are separable and have determinable useful lives are valued separately and amortized over their benefit period. The following is the gross carrying value and accumulated amortization of the Company’s identifiable intangible assets as of December 31, 2015 (Successor) and December 31, 2014 (Predecessor) ($ in thousands):
| Successor | Predecessor | |||||||||||||||||||||||||||
| December 31, 2015 | December 31, 2014 | |||||||||||||||||||||||||||
| Gross Carrying Amount |
Accumulated Amortization |
Net Carrying Amount |
Gross Carrying Amount |
Accumulated Amortization |
Net Carrying Amount |
|||||||||||||||||||||||
| Trade names |
$ | 15,980 | $ | (724 | ) | $ | 15,256 | $ | 9,169 | $ | (2,087 | ) | $ | 7,082 | ||||||||||||||
| Customer relationships |
140,920 | (4,378 | ) | 136,542 | 39,070 | (2,187 | ) | 36,883 | ||||||||||||||||||||
| Other intangible assets |
2,755 | (95 | ) | 2,660 | 1,616 | (344 | ) | 1,272 | ||||||||||||||||||||
|
|
|
|
|
|
|
|
|
|
|
|
|
|||||||||||||||||
| $ | 159,655 | $ | (5,197 | ) | $ | 154,458 | $ | 49,855 | $ | (4,618 | ) | $ | 45,237 | |||||||||||||||
|
|
|
|
|
|
|
|
|
|
|
|
|
|||||||||||||||||
The weighted average amortization period of these intangible assets in the aggregate is 5.4 years. Total amortization expense of intangible assets above was $5.2 million for October 9, 2015 to December 31, 2015 (Successor), $7.8 million for January 1, 2015 to October 8, 2015 (Predecessor), and $4.1 million for the year ended December 31, 2014 (Predecessor), respectively.
Future amortization for the next five fiscal years and thereafter is as follows (in thousands):
| Years Ending December 31, |
||||
| 2016 |
$ | 28,368 | ||
| 2017 |
28,148 | |||
| 2018 |
28,148 | |||
| 2019 |
28,117 | |||
| 2020 |
27,391 | |||
| Thereafter |
14,286 | |||
|
|
|
|||
| $ | 154,458 | |||
|
|
|
|||
Goodwill at December 31, 2015 and 2014, consisted of the following (in thousands):
| Carrying Value | ||||
| Balance at January 1, 2014 (Predecessor) |
$ | 21,566 | ||
| Goodwill acquired |
22,196 | |||
|
|
|
|||
| Balance at December 31, 2014 |
43,762 | |||
| Goodwill acquired |
32,854 | |||
|
|
|
|||
| Balance at October 8, 2015 (Predecessor) |
$ | 76,616 | ||
|
|
|
|||
| Carrying Value | ||||
| Balance at October 9, 2015 (Successor) |
$ | — | ||
| Goodwill acquired |
289,086 | |||
|
|
|
|||
| Balance at December 31, 2015 (Successor) |
$ | 289,086 | ||
|
|
|
|||
F-27
Table of Contents
LSF9 CYPRESS HOLDINGS, LLC AND SUBSIDIARIES
NOTES TO CONSOLIDATED FINANCIAL STATEMENTS—(Continued)
6. Income Taxes
The following table shows the (benefit) / expense for income taxes ($ in thousands):
| Successor | Predecessor | |||||||||||||||||||
| October 9, 2015 to December 31, 2015 |
January 1, 2015 to October 8, 2015 |
Year Ended December 31, 2014 |
||||||||||||||||||
| Current: |
||||||||||||||||||||
| Federal |
$ | — | $ | 4 | $ | — | ||||||||||||||
| State |
106 | 539 | 699 | |||||||||||||||||
|
|
|
|
|
|
|
|||||||||||||||
| 106 | 543 | 699 | ||||||||||||||||||
|
|
|
|
|
|
|
|||||||||||||||
| Deferred: |
||||||||||||||||||||
| Federal |
(3,824 | ) | (1,585 | ) | 113 | |||||||||||||||
| State |
(1,015 | ) | (252 | ) | — | |||||||||||||||
|
|
|
|
|
|
|
|||||||||||||||
| (4,839 | ) | (1,837 | ) | 113 | ||||||||||||||||
|
|
|
|
|
|
|
|||||||||||||||
| Income tax (benefit) / expense |
$ | (4,733 | ) | $ | (1,294 | ) | $ | 812 | ||||||||||||
|
|
|
|
|
|
|
|||||||||||||||
The differences between income taxes expected at the U.S. federal statutory rate of 35 percent and the reported income tax (benefit) / expense are summarized as follows ($ in thousands):
| Successor | Predecessor | |||||||||||||||||||
| October 9, 2015 to December 31, 2015 |
January 1, 2015 to October 8, 2015 |
Year Ended December 31, 2014 |
||||||||||||||||||
| Tax computed at federal statutory rate |
$ | (4,430 | ) | $ | (10,762 | ) | $ | (350 | ) | |||||||||||
| State income tax, net of federal benefit |
(669 | ) | (164 | ) | 311 | |||||||||||||||
| Permanent items |
96 | 75 | 3 | |||||||||||||||||
| Transaction cost |
116 | — | — | |||||||||||||||||
| Payable RTP |
69 | 543 | 346 | |||||||||||||||||
| Non-taxable partnership income |
— | 8,989 | 474 | |||||||||||||||||
| Rate Change |
— | 28 | 38 | |||||||||||||||||
| Other |
85 | (3 | ) | (10 | ) | |||||||||||||||
|
|
|
|
|
|
|
|||||||||||||||
| Income tax (benefit) expense |
$ | (4,733 | ) | $ | (1,294 | ) | $ | 812 | ||||||||||||
|
|
|
|
|
|
|
|||||||||||||||
F-28
Table of Contents
LSF9 CYPRESS HOLDINGS, LLC AND SUBSIDIARIES
NOTES TO CONSOLIDATED FINANCIAL STATEMENTS—(Continued)
Deferred income taxes reflect the net tax effects of temporary differences between the carrying amounts of assets and liabilities for financial reporting purposes and the amounts used for income tax purposes. On November 20, 2015, the FASB issued ASU No 2015-17, Income Taxes (Topic 740): Balance Sheet Classification of Deferred Taxes which requires all deferred tax assets and liabilities to be classified as noncurrent on the balance sheet. The new accounting guidance is effective for annual reporting periods beginning after December 15, 2016. The Company opted to early adopt this ASU on a retrospective basis and applied this amendment to its deferred tax liabilities in its consolidated balance sheets as of December 31, 2015 and 2014. Significant components of the Company’s net deferred tax assets and liabilities as of December 31, 2015 (Successor) and December 31, 2014 (Predecessor) are composed of the following ($ in thousands):
| Successor | Predecessor | |||||||||||||||
| December 31, 2015 | December 31, 2014 | |||||||||||||||
| Deferred income tax assets: |
||||||||||||||||
| Inventories and related reserves |
$ | 2,255 | $ | — | ||||||||||||
| Accrued compensation |
535 | — | ||||||||||||||
| Allowance for doubtful accounts |
1,901 | — | ||||||||||||||
| Net operating loss carryforwards |
2,290 | 118 | ||||||||||||||
| Other, net |
41 | 201 | ||||||||||||||
|
|
|
|
|
|||||||||||||
| Total deferred tax assets |
7,022 | 319 | ||||||||||||||
|
|
|
|
|
|||||||||||||
| Deferred income tax liabilities: |
||||||||||||||||
| Intangible assets and goodwill |
(14,887 | ) | — | |||||||||||||
| Property and equipment |
(7,445 | ) | — | |||||||||||||
| Partnership investment |
— | (1,167 | ) | |||||||||||||
|
|
|
|
|
|||||||||||||
| Total deferred tax liabilities |
(22,332 | ) | (1,167 | ) | ||||||||||||
|
|
|
|
|
|||||||||||||
| Net deferred tax liabilities |
$ | (15,310 | ) | $ | (848 | ) | ||||||||||
|
|
|
|
|
|||||||||||||
At December 31, 2015, the Company had net operating loss carryforwards for federal and state tax purposes of $4.6 million and $8.2 million, respectively. These carryforwards start to expire in 2032.
At December 31, 2014, the Company had net operating loss carryforwards of $0.3 million which will expire in varying amounts through 2032.
At December 31, 2015, the Company has federal tax credit carryforwards of $0.2 million. These carryforwards can be carried forward indefinitely.
Tax benefits from uncertain tax positions are recognized if it is more likely than not that the position is sustainable based solely on its technical merits. The Company concluded that there were no uncertain tax positions identified during its analysis at December 31, 2015 or December 31, 2014.
The Company recognizes interest and penalties related to unrecognized tax benefits within the income tax benefit line in the accompanying consolidated statements of operations and comprehensive loss. There were no accrued interest and penalties associated with uncertain tax positions as of December 31, 2015 or December 31, 2014.
F-29
Table of Contents
LSF9 CYPRESS HOLDINGS, LLC AND SUBSIDIARIES
NOTES TO CONSOLIDATED FINANCIAL STATEMENTS—(Continued)
The Company does not anticipate a significant change in its uncertain tax benefits over the next twelve months.
The Company is subject to taxation in the U.S. and various state jurisdictions. As of December 31, 2015, the Company is only subject to federal tax authority examinations from 2011 forward and to state tax authority examination from 2010 forward.
7. Assets Held for Sale
During the Successor Period, the Company approved the sale of the Appleton, WI location and reclassified $1.0 million as assets held for sale. This amount is included in prepaid and other current assets as of December 31, 2015 on the consolidated balance sheet.
8. Property and Equipment
Property and equipment as of December 31, 2015 (Successor) and December 31, 2014 (Predecessor), consist of the following ($ in thousands):
| Successor | Predecessor | |||||||||||||||
| December 31, 2015 | December 31, 2014 | |||||||||||||||
| Vehicles and equipment |
$ | 36,672 | $ | 30,958 | ||||||||||||
| Buildings and leasehold improvements |
13,918 | 2,197 | ||||||||||||||
| Machinery and equipment |
12,533 | 7,945 | ||||||||||||||
| Land |
2,590 | — | ||||||||||||||
| Construction in progress |
1,774 | — | ||||||||||||||
| Furniture and fixtures |
636 | 2,211 | ||||||||||||||
|
|
|
|
|
|||||||||||||
| 68,123 | 43,311 | |||||||||||||||
| Less: accumulated depreciation |
(1,982 | ) | (8,140 | ) | ||||||||||||
|
|
|
|
|
|||||||||||||
| $ | 66,141 | $ | 35,171 | |||||||||||||
|
|
|
|
|
|||||||||||||
Depreciation expense for property and equipment was $2.0 million for October 9, 2015 to December 31, 2015 (Successor), $7.8 million for January 1, 2015 to October 8, 2015 (Predecessor), and $7.6 million for the year ended December 31, 2014 (Predecessor).
F-30
Table of Contents
LSF9 CYPRESS HOLDINGS, LLC AND SUBSIDIARIES
NOTES TO CONSOLIDATED FINANCIAL STATEMENTS—(Continued)
9. Asset-Based Credit Facility and Notes Payable
Notes payable consisted of the following at December 31, 2015 (Successor) and December 31, 2014 (Predecessor) ($ in thousands):
| Successor | Predecessor | |||||||||||
| December 31, 2015 | December 31, 2014 | |||||||||||
| Senior lien term loan |
$ | 245,000 | $ | — | ||||||||
| Junior lien term loan |
80,000 | — | ||||||||||
| BofA and PNC Bank asset-based credit facility |
— | 90,746 | ||||||||||
| PennantPark Investment Corporation and affiliates term loans |
— | 87,860 | ||||||||||
| Notes payable related party |
— | 72 | ||||||||||
| Kobrin note payable to related party shareholder |
— | 900 | ||||||||||
| Unamortized debt issuance costs and debt discount |
(23,193 | ) | (1,249 | ) | ||||||||
| Less: current portion of notes payable, net |
(1,492 | ) | (28 | ) | ||||||||
|
|
|
|
|
|||||||||
| $ | 300,315 | $ | 178,301 | |||||||||
|
|
|
|
|
|||||||||
December 31, 2015
2015 Credit Facility
On October 9, 2015, the Company entered into a secured credit facility with a syndicate of lenders that consists of a Senior Lien Term Loan Credit Agreement (“SLCA”), Junior Lien Term Credit Agreement (“JLCA”) and an ABL Credit Agreement (“ABL”) with commitments of $245 million for the SLCA and $80 million as part of the JLCA (“Term Loans”) and under the ABL, a $5 million letter of credit and a revolving credit facility of $50 million. On December 30, 2015, the Company entered into the Incremental Facility Amendment to the ABL Credit Agreement (“ABL Amendment”) extending the revolving credit facility to $100 million. Collectively, the Term Loans, ABL and ABL Amendment represent the “2015 credit facility”. The 2015 credit facility was used for working capital and general corporate purposes as well as to finance acquisition related business activities.
The 2015 credit facility bears interest, at the Company’s option, at either a Eurodollar adjusted LIBOR rate or an alternate base rate based upon the prime rate, the federal funds effective rate or the adjusted LIBOR rate plus 1.00%, plus, an applicable margin specific to each of the SLCA, JLCA, or ABL revolver. The margin in either case is based on a measure of availability under the 2015 credit facility. Interest on alternate base rate loans is due on the last business day of March, June, September and December commencing on December 31, 2015. Interest on Eurodollar loans is due and payable at least every three months.
Senior Lien Term Loan Credit Agreement
As of December 31, 2015, the Company has $245.0 million outstanding under the SLCA, which matures on October 9, 2022. The SLCA bears interest, at the Company’s option, at either a Eurodollar rate or an alternate base rate plus an applicable margin. The margin will be 6.25% per annum in the case of Eurodollar rate loans and 5.25% per annum in the case of
F-31
Table of Contents
LSF9 CYPRESS HOLDINGS, LLC AND SUBSIDIARIES
NOTES TO CONSOLIDATED FINANCIAL STATEMENTS—(Continued)
alternate base rate loans. Beginning March 31, 2016, the SLCA has mandatory principal repayments of $0.6 million which are payable in March, June, September, and December of each year. The weighted average interest rate of the term loan was 7.25% during the year ended December 31, 2015. An administrative agent fee of $0.2 million for the SLCA is due and payable each year in quarterly installments on the last day of each quarter. With the exception of a 1% premium for prepayment in the first twelve months from closing, there are no prepayment penalties associated with the SLCA.
Junior Lien Term Loan Credit Agreement
As of December 31, 2015, the Company has $80.0 million outstanding under the JLCA, which matures on October 9, 2023. The JLCA bears interest, at the Company’s option, at either a Eurodollar rate or an alternate base rate plus an applicable margin. The margin will be 10.50% per annum in the case of Eurodollar rate loans and 9.50% per annum in the case of alternate base rate loans. The weighted average interest rate of the term loan was 11.5% during the year ended December 31, 2015. An administrative agent fee of $0.1 million for the JLCA is due and payable each year in quarterly installments on the last day of each quarter. With the exception of a 2% premium for prepayment in the first year from closing and a 1% premium for prepayment in the second year, there are no additional prepayment penalties associated with the JLCA. The JLCA is payable in full on October 9, 2023.
ABL Credit Agreement
As of December 31, 2015, the Company has $70.0 million outstanding under the revolving credit facility, which matures on October 9, 2020. The revolver bears interest, at the Company’s option, at either a Eurodollar rate or an alternate base rate plus an applicable margin. Based on the historical excess availability under the revolver, the margin can range from 1.25% to 1.75% per annum in the case of Eurodollar rate loans and 0.25% to 0.75% per annum in the case of alternate base rate loans. The available borrowing capacity, or borrowing base, is derived from a percentage of the Company’s eligible receivables and inventory, as defined by the agreement, subject to certain reserves. As of December 31, 2015 the available borrowing capacity was $100.0 million. The weighted average interest rate of the revolver was 1.45% during the year ended December 31, 2015. A variable commitment fee, ranging from 0.25% to 0.375% and currently .25% per annum, is charged on the unused amount of the revolver based on quarterly average loan utilization. Letters of credit under the ABL are assessed at a rate equal to the applicable Eurodollar margin, currently 1.25%, as well as a fronting fee at a rate of 0.125% per annum. These fees are payable quarterly in arrears at the end of March, June, September, and December. In addition, an administrative agent fee of $0.1 million for the ABL is due and payable each year in quarterly installments on the last day of each quarter. There are no prepayment premiums associated with the ABL.
All obligations under the 2015 credit facility are guaranteed jointly and severally by the Company and its subsidiaries. All obligations and the guarantees of those obligations are secured by substantially all of the assets of the Company and the guarantors.
The 2015 credit facility contains restrictive covenants which, among other things, limit the Company’s ability to incur additional indebtedness, incur liens, engage in mergers or other fundamental changes, sell certain assets, pay dividends, make acquisitions or investments,
F-32
Table of Contents
LSF9 CYPRESS HOLDINGS, LLC AND SUBSIDIARIES
NOTES TO CONSOLIDATED FINANCIAL STATEMENTS—(Continued)
prepay certain indebtedness, change the nature of the Company’s business, and engage in certain transactions with affiliates, respectively. In addition, the 2015 credit facility also contains a financial covenant requiring the satisfaction of a minimum fixed charge ratio of 1.00 to 1.00 in the event that the Company does not meet a minimum measure of availability.
As of December 31, 2015, the Company was in compliance with all debt covenants
Debt Issuance Costs
During the period from October 9, 2015 to December 31, 2015 (Successor), the Company modified its debt agreements for additional borrowing, resulting in capitalized debt issuance costs of $8.2 million. The costs incurred in connection with the origination of the Company’s term loans totaled $6.9 million. Unamortized debt issuance costs as of December 31, 2015 were $6.7 million, of which $1.0 million was included in current portion of notes payable, net and $5.7 million was included in long-term portion of notes payable, net in the accompanying consolidated balance sheet. The fees incurred in connection with the origination of the Company’s asset-based credit facility totaled $1.3 million. Unamortized debt issuance costs as of December 31, 2015 were $1.2 million, of which $0.3 million was included in prepaid and other current assets and $0.9 million, was included in other long-term assets in the accompanying consolidated balance sheet.
December 31, 2014
2014 Revolving Line of Credit
As of December 31, 2014, the Company had a revolving line of credit with Bank of America and PNC Bank dated November 1, 2013 and amended on May 1, 2014 and December 5, 2014. The borrowing base was determined based on the amount of eligible accounts receivable, eligible inventory and fixed asset availability that amortizes monthly, reduced by applicable reserves. The Company had borrowings of $90.7 million under the available line of credit with a borrowing base of $103.9 million at December 31, 2014. The revolving line of credit was secured by substantially all of the Company’s assets. The line of credit was repaid during 2015.
Term Loans
The Company had term loans with Pennant Park Investment Corporation and affiliates, dated November 1, 2013 and amended on May 1, 2014 and December 5, 2014, which were used to support the 2014 acquisitions. The term loans were secured by a second lien on substantially all of the Company’s assets with a balance as of December 31, 2014 of $87.9 million. The note was repaid during 2015.
Related Party Note Payable
As of December 31, 2014, the Company had a note payable to a related party with interest rate fixed at 4.00% per annum. At December 31, 2014 the note balance was $0.1 million and was secured by vehicles. The note was repaid during 2015.
F-33
Table of Contents
LSF9 CYPRESS HOLDINGS, LLC AND SUBSIDIARIES
NOTES TO CONSOLIDATED FINANCIAL STATEMENTS—(Continued)
Kobrin Note Payable
At December 31, 2014, the Company had a note payable due to a related party shareholder due December 2020. The balance as of December 31 2014 was $0.9 million which was repaid during 2015.
All of the existing credit facilities outstanding at October 8, 2015 were paid off in connection with the Lone Star Acquisition. All unamortized debt issuance costs outstanding at that time were charged to income for the period from January 1, 2015 through October 8, 2015.
Aggregate Contractual Maturities
Aggregate contractual maturities for the Company’s asset-based credit facility and long-term debt as of December 31, 2015 are as follows ($ in thousands).
| Years Ending December 31, |
||||
| 2016 |
$ | 2,450 | ||
| 2017 |
2,450 | |||
| 2018 |
2,450 | |||
| 2019 |
2,450 | |||
| 2020 |
72,450 | |||
| Thereafter |
312,750 | |||
|
|
|
|||
| $ | 395,000 | |||
|
|
|
|||
10. Related Parties
Holdings previously paid management fees and certain expenses to an affiliate of its former parent CI (FBM), Holdings, LLC (“CIFBM”) Total management fees and expenses were $1.0 million for January 1, 2015 to October 8, 2015 (Predecessor) and $0.5 million for the year end December 31, 2014 (Predecessor). The Company reports these management fees and expenses in selling, general and administrative expenses on the consolidated statements of operations. Holdings also paid acquisition costs of $1.9 million in the period January 1, 2015 through October 8, 2015 (Predecessor) and $1.9 million in the year ended December 31, 2014 (Predecessor) to an affiliate of CIFBM which were properly expensed and reported as acquisition related expenses in the consolidated statements of operations.
The Company currently pays management fees and certain expenses to an affiliate of, Lone Star. Total management fees were $0.3 million for the period from October 9, 2015, to December 31, 2015 (Successor). The Company also paid acquisition costs of $0.2 million in the year ended December 2015 to an affiliate of Lone Star which were properly expensed and reported as acquisition related expenses in the consolidated statements of operations.
The Company leases approximately fifteen facilities from related parties (Note 11). Amounts recognized in the statement of operations as rent expense related to these fifteen facilities for the period from October 9, 2015, to December 31, 2015 (Successor), January 1, 2015 to October 8, 2015 (Predecessor) and for the year ended December 31, 2014 (Predecessor) was $0.6 million, $1.6 million, and $3.1 million, respectively.
F-34
Table of Contents
LSF9 CYPRESS HOLDINGS, LLC AND SUBSIDIARIES
NOTES TO CONSOLIDATED FINANCIAL STATEMENTS—(Continued)
Until the Lone Star Acquisition, Holdings had outstanding debt with related parties totaling $0.9 million at October 9, 2015. At December 31, 2014, there was $0.2 million of accrued interest payable to a shareholder.
In addition, the Company sells products to another affiliate company that is owned by one of its shareholders. Total sales for the period from October 9, 2015 to December 31, 2015 (Successor) and January 1, 2015 to October 8, 2015 (Predecessor) was $0.2 million and $0.6 million, respectively. There were $0.3 million in accounts receivable balances from such related party as of December 31, 2015.
11. Lease Commitments
The Company leases certain facilities and equipment under various operating lease agreements with expiration dates through 2026 and typically contain renewal options of 5 to 10 years. These agreements generally require the Company to pay rental amounts and operating expenses, and contain tenant improvement allowances, rent holidays, rent escalation clauses and/or contingent rent provisions.
Leasehold improvement assets, which generally represent non-structural improvements for which the Company receives reimbursement from the landlord, are depreciated over the lesser of 10 years or the initial life of the lease, prior to any lease extensions. For tenant allowances, the Company records a corresponding deferred rent liability in other liabilities on the balance sheet and amortizes the deferred rent over the initial term of the lease as a reduction to rent expense.
The Company’s leases may contain rent holidays and/or escalating rent payments, however the Company accounts for the rent expense on a straight-line basis over the lease term. The straight-line rent expense is calculated at the inception of the lease, which entails recording a monthly liability for the difference between rent paid to the landlord and straight-line rent expense as calculated at the beginning of the lease.
Rent expense was $3.2 million for October 9, 2015 to December 31, 2015 (Successor), $9.6 million for January 1, 2015 to October 8, 2015 (Predecessor) and $7.4 million for the year ended December 31, 2014 (Predecessor).
Minimum annual lease commitments under non-cancelable leases are summarized as follows ($ in thousands):
| Year Ending December 31, |
Related Party |
Third Party |
Total | |||||||||
| 2016 |
$ | 1,622 | $ | 9,876 | $ | 11,499 | ||||||
| 2017 |
1,257 | 7,678 | 8,935 | |||||||||
| 2018 |
1,100 | 5,933 | 7,032 | |||||||||
| 2019 |
898 | 3,996 | 4,894 | |||||||||
| 2020 |
822 | 2,217 | 3,039 | |||||||||
| Thereafter |
939 | 6,695 | 7,634 | |||||||||
|
|
|
|
|
|
|
|||||||
| $ | 6,638 | $ | 36,395 | $ | 43,033 | |||||||
|
|
|
|
|
|
|
|||||||
F-35
Table of Contents
LSF9 CYPRESS HOLDINGS, LLC AND SUBSIDIARIES
NOTES TO CONSOLIDATED FINANCIAL STATEMENTS—(Continued)
12. Long-Term Incentive Plan
The Company established the LSF9 Cypress Parent LLC Long-Term Incentive Plan (the “LTIP” or “plan”) in October 2015 with the purpose of attracting certain key employees and other service providers of the Company and its subsidiaries and to provide motivation to put forth maximum efforts toward the continued growth, profitability and success of the Company by providing incentives.
The board of the Company administers the plan and awards pool units. Pool units vest 10% each year for the first 3 years. Pool units, whether vested or unvested, that are outstanding on the 5th anniversary of the date the award was granted will be forfeited on that date or, upon the date the participant ceases employment. Pool units will remain outstanding for a period of six months from the date of such termination if the termination is without cause, a resignation for good reason, death or termination due to disability. Total pool units to be granted under the LTIP is 1,000,000. At December 31, 2015, there were 835,000 pool units granted.
The Company will maintain an incentive pool account and upon a monetization event and obtaining a cumulative internal rate of return of at least 15%, the Company will credit to the incentive pool account amounts as defined in the LTIP and determined by the cumulative internal rate of return achieved at the time of the monetization event. A monetization event, as defined by the LTIP, is one of the following transactions: a) the Company is sold, transferred or otherwise disposed of to an unrelated third party for cash; b) a firm commitment underwritten public offering of the equity interests of the Company; or c) the payment by the Company of any cash distributions to investors. Following a monetization event, the value of any incentive amount to be paid to a participant will be determined by the percentage of a participant’s pool units awarded to the total pool units awarded under the LTIP times the amount in the incentive pool account. Participants will be paid within 60 days following the monetization event. At December 31, 2015, there has not been a monetization event.
As of November 4, 2016, no such monetization events had occurred as the 15% cumulative internal rate of return required before funding is triggered was not yet met, and therefore no amounts were accrued in the accompanying combined balance sheets. The Company is contemplating an initial public offering as early as the first quarter of 2017, but the initial public offering is not expected to reach the required return on investment to trigger a payout under the LTIP.
13. Retirement Plan
The Company has multiple retirement savings plans for all eligible full-time employees under Section 401(k) of the Internal Revenue Code. The plans allow participants to contribute a portion of their earnings to the plans. The plans allow the Company, at its discretion, to match a certain percentage of the employees’ contributions, limited to a certain percentage of eligible compensation. There were contributions to the plans of $0.4 million for October 9, 2015 to December 31, 2015 (Successor), $0.8 million for January 1, 2015 to October 8, 2015 (Predecessor) and $0.6 million for the year ended December 31, 2014 (Predecessor).
F-36
Table of Contents
LSF9 CYPRESS HOLDINGS, LLC AND SUBSIDIARIES
NOTES TO CONSOLIDATED FINANCIAL STATEMENTS—(Continued)
14. Contingencies
The Company is involved in certain legal actions arising in the ordinary course of business. Management believes that such litigation and claims will be resolved without material effect on the Company’s consolidated financial position.
As of December 31, 2015, there were no proceedings or litigation involving the Company that management believes would have a material adverse impact on its business, financial position, results of operations, or cash flows.
15. Segments
Segment information is presented in accordance with ASC 280, Segment Reporting (“ASC 280”), which establishes standards for reporting information about operating segments. It also establishes standards for related disclosures about customers, products and geographic areas. Operating segments are defined as components of an enterprise that engage in business activities that earn revenues, incur expenses and prepare separate financial information that is evaluated regularly by the Company’s chief operating decision maker in order to allocate resources and assess performance.
Based on the provisions of ASC 280, the Company has defined its operating segments based on domestic geographic areas led by Regional Vice Presidents. Resources are allocated and performance is assessed by our CEO. All of the Company’s operating segments have been aggregated into one reportable segment based upon their similar economic characteristics, nature of products, type of customers, and distribution methods.
As of December 31, 2015 the Company did not earn revenues or have long-lived assets in foreign countries and no customer comprised more than 10% of net sales. In accordance with the enterprise-wide disclosure requirements of ASC 280, the Company’s net sales from external customers by main product line are as follows ($ in thousands):
| Successor | Predecessor | |||||||||||||||||||
| October 9 - December 31, 2015 |
January 1- October 8, 2015 |
Year Ended December 31, 2014 |
||||||||||||||||||
| Wallboard and Accessories |
$ | 99,275 | $ | 320,246 | $ | 276,502 | ||||||||||||||
| Metal Framing |
33,093 | 109,850 | 85,229 | |||||||||||||||||
| Suspended Ceiling Systems |
20,341 | 74,757 | 53,119 | |||||||||||||||||
| Other products |
39,830 | 123,213 | 94,003 | |||||||||||||||||
|
|
|
|
|
|
|
|||||||||||||||
| Net Sales |
$ | 192,539 | $ | 628,066 | $ | 508,853 | ||||||||||||||
|
|
|
|
|
|
|
|||||||||||||||
16. Subsequent Events
Acquisitions
On April 29, 2016, the Company acquired certain assets and the operations of Mid America Drywall Supply, Inc. (“Mid America”) for $1.5 million in cash (including certain adjustments). Mid America is located in Wichita Kansas. Mid America was a distributor of interior products such as wallboard, and other products. The final purchase price allocation for the acquisition is preliminary and subject to adjustment as additional information is obtained about facts and circumstances that existed as of the acquisition date.
F-37
Table of Contents
LSF9 CYPRESS HOLDINGS, LLC AND SUBSIDIARIES
NOTES TO CONSOLIDATED FINANCIAL STATEMENTS—(Continued)
On May 31, 2016, the Company acquired certain assets and the operations of Ken Builders Supply Inc. (“Ken API”) for $37.4 million. Ken API was a supplier of building materials to commercial and residential developers throughout Ohio, Kentucky, West Virginia, and central Indiana. In accordance with its acquisitive growth strategy, the Company determined that Ken API fits its need for a supplier with a presence in Ohio, Kentucky, West Virginia and central Indiana. The Acquisition was accounted for as a business combination under the acquisition method of accounting. Accordingly, the assets acquired and liabilities assumed were recorded at fair value with the remaining purchase price recorded as goodwill. The Company estimated the fair value of the assets acquired and liabilities assumed as part of the business combination, including working capital, property and equipment, and customer relationships. The final purchase price allocation for the acquisition is preliminary and subject to adjustment as additional information is obtained about facts and circumstances that existed as of the acquisition date.
On May 31, 2016, the Company acquired 100% of the capital stock of Kent Gypsum Supply Inc. (“Kent”) for $19.6 million of which purchase price was $19.2 million with an additional working capital adjustment of $0.4 million. Kent is a supplier of building materials to commercial and residential developers throughout Western Washington. In accordance with its acquisitive growth strategy, the Company determined that Kent fits its need for a supplier with a presence in Western Washington. The Acquisition was accounted for as a business combination under the acquisition method of accounting. Accordingly, the assets acquired and liabilities assumed were recorded at fair value with the remaining purchase price recorded as goodwill. The Company estimated the fair value of the assets acquired and liabilities assumed as part of the business combination, including working capital, property and equipment, and customer relationships. The final purchase price allocation for the acquisition is preliminary and subject to adjustment as additional information is obtained about facts and circumstances that existed as of the acquisition date.
On August 9, 2016, the Company acquired 100% of the capital stock of Winroc-SPI Corporation, Superior Plus Construction Products Corp., and The Winroc Corporation (Midwest) (collectively referred to as “Winroc”) for $314.1 million. Winroc is a supplier of building materials to commercial and residential developers throughout the United States and Canada. The Acquisition is accounted for as a business combination in the Company’s third quarter of 2016. The Company funded the acquisition with the issuance of the Notes, the revolving credit facility, a cash payment of $13.0 million and an equity contribution from Lone Star of $65.0 million.
Senior Secured Notes Due 2021
On August 9, 2016, the Company, together with FBM Finance, Inc., its wholly owned subsidiary (together, the “Issuers”) which was created for the purpose of issuing the Notes , issued $575 million in aggregate principal amount of 8.25% senior secured notes due 2021 (the “Notes”) at an issue price of 98% of the principal amount of the Notes in a private placement for resale to “qualified institutional buyers” as defined in Rule 144A under the Securities Act of 1933, as amended (“Securities Act”) and in offshore transactions pursuant to Regulation S under the Securities Act.
The Notes are senior secured obligations that have priority over certain collateral of the Issuers and the guarantors of the Notes and are effectively subordinated to the obligations
F-38
Table of Contents
LSF9 CYPRESS HOLDINGS, LLC AND SUBSIDIARIES
NOTES TO CONSOLIDATED FINANCIAL STATEMENTS—(Continued)
under the Revolver (described below) in respect of certain other collateral of the Issuers and the guarantors of the Notes. The Notes are fully and unconditionally guaranteed on a senior secured basis, jointly and severally, by LSF9 Cypress Parent, LLC (“Parent”) and each of Parent’s domestic wholly owned restricted subsidiaries (other than certain excluded subsidiaries) (the “guarantors”).
The Notes will mature on August 15, 2021 and bear interest at an annual rate of 8.25%. Interest on the Notes is payable semi-annually in arrears in February and August of each year, commencing February 2017. The Notes are governed by an indenture, dated August 9, 2016, among the Issuers, the guarantors and Wilmington Trust, National Association, as trustee (the “Indenture”).
The Issuers may, at their option, redeem all or a portion of the Notes at any time on or after August 15, 2018 at the applicable redemption prices specified in the Indenture, plus any accrued and unpaid interest to, but excluding, the applicable redemption date. The Issuers are also entitled to redeem up to 40% of the aggregate principal amount of the Notes before August 15, 2018 with the net cash proceeds that the Issuers receive from certain equity offerings as defined in the Indenture at a redemption price equal to 108.25% of the principal amount of the Notes, plus accrued and unpaid interest, if any, to, but excluding, the applicable redemption date. In addition, before August 15, 2018, the Issuers may redeem all or a portion of the Notes, at a redemption price equal to 100% of the principal amount thereof, plus a “make-whole” premium and accrued and unpaid interest, if any, to, but excluding, the applicable redemption date.
Upon certain kinds of changes of control, holders of the Notes have the right to require the Issuers to repurchase all or any portion of such holder’s Notes at 101% of the principal amount of the notes being repurchased, plus any accrued and unpaid interest to, but excluding, the date of repurchase.
ABL Credit Agreement
On August 9, 2016, the Company entered into a new revolving credit facility (the “Revolver”) with Goldman Sachs Bank USA, as administrative agent, which matures on February 9, 2021. The Revolver bears interest, at the Company’s option, at either a Eurodollar rate or an alternate base rate plus an applicable margin. Based on the historical excess availability under the Revolver, the margin can range from 1.25% to 1.75% per annum in the case of Eurodollar rate loans and 0.25% to 0.75% per annum in the case of alternate base rate loans. The available borrowing capacity, or borrowing base, is derived from a percentage of the Company’s eligible receivables and inventory in both the United States and Canada, as defined in the agreement, subject to certain reserves, with a $75 million sublimit on the Canadian borrowing base. As of the closing of the Revolver, the available borrowing capacity was $250 million. A variable commitment fee, ranging from 0.25% to 0.375% and currently 0.25% per annum, is charged on the unused amount of the Revolver based on quarterly average loan utilization. Letters of credit under the Revolver are assessed at a rate equal to the applicable Eurodollar margin currently 1.50% as well as a fronting fee at a rate of 0.125% per annum. These fees are payable quarterly in arrears at the end of March, June, September, and December. In addition, an administrative agent fee of $75,000 for the Revolver is due and payable each year in quarterly installments on the last day of each quarter. The Revolver is a senior secured obligation of the Company, with priority over certain collateral of the Company and its subsidiaries. There are no prepayment premiums associated with the Revolver.
F-39
Table of Contents
LSF9 CYPRESS HOLDINGS, LLC AND SUBSIDIARIES
NOTES TO CONSOLIDATED FINANCIAL STATEMENTS—(Continued)
In connection with the entry into the Revolver and issuance of the Notes, the Company paid off and terminated the existing Senior Lien Term Loan Credit Agreement, Junior Lien Term Loan Credit Agreement and ABL Credit Agreement that were entered into on October 9, 2015.
On September 23, 2016, the Company entered into an Incremental Facility Amendment which extended borrowing commitments under the initial credit agreement by an additional $50 million, resulting in total borrowing capacity of $300 million.
Management has performed their analysis through November 4, 2016, which was the date that the financial statements were issued and has determined that there are no further subsequent events requiring disclosure.
17. UNAUDITED PRO FORMA NET LOSS PER SHARE
The pro forma earnings per share data for the successor period October 9, 2015 to December 31, 2015 based on our historical combined statement of operations after giving effect to the following as if they occurred at the beginning of the period: (1) a reorganization consolidating all entities under a new parent entity (Foundation Building Materials, Inc.), and (2) a 29,974.239 to 1 stock split with respect to the common stock of Foundation Building Materials, Inc. that will occur prior to the effective date of the registration statement.
| Successor | ||||
| October 9, 2015 to December 31, 2015 |
||||
| Net loss attributable to common share holders |
$ | (7,926 | ) | |
| Historical outstanding common shares of the combined entity |
— | |||
| Effect of reorganization, issuance of shares and stock split |
29,974,239 | |||
| Pro forma basic weighted average outstanding common shares |
29,974,239 | |||
| Pro forma diluted weighted average outstanding common shares |
29,974,239 | |||
| Pro forma Loss per share |
||||
| Basic |
(0.26 | ) | ||
| Diluted |
(0.26 | ) | ||
F-40
Table of Contents
LSF9 Cypress
Holdings, LLC and
Subsidiaries
Unaudited Condensed Consolidated Financial Statements
as of September 30, 2016, and December 31, 2015, and for the Nine Months Ended September 30, 2016 (Successor), and September 30, 2015 (Predecessor)
F-41
Table of Contents
LSF9 CYPRESS HOLDINGS, LLC AND SUBSIDIARIES
TABLE OF CONTENTS
| Page | ||||
| UNAUDITED CONDENSED CONSOLIDATED FINANCIAL STATEMENTS AS OF SEPTEMBER 30, 2016, AND DECEMBER 31, 2015, AND FOR THE NINE MONTHS ENDED SEPTEMBER 30, 2016 (SUCCESSOR), AND SEPTEMBER 30, 2015 (PREDECESSOR): |
||||
| F-43 | ||||
| F-44 | ||||
| F-45 | ||||
| F-46-F-65 | ||||
F-42
Table of Contents
LSF9 CYPRESS HOLDINGS, LLC AND SUBSIDIARIES
CONDENSED CONSOLIDATED BALANCE SHEETS
AS OF SEPTEMBER 30, 2016, AND DECEMBER 31, 2015
(UNAUDITED)
($ in thousands)
| September 30, 2016 |
December 31, 2015 |
Pro Forma September 30, 2016 (Note 10) |
||||||||||
| Assets |
||||||||||||
| Current assets |
||||||||||||
| Cash and cash equivalents |
$ | 23,393 | $ | 10,662 | $ | 23,393 | ||||||
| Accounts receivable—net of allowance for doubtful accounts of $8,627 and $6,304, respectively |
287,567 | 138,621 | 287,567 | |||||||||
| Other receivables |
35,686 | 24,673 | 35,686 | |||||||||
| Inventories, net |
153,855 | 71,876 | 153,855 | |||||||||
| Prepaid and other current assets |
9,959 | 4,666 | 9,959 | |||||||||
|
|
|
|
|
|
|
|||||||
| Total current assets |
510,460 | 250,498 | 510,460 | |||||||||
| Property and equipment, net |
145,007 | 66,141 | 145,007 | |||||||||
| Intangible assets, net |
214,430 | 154,458 | 214,430 | |||||||||
| Goodwill |
396,532 | 289,086 | 396,532 | |||||||||
| Other assets |
7,894 | 3,204 | 7,894 | |||||||||
|
|
|
|
|
|
|
|||||||
| Total assets |
$ | 1,274,323 | $ | 763,387 | $ | 1,274,323 | ||||||
|
|
|
|
|
|
|
|||||||
| Liabilities and member’s equity |
||||||||||||
| Current liabilities |
||||||||||||
| Asset-based credit facility |
$ | — | $ | 70,000 | $ | — | ||||||
| Accounts payable |
132,087 | 59,193 | 132,087 | |||||||||
| Accrued payroll and employee benefits |
25,699 | 10,942 | 25,699 | |||||||||
| Accrued taxes |
9,844 | 5,765 | 9,844 | |||||||||
| Other current liabilities |
28,741 | 9,501 | 28,741 | |||||||||
| Current portion of notes payable |
— | 1,492 | — | |||||||||
|
|
|
|
|
|
|
|||||||
| Total current liabilities |
196,371 | 156,893 | 196,371 | |||||||||
| Asset-based credit facility |
190,000 | — | 190,000 | |||||||||
| Long-term portion of notes payable, net |
523,403 | 300,315 | 523,403 | |||||||||
| Tax receivable agreement liability |
— | — | 205,000 | |||||||||
| Deferred income taxes, net |
8,413 | 15,310 | 8,413 | |||||||||
| Other liabilities |
17,938 | 118 | 17,938 | |||||||||
|
|
|
|
|
|
|
|||||||
| Total liabilities |
936,125 | 472,636 | 1,141,125 | |||||||||
|
|
|
|
|
|
|
|||||||
| Commitments and contingencies (Note 14) |
||||||||||||
| Member’s paid in capital |
364,815 | 298,677 | 159,815 | |||||||||
| Accumulated other comprehensive income |
875 | — | 875 | |||||||||
| Accumulated deficit |
(27,492 | ) | (7,926 | ) | (27,492 | ) | ||||||
|
|
|
|
|
|
|
|||||||
| Total member’s equity |
338,198 | 290,751 | 133,198 | |||||||||
|
|
|
|
|
|
|
|||||||
| Total liabilities and member’s equity |
$ | 1,274,323 | $ | 763,387 | $ | 1,274,323 | ||||||
|
|
|
|
|
|
|
|||||||
See accompanying notes to the condensed consolidated financial statements.
F-43
Table of Contents
LSF9 CYPRESS HOLDINGS, LLC AND SUBSIDIARIES
CONDENSED CONSOLIDATED STATEMENTS OF OPERATIONS
AND COMPREHENSIVE (LOSS) INCOME
FOR THE NINE MONTHS ENDED
SEPTEMBER 30, 2016 (SUCCESSOR), AND
SEPTEMBER 30, 2015 (PREDECESSOR)
(UNAUDITED)
($ in thousands)
| Nine Months Ended | ||||||||||||
| (Successor) September 30, 2016 |
(Predecessor) September 30, 2015 |
|||||||||||
| Net sales |
$ | 930,315 | $ | 608,964 | ||||||||
| Cost of goods sold (exclusive of depreciation and amortization) |
665,767 | 440,539 | ||||||||||
|
|
|
|
|
|||||||||
| Gross profit |
264,548 | 168,425 | ||||||||||
|
|
|
|
|
|
|
|||||||
| Operating expenses |
||||||||||||
| Selling, general and administrative expenses |
206,280 | 126,102 | ||||||||||
| Depreciation and amortization |
33,605 | 15,125 | ||||||||||
| Acquisition related expenses |
12,478 | 12,542 | ||||||||||
|
|
|
|
|
|||||||||
| Total operating expenses |
252,363 | 153,769 | ||||||||||
|
|
|
|
|
|||||||||
| Income from operations |
12,185 | 14,656 | ||||||||||
| Interest expense |
(37,202 | ) | (15,717 | ) | ||||||||
| Other income, net |
93 | 14 | ||||||||||
|
|
|
|
|
|||||||||
| (Loss) income before income taxes |
(24,924 | ) | (1,047 | ) | ||||||||
|
|
|
|
|
|||||||||
| Income tax benefit |
(5,358 | ) | (1,325 | ) | ||||||||
|
|
|
|
|
|||||||||
| Net (loss) income |
$ | (19,566 | ) | $ | 278 | |||||||
|
|
|
|
|
|||||||||
| Other comprehensive income, net of tax: |
||||||||||||
| Change in foreign currency translation adjustments |
153 | — | ||||||||||
| Change in fair value of derivatives |
722 | — | ||||||||||
|
|
|
|
|
|||||||||
| Other comprehensive income |
875 | — | ||||||||||
| Comprehensive (loss) income |
$ | (18,691 | ) | $ | 278 | |||||||
|
|
|
|
|
|||||||||
| Basic and diluted loss per share (Note 10) |
$ | (0.65 | ) | |||||||||
See accompanying notes to the condensed consolidated financial statements.
F-44
Table of Contents
LSF9 CYPRESS HOLDINGS, LLC AND SUBSIDIARIES
CONDENSED CONSOLIDATED STATEMENTS OF CASH FLOWS
FOR THE NINE MONTHS ENDED SEPTEMBER 30, 2016 (SUCCESSOR),
AND SEPTEMBER 30, 2015 (PREDECESSOR)
(UNAUDITED)
($ in thousands)
| (Successor) September 30, 2016 |
(Predecessor) September 30, 2015 |
|||||||||||
| Operating activities |
||||||||||||
| Net (loss) income |
$ | (19,566 | ) | $ | 278 | |||||||
| Adjustments to reconcile net (loss) income to net cash provided by operating activities: |
||||||||||||
| Depreciation |
9,620 | 7,575 | ||||||||||
| Amortization of intangible assets |
23,985 | 7,550 | ||||||||||
| Amortization and write-off of debt issuance costs and debt discount |
3,599 | 354 | ||||||||||
| Inventory fair value adjustment |
6,372 | 1,606 | ||||||||||
| Loss on extinguishment of debt |
5,355 | — | ||||||||||
| Unrealized changes in foreign currency, net |
(17 | ) | — | |||||||||
| Unrealized changes in fair value of derivatives, net |
(148 | ) | — | |||||||||
| Bad debt expense |
1,923 | 1,511 | ||||||||||
| Loss on disposal of property and equipment |
243 | 216 | ||||||||||
| Deferred income taxes |
(5,160 | ) | (1,685 | ) | ||||||||
| Changes in assets and liabilities, net of effects of acquisitions: |
||||||||||||
| Accounts receivable |
(21,179 | ) | (23,403 | ) | ||||||||
| Other receivables |
2,177 | (2,446 | ) | |||||||||
| Inventories |
(6,782 | ) | 7,329 | |||||||||
| Prepaid expenses and other current assets |
(696 | ) | (283 | ) | ||||||||
| Other assets |
(110 | ) | 714 | |||||||||
| Accounts payable |
(2,949 | ) | 11,071 | |||||||||
| Accrued taxes |
1,187 | (2,947 | ) | |||||||||
| Accrued payroll and employee benefits |
2,647 | 8,160 | ||||||||||
| Other current liabilities |
6,601 | (1,758 | ) | |||||||||
| Other liabilities |
820 | 21 | ||||||||||
|
|
|
|
|
|||||||||
| Net cash provided by operating activities |
7,922 | 13,863 | ||||||||||
|
|
|
|
|
|||||||||
| Investing activities |
||||||||||||
| Capital expenditures |
(22,780 | ) | (9,586 | ) | ||||||||
| Acquisition of Ken Builders Supply |
(37,442 | ) | — | |||||||||
| Acquisition of Kent Gypsum Supply, net of cash acquired |
(19,307 | ) | — | |||||||||
| Acquisition of Mid America Drywall Supply |
(1,193 | ) | — | |||||||||
| Acquisition of Winroc |
(314,174 | ) | — | |||||||||
| Acquisition of Great Western Building Materials, net of cash acquired |
— | (87,490 | ) | |||||||||
|
|
|
|
|
|
|
|||||||
| Net cash used in investing activities |
(394,896 | ) | (97,076 | ) | ||||||||
|
|
|
|
|
|
|
|||||||
| Financing activities |
||||||||||||
| Proceeds from asset-based credit facility |
215,000 | 203,415 | ||||||||||
| Repayments of asset-based credit facility |
(95,000 | ) | (194,940 | ) | ||||||||
| Principal borrowings on long-term debt |
713,600 | 80,000 | ||||||||||
| Repayments of long-term debt |
(463,606 | ) | — | |||||||||
| Principal repayments of capital lease obligations |
(2,000 | ) | — | |||||||||
| Debt issuance costs |
(34,359 | ) | (1,165 | ) | ||||||||
| Capital contributions |
66,205 | 1,116 | ||||||||||
| Capital distributions |
(67 | ) | — | |||||||||
|
|
|
|
|
|
|
|||||||
| Net cash provided by financing activities |
399,773 | 88,426 | ||||||||||
|
|
|
|
|
|
|
|||||||
| Effect of exchange rate changes on cash |
(68 | ) | — | |||||||||
|
|
|
|
|
|
|
|||||||
| Net increase in cash |
12,731 | 5,213 | ||||||||||
| Cash and cash equivalents at beginning of period |
10,662 | 2,216 | ||||||||||
|
|
|
|
|
|
|
|||||||
| Cash and cash equivalents at end of period |
$ | 23,393 | $ | 7,429 | ||||||||
|
|
|
|
|
|
|
|||||||
| Supplemental disclosures of cash flow information |
||||||||||||
| Cash paid during the period for income taxes |
$ | 2,228 | $ | 334 | ||||||||
| Cash paid during the period for interest |
$ | 18,717 | $ | 12,964 | ||||||||
| Cash paid during the period for early debt prepayment penalty |
$ | 1,600 | $ | — | ||||||||
| Supplemental noncash investing and financing disclosures |
||||||||||||
| Fair value changes of derivative instruments recorded in OCI, net of tax |
$ | 722 | $ | — | ||||||||
| Assets acquired under capital lease |
$ | 804 | $ | — | ||||||||
| Purchases of property and equipment included in accounts payable |
$ | 133 | $ | — | ||||||||
| Embedded derivative in issued notes |
$ | 6,200 | $ | — | ||||||||
See accompanying notes to the condensed consolidated financial statements.
F-45
Table of Contents
LSF9 CYPRESS HOLDINGS, LLC AND SUBSIDIARIES
NOTES TO THE CONDENSED CONSOLIDATED FINANCIAL STATEMENTS (UNAUDITED)
1. DESCRIPTION OF COMPANY AND BASIS OF PRESENTATION
Description of Company—LSF9 Cypress Holdings, LLC (“Company” or “LSF9” or “Successor”) was formed on August 10, 2015 as a Delaware limited liability company and is a wholly owned direct subsidiary of LSF9 Cypress Parent, LLC (“Parent”), an affiliate of Lone Star Fund IX (U.S.), L.P. (“Lone Star”).
LSF9 acquired FBM Intermediate Holdings, LLC and its consolidated subsidiaries (“Holdings” or “Predecessor”) on October 9, 2015. LSF9 had no operations prior to the acquisition, and therefore, Holdings is the predecessor to the Company.
The Company, through its subsidiaries, is engaged in the wholesale and retail distribution of wallboard, suspended ceiling systems, metal framing, commercial and industrial insulation, and other products to commercial and residential building contractors and subcontractors. The Company has branch locations in 31 states and five Canadian provinces.
The accompanying condensed consolidated financial statements present the balance sheets as of September 30, 2016, and December 31, 2015, and the operations of the Successor for the nine months ended September 30, 2016 (“Successor Period”), and the operations of the Predecessor for the nine months ended September 30, 2015 (“Predecessor Period”). Operations of the Predecessor are presented based on its historical cost basis, which may not be comparable to that of the Successor.
General—The condensed consolidated financial statements have been prepared in accordance with accounting principles generally accepted in the United States of America (“U.S. GAAP”) and on the same basis as our audited consolidated financial statements as of December 31, 2015. The condensed consolidated balance sheet as of September 30, 2016 and the condensed consolidated statements of operations and comprehensive income (loss) and cash flows, for the periods presented herein are not audited but reflect all adjustments that are of a normal recurring nature and are necessary for a fair statement of the results of the periods shown. Certain information and note disclosures normally included in annual financial statements have been omitted pursuant to the rules and regulations of the U.S. Securities and Exchange Commission (“SEC”). Because the condensed consolidated interim financial statements do not include all of the information and notes required by U.S. GAAP for a complete set of financial statements, they should be read in conjunction with the audited consolidated financial statements referred to above. The results and trends in these interim financial statements may not be indicative of results for the full year.
Principles of Consolidation—The condensed consolidated financial statements include Foundation Building Materials, LLC and its consolidated subsidiaries. All intercompany balances and transactions have been eliminated in the consolidations. The Company reports two reportable segments. Based on the provisions of ASC 280, the Company has defined its operating segments based on geographic areas led by Regional Vice Presidents. Resources are allocated and performance is assessed by our CEO whom we have determined to be our Chief Operating Decision Maker (CODM).
F-46
Table of Contents
LSF9 CYPRESS HOLDINGS, LLC AND SUBSIDIARIES
NOTES TO THE CONDENSED CONSOLIDATED FINANCIAL STATEMENTS (UNAUDITED)—(Continued)
Basis of Presentation—The accompanying condensed consolidated financial statements have been prepared in accordance with U.S. GAAP.
2. SUMMARY OF SIGNIFICANT ACCOUNTING POLICIES
Use of Estimates—The preparation of financial statements in conformity with U.S. GAAP requires management to make estimates and assumptions that affect the reported amounts of assets and liabilities and disclosure of contingent assets and liabilities as of the date of the financial statements and the reported amounts of revenues and expenses during the period. Estimates that are more susceptible to change in the near term are the allowance for doubtful accounts, the allowance for excess and obsolete inventory, and recoverability of long-lived assets. Actual results may differ from these estimates.
Inventories—Inventories, consisting substantially of finished goods, are valued at the lower of cost or market (net realizable value). Cost is determined using the moving weighted-average cost method. The Company routinely evaluates inventory for excess or obsolescence and considers factors such as historical usage rates and present demand.
Reclassification—The Company has changed the manner in which it presents certain expenses related to the delivery and warehousing of its products in order to conform financial statement presentation to its industry peer group for comparability. These costs include warehousing and delivery costs, depreciation expense, payroll, and other costs directly attributable to the delivery of products to customers. In accordance with ACS 605, Revenue Recognition, the classification of shipping and handling costs on the statement of operations is an accounting policy decision. The previous accounting classification recorded these amounts in cost of goods sold within the statement of operations. The new accounting classification moves these amounts to selling, general, and administrative expenses, with separate presentation of depreciation and amortization expense.
Accordingly, the respective balances for all periods presented in these financial statements were reclassified in order to be consistent and comparable. The new account classification as well as the reclassification for prior periods had no effect on the consolidated balance sheets or statements of cash flows for the periods presented. Additionally, the reclassification did not impact income from operations nor net loss. The details of the reclassification in the statements of operations for the nine months ended September 30, 2016, are included below:
| ($ in thousands) | Successor Nine Months Ended September 30, 2016 |
|||||||||||
| Impact to Statement of Operations |
As previously classified |
Reclassification | As reclassified | |||||||||
| Cost of goods sold |
$ | 787,269 | $ | (121,502 | ) | $ | 665,767 | |||||
| Gross Profit |
$ | 143,046 | $ | 121,502 | $ | 264,548 | ||||||
| Selling, general, and administrative expenses |
$ | 118,383 | $ | 87,897 | $ | 206,280 | ||||||
| Depreciation and amortization |
$ | — | $ | 33,605 | $ | 33,605 | ||||||
F-47
Table of Contents
LSF9 CYPRESS HOLDINGS, LLC AND SUBSIDIARIES
NOTES TO THE CONDENSED CONSOLIDATED FINANCIAL STATEMENTS (UNAUDITED)—(Continued)
| ($ in thousands) | Predecessor Nine Months Ended September 30, 2015 |
|||||||||||
| Impact to Statement of Operations |
As previously classified |
Reclassification | As reclassified | |||||||||
| Cost of goods sold |
$ | 519,987 | $ | (79,448 | ) | $ | 440,539 | |||||
| Gross Profit |
$ | 88,977 | $ | 79,448 | $ | 168,425 | ||||||
| Selling, general, and administrative expenses |
$ | 60,863 | $ | 64,323 | $ | 125,186 | ||||||
| Depreciation and amortization |
$ | — | $ | 15,125 | $ | 15,125 | ||||||
Derivatives and Hedge Accounting—The Company has entered into derivative instruments to manage its exposure to certain financial risks. Certain derivative instruments are designated for hedge accounting under ASC 815-20, Derivatives—Hedging (“ASC 815-20”). Instruments that meet hedge criteria are formally designated as hedges at the inception of the instrument. The Company measures hedge effectiveness on a quarterly basis. The Company’s derivative instruments include a net investment hedge and embedded derivatives.
In August 2016, the Company entered into foreign exchange forward contracts. The foreign exchange forward contracts were designated as a net investment hedge in accordance with ASC 815-20. The effective portion of the gains and losses on net investment hedge transactions are reported in cumulative translation adjustment as a component of accumulated other comprehensive income (loss). To the extent the net investment hedge is ineffective, changes in value are recorded in earnings through the maturity date. Derivative financial instruments are recorded in the financial statements and measured at fair value.
The Company, together with FBM Finance, Inc., its wholly owned subsidiary, issued Senior Secured Notes (the “Notes”) on August 9, 2016 (see Note 9). The Notes have prepayment option features and the Revolver has mandatory payments of additional fees or compensation for reduced rates of return upon a change in law features. These features meet the definition of embedded derivatives and are bifurcated from the debt host and accounted for separately. The embedded derivatives are recorded at fair value at each reporting period with the change in fair value at each reporting date recorded in earnings.
The Company classifies the cash flows at settlement from derivatives in the same category as the cash flows from the related hedged items. For designated net investment hedges, the cash settlement is classified within the Net cash used in investing activities component of the condensed consolidated statements of cash flows. For undesignated hedges, the cash settlement is primarily classified within the Net cash provided by operating activities component of the condensed consolidated statements of cash flows. As of and for the nine months ended September 30, 2016, there is no cash flow settlement from the net investment hedge.
The Company’s derivative assets and liabilities are measured at fair value. Fair value related to the cash flows occurring within one year are classified as current and the fair value related to the cash flows occurring beyond one year are classified as non-current in the condensed consolidated balance sheets. For those instruments designated as hedges, the Company recognizes the changes in fair value in other comprehensive income (“OCI”), and recognizes any ineffectiveness immediately in earnings.
Valuation of derivative assets and liabilities reflect the value of the instrument including counterparty credit risk. These values also take into account the Company’s own credit standing.
F-48
Table of Contents
LSF9 CYPRESS HOLDINGS, LLC AND SUBSIDIARIES
NOTES TO THE CONDENSED CONSOLIDATED FINANCIAL STATEMENTS (UNAUDITED)—(Continued)
Foreign Currency Translation—Assets and liabilities of the Company’s foreign affiliates are translated at the exchange rate prevailing at the balance sheet date, while income and expenses are translated at average rates for the period. Translation gains and losses are reported as a component of other comprehensive income (loss).
Transaction gains and losses that arise from exchange rate fluctuations on transactions denominated in a currency other than the functional currency, except those transactions that have been designated as hedges of identifiable foreign currency commitments, are included in the results of operations as incurred.
Capital Lease—Leased property and equipment meeting capital lease criteria are capitalized at the lower of the present value of the related lease payments or the fair value of the leased asset at the inception of the lease. The corresponding liability is included in the balance sheet as other liabilities current and non-current. Leasehold improvements and assets under capital leases are amortized using the straight-line method over the shorter of their estimated useful lives or the initial term of the related lease.
Recently Adopted Accounting Standards
In August 2015, the Financial Accounting Standards Board, or FASB, issued Accounting Standards Update, or ASU 2015-03, Interest—Imputation of Interest (Subtopic 835-30): Simplifying the Presentation of Debt Issuance Costs, or ASU 2015-03. ASU 2015-03 amends current presentation guidance by requiring that debt issuance costs related to a recognized debt liability be presented in the balance sheet as a direct deduction from the carrying amount of that debt liability, consistent with debt discounts. Prior to the issuance of ASU 2015-03, debt issuance costs were required to be presented as an asset in the balance sheet. We retrospectively adopted the provisions of ASU 2015-03 upon issuance and prior period amounts have been reclassified to conform to the current period presentation. The adoption of ASU 2015-03 did not impact our consolidated financial position, results of operations or cash flows.
In addition, in August 2015, the FASB issued ASU 2015-15, Interest—Imputation of Interest (Subtopic 835-30): Presentation and Subsequent Measurement of Debt Issuance Costs Associated with Line-of-Credit Arrangements—Amendments to SEC Paragraphs Pursuant to Staff Announcement at June 18, 2015 EITF Meeting (SEC Update), or ASU 2015-15. ASU 2015-15 clarifies that companies may continue to present unamortized debt issuance costs associated with line of credit arrangements as an asset. This announcement came in response to questions that arose regarding revolving lines of credit, after the FASB issued ASU 2015-03. Prior to the issuance of ASU 2015-15, the Company’s consolidated financial statements reflected this presentation and therefore, the adoption of ASU 2015-15 did not impact the Company’s consolidated financial statements.
In September 2015, the FASB issued ASU 2015-16, Business Combinations (Topic 805): Simplifying the Accounting for Measurement-Period Adjustments, or ASU 2015-16. ASU 2015-16 eliminates the requirement to restate prior period financial statements for measurement period adjustments. The new guidance requires that the cumulative impact of a measurement period adjustment (including the impact on prior periods) be recognized in the reporting period in which the adjustment is identified. In addition, separate presentation on the
F-49
Table of Contents
LSF9 CYPRESS HOLDINGS, LLC AND SUBSIDIARIES
NOTES TO THE CONDENSED CONSOLIDATED FINANCIAL STATEMENTS (UNAUDITED)—(Continued)
face of the income statement or disclosure in the notes is required regarding the portion of the adjustment recorded in the current period earnings, by line item, which would have been recorded in previous reporting periods if the adjustment to the provisional amounts had been recognized as of the acquisition date. ASU 2015-16 is to be applied prospectively for measurement period adjustments that occur after the effective date. ASU 2015-16 is effective for annual reporting periods beginning after December 15, 2015, including interim periods within those fiscal years. The adoption of this ASU did not have a material impact on the Company’s financial statements.
In November 2015, the FASB issued ASU 2015-17, Income Taxes (Topic 740): Balance Sheet Classifications of Deferred Taxes. Companies are required to classify all deferred tax assets and liabilities as noncurrent on the balance sheet instead of separating deferred taxes into current and noncurrent amounts. Also, companies will no longer allocate valuation allowances between current and noncurrent deferred tax assets because those allowances also will be classified as noncurrent. The guidance is effective for financial statements issued for annual periods beginning after December 15, 2016, and interim periods within those annual periods. Companies can adopt the guidance either prospectively or retrospectively. The Company early adopted ASU 2015-17 and applied the new guidance for all periods presented.
Recently Issued Accounting Standards
In May 2014, the FASB issued ASU 2014-09, Revenue from Contracts with Customers (Topic 606), or ASU 2014-09. ASU 2014-09 amends the guidance for revenue recognition to replace numerous, industry-specific requirements. The core principle of the ASU is that an entity should recognize revenue for the transfer of goods or services equal to the amount that it expects to be entitled to receive for those goods or services. The ASU implements a five-step process for customer contract revenue recognition that focuses on transfer of control, as opposed to transfer of risk and rewards. The amendment also requires enhanced disclosures regarding the nature, amount, timing and uncertainty of revenues and cash flows arising from contracts with customers. Additional ASUs have been issued to amend or clarify the ASU as follows:
| • | ASU No. 2016-12 Revenue from Contracts with Customers (Topic 606): Narrow-Scope Improvements and Practical Expedients was issued in May 2016. ASU No. 2016-12 amends the new revenue recognition standard to clarify the guidance on assessing collectability, presenting sales taxes, measuring noncash consideration, and certain transition matters. |
| • | ASU No. 2016-10 Revenue from Contracts with Customers (Topic 606): Identifying Performance Obligations and Licensing was issued in April 2016. ASU No. 2016-10 addresses implementation issues identified by the FASB-International Accounting Standards Board Joint Transition Resource Group for Revenue Recognition (TRG). |
| • | ASU No. 2016-08 Revenue from Contracts with Customers (Topic 606): Principal versus Agent Considerations (Reporting Revenue Gross versus Net) was issued in March 2016. ASU No. 2016-08 requires an entity to determine whether the nature of its promise to provide goods or services to a customer is performed in a principal or agent capacity and to recognize revenue in a gross or net manner based on its principal/agent designation. |
F-50
Table of Contents
LSF9 CYPRESS HOLDINGS, LLC AND SUBSIDIARIES
NOTES TO THE CONDENSED CONSOLIDATED FINANCIAL STATEMENTS (UNAUDITED)—(Continued)
The guidance in these ASUs is effective for annual reporting periods beginning after December 15, 2017, including interim periods within that reporting period, and early adoption is permitted for interim and annual periods beginning after December 15, 2016. We are currently evaluating the impact of adopting ASU 2014-09, 2016-12, 2016-10 and 2016-08.
In August 2014, the FASB issued ASU 2014-15, Presentation of Financial Statements—Going Concern (Subtopic 205-40): Disclosures of Uncertainties about an Entity’s Ability to Continue as a Going Concern, or ASU 2014-15. ASU 2014-15 requires management to evaluate whether there are conditions or events that raise substantial doubt about the entity’s ability to continue as a going concern within one year after the date that the financial statements are issued or are available to be issued. This ASU also requires management to disclose certain information depending on the results of the going concern evaluation. The provisions of this ASU are effective for annual periods ending after December 15, 2016, including interim reporting periods thereafter. The Company is currently evaluating the impact of this accounting guidance and does not expect any significant impact on its consolidated financial statements.
In July 2015, the FASB issued ASU 2015-11, Simplifying the Measurement of Inventory, or ASU 2015-11, which applies to inventory valued at first-in, first-out (FIFO) or average cost. ASU 2015-11 requires inventory to be measured at the lower of cost and net realizable value, rather than at the lower of cost or market. ASU 2015-11 is effective on a prospective basis for annual periods beginning after December 15, 2016, and interim periods within those fiscal years. The Company reports inventory on an average-cost basis and thus will be required to adopt the standard; however, the provisions of ASU 2015-11 are not expected to have a material effect on the Company’s consolidated financial condition.
In February 2016, the FASB issued ASU 2016-02, Leases (Topic 842), or ASU 2016-02. ASU 2016-02 establishes a right-of-use model that requires a lessee to record a right-of-use asset and a lease liability on the balance sheet for all leases with terms longer than twelve months. Leases will be classified as either “finance” or “operating,” with classification affecting the pattern of expense recognition in the income statement. This update requires a modified retrospective transition as of the beginning of the earliest comparative period presented in the financial statements. This update is effective for fiscal years beginning after December 15, 2018, and interim periods within those fiscal years. Early adoption is permitted. The Company is currently evaluating the impact of this guidance on its consolidated financial statements.
In August 2016, the FASB issued ASU 2016-15, Statement of Cash Flows (Topic 230): Classification of Certain Cash Receipts and Cash Payments. ASU 2016-15 amended the existing accounting standards for the statement of cash flows. The amendments provide guidance on eight classification issues related to the statement of cash flows. This update is effective for fiscal years beginning after December 15, 2017, and interim periods within those fiscal years. Early adoption is permitted. The Company is currently evaluating the impact of this guidance on its consolidated financial statements.
3. ACQUISITIONS
Ken Builders Supply Inc.—On May 31, 2016, the Company acquired certain assets and the operations of Ken Builders Supply Inc. (“Ken API”) for $37.4 million. Ken API is a supplier of building materials to commercial and residential developers throughout Ohio, Kentucky, West
F-51
Table of Contents
LSF9 CYPRESS HOLDINGS, LLC AND SUBSIDIARIES
NOTES TO THE CONDENSED CONSOLIDATED FINANCIAL STATEMENTS (UNAUDITED)—(Continued)
Virginia, and central Indiana. In accordance with its acquisitive growth strategy, the Company determined that Ken API fit its need for a supplier with a presence in Ohio, Kentucky, West Virginia and central Indiana. The acquisition was accounted for as a business combination under the acquisition method of accounting. Accordingly, the assets acquired and liabilities assumed were recorded at fair value with the remaining purchase price recorded as goodwill. The Company estimated the fair value of the assets acquired and liabilities assumed as part of the business combination, including working capital, property and equipment, and customer relationships. The purchase price allocation for the acquisition is preliminary and subject to adjustment as additional information is obtained about facts and circumstances that existed as of the acquisition date.
Kent Gypsum Supply Inc.—On May 31, 2016, the Company acquired 100% of the capital stock of Kent Gypsum Supply Inc. (“Kent”) for $19.6 million of which purchase price was $19.2 million with an additional working capital adjustment of $0.4 million. Kent is a supplier of building materials to commercial and residential developers throughout western Washington. In accordance with its acquisitive growth strategy, the Company determined that Kent fit its need for a supplier with a presence in western Washington. The acquisition was accounted for as a business combination under the acquisition method of accounting. Accordingly, the assets acquired and liabilities assumed were recorded at fair value with the remaining purchase price recorded as goodwill. The Company estimated the fair value of the assets acquired and liabilities assumed as part of the business combination, including working capital, property and equipment, and customer relationships. The purchase price allocation for the acquisition is preliminary and subject to adjustment as additional information is obtained about facts and circumstances that existed as of the acquisition date.
Mid America Drywall Supply, Inc.—On April 29, 2016, the Company acquired certain assets and the operations of Mid America Drywall Supply, Inc. (“Mid America”) for $1.2 million in cash (including certain adjustments). Mid America is located Wichita Kansas. Mid America is a distributor of interior products such as wallboard, and other related products. The purchase price allocation for the acquisition is preliminary and subject to adjustment as additional information is obtained about facts and circumstances that existed as of the acquisition date.
Winroc Corporation—On August 9, 2016, the Company acquired 100% of the capital stock of Winroc-SPI Corporation, Superior Plus Construction Products Corp., and The Winroc Corporation (collectively referred to as “Winroc”) for cash consideration of $314.1 million, subject to customary working capital adjustments. Winroc is a supplier of building materials to commercial and residential developers throughout the United States and Canada. The acquisition was accounted for as a business combination under the acquisition method of accounting. Accordingly, the assets acquired and liabilities assumed are recorded at fair value with the remaining purchase price recorded as goodwill. The goodwill recognized was primarily attributable to synergies expected to arise after the acquisition, including expecting operating efficiencies and expansion opportunities. The purchase price allocation for the acquisition is preliminary and subject to adjustment as additional information is obtained about facts and circumstances that existed as of the acquisition date.
The Company funded the acquisition with the issuance of senior secured notes and a new revolving credit facility entered on August 9, 2016 (as further discussed in Note 7), a cash payment of $13.0 million and an equity contribution from Lone Star of $65.0 million.
F-52
Table of Contents
LSF9 CYPRESS HOLDINGS, LLC AND SUBSIDIARIES
NOTES TO THE CONDENSED CONSOLIDATED FINANCIAL STATEMENTS (UNAUDITED)—(Continued)
The following table summarizes the preliminary estimated fair values of the assets acquired and liabilities assumed as of the acquisition date based on the purchase price during the nine months ended September 30, 2016 ($ in thousands):
| Ken API | Kent | Mid America | Winroc | |||||||||||||
| Assets acquired: |
||||||||||||||||
| Cash |
$ | — | $ | 308 | $ | — | $ | — | ||||||||
| Accounts receivable |
10,472 | 2,820 | 445 | 125,531 | ||||||||||||
| Inventories |
6,424 | 1,690 | 99 | 73,316 | ||||||||||||
| Prepaids and other current assets |
349 | 80 | — | 3,889 | ||||||||||||
| Property and equipment |
7,948 | 2,652 | — | 53,768 | ||||||||||||
| Goodwill |
11,648 | 10,005 | 644 | 84,411 | ||||||||||||
| Intangible assets |
6,800 | 7,500 | 341 | 69,634 | ||||||||||||
| Other assets |
— | 169 | — | — | ||||||||||||
| Deferred tax asset |
— | — | — | 5,314 | ||||||||||||
|
|
|
|
|
|
|
|
|
|||||||||
| Total assets acquired |
43,641 | 25,224 | 1,529 | 415,863 | ||||||||||||
|
|
|
|
|
|
|
|
|
|||||||||
| Liabilities assumed: |
||||||||||||||||
| Accounts payable |
(3,890 | ) | (1,190 | ) | (303 | ) | (86,936 | ) | ||||||||
| Accrued expenses and other current liabilities |
(1,327 | ) | (1,192 | ) | (33 | ) | (4,455 | ) | ||||||||
| Deferred income taxes |
— | (3,227 | ) | — | — | |||||||||||
| Long term liabilities |
(982 | ) | — | — | (10,298 | ) | ||||||||||
|
|
|
|
|
|
|
|
|
|||||||||
| Total liabilities assumed |
(6,199 | ) | (5,609 | ) | (336 | ) | (101,689 | ) | ||||||||
|
|
|
|
|
|
|
|
|
|||||||||
| Total net assets acquired |
$ | 37,442 | $ | 19,615 | $ | 1,193 | $ | 314,174 | ||||||||
|
|
|
|
|
|
|
|
|
|||||||||
The excess of purchase price over the fair value amounts assigned to the assets acquired and liabilities assumed represents the goodwill amount resulting from the acquisitions. Goodwill attributable to the acquisitions has been recorded as a non-current asset and is not amortized, but is subject to review at least on an annual basis for impairment. Goodwill recognized was primarily attributable to expected operating efficiencies and expansion opportunities in the business acquired. Goodwill and intangible assets recognized from the acquisitions are expected to be deductible for tax purposes with the exception of Kent. The Ken API and Mid America acquisitions will be treated as an asset purchase for tax purposes and Kent and Winroc will be treated as a stock acquisition for tax purposes.
The purchase price allocations are still preliminary and the Company expects to record a material amount related to deferred tax liabilities during the quarter ended December 31, 2016.
The operating results of the acquisitions have been included in the condensed consolidated statements of operations from their acquisition dates through September 30, 2016. The acquired entities contributed $144.3 million in net sales and $3.3 million in net loss for the period.
Supplemental Unaudited Pro Forma Information
In accordance with ASC 805, the following information for the nine months ended September 30, 2016 and 2015 presents the results of operations of the Company as if the 2016 acquisitions occurred as of January 1, 2015. The disclosure also reflects the 2015 acquisitions,
F-53
Table of Contents
LSF9 CYPRESS HOLDINGS, LLC AND SUBSIDIARIES
NOTES TO THE CONDENSED CONSOLIDATED FINANCIAL STATEMENTS (UNAUDITED)—(Continued)
which are disclosed in the financial statements, as if they occurred as of January 1, 2014. The supplemental pro forma information has been adjusted to include:
| • | the pro forma impact of additional amortization and depreciation related to the fair value of acquired tangible and intangible assets, |
| • | the pro forma impact of acquisition costs which consisted of legal, advisory, and due diligence fees and expenses, |
| • | the pro forma impact to conform accounting for leases in the Winroc-SPI historical financial statements presented under IFRS to GAAP, inclusive of adjustments for rent expense and interest expense, |
| • | the pro forma impact of interest expense related to additional borrowings incurred as part of the acquisition and |
| • | the pro forma tax effect of the pro forma adjustments, calculated using a tax rate of 35%. |
The Company incurred charges related to the inventory fair value adjustment and acquisition related expenses of $6.4 million and $12.5 million, respectively, for the nine months ended September 30, 2016. These expenses are reflected in pro forma earnings for the period ended September 30, 2015.
The pro forma results are presented for illustrative purposes only and are not necessarily indicative of, or intended to represent, the results that would have been achieved had the various acquisitions been completed on the dates indicated. For example, the pro forma results do not reflect any operating efficiencies and associated cost savings that the Company might have achieved with respect to the acquisitions ($ in thousands).
| Nine Months Ended September 30, |
||||||||||||
| (Successor) 2016 |
(Predecessor) 2015 |
|||||||||||
| (Unaudited) | (Unaudited) | |||||||||||
| Net sales |
$ | 1,428,033 | $ | 1,265,055 | ||||||||
| Net Income (loss) |
$ | (8,999 | ) | $ | (26,794 | ) | ||||||
4. GOODWILL AND INTANGIBLE ASSETS
Identifiable intangible assets that are separable and have determinable useful lives are valued separately and amortized over their benefit period. The following is the gross carrying value and accumulated amortization by a reconciliation of the beginning and ending balances of the Company’s goodwill and identifiable intangible assets as of September 30, 2016 and December 31, 2015 ($ in thousands):
| September 30, 2016 | ||||||||||||
| Gross Carrying Amount |
Accumulated Amortization |
Net Carrying Amount |
||||||||||
| Goodwill |
$ | 396,532 | $ | — | $ | 396,532 | ||||||
| Trade names |
15,980 | 3,252 | 12,728 | |||||||||
| Customer relationships |
223,787 | 25,582 | 198,205 | |||||||||
| Leases under market rent |
3,845 | 348 | 3,497 | |||||||||
|
|
|
|
|
|
|
|||||||
| $ | 640,144 | $ | 29,182 | $ | 610,962 | |||||||
|
|
|
|
|
|
|
|||||||
F-54
Table of Contents
LSF9 CYPRESS HOLDINGS, LLC AND SUBSIDIARIES
NOTES TO THE CONDENSED CONSOLIDATED FINANCIAL STATEMENTS (UNAUDITED)—(Continued)
| December 31, 2015 | ||||||||||||
| Gross Carrying Amount |
Accumulated Amortization |
Net Carrying Amount |
||||||||||
| Goodwill |
$ | 289,086 | $ | — | $ | 289,086 | ||||||
| Trade names |
15,980 | 724 | 15,256 | |||||||||
| Customer relationships |
140,920 | 4,378 | 136,542 | |||||||||
| Leases under market rent |
2,755 | 95 | 2,660 | |||||||||
|
|
|
|
|
|
|
|||||||
| $ | 448,741 | $ | 5,197 | $ | 443,544 | |||||||
|
|
|
|
|
|
|
|||||||
The weighted average amortization period of these intangible assets in the aggregate is 5.9 years. Total amortization expense of intangible assets above was $24.0 million during the nine months ended September 30, 2016 (Successor), respectively, as compared to $7.5 million during the nine months September 30, 2015 (Predecessor), respectively.
The following table summarizes the life of the intangible assets acquired for the nine months ended September 30, 2016 and the year ended December 31, 2015:
| Trade names |
1—5 years | |||
| Customer relationships |
5—6 years | |||
| Leases under market rent |
1—13 years |
Goodwill at September 30, 2016, consisted of the following ($ in thousands):
| Carrying Value | ||||
| Balance at January 1, 2016 |
$ | 289,086 | ||
| Goodwill acquired |
106,708 | |||
| Purchase price adjustment |
738 | |||
|
|
|
|||
| Balance at September 30, 2016 |
$ | 396,532 | ||
|
|
|
|||
5. INCOME TAXES
The Company recognized an income tax benefit of $5.4 million for the nine months ended September 30, 2016, compared to an income tax benefit of $1.3 million for the nine months ended September 30, 2015.
The Company’s effective tax rate was 21.5% for the nine months ended September 30, 2016 and 126.6% for the nine months ended September 30, 2015. The tax rate for the nine months ended September 30, 2016 and 2015, varied from the statutory tax rate of 35% primarily due to non-deductible transaction costs.
Tax benefits from uncertain tax positions are recognized if it is more likely than not that the position is sustainable based solely on its technical merits. The Company concluded that there were no uncertain tax positions identified during its analysis at September 30, 2016.
The Company recognizes interest and penalties related to unrecognized tax positions within the income tax benefit line in the accompanying condensed consolidated statements of
F-55
Table of Contents
LSF9 CYPRESS HOLDINGS, LLC AND SUBSIDIARIES
NOTES TO THE CONDENSED CONSOLIDATED FINANCIAL STATEMENTS (UNAUDITED)—(Continued)
operations. There were no accrued interest and penalties associated with uncertain tax positions as of September 30, 2016, and December 31, 2015.
The Company does not anticipate a significant change in its uncertain tax positions over the next 12 months.
The Company is subject to taxation in the United States and various state jurisdictions and Canada and various provinces. As of September 30, 2016, the Company is only subject to federal tax authority examinations from 2011 forward and to state tax authority examination from 2010 forward.
6. PROPERTY AND EQUIPMENT
Property and equipment as of September 30, 2016, and December 31, 2015, consisted of the following ($ in thousands):
| September 30, 2016 |
December 31, 2015 |
|||||||
| Land |
$ | 10,469 | $ | 2,590 | ||||
| Buildings and leasehold improvements |
21,420 | 13,918 | ||||||
| Vehicles and equipment |
82,648 | 36,672 | ||||||
| Construction in progress |
20,068 | 1,774 | ||||||
| Furniture and fixtures |
3,874 | 636 | ||||||
| Machinery and equipment |
17,981 | 12,533 | ||||||
|
|
|
|
|
|||||
| Property and equipment—gross |
156,460 | 68,123 | ||||||
| Less accumulated depreciation |
11,453 | 1,982 | ||||||
|
|
|
|
|
|||||
| Property and equipment—net |
$ | 145,007 | $ | 66,141 | ||||
|
|
|
|
|
|||||
Depreciation expense for property and equipment was $9.6 million for the nine months ended September 30, 2016 (Successor). For the nine months ended September 30, 2015 (Predecessor), depreciation expense for property and equipment was $7.6 million.
7. ASSET-BASED CREDIT FACILITY AND NOTES PAYABLE
Notes payable consisted of the following at September 30, 2016 and December 31, 2015 ($ in thousands):
| September 30 2016 |
December 31, 2015 |
|||||||
| Senior secured note |
$ | 575,000 | $ | 0 | ||||
| Senior lien term loan |
0 | 245,000 | ||||||
| Junior lien term loan |
0 | 80,000 | ||||||
| Unamortized debt issuance costs and debt discount |
(51,597 | ) | (23,193 | ) | ||||
| Less: current portion of notes payable—net |
0 | (1,492 | ) | |||||
|
|
|
|
|
|||||
| Long-term portion of notes payable—net |
$ | 523,403 | $ | 300,315 | ||||
|
|
|
|
|
|||||
F-56
Table of Contents
LSF9 CYPRESS HOLDINGS, LLC AND SUBSIDIARIES
NOTES TO THE CONDENSED CONSOLIDATED FINANCIAL STATEMENTS (UNAUDITED)—(Continued)
September 30, 2016
Senior Secured Notes Due 2021
On August 9, 2016, the Company, together with FBM Finance, Inc., its wholly owned subsidiary (together, the “Issuers”) which was created for the purpose of issuing the Notes, issued $575 million in aggregate principal amount of 8.25% senior secured notes due 2021 (the “Notes”) at an issue price of 100% of the principal amount of the Notes in a private placement for resale to “qualified institutional buyers” as defined in Rule 144A under the Securities Act of 1933, as amended (“Securities Act”) and in offshore transactions pursuant to Regulation S under the Securities Act.
The Notes are senior secured obligations that have priority over certain collateral of the Issuers and the guarantors of the Notes and are effectively subordinated to the obligations under the Revolver (described below) in respect of certain other collateral of the Issuers and the guarantors of the Notes. The Notes are fully and unconditionally guaranteed on a senior secured basis, jointly and severally, by LSF9 Cypress Parent, LLC (“Parent”) and each of Parent’s domestic wholly owned restricted subsidiaries (other than certain excluded subsidiaries) (the “guarantors”).
The Notes will mature on August 15, 2021 and bear interest at an annual rate of 8.25%. Interest on the Notes is payable semi-annually in arrears in February and August of each year, commencing February 2017. The Notes are governed by an indenture, dated August 9, 2016, among the Issuers, the guarantors and Wilmington Trust, National Association, as trustee (the “Indenture”).
The Issuers may, at their option, redeem all or a portion of the Notes at any time on or after August 15, 2018 at the applicable redemption prices specified in the Indenture, plus any accrued and unpaid interest to, but excluding, the applicable redemption date. The Issuers are also entitled to redeem up to 40% of the aggregate principal amount of the Notes before August 15, 2018 with the net cash proceeds that the Issuers receive from certain equity offerings at a redemption price equal to 108.25% of the principal amount of the Notes, plus accrued and unpaid interest, if any, to, but excluding, the applicable redemption date. In addition, before August 15, 2018, the Issuers may redeem all or a portion of the Notes, at a redemption price equal to 100% of the principal amount thereof, plus a “make-whole” premium and accrued and unpaid interest, if any, to, but excluding, the applicable redemption date.
Upon certain kinds of changes of control, holders of the Notes have the right to require the Issuers to repurchase all or any portion of such holder’s Notes at 101% of the principal amount of the notes being repurchased, plus any accrued and unpaid interest to, but excluding, the date of repurchase.
ABL Credit Agreement
On August 9, 2016, the Company entered into a new revolving credit facility (the “Revolver”) with Goldman Sachs Bank USA as administrative agent, which matures on February 9, 2021. The Revolver bears interest, at the Company’s option, at either a Eurodollar rate or an alternate base rate plus an applicable margin. Based on the historical excess availability under the Revolver, the margin can range from 1.25% to 1.75% per annum in the
F-57
Table of Contents
LSF9 CYPRESS HOLDINGS, LLC AND SUBSIDIARIES
NOTES TO THE CONDENSED CONSOLIDATED FINANCIAL STATEMENTS (UNAUDITED)—(Continued)
case of Eurodollar rate loans and 0.25% to 0.75% per annum in the case of alternate base rate loans. The available borrowing capacity, or borrowing base, is derived from a percentage of the Company’s eligible receivables and inventory in both the United States and Canada, as defined in the agreement, subject to certain reserves, with a $75 million sublimit on the Canadian borrowing base. As of the closing of the Revolver, the available borrowing capacity was $250 million. A variable commitment fee, ranging from 0.25% to 0.375% and currently 0.25% per annum, is charged on the unused amount of the Revolver based on quarterly average loan utilization. Letters of credit under the Revolver are assessed at a rate equal to the applicable Eurodollar margin currently 1.50% as well as a fronting fee at a rate of 0.125% per annum.
These fees are payable quarterly in arrears at the end of March, June, September, and December. In addition, an administrative agent fee of $75,000 for the Revolver is due and payable each year in quarterly installments on the last day of each quarter. The Revolver is a senior secured obligation of the Company, with priority over certain collateral of the Company and its subsidiaries. There are no prepayment premiums associated with the Revolver.
In connection with the entry into the Revolver and issuance of the Notes, the Company paid off and terminated the existing Senior Lien Term Loan Credit Agreement, Junior Lien Term Loan Credit Agreement and ABL Credit Agreement that were entered into on October 9, 2015. The Company accounted for the refinancing of the existing credit facilities as a debt modification with respect to amounts that remained in the syndicate and a debt extinguishment with respect to amounts that exited the syndicate. This resulted in a loss on extinguishment of debt of $7.0 million which has been reflected as a component of interest expense within the statement of operations.
On September 23, 2016, the Company entered into an Incremental Facility Amendment which extended borrowing commitments under the initial credit agreement by an additional $50 million, resulting in total borrowing capacity of $300 million. As of September 30, 2016, the Company has $190.0 million outstanding under the Revolver and is in compliance with all debt covenants.
December 31, 2015
2015 Credit Facility
On October 9, 2015, the Company entered into a secured credit facility with a syndicate of lenders that consists of a Senior Lien Term Loan Credit Agreement (“SLCA”), Junior Lien Term Credit Agreement (JLCA), and an ABL Credit Agreement (“ABL”) with commitments of $245 million for the SLCA and $80 million as part of the JLCA (“Term Loans”) and under the ABL, a $5 million letter of credit and a revolving credit facility of $50 million. On December 30, 2015, the Company entered into the Incremental Facility Amendment to the ABL Credit Agreement (“ABL Amendment”) extending the revolving credit facility to $100 million. Collectively, the Term Loans, ABL, and ABL Amendment represent the “2015 credit facility”. The 2015 credit facility was used for working capital and general corporate purposes, as well as to finance acquisition related business activities.
The 2015 credit facility bears interest, at the Company’s option, at either a Eurodollar adjusted LIBOR rate or an alternate base rate based upon the prime rate, the federal funds effective rate or the adjusted LIBOR rate, plus 1%, plus, an applicable margin specific to each of
F-58
Table of Contents
LSF9 CYPRESS HOLDINGS, LLC AND SUBSIDIARIES
NOTES TO THE CONDENSED CONSOLIDATED FINANCIAL STATEMENTS (UNAUDITED)—(Continued)
the SLCA, JLCA, or ABL revolver. The margin in either case is based on a measure of availability under the 2015 credit facility. Interest on alternate base rate loans is due on the last business day of March, September, September, and December commencing on December 31, 2015. Interest on Eurodollar loans is due and payable at least every three months.
Beginning March 31, 2016, the SLCA has mandatory principal repayments of $0.6 million, which are payable in March, September, September, and December each year. An administrative agent fee of $75,000 for the JLCA is due and payable each year in quarterly installments on the last day of each quarter (Note 10).
All obligations under the 2015 credit facility will be guaranteed jointly and severally by the Company and its subsidiaries. All obligations and the guarantees of those obligations will be secured by substantially all of the assets of the Company and the guarantors.
The 2015 credit facility contains restrictive covenants which, among other things, limit the Company’s ability to incur additional indebtedness, incur liens, engage in mergers or other fundamental changes, sell certain assets, pay dividends, make acquisitions or investments, prepay certain indebtedness, change the nature of the Company’s business, and engage in certain transactions with affiliates, respectively. In addition, the 2015 credit facility also contains a financial covenant requiring the satisfaction of a minimum fixed charge ratio of 1 to 1 in the event that the Company does not meet a minimum measure of availability. The minimum measure of availability is triggered at any time the Company fails to maintain excess availability of at least the greater of 10% of availability and $5.0 million at any time. In connection with the entry into the Revolver and issuance of the Notes, the Company paid off and terminated the existing Senior Lien Term Loan Credit Agreement, Junior Lien Term Loan Credit Agreement and ABL Credit Agreement
8. RELATED PARTIES
Holdings previously paid management fees and certain expenses to an affiliate of its former parent CI (FBM), Holdings, LLC (“CIFBM”). For the nine months ended September 30, 2015 (Predecessor), management fees and expenses was $1.0 million. Holdings reports these management fees and expenses in selling, general, and administrative expenses in the condensed consolidated statements of operations.
The Company currently pays management fees and certain expenses to an affiliate of its parent, Lone Star Fund, IX. Total management fees were $2.4 million for the nine months ended September 30, 2016 (Successor).
The Company leases approximately 15 facilities from related parties. Amounts recognized in the statement of operations as rent expense related to these 15 facilities for the nine months ended September 30, 2016 (Successor), and September 30, 2015 (Predecessor), were $1.2 million and $1.6 million, respectively.
In addition, the Company sells products to another affiliate company that is owned by one of its shareholders. Total sales for the nine months ended September 30, 2016 (Successor), and September 30, 2015 (Predecessor), were $0.5 million and $0.6 million, respectively. There were $0.1 million and $0.2 million in accounts receivable balances as of September 30, 2016 and December 31, 2015, respectively.
F-59
Table of Contents
LSF9 CYPRESS HOLDINGS, LLC AND SUBSIDIARIES
NOTES TO THE CONDENSED CONSOLIDATED FINANCIAL STATEMENTS (UNAUDITED)—(Continued)
9. DERIVATIVES AND HEDGING ACTIVITIES
The Company uses derivatives to manage selected foreign exchange exposures for its investments in foreign subsidiaries. In general, the types of risks hedged are those relating to the variability of future earnings and cash flows caused by movements in foreign currency exchange rates and interest rates. The Company documents its risk management strategy and hedge effectiveness at the inception of and during the term of each hedge.
Net Investment Hedge
As of September 30, 2016, the amount of notional foreign exchange contracts outstanding was approximately $88.0 million. There is no significant credit risk associated with the potential failure of any counterparty to perform under the terms of any derivative financial instrument.
The net investment hedge is measured at fair value within the consolidated balance sheet either as an asset or a liability. As of September 30, 2016, the fair value of the derivative instrument was $1.2 million and was recorded in non-current other assets.
For the nine months ended September 30, 2016, the Company recognized a gain of $0.7 million, net of tax, recorded in comprehensive income (loss). The Company also recorded the ineffective portion of the gain relating to the net investment hedge for the nine months ended September 30, 2016 totaling $48,000 in other income. The Company did not have derivative instruments during the nine months ended September 30, 2015.
Embedded Derivative
The Company has the option to prepay the Notes at any time prior to August 15, 2018 at a price equal to 100% of the principal amount, plus the applicable premium and any accrued and unpaid interest. Redemption on and after August 15 of the subsequent years are subject to the premiums as defined in the Notes Offering Circular.
Prior to August 15, 2018, in the event of equity offerings, the Company has the option to prepay 40% of the Notes using the proceeds from such offering within 180 days from closing of the offering. However, 50% of the principal needs to remain outstanding. The redemption price is determined at 108.25% plus accrued and unpaid interest.
The optional prepayment subsequent to an equity offering constitutes an embedded derivative and is bifurcated from the debt host and accounted for separately. The embedded derivative is recorded at fair value at inception and on an ongoing basis, with any changes in fair value recorded in earnings. As of September 30, 2016, the embedded derivative was $6.1 million and was included in the balance sheet as non-current other liabilities. The change in fair value in the amount of $0.1 million for the nine months ended September 30, 2016 was included in statements of operations and other comprehensive income (loss) as other income.
The Revolver requires the Company to pay additional fees or compensation for reduced rates of return upon a change in law. These mandatory payment features meet the definition of embedded derivatives that are bifurcated from the debt host and are accounted for separately. These derivatives do not have material value due to the probability of triggering a change in law is remote.
F-60
Table of Contents
LSF9 CYPRESS HOLDINGS, LLC AND SUBSIDIARIES
NOTES TO THE CONDENSED CONSOLIDATED FINANCIAL STATEMENTS (UNAUDITED)—(Continued)
10. UNAUDITED PRO FORMA NET LOSS PER SHARE AND UNAUDITED PRO FORMA BALANCE SHEET
The pro forma earnings per share data for the nine months ended September 30, 2016 is based on our historical combined statement of operations after giving effect to the following as if they occurred at the beginning of the period: (1) a reorganization consolidating all entities under a new parent entity (Foundation Building Materials, Inc.); and (2) a 29,974.239 to 1 stock split with respect to the common stock of Foundation Building Materials, Inc. that will occur prior to the effective date of the registration statement.
| Nine Months Ended September 30, 2016 |
||||
| Net loss attributable to common share holders |
$ | (19,566 | ) | |
| Historical outstanding common shares of the combined entity |
— | |||
| Effect of reorganization, issuance of shares and stock split |
29,974,239 | |||
| Pro forma basic weighted average outstanding common shares |
29,974,239 | |||
| Pro forma diluted weighted average outstanding common shares |
29,974,239 | |||
| Pro forma Loss per share |
||||
| Basic |
(0.65 | ) | ||
| Diluted |
(0.65 | ) | ||
Upon completion of this offering, the Company will enter into a tax receivable agreement that will provide for the payment by us to Lone Star of 90% of the amount of cash savings, if any, in U.S. federal, state, local and non-U.S. income tax that we realize (or in some circumstances are deemed to realize) as a result of the utilization of our and our subsidiaries’ (i) depreciation and amortization deductions, and any offset to taxable income and gain or increase to taxable loss, resulting from the tax basis we have in our assets at the consummation of this offering, (ii) net operating losses, (iii) tax credits and (iv) certain other tax attributes. The unaudited pro forma condensed combined consolidated balance sheet as of September 30, 2016 has been prepared to give effect to the tax receivable agreement liability as if it has occurred or existed on September 30, 2016. The unaudited pro forma condensed combined consolidated balance sheet does not reflect any proceeds of this offering.
11. ACCUMULATED OTHER COMPREHENSIVE INCOME
Accumulated other comprehensive income (“AOCI”) consists of cumulative unrealized foreign currency translation adjustments and unrealized gains on certain derivative instruments.
The components of AOCI, net of tax, for the nine-month period ended September 30, 2016 were as follows ($ in thousands):
| Cumulative unrealized foreign currency translation gains |
Unrealized gains on derivatives |
Total | ||||||||||
| Balance at December 31, 2015 |
$ | — | $ | — | $ | — | ||||||
| Other comprehensive income |
153 | 722 | 875 | |||||||||
|
|
|
|
|
|
|
|||||||
| Balance at September 30, 2016 |
$ | 153 | $ | 722 | $ | 875 | ||||||
|
|
|
|
|
|
|
|||||||
F-61
Table of Contents
LSF9 CYPRESS HOLDINGS, LLC AND SUBSIDIARIES
NOTES TO THE CONDENSED CONSOLIDATED FINANCIAL STATEMENTS (UNAUDITED)—(Continued)
12. FAIR VALUE MEASUREMENT
The Company’s financial instruments consist primarily of cash and cash equivalents, trade and other receivables, derivative instruments, accounts payable, long-term debt and accrued liabilities. The carrying value of the Company’s trade receivables, trade payables, the asset based revolver and accrued liabilities approximates fair value due to their short-term maturity. The Company may adjust the carrying amount of certain nonfinancial assets to fair value on a non-recurring basis when they are impaired.
The estimated carrying amount and fair value of the Company’s financial instruments and other assets and liabilities measured and recorded at fair value on a recurring basis is as follows for the dates indicated ($ in thousands):
| Fair Value Measurements at September 30, 2016 | ||||||||||||||||
| Quoted Prices in Active Markets for Identical Assets (Level 1) |
Significant Other Observable Inputs (Level 2) |
Significant Unobservable Inputs (Level 3) |
Total Fair Value |
|||||||||||||
| Recurring: |
||||||||||||||||
| Non-current asset (liabilities) |
||||||||||||||||
| Derivative asset (Note 9) |
$ | — | $ | 1,213 | $ | — | $ | 1,213 | ||||||||
| Derivative (liability) (Note 9) |
$ | — | $ | (6,100 | ) | $ | — | $ | (6,100 | ) | ||||||
The fair values of derivative assets and liabilities are determined using quantitative models that utilize multiple market inputs including interest rates and exchange rates to generate continuous yield or pricing curves and volatility factors to value the position. The majority of market inputs are actively quoted and can be validated through external sources, including brokers, market transactions and third-party pricing services. The fair values of derivative assets and liabilities include adjustments for market liquidity, counterparty credit quality and other instrument-specific factors, where appropriate. In addition, the Company incorporates within its fair value measurements a valuation adjustment to reflect the credit risk associated with the net position. Positions are netted by counterparties, and fair value for net long exposures is adjusted for counterparty credit risk while the fair value for net short exposures is adjusted for the Company’s own credit risk.
The estimated carrying amount and fair value of the Company’s financial instruments and liabilities for which fair value is only disclosed is as follows ($ in thousands):
| Fair Value Measurements at September 30, 2016 | ||||||||||||||||||||
| Carrying Amount |
Quoted Prices in Active Markets for Identical Assets (Level 1) |
Significant Other Observable Inputs (Level 2) |
Significant Unobservable Inputs (Level 3) |
Total Fair Value |
||||||||||||||||
| Senior secured note |
$ | 523,403 | $ | — | $ | 599,100 | $ | — | $ | 599,100 | ||||||||||
The fair value of debt is the estimated amount the Company would have to repay its debt, including any premium or discount attributable to the difference between the stated interest rate and market rate of interest at the balance sheet date. Fair values are supported by observable market transactions when available.
F-62
Table of Contents
LSF9 CYPRESS HOLDINGS, LLC AND SUBSIDIARIES
NOTES TO THE CONDENSED CONSOLIDATED FINANCIAL STATEMENTS (UNAUDITED)—(Continued)
13. SEGMENTS
Segment information is presented in accordance with ASC 280, Segment Reporting, which establishes standards for reporting information about operating segments. It also establishes standards for related disclosures about customers, products and geographic areas. Operating segments are defined as components of an enterprise that engage in business activities that earn revenues, incur expenses and prepare separate financial information that is evaluated regularly by the Company’s CODM in order to allocate resources and assess performance. Resources are allocated and performance is assessed by our CEO whom we have determined to be our CODM.
Based on the provisions of ASC 280, the Company has defined its operating segments by considering management structure and product offerings. Operating segments have been aggregated into reportable segments based upon their similar economic characteristics, nature of products, type of customers, and distribution methods. This evaluation resulted in the following reportable segments:
| • | Specialty Building Products—Specialty building products (“SBP”) distributes wallboard and accessories, metal framing, suspended ceiling systems and other products. Other products include stucco and EIFS, as well as complimentary offerings, such as tools, safety accessories and fasteners. The primary end markets served are new non-residential, new residential and non-residential repair and remodel construction markets. |
| • | Mechanical Insulation—Mechanical insulation (“MI”) distributes commercial and industrial insulation for pipes and mechanical systems and the primary end markets served are new non-residential construction, non-residential repair and remodel construction and industrial markets. |
In addition to the two reportable segments, the Company’s consolidated results include corporate activities, which include depreciation and amortization.
For purposes of evaluation under these segment reporting principles, the CODM assesses the Company’s ongoing performance based on the periodic review of net sales, gross margin, and certain other measures for each of the operating segments. The Company has not disclosed asset information by segment as its CODM does not use such information for purposes of allocating resources and assessing performance.
F-63
Table of Contents
LSF9 CYPRESS HOLDINGS, LLC AND SUBSIDIARIES
NOTES TO THE CONDENSED CONSOLIDATED FINANCIAL STATEMENTS (UNAUDITED)—(Continued)
The following tables present Net sales, Gross margin, and certain other measures for each reportable segment:
| Nine months ended September 30, 2016 | ||||||||||||
| Net Sales | Gross Margin |
Depreciation & Amortization |
||||||||||
| Specialty Building Products |
$ | 893,041 | $ | 256,734 | $ | 9,204 | ||||||
| Mechanical Insulation |
37,274 | 7,814 | 415 | |||||||||
| Corporate and Other |
— | — | 23,986 | |||||||||
|
|
|
|
|
|
|
|||||||
| Consolidated |
$ | 930,315 | $ | 264,548 | $ | 33,605 | ||||||
|
|
|
|
|
|
|
|||||||
| Total segment gross margin |
$ | 264,548 | ||||||||||
| Total operating expenses |
252,363 | |||||||||||
| Interest expense |
(37,202 | ) | ||||||||||
| Other income |
93 | |||||||||||
|
|
|
|||||||||||
| Loss before income taxes |
$ | (24,924 | ) | |||||||||
|
|
|
|||||||||||
| Nine months ended September 30, 2015 | ||||||||||||
| Net Sales | Gross Margin |
Depreciation & Amortization |
||||||||||
| Specialty Building Products |
$ | 608,964 | $ | 168,425 | $ | 7,575 | ||||||
| Mechanical Insulation |
— | — | — | |||||||||
| Corporate and Other |
— | 7,550 | ||||||||||
|
|
|
|
|
|
|
|||||||
| Consolidated |
$ | 608,964 | $ | 168,425 | $ | 15,125 | ||||||
|
|
|
|
|
|
|
|||||||
| Total segment gross margin |
$ | 168,425 | ||||||||||
| Total operating expenses |
153,769 | |||||||||||
| Interest expense |
(15,717 | ) | ||||||||||
| Other income |
14 | |||||||||||
|
|
|
|||||||||||
| Loss before income taxes |
$ | (1,047 | ) | |||||||||
|
|
|
|||||||||||
Revenues are attributed to each country based on the location in which sales originate and in which assets are located. The following table provides information about the Company by geographic areas.
| Net Sales | Fixed Assets | |||||||
| Canada |
$ | 31,599 | $ | 17,876 | ||||
| United States |
898,716 | 127,131 | ||||||
|
|
|
|
|
|||||
| $ | 930,315 | $ | 145,007 | |||||
|
|
|
|
|
|||||
F-64
Table of Contents
LSF9 CYPRESS HOLDINGS, LLC AND SUBSIDIARIES
NOTES TO THE CONDENSED CONSOLIDATED FINANCIAL STATEMENTS (UNAUDITED)—(Continued)
For the nine months ended September 30, 2016, no customer comprised more than 10% of net sales. The Company’s net sales from external customers by main product line are as follows:
| Successor | Predecessor | |||||||||||
| Nine Months Ended September 30, 2016 |
Nine Months Ended September 30, 2015 |
|||||||||||
| Wallboard & Accessories |
$ | 450,756 | $ | 310,709 | ||||||||
| Metal Framing |
157,374 | 106,545 | ||||||||||
| Suspended Ceiling Systems |
119,270 | 72,827 | ||||||||||
| Other Products |
181,207 | 119,084 | ||||||||||
| Commercial and Industrial Insulation |
28,296 | — | ||||||||||
|
|
|
|
|
|||||||||
| Total Gross Sales |
$ | 936,903 | $ | 609,165 | ||||||||
|
|
|
|
|
|||||||||
| Surcharges and Discounts |
(6,588 | ) | (201 | ) | ||||||||
|
|
|
|
|
|||||||||
| Total Net Sales |
$ | 930,315 | $ | 608,964 | ||||||||
|
|
|
|
|
|||||||||
14. COMMITMENTS AND CONTINGENCIES
The Company is involved in certain legal actions arising in the ordinary course of business. Management believes that such litigation and claims will be resolved without material effect on the Company’s consolidated financial position.
As of September 30, 2016, there were no proceedings or litigation involving the Company that management believes would have a material adverse impact on its business, financial position, results of operations, or cash flows.
15. SUBSEQUENT EVENTS
United Drywall Supply, Inc. Acquisition
On November 30, 2016, the Company acquired the assets of United Drywall Supply, Inc. (“United Drywall Supply”) for $29 million subject to normal working capital adjustments. United Drywall Supply is a supplier of building materials to commercial and residential developers in the Atlanta, Georgia metropolitan area. The Acquisition will be accounted for as a business combination under the acquisition method of accounting. Accordingly, the assets acquired and liabilities assumed will be recorded at fair value with the remaining purchase price recorded as goodwill.
Management has performed an analysis of activities and transactions subsequent to September 30, 2016 through December 9, 2016, which is the date the financial statements were issued, to determine the need for any adjustments to or disclosures within these financial statements for the nine months ended September 30, 2016 and has determined that there are no other subsequent events requiring disclosure.
F-65
Table of Contents
Construction Products Distribution
For the years ended December 31, 2015, 2014, and 2013
F-66
Table of Contents

|
Deloitte LLP Suite 700 850—2nd Street SW Calgary AB T2P 0R8
Tel: (403) 267-1700 Fax: (587) 774-5379 |
To the Directors of Superior Plus Corp.
We have audited the accompanying combined financial statements of Construction Products Distribution, which comprise the combined balance sheets as at December 31, 2015, December 31, 2014 and December 31, 2013, and the combined statements of changes in owners’ net investment, combined statements of net earnings and total comprehensive loss, and combined statements of cash flows for the years then ended, and related notes to the combined financial statements.
Management’s Responsibility for the Combined Financial Statements
Management is responsible for the preparation and fair presentation of these combined financial statements in accordance with International Financial Reporting Standards as issued by the International Accounting Standards Board this includes the design, implementation, and maintenance of internal control relevant to the preparation and fair presentation of combined financial statements that are free from material misstatement, whether due to fraud or error.
Auditors’ Responsibility
Our responsibility is to express an opinion on these combined financial statements based on our audits. We conducted our audits in accordance with auditing standards generally accepted in the United States of America. Those standards require that we plan and perform the audit to obtain reasonable assurance about whether the combined financial statements are free from material misstatement.
An audit involves performing procedures to obtain audit evidence about the amounts and disclosures in the combined financial statements. The procedures selected depend on the auditor’s judgment, including the assessment of the risks of material misstatement of the combined financial statements, whether due to fraud or error. In making those risk assessments, the auditor considers internal control relevant to the Company’s preparation and fair presentation of the combined financial statements in order to design audit procedures that are appropriate in the circumstances, but not for the purpose of expressing an opinion on the effectiveness of the Company’s internal control. Accordingly, we express no such opinion. An audit also includes evaluating the appropriateness of accounting policies used and the reasonableness of significant accounting estimates made by management, as well as evaluating the overall presentation of the combined financial statements.
We believe that the audit evidence we have obtained is sufficient and appropriate to provide a basis for our audit opinion.
Opinion
In our opinion, the combined financial statements referred to above present fairly, in all material respects, the financial position of Construction Products Distribution as at
F-67
Table of Contents
December 31, 2015, December 31, 2014 and December 31, 2013, and its financial performance and its cash flows for the years then ended in accordance with International Financial Reporting Standards as issued by the International Accounting Standards Board.
/s/ Deloitte LLP
Chartered Professional Accountants, Chartered Accountants
July 20, 2016
F-68
Table of Contents
CONSTRUCTION PRODUCTS DISTRIBUTION
Combined Balance Sheets
| (millions of United States dollars) |
Note | December 31, 2015 |
December 31, 2014 |
December 31, 2013 Restated(1) |
||||||||||||
| Assets |
||||||||||||||||
| Current Assets |
||||||||||||||||
| Trade and other receivables |
4 | 108.0 | 117.4 | 109.7 | ||||||||||||
| Prepaid expenses |
5 | 4.5 | 4.2 | 4.2 | ||||||||||||
| Inventories |
6 | 64.1 | 69.3 | 67.0 | ||||||||||||
| Related-party receivables |
18 | 89.4 | 104.6 | 118.0 | ||||||||||||
|
|
|
|
|
|
|
|||||||||||
| Total Current Assets |
266.0 | 295.5 | 298.9 | |||||||||||||
|
|
|
|
|
|
|
|||||||||||
| Non-Current Assets |
||||||||||||||||
| Restricted cash |
11 | — | — | 4.6 | ||||||||||||
| Property, plant and equipment |
7 | 34.0 | 22.6 | 20.0 | ||||||||||||
| Intangible assets |
8 | 0.3 | 0.3 | 0.3 | ||||||||||||
| Deferred tax |
15 | 19.8 | 19.4 | 16.0 | ||||||||||||
|
|
|
|
|
|
|
|||||||||||
| Total Non-Current Assets |
54.1 | 42.3 | 40.9 | |||||||||||||
|
|
|
|
|
|
|
|||||||||||
| Total Assets |
320.1 | 337.8 | 339.8 | |||||||||||||
|
|
|
|
|
|
|
|||||||||||
| Liabilities and Owners’ Net Investment |
||||||||||||||||
| Current Liabilities |
||||||||||||||||
| Trade and other payables |
9&10 | 83.3 | 86.1 | 84.1 | ||||||||||||
| Borrowing |
12 | 4.6 | 3.4 | 4.3 | ||||||||||||
| Unrealized losses on derivative financial instruments |
14 | 5.8 | 1.7 | — | ||||||||||||
| Related-party notes |
131.3 | — | — | |||||||||||||
|
|
|
|
|
|
|
|||||||||||
| Total Current Liabilities |
225.0 | 91.2 | 88.4 | |||||||||||||
|
|
|
|
|
|
|
|||||||||||
| Non-Current Liabilities |
||||||||||||||||
| Borrowing |
12 | 12.1 | 9.7 | 7.4 | ||||||||||||
| Related-party notes |
13 | — | 131.3 | 131.3 | ||||||||||||
| Provisions |
9 | — | 2.4 | 3.6 | ||||||||||||
| Unrealized losses on derivative financial instruments |
14 | 3.0 | 1.5 | 0.6 | ||||||||||||
|
|
|
|
|
|
|
|||||||||||
| Total Non-Current Liabilities |
15.1 | 144.9 | 142.9 | |||||||||||||
|
|
|
|
|
|
|
|||||||||||
| Total Liabilities |
240.1 | 236.1 | 231.3 | |||||||||||||
|
|
|
|
|
|
|
|||||||||||
| Owners’ Net Investment |
||||||||||||||||
| Paid in capital |
80.1 | 80.1 | 80.1 | |||||||||||||
| Retained earnings |
20.1 | 15.9 | 8.3 | |||||||||||||
| Accumulated other comprehensive (loss) income |
(20.2 | ) | 5.7 | 20.1 | ||||||||||||
|
|
|
|
|
|
|
|||||||||||
| Total Owners’ Net Investment |
80.0 | 101.7 | 108.5 | |||||||||||||
|
|
|
|
|
|
|
|||||||||||
| Total Liabilities and Owners’ Net Investment |
320.1 | 337.8 | 339.8 | |||||||||||||
|
|
|
|
|
|
|
|||||||||||
| (1) | See Note 2 to the Combined Financial Statements. |
See accompanying Notes to the Combined Financial Statements.
F-69
Table of Contents
CONSTRUCTION PRODUCTS DISTRIBUTION
Combined Statements of Changes in Owners’ Net Investment
| (millions of United States dollars) |
Paid in Capital |
Retained Earnings (Deficit)— Restated(1) |
Accumulated Other Comprehensive Income (Loss) |
Total | ||||||||||||
| January 1, 2013—Restated(1) |
80.1 | 6.3 | 31.4 | 117.8 | ||||||||||||
| Net earnings |
— | 2.0 | — | 2.0 | ||||||||||||
| Unrealized foreign currency losses on translation of foreign operations |
— | — | (11.3 | ) | (11.3 | ) | ||||||||||
|
|
|
|
|
|
|
|
|
|||||||||
| December 31, 2013—Restated(1) |
80.1 | 8.3 | 20.1 | 108.5 | ||||||||||||
|
|
|
|
|
|
|
|
|
|||||||||
| Net earnings |
— | 7.6 | — | 7.6 | ||||||||||||
| Unrealized foreign currency losses on translation of foreign operations |
— | — | (14.4 | ) | (14.4 | ) | ||||||||||
|
|
|
|
|
|
|
|
|
|||||||||
| December 31, 2014 |
80.1 | 15.9 | 5.7 | 101.7 | ||||||||||||
|
|
|
|
|
|
|
|
|
|||||||||
| Net earnings |
— | 4.2 | — | 4.2 | ||||||||||||
| Unrealized foreign currency losses on translation of foreign operations |
— | — | (25.9 | ) | (25.9 | ) | ||||||||||
|
|
|
|
|
|
|
|
|
|||||||||
| December 31, 2015 |
80.1 | 20.1 | (20.2 | ) | 80.0 | |||||||||||
|
|
|
|
|
|
|
|
|
|||||||||
| (1) | See Note 2 to the Combined Financial Statements. |
See accompanying Notes to the Combined Financial Statements.
F-70
Table of Contents
CONSTRUCTION PRODUCTS DISTRIBUTION
Combined Statements of Net Earnings and Total Comprehensive Loss
| Years ended December 31 (millions of United States dollars) |
Note | 2015 | 2014 | 2013— Restated(1) |
||||||||||||
| Revenues |
16 | 745.3 | 761.9 | 776.9 | ||||||||||||
| Cost of sales |
16 | (560.3 | ) | (574.6 | ) | (585.3 | ) | |||||||||
|
|
|
|
|
|
|
|||||||||||
| Gross profit |
185.0 | 187.3 | 191.6 | |||||||||||||
|
|
|
|
|
|
|
|||||||||||
| Expenses |
||||||||||||||||
| Selling, distribution and administrative costs |
16 | (157.5 | ) | (163.8 | ) | (169.7 | ) | |||||||||
| Finance expense |
16 | (13.5 | ) | (13.4 | ) | (14.2 | ) | |||||||||
| Unrealized loss on derivative financial instruments |
14 | (6.6 | ) | (2.7 | ) | (2.1 | ) | |||||||||
|
|
|
|
|
|
|
|||||||||||
| Total expenses |
(177.6 | ) | (179.9 | ) | (186.0 | ) | ||||||||||
|
|
|
|
|
|
|
|||||||||||
| Net earnings before income taxes |
7.4 | 7.4 | 5.6 | |||||||||||||
| Income tax (expense) recovery |
15 | (3.2 | ) | 0.2 | (3.6 | ) | ||||||||||
|
|
|
|
|
|
|
|||||||||||
| Net earnings |
4.2 | 7.6 | 2.0 | |||||||||||||
|
|
|
|
|
|
|
|||||||||||
| Net earnings |
4.2 | 7.6 | 2.0 | |||||||||||||
| Other comprehensive loss: |
||||||||||||||||
| Unrealized foreign currency loss on translation of foreign operations |
(25.9 | ) | (14.4 | ) | (11.3 | ) | ||||||||||
|
|
|
|
|
|
|
|||||||||||
| Total Comprehensive Loss |
(21.7 | ) | (6.8 | ) | (9.3 | ) | ||||||||||
|
|
|
|
|
|
|
|||||||||||
| (1) | See Note 2 to the Combined Financial Statements. |
See accompanying Notes to the Combined Financial Statements.
F-71
Table of Contents
CONSTRUCTION PRODUCTS DISTRIBUTION
Combined Statements of Cash Flows
| Years ended December 31 (millions of United States dollars) |
Notes | 2015 | 2014 | 2013— Restated(1) |
||||||||||||
| OPERATING ACTIVITIES |
||||||||||||||||
| Net earnings |
4.2 | 7.6 | 2.0 | |||||||||||||
| Adjustments for: |
||||||||||||||||
| Depreciation included in selling, distribution and administrative costs |
7 | 5.8 | 5.9 | 5.9 | ||||||||||||
| Losses on disposal of assets |
— | — | 0.1 | |||||||||||||
| Finance expenses recognized in net earnings |
0.7 | 0.6 | 1.4 | |||||||||||||
| Finance expenses on related-party borrowings recognized in net earnings |
12.8 | 12.8 | 12.8 | |||||||||||||
| Unrealized loss on derivative financial instruments |
6.6 | 2.7 | 2.1 | |||||||||||||
| Restricted cash |
— | 4.5 | (4.8 | ) | ||||||||||||
| Income tax (recovery) recognized in net earnings |
3.2 | (0.2 | ) | 3.6 | ||||||||||||
| Change in non-cash operating working capital |
17 | (17.0 | ) | (30.4 | ) | 1.5 | ||||||||||
| Interest paid on related-party notes |
(12.8 | ) | (12.8 | ) | (12.8 | ) | ||||||||||
| Interest paid |
(0.7 | ) | (0.6 | ) | (0.6 | ) | ||||||||||
|
|
|
|
|
|
|
|||||||||||
| Cash flows from (used in) operating activities |
2.8 | (9.9 | ) | 11.2 | ||||||||||||
|
|
|
|
|
|
|
|||||||||||
| INVESTING ACTIVITIES |
||||||||||||||||
| Purchase of property, plant and equipment |
7 | (13.0 | ) | (4.0 | ) | (2.6 | ) | |||||||||
| Proceeds from disposal of property, plant and equipment |
7 | 0.1 | 0.1 | 0.2 | ||||||||||||
|
|
|
|
|
|
|
|||||||||||
| Cash flows from (used in) investing activities |
(12.9 | ) | (3.9 | ) | (2.4 | ) | ||||||||||
|
|
|
|
|
|
|
|||||||||||
| FINANCING ACTIVITIES |
||||||||||||||||
| Repayment of finance lease obligations |
(2.6 | ) | (2.6 | ) | (2.4 | ) | ||||||||||
| Related-party borrowing (repayments) |
12.6 | 16.7 | (6.1 | ) | ||||||||||||
|
|
|
|
|
|
|
|||||||||||
| Cash flows used in financing activities |
10.0 | 14.1 | (8.5 | ) | ||||||||||||
|
|
|
|
|
|
|
|||||||||||
| Net increase in cash and cash equivalents |
(0.1 | ) | 0.3 | 0.3 | ||||||||||||
| Cash and cash equivalents, beginning of the year |
— | — | — | |||||||||||||
| Effect of translation of foreign currency-denominated cash and cash equivalents |
0.1 | (0.3 | ) | (0.3 | ) | |||||||||||
|
|
|
|
|
|
|
|||||||||||
| Cash and cash equivalents, end of the year |
— | — | — | |||||||||||||
|
|
|
|
|
|
|
|||||||||||
| (1) | See Note 2 to the Combined Financial Statements. |
See accompanying notes to the Combined Financial Statements.
F-72
Table of Contents
CONSTRUCTION PRODUCTS DISTRIBUTION
NOTES TO THE COMBINED FINANCIAL STATEMENTS
(Tabular amounts in United States millions of dollars, except where otherwise noted. Tables labeled “2015”, “2014”, and “2013” are for full year ended December 31.)
1. Organization
Construction Products Distribution (CPD) is a distributor of commercial and industrial insulation and specialty walls and ceiling products. CPD has 98 distribution centers, including 15 fabrication facilities, across North America with a presence in 26 states and five provinces. CPD is comprised of three entities, The Winroc Corporation (Midwest), Superior Plus Construction Products Corp. and the division Winroc. The Winroc Corporation (Midwest) and Superior Plus Construction Products Corp. are owned 100% by Superior Plus US Holdings Inc in the U.S. and 100% of Winroc, a division of Superior Plus LP in Canada. The parent company of CPD is Superior Plus Corp. (Superior). Superior is a publicly traded company with its common shares traded on the Toronto Stock Exchange (TSX) under the exchange symbol SPB.
2. Basis of Presentation and Restatement
The accompanying combined financial statements present the operations of CPD on a carve-out basis from Superior Plus Corp. as if they had operated as a stand-alone entity. The statements were prepared in accordance with International Financial Reporting Standards (IFRS) as issued by the International Accounting Standards Board (IASB) using the accounting policies adopted by CPD’s ultimate parent, Superior Plus Corp. in its annual consolidated financial statements as at and for the year ended December 31, 2015. The financial statements were prepared on a going concern basis.
The combined financial statements are presented in United States dollars. All financial information presented in United States dollars has been rounded to the nearest hundred-thousand. The functional currency of CPD is Canadian dollars.
The combined financial statements were prepared on the historical cost basis except for the revaluation of certain financial instruments and incorporate the accounts of CPD and its subsidiaries. Subsidiaries are all entities over which CPD has the power to govern the financial and operating policies generally accompanying a shareholding of more than one-half of the voting rights. The results of subsidiaries are included in CPD’s statement of net earnings. All transactions and balances between subsidiaries are eliminated on consolidation. CPD’s entities are all wholly owned directly by Superior Plus US Holdings Inc. and Superior Plus LP.
Preparation Methodology and Restatement
These CPD financial statements have been prepared using financial information collected as part of the Superior Plus Corp. consolidated financial statements and disclosure process. The figures presented are consistent with those presented in the Superior Plus Corp. consolidated financial statements except for: i) the impact of pushing down derivative financial instruments to these financial statements from Superior Plus LP; ii) the timing of recognition of rebates; and iii) income taxes, which have been updated to reflect the tax impact of the financial information presented in the combined CPD financial statements as if it were a stand-alone entity. In addition, CPD recognized an adjustment related to the timing of the recognition of supplier rebates.
F-73
Table of Contents
CONSTRUCTION PRODUCTS DISTRIBUTION
NOTES TO THE COMBINED FINANCIAL STATEMENTS—(Continued)
For the year ended December 31, 2013, CPD recognized an adjustment related to timing of the recognition of supplier rebates resulting in an increase in cost of goods sold of $1.4 million, an increase to accounts receivable of $7.1 million and an increase to opening retained earnings of $5.7 million. The nature of the error related to previously recognized rebates in 2013 that related to the 2012 fiscal year. The financial statements for the year ended December 31, 2013 have been restated to correct this error.
Related party balances have been disclosed separately in the CPD financial statements and notes and relate to transactions that CPD has entered into with other Superior entities.
No corporate costs have been allocated to CPD, as CPD uses its own resources and operates on a stand-alone basis.
Significant Accounting Policies
(a) Cash and Cash Equivalents
Cash and cash equivalents include cash which, on acquisition, have a term to maturity of three months or less.
(b) Inventories
Inventories of building products are valued at the lower of cost and net realizable value. Cost is calculated on a weighted-average cost basis and any trade discounts and vendor rebates are deducted from the cost. The net realizable value of inventory is based on estimated selling price in the ordinary course of business less the estimated costs necessary to complete the sale.
(c) Financial Instruments and Derivative Financial Instruments
Derivative Financial Instruments
Superior Plus Corp. enters into a variety of derivatives on behalf of CPD to manage its exposure to certain financial risks. Further details of derivative financial instruments are disclosed in Note 14.
Derivatives are initially recognized at fair value at the date a derivative contract is entered into and are subsequently re-valued to their fair value at each balance sheet date. The resulting gain or loss is recognized in net earnings. Realized gains and losses on derivatives are recognized as a component of revenue, cost of sales or finance expense/revenue, the classification of which depends on the underlying nature of the economic exposure being managed.
CPD does not formally designate and document economic hedges, in accordance with the requirements of applying hedge accounting under IFRS and, therefore, does not apply hedge accounting.
Financial Assets
A financial asset is classified at fair value through net earnings (FVTNE) if it is classified as held for trading or is designated as such upon initial recognition. Upon initial recognition, attributable transaction costs are recognized in net earnings as incurred. Financial assets at FVTNE are measured at fair value, and changes therein are recognized in net earnings.
F-74
Table of Contents
CONSTRUCTION PRODUCTS DISTRIBUTION
NOTES TO THE COMBINED FINANCIAL STATEMENTS—(Continued)
Loans and receivables
Loans and receivables are financial assets with fixed or determinable payments that are not quoted in an active market. Such assets are recognized initially at fair value plus any directly attributable transaction costs. Subsequent to initial recognition, loans and receivables are measured at amortized cost using the effective interest method, less any impairment losses.
Separable embedded derivatives
Changes in the fair value of separable embedded derivatives are recognized immediately in net earnings.
Impairment of Financial Assets
Financial assets measured at amortized cost are assessed for indicators of impairment at each reporting date. Financial assets are impaired when there is objective evidence that, as a result of one or more events that occurred after the financial asset’s initial recognition, the estimated future cash flows of the investment have been negatively impacted.
For certain categories of financial assets, such as trade receivables, assets that are assessed as not impaired individually are subsequently assessed for collective impairment. Objective evidence of the impairment of a portfolio of receivables could include CPD’s past experience of collecting payments, an increase in the number of delayed payments past the average credit period, in addition to changes in economic conditions that correlate with defaults on receivables. For financial assets carried at amortized cost, the amount of impairment recognized is the difference between the asset’s carrying amount and the present value of estimated future cash flows, discounted at the financial asset’s original effective interest rate.
The carrying amount of the financial asset is reduced by the impairment loss directly for all financial assets with the exception of trade receivables, in which case the carrying amount is reduced through the use of an allowance account. When a trade receivable is considered uncollectible, it is written off against the allowance account. Subsequent recoveries of amounts previously written off are credited to the statement of net earnings and comprehensive income. Changes in the carrying amount of the allowance account are recognized in net earnings.
Classification as Debt or Equity
Debt and equity instruments are classified as either financial liabilities or as equity in accordance with the substance of the contractual arrangement.
Financial Liabilities
Financial liabilities are classified as either financial liabilities at FVTNE or other financial liabilities.
Financial Liabilities at FVTNE
Financial liabilities are classified as FVTNE when the financial liability is held for trading or are designated as FVTNE upon initial recognition. Financial liabilities at FVTNE are stated at fair
F-75
Table of Contents
CONSTRUCTION PRODUCTS DISTRIBUTION
NOTES TO THE COMBINED FINANCIAL STATEMENTS—(Continued)
value with any resulting gain or loss recognized in net earnings. The net gain or loss recognized in net earnings incorporates any related interest expense. Upon initial recognition, attributable transaction costs are recognized in net earnings or loss as incurred. Fair value is determined in the manner described in Note 14.
Other Financial Liabilities
Other financial liabilities, including borrowing, are initially measured at fair value, net of transaction costs. Other financial liabilities are subsequently measured at amortized cost using the effective interest method, with interest expense recognized on an effective interest basis. Financial liabilities are recognized at amortized cost, using the effective interest rate method, at each reporting period, net of transaction costs directly attributable to the issuance of the liability. Transaction costs related to the issuance of any liability are netted against the carrying value of the associated liability and amortized as part of financing costs over the life of that debt using the effective interest rate method.
Derecognition of Financial Liabilities
CPD derecognizes financial liabilities when, and only when, CPD’s obligations are discharged, cancelled or they expire.
(d) Property, Plant and Equipment
Cost
Property, plant and equipment are recorded at cost less accumulated depreciation and impairment losses. Major renewals and improvements which provide future economic benefits and can be reliably measured are capitalized, while repair and maintenance expenses are charged to operations as incurred. Property, plant and equipment in the course of construction are carried at cost less any recognized impairment losses. Cost includes directly attributable expenses, professional fees and, for qualifying assets, borrowing costs capitalized in accordance with CPD’s accounting policy. Depreciation of these assets, on the same basis as other property assets, commences when the assets are available for their intended use. Disposals are derecognized at carrying costs less accumulated depreciation and impairment losses, with any resulting gain or loss reflected in net earnings.
Borrowing Costs
Borrowing costs directly attributable to the acquisition, construction or production of qualifying assets, which are assets that necessarily take substantial time to ready for their intended use or sale, are included in the cost of those assets, until such time as the assets are available for their intended use. All other borrowing costs are recognized in net earnings in the period in which they are incurred.
Depreciation
Depreciation is calculated using the straight-line method, based on the estimated useful life. Land is not depreciated. Depreciation of property in the course of construction commences
F-76
Table of Contents
CONSTRUCTION PRODUCTS DISTRIBUTION
NOTES TO THE COMBINED FINANCIAL STATEMENTS—(Continued)
when the assets are available for their intended use. In the majority of cases, residual value is estimated to be insignificant. Depreciation by class of assets is as follows:
| Buildings |
15 to 40 years | |
| Leasehold improvements |
over the lease term up to10 years | |
| Construction Products Distribution equipment |
5 to 15 years | |
| Manufacturing equipment |
5 to 40 years | |
| Furniture and fixtures |
10 years | |
| Computer equipment |
3 years |
Depreciation rates, residual values and depreciation methods are reviewed at the end of each annual reporting period, with the effect of any changes in estimate being accounted for on a prospective basis.
(e) Intangible Assets
Intangible assets are reported at cost less accumulated amortization and accumulated impairment losses. For intangible assets with a determinate life, amortization is charged on a straight-line basis over their estimated useful lives.
Intangible assets acquired in a business combination are identified and recognized separately from goodwill when they satisfy the recognition criteria. The initial cost of such intangible assets is their fair value at the acquisition date. Subsequent to initial recognition, intangible assets acquired in a business combination are reported at cost less accumulated amortization and accumulated impairment losses, on the same basis as intangible assets acquired separately.
Amortization rates, residual values and amortization methods are reviewed at least annually, with the effect of any changes in estimate being accounted for on a prospective basis.
CPD’s other intangible assets and related amortization rates are summarized as follows:
| Software |
1-3 years |
(f) Impairment of Property, Plant and Equipment and Intangible Assets
On an annual basis, CPD reviews the carrying amounts of its tangible and intangible assets to determine whether there is any indication that those assets have suffered an impairment loss. If so, the recoverable amount of the asset is estimated in order to determine the extent of the impairment loss, if any. Where it is not possible to estimate the recoverable amount of an individual asset, CPD estimates the recoverable amount of the cash-generating unit (CGU) to which the asset belongs. For the impairment testing, assets that cannot be tested individually are grouped into the smallest group of assets that generates cash inflows from continuing use that are largely independent of the cash inflows of other assets or groups.
Recoverable amount is the higher of fair value less costs to sell and value-in-use. In assessing value-in-use, the estimated future cash flows are discounted to their present value using a pre-tax discount rate that reflects current market assessments of the time value of money and the risks specific to the asset for which the estimates of future cash flows have not been adjusted.
F-77
Table of Contents
CONSTRUCTION PRODUCTS DISTRIBUTION
NOTES TO THE COMBINED FINANCIAL STATEMENTS—(Continued)
If the recoverable amount of an asset or CGU is estimated to be less than its carrying amount, the carrying amount is reduced to its recoverable amount. An impairment loss is recognized immediately in net earnings. When an impairment loss, other than an impairment loss on goodwill, subsequently reverses, the carrying amount of the asset is increased to the revised estimate of its recoverable amount, which cannot exceed the original carrying amount less normal depreciation.
(g) Business Combinations
All business combinations are accounted for using the acquisition method. The consideration transferred in a business combination is measured at fair values, at the acquisition date of the assets given up, the liabilities incurred or assumed and equity instruments issued by CPD in exchange for control of the acquiree. Transaction costs, other than those associated with the issuance of debt or equity securities, that CPD incurs in connection with a business combination, are expensed as incurred. The acquiree’s identifiable assets, liabilities and contingent liabilities that meet the conditions for recognition under IFRS 3—Business Combinations are recognized at their fair values at the acquisition date.
(h) Revenue Recognition
Revenue is measured at the fair value of the consideration received or receivable. Revenue is reduced for estimated customer returns, rebates and other similar allowances. Revenue from the sale of goods is recognized when all the following conditions are satisfied:
| • | CPD has transferred to the buyer the significant risks and rewards of ownership of the goods; |
| • | CPD retains neither continuing managerial involvement to the degree usually associated with ownership nor effective control over the goods sold; |
| • | The amount of revenue can be measured reliably; |
| • | It is probable that the economic benefits associated with the transaction will flow to CPD; and |
| • | The costs incurred or to be incurred in respect of the transaction can be measured reliably. |
Revenue is recognized when products are delivered to the customer and when the above conditions related to revenue from sale of goods are satisfied. Revenue is stated net of discounts and rebates granted.
(i) Leases
Leases are classified as finance leases whenever the terms of the lease transfer substantially all of the risks and rewards of ownership to the lessee. All other leases are classified as operating leases.
Assets held under finance leases are initially recognized as assets of CPD at their fair value at the inception of the lease or, if lower, at the present value of the minimum lease payments. The corresponding liability to CPD is included in the balance sheet as a finance lease obligation as part of borrowing.
F-78
Table of Contents
CONSTRUCTION PRODUCTS DISTRIBUTION
NOTES TO THE COMBINED FINANCIAL STATEMENTS—(Continued)
Lease payments are apportioned between finance expenses and reduction of the lease obligation so as to achieve a constant rate of interest on the remaining balance of the liability. Finance expenses are recognized immediately in net earnings, unless they are directly attributable to qualifying assets, in which case they are capitalized in accordance with CPD’s general policy on borrowing costs (see (d) above). Contingent rentals are recognized as expenses in the period in which they are incurred.
Operating lease payments are recognized as an expense based on terms contained in the lease agreements. Contingent rentals arising under operating leases are recognized as an expense in the period in which they are incurred.
In the event lease incentives are received to enter into operating leases, such incentives are recognized as a liability. The aggregate benefit of incentives is recognized as a reduction of rental expense and amortized over the term of the lease.
(j) Rebates
Purchase rebates are recognized as a reduction of cost of goods sold when the related performance is completed and the inventory is sold. Vendor rebates that are contingent upon completing a specified level of purchases are recognized as a reduction of cost of goods sold based on a systematic and rational allocation of the cash consideration to each of the underlying transactions that results in progress toward earning that rebate, assuming that the rebate can be reasonably estimated and it is probable that the specified target will be obtained. Otherwise, the rebate is recognized as the milestone is achieved and the inventory is sold.
(k) Provisions
Provisions are recognized when there is a present legal or constructive obligation as a result of past events, for which it is probable that payment will be required to settle the obligation, and where the amount can be reliably estimated.
The amount is the best estimate of the consideration required to settle the present obligation at the reporting date, taking into account the risks and uncertainties surrounding the obligation. Where a provision is measured using the cash flows estimated to settle the present obligation, its carrying amount is the present value of those cash flows.
When some or all of the economic benefit required to settle a provision is expected to be recovered from a third party, the receivable is recognized as an asset if it is virtually certain that reimbursement will be received and the receivable can be measured reliably.
Restructuring
A restructuring provision is recognized when CPD has developed a detailed formal restructuring plan and has raised a valid expectation in those affected that it will carry out the restructuring by starting to implement the plan or announcing its main features to those affected. The measurement of a restructuring provision includes only the direct expenditures arising from the restructuring.
F-79
Table of Contents
CONSTRUCTION PRODUCTS DISTRIBUTION
NOTES TO THE COMBINED FINANCIAL STATEMENTS—(Continued)
(l) Income Taxes
Income tax expense represents the sum of current income taxes payable and deferred income taxes. Income tax expense was calculated based on legal entity for each of the following entities: The Winroc Corporation, Superior Plus Construction Productions Corp, and Winroc, A Division of Superior Plus LP. There was no allocation of corporate’s non-operating losses to CPD.
Current Income Taxes
The income tax currently payable is based on taxable net earnings for the year. Taxable net earnings differs from net earnings as reported in the combined statement of net earnings and total comprehensive income because it excludes items of income or expense that are taxable or deductible in other years and it further excludes items that are never taxable or deductible. CPD’s liability for current income tax is calculated using tax rates that have been enacted or substantively enacted by the balance sheet date.
Deferred Income Taxes
Deferred income tax is recognized on differences between the carrying amounts of assets and liabilities in the financial statements and the corresponding tax basis used in the computation of taxable net earnings. Deferred income tax assets are generally recognized for all deductible temporary differences to the extent that it is probable that taxable net earnings will be available against which those deductible temporary differences can be utilized. Deferred tax liabilities are recognized for all taxable temporary differences, except for the following:
| • | When the deferred tax liability arises from the initial recognition of goodwill; or |
| • | When an asset or liability in a transaction that is not a business combination and, at the time of the transaction, affects neither the accounting net earnings or taxable net earnings; and |
| • | In respect of taxable temporary differences associated with investments in subsidiaries, associates and interests in joint ventures, where the timing of the reversal of the temporary differences can be controlled by CPD and it is probable that the temporary differences will not be reversed in the foreseeable future. |
Deferred tax assets arising from deductible temporary differences associated with such investments and interests are only recognized to the extent that they are expected to be reversed in the foreseeable future and it is probable that there will be sufficient taxable net earnings against which to utilize the benefits of the temporary differences. A deferred tax asset may also be recognized for the benefit expected from unused tax losses available for carry-forward, to the extent that it is probable that future taxable earnings will be available against which the tax losses can be applied.
Deferred tax assets and liabilities are measured at the tax rates that are expected to apply in the period in which the liability is settled or the asset realized, based on tax rates and tax laws that have been enacted or substantively enacted by the balance sheet date. The measurement of deferred tax liabilities and assets reflects the tax consequences that would follow from the manner in which CPD expects, at the reporting date, to recover or settle the carrying amount of its assets and liabilities.
F-80
Table of Contents
CONSTRUCTION PRODUCTS DISTRIBUTION
NOTES TO THE COMBINED FINANCIAL STATEMENTS—(Continued)
Deferred tax assets and liabilities are offset when there is a legally enforceable right to offset current tax assets against current liabilities and when they are related to income taxes levied by the same taxation authority and CPD intends to settle its current tax assets and liabilities on a net basis. Also, CPD recognizes any benefit associated with investment tax credits as deferred tax assets to the extent they are expected to be utilized in accordance with IAS 12—Income Taxes.
Uncertain Tax Positions
CPD is subject to taxation in numerous jurisdictions. There are many transactions and calculations during the course of business for which the ultimate tax determination is uncertain. It is possible, however, that at some future date, liabilities in excess of CPD’s provisions could result from audits by or litigation with tax authorities. Where the final outcome of these tax-related matters is different from the amounts that were initially recorded, such differences will affect the tax provisions in the period in which such determination is made.
Current and Deferred Tax for the Period
Current and deferred tax are recognized as an expense in net earnings, except where they relate to amounts recognized outside of net earnings (whether in other comprehensive income or directly in equity), in which case the tax is also recognized outside net earnings, or where they arise from the initial accounting for a business combination. In the case of a business combination, the tax effect is included in the accounting for the business combination.
(m) Foreign Currencies
The financial statements of each subsidiary of CPD are translated into the currency of the subsidiary’s primary economic environment (its functional currency, Canadian Dollars). For the purpose of the combined financial statements, the results and balance sheets of each subsidiary are expressed in United States Dollars, CPD’s presentation currency.
All monetary assets and liabilities of the foreign operations of CPD are translated at the exchange rate prevailing at the balance sheet date, and revenues and expenses at average exchange rates during the period. Exchange gains and losses arising from this translation are recorded as a component of accumulated other comprehensive income (loss). Gains and losses are recognized on monetary assets and liabilities when those items are settled. Other non-monetary assets and liabilities held by CPD are converted using the spot rate at the date of the transaction.
Transactions denominated in a foreign currency are translated into the functional currency at rates in effect at the date of the transaction. At the balance sheet date, monetary foreign currency assets and liabilities are translated at exchange rates then in effect. The resulting translation gains or losses are recognized in net earnings.
(n) Share-Based Payments
CPD has established share-based compensation plans whereby notional restricted shares and/or notional performance shares may be granted to employees. The fair value of these
F-81
Table of Contents
CONSTRUCTION PRODUCTS DISTRIBUTION
NOTES TO THE COMBINED FINANCIAL STATEMENTS—(Continued)
notional shares is estimated using the period-end Superior Plus Corp. quoted market price and recorded as an expense with an offsetting amount to accrued liabilities, re-measured at each balance sheet date. All share-based payments are settled in cash.
(o) Significant Accounting Judgments, Estimates and Assumptions
The preparation of CPD’s combined financial statements in accordance with IFRS requires management to make judgments, estimates and assumptions that affect the reported amounts of assets, liabilities, net earnings and related disclosure. The estimates and associated assumptions are based on historical experience and various other factors deemed reasonable under the circumstances, the results of which form the basis of making the judgments about carrying values of assets and liabilities that are not readily apparent from other sources. Actual results may differ from these estimates. The areas involving a higher degree of judgment or complexity, or where assumptions and estimates are significant to the financial statements are as follows:
Fair Value of Derivative and Non-Financial Derivative Instruments
Where the fair values of derivatives and non-financial derivatives cannot be derived from active markets, they are determined using valuation techniques including a discounted cash flow model. This requires assumptions concerning the amount and timing of estimated future cash flows and discount rates. Differences between actual values and assumed values will affect net earnings in the period when the determination of the difference is made.
Allowance for Doubtful Accounts
CPD recognizes an allowance for doubtful accounts based on historical customer collection history, general economic indicators and other customer-specific information, all of which require CPD to make certain assumptions. Where the actual collectability of accounts receivable differs from these estimates, such differences will have an impact on net earnings in the period such a determination is made.
Supplier-Rebates
CPD recognizes rebates earned from suppliers as a reduction of the price of vendors’ products and reflects it as a reduction of cost of sales and the related inventory in the combined statement of income and combined statement of financial position. To determine probability and estimated receipts, CPD analyzes actual purchases during the year, attainment of purchase forecasts, and contractual terms and conditions. The assumptions are reassessed each year.
Property, Plant and Equipment and Intangible Assets
Capitalized assets, including property, plant and equipment and intangible assets are amortized over their respective estimated useful lives. All estimates of useful lives are set out in 2(d) and 2(e) above.
Provisions
Provisions have been estimated for restructuring. The actual costs and timing of future cash flows depend on future events. Any differences between estimates and the actual future liability will be accounted for in the period when such determination is made.
F-82
Table of Contents
CONSTRUCTION PRODUCTS DISTRIBUTION
NOTES TO THE COMBINED FINANCIAL STATEMENTS—(Continued)
Income Tax Assets and Liabilities
CPD recognizes expected tax assets and liabilities based on estimates of current and future taxable net earnings, which may require significant judgment regarding the ultimate tax determination of certain items. If taxable net earnings differ from the estimates there may be an impact on current and future income tax provisions in the period when the difference is determined.
Asset Impairments
Financial and non-financial assets are subject to impairment reviews based on whether current or future events and circumstances suggest that their recoverable amount may be less than their carrying value. Recoverable amounts are based on a calculation of expected future cash flows, which includes management assumptions and estimates of future performance.
Critical Judgments in Applying Accounting Policies
In applying CPD’s accounting policies, described above, management makes judgments that could significantly affect the amounts recognized in the combined financial statements. The most critical of these judgments are:
Impairment of Property, Plant and Equipment
An impairment evaluation involves consideration of whether there are indicators of impairment. Indicators include: significant underperformance relative to historical or projected operating results, significant changes in the manner in which an asset is used or in CPD’s overall business strategy, or significant negative industry or economic trends. In some cases, these events are clear. However, in many cases, there is no such clearly identifiable event. Instead, a series of individually insignificant events, some of them only later known, leads to an indication that an asset may be impaired. Management continually monitors CPD’s markets and the business environment, and makes judgments and assessments about conditions and events in order to conclude whether a possible impairment exists.
Income Taxes
Preparation of the combined financial statements involves making an estimate of, or provision for, income taxes in each of the jurisdictions in which CPD operates and on a legal entity basis. The process also involves estimating taxes currently payable and taxes expected to be payable or recoverable in future periods, referred to as deferred income taxes. Deferred income taxes result from the effects of temporary differences due to items that are treated differently for tax and accounting purposes. The tax effects of these differences are reflected in the balance sheet as deferred income tax assets and liabilities. An assessment must also be made to determine the likelihood that CPD’s future taxable income will be sufficient to permit the recovery of deferred income tax assets. To the extent that such recovery is not probable, recognized deferred income tax assets must be reduced. Judgment is required in determining the provision for income taxes and recognition of deferred income tax assets and liabilities. Management must also exercise judgment in its assessment of continually changing tax interpretations, regulations and legislation, to ensure deferred income tax assets and liabilities are complete and fairly presented. The effects of differing assessments and applications could be material.
F-83
Table of Contents
CONSTRUCTION PRODUCTS DISTRIBUTION
NOTES TO THE COMBINED FINANCIAL STATEMENTS—(Continued)
Financial Instruments
The fair value of financial instruments is determined and classified within three categories, which are outlined below and discussed in more detail in Note 14.
Level I
Fair values in Level I are determined using inputs that are unadjusted quoted prices in active markets for identical assets or liabilities that CPD has the ability to access.
Level II
Fair values in Level II are determined, directly or indirectly, using inputs that are observable for the asset or liability.
Level III
Fair values in Level III are determined using inputs for the asset or liability that are not readily observable.
The fair value measurement of a financial instrument is included in only one of the three levels, the determination of which is based on the lowest-level input that is significant to the derivation of the fair value. Classification of financial instruments requires management to use judgment in respect of both the determination of fair value and the lowest-level input of significance.
Recent Accounting Pronouncements
Certain mandatory new standards, interpretations, amendments and improvements to existing standards were issued by the IASB or International Financial Reporting Interpretations Committee (IFRIC) effective for accounting periods beginning on or after January 1, 2015. The affected standards applicable to Superior are as follows:
IAS 19—Defined Benefit Plans: Employee Contributions
The amendments to IAS 19 clarify how an entity should account for contributions made by employees or third parties to defined benefit plans, based on whether those contributions are dependent on the employee’s number of years of service. For contributions that are independent of the number of years of services, the entity may either recognize the contributions as a reduction in the service cost in the period in which the related service is rendered, or attribute them to the employee’s periods of service using the projected unit credit method; whereas for contributions that are dependent on the number of years of service, the entity is required to attribute them to the employee’s period of service. This standard must be applied for accounting periods beginning on or after July 1, 2014, with earlier adoption permitted. Superior adopted these IAS 19 amendments on January 1, 2015 with no material impact to financial results and financial position.
New and revised IFRS standards issued but not yet effective
IFRS 9—Financial Instruments: Classification and Measurement
IFRS 9 was issued in November 2009 and is intended to replace IAS 39—Financial Instruments: Recognition and Measurement. IFRS 9 uses a single approach to determine
F-84
Table of Contents
CONSTRUCTION PRODUCTS DISTRIBUTION
NOTES TO THE COMBINED FINANCIAL STATEMENTS—(Continued)
whether a financial asset is measured at amortized cost or fair value, replacing the multiple rules in IAS 39. The approach in IFRS 9 is based on how an entity manages its financial instruments in the context of its business model and the contractual cash flow characteristics of the financial assets. The new standard also requires a single impairment method to be used, replacing the multiple impairment methods in IAS 39. Requirements for financial liabilities were added in October 2010 and they largely carried forward existing requirements in IAS 39 except that fair value changes due to credit risk for liabilities designated at fair value through profit and loss would generally be recorded in other comprehensive income.
A finalized version of IFRS 9 was issued in July 2014 to include impairment requirements for financial assets and limited amendments to the classification and measurement requirements by introducing a fair value through other comprehensive income measurement category for certain simple debt instruments. This standard must be applied for accounting periods beginning on or after January 1, 2018, with earlier adoption permitted. Superior intends to adopt the new standard on the required effective date, and is currently assessing the effect of IFRS 9 on its financial results and financial position. Changes, if any, are not expected to be material.
IFRS 15- Revenue from Contracts with Customers
IFRS 15 was issued in May 2014, establishing a single comprehensive model for entities to use in accounting for revenue arising from contracts with customers. IFRS 15 supersedes the current revenue recognition guidance including IAS 18—Revenue and IAS 11—Construction Contracts, as well as the related interpretation when it becomes effective. Under IFRS 15, an entity should recognize revenue to depict the transfer of promised goods or services to customers in an amount that reflects the consideration to which the entity expects to be entitled in exchange for those goods or services. An entity is required to recognize revenue when the performance obligation is satisfied. Either a full or modified retrospective application is required for annual periods beginning on or after January 1, 2018 with early adoption permitted. CPD is currently assessing the impact of IFRS 15 and plans to adopt the new standard on the required effective date.
IAS 16 and IAS 38—Property, Plant and Equipment and Intangible Assets
The amendments to IAS 16 prohibit entities from using a revenue-based depreciation method for items of property, plant, and equipment. The amendments to IAS 38 introduce a rebuttable presumption that revenue is not an appropriate basis for amortization of an intangible asset. This presumption can only be rebutted in the event that the intangible asset is expressed as a measure of revenue or when it can be demonstrated that revenue and consumption of the economic benefits of the intangible assets are highly correlated. This standard must be applied for accounting periods beginning on or after January 1, 2016, with earlier adoption permitted. CPD currently amortizes property, plant and equipment and intangible assets using the straight-line method and, therefore, does not anticipate that the application of these amendments to IAS 16 and IAS 18 will have a material impact on its combined financial statements.
3. Seasonality of Operations
Sales typically peak during the second and third quarters with the seasonal increase in building and renovation activities. They then decline through the fourth quarter and into the
F-85
Table of Contents
CONSTRUCTION PRODUCTS DISTRIBUTION
NOTES TO THE COMBINED FINANCIAL STATEMENTS—(Continued)
subsequent first quarter. Similarly, net working capital is typically at seasonal highs during the second and third quarters, and normally decline to seasonal lows in the fourth and first quarters.
4. Trade and Other Receivables
A summary of trade and other receivables are as follows:
| 2015 | 2014 | 2013 Restated(1) |
||||||||||
| Trade receivables, net of allowances |
98.6 | 106.5 | 97.0 | |||||||||
| Accounts receivable—other |
9.4 | 10.9 | 12.7 | |||||||||
|
|
|
|
|
|
|
|||||||
| Trade and other receivables |
108.0 | 117.4 | 109.7 | |||||||||
|
|
|
|
|
|
|
|||||||
| (1) | See Note 2 to the Combined Financial Statements. |
Pursuant to their respective terms, trade receivables, before deducting an allowance for doubtful accounts, are aged as follows:
| 2015 | 2014 | 2013 Restated(1) |
||||||||||
| Current |
69.5 | 74.8 | 53.1 | |||||||||
| Past due less than 90 days |
27.0 | 29.2 | 41.6 | |||||||||
| Past due over 90 days |
3.4 | 4.3 | 4.8 | |||||||||
|
|
|
|
|
|
|
|||||||
| Trade receivables |
99.9 | 108.3 | 99.5 | |||||||||
|
|
|
|
|
|
|
|||||||
| (1) | See Note 2 to the Combined Financial Statements. |
The current portion of CPD’s trade receivables is neither impaired nor past due and there are no indications as of the reporting date that the debtors will not make payment. CPD’s trade receivables are stated after deducting a provision of $1.3 million as at December 31, 2015 (December 31, 2014—$1.8 million; December 31, 2013—$2.5 million). The movement in the provision for doubtful accounts was as follows:
| 2015 | 2014 | 2013 Restated(1) |
||||||||||
| Allowance for doubtful accounts, beginning of the year |
(1.9 | ) | (2.5 | ) | (3.7 | ) | ||||||
| Opening adjustment due to acquisitions |
— | (0.2 | ) | — | ||||||||
| Impairment losses recognized on receivables |
(1.2 | ) | (0.6 | ) | — | |||||||
| Amounts written off during the year as uncollectible |
1.3 | 1.0 | 0.8 | |||||||||
| Amounts recovered |
0.1 | 0.2 | 0.2 | |||||||||
| Net foreign currency translation impact |
0.4 | 0.3 | 0.2 | |||||||||
|
|
|
|
|
|
|
|||||||
| Allowance for doubtful accounts, end of the year |
(1.3 | ) | (1.8 | ) | (2.5 | ) | ||||||
|
|
|
|
|
|
|
|||||||
| (1) | See Note 2 to the Combined Financial Statements. |
F-86
Table of Contents
CONSTRUCTION PRODUCTS DISTRIBUTION
NOTES TO THE COMBINED FINANCIAL STATEMENTS—(Continued)
5. Prepaid expenses
| 2015 | 2014 | 2013 Restated(1) |
||||||||||
| Balance at the beginning of the year |
4.2 | 4.2 | 4.0 | |||||||||
| Added to prepaid assets |
11.3 | 12.9 | 18.7 | |||||||||
| Expensed to net earnings |
(10.6 | ) | (12.7 | ) | (18.4 | ) | ||||||
| Net foreign currency translation impact |
(0.4 | ) | (0.2 | ) | (0.1 | ) | ||||||
|
|
|
|
|
|
|
|||||||
| Balance at the end of the year |
4.5 | 4.2 | 4.2 | |||||||||
|
|
|
|
|
|
|
|||||||
| (1) | See Note 2 to the Combined Financial Statements. |
6. Inventories
| 2015 | 2014 | 2013 Restated(1) |
||||||||||
| Wall, ceiling and insulation construction products |
64.1 | 69.3 | 67.0 | |||||||||
|
|
|
|
|
|
|
|||||||
| 64.1 | 69.3 | 67.0 | ||||||||||
|
|
|
|
|
|
|
|||||||
| (1) | See Note 2 to the Combined Financial Statements. |
F-87
Table of Contents
CONSTRUCTION PRODUCTS DISTRIBUTION
NOTES TO THE COMBINED FINANCIAL STATEMENTS—(Continued)
The cost of inventories recognized as an expense in the year ended December 31, 2015 was $556.4 million (December 31, 2014—$573.0 million; December 2013—$585.3 million). Inventories of $nil as at December 31, 2015 (December 31, 2014—$nil; December 31, 2013—$nil) are expected to be recovered after more than 12 months. Inventory was written down during the year ended December 31, 2015 by $0.6 million (December 31, 2014—$0.5 million; December 31, 2013—$nil). A write-down reversal of $0.2 million was recorded during the year ended December 31, 2015 (December 31, 2014—$nil; December 31, 2013—$nil).
7. Property, Plant and Equipment
| Land | Buildings | Equipment | Leasehold Improvements |
Total | ||||||||||||||||
| Cost |
||||||||||||||||||||
| Balance at December 31, 2014 |
0.6 | 2.3 | 46.8 | 6.1 | 55.8 | |||||||||||||||
| Additions |
— | — | 17.4 | 0.1 | 17.5 | |||||||||||||||
| Disposals |
— | — | (4.4 | ) | (0.2 | ) | (4.6 | ) | ||||||||||||
| Net foreign currency translation impact |
— | 0.1 | (2.6 | ) | (0.8 | ) | (3.3 | ) | ||||||||||||
|
|
|
|
|
|
|
|
|
|
|
|||||||||||
| Balance at December 31, 2015 |
0.6 | 2.4 | 57.2 | 5.2 | 65.4 | |||||||||||||||
|
|
|
|
|
|
|
|
|
|
|
|||||||||||
| Accumulated Depreciation and Impairment |
| |||||||||||||||||||
| Balance at December 31, 2014 |
— | 1.5 | 26.6 | 5.1 | 33.2 | |||||||||||||||
| Depreciation expense |
— | 0.2 | 5.2 | 0.4 | 5.8 | |||||||||||||||
| Eliminated on disposal of assets |
— | — | (4.4 | ) | (0.2 | ) | (4.6 | ) | ||||||||||||
| Net foreign currency translation impact |
— | — | (2.2 | ) | (0.8 | ) | (3.0 | ) | ||||||||||||
|
|
|
|
|
|
|
|
|
|
|
|||||||||||
| Balance at December 31, 2015 |
— | 1.7 | 25.2 | 4.5 | 31.4 | |||||||||||||||
|
|
|
|
|
|
|
|
|
|
|
|||||||||||
| Land | Buildings | Equipment | Leasehold Improvements |
Total | ||||||||||||||||
| Cost—Restated(1) |
||||||||||||||||||||
| Balance at December 31, 2013 |
0.6 | 2.4 | 45.1 | 6.0 | 54.1 | |||||||||||||||
| Additions |
— | — | 8.7 | 0.4 | 9.1 | |||||||||||||||
| Disposals |
— | — | (5.0 | ) | — | (5.0 | ) | |||||||||||||
| Net foreign currency translation impact |
— | (0.1 | ) | (2.0 | ) | (0.3 | ) | (2.4 | ) | |||||||||||
|
|
|
|
|
|
|
|
|
|
|
|||||||||||
| Balance at December 31, 2014 |
0.6 | 2.3 | 46.8 | 6.1 | 55.8 | |||||||||||||||
|
|
|
|
|
|
|
|
|
|
|
|||||||||||
| Accumulated Depreciation—Restated(1) |
| |||||||||||||||||||
| Balance at December 31, 2013 |
— | 1.4 | 27.6 | 5.1 | 34.1 | |||||||||||||||
| Depreciation expense |
— | — | 5.5 | 0.4 | 5.9 | |||||||||||||||
| Eliminated on disposal of assets |
— | — | (4.8 | ) | — | (4.8 | ) | |||||||||||||
| Net foreign currency translation impact |
— | 0.1 | (1.7 | ) | (0.4 | ) | (2.0 | ) | ||||||||||||
|
|
|
|
|
|
|
|
|
|
|
|||||||||||
| Balance at December 31, 2014 |
— | 1.5 | 26.6 | 5.1 | 33.2 | |||||||||||||||
|
|
|
|
|
|
|
|
|
|
|
|||||||||||
| (1) | See Note 2 to the Combined Financial Statements. |
F-88
Table of Contents
CONSTRUCTION PRODUCTS DISTRIBUTION
NOTES TO THE COMBINED FINANCIAL STATEMENTS—(Continued)
| Land | Buildings | Equipment | Leasehold Improvements |
Total | ||||||||||||||||
| Cost—Restated(1) |
||||||||||||||||||||
| Balance at December 31, 2012 |
0.6 | 2.4 | 43.1 | 6.4 | 52.5 | |||||||||||||||
| Additions |
— | — | 5.8 | 0.4 | 6.2 | |||||||||||||||
| Disposals |
— | — | (2.6 | ) | (0.5 | ) | (3.1 | ) | ||||||||||||
| Net foreign currency translation impact |
— | — | (1.2 | ) | (0.3 | ) | (1.5 | ) | ||||||||||||
|
|
|
|
|
|
|
|
|
|
|
|||||||||||
| Balance at December 31, 2013 |
0.6 | 2.4 | 45.1 | 6.0 | 54.1 | |||||||||||||||
|
|
|
|
|
|
|
|
|
|
|
|||||||||||
| Accumulated Depreciation—Restated(1) |
| |||||||||||||||||||
| Balance at December 31, 2012 |
— | 1.2 | 25.5 | 5.4 | 32.1 | |||||||||||||||
| Depreciation expense |
— | 0.1 | 5.3 | 0.5 | 5.9 | |||||||||||||||
| Eliminated on disposal of assets |
— | — | (2.5 | ) | (0.5 | ) | (3.0 | ) | ||||||||||||
| Net foreign currency translation impact |
— | 0.1 | (0.7 | ) | (0.3 | ) | (0.9 | ) | ||||||||||||
|
|
|
|
|
|
|
|
|
|
|
|||||||||||
| Balance at December 31, 2013 |
— | 1.4 | 27.6 | 5.1 | 34.1 | |||||||||||||||
|
|
|
|
|
|
|
|
|
|
|
|||||||||||
| (1) | See Note 2 to the Combined Financial Statements. |
| Carrying Amount—Restated(1) |
||||||||||||||||||||
| As at December 31, 2013 |
0.6 | 1.0 | 17.5 | 0.9 | 20.0 | |||||||||||||||
| As at December 31, 2014 |
0.6 | 0.8 | 20.2 | 1.0 | 22.6 | |||||||||||||||
| As at December 31, 2015 |
0.6 | 0.7 | 32.0 | 0.7 | 34.0 | |||||||||||||||
| (1) | See Note 2 to the Combined Financial Statements. |
The carrying value of CPD’s property, plant, and equipment includes $13.2 million of leased assets as at December 31, 2015 (December 31, 2014—$11.9 million, December 31, 2013—$8.3 million).
8. Intangible Assets
| Intangible Assets |
||||
| Cost |
||||
| Balance at December 31, 2014 |
1.6 | |||
| Net foreign translation impact |
(0.3 | ) | ||
|
|
|
|||
| Balance at December 31, 2015 |
1.3 | |||
|
|
|
|||
| Accumulated Amortization |
||||
| Balance at December 31, 2014 |
1.3 | |||
| Net foreign translation impact |
(0.3 | ) | ||
|
|
|
|||
| Balance at December 31, 2015 |
1.0 | |||
|
|
|
|||
F-89
Table of Contents
CONSTRUCTION PRODUCTS DISTRIBUTION
NOTES TO THE COMBINED FINANCIAL STATEMENTS—(Continued)
| Intangible Assets Restated(1) |
||||
| Cost |
||||
| Balance at December 31, 2013 |
1.6 | |||
|
|
|
|||
| Balance at December 31, 2014 |
1.6 | |||
|
|
|
|||
| Accumulated Amortization |
| |||
| Balance at December 31, 2013 |
1.3 | |||
|
|
|
|||
| Balance at December 31, 2014 |
1.3 | |||
|
|
|
|||
| (1) | See Note 2 to the Combined Financial Statements. |
| Intangible Assets Restated(1) |
||||
| Cost |
||||
| Balance at December 31, 2012 |
1.7 | |||
| Net foreign translation impact |
(0.1 | ) | ||
|
|
|
|||
| Balance at December 31, 2013 |
1.6 | |||
|
|
|
|||
| Accumulated Amortization |
| |||
| Balance at December 31, 2012 |
1.2 | |||
| Net foreign translation impact |
0.1 | |||
|
|
|
|||
| Balance at December 31, 2013 |
1.3 | |||
|
|
|
|||
| (1) | See Note 2 to the Combined Financial Statements. |
| Carrying value—Restated(1) |
||||
| As at December 31, 2013 |
0.3 | |||
| As at December 31, 2014 |
0.3 | |||
| As at December 31, 2015 |
0.3 |
| (1) | See Note 2 to the Combined Financial Statements. |
No impairment charges were recorded to the intangible assets during the years ended December 31, 2015, December 31, 2014, and December 31, 2013.
F-90
Table of Contents
CONSTRUCTION PRODUCTS DISTRIBUTION
NOTES TO THE COMBINED FINANCIAL STATEMENTS—(Continued)
9. Provisions
| Restructuring Restated(1) |
||||
| Balance at December 31, 2012 |
5.5 | |||
| Additions |
5.3 | |||
| Payments |
(2.7 | ) | ||
| Impact of foreign currency differences |
(0.4 | ) | ||
|
|
|
|||
| Balance at December 31, 2013 |
7.7 | |||
| Additions |
1.1 | |||
| Payments |
(2.8 | ) | ||
| Impact of foreign currency differences |
(1.0 | ) | ||
|
|
|
|||
| Balance at December 31, 2014 |
5.0 | |||
| Payments |
(3.7 | ) | ||
| Amounts reversed during the year |
(0.6 | ) | ||
| Impact of foreign currency differences |
(0.4 | ) | ||
|
|
|
|||
| Balance at December 31, 2015 |
0.3 | |||
|
|
|
|||
| (1) | See Note 2 to the Combined Financial Statements. |
| 2015 | 2014 | 2013 Restated(1) |
||||||||||
| Current |
0.3 | 2.6 | 4.1 | |||||||||
| Non-current |
— | 2.4 | 3.6 | |||||||||
|
|
|
|
|
|
|
|||||||
| 0.3 | 5.0 | 7.7 | ||||||||||
|
|
|
|
|
|
|
|||||||
| (1) | See Note 2 to the Combined Financial Statements. |
Restructuring
Restructuring costs are recorded in selling, distribution, and administrative costs. As at December 31, 2015, restructuring (recovery) expense was $(0.6) million (December 31, 2014—$1.1 million; December 31, 2013—5.3 million). Provisions for restructuring are recorded in provisions, except for the current portion, which is recorded in trade and other payables. As at December 31, 2015, the current portion of restructuring costs was $0.3 million (December 31, 2014—$2.6 million; December 31, 2013—$4.1 million). As at December 31, 2015, the long term portion of restructuring costs was $nil (December 31, 2014—$2.5 million; December 31, 2013—$3.6 million). The provision is primarily for severance and lease costs.
F-91
Table of Contents
CONSTRUCTION PRODUCTS DISTRIBUTION
NOTES TO THE COMBINED FINANCIAL STATEMENTS—(Continued)
10. Trade and Other Payables
A summary of trade and other payables is as follows:
| Notes | 2015 | 2014 | 2013 Restated(1) |
|||||||||||||
| Trade payables |
42.2 | 44.7 | 51.6 | |||||||||||||
| Accrued incentive |
9.6 | 7.8 | 10.5 | |||||||||||||
| Restructuring provision |
9 | 0.3 | 2.6 | 4.1 | ||||||||||||
| Other payables |
31.2 | 31.0 | 17.9 | |||||||||||||
|
|
|
|
|
|
|
|||||||||||
| Trade and other payables |
83.3 | 86.1 | 84.1 | |||||||||||||
|
|
|
|
|
|
|
|||||||||||
| (1) | See Note 2 to the Combined Financial Statements. |
The average credit period on purchases by CPD is 45 days. No interest is charged on the trade payables between 7 and 30 days from the date of the invoice. Thereafter, interest is charged at 12% per annum on the balance. CPD’s financial risk management policies ensure that trade payables are normally paid within the pre-agreed credit terms.
11. Restricted Cash
During 2013, one of the members of Allroc’s buying group failed to pay an outstanding receivable balance of approximately CAD$4.9 million and disputed the amount on the basis of alleged breaches of contract. Subsequently, the member agreed to deposit approximately CAD$4.9 million into a trust account for distribution once the matter is resolved. The relationship with the member has been terminated and Superior Plus LP commenced legal proceedings to recover the full amount owing. Restrictions on the cash in trust was lifted in 2014.
12. Borrowing
Included in current borrowing is $1.9 million of bank overdraft (December 31, 2014—$1.1 million; December 31, 2013—$1.9 million).
Operating Lease Commitments
CPD has entered into leases on certain vehicles, premises and other equipment. Leases have an average life of between five and seven years with no renewal option included in the contracts. There are no restrictions placed upon CPD by entering into these leases.
Future minimum lease payments under non-cancellable operating leases are as follows:
| 2015 | 2014 | 2013 Restated(1) |
||||||||||
| Not later than one year |
13.8 | 13.5 | 13.2 | |||||||||
| Later than one year and not later than five years |
30.0 | 36.1 | 32.9 | |||||||||
| Later than five years |
6.7 | 2.6 | 10.9 | |||||||||
|
|
|
|
|
|
|
|||||||
| 50.5 | 52.2 | 57.0 | ||||||||||
|
|
|
|
|
|
|
|||||||
| (1) | See Note 2 to the Combined Financial Statements. |
F-92
Table of Contents
CONSTRUCTION PRODUCTS DISTRIBUTION
NOTES TO THE COMBINED FINANCIAL STATEMENTS—(Continued)
Obligations under finance lease
Finance leases relate to construction products vehicles, equipment and office space with lease terms of five to 15 years. CPD has options to purchase the assets for a nominal amount at the conclusion of the lease agreements. CPD’s obligations under finance leases are secured by the lessors’ title to the leased assets.
| Minimum Lease Payments | Present Value of Minimum Lease Payments |
|||||||||||||||||||||||
| 2015 | 2014 | 2013 Restated(1) |
2015 | 2014 | 2013 Restated(1) |
|||||||||||||||||||
| Not later than one year |
3.4 | 3.0 | 2.8 | 2.7 | 2.3 | 2.4 | ||||||||||||||||||
| Later than one year and not later than five years |
11.1 | 8.9 | 7.1 | 9.8 | 7.9 | 6.3 | ||||||||||||||||||
| Later than five years |
2.4 | 2.0 | 1.2 | 2.3 | 1.8 | 1.1 | ||||||||||||||||||
| Less: future finance charges |
(2.1 | ) | (1.9 | ) | (1.3 | ) | — | — | — | |||||||||||||||
|
|
|
|
|
|
|
|
|
|
|
|
|
|||||||||||||
| Present value of minimum lease payments |
14.8 | 12.0 | 9.8 | 14.8 | 12.0 | 9.8 | ||||||||||||||||||
|
|
|
|
|
|
|
|
|
|
|
|
|
|||||||||||||
| (1) | See Note 2 to the Combined Financial Statements. |
Included in the combined balance sheets as at December 31:
| 2015 | 2014 | 2013 Restated(1) |
||||||||||
| Current portion of finance lease |
2.7 | 2.3 | 2.4 | |||||||||
| Non-current portion of finance lease |
12.1 | 9.7 | 7.4 | |||||||||
|
|
|
|
|
|
|
|||||||
| 14.8 | 12.0 | 9.8 | ||||||||||
|
|
|
|
|
|
|
|||||||
| (1) | See Note 2 to the Combined Financial Statements. |
Repayment requirements are as follows:
| Current maturities |
2.7 | |||
| Due in 2017 |
2.9 | |||
| Due in 2018 |
2.7 | |||
| Due in 2019 |
2.3 | |||
| Due in 2020 |
1.9 | |||
| Subsequent to 2020 |
2.3 | |||
|
|
|
|||
| Total |
14.8 | |||
|
|
|
F-93
Table of Contents
CONSTRUCTION PRODUCTS DISTRIBUTION
NOTES TO THE COMBINED FINANCIAL STATEMENTS—(Continued)
13. Related-party Note Payable
The related-party note was created to finance the acquisition of Specialty Products and Insulation and is between Superior Plus US Financing Inc. (lender) and Specialty Products and Insulation (borrower).
| Date of Maturity |
Effective Interest Rate |
2015 | 2014 | 2013 Restated(1) |
||||||||||||||||
| Related-party notes |
||||||||||||||||||||
| Related-party notes |
September 2016 | 9.75 | % | 131.3 | 131.3 | 131.3 | ||||||||||||||
|
|
|
|
|
|
|
|
|
|
|
|||||||||||
| (1) | See Note 2 to the Combined Financial Statements. |
14. Financial Instruments
Superior enters into foreign currency forward contracts on behalf of CPD in order to reduce foreign currency risk. The unrealized gains and losses associated with foreign currency contracts held by Superior Plus LP were allocated to these CPD financial statements. Below is the summary of the gains and losses included in net earnings:
| Asset (Liability) | ||||||||||||||||||||||||||||
| Description |
Notional(1) | Term | Effective Rate |
Fair Value Input Level |
December 31, 2015 |
December 31, 2014 |
December 31, 2013 Restated(2) |
|||||||||||||||||||||
| Foreign currency forward contracts, net sale |
US$ | 57.0 | 2016-2017 | 1.17 | Level 1 | (8.8 | ) | (3.2 | ) | (0.6 | ) | |||||||||||||||||
| (1) | Notional values as at December 31, 2015. |
| (2) | See Note 2 to the Combined Financial Statements. |
| Description |
Current Assets |
Long- term Assets |
Current Liabilities |
Long- term Liabilities |
||||||||||||
| Foreign currency forward contracts, net sale |
— | — | 5.8 | 3.0 | ||||||||||||
|
|
|
|
|
|
|
|
|
|||||||||
| As at December 31, 2015 |
— | — | 5.8 | 3.0 | ||||||||||||
|
|
|
|
|
|
|
|
|
|||||||||
| Description |
Current Assets |
Long- term Assets |
Current Liabilities |
Long- term Liabilities |
||||||||||||
| Foreign currency forward contracts, net sale |
— | — | 1.7 | 1.5 | ||||||||||||
|
|
|
|
|
|
|
|
|
|||||||||
| As at December 31, 2014 |
— | — | 1.7 | 1.5 | ||||||||||||
|
|
|
|
|
|
|
|
|
|||||||||
| Description |
Current Assets |
Long- term Assets |
Current Liabilities |
Long- term Liabilities |
||||||||||||
| Foreign currency forward contracts, net sale |
— | — | — | 0.6 | ||||||||||||
| As at December 31, 2013—Restated(1) |
— | — | — | 0.6 | ||||||||||||
| (1) | See Note 2 to the Combined Financial Statements. |
F-94
Table of Contents
CONSTRUCTION PRODUCTS DISTRIBUTION
NOTES TO THE COMBINED FINANCIAL STATEMENTS—(Continued)
| 2015 | 2014 | 2013—Restated(1) | ||||||||||||||||||||||
| Description |
Realized Loss |
Unrealized Loss |
Realized Loss |
Unrealized Loss |
Realized Gain |
Unrealized Loss |
||||||||||||||||||
| Foreign currency forward contracts, net sale |
(3.6 | ) | (6.6 | ) | (1.1 | ) | (2.7 | ) | 0.8 | (2.1 | ) | |||||||||||||
|
|
|
|
|
|
|
|
|
|
|
|
|
|||||||||||||
| Total gains and (losses) |
(3.6 | ) | (6.6 | ) | (1.1 | ) | (2.7 | ) | 0.8 | (2.1 | ) | |||||||||||||
|
|
|
|
|
|
|
|
|
|
|
|
|
|||||||||||||
| (1) | See Note 2 to the Combined Financial Statements. |
Realized gains or losses on financial and non-financial derivatives and foreign currency translation gains or losses on the revaluation of Canadian domiciled US-denominated working capital have been classified on the statement of net earnings based on the underlying nature of the financial statement line item and/or the economic exposure being managed.
The following summarizes CPD’s classification and measurement of financial assets and liabilities:
| Classification | Measurement | |||||||
| Financial Assets |
||||||||
| Cash and cash equivalents |
Loans and receivables | Amortized cost | ||||||
| Trade and other receivables |
Loans and receivables | Amortized cost | ||||||
| Derivative assets |
FVTNE | Fair value | ||||||
| Financial liabilities |
||||||||
| Trade and other payables |
Other liabilities | Amortized cost | ||||||
| Borrowing |
Other liabilities | Amortized cost | ||||||
| Derivative liabilities |
FVTNE | Fair value | ||||||
Non-Derivative Financial Instruments
The fair value of CPD’s cash and cash equivalents, trade and other receivables, related-party receivables, trade and other payables, related-party notes, and interest payable approximates their carrying value due to the short-term nature of these amounts.
Financial Instruments—Risk Management
Market Risk
Derivative and non-financial derivatives are used by Superior, on behalf of CPD, to manage its exposure to fluctuations in foreign currency exchange rates. Superior assesses the inherent risks of these instruments by grouping derivative and non-financial derivatives related to the exposures these instruments mitigate. Superior’s policy is not to use derivative or non-financial derivative instruments for speculative purposes. Superior does not formally designate its derivatives as hedges, and as a result, Superior does not apply hedge accounting and is required to designate its derivatives and non-financial derivatives as held for trading.
Superior, on behalf of its operating divisions, enters into foreign currency forward contracts with ten counterparties to manage the economic exposure of its operations to movements in foreign currency exchange rates.
F-95
Table of Contents
CONSTRUCTION PRODUCTS DISTRIBUTION
NOTES TO THE COMBINED FINANCIAL STATEMENTS—(Continued)
Credit Risk
Superior utilizes a variety of counterparties in relation to its derivative and non-financial derivative instruments in order to mitigate its counterparty risk. Superior assesses the credit-worthiness of its significant counterparties at the inception and throughout the term of a contract. Superior is also exposed to customer credit risk. Overall, Superior’s credit quality is enhanced by its portfolio of customers which is diversified across geographical (primarily Canada and the United States) and end-use (primarily commercial, residential and industrial) markets.
Allowances for doubtful accounts and past due receivables are reviewed by CPD at each balance sheet date. CPD updates its estimate of the allowance for doubtful accounts based on the evaluation of the recoverability of trade receivables with each customer taking into account historical collection trends of past due accounts and current economic conditions. Trade receivables are written-off once it is determined they are uncollectible.
Liquidity Risk
Liquidity risk is the risk that CPD cannot meet a demand for cash or fund an obligation as it comes due. Liquidity risk also includes the risk of not being able to liquidate assets in a timely manner at a reasonable price.
To ensure it is able to react to contingencies and investment opportunities quickly, Superior maintains sources of liquidity at the corporate and subsidiary levels. The main sources of liquidity for CPD are cash, financial assets, and intercompany financing.
CPD is subject to the risks associated with debt financing, including the ability to refinance indebtedness at maturity. CPD believes these risks are mitigated through the use of long-term debt secured by high-quality assets, maintaining debt levels that in management’s opinion are appropriate, and by diversifying maturities over an extended period. Superior also seeks to include in its agreements terms that protect it from liquidity issues of counterparties that might otherwise impact liquidity.
CPD’s contractual obligations associated with its financial liabilities are as follows:
| 2016 | 2017 | 2018 | 2019 | 2020 | 2020 and Thereafter |
Total | ||||||||||||||||||||||
| Borrowing |
4.6 | 2.9 | 2.7 | 2.3 | 1.9 | 2.3 | 16.7 | |||||||||||||||||||||
|
|
|
|
|
|
|
|
|
|
|
|
|
|
|
|||||||||||||||
CPD’s contractual obligations are considered normal-course operating commitments and do not include the impact of mark-to-market fair values on financial and non-financial derivatives. CPD expects to fund these obligations through a combination of cash flow from operations, proceeds on its revolving term bank credit facilities and proceeds on the issuance of share capital.
15. Income Taxes
CPD recognizes a provision for income taxes that are subject to current and deferred income taxes, including United States income tax and United States non-resident withholding tax.
F-96
Table of Contents
CONSTRUCTION PRODUCTS DISTRIBUTION
NOTES TO THE COMBINED FINANCIAL STATEMENTS—(Continued)
Total income taxes are different from the amount computed by applying the corporate Canadian enacted statutory rate of 26% for the years ended December 31, 2015, 2014 and 2013. Income tax expense (recovery) was calculated are as follows:
| Note | 2015 | 2014 | 2013 Restated(1) |
|||||||||||||
| Net earnings |
4.2 | 7.6 | 2.0 | |||||||||||||
| Income tax expense (recovery) |
3.2 | (0.2 | ) | 3.6 | ||||||||||||
|
|
|
|
|
|
|
|||||||||||
| Net earnings of CPD before taxes |
7.4 | 7.4 | 5.6 | |||||||||||||
| Computed income tax expense (recovery) |
2.0 | 1.9 | 1.1 | |||||||||||||
| Higher effective foreign tax rates |
1.2 | (0.3 | ) | 0.3 | ||||||||||||
| Non-deductible costs and other |
0.4 | 0.3 | 0.2 | |||||||||||||
| Prior period adjustment |
2 | (0.4 | ) | (2.2 | ) | 1.9 | ||||||||||
| Other |
— | 0.1 | 0.1 | |||||||||||||
|
|
|
|
|
|
|
|||||||||||
| Income tax expense (recovery) |
3.2 | (0.2 | ) | 3.6 | ||||||||||||
|
|
|
|
|
|
|
|||||||||||
| (1) | See Note 2 to the Combined Financial Statements. |
Total income tax expense or recovery for the years ended December 31, 2015, 2014, and 2013 is comprised of:
| 2015 | 2014 | 2013 Restated(1) |
||||||||||
| Current income tax expense |
||||||||||||
| Current income tax charge |
4.7 | 4.1 | 4.3 | |||||||||
|
|
|
|
|
|
|
|||||||
| Total current income tax expense |
4.7 | 4.1 | 4.3 | |||||||||
| Deferred income tax recovery |
||||||||||||
| Relating to origination and reversal of temporary difference |
(1.1 | ) | (2.2 | ) | (2.7 | ) | ||||||
| Adjustments in respect of previous year |
(0.4 | ) | (2.1 | ) | 2.0 | |||||||
|
|
|
|
|
|
|
|||||||
| Total deferred income tax recovery |
(1.5 | ) | (4.3 | ) | (0.7 | ) | ||||||
|
|
|
|
|
|
|
|||||||
| Total income tax expense (recovery) |
3.2 | (0.2 | ) | 3.6 | ||||||||
|
|
|
|
|
|
|
|||||||
| (1) | See Note 2 to the Combined Financial Statements. |
| 2015 |
Opening Balance |
(Credited)/ charged to net earnings |
Exchange differences |
Other | Closing Balance |
|||||||||||||||
| Reserves |
16.6 | (0.3 | ) | (0.2 | ) | — | 16.1 | |||||||||||||
| Unrealized foreign exchange (losses) gains |
0.9 | 1.7 | (0.3 | ) | — | 2.3 | ||||||||||||||
| Property, plant and equipment |
(2.4 | ) | (1.2 | ) | (0.3 | ) | — | (3.9 | ) | |||||||||||
| Capital leases |
4.3 | 1.2 | (0.2 | ) | — | 5.3 | ||||||||||||||
|
|
|
|
|
|
|
|
|
|
|
|||||||||||
| Total |
19.4 | 1.4 | (1.0 | ) | — | 19.8 | ||||||||||||||
|
|
|
|
|
|
|
|
|
|
|
|||||||||||
F-97
Table of Contents
CONSTRUCTION PRODUCTS DISTRIBUTION
NOTES TO THE COMBINED FINANCIAL STATEMENTS—(Continued)
| 2014 |
Opening Balance |
(Credited)/ charged to net earnings |
Exchange differences |
Other | Closing Balance |
|||||||||||||||
| Reserves |
12.7 | 4.4 | (0.5 | ) | — | 16.6 | ||||||||||||||
| Unrealized foreign exchange losses |
0.2 | 0.7 | — | — | 0.9 | |||||||||||||||
| Property, plant and equipment |
(0.2 | ) | (1.9 | ) | (0.3 | ) | — | (2.4 | ) | |||||||||||
| Capital leases |
3.3 | 1.1 | (0.1 | ) | — | 4.3 | ||||||||||||||
|
|
|
|
|
|
|
|
|
|
|
|||||||||||
| Total |
16.0 | 4.3 | (0.9 | ) | — | 19.4 | ||||||||||||||
|
|
|
|
|
|
|
|
|
|
|
|||||||||||
| 2013—Restated(1) |
Opening Balance |
(Credited)/ charged to net earnings |
Exchange differences |
Other | Closing Balance |
|||||||||||||||
| Reserves |
9.9 | 3.1 | (0.3 | ) | — | 12.7 | ||||||||||||||
| Unrealized foreign exchange losses |
(0.4 | ) | 0.5 | — | — | 0.2 | ||||||||||||||
| Property, plant and equipment |
3.5 | (2.2 | ) | (0.2 | ) | (1.3 | ) | (0.2 | ) | |||||||||||
| Capital leases |
2.8 | (0.7 | ) | (0.1 | ) | 1.3 | 3.3 | |||||||||||||
| Total |
15.8 | 0.7 | (0.6 | ) | — | 16.0 | ||||||||||||||
| (1) | See Note 2 to the Combined Financial Statements. |
Deferred taxes reported in the two preceding tables are presented on a functional basis while deferred taxes reported on the balance sheet are on a legal entity basis.
The net deferred income tax asset relates to the following tax jurisdictions as at December 31, 2015, 2014, and 2013:
| 2015 | 2014 | 2013 Restated(1) |
||||||||||
| Canada |
5.3 | 6.1 | 7.1 | |||||||||
| United States |
14.5 | 13.3 | 8.9 | |||||||||
|
|
|
|
|
|
|
|||||||
| Total net deferred income tax asset |
19.8 | 19.4 | 16.0 | |||||||||
|
|
|
|
|
|
|
|||||||
| (1) | See Note 2 to the Combined Financial Statements. |
CPD has available to carry forward the following as at December 31, 2015 and 2014:
| 2015 | 2014 | 2013 Restated(1) |
||||||||||
| United States non capital losses—state |
17.4 | 20.1 | 20.1 | |||||||||
|
|
|
|
|
|
|
|||||||
| (1) | See Note 2 to the Combined Financial Statements. |
As at December 31 CPD has the following balances in respect of which no deferred tax asset was recognized:
| 2015 | 2014 | 2013 Restated(1) |
||||||||||
| United States non capital losses—state |
17.4 | 20.1 | 20.1 | |||||||||
|
|
|
|
|
|
|
|||||||
| Total unrecognized deferred income tax assets |
17.4 | 20.1 | 20.1 | |||||||||
|
|
|
|
|
|
|
|||||||
| (1) | See Note 2 to the Combined Financial Statements. |
F-98
Table of Contents
CONSTRUCTION PRODUCTS DISTRIBUTION
NOTES TO THE COMBINED FINANCIAL STATEMENTS—(Continued)
Deferred tax assets have not been recognized for the above temporary differences as it is not probable that the respective entities to which they relate will generate sufficient future taxable income against which to utilize the temporary differences.
16. Supplemental Disclosure of Combined Statement of Total Comprehensive Income
Revenue is recognized at the fair value of consideration received or receivable when the significant risks and rewards of ownership have been transferred.
| 2015 | 2014 | 2013 Restated(1) |
||||||||||
| Revenues |
||||||||||||
| Revenue from products |
745.3 | 761.9 | 776.1 | |||||||||
| Realized gains on derivative financial instruments |
— | — | 0.8 | |||||||||
|
|
|
|
|
|
|
|||||||
| 745.3 | 761.9 | 776.9 | ||||||||||
|
|
|
|
|
|
|
|||||||
| Cost of sales (includes products and services) |
||||||||||||
| Cost of products and services |
(556.7 | ) | (573.5 | ) | (585.3 | ) | ||||||
| Realized losses on derivative financial instruments |
(3.6 | ) | (1.1 | ) | — | |||||||
|
|
|
|
|
|
|
|||||||
| (560.3 | ) | (574.6 | ) | (585.3 | ) | |||||||
|
|
|
|
|
|
|
|||||||
| Selling, distribution and administrative costs |
||||||||||||
| Other selling, distribution and administrative costs |
(53.3 | ) | (58.1 | ) | (57.5 | ) | ||||||
| Restructuring costs |
— | (1.1 | ) | (5.3 | ) | |||||||
| Employee costs |
(98.4 | ) | (98.7 | ) | (100.9 | ) | ||||||
| Depreciation included in selling, distribution and administrative costs |
(5.8 | ) | (5.9 | ) | (5.9 | ) | ||||||
| Losses on disposal of assets |
— | — | (0.1 | ) | ||||||||
|
|
|
|
|
|
|
|||||||
| (157.5 | ) | (163.8 | ) | (169.7 | ) | |||||||
|
|
|
|
|
|
|
|||||||
| Finance expense |
||||||||||||
| Interest on borrowing |
(12.8 | ) | (12.8 | ) | (13.7 | ) | ||||||
| Interest on obligations under finance leases |
(0.7 | ) | (0.6 | ) | (0.5 | ) | ||||||
|
|
|
|
|
|
|
|||||||
| (13.5 | ) | (13.4 | ) | (14.2 | ) | |||||||
|
|
|
|
|
|
|
|||||||
| (1) | See Note 2 to the Combined Financial Statements. |
17. Supplemental Disclosure of Non-Cash Operating Working Capital Changes
| 2015 | 2014 | 2013 Restated(1) |
||||||||||
| Changes in non-cash working capital |
||||||||||||
| Trade receivables and other |
(11.5 | ) | (18.0 | ) | (0.5 | ) | ||||||
| Inventories |
(6.5 | ) | (8.3 | ) | (3.5 | ) | ||||||
| Trade payable and other payables |
4.0 | 2.8 | 9.0 | |||||||||
| Other |
(3.0 | ) | (6.9 | ) | (3.5 | ) | ||||||
|
|
|
|
|
|
|
|||||||
| Change in non-cash operating working capital |
(17.0 | ) | (30.4 | ) | 1.5 | |||||||
|
|
|
|
|
|
|
|||||||
| (1) | See Note 2 to the Combined Financial Statements. |
F-99
Table of Contents
CONSTRUCTION PRODUCTS DISTRIBUTION
NOTES TO THE COMBINED FINANCIAL STATEMENTS—(Continued)
18. Related-party Transactions
As at December 31, 2015, CPD had an account receivable balance of $89.4 million (December 31, 2014—$104.6 million, December 31, 2013—$118.0 million) due from Superior Plus Corp. and its subsidiaries. All related party balances held with Superior Plus Corp. are non-interest bearing instruments and are due on demand.
| 2015 | 2014 | 2013 Restated(1) |
||||||||||
| Due from Superior Plus Corp. |
2.8 | 3.2 | 3.3 | |||||||||
| Due to Superior Plus Canada Financing Inc. |
(19.1 | ) | (19.1 | ) | (6.9 | ) | ||||||
| Due from Superior Plus US Holdings Inc. |
0.9 | 0.5 | 0.6 | |||||||||
| Due from Superior Plus LP |
104.8 | 120.0 | 121.0 | |||||||||
|
|
|
|
|
|
|
|||||||
| Related-party receivable, at the end of the year |
89.4 | 104.6 | 118.0 | |||||||||
|
|
|
|
|
|
|
|||||||
| (1) | See Note 2 to the Combined Financial Statements. |
Remuneration of directors and other key management personnel
The key management personnel of CPD are comprised of executives of CPD’s businesses.
The remuneration of key management personnel during the twelve months ended December 31, were as follows:
| Twelve months ended December 31, |
2015 | 2014 | 2013 Restated(1) |
|||||||||
| Salary and short-term employee benefits |
0.3 | 0.3 | 0.7 | |||||||||
| Share-based payments |
— | 0.9 | 0.1 | |||||||||
|
|
|
|
|
|
|
|||||||
| 0.3 | 1.2 | 0.8 | ||||||||||
|
|
|
|
|
|
|
|||||||
| (1) | See Note 2 to the Combined Financial Statements. |
Construction Products Division Long-Term Incentive Plan
The Corporation established the Construction Products Division Long-Term Incentive Plan (CPD LTIP) in 2015. The CPD LTIP provides participants with the potential to receive a cash payment in the event of the sale of the CPD Business or a change of control of the Corporation, provided that at the time of such transaction there has been an increase in the value of the CPD business from the base value of the business as established at the time the Plan was created. The maximum amount payable as a contingent liability by Superior under the plan is 10% of the increased value of the CPD Business from the base value.
19. Group Entities
| Entities |
Country of Incorporation |
|||
| Superior Plus Construction Products Corp. |
United States | |||
| The Winroc Corporation (Midwest) |
United States | |||
| Winroc, a division of Superior Plus LP |
Canada | |||
F-100
Table of Contents
CONSTRUCTION PRODUCTS DISTRIBUTION
NOTES TO THE COMBINED FINANCIAL STATEMENTS—(Continued)
20. Geographic Information
| Canada | United States | Total Combined |
||||||||||
| Revenues for the year ended December 31, 2015 |
229.2 | 516.1 | 745.3 | |||||||||
| Property, plant and equipment as at December 31, 2015 |
8.5 | 25.5 | 34.0 | |||||||||
| Intangible assets as at December 31, 2015 |
— | 0.3 | 0.3 | |||||||||
| Total assets as at December 31, 2015 |
173.6 | 146.5 | 320.1 | |||||||||
|
|
|
|
|
|
|
|||||||
| Revenues for the year ended December 31, 2014 |
263.8 | 498.1 | 761.9 | |||||||||
| Property, plant and equipment as at December 31, 2014 |
7.1 | 15.5 | 22.6 | |||||||||
| Intangible assets as at December 31, 2014 |
— | 0.3 | 0.3 | |||||||||
| Total assets as at December 31, 2014 |
202.9 | 134.9 | 337.8 | |||||||||
|
|
|
|
|
|
|
|||||||
| Revenues for the year ended December 31, 2013 |
306.8 | 470.1 | 776.9 | |||||||||
| Property, plant and equipment as at December 31, 2013 |
9.3 | 10.7 | 20.0 | |||||||||
| Intangible assets as at December 31, 2013 |
— | 0.3 | 0.3 | |||||||||
| Total assets as at December 31, 2013(1) |
214.8 | 125.0 | 339.8 | |||||||||
|
|
|
|
|
|
|
|||||||
| (1) | Restated. See Note 2 to the Combined Financial Statements. |
21. Subsequent Events
Superior Plus Corp (SPC) entered into a non-binding Letter of Intent (LOI) dated May 13, 2016 with Lone Star Americas Acquisitions (LSAA), LLC which outlines the general terms and conditions pursuant to which LSAA will acquire the assets (Assets) of Superior Plus Construction Products Division. Under the terms of the LOI the deal is contingent on LSAA obtaining the financing required to purchase Assets from SPC, should financing not be available LSAA will pay SPC a break fee equal to 10% of the purchase price.
F-101
Table of Contents
Construction Products Distribution
Condensed Combined Financial Statements
For the six months ended June 30, 2016 and 2015
F-102
Table of Contents
CONSTRUCTION PRODUCTS DISTRIBUTION
Condensed Combined Balance Sheets
| (unaudited, millions of United States dollars) |
Note | June 30 2016 |
December 31 2015 |
|||||||||
| Assets |
||||||||||||
| Current Assets |
||||||||||||
| Cash and cash equivalents |
0.9 | — | ||||||||||
| Trade and other receivables |
4 | 119.5 | 108.0 | |||||||||
| Prepaid expenses |
4.5 | 4.5 | ||||||||||
| Inventories |
5 | 66.6 | 64.1 | |||||||||
| Related-party receivables |
14 | 89.1 | 89.4 | |||||||||
|
|
|
|
|
|||||||||
| Total Current Assets |
280.6 | 266.0 | ||||||||||
|
|
|
|
|
|||||||||
| Non-Current Assets |
||||||||||||
| Property, plant and equipment |
6 | 41.7 | 34.0 | |||||||||
| Intangible assets |
0.3 | 0.3 | ||||||||||
| Deferred tax |
11 | 19.5 | 19.8 | |||||||||
|
|
|
|
|
|||||||||
| Total Non-Current Assets |
61.5 | 54.1 | ||||||||||
|
|
|
|
|
|||||||||
| Total Assets |
342.1 | 320.1 | ||||||||||
|
|
|
|
|
|||||||||
| Liabilities and Owners’ Net Investment |
||||||||||||
| Current Liabilities |
||||||||||||
| Trade and other payables |
7 | 94.4 | 83.3 | |||||||||
| Borrowing |
8 | 3.8 | 4.6 | |||||||||
| Unrealized losses on derivatives financial instruments |
10 | 2.7 | 5.8 | |||||||||
| Related-party notes |
9 | 131.3 | 131.3 | |||||||||
|
|
|
|
|
|||||||||
| Total Current Liabilities |
232.2 | 225.0 | ||||||||||
|
|
|
|
|
|||||||||
| Non-Current Liabilities |
||||||||||||
| Borrowing |
8 | 12.4 | 12.1 | |||||||||
| Unrealized losses on derivative financial instruments |
10 | 0.8 | 3.0 | |||||||||
|
|
|
|
|
|||||||||
| Total Non-Current Liabilities |
13.2 | 15.1 | ||||||||||
|
|
|
|
|
|||||||||
| Total Liabilities |
245.4 | 240.1 | ||||||||||
|
|
|
|
|
|||||||||
| Owners’ Net Investment |
||||||||||||
| Paid in capital |
80.1 | 80.1 | ||||||||||
| Retained earnings |
28.1 | 20.1 | ||||||||||
| Accumulated other comprehensive loss |
(11.5 | ) | (20.2 | ) | ||||||||
|
|
|
|
|
|||||||||
| Total Owners’ Net Investment |
96.7 | 80.0 | ||||||||||
|
|
|
|
|
|||||||||
| Total Liabilities and Owners’ Net Investment |
342.1 | 320.1 | ||||||||||
|
|
|
|
|
|||||||||
See accompanying Notes to the Condensed Combined Financial Statements.
F-103
Table of Contents
CONSTRUCTION PRODUCTS DISTRIBUTION
Condensed Combined Statements of Changes in Owners’ Net Investment
| (unaudited, millions of United States dollars) |
Paid in Capital |
Retained Earnings |
Accumulated Other Comprehensive Loss |
Total | ||||||||||||
| December 31, 2014 |
80.1 | 15.9 | 5.7 | 101.7 | ||||||||||||
| Net earnings |
— | 0.9 | — | 0.9 | ||||||||||||
| Unrealized foreign currency losses on translation of foreign operations |
— | — | (10.9 | ) | (10.9 | ) | ||||||||||
|
|
|
|
|
|
|
|
|
|||||||||
| June 30, 2015 |
80.1 | 16.8 | (5.2 | ) | 91.7 | |||||||||||
|
|
|
|
|
|
|
|
|
|||||||||
| December 31, 2015 |
80.1 | 20.1 | (20.2 | ) | 80.0 | |||||||||||
| Net earnings |
— | 8.0 | — | 8.0 | ||||||||||||
| Unrealized foreign currency gains on translation of foreign operations |
— | — | 8.7 | 8.7 | ||||||||||||
|
|
|
|
|
|
|
|
|
|||||||||
| June 30, 2016 |
80.1 | 28.1 | (11.5 | ) | 96.7 | |||||||||||
|
|
|
|
|
|
|
|
|
|||||||||
See accompanying Notes to the Condensed Combined Financial Statements.
F-104
Table of Contents
CONSTRUCTION PRODUCTS DISTRIBUTION
Condensed Combined Statements of Net Earnings and Total Comprehensive Income (Loss)
| Three months ended June 30 |
Six months ended June 30 |
|||||||||||||||||||
| (unaudited, millions of United States dollars) |
Notes | 2016 | 2015 | 2016 | 2015 | |||||||||||||||
| REVENUES |
12 | 199.3 | 195.0 | 378.6 | 370.5 | |||||||||||||||
| Cost of sales |
12 | (148.7 | ) | (146.5 | ) | (282.9 | ) | (279.1 | ) | |||||||||||
|
|
|
|
|
|
|
|
|
|||||||||||||
| Gross profit |
50.6 | 48.5 | 95.7 | 91.4 | ||||||||||||||||
|
|
|
|
|
|
|
|
|
|||||||||||||
| EXPENSES |
||||||||||||||||||||
| Selling, distribution and administrative costs |
12 | (42.5 | ) | (39.5 | ) | (83.0 | ) | (81.0 | ) | |||||||||||
| Finance income (expense) |
12 | (3.4 | ) | (3.4 | ) | (6.8 | ) | (6.7 | ) | |||||||||||
| Unrealized gain (loss) on derivatives financial instruments |
10 | 1.2 | 0.8 | 5.5 | (1.5 | ) | ||||||||||||||
|
|
|
|
|
|
|
|
|
|||||||||||||
| (44.7 | ) | (42.1 | ) | (84.3 | ) | (89.2 | ) | |||||||||||||
|
|
|
|
|
|
|
|
|
|||||||||||||
| Net earnings before income taxes |
5.9 | 6.4 | 11.4 | 2.2 | ||||||||||||||||
| Income tax expense |
(1.9 | ) | (2.2 | ) | (3.4 | ) | (1.3 | ) | ||||||||||||
|
|
|
|
|
|
|
|
|
|||||||||||||
| Net earnings |
4.0 | 4.2 | 8.0 | 0.9 | ||||||||||||||||
|
|
|
|
|
|
|
|
|
|||||||||||||
| Net earnings |
4.0 | 4.2 | 8.0 | 0.9 | ||||||||||||||||
| Other comprehensive income (loss): |
||||||||||||||||||||
| Unrealized foreign currency gains (losses) on translation of foreign operations |
(0.5 | ) | 2.3 | 8.7 | (10.9 | ) | ||||||||||||||
|
|
|
|
|
|
|
|
|
|||||||||||||
| Total comprehensive income (loss) for the period |
3.5 | 6.5 | 16.7 | (10.0 | ) | |||||||||||||||
|
|
|
|
|
|
|
|
|
|||||||||||||
See accompanying Notes to the Condensed Combined Financial Statements.
F-105
Table of Contents
CONSTRUCTION PRODUCTS DISTRIBUTION
Condensed Combined Statements of Cash Flows
| Six months ended June 30 |
||||||||||||
| (unaudited, millions of United States dollars except per share amounts) |
Notes | 2016 | 2015 | |||||||||
| OPERATING ACTIVITIES |
||||||||||||
| Net earnings for the period |
8.0 | 0.9 | ||||||||||
| Adjustments for: |
||||||||||||
| Depreciation included in selling, distribution and administrative costs |
6 | 3.1 | 2.9 | |||||||||
| Finance expenses recognized in net earnings |
0.4 | 0.3 | ||||||||||
| Finance expenses borrowing on related party borrowings recognized in net earnings (loss) |
6.4 | 6.4 | ||||||||||
| Unrealized (gains) losses on derivative financial instruments |
10 | (5.5 | ) | 1.5 | ||||||||
| Income tax expense (recovery) recognized in net earnings |
3.4 | 1.3 | ||||||||||
| Increase (decrease) in non-cash operating working capital |
13 | (8.7 | ) | (0.2 | ) | |||||||
|
|
|
|
|
|||||||||
| Interest paid on related-party notes |
(6.4 | ) | (6.4 | ) | ||||||||
|
|
|
|
|
|||||||||
| Interest paid |
(0.4 | ) | (0.3 | ) | ||||||||
|
|
|
|
|
|||||||||
| Cash flows from operating activities |
0.3 | 6.4 | ||||||||||
|
|
|
|
|
|||||||||
| INVESTING ACTIVITIES |
||||||||||||
| Purchase of property, plant and equipment |
6 | (8.0 | ) | (4.4 | ) | |||||||
|
|
|
|
|
|||||||||
| Cash flows used in investing activities |
(8.0 | ) | (4.4 | ) | ||||||||
|
|
|
|
|
|||||||||
| FINANCING ACTIVITIES |
||||||||||||
| Repayment of finance lease obligations |
(1.6 | ) | (1.3 | ) | ||||||||
| Related-party borrowings (repayments) |
10.0 | (0.2 | ) | |||||||||
|
|
|
|
|
|||||||||
| Cash flows from (used in) financing activities |
8.4 | (1.5 | ) | |||||||||
|
|
|
|
|
|||||||||
| Net decrease in cash and cash equivalents |
0.7 | 0.5 | ||||||||||
| Cash and cash equivalents, beginning of period |
— | — | ||||||||||
| Effect of translation of foreign currency-denominated cash and cash equivalents |
0.2 | 0.2 | ||||||||||
|
|
|
|
|
|||||||||
| Cash and cash equivalents, end of period |
0.9 | 0.7 | ||||||||||
|
|
|
|
|
|||||||||
See accompanying notes to the Condensed Combined Financial Statements.
F-106
Table of Contents
CONSTRUCTION PRODUCTS DISTRIBUTION
NOTES TO THE CONDENSED COMBINED FINANCIAL STATEMENTS
(Tabular amounts in United States millions of dollars, except where otherwise noted.)
1. Organization
Construction Products Distribution (CPD) is a distributor of commercial and industrial insulation and specialty walls and ceiling products. CPD has 98 distribution centers, including 15 fabrication facilities, across North America with a presence in 26 states and five provinces. CPD is comprised of three entities, The Winroc Corporation (Midwest), Superior Plus Construction Products Corp. and the division Winroc. The Winroc Corporation (Midwest) and Superior Plus Construction Products Corp. are owned 100% by Superior Plus US Holdings Inc. in the U.S. and 100% of Winroc, a division of Superior Plus LP in Canada. The parent company of CPD is Superior Plus Corp. (Superior). Superior is a publicly traded company with its common shares traded on the Toronto Stock Exchange (TSX) under the exchange symbol SPB.
2. Basis of Presentation
The accompanying condensed combined financial statements present the operations of CPD on a carve-out basis from Superior Plus Corp. as if they had operated as a stand-alone entity. The statements were prepared in accordance with International Accounting Standard 34 Interim Financial Reporting (IAS 34) as issued by the International Accounting Standards Board (IASB) using the accounting policies adopted by CPD’s ultimate parent, Superior, in its annual consolidated financial statements as at and for the year ended December 31, 2015, other than the standards adopted as at January 1, 2016 as discussed in 2(b) below. These accounting policies have been applied consistently to all periods presented in these condensed combined financial statements, and have been applied consistently throughout the combined entities. The condensed combined financial statements were prepared on a going concern basis.
The condensed combined financial statements are presented in United States dollars, CPD’s functional currency. All financial information presented in United States dollars has been rounded to the nearest hundred-thousand. These condensed combined financial statements should be read in conjunction with CPD’s 2015 annual combined financial statements.
The condensed combined financial statements were prepared on the historical cost basis except for the revaluation of certain financial instruments and incorporate the accounts of CPD and its subsidiaries. Subsidiaries are all entities over which CPD has the power to govern the financial and operating policies generally accompanying a shareholding of more than one-half of the voting rights. The results of subsidiaries are included in CPD’s statement of net earnings from date of acquisition, or in the case of disposals, up to the effective date of disposal. All transactions and balances between subsidiaries are eliminated on consolidation. CPD’s entities are all wholly owned directly by Superior Plus US Holdings Inc. and Superior Plus LP.
Significant Accounting Policies
(a) Significant Accounting Judgments, Estimates and Assumptions
The preparation of CPD’s combined financial statements in accordance with IFRS requires management to make judgments, estimates and assumptions that affect the reported amounts of assets, liabilities, net earnings and related disclosure. The estimates and associated assumptions are based on historical experience and various other factors deemed reasonable under the circumstances, the results of which form the basis of making the judgments about carrying values of assets and liabilities that are not readily apparent from other sources. Actual results may differ from these estimates. The areas involving a higher degree of judgment or
F-107
Table of Contents
CONSTRUCTION PRODUCTS DISTRIBUTION
NOTES TO THE CONDENSED COMBINED FINANCIAL STATEMENTS—(Continued)
complexity, or where assumptions and estimates are significant to the financial statements are consistent with those disclosed in CPD’s 2015 annual combined financial statements.
(b) Recent Accounting Pronouncements
Certain new standards, interpretations, amendments and improvements to existing standards were issued by the IASB or International Financial Reporting Interpretations Committee (“IFRIC”) that are mandatory for accounting periods beginning January 1, 2016 or later periods.
IAS 16 and IAS 38—Property, Plant and Equipment and Intangible Assets
The amendments to IAS 16 prohibit entities from using a revenue-based depreciation method for items of property, plant, and equipment. The amendments to IAS 38 introduce a rebuttable presumption that revenue is not an appropriate basis for amortization of an intangible asset. This presumption can only be rebutted in the event that the intangible asset is expressed as a measure of revenue or when it can be demonstrated that revenue and consumption of the economic benefits of the intangible assets are highly correlated. This standard must be applied for accounting periods beginning on or after January 1, 2016, and CPD has accordingly adopted the amendments effective January 1, 2016. CPD amortizes property, plant and equipment and intangible assets using the straight-line method and, therefore, the application of these amendments to IAS 16 and IAS 18 did not have any impact on its consolidated financial statements.
New and revised IFRS standards issued but not yet effective
IFRS 16—Leases
On January 13, 2016, the IASB issued IFRS 16—Leases (“IFRS 16”), which replaces IAS 17—Leases and related interpretations. IFRS 16 provides a single lessee accounting model, requiring the recognition of assets and liabilities for all leases, except those that meet limited exception criteria. IFRS 16 will be applied retrospectively for annual periods beginning on or after January 1, 2019. CPD is currently assessing the potential impact of this standard on its consolidated financial statements.
IFRS 9—Financial Instruments: Classification and Measurement
IFRS 9 was issued in November 2009 and is intended to replace IAS 39—Financial Instruments: Recognition and Measurement. IFRS 9 uses a single approach to determine whether a financial asset is measured at amortized cost or fair value, replacing the multiple rules in IAS 39. The approach in IFRS 9 is based on how an entity manages its financial instruments in the context of its business model and the contractual cash flow characteristics of the financial assets. The new standard also requires a single impairment method to be used, replacing the multiple impairment methods in IAS 39. Requirements for financial liabilities were added in October 2010 and they largely carried forward existing requirements in IAS 39 except that fair value changes due to credit risk for liabilities designated at fair value through profit and loss would generally be recorded in other comprehensive income.
A finalized version of IFRS 9 was issued in July 2014 to include impairment requirements for financial assets and limited amendments to the classification and measurement requirements by introducing a fair value through other comprehensive income measurement
F-108
Table of Contents
CONSTRUCTION PRODUCTS DISTRIBUTION
NOTES TO THE CONDENSED COMBINED FINANCIAL STATEMENTS—(Continued)
category for certain simple debt instruments. This standard must be applied for accounting periods beginning on or after January 1, 2018, with earlier adoption permitted. CPD intends to adopt the new standard on the required effective date, and is currently assessing the effect of IFRS 9 on its financial results and financial position. Changes, if any, are not expected to be material.
IFRS 15—Revenue from Contracts with Customers
IFRS 15 was issued in May 2014, establishing a single comprehensive model for entities to use in accounting for revenue arising from contracts with customers. IFRS 15 supersedes the current revenue recognition guidance including IAS 18—Revenue and IAS 11—Construction Contracts, as well as the related interpretation when it becomes effective. Under IFRS 15, an entity should recognize revenue to depict the transfer of promised goods or services to customers in an amount that reflects the consideration to which the entity expects to be entitled in exchange for those goods or services. An entity is required to recognize revenue when the performance obligation is satisfied. Either a full or modified retrospective application is required for annual periods beginning on or after January 1, 2018 with early adoption permitted. CPD is currently assessing the impact of IFRS 15 and plans to adopt the new standard on the required effective date.
3. Seasonality of Operations
Sales typically peak during the second and third quarters with the seasonal increase in building and renovation activities. They then decline through the fourth quarter and into the subsequent first quarter. Similarly, net working capital is typically at seasonal highs during the second and third quarters, and normally decline to seasonal lows in the fourth and first quarters.
4. Trade and Other Receivables
A summary of trade and other receivables are as follows:
| Note | June 30 2016 | December 31 2015 | ||||||||||
| Trade receivables, net of allowances |
113.5 | 98.6 | ||||||||||
| Accounts receivable—other |
6.0 | 9.4 | ||||||||||
|
|
|
|
|
|||||||||
| Trade and other receivables |
119.5 | 108.0 | ||||||||||
|
|
|
|
|
|||||||||
Pursuant to their respective terms, trade receivables, before deducting an allowance for doubtful accounts, are aged as follows:
| June 30 2016 | December 31 2015 | |||||||
| Current |
95.3 | 69.5 | ||||||
| Past due less than 90 days |
18.3 | 27.0 | ||||||
| Past due over 90 days |
1.2 | 3.4 | ||||||
|
|
|
|
|
|||||
| Trade receivables |
114.8 | 99.9 | ||||||
|
|
|
|
|
|||||
F-109
Table of Contents
CONSTRUCTION PRODUCTS DISTRIBUTION
NOTES TO THE CONDENSED COMBINED FINANCIAL STATEMENTS—(Continued)
The current portion of CPD’s trade receivables is neither impaired nor past due and there are no indications as of the reporting date that the debtors will not make payment.
CPD’s trade receivables are stated after deducting a provision of $1.3 million as at June 30, 2016 (December 31, 2015—$1.3 million).
5. Inventories
The cost of inventories recognized as an expense during the three months and six months ended June 30, 2016 was $144.8 million and $275.7 million respectively (three months and six months ended June 30, 2015—$142.6 million and $271.0). No impairments or write-down reversals were recorded during the six months ended June 30, 2016 and 2015.
6. Property, Plant and Equipment
| Land | Buildings | Equipment | Leasehold Improvements |
Total | ||||||||||||||||
| Cost |
||||||||||||||||||||
| Balance at December 31, 2015 |
0.6 | 2.4 | 57.2 | 5.2 | 65.4 | |||||||||||||||
|
|
|
|
|
|
|
|
|
|
|
|||||||||||
| Balance at June 30, 2016 |
0.6 | 2.4 | 66.1 | 5.9 | 75.0 | |||||||||||||||
|
|
|
|
|
|
|
|
|
|
|
|||||||||||
| Accumulated Depreciation and Impairment |
||||||||||||||||||||
| Balance at December 31, 2015 |
— | 1.7 | 25.2 | 4.5 | 31.4 | |||||||||||||||
|
|
|
|
|
|
|
|
|
|
|
|||||||||||
| Balance at June 30, 2016 |
— | 1.7 | 26.9 | 4.7 | 33.3 | |||||||||||||||
|
|
|
|
|
|
|
|
|
|
|
|||||||||||
| Carrying Amount |
||||||||||||||||||||
| As at December 31, 2015 |
0.6 | 0.7 | 32.0 | 0.7 | 34.0 | |||||||||||||||
| As at June 30, 2016 |
0.6 | 0.7 | 39.2 | 1.2 | 41.7 | |||||||||||||||
|
|
|
|
|
|
|
|
|
|
|
|||||||||||
The carrying value of CPD’s property, plant, and equipment includes $15.0 million of leased assets as at June 30, 2016 (December 31, 2015—$13.2 million).
Changes in the cost of property, plant, and equipment consisted of $8.0 million in purchases and $2.2 million of new leased assets offset by $2.0 million of asset disposals, and $1.4 million in net foreign currency translation impact.
Changes in accumulated depreciation and impairment consisted of $3.1 million of depreciation offset by $2.0 million of accumulated depreciation on asset disposals, and $0.8 in net foreign currency translation impact.
F-110
Table of Contents
CONSTRUCTION PRODUCTS DISTRIBUTION
NOTES TO THE CONDENSED COMBINED FINANCIAL STATEMENTS—(Continued)
7. Trade and Other Payables
A summary of trade and other payables is as follows:
| Notes | June 30 2016 | December 31 2015 | ||||||||||
| Trade payables |
58.4 | 42.2 | ||||||||||
| Accrued incentive |
6.3 | 9.6 | ||||||||||
| Restructuring provision |
0.1 | 0.3 | ||||||||||
| Other payables |
29.6 | 31.2 | ||||||||||
|
|
|
|
|
|||||||||
| Trade and other payables |
94.4 | 83.3 | ||||||||||
|
|
|
|
|
|||||||||
8. Borrowing
Included in current borrowing is $0.6 million of bank overdraft (December 31, 2015—$1.9 million).
Included in the condensed combined balance sheets as at June 30, 2016:
| June 30 2016 | December 31 2015 | |||||||
| Current portion of finance lease |
3.2 | 2.7 | ||||||
| Non-current portion of finance lease |
12.4 | 12.1 | ||||||
|
|
|
|
|
|||||
| 15.6 | 14.8 | |||||||
|
|
|
|
|
|||||
Repayment requirements are as follows:
| Current maturities |
3.2 | |||
| Due in 2017 |
3.2 | |||
| Due in 2018 |
2.8 | |||
| Due in 2019 |
2.3 | |||
| Due in 2020 |
1.9 | |||
| Subsequent to 2020 |
2.2 | |||
|
|
|
|||
| Total |
15.6 | |||
|
|
|
9. Related-party Notes
The related-party note was created to finance the acquisition of Specialty Products and Insulation and is between Superior Plus Canada Financing Inc. (lender) and Specialty Products and Insulation (borrower).
| Year of Maturity |
Effective Interest Rate |
June 30 2016 |
December 31 2015 |
|||||||||||||
| Related-party Notes |
||||||||||||||||
| Related-party Notes |
September 2016 | 9.75 | % | 131.3 | 131.3 | |||||||||||
F-111
Table of Contents
CONSTRUCTION PRODUCTS DISTRIBUTION
NOTES TO THE CONDENSED COMBINED FINANCIAL STATEMENTS—(Continued)
10. Financial Instruments
Superior enters into foreign currency forward contracts on behalf of CPD in order to reduce foreign currency risk. The unrealized gains and losses associated with foreign currency contracts held by Superior Plus LP were allocated to these CPD financial statements. All realized and unrealized gains and losses associated with those contracts are allocated into CPD results on a quarterly basis. Below is the summary of the gains and losses included in net earnings:
| Asset (Liability) | ||||||||||||||||||||
| Description |
Notional(1) | Term | Effective Rate |
Fair Value Input Level |
June 30 2016 |
December 31 2015 |
||||||||||||||
| Foreign currency forward contracts, net sale |
US$48.8(2) | 2016-2017 | 1.17 | Level 1 | (3.5 | ) | (8.8 | ) | ||||||||||||
| (1) | Notional values as at June 30, 2016. |
| (2) | Millions of dollars. |
| Description |
Current Assets |
Long- term Assets |
Current Liabilities |
Long- term Liabilities |
||||||||||||
| Foreign currency forward contracts, net sale |
— | — | 2.7 | 0.8 | ||||||||||||
| As at June 30, 2016 |
— | — | 2.7 | 0.8 | ||||||||||||
| As at December 31, 2015 |
— | — | 5.8 | 3.0 | ||||||||||||
| For the three months ended June 30, 2016 |
For the three months ended June 30, 2015 |
|||||||||||||||
| Description |
Realized Loss |
Unrealized Gain |
Realized Loss |
Unrealized Gain |
||||||||||||
| Foreign currency forward contracts, net sale |
(0.9 | ) | 1.2 | (0.7 | ) | 0.8 | ||||||||||
|
|
|
|
|
|
|
|
|
|||||||||
| Total (losses) and gains |
(0.9 | ) | 1.2 | (0.7 | ) | 0.8 | ||||||||||
|
|
|
|
|
|
|
|
|
|||||||||
| For the six months ended June 30, 2016 |
For the six months ended June 30, 2015 |
|||||||||||||||
| Description |
Realized Loss |
Unrealized Gain |
Realized Loss |
Unrealized Loss |
||||||||||||
| Foreign currency forward contracts, net sale |
(2.3 | ) | 5.5 | (1.3 | ) | (1.5 | ) | |||||||||
|
|
|
|
|
|
|
|
|
|||||||||
| Total (losses) and gains |
(2.3 | ) | 5.5 | (1.3 | ) | (1.5 | ) | |||||||||
|
|
|
|
|
|
|
|
|
|||||||||
Realized gains or losses on financial and non-financial derivatives and foreign currency translation gains or losses on the revaluation of Canadian domiciled US-denominated working capital have been classified on the statement of net earnings based on the underlying nature of the financial statement line item and/or the economic exposure being managed.
F-112
Table of Contents
CONSTRUCTION PRODUCTS DISTRIBUTION
NOTES TO THE CONDENSED COMBINED FINANCIAL STATEMENTS—(Continued)
The following summarizes CPD’s classification and measurement of financial assets and liabilities:
| Classification |
Measurement | |||
| Financial Assets |
||||
| Cash and cash equivalents |
Loans and receivables | Amortized cost | ||
| Trade and other receivables |
Loans and receivables | Amortized cost | ||
| Derivative assets |
FVTNE | Fair value | ||
| Financial liabilities |
||||
| Trade and other payables |
Other liabilities | Amortized cost | ||
| Borrowing |
Other liabilities | Amortized cost | ||
| Derivative liabilities |
FVTNE | Fair value |
Non-Derivative Financial Instruments
The fair value of CPD’s cash and cash equivalents, trade and other receivables, related-party receivables, trade and other payables, and related-party notes approximates their carrying value due to the short-term nature of these amounts.
Financial Instruments—Risk Management
Market Risk
Derivative and non-financial derivatives are used by Superior, on behalf of CPD, to manage its exposure to fluctuations in foreign currency exchange rates. Superior assesses the inherent risks of these instruments by grouping derivative and non-financial derivatives related to the exposures these instruments mitigate. Superior’s policy is not to use derivative or non-financial derivative instruments for speculative purposes. Superior does not formally designate its derivatives as hedges, and as a result, Superior does not apply hedge accounting and is required to designate its derivatives and non-financial derivatives as held for trading.
Superior, on behalf of its operating divisions, enters into foreign currency forward contracts with ten counterparties to manage the economic exposure of its operations to movements in foreign currency exchange rates.
Credit Risk
Superior utilizes a variety of counterparties in relation to its derivative and non-financial derivative instruments in order to mitigate its counterparty risk. Superior assesses the credit-worthiness of its significant counterparties at the inception and throughout the term of a contract. Superior is also exposed to customer credit risk. Overall, Superior’s credit quality is enhanced by its portfolio of customers which is diversified across geographical (primarily Canada and the United States) and end-use (primarily commercial, residential and industrial) markets.
Allowances for doubtful accounts and past due receivables are reviewed by CPD at each balance sheet date. CPD updates its estimate of the allowance for doubtful accounts based on the evaluation of the recoverability of trade receivables with each customer taking into account historical collection trends of past due accounts and current economic conditions. Trade receivables are written-off once it is determined they are uncollectible.
F-113
Table of Contents
CONSTRUCTION PRODUCTS DISTRIBUTION
NOTES TO THE CONDENSED COMBINED FINANCIAL STATEMENTS—(Continued)
Liquidity Risk
Liquidity risk is the risk that CPD cannot meet a demand for cash or fund an obligation as it comes due. Liquidity risk also includes the risk of not being able to liquidate assets in a timely manner at a reasonable price.
To ensure it is able to react to contingencies and investment opportunities quickly, Superior maintains sources of liquidity at the corporate and subsidiary levels. The main sources of liquidity for CPD are cash and cash equivalents, financial assets, and intercompany financing.
Superior is subject to the risks associated with debt financing, including the ability to refinance indebtedness at maturity. Superior believes these risks are mitigated through the use of long-term debt secured by high-quality assets, maintaining debt levels that in management’s opinion are appropriate, and by diversifying maturities over an extended period. Superior also seeks to include in its agreements terms that protect it from liquidity issues of counterparties that might otherwise impact liquidity.
CPD’s contractual obligations associated with its financial liabilities are as follows:
| 2016 | 2017 | 2018 | 2019 | 2020 | 2022 and Thereafter |
Total | ||||||||||||||||||||||
| Borrowing |
3.8 | 3.2 | 2.8 | 2.3 | 1.9 | 2.2 | 16.2 | |||||||||||||||||||||
CPD’s contractual obligations are considered normal-course operating commitments and do not include the impact of mark-to-market fair values on financial and non-financial derivatives. CPD expects to fund these obligations through a combination of cash flow from operations, proceeds on its revolving term bank credit facilities and proceeds on the issuance of share capital.
11. Income Taxes
CPD recognizes a provision for income taxes that are subject to current and deferred income taxes, including United States income tax and United States non-resident withholding tax.
Total income taxes expense, comprised of current taxes and deferred taxes for the three months and six months ended June 30, 2016 was $1.9 million and $3.4 million respectively, compared to $2.2 million and $1.3 million in the comparative periods. For the three months ended June 30, 2016, deferred income tax expense (recovery) from operations in Canada and the United States was $0.8 million and $(0.3) million, respectively, compared to $2.4 million and $(1.1) million for the 6 months ended June 30, 2016, which resulted in a corresponding total net deferred income tax asset of $19.5 million at June 30, 2016.
F-114
Table of Contents
CONSTRUCTION PRODUCTS DISTRIBUTION
NOTES TO THE CONDENSED COMBINED FINANCIAL STATEMENTS—(Continued)
12. Supplemental Disclosure of Condensed Combined Statement of Total Comprehensive Income
| Three months ended June 30 |
Six months ended June 30 |
|||||||||||||||
| 2016 | 2015 | 2016 | 2015 | |||||||||||||
| Revenues |
||||||||||||||||
| Revenue from products |
199.3 | 195.0 | 378.6 | 370.5 | ||||||||||||
|
|
|
|
|
|
|
|
|
|||||||||
| 199.3 | 195.0 | 378.6 | 370.5 | |||||||||||||
|
|
|
|
|
|
|
|
|
|||||||||
| Cost of sales (includes products & services) |
||||||||||||||||
| Cost of products and services |
(147.8 | ) | (145.8 | ) | (280.6 | ) | (277.8 | ) | ||||||||
| Realized losses on derivative financial instruments |
(0.9 | ) | (0.7 | ) | (2.3 | ) | (1.3 | ) | ||||||||
|
|
|
|
|
|
|
|
|
|||||||||
| (148.7 | ) | (146.5 | ) | (282.9 | ) | (279.1 | ) | |||||||||
|
|
|
|
|
|
|
|
|
|||||||||
| Selling, distribution and administrative costs |
||||||||||||||||
| Other selling, distribution and administrative costs |
(9.5 | ) | (10.2 | ) | (18.9 | ) | (21.0 | ) | ||||||||
| Employee costs |
(31.4 | ) | (27.8 | ) | (61.0 | ) | (57.0 | ) | ||||||||
| Depreciation included in selling, distribution and administrative costs |
(1.6 | ) | (1.5 | ) | (3.1 | ) | (3.0 | ) | ||||||||
| Amortization of intangible assets |
— | — | — | — | ||||||||||||
| Losses on disposal of assets |
— | — | — | — | ||||||||||||
|
|
|
|
|
|
|
|
|
|||||||||
| (42.5 | ) | (39.5 | ) | (83.0 | ) | (81.0 | ) | |||||||||
|
|
|
|
|
|
|
|
|
|||||||||
| Finance expense |
||||||||||||||||
| Interest on borrowings |
(3.2 | ) | (3.2 | ) | (6.4 | ) | (6.4 | ) | ||||||||
| Interest on obligations under finance leases |
(0.2 | ) | (0.2 | ) | (0.4 | ) | (0.3 | ) | ||||||||
|
|
|
|
|
|
|
|
|
|||||||||
| (3.4 | ) | (3.4 | ) | (6.8 | ) | (6.7 | ) | |||||||||
|
|
|
|
|
|
|
|
|
|||||||||
13. Supplemental Disclosure of Non-Cash Operating Working Capital Changes
| Six months ended June 30 |
||||||||
| 2016 | 2015 | |||||||
| Changes in non-cash working capital |
||||||||
| Trade receivables and other |
(4.5 | ) | (8.2 | ) | ||||
| Inventories |
1.5 | (2.7 | ) | |||||
| Trade and other payables |
(0.1 | ) | 2.6 | |||||
| Other, including foreign exchange |
(5.6 | ) | 8.1 | |||||
|
|
|
|
|
|||||
| (8.7 | ) | (0.2 | ) | |||||
|
|
|
|
|
|||||
F-115
Table of Contents
CONSTRUCTION PRODUCTS DISTRIBUTION
NOTES TO THE CONDENSED COMBINED FINANCIAL STATEMENTS—(Continued)
14. Net Related-party Receivables
As at June 30, 2016, CPD had a related-party receivable balance of $89.1 million (December 31, 2015—$89.4 million) due from Superior Plus Corp. and its subsidiaries. All related party balances held with Superior Plus Corp. and its related entities are non-interest bearing instruments and are due on demand.
| June 30 2016 |
December 31 2015 |
|||||||
| Due from Superior Plus Corp. |
2.8 | 2.8 | ||||||
| Due (to) / from Superior Plus Canada Financing Inc. |
(30.7 | ) | (19.1 | ) | ||||
| Due from Superior Plus US Holdings Inc. |
0.7 | 0.9 | ||||||
| Due from Superior Plus LP |
116.3 | 104.8 | ||||||
|
|
|
|
|
|||||
| Net Related-party receivable, at the end of the period |
89.1 | 89.4 | ||||||
|
|
|
|
|
|||||
15. Geographic Information
| Canada | United States | Total Combined | ||||||||||
| Revenues for the three months ended June 30, 2016 |
57.1 | 142.2 | 199.3 | |||||||||
| Revenues for the six months ended June 30, 2016 |
108.1 | 270.5 | 378.6 | |||||||||
| Property, plant and equipment as at June 30, 2016 |
9.4 | 32.3 | 41.7 | |||||||||
| Intangible assets as at June 30, 2016 |
— | 0.3 | 0.3 | |||||||||
| Total assets as at June 30, 2016 |
188.4 | 153.7 | 342.1 | |||||||||
|
|
|
|
|
|
|
|||||||
| Revenues for the three months ended June 30, 2015 |
61.1 | 133.9 | 195.0 | |||||||||
| Revenues for the six months ended June 30, 2015 |
115.6 | 254.9 | 370.5 | |||||||||
| Property, plant and equipment as at December 31, 2015 |
8.5 | 25.5 | 34.0 | |||||||||
| Intangible assets as at December 31, 2015 |
— | 0.3 | 0.3 | |||||||||
| Total assets as at December 31, 2015 |
173.6 | 146.5 | 320.1 | |||||||||
|
|
|
|
|
|
|
|||||||
16. Subsequent Events
CPD was acquired on August 9, 2016 for cash consideration of $314.1 million, subject to working capital and closing adjustments yet to be determined, by Construction Products Acquisition, LLC, a subsidiary of Foundation Building Materials, LLC. All amounts owed to or by related parties were extinguished as a condition of the sale.
F-116
Table of Contents
Financial Statements as of December 31, 2015, and December 31, 2014, and for the Years ended December 31, 2015 and 2014, and Independent Auditors’ Report
F-117
Table of Contents
KEN BUILDERS SUPPLY, INC.
TABLE OF CONTENTS
| Page | ||||
| F-119 | ||||
| FINANCIAL STATEMENTS AS OF DECEMBER 31, 2015 AND 2014, AND FOR THE YEARS ENDED DECEMBER 31, 2015, AND 2014: |
||||
| F-120 | ||||
| F-121 | ||||
| F-122 | ||||
| F-123 | ||||
| F-124 - F-132 | ||||
F-118
Table of Contents

Directors and Officers
Ken Builders Supply, Inc.
Covington, KY
Report on the Financial Statements
We have audited the accompanying financial statements of Ken Builders Supply, Inc. (an S Corporation) (the Company) which comprise the balance sheets as of December 31, 2015 and 2014, and the related statements of operations, stockholders’ equity, and cash flows for the years then ended, and the related notes to the financial statements.
Management’s Responsibility for the Financial Statements
Management is responsible for the preparation and fair presentation of these financial statements in accordance with accounting principles generally accepted in the United States of America; this includes the design, implementation, and maintenance of internal control relevant to the preparation and fair presentation of financial statements that are free from material misstatement, whether due to fraud or error.
Auditors’ Responsibility
Our responsibility is to express an opinion on these financial statements based on our audits. We conducted our audits in accordance with auditing standards generally accepted in the United States of America. Those standards require that we plan and perform the audits to obtain reasonable assurance about whether the financial statements are free from material misstatement.
An audit involves performing procedures to obtain audit evidence about the amounts and disclosures in the financial statements. The procedures selected depend on the auditors’ judgment, including the assessment of the risks of material misstatement of the financial statements, whether due to fraud or error. In making those risk assessments, the auditors consider internal control relevant to the entity’s preparation and fair presentation of the financial statements in order to design audit procedures that are appropriate in the circumstances, but not for the purpose of expressing an opinion on the effectiveness of the entity’s internal control. Accordingly, we express no such opinion. An audit also includes evaluating the appropriateness of accounting policies used and the reasonableness of significant accounting estimates made by management, as well as evaluating the overall presentation of the consolidated financial statements.
We believe that the audit evidence we have obtained is sufficient and appropriate to provide a basis for our audit opinion.
Opinion
In our opinion, the financial statements referred to above present fairly, in all material respects, the financial position of Ken Builders Supply, Inc. as of December 31, 2015 and 2014, and the results of their operations and cash flows for the years then ended in accordance with accounting principles generally accepted in the United States of America.

Fort Mitchell, Kentucky
June 29, 2016
| VonLehman & Company Inc. Kentucky Ohio Indiana 800.887.0437 vlcpa.com 250 Grandview Drive, Suite 300 Fort Mitchell, KY 41017-5610 859.331.3300 |
F-119
Table of Contents
BALANCE SHEETS
AS OF DECEMBER 31, 2015 AND DECEMBER 31, 2014
(In $000’s)
| 2015 | 2014 | |||||||
| ASSETS |
||||||||
| CURRENT ASSETS |
||||||||
| Cash |
$ | 223 | $ | 176 | ||||
| Accounts receivable—net of allowance for doubtful accounts of $730 and $808, respectively |
7,403 | 7,416 | ||||||
| Vendor rebates receivable |
2,482 | 1,885 | ||||||
| Inventories |
7,341 | 6,301 | ||||||
| Notes receivable—customers, net |
13 | 78 | ||||||
| Prepaid expenses |
534 | 359 | ||||||
|
|
|
|
|
|||||
| Total current assets |
17,996 | 16,215 | ||||||
| PROPERTY & EQUIPMENT—Net |
4,555 | 3,562 | ||||||
| GOODWILL |
1,666 | 1,666 | ||||||
| NOTES RECEIVABLE—RELATED PARTIES |
712 | 1,274 | ||||||
|
|
|
|
|
|||||
| TOTAL ASSETS |
$ | 24,929 | $ | 22,717 | ||||
|
|
|
|
|
|||||
| LIABILITIES AND STOCKHOLDERS’ EQUITY |
||||||||
| CURRENT LIABILITIES |
||||||||
| Line of credit |
$ | 3,675 | $ | 3,026 | ||||
| Accounts payable |
3,661 | 3,565 | ||||||
| Accrued expenses and other current liabilities |
1,008 | 987 | ||||||
| Current Portion of capital lease obligations |
233 | 149 | ||||||
| Current portion of notes payable |
1,938 | 1,558 | ||||||
|
|
|
|
|
|||||
| Total current liabilities |
10,515 | 9,285 | ||||||
|
|
|
|
|
|||||
| CAPITAL LEASE OBLIGATIONS |
1,082 | 761 | ||||||
| NOTES PAYABLE |
2,112 | 3,008 | ||||||
| NOTES PAYABLE—RELATED PARTIES |
— | 665 | ||||||
|
|
|
|
|
|||||
| TOTAL LIABILITIES |
13,709 | 13,719 | ||||||
| STOCKHOLDERS’ EQUITY |
11,220 | 8,998 | ||||||
|
|
|
|
|
|||||
| TOTAL LIABILITIES AND STOCKHOLDERS’ EQUITY |
$ | 24,929 | $ | 22,717 | ||||
|
|
|
|
|
|||||
See accompanying notes to financial statements.
F-120
Table of Contents
STATEMENTS OF OPERATIONS
FOR THE YEARS ENDED DECEMBER 31, 2015 AND 2014
(In 000’s)
| 2015 | 2014 | |||||||
| NET SALES |
$ | 54,990 | $ | 50,738 | ||||
| COST OF GOODS SOLD |
38,661 | 35,944 | ||||||
|
|
|
|
|
|||||
| GROSS PROFIT |
16,329 | 14,794 | ||||||
| OPERATING EXPENSES |
||||||||
| Selling, general and administrative expenses |
11,520 | 11,619 | ||||||
| Depreciation expense |
1,159 | 838 | ||||||
|
|
|
|
|
|||||
| Total operating expenses |
12,679 | 12,457 | ||||||
|
|
|
|
|
|||||
| OPERATING INCOME |
3,650 | 2,337 | ||||||
| OTHER EXPENSE |
||||||||
| Interest expense |
368 | 353 | ||||||
|
|
|
|
|
|||||
| NET INCOME |
$ | 3,282 | $ | 1,984 | ||||
|
|
|
|
|
|||||
See accompanying notes to financial statements.
F-121
Table of Contents
STATEMENT OF STOCKHOLDERS’ EQUITY
FOR THE YEARS ENDED DECEMBER 31, 2015 AND 2014
(In 000’s)
| Common Stock |
Paid-In Capital |
Retained Earnings |
Subscriptions Receivable |
Treasury Stock |
Total | |||||||||||||||||||
| BALANCE AT JANUARY 1, 2014 |
$ | 106 | $ | 724 | $ | 7,121 | $ | (39 | ) | $ | (419 | ) | $ | 7,493 | ||||||||||
| Reissue treasury stock |
— | (157 | ) | — | (165 | ) | 322 | — | ||||||||||||||||
| Payments on stock subscriptions |
— | — | — | 2 | — | 2 | ||||||||||||||||||
| Distributions |
— | — | (481 | ) | — | — | (481 | ) | ||||||||||||||||
| Net income for year |
— | — | 1,984 | — | — | 1,984 | ||||||||||||||||||
|
|
|
|
|
|
|
|
|
|
|
|
|
|||||||||||||
| BALANCE AT DECEMBER 31, 2014 |
106 | 567 | 8,624 | (202 | ) | (97 | ) | 8,998 | ||||||||||||||||
| Payments on stock subscriptions |
— | — | — | 39 | — | 39 | ||||||||||||||||||
| Distributions |
— | — | (1,099 | ) | — | — | (1,099 | ) | ||||||||||||||||
| Net income for year |
— | — | 3,282 | — | — | 3,282 | ||||||||||||||||||
|
|
|
|
|
|
|
|
|
|
|
|
|
|||||||||||||
| BALANCE AT DECEMBER 31, 2015 |
$ | 106 | $ | 567 | $ | 10,807 | $ | (163 | ) | $ | (97 | ) | $ | 11,220 | ||||||||||
|
|
|
|
|
|
|
|
|
|
|
|
|
|||||||||||||
See accompanying notes to financial statements.
F-122
Table of Contents
STATEMENTS OF CASH FLOWS
FOR THE YEARS ENDED DECEMBER 31, 2015 AND 2014
(In 000’s)
| 2015 | 2014 | |||||||
| Cash flows from operating activities |
||||||||
| Net income |
$ | 3,282 | $ | 1,984 | ||||
| Reconciliation of net income with cash flows from operations |
||||||||
| Depreciation |
1,159 | 838 | ||||||
| (Gain) Loss on sale of property and equipment |
(43 | ) | 68 | |||||
| Changes in |
||||||||
| Accounts receivable |
13 | (1,636 | ) | |||||
| Vendor rebates receivable |
(597 | ) | (332 | ) | ||||
| Inventories |
(1,040 | ) | (741 | ) | ||||
| Prepaid expenses |
(175 | ) | (30 | ) | ||||
| Accounts payable |
96 | (1,390 | ) | |||||
| Accrued expenses |
5 | 263 | ||||||
|
|
|
|
|
|||||
| Cash provided (used) by operations |
2,700 | (976 | ) | |||||
|
|
|
|
|
|||||
| Cash flows from investing activities |
||||||||
| Acquisition of property and equipment |
(295 | ) | (494 | ) | ||||
| Proceeds from sale of property and equipment |
43 | 40 | ||||||
| Net change in notes receivable |
627 | 549 | ||||||
|
|
|
|
|
|||||
| Cash provided by investing activities |
375 | 95 | ||||||
|
|
|
|
|
|||||
| Cash flows from financing activities |
||||||||
| Net change in line of credit |
649 | 2,741 | ||||||
| Additions to notes payable related parties |
— | 26 | ||||||
| Payments on notes payable related parties |
(665 | ) | — | |||||
| Payments on stock subscription receivable |
39 | 2 | ||||||
| Proceeds from long-term debt |
— | 8 | ||||||
| Payments on capital lease obligations |
(201 | ) | (132 | ) | ||||
| Payments on long-term debt |
(1,767 | ) | (1,211 | ) | ||||
| Distributions |
(1,083 | ) | (475 | ) | ||||
|
|
|
|
|
|||||
| Cash (used) provided by financing activities |
(3,028 | ) | 959 | |||||
|
|
|
|
|
|||||
| Net change in cash |
47 | 78 | ||||||
| Beginning cash balance |
176 | 98 | ||||||
|
|
|
|
|
|||||
| Ending cash balance |
$ | 223 | $ | 176 | ||||
|
|
|
|
|
|||||
See accompanying notes to financial statements.
F-123
Table of Contents
NOTES TO FINANCIAL STATEMENTS
AS OF DECEMBER 31, 2015 AND DECEMBER 31, 2014, AND FOR THE YEARS ENDED
DECEMBER 31, 2015 AND DECEMBER 31, 2014
1. DESCRIPTION OF COMPANY
Ken Builders Supply, Inc. (dba Ken/API Supply) (the Company) operates as a retail and wholesale building products distributor. The Company sells primarily to contractors and individuals in the Midwest region.
2. SUMMARY OF SIGNIFICANT ACCOUNTING POLICIES
Use of Estimates—The preparation of financial statements in conformity with generally accepted accounting principles (GAAP) requires management to make estimates and assumptions that affect the amounts of assets and liabilities and disclosure of contingent assets and liabilities as of the date of the financial statements and the reported amounts of revenues and expenses during the reporting period. Actual results may differ from these estimates.
Concentration of Risk—Financial instruments, which potentially subject the Company to concentration of credit risk, consist principally of accounts receivable. The Company’s accounts receivable are primarily from customers in the building industry located in the United States. Concentration of credit risk with respect to accounts receivable is limited due to the large number of customers comprising the Company’s customer base. The Company performs credit evaluations of its customers; however, the Company’s policy is not to require collateral. At December 31, 2015 and December 31, 2014, the Company had no significant concentrations of credit risk.
Liquidity and Credit Risk—The primary sources of liquidity and capital resources are cash provided from operating activities and other borrowings. The primary requirements for liquidity and capital are to operate and fund current activities. The Company believes that cash and expected cash flow from operations are adequate to fund debt service requirements, operating lease obligations, capital expenditures and working capital obligations for the next twelve months.
Accounts Receivable—The Company sells to customers using credit terms customary in its industry. Accounts receivables are recorded at invoiced amounts and generally do not bear interest. The allowance for doubtful accounts reflects the Company’s estimate of credit exposure, determined principally on the basis of its collection experience, aging of its receivables and significant individual account credit risk.
Vendor Rebates Receivable—The Company receives rebates from certain vendors based on the volume of inventory purchased. A receivable is recorded for these rebates when the amount of the rebate is reasonably estimable and collectible. Rebates received are recorded through a reduction to cost of goods sold.
Inventories—Inventories, consisting substantially of finished goods, are valued at the lower of cost or market (net realizable value). Cost is determined using the moving weighted-average cost method. The Company routinely evaluates inventory for excess or obsolescence and considers factors such as historical usage rates and present demand. Inventories are stated net of reserves for losses of $92 thousand and $72 thousand as of December 31, 2015 and 2014, respectively.
F-124
Table of Contents
KEN BUILDERS SUPPLY, INC.
NOTES TO FINANCIAL STATEMENTS—(Continued)
Property and Equipment—Property and equipment are stated at cost less accumulated depreciation and amortization. Major additions and improvements are capitalized and depreciated; maintenance and repairs are charged to expense when incurred. Upon disposition, the related cost and accumulated depreciation are removed from the accounts and any resulting gain or loss is recognized in selling, general, and administrative expense. Depreciation and amortization are computed using the straight-line method over the following estimated useful lives:
| Equipment |
3 – 10 Years | |||
| Vehicles |
5 – 7 Years | |||
| Leasehold improvements |
7 – 39.5 Years | |||
| Computer equipment |
3 – 7 Years | |||
| Furniture and fixtures |
3 – 7 Years |
Impairment of Long-Lived Assets—The Company reviews property and equipment for impairment when events or circumstances indicate these assets may not be recoverable. Factors considered include significant underperformance relative to expected historical or projected future operating results, significant changes in the manner of use of the acquired assets or the strategy for the overall business and significant negative industry or economic trends. In performing the review for recoverability, future cash flows expected to result from the use of the asset and its eventual disposition are estimated. If the sum of expected future undiscounted cash flows is less than the carrying amount of the asset, and impairment loss is recorded under the discounted cash flow method. As of December 31, 2015 and December 31, 2014, there were no impairments.
Goodwill—Goodwill represents the excess of purchase price over fair value of assets acquired and liabilities assumed in a business combination. The Company performs its impairment test annually or more frequently if impairment indicators arise. Such review entails comparing the carrying value to the fair value. If the aggregate carrying value of goodwill exceeds the fair value, the goodwill is impaired to the extent of the difference between the fair value and the aggregate carrying value. No impairment was recorded during the years ended December 31, 2015 and 2014.
Revenue Recognition—The criteria for recognition of revenue are met when persuasive evidence that an arrangement exists and both title and risk of loss have passed to the customer, the price is fixed or determinable, and collectability is reasonably assured.
All revenues recognized are net of sales taxes collected and allowances for discounts. Sales taxes collected are subsequently remitted to the appropriate government authorities.
Cost of Goods Sold—Cost of goods sold includes the cost of merchandise, inbound and outbound freight, inventory provisions, warehousing costs, vendor discounts and vendor rebates.
Advertising—The Company expenses the cost of advertising when incurred
Income Taxes—The Company has elected to be treated as an S-Corporation under provisions of the Internal Revenue Code, and as such did not pay federal corporate income
F-125
Table of Contents
KEN BUILDERS SUPPLY, INC.
NOTES TO FINANCIAL STATEMENTS—(Continued)
taxes on its taxable income. In lieu of corporate income taxes, the shareholders of an S-Corporation are taxed on their proportionate share of the Company’s taxable income. Given the structure of the Company as a pass-through entity and the nature of the operations of the Company, there were no significant deferred tax assets or liabilities.
Shipping and Handling Costs—In compliance with accounting standards, the Company includes all amounts billed to customers that relate to shipping and handling in net sales on the statements of income.
Recently Issued Accounting Guidance
In May 2014, the Financial Accounting Standards Board (“FASB”) issued Accounting Standards Update (“ASU”) 2014-09, Revenue from Contracts with Customers (“ASU 2014-09”). ASU 2014-09 amends the guidance for revenue recognition to replace numerous, industry-specific requirements. The core principle of the ASU is that an entity should recognize revenue for the transfer of goods or services equal to the amount that it expects to be entitled to receive for those goods or services. The ASU implements a five-step process for customer contract revenue recognition that focuses on transfer of control, as opposed to transfer of risk and rewards. The amendment also requires enhanced disclosures regarding the nature, amount, timing and uncertainty of revenues and cash flows arising from contracts with customers. On August 8, 2015, the FASB issued ASU No. 2015-14, which defers the effective date of ASU No. 2014-09 by one year. The standard is effective for nonpublic entities for annual and interim periods beginning after December 15, 2017. Entities can transition to the standard either retrospectively to each period presented or as a cumulative-effect adjustment as of the date of adoption. The Company is currently assessing the impact the adoption of ASU 2014-09 will have on its financial statements.
In August 2014, the FASB issued ASU 2014-15, Presentation of Financial Statements—Going Concern (Subtopic 205-40): Disclosures of Uncertainties about an Entity’s Ability to Continue as a Going Concern (“ASU 2014-15”). ASU 2014-15 requires management to evaluate whether there are conditions or events that raise substantial doubt about the entity’s ability to continue as a going concern within one year after the date that the financial statements are issued or are available to be issued. This ASU also requires management to disclose certain information depending on the results of the going concern evaluation. The provisions of this ASU are effective for annual periods ending after December 15, 2016, including interim reporting periods therein. The Company is currently evaluating the impact of this accounting guidance and does not expect any significant impact on its financial statements.
3. CASH
The Company has its cash deposits held at banks that at times may exceed federally insured limits. The Company has not incurred losses related to any deposits in excess of the FDIC insurance amount and believes no significant concentration of credit risk exists with respect to cash deposits.
For purposes of the cash flow statement, cash includes cash on hand and cash in checking accounts.
F-126
Table of Contents
KEN BUILDERS SUPPLY, INC.
NOTES TO FINANCIAL STATEMENTS—(Continued)
Cash paid for interest and state and local income taxes were as follows (in thousands):
| Years Ended December 31, | ||||||||
| 2015 | 2014 | |||||||
| Interest |
$ | 316 | $ | 311 | ||||
|
|
|
|
|
|||||
| Income taxes |
$ | — | $ | — | ||||
|
|
|
|
|
|||||
The Company had noncash financing and investing transactions as follows (in thousands):
| December 31, | ||||||||
| 2015 | 2014 | |||||||
| Property and equipment acquired through notes payable |
$ | 1,251 | $ | 1,302 | ||||
|
|
|
|
|
|||||
| Vehicles acquired through capital lease obligations |
$ | 606 | $ | 146 | ||||
|
|
|
|
|
|||||
| Reissuance of treasury stock through a note receivable |
$ | — | $ | 165 | ||||
|
|
|
|
|
|||||
| Refinance of line of credit through a note payable |
$ | — | $ | 2,074 | ||||
|
|
|
|
|
|||||
| Accrued distribution |
$ | 22 | $ | 6 | ||||
|
|
|
|
|
|||||
| Refinance of notes payable |
$ | — | $ | 1,323 | ||||
|
|
|
|
|
|||||
| Accounts receivable received through sale of asset |
$ | — | $ | 20 | ||||
|
|
|
|
|
|||||
| Note receivable write off through Allowance for doubtful accounts |
$ | 435 | $ | 150 | ||||
|
|
|
|
|
|||||
4. NOTES RECEIVABLE—CUSTOMERS
The Company has signed promissory notes with certain customers. The notes represent prior account receivable balances and have varying payment terms and interest rates as follows (in thousands):
| December 31, | ||||||||
| 2015 | 2014 | |||||||
| Notes receivable from customers; due in monthly installments with interest rates ranging from 0% to 6%. The notes mature on various dates through June, 2016; generally guaranteed by the stockholders of the respective companies. |
$ | 13 | $ | 513 | ||||
| Allowance for doubtful accounts |
— | 435 | ||||||
|
|
|
|
|
|||||
| Note receivable—customer, net |
13 | 78 | ||||||
| Less current portion |
(13 | ) | (78 | ) | ||||
|
|
|
|
|
|||||
| Long-term portion |
$ | — | $ | — | ||||
|
|
|
|
|
|||||
F-127
Table of Contents
KEN BUILDERS SUPPLY, INC.
NOTES TO FINANCIAL STATEMENTS—(Continued)
5. PROPERTY AND EQUIPMENT
Property and equipment as of December 31, 2015 and December 31, 2014, consist of the following (in thousands):
| December 31, | ||||||||
| 2015 | 2014 | |||||||
| Equipment |
$ | 1,536 | $ | 1,474 | ||||
| Vehicles |
9,003 | 7,140 | ||||||
| Leasehold improvements |
887 | 838 | ||||||
| Computer equipment |
606 | 529 | ||||||
| Furniture and fixtures |
103 | 103 | ||||||
|
|
|
|
|
|||||
| Property and equipment, gross |
12,135 | 10,084 | ||||||
| Less: accumulated depreciation |
7,580 | 6,522 | ||||||
|
|
|
|
|
|||||
| Property and equipment—net |
$ | 4,555 | $ | 3,562 | ||||
|
|
|
|
|
|||||
Depreciation expense for property and equipment was $1,159 thousand and $838 thousand for the years ended December 31, 2015 and 2014, respectively.
6. LINE OF CREDIT
The Company has available a $5,500,000 line of credit with a bank, collateralized by the general assets of the Company, the personal guarantee of the majority stockholder and which charges interest at the prime rate plus .5% (the prime rate was 3.5% as of December 31, 2015). The line was repaid prior to maturity as part of the FBM acquisition in 2016. (See Note 14)
F-128
Table of Contents
KEN BUILDERS SUPPLY, INC.
NOTES TO FINANCIAL STATEMENTS—(Continued)
7. NOTES PAYABLE
The Company had the following notes payable on its books at December 31, 2015 and 2014 (in thousands):
| December 31, | ||||||||
| 2015 | 2014 | |||||||
| The Company has several installment notes payable collateralized by equipment at interest rates ranging from 0% to 6.26%, payable in monthly installments of principal and interest ranging from $2 to $12 thousand and due on various dates through June, 2019. The notes were paid off as part of the FBM acquisition in 2016. |
$ | 1,269 | $ | 1,697 | ||||
| Term note payable to bank in order to refinance debt; established in June, 2014 due in monthly installments of $91 thousand, including interest at 4.5%, loan matures in June, 2017 at which time the remaining balance is due; collateralized by receivables, inventory and the personal guarantee of the majority shareholder. The note was paid off as part of the FBM acquisition in 2016. |
1,761 | 2,869 | ||||||
| Term note payable to bank in order to purchase assets; established in March, 2015 due in monthly installments of $ 22 thousand, including interest at 3.58%, loan matures in June, 2017 at which time the remaining balance is due; collateralized by receivables, inventory and the personal guarantee of the majority shareholder. The note was paid off as part of the FBM acquisition in 2016. |
1,020 | — | ||||||
|
|
|
|
|
|||||
| 4,050 | 4,566 | |||||||
| Less current portion |
1,938 | 1,558 | ||||||
|
|
|
|
|
|||||
| Long-term portion |
$ | 2,112 | $ | 3,008 | ||||
|
|
|
|
|
|||||
The remaining maturities on these notes are as follows (in thousands):
| Years Ending December 31, |
||||
| 2016 |
$ | 1,938 | ||
| 2017 |
1,162 | |||
| 2018 |
542 | |||
| 2019 |
344 | |||
| 2020 |
64 | |||
|
|
|
|||
| $ | 4,050 | |||
|
|
|
|||
In accordance with its debt agreements with the bank, the Company must maintain certain financial covenants. At December 31, 2015, the Company was in compliance with the covenants.
8. CAPITAL LEASE OBLIGATIONS
The Company has capital lease obligations, collateralized by the equipment purchased, that charge interest at rates of 4.0%. These capital lease obligations expire on various dates through September, 2022. Depreciation expense for equipment held under the capital lease obligations was $145 thousand and $219 thousand for the years ended December 31, 2015 and 2014, respectively.
F-129
Table of Contents
KEN BUILDERS SUPPLY, INC.
NOTES TO FINANCIAL STATEMENTS—(Continued)
The following is a summary of equipment at cost less accumulated depreciation held under the capital lease obligations (in thousands):
| December 31, | ||||||||
| 2015 | 2014 | |||||||
| Equipment |
$ | 1,718 | $ | 1,111 | ||||
| Less accumulated depreciation |
(456 | ) | (237 | ) | ||||
|
|
|
|
|
|||||
| $ | 1,262 | $ | 874 | |||||
|
|
|
|
|
|||||
The following is a summary of the remaining future minimum capital lease payments and associated interest expense:
| Years Ending December 31, |
||||||||
| 2016 |
$ | 282 | ||||||
| 2017 |
282 | |||||||
| 2018 |
282 | |||||||
| 2019 |
282 | |||||||
| 2020 |
189 | |||||||
| Thereafter |
148 | |||||||
|
|
|
|||||||
| $ | 1,465 | |||||||
| Less interest portion |
150 | |||||||
|
|
|
|||||||
| Net capital lease obligations |
1,315 | $ | 910 | |||||
| Less current portion |
233 | 149 | ||||||
|
|
|
|
|
|||||
| Long term portion |
$ | 1,082 | $ | 761 | ||||
|
|
|
|
|
|||||
9. STOCKHOLDERS’ EQUITY
Stockholders’ Equity as of December 31, 2015 and December 31, 2014, consist of the following (in thousands):
| December 31, | ||||||||
| 2015 | 2014 | |||||||
| Class A common stock, no par value; 500 shares authorized, 254 issued and 252 outstanding |
$ | 18 | $ | 18 | ||||
| Class B common stock, no par value; 2,500 shares authorized, 1,270 issued and 1,260 outstanding |
88 | 88 | ||||||
| Additional paid in capital |
567 | 567 | ||||||
| Retained earnings |
10,807 | 8,624 | ||||||
| Treasury stock, 2 Class A; 10 Class B shares at cost |
(97 | ) | (97 | ) | ||||
| Subscription receivable |
(163 | ) | (202 | ) | ||||
|
|
|
|
|
|||||
| Stockholders’ equity |
$ | 11,220 | $ | 8,998 | ||||
|
|
|
|
|
|||||
F-130
Table of Contents
KEN BUILDERS SUPPLY, INC.
NOTES TO FINANCIAL STATEMENTS—(Continued)
10. RELATED PARTIES
Notes Receivable—Related Parties
The Company has a note with the majority stockholder that is unsecured, payable on demand and bears simple interest at 4.00% for both 2014 and 2015, with no fixed repayment terms. Interest income from this note was $7 thousand and $19 thousand for 2015 and 2014, respectively. This note was repaid as part of the FBM acquisition in 2016.
The Company also has unsecured notes with other stockholders. The notes are due on demand and bear simple interest at 4.00% for both 2015 and 2014, with no fixed repayment terms. Interest income on these notes was $26 thousand and $34 thousand for 2015 and 2014, respectively. These notes were repaid as part of the FBM acquisition in 2016.
Notes Payable—Related Parties
The Company had unsecured notes payable with other related parties which were paid off during 2015. The notes payable charged interest at 4.00% for both 2015 and 2014. The balance at December 31, 2015 and 2014 was $-0- and $665 thousand, respectively. Interest expense on these notes was $-0- and $26 thousand for 2015 and 2014, respectively.
Facility Leases
The Company leases five of its facilities under operating agreements with monthly payments ranging from $5 to $17 thousand from five limited liability companies in which certain stockholders of the Company are members. The leases expire on various dates through May, 2026. Rent expense associated with these leased facilities was $772 thousand and $754 thousand for the years ended December 31, 2015 and 2014, respectively.
Minimum annual lease commitments under non-cancelable leases are summarized as follows (in thousands):
| Years Ending December 31, |
Total | |||
| 2016 |
$ | 718 | ||
| 2017 |
713 | |||
| 2018 |
503 | |||
| 2019 |
503 | |||
| 2020 |
422 | |||
| Thereafter |
1,223 | |||
|
|
|
|||
| $ | 4,082 | |||
|
|
|
|||
11. RETIREMENT PLANS
The Company has a retirement savings plan for eligible full-time and hourly employees under Section 401(k) of the Internal Revenue Code. The plan allows participants to contribute a portion of their earnings to the plan. The plan allows the Company, at its discretion, to match a certain percentage of the employees’ contributions, limited to a certain percentage of eligible compensation. By its nature the plan is fully funded. The Company’s contributions to the plan were $31 thousand and $-0- for the years ended December 31, 2015 and 2014, respectively.
F-131
Table of Contents
KEN BUILDERS SUPPLY, INC.
NOTES TO FINANCIAL STATEMENTS—(Continued)
12. COMMITMENTS AND CONTINGENCIES
The Company leases certain facilities and equipment under various operating lease agreements with expiration dates through October, 2018. These agreements generally require the Company to pay rental amounts and operating expenses.
Rent expense was $215 thousand and $180 thousand for the years ended December 31, 2015 and 2014, respectively. Rent expense is included in selling, general and administrative expenses in the Statements of Income.
Minimum annual lease commitments under non-cancelable leases are summarized as follows:
| Years Ending December 31, |
Total | |||
| 2016 |
$ | 153 | ||
| 2017 |
100 | |||
| 2018 |
83 | |||
|
|
|
|||
| $ | 336 | |||
|
|
|
|||
13. LOAN GUARANTEE
The Company leases five facilities from related party entities under various operating agreements as detailed in Note 9. The Company’s majority stockholder owns the majority of equity in each of these entities and as of December 31, 2015 and 2014, has guaranteed the debt of each entity. The combined carrying amount of their debt as of December 31, 2015 and 2014 was $3,371 thousand and $3,743 thousand, respectively. The debt for each entity is secured by their respective facilities.
14. SUBSEQUENT EVENTS
On May 31, 2016, substantially all of the assets and operations of the Company were acquired by Foundation Building Materials (FBM) for cash. The acquisition was accounted for by the acquisition method, and accordingly the results of operations will be included in financial statements of FBM subsequent to the acquisition date.
Management has performed an analysis of activities and transactions subsequent to December 31, 2015 to determine the need for any adjustments to or disclosures within these financial statements for the years ended December 31, 2015 and December 31, 2014. Management has performed their analysis through June 29, 2016, which was the date that the financial statements were issued and has determined that there are no subsequent events to disclose.
******
F-132
Table of Contents
KEN BUILDERS SUPPLY, INC.
Financial Statements as of March 31, 2016 and December 31, 2015, and for the Three Month Periods ended March 31, 2016 and March 31, 2015
F-133
Table of Contents
KEN BUILDERS SUPPLY, INC.
| Page | ||||
| F-135 | ||||
| FINANCIAL STATEMENTS AS OF MARCH 31, 2016 AND DECEMBER 31, 2015 AND FOR THE THREE MONTH PERIODS ENDED MARCH 31, 2016 AND MARCH 31, 2015: |
||||
| F-136 | ||||
| F-137 | ||||
| F-138 | ||||
| F-139 | ||||
| F-140 -F-148 | ||||
F-134
Table of Contents
INDEPENDENT ACCOUNTANTS’ REVIEW REPORT
Directors and Officers
Ken Builders Supply, Inc.
Covington, KY
Report on the Financial Statements
We have reviewed the balance sheet of Ken Builders Supply, Inc. as of March 31,2016, and the related statements of income, stockholders’ equity, and cash flows for the three-month periods ended March 31, 2016 and 2015. This financial information is the responsibility of the company’s management.
We conducted our reviews in accordance with standards established by the American Institute of Certified Public Accountants. A review of interim financial information consists principally of applying analytical procedures and making inquiries of persons responsible for financial and accounting matters. It is substantially less in scope than an audit conducted in according with auditing standards generally accepted in the United States, the objective of which is the expression of an opinion regarding the financial information taken as a whole. Accordingly, we do not express such an opinion.
We have previously audited, in accordance with auditing standards generally accepted in the United States of America, the balance sheet of Ken Builders Supply, Inc. and the related statements of income, stockholders’ equity, and cash flows as of December 31, 2015 and 2014 and for the years then ended (not presented herein); and in our report dated June 29, 2016, we expressed an unqualified opinion on those financial statements. In our opinion, the information set forth in the accompanying balance sheet as of December 31, 2015, is fairly stated, in all material respects, in relation to the balance sheet from which it has been derived.
Management’s Responsibility for the Financial Statements
Management is responsible for the preparation and fair presentation of these financial statements in accordance with accounting principles generally accepted in the United States of America; this includes the design, implementation, and maintenance of internal control relevant to the preparation and fair presentation of financial statements that are free from material misstatement, whether due to fraud or error.
Accountants’ Responsibility
Our responsibility is to conduct the review engagements in accordance with Statements on Standards for Accounting and Review Services promulgated by the Accounting and Review Services Committee of the AICPA. Those standards require us to perform procedures to obtain limited assurance as a basis for reporting whether we are aware of any material modifications that should be made to the financial statements for them to be in accordance with accounting principles generally accepted in the United States of America. We believe that the results of our procedures provide a reasonable basis for our report.
Accountants’ Conclusion
Based on our review, we are not aware of any material modifications that should be made to the information referred to above for them to be in conformity with accounting principles generally accepted in the United States of America.
Fort Mitchell, Kentucky
June 29,2016
| VonLehman & Company Inc. Kentucky Ohio Indiana 800.887.0437 vlcpa.com 250 Grandview Drive, Suite 300 Fort Mitchell, KY 41017-5610 859.331.3300 | ||
F-135
Table of Contents
BALANCE SHEETS
AS OF MARCH 31, 2016 and DECEMBER 31, 2015
(In $000’s)
| March 31, 2016` |
December 31, 2015 |
|||||||
| ASSETS |
||||||||
| CURRENT ASSETS |
||||||||
| Cash |
$ | 219 | $ | 223 | ||||
| Accounts receivable—net of allowance for doubtful accounts of $730 and $730, respectively |
8,097 | 7,403 | ||||||
| Vendor rebates receivable |
1,342 | 2,482 | ||||||
| Inventories |
6,072 | 7,341 | ||||||
| Notes receivable—customers, net |
4 | 13 | ||||||
| Prepaid expenses |
415 | 534 | ||||||
|
|
|
|
|
|||||
| Total current assets |
16,149 | 17,996 | ||||||
| PROPERTY & EQUIPMENT—Net |
4,501 | 4,555 | ||||||
| GOODWILL |
1,666 | 1,666 | ||||||
| NOTES RECEIVABLE—RELATED PARTIES |
597 | 712 | ||||||
|
|
|
|
|
|||||
| TOTAL ASSETS |
$ | 22,913 | $ | 24,929 | ||||
|
|
|
|
|
|||||
| LIABILITIES AND STOCKHOLDERS’ EQUITY |
||||||||
| CURRENT LIABILITIES |
||||||||
| Line of credit |
$ | 2,133 | $ | 3,675 | ||||
| Accounts payable |
3,912 | 3,661 | ||||||
| Accrued expenses and other current liabilities |
756 | 1,008 | ||||||
| Current portion of capital lease obligations |
236 | 233 | ||||||
| Current portion of notes payable |
1,405 | 1,938 | ||||||
|
|
|
|
|
|||||
| Total current liabilities |
8,442 | 10,515 | ||||||
| CAPITAL LEASE OBLIGATIONS |
1,022 | 1,082 | ||||||
| NOTES PAYABLE |
2,098 | 2,112 | ||||||
| NOTES PAYABLE—RELATED PARTIES |
612 | — | ||||||
|
|
|
|
|
|||||
| TOTAL LIABILITIES |
12,174 | 13,709 | ||||||
| STOCKHOLDERS’ EQUITY |
10,739 | 11,220 | ||||||
|
|
|
|
|
|||||
| TOTAL LIABILITIES AND STOCKHOLDERS’ EQUITY |
$ | 22,913 | $ | 24,929 | ||||
|
|
|
|
|
|||||
See accountants’ report and accompanying notes.
F-136
Table of Contents
STATEMENTS OF INCOME
FOR THE THREE MONTHS ENDED MARCH 31, 2016 AND 2015
(In 000’s)
| Three Months Ended March 31, |
||||||||
| 2016 | 2015 | |||||||
| NET SALES |
$ | 13,504 | $ | 11,732 | ||||
| COST OF GOODS SOLD |
9,292 | 8,416 | ||||||
|
|
|
|
|
|||||
| GROSS PROFIT |
4,212 | 3,316 | ||||||
| OPERATING EXPENSES |
||||||||
| Selling, general and administrative expenses |
3,035 | 2,708 | ||||||
| Depreciation expense |
302 | 258 | ||||||
|
|
|
|
|
|||||
| Total operating expenses |
3,337 | 2,966 | ||||||
|
|
|
|
|
|||||
| OPERATING INCOME |
875 | 350 | ||||||
| OTHER EXPENSE |
||||||||
| Interest expense |
71 | 93 | ||||||
|
|
|
|
|
|||||
| NET INCOME |
$ | 804 | $ | 257 | ||||
|
|
|
|
|
|||||
See accountants’ report and accompanying notes.
F-137
Table of Contents
STATEMENT OF STOCKHOLDERS’ EQUITY
(In 000’s)
| Common Stock |
Paid-In Capital |
Retained Earnings |
Subscriptions Receivable |
Treasury Stock |
Total | |||||||||||||||||||
| BALANCE AT DECEMBER 31, 2014 |
$ | 106 | $ | 567 | $ | 8,624 | $ | (202 | ) | $ | (97 | ) | $ | 8,998 | ||||||||||
| Payments on stock subscriptions |
— | — | — | 39 | — | 39 | ||||||||||||||||||
| Distributions |
— | — | (1,099 | ) | — | — | (1,099 | ) | ||||||||||||||||
| Net income for year |
— | — | 3,282 | — | — | 3,282 | ||||||||||||||||||
|
|
|
|
|
|
|
|
|
|
|
|
|
|||||||||||||
| BALANCE AT DECEMBER 31, 2015 |
106 | 567 | 10,807 | (163 | ) | (97 | ) | 11,220 | ||||||||||||||||
| Payments on stock subscriptions |
— | — | — | 45 | — | 45 | ||||||||||||||||||
| Distributions |
— | — | (1,330 | ) | — | — | (1,330 | ) | ||||||||||||||||
| Net income for period |
— | — | 804 | — | — | 804 | ||||||||||||||||||
|
|
|
|
|
|
|
|
|
|
|
|
|
|||||||||||||
| BALANCE AT MARCH 31, 2016 |
$ | 106 | $ | 567 | $ | 10,281 | $ | (118 | ) | $ | (97 | ) | $ | 10,739 | ||||||||||
|
|
|
|
|
|
|
|
|
|
|
|
|
|||||||||||||
See accountants’ report and accompanying notes.
F-138
Table of Contents
STATEMENTS OF CASH FLOWS
FOR THE THREE MONTHS ENDED MARCH 31, 2016 AND 2015
(In 000’s)
| Three Months Ended, March 31, |
||||||||
| 2016 | 2015 | |||||||
| Cash flows from operating activities |
||||||||
| Net income |
$ | 804 | $ | 257 | ||||
| Reconciliation of net income with cash flows from operations |
||||||||
| Depreciation |
302 | 258 | ||||||
| Changes in |
||||||||
| Accounts receivable |
(694 | ) | (592 | ) | ||||
| Vendor rebates receivable |
1,140 | 1,015 | ||||||
| Inventories |
1,269 | (189 | ) | |||||
| Prepaid expenses |
119 | (14 | ) | |||||
| Accounts payable |
251 | 169 | ||||||
| Accrued expenses |
(252 | ) | (287 | ) | ||||
|
|
|
|
|
|||||
| Cash provided by operations |
2,939 | 617 | ||||||
|
|
|
|
|
|||||
| Cash flows from investing activities |
||||||||
| Acquisition of property and equipment |
(248 | ) | (55 | ) | ||||
| Net change in notes receivable |
124 | 600 | ||||||
|
|
|
|
|
|||||
| Cash (used) provided by investing activities |
(124 | ) | 545 | |||||
|
|
|
|
|
|||||
| Cash flows from financing activities |
||||||||
| Net change in line of credit |
(1,542 | ) | 83 | |||||
| Additions to notes payable related parties |
612 | 59 | ||||||
| Payments on stock subscription receivable |
45 | 44 | ||||||
| Payments on capital lease obligations |
(57 | ) | (44 | ) | ||||
| Payments on long-term debt |
(547 | ) | (383 | ) | ||||
| Distributions |
(1,330 | ) | (1,077 | ) | ||||
|
|
|
|
|
|||||
| Cash used by financing activities |
(2,819 | ) | (1,318 | ) | ||||
|
|
|
|
|
|||||
| Net change in cash |
(4 | ) | (156 | ) | ||||
| Beginning cash balance |
223 | 176 | ||||||
|
|
|
|
|
|||||
| Ending cash balance |
$ | 219 | $ | 20 | ||||
|
|
|
|
|
|||||
See accountants’ report and accompanying notes.
F-139
Table of Contents
NOTES TO FINANCIAL STATEMENTS
AS OF MARCH 31, 2016 AND DECEMBER 31, 2015, AND FOR THE PERIODS ENDED
MARCH 31, 2016 AND 2015
1. DESCRIPTION OF COMPANY
Ken Builders Supply, Inc. (dba Ken/API Supply) (the Company) operates as a retail and wholesale building products distributor. The Company sells primarily to contractors and individuals in the Midwest region.
2. SUMMARY OF SIGNIFICANT ACCOUNTING POLICIES
Use of Estimates—The preparation of financial statements in conformity with generally accepted accounting principles (GAAP) requires management to make estimates and assumptions that affect the amounts of assets and liabilities and disclosure of contingent assets and liabilities as of the date of the financial statements and the reported amounts of revenues and expenses during the reporting period. Actual results may differ from these estimates.
Concentration of Risk—Financial instruments, which potentially subject the Company to concentration of credit risk, consist principally of accounts receivable. The Company’s accounts receivable are primarily from customers in the building industry located in the United States. Concentration of credit risk with respect to accounts receivable is limited due to the large number of customers comprising the Company’s customer base. The Company performs credit evaluations of its customers; however, the Company’s policy is not to require collateral. At March 31, 2016 and December 31, 2015, the Company had no significant concentrations of credit risk.
Liquidity and Credit Risk—The primary sources of liquidity and capital resources are cash provided from operating activities and other borrowings. The primary requirements for liquidity and capital are to operate and fund current activities. The Company believes that cash and expected cash flow from operations are adequate to fund debt service requirements, operating lease obligations, capital expenditures and working capital obligations for the next twelve months.
Accounts Receivable—The Company sells to customers using credit terms customary in its industry. Accounts receivables are recorded at invoiced amounts and generally do not bear interest. The allowance for doubtful accounts reflects the Company’s estimate of credit exposure, determined principally on the basis of its collection experience, aging of its receivables and significant individual account credit risk.
Vendor Rebates Receivable—The Company receives rebates from certain vendors based on the volume of inventory purchased. A receivable is recorded for these rebates when the amount of the rebate is reasonably estimable and collectible. Rebates received are recorded through a reduction to cost of goods sold.
Inventories—Inventories, consisting substantially of finished goods, are valued at the lower of cost or market (net realizable value). Cost is determined using the moving weighted-average cost method. The Company routinely evaluates inventory for excess or obsolescence and considers factors such as historical usage rates and present demand. Inventories are stated net of reserves for losses of $114 thousand and $97 thousand as of March 31, 2016 and December 31, 2015, respectively.
F-140
Table of Contents
KEN BUILDERS SUPPLY, INC.
NOTES TO FINANCIAL STATEMENTS—(Continued)
Property and Equipment—Property and equipment are stated at cost less accumulated depreciation and amortization. Major additions and improvements are capitalized and depreciated; maintenance and repairs are charged to expense when incurred. Upon disposition, the related cost and accumulated depreciation are removed from the accounts and any resulting gain or loss is recognized in selling, general, and administrative expense. Depreciation and amortization are computed using the straight-line method over the following estimated useful lives:
| Equipment |
3 – 10 Years | |||
| Vehicles |
5 – 7 Years | |||
| Leasehold improvements |
7 — 39.5 Years | |||
| Computer equipment |
3 – 7 Years | |||
| Furniture and fixtures |
3 – 7 Years |
Impairment of Long-Lived Assets—The Company reviews property and equipment for impairment when events or circumstances indicate these assets may not be recoverable. Factors considered include significant underperformance relative to expected historical or projected future operating results, significant changes in the manner of use of the acquired assets or the strategy for the overall business and significant negative industry or economic trends. In performing the review for recoverability, future cash flows expected to result from the use of the asset and its eventual disposition are estimated. If the sum of expected future undiscounted cash flows is less than the carrying amount of the asset, and impairment loss is recorded under the discounted cash flow method. As of March 31, 2016 and December 31, 2015, there were no impairments.
Goodwill—Goodwill represents the excess of purchase price over fair value of assets acquired and liabilities assumed in a business combination. The Company performs its impairment test annually or more frequently if impairment indicators arise. Such review entails comparing the carrying value to the fair value. If the aggregate carrying value of goodwill exceeds the fair value, the goodwill is impaired to the extent of the difference between the fair value and the aggregate carrying value. No impairment was recorded during the three months ended March 31, 2016 and 2015.
Revenue Recognition—The criteria for recognition of revenue are met when persuasive evidence that an arrangement exists and both title and risk of loss have passed to the customer, the price is fixed or determinable, and collectability is reasonably assured.
All revenues recognized are net of sales taxes collected and allowances for discounts. Sales taxes collected are subsequently remitted to the appropriate government authorities.
Cost of Goods Sold—Cost of goods sold includes the cost of merchandise, inbound and outbound freight, inventory provisions, warehousing costs, vendor discounts and vendor rebates.
Advertising—The Company expenses the cost of advertising when incurred
Income Taxes—The Company has elected to be treated as an S-Corporation under provisions of the Internal Revenue Code, and as such did not pay federal corporate income taxes on its taxable income. In lieu of corporate income taxes, the shareholders of an S-Corporation are taxed
F-141
Table of Contents
KEN BUILDERS SUPPLY, INC.
NOTES TO FINANCIAL STATEMENTS—(Continued)
on their proportionate share of the Company’s taxable income. Given the structure of the Company as a pass-through entity and the nature of the operations of the Company, there were no significant deferred tax assets or liabilities.
Shipping and Handling Costs—In compliance with accounting standards, the Company includes all amounts billed to customers that relate to shipping and handling in net sales on the statements of income.
Recently Issued Accounting Guidance
In May 2014, the Financial Accounting Standards Board (“FASB”) issued Accounting Standards Update (“ASU”) 2014-09, Revenue from Contracts with Customers (“ASU 2014-09”). ASU 2014-09 amends the guidance for revenue recognition to replace numerous, industry-specific requirements. The core principle of the ASU is that an entity should recognize revenue for the transfer of goods or services equal to the amount that it expects to be entitled to receive for those goods or services. The ASU implements a five-step process for customer contract revenue recognition that focuses on transfer of control, as opposed to transfer of risk and rewards. The amendment also requires enhanced disclosures regarding the nature, amount, timing and uncertainty of revenues and cash flows arising from contracts with customers. On August 8, 2015, the FASB issued ASU No. 2015-14, which defers the effective date of ASU No. 2014-09 by one year. The standard is effective for nonpublic entities for annual and interim periods beginning after December 15, 2017. Entities can transition to the standard either retrospectively to each period presented or as a cumulative-effect adjustment as of the date of adoption. The Company is currently assessing the impact the adoption of ASU 2014-09 will have on its financial statements.
In August 2014, the FASB issued ASU 2014-15, Presentation of Financial Statements—Going Concern (Subtopic 205-40): Disclosures of Uncertainties about an Entity’s Ability to Continue as a Going Concern (“ASU 2014-15”). ASU 2014-15 requires management to evaluate whether there are conditions or events that raise substantial doubt about the entity’s ability to continue as a going concern within one year after the date that the financial statements are issued or are available to be issued. This ASU also requires management to disclose certain information depending on the results of the going concern evaluation. The provisions of this ASU are effective for annual periods ending after December 15, 2016, including interim reporting periods therein. The Company is currently evaluating the impact of this accounting guidance and does not expect any significant impact on its financial statements.
3. CASH
The Company has its cash deposits held at banks that at times may exceed federally insured limits. The Company has not incurred losses related to any deposits in excess of the FDIC insurance amount and believes no significant concentration of credit risk exists with respect to cash deposits.
For purposes of the cash flow statement, cash includes cash on hand and cash in checking accounts.
F-142
Table of Contents
KEN BUILDERS SUPPLY, INC.
NOTES TO FINANCIAL STATEMENTS—(Continued)
Cash paid for interest and a state and local income tax was as follows (in thousands):
| Three Months Ended March 31, | ||||||||
| 2016 | 2015 | |||||||
| Interest |
$ | 71 | $ | 93 | ||||
|
|
|
|
|
|||||
| Income taxes |
$ | — | $ | — | ||||
|
|
|
|
|
|||||
The Company had noncash financing and investing transactions as follows (in thousands):
| March 31, 2016 |
March 31, 2015 |
|||||||
| Property and equipment acquired through notes payable |
$ | — | $ | 1,184 | ||||
|
|
|
|
|
|||||
| Vehicles acquired through capital lease obligations |
$ | — | $ | 345 | ||||
|
|
|
|
|
|||||
| Accrued distribution |
$ | — | $ | 22 | ||||
|
|
|
|
|
|||||
| Note receivable write off through allowance for doubtful accounts |
$ | — | $ | 269 | ||||
|
|
|
|
|
|||||
4. NOTES RECEIVABLE—CUSTOMERS
The Company has signed promissory notes with certain customers. The notes represent prior account receivable balances and have varying payment terms and interest rates as follows (in thousands):
| March 31, 2016 |
December 31, 2015 |
|||||||
| Notes receivable from customers; due in monthly installments with interest rates ranging from 0% to 6%. The notes mature on various dates through June, 2016; generally guaranteed by the stockholders of the respective companies. |
$ | 4 | $ | 13 | ||||
| Allowance for doubtful accounts |
— | — | ||||||
|
|
|
|
|
|||||
| Note receivable—customer, net |
4 | 13 | ||||||
| Less current portion |
(4 | ) | (13 | ) | ||||
|
|
|
|
|
|||||
| Long-term portion |
$ | — | $ | — | ||||
|
|
|
|
|
|||||
F-143
Table of Contents
KEN BUILDERS SUPPLY, INC.
NOTES TO FINANCIAL STATEMENTS—(Continued)
5. PROPERTY AND EQUIPMENT
Property and equipment as of March 31, 2016 and December 31, 2015, consist of the following (in thousands):
| March 31, 2016 |
December 31, 2015 |
|||||||
| Equipment |
$ | 1,555 | $ | 1,536 | ||||
| Vehicles |
9,194 | 9,003 | ||||||
| Leasehold improvements |
893 | 887 | ||||||
| Computer equipment |
637 | 606 | ||||||
| Furniture and fixtures |
104 | 103 | ||||||
|
|
|
|
|
|||||
| Property and equipment, gross |
12,383 | 12,135 | ||||||
| Less: accumulated depreciation |
7,882 | 7,580 | ||||||
|
|
|
|
|
|||||
| Property and equipment—net |
$ | 4,501 | $ | 4,555 | ||||
|
|
|
|
|
|||||
Depreciation expense for property and equipment was $258 thousand and $302 thousand for the three months ended March 31, 2016 and 2015, respectively.
6. LINE OF CREDIT
The Company has available a $5,500,000 line of credit with a bank, collateralized by the general assets of the Company, the personal guarantee of the majority stockholder and which charges interest at the prime rate plus .5% (the prime rate was 3.5% as of March 31, 2016). The line was repaid prior to maturity as part of the FBM acquisition in 2016. (See Note 14)
F-144
Table of Contents
KEN BUILDERS SUPPLY, INC.
NOTES TO FINANCIAL STATEMENTS—(Continued)
7. NOTES PAYABLE
The Company had the following notes payable on its books at March 31, 2016 and December 31, 2015 (in thousands):
| March 31, 2016 |
December 31, 2015 |
|||||||
| The Company has several installment notes payable collateralized by equipment at interest rates ranging from 0% to 6.26%, payable in monthly installments of principal and interest ranging from $2 to $12 thousand and due on various dates through June, 2019. The notes were paid off as part of the FBM acquisition in 2016. |
$ | 1,158 | $ | 1,269 | ||||
| Term note payable to bank in order to refinance debt; established in June, 2014 due in monthly installments of $91 thousand, including interest at 4.5%, loan matures in June, 2017 at which time the remaining balance is due; collateralized by receivables, inventory and the personal guarantee of the majority shareholder. The note was paid off as part of the FBM acquisition in 2016. |
1,381 | 1,761 | ||||||
| Term note payable to bank in order to purchase assets; established in March, 2015 due in monthly installments of $22 thousand, including interest at 3.58%, loan matures in June, 2017 at which time the remaining balance is due; collateralized by receivables, inventory and the personal guarantee of the majority shareholder. The note was paid off as part of the FBM acquisition in 2016. |
964 | 1,020 | ||||||
|
|
|
|
|
|||||
| 3,503 | 4,050 | |||||||
| Less current portion |
1,405 | 1,938 | ||||||
|
|
|
|
|
|||||
| Long-term portion |
$ | 2,098 | $ | 2,112 | ||||
|
|
|
|
|
|||||
The remaining maturities on these notes are as follows (in thousands):
| Years Ending March 31, |
||||
| 2017 |
$ | 1,405 | ||
| 2018 |
1,162 | |||
| 2019 |
528 | |||
| 2020 |
344 | |||
| 2021 |
64 | |||
|
|
|
|||
| $ | 3,503 | |||
|
|
|
|||
In accordance with its debt agreements with the bank, the Company must maintain certain annual financial covenants. At March 31, 2016, the Company was in compliance with the covenants.
8. CAPITAL LEASE OBLIGATIONS
The Company has capital lease obligations, collateralized by the equipment purchased, that charge interest at 4.0%. These capital lease obligations expire on various dates through September, 2022. Depreciation expense for equipment held under the capital lease obligations was $61 thousand and $50 thousand for the three months ended March 31, 2016 and 2015, respectively.
F-145
Table of Contents
KEN BUILDERS SUPPLY, INC.
NOTES TO FINANCIAL STATEMENTS—(Continued)
The following is a summary of equipment at cost less accumulated depreciation held under the capital lease obligations (in thousands):
| March 31, 2016 |
December 31, 2015 |
|||||||
| Equipment |
$ | 1,718 | $ | 1,718 | ||||
| Less accumulated depreciation |
(517 | ) | (456 | ) | ||||
|
|
|
|
|
|||||
| $ | 1,201 | $ | 1,262 | |||||
|
|
|
|
|
|||||
The following is a summary of the remaining future minimum capital lease payments and associated interest expense (in thousands):
| Years Ending March 31, |
||||||||
| 2017 |
$ | 282 | ||||||
| 2018 |
282 | |||||||
| 2019 |
282 | |||||||
| 2020 |
282 | |||||||
| 2021 |
266 | |||||||
|
|
|
|||||||
| $ | 1,394 | |||||||
| Less interest portion |
136 | |||||||
|
|
|
|||||||
| Net capital lease obligations |
1,258 | $ | 1,315 | |||||
| Less current portion |
236 | 233 | ||||||
|
|
|
|
|
|||||
| Long term portion |
$ | 1,022 | $ | 1,082 | ||||
|
|
|
|
|
|||||
9. STOCKHOLDERS’ EQUITY
Stockholders’ Equity as of March 31, 2016 and December 31, 2015, consist of the following (in thousands):
| March 31, 2016 |
December 31, 2015 |
|||||||
| Class A common stock, no par value; 500 shares authorized, 254 issued and 252 outstanding |
$ | 18 | $ | 18 | ||||
| Class B common stock, no par value; 2,500 shares authorized, 1,270 issued and 1,260 outstanding |
88 | 88 | ||||||
| Additional paid in capital |
567 | 567 | ||||||
| Retained earnings |
10,281 | 10,807 | ||||||
| Treasury stock, 2 Class A; 10 Class B shares at cost |
(97 | ) | (97 | ) | ||||
| Subscription receivable |
(118 | ) | (163 | ) | ||||
|
|
|
|
|
|||||
| Stockholders’ equity |
$ | 10,739 | $ | 11,220 | ||||
|
|
|
|
|
|||||
10. RELATED PARTIES
Notes Receivable—Related Parties
The Company has a note with the majority stockholder that is unsecured, payable on demand and bears simple interest at 4.00% for both 2016 and 2015, with no fixed repayment terms. Interest income from this note was $-0- for three months ended March 31, 2016 and 2015, respectively. This note was repaid as part of the FBM acquisition in 2016.
F-146
Table of Contents
KEN BUILDERS SUPPLY, INC.
NOTES TO FINANCIAL STATEMENTS—(Continued)
The Company also has unsecured notes with other stockholders. The notes are due on demand and bear simple interest at 4.00% for both 2016 and 2015, with no fixed repayment terms. Interest income on these notes was $6 thousand and $-0- for the three months ended March 31, 2016 and 2015, respectively. These notes were repaid as part of the FBM acquisition in 2016.
Notes Payable—Related Parties
The Company had unsecured notes payable with other related parties. The notes payable charged interest at 4.00% for 2016. The balance at March 31, 2016 and December 31, 2015 was $612 thousand and $-0- , respectively. Interest expense on these notes was $5 thousand $-0- for the three months ended March 31, 2016 and 2015, respectively.
Facility Leases
The Company leases five of its facilities under operating agreements with monthly payments ranging from $5 to $17 thousand from five limited liability companies in which certain stockholders of the Company are members. The leases expire on various dates through May, 2026. Rent expense associated with these leased facilities was $193 thousand for the three months ended March 31, 2016 and 2015, respectively.
Minimum annual lease commitments under non-cancelable leases are summarized as follows (in thousands):
| Years Ending March 31, |
Total | |||
| 2017 |
$ | 713 | ||
| 2018 |
661 | |||
| 2019 |
503 | |||
| 2020 |
503 | |||
| 2021 |
343 | |||
| Thereafter |
1,176 | |||
|
|
|
|||
| $ | 3,899 | |||
|
|
|
|||
11. RETIREMENT PLANS
The Company has a retirement savings plan for eligible full-time and hourly employees under Section 401(k) of the Internal Revenue Code. The plan allows participants to contribute a portion of their earnings to the plan. The plan allows the Company, at its discretion, to match a certain percentage of the employees’ contributions, limited to a certain percentage of eligible compensation. By its nature the plan is fully funded. The Company’s contributions to the plan were $12 thousand and $7 for the three months ended March 31, 2016 and 2015, respectively.
12. COMMITMENTS AND CONTINGENCIES
The Company leases certain facilities and equipment under various operating lease agreements with expiration dates through October, 2018. These agreements generally require the Company to pay rental amounts and operating expenses.
F-147
Table of Contents
KEN BUILDERS SUPPLY, INC.
NOTES TO FINANCIAL STATEMENTS—(Continued)
Rent expense was $54 thousand and $53 thousand for the three months ended March 31, 2016 and 2015, respectively. Rent expense is included in selling, general and administrative expenses in the Statements of Income.
Minimum annual lease commitments under non-cancelable leases are summarized as follows:
| Years Ending March 31, |
Total | |||
| 2017 |
$ | 134 | ||
| 2018 |
100 | |||
| 2019 |
58 | |||
|
|
|
|||
| $ | 292 | |||
|
|
|
|||
13. LOAN GUARANTEE
The Company leases five facilities from related party entities under various operating agreements as detailed in Note 9. The Company’s majority stockholder owns the majority of equity in each of these entities and as of March 31, 2016 and December 31, 2015, has guaranteed the debt of each entity. The combined carrying amount of their debt as of March 31, 2016 and December 31, 2015 was approximately $3,371 thousand. The debt for each entity is secured by their respective facilities.
14. SUBSEQUENT EVENTS
On May 31, 2016, substantially all of the assets and operations of the Company were acquired by Foundation Building Materials (FBM) for cash. The acquisition was accounted for by the acquisition method, and accordingly the results of operations will be included in financial statements of FBM subsequent to the acquisition date.
Management has performed an analysis of activities and transactions subsequent to March 31, 2016 to determine the need for any adjustments to or disclosures within these financial statements for the three months ended March 31, 2016 and 2015. Management has performed their analysis through June 29, 2016, which was the date that the financial statements were issued and has determined that there are no subsequent events to disclose.
******
F-148
Table of Contents
Financial Statements as of December 30, 2015, and December 31, 2014, and for the Period from January 1, 2015, to December 30, 2015, and the Year Ended December 31, 2014, and Independent Auditors’ Report
F-149
Table of Contents
|
|
Deloitte & Touche LLP | |
| 695 Town Center Drive | ||
| Suite 1200 | ||
| Costa Mesa, CA 92626 | ||
| USA | ||
| Tel: +1 714 436 7100 | ||
| Fax: +1 714 436 7200 | ||
| www.deloitte.com |
Board of Directors
Gypsum Supply Company
Rockford, Illinois
We have audited the accompanying financial statements of Gypsum Supply Company (the “Company”), which comprise the balance sheets as of December 30, 2015 and December 31, 2014, and the related statements of income, member’s equity, and cash flows for the period from January 1, 2015 to December 30, 2015 and for the year ended December 31, 2014, and the related notes to the financial statements.
Management’s Responsibility for the Financial Statements
Management is responsible for the preparation and fair presentation of these financial statements in accordance with accounting principles generally accepted in the United States of America; this includes the design, implementation, and maintenance of internal control relevant to the preparation and fair presentation of financial statements that are free from material misstatement, whether due to fraud or error.
Auditors’ Responsibility
Our responsibility is to express an opinion on these financial statements based on our audits. We conducted our audits in accordance with auditing standards generally accepted in the United States of America. Those standards require that we plan and perform the audit to obtain reasonable assurance about whether the financial statements are free from material misstatement.
An audit involves performing procedures to obtain audit evidence about the amounts and disclosures in the financial statements. The procedures selected depend on the auditor’s judgment, including the assessment of the risks of material misstatement of the financial statements, whether due to fraud or error. In making those risk assessments, the auditor considers internal control relevant to the Company’s preparation and fair presentation of the financial statements in order to design audit procedures that are appropriate in the circumstances, but not for the purpose of expressing an opinion on the effectiveness of the Company’s internal control. Accordingly, we express no such opinion. An audit also includes evaluating the appropriateness of accounting policies used and the reasonableness of significant accounting estimates made by management, as well as evaluating the overall presentation of the financial statements.
We believe that the audit evidence we have obtained is sufficient and appropriate to provide a basis for our audit opinion.
F-150
Table of Contents
Opinion
In our opinion, the financial statements referred to above present fairly, in all material respects, the financial position of the Company as of December 30, 2015 and December 31, 2014, and the results of its operations and cash flows for the period from January 1, 2015 to December 30, 2015 and for the year ended December 31, 2014, in accordance with accounting principles generally accepted in the United States of America.
/s/ Deloitte & Touche LLP
June 8, 2016
F-151
Table of Contents
BALANCE SHEETS
AS OF DECEMBER 30, 2015, AND DECEMBER 31, 2014
(In $000’s)
| December 30, 2015 |
December 31 2014 |
|||||||
| ASSETS |
||||||||
| CURRENT ASSETS: |
||||||||
| Cash |
$ | 7,932 | $ | 7,289 | ||||
| Accounts receivable—net of allowance for doubtful accounts of $305 and $157 for 2015 and 2014, respectively |
16,612 | 16,390 | ||||||
| Vendor rebates receivable |
2,793 | 2,345 | ||||||
| Inventories |
11,063 | 11,106 | ||||||
| Current portion of notes receivable |
288 | 255 | ||||||
| Prepaid expenses and other current assets |
793 | 577 | ||||||
|
|
|
|
|
|||||
| Total current assets |
39,481 | 37,962 | ||||||
| PROPERTY AND EQUIPMENT—Net. |
15,852 | 14,629 | ||||||
| INTANGIBLE ASSETS—Net |
1,217 | 1,489 | ||||||
| GOODWILL |
608 | 608 | ||||||
| NOTES RECEIVABLE |
502 | 218 | ||||||
|
|
|
|
|
|||||
| TOTAL ASSETS |
$ | 57,660 | $ | 54,906 | ||||
|
|
|
|
|
|||||
| LIABILITIES AND MEMBER’S EQUITY |
||||||||
| CURRENT LIABILITIES: |
||||||||
| Accounts payable |
$ | 5,449 | $ | 5,900 | ||||
| Accrued expenses and other current liabilities |
2,341 | 3,656 | ||||||
| Current portion of notes payable |
1,345 | 1,825 | ||||||
|
|
|
|
|
|||||
| Total current liabilities |
9,135 | 11 ,381 | ||||||
| LONG-TERM PORTION OF NOTES PAYABLE |
6,404 | 9,121 | ||||||
|
|
|
|
|
|||||
| Total liabilities |
15,539 | 20,502 | ||||||
| COMMITMENTS AND CONTINGENCIES (Note 10) |
||||||||
| MEMBER’S EQUITY |
42,121 | 34,404 | ||||||
|
|
|
|
|
|||||
| TOTAL LIABILITIES AND MEMBERS’ EQUITY |
$ | 57,660 | $ | 54,906 | ||||
|
|
|
|
|
|||||
See accompanying notes to financial statements.
F-152
Table of Contents
STATEMENTS OF INCOME
FOR THE PERIOD FROM JANUARY 1, 2015, TO DECEMBER 30, 2015, AND
FOR THE YEAR ENDED DECEMBER 31, 2014
(In 000’s)
| For the Period from January 1, 2015, to December 30, 2015 |
For the Year Ended December 31, 2014 |
|||||||
| NET SALES |
$ | 107,715 | $ | 97,926 | ||||
| COST OF GOODS SOLD |
72,741 | 66,532 | ||||||
|
|
|
|
|
|||||
| GROSS PROFIT |
34,974 | 31,394 | ||||||
|
|
|
|
|
|||||
| OPERATING EXPENSES: |
||||||||
| Selling, general, and administrative expenses |
26,958 | 24,475 | ||||||
| Depreciation expense |
1,282 | 995 | ||||||
|
|
|
|
|
|||||
| Total operating expenses |
28,240 | 25,470 | ||||||
|
|
|
|
|
|||||
| OPERATING INCOME |
6,734 | 5,924 | ||||||
| OTHER EXPENSE: |
||||||||
| Interest expense |
(183 | ) | (219 | ) | ||||
|
|
|
|
|
|||||
| NET INCOME |
$ | 6,551 | $ | 5,705 | ||||
|
|
|
|
|
|||||
See accompanying notes to financial statements.
F-153
Table of Contents
STATEMENTS OF MEMBER’S EQUITY
FOR THE PERIOD FROM JANUARY 1, 2015, TO DECEMBER 30, 2015, AND
FOR THE YEAR ENDED DECEMBER 31, 2014
(In $000’s)
| Common Stock | Additional Paid-In Capital |
Retained Earnings |
Unearned ESOP |
Total Equity |
||||||||||||||||
| BALANCE AT JANUARY 1, 2014 |
$ | 216 | $ | 7,380 | $ | 28,102 | $ | (7,831 | ) | $ | 27,867 | |||||||||
| Net income |
— | — | 5,705 | — | 5,705 | |||||||||||||||
| Compensation expense recognized due to release of ESOP shares |
— | 310 | — | 522 | 832 | |||||||||||||||
|
|
|
|
|
|
|
|
|
|
|
|||||||||||
| BALANCE AT DECEMBER 31, 2014 |
216 | 7,690 | 33,807 | (7,309 | ) | 34,404 | ||||||||||||||
| Net income |
— | — | 6,551 | — | 6,551 | |||||||||||||||
| Compensation expense recognized due to release of ESOP shares |
— | 644 | — | 522 | 1,166 | |||||||||||||||
|
|
|
|
|
|
|
|
|
|
|
|||||||||||
| BALANCE AT DECEMBER 30, 2015 |
$ | 216 | $ | 8,334 | $ | 40,358 | $ | (6,787 | ) | $ | 42,121 | |||||||||
|
|
|
|
|
|
|
|
|
|
|
|||||||||||
See accompanying notes to financial statements.
F-154
Table of Contents
STATEMENTS OF CASH FLOWS
FOR THE PERIOD FROM JANUARY 1, 2015, TO DECEMBER 30, 2015, AND
FOR THE YEAR ENDED DECEMBER 31, 2014
(In 000’s)
| For the Period from January 1, 2015, to December 30, 2015 |
For the Year Ended December 31, 2014 |
|||||||
| CASH FLOWS FROM OPERATING ACTIVITIES: |
||||||||
| Net income |
$ | 6,551 | $ | 5,705 | ||||
| Adjustments to reconcile net income to net cash provided by operating activities: |
||||||||
| Depreciation and amortization |
1,551 | 1,144 | ||||||
| Bad debt expense |
358 | 431 | ||||||
| Loss on disposal of fixed assets |
4 | 132 | ||||||
| Amortization of inventory fair value adjustment |
— | 301 | ||||||
| Compensation expense for ESOP due to change in fair value |
1,166 | 832 | ||||||
| Changes in assets and liabilities—net effects of acquisitions: |
||||||||
| Accounts receivable |
(580 | ) | (4,305 | ) | ||||
| Vendor rebates receivable |
(448 | ) | (969 | ) | ||||
| Inventories |
43 | (611 | ) | |||||
| Prepaid expenses and other current assets |
(216 | ) | 56 | |||||
| Notes receivable |
(317 | ) | 24 | |||||
| Accounts payable |
(451 | ) | 1,001 | |||||
| Accrued expenses and other current liabilities |
(1,315 | ) | 573 | |||||
|
|
|
|
|
|||||
| Net cash provided by operating activities |
6,346 | 4,314 | ||||||
|
|
|
|
|
|||||
| CASH FLOWS FROM INVESTING ACTIVITIES: |
||||||||
| Capital expenditures |
(2,506 | ) | (2,199 | ) | ||||
| Cash paid for acquisition |
— | (4,703 | ) | |||||
|
|
|
|
|
|||||
| Net cash used in investing activities |
(2,506 | ) | (6,902 | ) | ||||
|
|
|
|
|
|||||
| CASH FLOWS FROM FINANCING ACTIVITIES: |
||||||||
| Proceeds from notes payable |
— | 6,071 | ||||||
| Repayment of notes payable |
(3,197 | ) | (3,005 | ) | ||||
|
|
|
|
|
|||||
| Net cash (used in) provided by financing activities |
(3,197 | ) | 3,066 | |||||
|
|
|
|
|
|||||
| NET INCREASE IN CASH |
643 | 478 | ||||||
| CASH AT BEGINNING OF PERIOD |
7,289 | 6,811 | ||||||
|
|
|
|
|
|||||
| CASH AT END OF PERIOD |
$ | 7,932 | $ | 7,289 | ||||
|
|
|
|
|
|||||
| SUPPLEMENTAL DISCLOSURE OF CASH FLOW INFORMATION |
||||||||
| Cash paid during the period for interest. |
$ | 223 | $ | 221 | ||||
|
|
|
|
|
|||||
See accompanying notes to financial statements.
F-155
Table of Contents
NOTES TO FINANCIAL STATEMENTS
AS OF DECEMBER 30, 2015, AND DECEMBER 31, 2014, AND
FOR THE PERIOD FROM JANUARY 1, 2015, TO DECEMBER 30, 2015, AND
THE YEAR ENDED DECEMBER 31, 2014
1. DESCRIPTION OF COMPANY AND BASIS OF PRESENTATION
Description of Company—Gypsum Supply Company (GSC or the “Company”) was formed in Illinois on March 17, 1978. The Company is engaged in the wholesale and retail distribution of wallboard, metal framing, suspended ceiling systems, and other products to contractors and individuals in the Midwest region. The Company has branch locations in Illinois (6), Iowa (4), and Wisconsin (4). Refer to footnote 6, Notes Payable and footnote 9, Employee Stock Ownership Plan (ESOP) for information regarding the Company’s transactions with the ESOP.
Basis of Presentation—The financial statements of the Company for the period from January 1, 2015, to December 30, 2015, and the year ended December 31, 2014. The accompanying financial statements have been prepared in accordance with accounting principles generally accepted in the United States of America (GAAP).
On December 30, 2015, the assets and operations of the Company were acquired by Foundation Building Materials (FBM) for cash (FBM acquisition). The acquisition was accounted for by the acquisition method and, accordingly, the results of operations will be included in financial statements of FBM subsequent to the acquisition date.
Comprehensive Income—The Company does not have components of other comprehensive income recorded within its financial statements and, therefore, does not separately present a statements of comprehensive income in its financial statements.
2. SUMMARY OF SIGNIFICANT ACCOUNTING POLICIES
Use of Estimates—The preparation of financial statements in conformity with GAAP requires management to make estimates and assumptions that affect the amounts of assets and liabilities and disclosure of contingent assets and liabilities as of the date of the financial statements and the reported amounts of revenues and expenses during the reporting period. Actual results may differ from these estimates.
Cash—Cash includes deposits in financial institutions and money market deposits. The Company has its cash deposits held at banks that, at times, may exceed federally insured limits. The Company has not incurred losses related to any deposits in excess of the Federal Deposit Insurance Corporation insurance amount and believes no significant concentration of credit risk exists with respect to cash deposits.
Concentration of Risk—Financial instruments, which potentially subject the Company to concentration of credit risk, consist principally of accounts receivable. The Company’s accounts receivable are primarily from customers in the building industry located in the United States. Concentration of credit risk with respect to accounts receivable is limited due to the large number of customers comprising the Company’s customer base. The Company performs credit evaluations of its customers; however, the Company’s policy is not to require collateral. At December 30, 2015, and December 31, 2014, the Company had no significant concentrations of credit risk.
F-156
Table of Contents
GYPSUM SUPPLY COMPANY
NOTES TO FINANCIAL STATEMENTS—(Continued)
Liquidity and Credit Risk—The primary sources of liquidity and capital resources are cash provided from operating activities and other borrowings. The primary requirements for liquidity and capital are to operate and fund current activities. The Company believes that cash and expected cash flows from operations are adequate to fund debt-service requirements, operating lease obligations, capital expenditures, and working capital obligations for the next 12 months.
Accounts Receivable—The Company sells to customers using credit terms customary in its industry. Accounts receivables are recorded at invoiced amounts and generally do not bear interest.
The allowance for doubtful accounts reflects the Company’s estimate of credit exposure, determined principally on the basis of its collection experience, aging of its receivables, and significant individual account credit risk.
Vendor Rebates Receivable—The Company receives rebates from certain vendors based on the volume of inventory purchased. A receivable is recorded for these rebates when the amount of the rebate is reasonably estimable and collectible. Rebates received are initially recorded as a reduction of the cost of the inventory purchased and subsequently recognized through a reduction to cost of goods sold, when the related inventory is sold.
Inventories—Inventories, consisting substantially of finished goods, are valued at the lower of cost or market (net realizable value). Cost is determined using the moving weighted-average cost method. The Company routinely evaluates inventory for excess or obsolescence and considers factors, such as historical usage rates and present demand.
Property and Equipment—Property and equipment are stated at cost, less accumulated depreciation and amortization. Major additions and improvements are capitalized and depreciated; maintenance and repairs are charged to expense when incurred. Upon disposition, the related cost and accumulated depreciation are removed from the accounts and any resulting gain or loss is recognized in selling, general, and administrative expenses. Depreciation and amortization are computed using the straight-line method over the following estimated useful lives:
| Buildings | 39 years | |
| Vehicles and equipment | 5-7 years | |
| Furniture and fixtures | 7 years | |
| Leasehold improvements | Lesser of useful life or lease term |
Impairment of Long-Lived Assets—The Company reviews property and equipment for impairment when events or circumstances indicate these assets may not be recoverable. Factors considered include significant underperformance relative to expected historical or projected future operating results, significant changes in the manner of use of the acquired assets or the strategy for the overall business, and significant negative industry or economic trends. In performing the review for recoverability, future cash flows expected to result from the use of the asset and its eventual disposition are estimated. If the sum of expected future undiscounted cash flows is less than the carrying amount of the asset, the impairment loss is recorded under the discounted cash flow method. As of December 30, 2015, and December 31, 2014, there were no impairments.
F-157
Table of Contents
GYPSUM SUPPLY COMPANY
NOTES TO FINANCIAL STATEMENTS—(Continued)
Goodwill and Intangible Assets—Intangible assets consist of noncompete agreements and customer lists. Intangible assets with definite lives are amortized over their respective estimated useful lives using the straight-line method. The period of amortization of the noncompete agreements are five years and customer lists are 10 years (see Note 4).
Goodwill represents the excess of purchase price over fair value of assets acquired and liabilities assumed in a business combination.
The Company performs its impairment test annually on the first day of the fourth quarter or more frequently if impairment indicators arise. Such review entails comparing the carrying value of the reporting unit to the fair value. If the aggregate carrying value of goodwill of the reporting unit exceeds the fair value, the goodwill is impaired to the extent of the difference between the fair value and the aggregate carrying value. No impairment was recorded for the period from January 1, 2015, to December 30, 2015, and the year ended December 31, 2014.
Debt Issuance Costs—During 2015, the Company elected to early adopt Accounting Standards Update (ASU) No. 2015-03, Interest-Imputation of Interest (Subtopic 835-30): Simplifying the Presentation of Debt Issuance Costs and therefore applied the standard retrospectively to all prior periods. The guidance simplifies the presentation of debt issuance costs by requiring debt issuance costs to be presented as a deduction from the corresponding liability, consistent with debt discounts. The recognition and measurement guidance for debt issuance costs is not affected. Therefore, these costs will continue to be amortized as interest expense over the term of the corresponding debt issuance.
Revenue Recognition—The criteria for recognition of revenue are met when persuasive evidence that an arrangement exists and both title and risk of loss have passed to the customer, the price is fixed or determinable, and collectibility is reasonably assured.
All revenues recognized are net of sales taxes collected and allowances for discounts. Sales taxes collected are subsequently remitted to the appropriate government authorities.
Cost of Goods Sold—Cost of goods sold includes the cost of merchandise, inbound and outbound freight, inventory provisions, warehousing costs, vendor discounts, and vendor rebates.
Income Taxes—The Company has elected to be treated as an S corporation under provisions of the Internal Revenue Code and as such did not pay federal corporate income taxes on its taxable income. In lieu of corporate income taxes, the shareholders of an S corporation are taxed on their proportionate share of the Company’s taxable income. Given the structure of the Company as a pass-through entity and the nature of the operations of the Company, there were no significant deferred tax assets or liabilities.
Fair Value of Financial Instruments—Fair value is defined as the price that would be received to sell an asset or price paid to transfer a liability in an orderly transaction between market participants at the measurement date. Authoritative guidance for fair value measurements establishes a hierarchy that prioritizes the inputs to valuation models based upon the degree to which they are observable. The three levels of the fair value measurement hierarchy are as follows:
Level 1: Inputs represent quoted prices in active markets for identical assets or liabilities at the measurement date.
F-158
Table of Contents
GYPSUM SUPPLY COMPANY
NOTES TO FINANCIAL STATEMENTS—(Continued)
Level 2. Inputs (other than quoted prices included in Level 1) that are either directly or indirectly observable for the asset or liability through correlation with market data at the measurement date for the duration of the instrument’s anticipated life.
Level 3: Inputs are unobservable and, therefore, reflect management’s best estimate of the assumptions that market participants would use in pricing the asset or liability.
The Company estimates the fair value of its assets and liabilities, which qualify as financial instruments, and includes this additional information in the notes to financial statements when the fair value is different from the carrying value of these instruments. The estimated fair value of cash, accounts receivable, prepaid expenses, notes receivable, accounts payable, and accrued expenses approximate their carrying amounts due to the relatively short maturity of these instruments. The fair value of notes payable is determined using Level 2 inputs, based on applicable rates for similar instruments and collateral as of the balance sheet date and approximates $7.7 million and $10.9 million as of December 30, 2015, and December 31, 2014, respectively.
Recently Issued Accounting Guidance—In May 2014, the Financial Accounting Standards Board (FASB) issued ASU No. 2014-09, Revenue from Contracts with Customers (“ASU 2014-09”). ASU 2014-09 amends the guidance for revenue recognition to replace numerous industry-specific requirements. The core principle of the ASU is that an entity should recognize revenue for the transfer of goods or services equal to the amount that it expects to be entitled to receive for those goods or services. The ASU implements a five-step process for customer contract revenue recognition that focuses on transfer of control, as opposed to transfer of risk and rewards. The amendment also requires enhanced disclosures regarding the nature, amount, timing, and uncertainty of revenues and cash flows arising from contracts with customers. On August 8, 2015, the FASB issued ASU No. 2015-14, Revenue from Contracts with Customers which defers the effective date of ASU 2014-09 by one year. The standard is effective for non public entities for annual and interim periods beginning after December 15, 2018. Entities can transition to the standard either retrospectively to each period presented or as a cumulative effect adjustment as of the date of adoption. The Company is currently assessing the impact the adoption of ASU 2014-09 will have on its financial statements.
In August 2014, the FASB issued ASU No. 2014-15, Presentation of Financial Statements-Going Concern (Subtopic 205-40): Disclosure of Uncertainties about an Entity’s Ability to Continue as a Going Concern (“ASU 2014-15”). ASU 2014-15 requires management to evaluate whether there are conditions or events that raise substantial doubt about the entity’s ability to continue as a going concern within one year after the date that the financial statements are issued or are available to be issued. This ASU also requires management to disclose certain information depending on the results of the going-concern evaluation. The provisions of this ASU are effective for annual periods ending after December 15, 2016, including interim reporting periods therein. The Company is currently evaluating the impact of this accounting guidance and does not expect any significant impact on its financial statements.
In July 2015, the FASB issued ASU No. 2015-11, Simplifying the Measurement of lnventory (“ASU 2015-11”), which applies to inventory valued at first-in, first-out or average cost. ASU 2015-11 requires inventory to be measured at the lower of cost and net realizable value, rather than at the lower of cost or market. ASU 2015-11 is effective on a prospective basis for annual
F-159
Table of Contents
GYPSUM SUPPLY COMPANY
NOTES TO FINANCIAL STATEMENTS—(Continued)
periods, including interim reporting periods within those periods, beginning after December 15, 2016. The Company reports inventory on an average-cost basis and thus will be required to adopt the standard; however, the provisions of ASU 2015-11 are not expected to have a material effect on the Company’s financial condition.
In September 2015, the FASB issued ASU No. 2015-16, Business Combinations (Topic 805): Simplifying the Accounting for Measurement-Period Adjustments (“ASU 2015-16”). ASU 2015-16 eliminates the requirement to restate prior-period financial statements for measurement-period adjustments. The new guidance requires that the cumulative impact of a measurement-period adjustment (including the impact on prior periods) be recognized in the reporting period in which the adjustment is identified. In addition, separate presentation on the face of the income statement or disclosure in the notes is required regarding the portion of the adjustment recorded in the current-period earnings, by line item, which would have been recorded in previous reporting periods if the adjustment to the provisional amounts had been recognized as of the acquisition date. ASU 2015-16 is to be applied prospectively for measurement-period adjustments that occur after the effective date. ASU 2015-16 is effective for annual reporting periods, including interim reporting periods within those periods, beginning after December 15, 2015, and early adoption is permitted and the Company intends to adopt in fiscal year 2016. Since it is prospective, the impact of ASU 2015-16 on the Company’s financial condition and earnings will depend upon the nature of any measurement-period adjustments identified in future periods.
In February 2016, the FASB issued ASU No. 2016-02, Leases (“ASU 2016-02”). ASU 2016-02 establishes a right-of-use model that requires a lessee to record a right-of-use asset and a lease liability on the balance sheet for all leases with terms longer than 12 months. Leases will be classified as either “finance” or “operating,” with classification affecting the pattern of expense recognition in the income statement. This update requires a modified retrospective transition as of the beginning of the earliest comparative period presented in the financial statements. This update is effective for fiscal years beginning after December 15, 2019, including interim periods within those fiscal years, with early adoption permitted. The Company is currently evaluating the impact of this guidance on its financial statements.
3. ACQUISITION
On July 28, 2014, the Company acquired certain branch operations and other assets of Engler, Meier & Justus, Inc. (EMJ) for a total purchase price of $4.7 million in cash and through the assumption of certain property tax liabilities. The Company purchased the Peoria, Illinois, branch operations of EMJ, as well as inventory and other fixed assets from two other locations that were closed by EMJ. The purchase of certain branches of EMJ further expanded the Company’s presence in central Iowa and Illinois.
The acquisition was accounted for by the acquisition method and, accordingly, the results of operations for the Peoria branch were included in the Company’s financial statements from the acquisition date. The purchase price was allocated to the assets acquired based on estimated fair values at the acquisition date, with the excess of purchase price over the estimated fair value of the net assets acquired recorded as goodwill. The fair value of acquired intangible assets of $1.6 million, related to noncompete agreements and customer lists, was estimated by applying an income approach. That measure is based on significant Level 3 inputs
F-160
Table of Contents
GYPSUM SUPPLY COMPANY
NOTES TO FINANCIAL STATEMENTS—(Continued)
not observable in the market. Key assumptions developed based on the Company’s future projections and comparable market data, including future cash flows, revenue growth rates, and discount rates.
The Company incurred acquisition costs of less than $0.1 million mainly related to due diligence activities and transaction expenses to complete the acquisition. The costs have been included in selling, general, and administrative expenses in the accompanying statement of income for the year ended December 31, 2014.
The following table summarizes the fair values of the assets acquired and the liabilities assumed (in thousands):
| Inventories |
$ | 1,588 | ||
| Trucks and other equipment |
216 | |||
| Land and building |
700 | |||
| Noncompete agreements |
1,117 | |||
| Customer list |
485 | |||
| Goodwill |
608 | |||
|
|
|
|||
| Total assets acquired |
4,714 | |||
| Accrued liabilities assumed |
(11 | ) | ||
|
|
|
|||
| Net assets acquired |
$ | 4,703 | ||
|
|
|
4. GOODWILL AND INTANGIBLE ASSETS
Identifiable intangible assets that are separable and have determinable useful lives are valued separately and amortized over their benefit period. The following is the gross carrying value and accumulated amortization by a reconciliation of the beginning and ending balances of the Company’s goodwill and identifiable intangible assets at December 30, 2015, and December 31, 2014 (in thousands):
| December 30, 2015 | ||||||||||||
| Gross Carrying Amount |
Accumulated Amortization |
Net Carrying Amount |
||||||||||
| Goodwill |
$ | 608 | $ | — | $ | 608 | ||||||
| Customer list |
485 | (68 | ) | 417 | ||||||||
| Noncompete agreements |
1,117 | (317 | ) | 800 | ||||||||
|
|
|
|
|
|
|
|||||||
| $ | 2,210 | $ | (385 | ) | $ | 1,825 | ||||||
|
|
|
|
|
|
|
|||||||
| December 31, 2014 | ||||||||||||
| Gross Carrying Amount |
Accumulated Amortization |
Net Carrying Amount |
||||||||||
| Goodwill |
$ | 608 | $ | — | $ | 608 | ||||||
| Customer list |
485 | (20 | ) | 465 | ||||||||
| Noncompete agreements |
1,117 | (93 | ) | 1,024 | ||||||||
|
|
|
|
|
|
|
|||||||
| $ | 2,210 | $ | (113 | ) | $ | 2,097 | ||||||
|
|
|
|
|
|
|
|||||||
F-161
Table of Contents
GYPSUM SUPPLY COMPANY
NOTES TO FINANCIAL STATEMENTS—(Continued)
The estimated useful life for the noncompete intangible is five years, while the customer list intangible is 10 years. Amortization expense on the noncompete for the years ending December 31, 2016-2018 will be approximately $223,000 per year and $130,000 for the year ending December 31, 2019. Amortization expense on the customer list for each of the years ending December 31, 2016 through 2020 will be approximately $48,000.
5. PROPERTY AND EQUIPMENT
Property and equipment as of December 30, 2015, and December 31, 2014, consist of the following:
| December 30, 2015 |
December 31, 2014 |
|||||||
| Buildings and land |
$ | 15,938 | $ | 15,268 | ||||
| Vehicles and equipment |
14,424 | 12,954 | ||||||
| Furniture and fixtures |
949 | 942 | ||||||
| Leasehold improvements |
45 | 45 | ||||||
|
|
|
|
|
|||||
| Property and equipment, gross |
31,356 | 29,209 | ||||||
| Less accumulated depreciation |
(15,504 | ) | (14,580 | ) | ||||
|
|
|
|
|
|||||
| Property and equipment-net |
$ | 15,852 | $ | 14,629 | ||||
|
|
|
|
|
|||||
Depreciation expense for property and equipment was $1.3 million and $1.0 million for the period from January 1, 2015, to December 30, 2015, and the year ended December 31, 2014, respectively.
6. NOTES PAYABLE
On October 8, 2015, the Company entered into an amended and restated revolving credit agreement, with the initial bank line of credit dated October 4, 2011. It allows for borrowings up to $1,500,000, subject to borrowing base limitations, and its due July 5, 2016. The borrowings are due upon demand and bear interest at the one-month London InterBank Offered Rate (LIBOR), plus 2%. Borrowings under this agreement are collateralized by the Company’s receivables, inventory, and fixed assets (excluding real estate). For the period from January 1, 2015, to December 30, 2015, and the year ended December 31, 2014, there were no borrowings under this agreement for the respective period.
In accordance with its debt agreements with the bank, the Company must maintain certain financial covenants. The debt includes various covenants, including, among others, maintaining a ratio of debt-service coverage in excess of 1.200 to 1.000. The ratio “Debt-service coverage” means borrower’s net income + depreciation/amortization + interest expense + ESOP expense –distribution/dividends ÷ actual principal and interest payments. At December 30, 2015, the Company was in compliance with the covenants.
F-162
Table of Contents
GYPSUM SUPPLY COMPANY
NOTES TO FINANCIAL STATEMENTS—(Continued)
Notes payable for the period from January 1, 2015, to December 30, 2015, and the year ended December 31, 2014, were $7.7 million and $10.9 million, respectively, and consisted primarily of notes payable to financial institutions. The Company had the following balances as of December 30, 2015, and December 31, 2014:
| December 30, 2015 |
December 31, 2014 |
|||||||||
| Notes payable with an initial loan balance of $5,000,000 dated October 4, 2011. Note is payable in 59 monthly installments of $49,012 and with a balloon payment due at maturity for approximately $2.8 million. Maturity date on the loan is October 4, 2016, and bears a fixed interest rate at 3.27%. The loan is collateralized by the Company’s receivables, inventory, and fixed assets (excluding real estate) |
$ | — | $ | 1,906 | ||||||
| Notes payable dated July 28, 2014, with an initial loan balance of $6,000,000 for five years with a maturity date of July 28, 2021. Note is payable in 83 monthly principal installments of $71,429 and a final principal and interest payment due of $71,526. The note has a variable interest rate which is based on the three-month LIBOR rate (0.61% and 0.26% at December 31,2015 and 2014, respectively), plus 2%. The interest rate changes shall only occur in three-month intervals. The loan is collateralized by the Company’s receivables, inventory, and fixed assets (excluding real estate). The note was paid off as part of the FBM acquisition in 2015 |
$ | 4,850 | $ | 5,640 | ||||||
| Notes payable dated October 4, 2011, with an initial loan balance of $5,000,000 for five years with a maturity date of October 4, 2016. Loan has 59 monthly principal installments of $41 ,667 and a final principal and interest payment due of approximately $2.5 million. The note has a variable interest rate which is based on a 30-day LIBOR rate (0.61 % and .26% at December 31, 2015 and 2014, respectively), plus 2%. The loan is collateralized by the Company’s receivables, inventory, and fixed assets (excluding real estate). The note was paid off as part of the FBM acquisition in 2015 |
$ | 2,899 | $ | 3,400 | ||||||
7. RELATED PARTIES
The Company has leased two facilities from family members of branch managers in 2014 and 2015 at rates that management believes are reflective of market conditions. Rent expense associated with these leased facilities were $72,000 and $93,000 for the period from January 1, 2015, to December 30, 2015, and the year ended December 31, 2014, respectively.
8. RETIREMENT PLANS
The Company has multiple retirement savings plans for eligible full-time and hourly employees under Section 401(k) of the Internal Revenue Code. The plans allow participants to contribute a portion of their earnings to the plans. The plans allow the Company, at its discretion, to match a certain percentage of the employees’ contributions, limited to a certain percentage of eligible compensation. The Company also contributes additional funds to this
F-163
Table of Contents
GYPSUM SUPPLY COMPANY
NOTES TO FINANCIAL STATEMENTS—(Continued)
plan under three union-sponsored, collectively bargained, multiemployer pension plan. There were contributions of $0.5 million and $0.4 million to the plans for the period from January 1, 2015, to December 30, 2015, and the year ended December 31, 2014, respectively.
9. ESOP
The Company sponsors an ESOP to provide additional retirement benefits to substantially all employees. All of the Company’s outstanding common stock is held by the Employee Stock Ownership Trust, which was established to fund the ESOP. All contributions are made by the Company and are allocated in proportion to compensation of eligible participants. The vested portion of an employee’s retirement benefit is a percentage, determined by years of service, of the total amount credited to the employee’s account. Participants are fully vested after six years of service. Distributions from the ESOP are made in cash.
The Company has a loan with the ESOP which requires monthly payments of $58,000, including interest at 3.50%, and is due January 15, 2029. This loan has a balance of $7.3 million and $7.7 million at December 30, 2015, and December 31, 2014, respectively.
The remaining loan to the ESOP is collateralized by the unallocated shares of the Company’s common stock held by the ESOP. As the loan is repaid, shares are released from collateral and allocated to active employees, based on the proportion of payments made in the year to total remaining payments. The Company makes annual contributions to the ESOP equal to the ESOP’s debt service. The Company may make additional contributions to the ESOP at its discretion.
The shares pledged as collateral are deducted from stockholders’ equity as unearned ESOP shares in the accompanying balance sheets. As shares are released from collateral, the Company reports compensation expense equal to the current fair value price of the shares. Dividends on allocated ESOP shares are recorded as a reduction of retained earnings and dividends on unallocated ESOP shares are recorded as compensation expense. The Company made a discretionary contribution of $784,000 and $629,000 to the ESOP for 2015 and 2014, respectively. The Company also recognized compensation expense of $1.9 million and $1.6 million for the period from January 1, 2015, to December 30, 2015, and the year ended December 31, 2014, respectively, due to the release of shares. There were no dividends paid in 2014 and 2013 on allocated shares.
Shares of the Company held by the ESOP at December 30, 2015, and December 31, 2014, are as follows:
| 2015 | 2014 | |||||||
| Allocated shares |
14,402 | 13,888 | ||||||
| Shares released for allocation |
515 | 515 | ||||||
| Unreleased (unearned) shares |
6,692 | 7,206 | ||||||
|
|
|
|
|
|||||
| 21,609 | 21,609 | |||||||
|
|
|
|
|
|||||
| Fair value of unearned shares |
$ | 17,164,724 | $ | 13,050,868 | ||||
|
|
|
|
|
|||||
In the event a participant is no longer employed by the Company, the Company may be required to make contributions to the plan in an amount sufficient to enable the ESOP to make cash payments equal to the value of the participant’s portion of shares held by the ESOP.
F-164
Table of Contents
GYPSUM SUPPLY COMPANY
NOTES TO FINANCIAL STATEMENTS—(Continued)
The fair value amount disclosed above of $2,565 per share is the estimated fair value as of December 30, 2015, based on a third-party appraisal.
10. COMMITMENTS AND CONTINGENCIES
The Company leases certain facilities and equipment under various operating lease agreements with expiration dates through September 2017 and typically contain renewal options of 5-10 years. These agreements generally require the Company to pay rental amounts and operating expenses.
Rent expense was $0.2 million and $0.2 million for the period from January 1, 2015, to December 30, 2015, and the year ended December 31, 2014, respectively. Rent expense is included in selling, general, and administrative expenses in the statements of income.
Minimum annual lease commitments under noncancelable leases are summarized as follows:
| Year Ended December 31 (In ‘000) |
Related Party |
All Other |
Total | |||||||||
| 2016 |
$ | 18 | $ | 151 | $ | 169 | ||||||
| 2017 |
— | 36 | 36 | |||||||||
| Thereafter |
— | — | — | |||||||||
|
|
|
|||||||||||
| $ | 205 | |||||||||||
|
|
|
|||||||||||
Beginning May 1, 2014, the Company entered into a month-to-month agreement to lease the remaining space in the building currently leased in Bloomington, Illinois. The monthly rent for this space is $2,000. The Company also leases transportation equipment and machinery on short-term leases from nonrelated parties.
The Company is involved in certain legal actions arising in the ordinary course of business. As of December 30, 2015, and December 31, 2014, there were no proceedings or litigation involving the Company that management believes would have a material adverse impact on its business, financial position, results of income, or cash flows.
11. SUBSEQUENT EVENTS
Management has performed an analysis of activities and transactions subsequent to December 30, 2015, to determine the need for any adjustments to or disclosures within these financial statements for the period from January 1, 2015, through December 30, 2015, and the year ended December 31, 2014. Management has performed their analysis through June 8, 2016, which was the date that the financial statements were issued and has determined that there are no subsequent events to disclose.
* * * * * *
F-165
Table of Contents
Materials
Combined Financial Statements as of
March 12, 2015, and December 31, 2014, and for the
Period from January 1, 2015, to March 12, 2015,
and the Year Ended December 31, 2014, and
Independent Auditors’ Report
F-166
Table of Contents
GREAT WESTERN BUILDING MATERIALS
| Page | ||||
| F-168-F-169 | ||||
| COMBINED FINANCIAL STATEMENTS AS OF MARCH 12, 2015, AND DECEMBER 31, 2014, AND FOR THE PERIOD FROM JANUARY 1, 2015, TO MARCH 12, 2015, AND THE YEAR ENDED DECEMBER 31, 2014: |
||||
| F-170 | ||||
| F-171 | ||||
| F-172 | ||||
| F-173 | ||||
| F-174-F-180 | ||||
F-167
Table of Contents
|
|
Deloitte & Touch LLP 695 Town Center Drive Suite 1200 Costa Mesa, CA 92626 USA
Tel: +1 714 436 7100 Fax: +1 714 436 7200 www.Deloitte.com |
Board of Directors
Great Western Building Materials
Tustin, California
We have audited the accompanying combined financial statements of Great Western Building Materials (the “Company”), which comprise the combined balance sheets as of March 12, 2015, and December 31, 2014, and the related combined statements of operations, member’s equity, and cash flows for the period from January 1, 2015, to March 12, 2015, and the year ended December 31, 2014, and the related notes to the combined financial statements.
Management’s Responsibility for the Combined Financial Statements
Management is responsible for the preparation and fair presentation of these combined financial statements in accordance with accounting principles generally accepted in the United States of America; this includes the design, implementation, and maintenance of internal control relevant to the preparation and fair presentation of combined financial statements that are free from material misstatement, whether due to fraud or error.
Auditors’ Responsibility
Our responsibility is to express an opinion on these combined financial statements based on our audits. We conducted our audits in accordance with auditing standards generally accepted in the United States of America. Those standards require that we plan and perform the audit to obtain reasonable assurance about whether the combined financial statements are free from material misstatement.
An audit involves performing procedures to obtain audit evidence about the amounts and disclosures in the combined financial statements. The procedures selected depend on the auditor’s judgment, including the assessment of the risks of material misstatement of the combined financial statements, whether due to fraud or error. In making those risk assessments, the auditor considers internal control relevant to the Company’s preparation and fair presentation of the combined financial statements in order to design audit procedures that are appropriate in the circumstances, but not for the purpose of expressing an opinion on the effectiveness of the Company’s internal control. Accordingly, we express no such opinion. An audit also includes evaluating the appropriateness of accounting policies used and the reasonableness of significant accounting estimates made by management, as well as evaluating the overall presentation of the combined financial statements.
We believe that the audit evidence we have obtained is sufficient and appropriate to provide a basis for our audit opinion.
F-168
Table of Contents
Opinion
In our opinion, the combined financial statements referred to above present fairly, in all material respects, the financial position of the Company as of March 12, 2015, and December 30, 2014, and the results of its operations and cash flows for the period from January 1, 2015, to March 12, 2015, and the year ended December 31, 2014, in accordance with accounting principles generally accepted in the United States of America.
/s/ Deloitte & Touche LLP
June 10, 2016
F-169
Table of Contents
GREAT WESTERN BUILDING MATERIALS
AS OF MARCH 12, 2015, AND DECEMBER 31, 2014
(In $000’s)
| March 12, 2015 |
December 31, 2014 |
|||||||
| ASSETS |
||||||||
| CURRENT ASSETS: |
||||||||
| Cash |
$ | 5,548 | $ | 5,684 | ||||
| Accounts receivable—net of allowance for doubtful accounts of $447 and $263 |
27,553 | 24,226 | ||||||
| Vendor rebates receivable |
2,095 | 3,487 | ||||||
| Inventories |
12,118 | 14,321 | ||||||
| Prepaids and other current assets |
440 | 902 | ||||||
|
|
|
|
|
|||||
| Total current assets |
47,754 | 48,620 | ||||||
| PROPERTY AND EQUIPMENT—Net |
4,281 | 4,514 | ||||||
|
|
|
|
|
|||||
| TOTAL ASSETS |
$ | 52,035 | $ | 53,134 | ||||
|
|
|
|
|
|||||
| LIABILITIES AND MEMBER’S EQUITY |
||||||||
| CURRENT LIABILITIES: |
||||||||
| Accounts payable |
$ | 8,753 | $ | 10,830 | ||||
| Accrued payroll and employee benefits |
4,008 | 1,330 | ||||||
| Accrued taxes |
1,233 | 1,107 | ||||||
| Accrued expenses |
5,785 | 509 | ||||||
| Other current liabilities |
590 | 188 | ||||||
| Line of credit |
9,335 | 6,097 | ||||||
| Current portion of notes payable |
840 | 599 | ||||||
|
|
|
|
|
|||||
| Total current liabilities |
30,544 | 20,660 | ||||||
| LONG-TERM PORTION OF NOTES PAYABLE, NET |
558 | 681 | ||||||
|
|
|
|
|
|||||
| Total liabilities |
31,102 | 21,341 | ||||||
|
|
|
|
|
|||||
| COMMITMENTS AND CONTINGENCIES (Note 8) |
||||||||
| TOTAL MEMBER’S EQUITY |
20,933 | 31,793 | ||||||
|
|
|
|
|
|||||
| TOTAL LIABILITIES AND MEMBER’S EQUITY |
$ | 52,035 | $ | 53,134 | ||||
|
|
|
|
|
|||||
F-170
Table of Contents
GREAT WESTERN BUILDING MATERIALS
COMBINED STATEMENTS OF OPERATIONS
FOR THE PERIOD FROM JANUARY 1, 2015, TO MARCH 12, 2015,
AND FOR THE YEAR ENDED DECEMBER 31, 2014
(In 000’s)
| For the Period from January 1, 2015, to March 12, 2015 |
For the Year Ended December 31, 2014 |
|||||||
| NET SALES |
$ | 32,474 | $ | 166,169 | ||||
| COST OF GOODS SOLD |
24,078 | 119,543 | ||||||
|
|
|
|
|
|||||
| GROSS PROFIT |
8,396 | 46,626 | ||||||
|
|
|
|
|
|||||
| OPERATING EXPENSES: |
||||||||
| Selling, general, and administrative expenses |
13,645 | 38,598 | ||||||
| Depreciation expense |
233 | 1,013 | ||||||
|
|
|
|
|
|||||
| Total operating expenses |
13,878 | 39,611 | ||||||
|
|
|
|
|
|||||
| OPERATING (LOSS) INCOME |
(5,482 | ) | 7,015 | |||||
| INTEREST EXPENSE—Net |
120 | 549 | ||||||
|
|
|
|
|
|||||
| NET (LOSS) INCOME |
$ | (5,602 | ) | $ | 6,466 | |||
|
|
|
|
|
|||||
See accompanying notes to combined financial statements.
F-171
Table of Contents
GREAT WESTERN BUILDING MATERIALS
COMBINED STATEMENTS OF MEMBER’S EQUITY
FOR THE PERIOD FROM JANUARY 1, 2015, TO MARCH 12, 2015, AND FOR THE YEAR ENDED DECEMBER 31, 2014
(In $000’s)
| Total Member’s Equity |
||||
| BALANCE—At January 1, 2014 |
$ | 27,907 | ||
| Net income |
6,466 | |||
| Capital contributions |
479 | |||
| Distributions |
(3,059 | ) | ||
|
|
|
|||
| BALANCE—At December 31, 2014 |
31,793 | |||
| Net loss |
(5,602 | ) | ||
| Distributions |
(5,258 | ) | ||
|
|
|
|||
| BALANCE—At March 12, 2015 |
$ | 20,933 | ||
|
|
|
|||
See accompanying notes to combined financial statements.
F-172
Table of Contents
GREAT WESTERN BUILDING MATERIALS
COMBINED STATEMENTS OF CASH FLOWS
FOR THE PERIOD FROM JANUARY 1, 2015 TO MARCH 12, 2015,
AND FOR THE YEAR ENDED DECEMBER 31, 2014
(In 000’s)
| For the Period from January 1, 2015 to March 12, 2015 |
For the Year Ended December 31, 2014 |
|||||||
| CASH FLOWS FROM OPERATING ACTIVITIES: |
||||||||
| Net (loss) income |
$ | (5,602 | ) | $ | 6,466 | |||
| Adjustments to reconcile net income to net cash provided by operating activities: |
||||||||
| Depreciation |
233 | 1,013 | ||||||
| Bad debt expense |
152 | 255 | ||||||
| Changes in assets and liabilities: |
||||||||
| Accounts receivable |
(3,478 | ) | (4,555 | ) | ||||
| Vendor rebates receivable |
1,392 | (1,706 | ) | |||||
| Inventories |
2,203 | (3,171 | ) | |||||
| Prepaid expenses and other current assets |
462 | 255 | ||||||
| Accounts payable |
(2,078 | ) | 1,549 | |||||
| Accrued payroll and employee benefits |
2,678 | 334 | ||||||
| Accrued taxes |
126 | 272 | ||||||
| Accrued expenses |
5,276 | 245 | ||||||
| Other current liabilities |
401 | 175 | ||||||
|
|
|
|
|
|||||
| Net cash provided by operating activities |
1,765 | 1,132 | ||||||
|
|
|
|
|
|||||
| CASH FLOWS FROM INVESTING ACTIVITIES— |
||||||||
| Capital expenditures |
— | (1,712 | ) | |||||
|
|
|
|
|
|||||
| Net cash used in investing activities |
— | (1,712 | ) | |||||
|
|
|
|
|
|||||
| CASH FLOWS FROM FINANCING ACTIVITIES: |
||||||||
| Proceeds from line of credit—net |
3,238 | 2,158 | ||||||
| Proceeds from notes payable |
356 | 1,501 | ||||||
| Repayment of notes payable |
(237 | ) | (1,026 | ) | ||||
| Capital contributions |
479 | |||||||
| Distributions |
(5,258 | ) | (3,059 | ) | ||||
|
|
|
|
|
|||||
| Net cash (used in) provided by financing activities |
(1,901 | ) | 53 | |||||
|
|
|
|
|
|||||
| NET DECREASE IN CASH |
(136 | ) | (527 | ) | ||||
| CASH—At beginning of period |
5,684 | 6,211 | ||||||
|
|
|
|
|
|||||
| CASH—At end of period |
$ | 5,548 | $ | 5,684 | ||||
|
|
|
|
|
|||||
| SUPPLEMENTAL DISCLOSURE OF CASH FLOW INFORMATION |
||||||||
| Cash paid during the period for interest |
$ | 120 | $ | 549 | ||||
|
|
|
|
|
|||||
See accompanying notes to combined financial statements.
F-173
Table of Contents
GREAT WESTERN BUILDING MATERIALS
NOTES TO COMBINED FINANCIAL STATEMENTS
AS OF MARCH 12, 2015, AND DECEMBER 31, 2014, AND FOR THE PERIOD
FROM JANUARY 1, 2015, TO MARCH 12, 2015, AND FOR THE YEAR ENDED DECEMBER 31, 2014
1. DESCRIPTION OF COMPANY AND BASIS OF PRESENTATION
Description of Company—Great Western Building Materials’ combined financial statements include the financial statements of:
Oxnard Building Materials, Inc. (Oxnard) (dba Great Western Building Materials);
Great Western Building Materials, Inc. (GWBM AZ); and
ProWall Building Products, Inc. (ProWall).
Great Western Building Materials is collectively referred to as the “Great Western Companies” or the “Companies”. The Companies are owned by different trusts with the same majority shareholder and executive management. The Companies operate as wholesalers and retailers engaged in the business of selling building materials to real estate developers and commercial and residential building contractors and subcontractors primarily in the states of California and Arizona. In addition, ProWall manufactures certain coatings and building materials and sells to builders and manufacturers.
Oxnard is a California corporation formed in August 1977, GWBM AZ is an Arizona corporation formed in September 1997, and ProWall is an Arizona corporation formed in March 1996.
Basis of Presentation—The Great Western Companies are entities under common control and management, and the financial statements have been combined as a single set of financial statements. All intercompany transactions between the Great Western Companies have been eliminated from the combined financial statements. The accompanying combined financial statements have been prepared in accordance with accounting principles generally accepted in the United States of America (GAAP).
On March 13, 2015, the assets and operations of the Company were acquired by Foundation Building Materials (FBM) for cash. The acquisition was accounted for by the acquisition method, and accordingly the results of operations will be included in the financial statements of FBM subsequent to the acquisition date.
Comprehensive Income—The Companies do not have any components of other comprehensive income recorded within the combined financial statements and, therefore, do not separately present a statement of comprehensive income in the combined financial statements.
2. SUMMARY OF SIGNIFICANT ACCOUNTING POLICIES
Use of Estimates—The preparation of financial statements in conformity with GAAP requires management to make estimates and assumptions that affect the amounts of assets and liabilities and disclosure of contingent assets and liabilities as of the date of the financial statements and the reported amounts of revenues and expenses during the reporting period. Actual results may differ from these estimates.
F-174
Table of Contents
GREAT WESTERN BUILDING MATERIALS
NOTES TO COMBINED FINANCIAL STATEMENTS—(Continued)
Cash—Cash includes deposits in financial institutions. The Companies have cash deposits held at major banks that at times may exceed federally insured limits. The Companies have not incurred losses related to any deposits in excess of the Federal Deposit Insurance Corporation insurance amount and believe no significant concentration of credit risk exists with respect to cash deposits.
Concentration of Risk—Financial instruments, which potentially subject the Companies to concentration of credit risk, consist principally of accounts receivable. The Companies’ accounts receivable are primarily from customers in the building industry located in the United States. Concentration of credit risk with respect to accounts receivable is limited due to the significant number of individual customers comprising the Companies’ customer base. The Companies perform customer credit evaluations; however, the Companies’ policies do not require collateral. At March 12, 2015, and December 31, 2014, the Companies had no significant concentrations of credit risk.
Liquidity and Credit Risk—The primary sources of liquidity and capital resources are cash provided from operating activities and other borrowings. The primary requirements for liquidity and capital are to operate and fund current activities. The Companies believe that current cash balances and expected cash flow from operations are adequate to fund debt service requirements, operating lease obligations, capital expenditures, and working capital obligations for the next 12 months.
Accounts Receivable—The Companies sell to customers using credit terms customary in their industry. Accounts receivable are recorded at invoiced amounts and generally do not bear interest. The allowance for doubtful accounts reflects the Companies’ estimate of credit exposure, determined principally on the basis of collection experience, aging of receivables, and significant individual account credit risk.
Vendor Rebates Receivable—The Companies receive rebates from certain vendors based on inventory purchases. A receivable is recorded for these rebates when the amount of the rebate is reasonably estimable and collectible. Rebates received are initially recorded as a reduction of the cost of the inventory purchased and subsequently recognized through a reduction to cost of goods sold, when the related inventory is sold.
Inventories—Inventories, consisting substantially of finished goods, are valued at the lower of cost or market (net realizable value). Cost is determined using the moving weighted-average cost method. The Companies routinely evaluate inventory for excess or obsolescence and consider factors such as historical usage rates and present demand.
Property and Equipment—Property and equipment are stated at cost, less accumulated depreciation and amortization. Major additions and improvements are capitalized and depreciated; maintenance and repairs are charged to expense when incurred. Depreciation is computed using the straight-line method over the following estimated useful lives:
| Vehicles and equipment | 5—10 years | |
| Computers | 3—5 years | |
| Furniture and fixtures | 7 years | |
| Leasehold improvements | Lesser of useful life or lease term |
F-175
Table of Contents
GREAT WESTERN BUILDING MATERIALS
NOTES TO COMBINED FINANCIAL STATEMENTS—(Continued)
Impairment of Long-Lived Assets—The Companies review property and equipment for impairment when events or circumstances indicate these assets may not be recoverable. Factors considered include significant underperformance relative to expected historical or projected future operating results, significant changes in the manner of use of the acquired assets or the strategy for the overall business, and significant negative industry or economic trends. In performing the review for recoverability, future cash flows expected to result from the use of the asset and its eventual disposition are estimated. If the sum of expected future undiscounted cash flows is less than the carrying amount of the asset, an impairment loss is recorded using the discounted cash flow method as a basis for determining the fair value of the asset. As of March 12, 2015, and December 31, 2014, there were no impairments.
Accrued Expenses – Accrued expenses are primarily comprised of accrued purchases and accrued vehicle licenses expense.
Revenue Recognition—The criteria for recognition of revenue are met when persuasive evidence that an arrangement exists and both title and risk of loss have passed to the customer, the price is fixed or determinable, and collectability is reasonably assured.
All revenues recognized are net of sales taxes collected and allowances for discounts. Sales taxes collected are subsequently remitted to the appropriate government authorities.
Cost of Goods Sold—Cost of goods sold includes the cost of merchandise, inbound and outbound freight, inventory provisions, warehousing costs, vendor discounts and vendor rebates.
Income Taxes—The Companies have elected to be treated as S corporations under provisions of the Internal Revenue Code (IRC), and as such did not pay federal corporate income taxes on taxable income. In lieu of corporate income taxes, the shareholders of S corporations are taxed on their proportionate share of the Companies’ taxable income. Given the structure of the Companies as pass-through entities and the nature of the operations of the Companies, there were no significant deferred tax assets or liabilities.
Fair Value of Financial Instruments—Fair value is defined as the price that would be received to sell an asset or price paid to transfer a liability in an orderly transaction between market participants at the measurement date. Authoritative guidance for fair value measurements establishes a hierarchy that prioritizes the inputs to valuation models based upon the degree to which they are observable. The three levels of the fair value measurement hierarchy are as follows:
Level 1: Inputs represent quoted prices in active markets for identical assets or liabilities at the measurement date.
Level 2: Inputs (other than quoted prices included in Level 1) that are either directly or indirectly observable for the asset or liability through correlation with market data at the measurement date for the duration of the instrument’s anticipated life.
Level 3: Inputs are unobservable and therefore reflect management’s best estimate of the assumptions that market participants would use in pricing the asset or liability.
F-176
Table of Contents
GREAT WESTERN BUILDING MATERIALS
NOTES TO COMBINED FINANCIAL STATEMENTS—(Continued)
The Companies estimate the fair value of assets and liabilities, which qualify as financial instruments, and include this additional information in the notes to the combined financial statements when the fair value is different from the carrying value of these instruments. The estimated fair value of cash, accounts receivable, prepaid expenses, accounts payable, accrued expenses and the line of credit approximate their carrying amounts due to the relatively short maturity of these instruments. The fair value of notes payable is determined by Level 2 inputs, using applicable rates for similar instruments and collateral as of the balance sheet date and approximates $1.4 million and $1.3 million as of March 12, 2015 and December 31, 2014, respectively.
Recently Issued Accounting Guidance—In May 2014, the Financial Accounting Standards Board (FASB) issued Accounting Standards Update (ASU) No. 2014-09, Revenue from Contracts with Customers. ASU No. 2014-09 amends the guidance for revenue recognition to replace numerous, industry-specific requirements. The core principle of the ASU is that an entity should recognize revenue for the transfer of goods or services equal to the amount that it expects to be entitled to receive for those goods or services. The ASU implements a five-step process for customer contract revenue recognition that focuses on transfer of control, as opposed to transfer of risk and rewards. The amendment also requires enhanced disclosures regarding the nature, amount, timing, and uncertainty of revenues and cash flows arising from contracts with customers. On August 8, 2015, the FASB issued ASU No. 2015-14, Revenue from Contracts with Customers, which defers the effective date of ASU No. 2014-09 by one year. The standard is effective for nonpublic entities for annual and interim periods beginning after December 15, 2018. Entities can transition to the standard either retrospectively to each period presented or as a cumulative-effect adjustment as of the date of adoption. The Companies are currently assessing the impact the adoption of ASU No. 2014-09 will have on the combined financial statements.
In August 2014, the FASB issued ASU No. 2014-15, Presentation of Financial Statements—Going Concern (Subtopic 205-40): Disclosures of Uncertainties about an Entity’s Ability to Continue as a Going Concern. ASU No. 2014-15 requires management to evaluate whether there are conditions or events that raise substantial doubt about the entity’s ability to continue as a going concern within one year after the date that the financial statements are issued or are available to be issued. This ASU also requires management to disclose certain information depending on the results of the going concern evaluation. The provisions of this ASU are effective for annual periods ending after December 15, 2016, including interim reporting periods therein. The Companies are currently evaluating the impact of this accounting guidance and do not expect any significant impact on the combined financial statements.
In July 2015, the FASB issued ASU No. 2015-11, Simplifying the Measurement of Inventory, which applies to inventory valued at first in, first out or average cost. ASU No. 2015-11 requires inventory to be measured at the lower of cost and net realizable value, rather than at the lower of cost or market. ASU No. 2015-11 is effective on a prospective basis for annual periods, including interim reporting periods within those periods, beginning after December 15, 2016. The Companies report inventory on an average-cost basis and thus will be required to adopt the standard; however, the provisions of ASU No. 2015-11 are not expected to have a material effect on the Companies’ financial condition.
In September 2015, the FASB issued ASU No. 2015-16, Business Combinations (Topic 805): Simplifying the Accounting for Measurement-Period Adjustments. ASU No. 2015-16 eliminates
F-177
Table of Contents
GREAT WESTERN BUILDING MATERIALS
NOTES TO COMBINED FINANCIAL STATEMENTS—(Continued)
the requirement to restate prior period financial statements for measurement-period adjustments. The new guidance requires that the cumulative impact of a measurement-period adjustment (including the impact on prior periods) be recognized in the reporting period in which the adjustment is identified. In addition, separate presentation on the face of the income statement or disclosure in the notes is required regarding the portion of the adjustment recorded in the current period earnings, by line item, which would have been recorded in previous reporting periods if the adjustment to the provisional amounts had been recognized as of the acquisition date. ASU No. 2015-16 is to be applied prospectively for measurement-period adjustments that occur after the effective date. ASU No. 2015-16 is effective for annual reporting periods, including interim reporting periods within those periods, beginning after December 15, 2015, and early adoption is permitted. The Companies are currently evaluating the impact of this guidance on the combined financial statements.
In February 2016, the FASB issued ASU No. 2016-02, Leases. ASU No. 2016-02 establishes a right-of-use model that requires a lessee to record a right-of-use asset and a lease liability on the balance sheets for all leases with terms longer than 12 months. Leases will be classified as either “finance” or “operating,” with classification affecting the pattern of expense recognition in the income statement. This update requires a modified retrospective transition as of the beginning of the earliest comparative period presented in the financial statements. This update is effective for fiscal years beginning after December 15, 2019, including interim periods within those fiscal years, with early adoption permitted. The Companies are currently evaluating the impact of this guidance on the combined financial statements.
3. PROPERTY AND EQUIPMENT
Property and equipment as of March 12, 2015, and December 31, 2014, consist of the following (in thousands):
| March 12, 2015 |
December 31, 2014 |
|||||||
| Vehicles and equipment |
$ | 9,469 | $ | 9,469 | ||||
| Computers |
36 | 36 | ||||||
| Furniture and fixtures |
131 | 131 | ||||||
| Leasehold improvements |
298 | 298 | ||||||
|
|
|
|
|
|||||
| Property and equipment, gross |
9,934 | 9,934 | ||||||
| Less accumulated depreciation |
(5,653 | ) | (5,420 | ) | ||||
|
|
|
|
|
|||||
| Property and equipment—net |
$ | 4,281 | $ | 4,514 | ||||
|
|
|
|
|
|||||
Depreciation expense for property and equipment was $0.2 million and $1.0 million for the period from January 1, 2015, to March 12, 2015, and for the year ended December 31, 2014, respectively.
4. LINES OF CREDIT
Marquette Business Credit Corporation (“Marquette”) line of credit:
Oxnard has a line of credit agreement with a maximum limit of $14.0 million. Oxnard may borrow up to 80% of the face amount of eligible accounts receivable due from customers, plus
F-178
Table of Contents
GREAT WESTERN BUILDING MATERIALS
NOTES TO COMBINED FINANCIAL STATEMENTS—(Continued)
the lesser of: A) 50% of the cost of eligible inventory or B) $2.5 million, less any reserves the lender deems appropriate. Oxnard is subject to various financial covenants. Interest on this line is payable at a base rate, plus 1.75%, per annum. The Marquette interest rate was 5.00% at both March 12, 2015 and December 31, 2014. The base rate is defined by Marquette as equal to the higher of (i) the prime rate in effect, or (ii) the adjusted London InterBank Offered Rate, plus 2.00% as determined by Marquette. At March 12, 2015, and December 31, 2014, Oxnard had outstanding balances on this line of credit of $9.2 million and $6.0 million, respectively. The amount available on the line of credit at March 12, 2015, and December 31, 2014, was $4.8 million and $8.0 million, respectively. This line had a maturity date of April 13, 2016, and was collateralized by security interest in substantially all of the assets of Oxnard. The line was paid in full as of the acquisition date discussed in Note 1.
City National Bank line of credit:
Oxnard has an equipment line of credit with City National Bank with a maximum borrowing limit of $1,000,000. Interest on this line is payable at 3.00% per annum. At both March 12, 2015 and December 31, 2014, Oxnard had an outstanding balance on this line of credit of $0.1 million. This line matures on September 1, 2016, and is collateralized by security interest in all of the assets purchased through the line of credit. The outstanding principal balance will be payable in 36 equal monthly installments in the amount of one 36 of the principal balance outstanding at September 12, 2015. The amount available under this line was $0.9 million at both March 12, 2015 and December 31, 2014, respectively. The line was paid in full as of the acquisition date discussed in Note 1.
5. NOTES PAYABLE
The Companies had certain notes payable with third-party and related-party lenders at March 31, 2015 and December 31, 2014. The balances outstanding at March 12, 2015 and December 31, 2014 were $1.4 million and $1.3 million, respectively. See Note 6 for discussion of related-party notes payable. The notes were paid in full as of the acquisition date as discussed in Note 1.
6. RELATED PARTIES
The Companies lease three facilities from affiliates of the Companies’ founder and majority shareholder. Rent expense for these three facilities is approximately $0.7 million annually and the current leases end in 2020 and include option periods that can extend the leases into 2025.
The Companies have certain notes payable with affiliates of the Companies’ founder and majority shareholder. These notes payable finance equipment purchases and were zero and $0.9 million at March 12, 2015, and December 31, 2014, respectively.
7. RETIREMENT PLANS
The Companies have multiple retirement savings plans for all eligible full-time and hourly employees under Section 401(k) of the IRC. The plans allow participants to contribute a portion of their earnings to the plans. The plans allow the Companies, at their discretion, to match a certain percentage of the employees’ contributions, limited to a certain percentage of eligible
F-179
Table of Contents
GREAT WESTERN BUILDING MATERIALS
NOTES TO COMBINED FINANCIAL STATEMENTS—(Continued)
compensation. There were contributions of zero and $0.04 million to the plans for the period from January 1, 2015, to March 12, 2015, and for the year ended December 31, 2014, respectively.
8. COMMITMENTS AND CONTINGENCIES
Leases—The Companies lease certain facilities and equipment under various operating lease agreements with expiration dates through March 2020 and typically contain renewal options of five years. These agreements generally require the Companies to pay rental amounts and operating expenses.
Rent expense was $0.6 million and $2.5 million for the period from January 1, 2015, to March 12, 2015, and for the year ended December 31, 2014, respectively.
Minimum annual lease commitments under noncancelable leases are summarized as follows (in thousands):
| Year Ending December 31, |
Related Party |
All Other |
Total | |||||||||
| 2015 |
$ | 725 | $ | 1,578 | $ | 2,303 | ||||||
| 2016 |
747 | 1,604 | 2,351 | |||||||||
| 2017 |
770 | 1,305 | 2,075 | |||||||||
| 2018 |
791 | 1,002 | 1,793 | |||||||||
| 2019 |
809 | 227 | 1,036 | |||||||||
| Thereafter |
207 | 27 | 234 | |||||||||
|
|
|
|
|
|
|
|||||||
| $ | 4,049 | $ | 5,743 | $ | 9,792 | |||||||
|
|
|
|
|
|
|
|||||||
Litigation—The Companies are involved in certain legal actions arising in the ordinary course of business. As of March 12, 2015 and December 31, 2014, there were no proceedings or litigation involving the Companies that management believes would have a material adverse impact on their business, financial position, results of operations, or cash flows.
9. SUBSEQUENT EVENTS
Management has performed an analysis of activities and transactions subsequent to March 12, 2015, to determine the need for any adjustments to or disclosures within these combined financial statements for the period from January 1, 2015, to March 12, 2015, and for the year ended December 31, 2014. Management has performed their analysis through June 10, 2016, which was the date that the combined financial statements were issued and has determined that there are no subsequent events to disclose.
* * * * * *
F-180
Table of Contents
Abbreviated Financial Statement
Statement of Revenues and Direct Expenses
For the Period from January 1, 2014 through December 5, 2014, and
Independent Auditors’ Report
F-181
Table of Contents
BAV, INC.
| Page | ||||
| F-183 | ||||
| ABBREVIATED FINANCIAL STATEMENT FOR THE PERIOD FROM JANUARY 1, 2014 THROUGH DECEMBER 5, 2014 |
||||
| F-184 | ||||
| F-185-F-187 | ||||
F-182
Table of Contents
To the Board of Directors of
LSF9 Cypress Holdings LLC
We have audited the accompanying statement of revenues and direct expenses of BAV, Inc. (the “Company”) for the period from January 1, 2014 through December 5, 2014, and the related notes (the “financial statement”).
Management’s Responsibility for the Financial Statement
Management is responsible for the preparation and fair presentation of this financial statement in accordance with accounting principles generally accepted in the United States of America; this includes the design, implementation, and maintenance of internal control relevant to the preparation and fair presentation of the financial statement that is free from material misstatement, whether due to fraud or error.
Auditors’ Responsibility
Our responsibility is to express an opinion on the financial statement based on our audit. We conducted our audit in accordance with auditing standards generally accepted in the United States of America. Those standards require that we plan and perform the audit to obtain reasonable assurance about whether the financial statement is free from material misstatement.
An audit involves performing procedures to obtain audit evidence about the amounts and disclosures in the financial statement. The procedures selected depend on the auditor’s judgment, including the assessment of the risks of material misstatement of the financial statement, whether due to fraud or error. In making those risk assessments, the auditor considers internal control relevant to the Company’s preparation and fair presentation of the financial statement in order to design audit procedures that are appropriate in the circumstances, but not for the purpose of expressing an opinion on the effectiveness of the Company’s internal control. Accordingly, we express no such opinion. An audit also includes evaluating the appropriateness of accounting policies used and the reasonableness of significant accounting estimates made by management, as well as evaluating the overall presentation of the financial statement.
We believe that the audit evidence we have obtained is sufficient and appropriate to provide a basis for our audit opinion.
Opinion
In our opinion, the financial statement referred to above presents fairly, in all material respects, the statement of revenues and direct expenses of BAV, Inc. for the period from January 1, 2014 through December 5, 2014, in accordance with accounting principles generally accepted in the United States of America.
Emphasis of Matter
As discussed in Note 1 to the financial statement, the Company has prepared an abbreviated financial statement as it is impracticable for the Company to prepare full financial statements in accordance with the Securities and Exchange Commission (SEC) Rule 3-05 of Regulation S-X. Our opinion is not modified with respect to this matter.
/s/ DELOITTE & TOUCHE LLP
November 4, 2016
Costa Mesa, CA
F-183
Table of Contents
BAV, INC.
STATEMENT OF REVENUES AND DIRECT EXPENSES
FOR THE PERIOD FROM JANUARY 1, 2014 THROUGH DECEMBER 5, 2014
(In 000’s)
| Revenues, net |
$ | 30,622 | ||
| Cost of goods sold, exclusive of depreciation |
24,298 | |||
|
|
|
|||
| Gross profit |
6,324 | |||
| Operating expenses: |
||||
| Selling, general and administrative expenses |
4,590 | |||
| Depreciation |
116 | |||
|
|
|
|||
| Total operating expenses |
4,706 | |||
| Excess of revenues over direct operating expenses |
$ | 1,618 | ||
|
|
|
See accompanying notes to the abbreviated financial statement.
F-184
Table of Contents
BAV, INC.
NOTES TO THE ABBREVIATED FINANCIAL STATEMENT
FOR THE PERIOD FROM JANUARY 1, 2014 THROUGH DECEMBER 5, 2014
1. DESCRIPTION OF COMPANY AND BASIS OF PRESENTATION
Description of Company—BAV, Inc. (BAV or the “Company”) was formed in Texas on September 7, 1976. The Company is engaged in the wholesale and retail distribution of wallboard, metal framing, suspended ceiling systems, and other products to commercial and residential contractors.
Basis of Presentation—The statement of revenues and direct expenses of the Company for the period from January 1, 2014 through December 5, 2014 has been prepared in accordance with accounting principles generally accepted in the United States of America (GAAP).
The statement of revenues and certain expenses includes the net revenues and direct operating expenses directly attributable to the generation of those revenues. The statement of revenues and direct expenses excludes the cost of general corporate activities, corporate level overhead and income taxes.
Therefore, the abbreviated statement of revenues and direct operating expenses is not intended to be a complete presentation of the results of operations of the business going forward due to changes in the business and the omission of various operating expenses. It is impracticable to prepare full financial statements in accordance with SEC Rule 3-05 of Regulation S-X as the Company has not maintained the distinct and separate accounts necessary to present full financial statements and historical full financial statements have not been prepared. As such, the historical combined abbreviated statement of revenues and direct operating expenses of the Company is presented in lieu of full financial statements.
On December 5, 2014, the assets and operations of the Company were acquired by FBM Intermediate Holding, LLC (FBM) for cash. The acquisition was accounted for by the acquisition method and, accordingly, the results of operations have been included in the financial statements of FBM for the period subsequent to the acquisition date.
2. SUMMARY OF SIGNIFICANT ACCOUNTING POLICIES
Use of Estimates—The preparation of the financial statement in conformity with GAAP requires management to make estimates and assumptions that affect the amounts of assets and liabilities and disclosure of contingent assets and liabilities as of the date of the abbreviated financial statement and the reported amounts of revenues and expenses during the reporting period. On an ongoing basis, management evaluates its estimates, including those related to revenue recognition, inventory obsolescence, bad debt expense, and impairment of long lived assets. Actual results may differ from these estimates.
Revenue Recognition—The criteria for recognition of revenue are met when persuasive evidence that an arrangement exists and both title and risk of loss have passed to the customer, the price is fixed or determinable, and collectability is reasonably assured. This criteria is met and revenue is recognized when goods are delivered to the customer.
All revenues recognized are net of sales taxes collected, estimated returns and allowances for discounts. Sales taxes collected are subsequently remitted to the appropriate government authorities.
F-185
Table of Contents
BAV, INC.
NOTES TO THE ABBREVIATED FINANCIAL STATEMENT
FOR THE PERIOD FROM JANUARY 1, 2014 THROUGH DECEMBER 5, 2014
Cost of Goods Sold—Cost of goods sold includes the cost of merchandise determined on an average basis, freight, inventory provisions, vendor discounts, and vendor rebates.
Operating Expenses—Operating expenses include selling, general and administrative expenses, and depreciation. Selling, general and administrative expenses are comprised primarily of employee compensation and benefits, warehousing costs, travel, advertising, marketing and facilities costs.
Depreciation of property and equipment, and leasehold improvements for the period is $0.1 million and is computed using the straight-line method on the historical cost basis of the asset for financial reporting purposes over the following useful lives:
| Years | ||
| Leasehold Improvements |
Shorter of asset life or over life of lease | |
| Machinery and equipment |
3—7 | |
| Vehicles |
3—7 | |
| Office furniture and fixtures |
7 |
3. COMMITMENTS AND CONTINGENCIES
The Company has leased two facilities from shareholders in 2014 and equipment under various operating lease agreements expiring through 2016. Rent expense associated with the leased facilities was $0.2 million for the period from January 1, 2014 through December 5, 2014. The lease agreements generally require the Company to pay monthly rent and certain common area maintenance expenses.
Rent expense was $0.2 million for the period from January 1, 2014 through December 5, 2014 and is included in selling, general, and administrative expenses in the statement of revenues and direct operating expenses.
Minimum annual lease commitments under non-cancelable leases are summarized as follows:
| (in ‘000’s) |
Related Party |
Third Party |
Total | |||||||||
| 2015 |
$ | 215 | $ | 38 | $ | 253 | ||||||
| 2016 |
99 | 20 | 119 | |||||||||
| Thereafter |
— | — | — | |||||||||
|
|
|
|
|
|
|
|||||||
| $ | 314 | $ | 58 | $ | 372 | |||||||
|
|
|
|
|
|
|
|||||||
The Company is involved in certain legal actions arising in the ordinary course of business. As of December 5, 2014, there were no proceedings or litigation involving the Company that management believes would have a material adverse impact on its business and results of operations.
F-186
Table of Contents
BAV, INC.
NOTES TO THE ABBREVIATED FINANCIAL STATEMENT
FOR THE PERIOD FROM JANUARY 1, 2014 THROUGH DECEMBER 5, 2014
4. SUBSEQUENT EVENTS
Management has performed an analysis of activities and transactions subsequent to December 5, 2014, to determine the need for any adjustments to or disclosures within this financial statement for the period from January 1, 2014 through December 5, 2014. Management has performed their analysis through November 4, 2016, which was the date that this financial statement was issued and has determined that there are no subsequent events to disclose.
F-187
Table of Contents
(A business of CDM Investment Group, Inc.)
Combined Abbreviated Financial Statement
Statement of Revenues and Direct Expenses
For the Period from January 1, 2014 through May 30, 2014, and
Independent Auditor’s Report
F-188
Table of Contents
Wagner
(A business of CDM Investment Group, Inc.)
| Page | ||||
| F-190 | ||||
| COMBINED ABBREVIATED FINANCIAL STATEMENT FOR THE PERIOD FROM JANUARY 1, 2014 THROUGH MAY 30, 2014: |
||||
| Combined Abbreviated Statement of Revenues and Direct Expenses |
F-191 | |||
| F-192-F-194 | ||||
F-189
Table of Contents
Board of Directors
LSF9 Cypress Holdings LLC
Tustin, California
Report on the Financial Statements
We have audited the accompanying combined abbreviated financial statement of Millard Drywall Services, Inc., Lincoln Drywall Services, Inc., Wagner Interior Supply of Manhattan, Inc., Wagner Distribution of Kansas City, Inc., Wagner Distribution of Springfield, Inc., Wagner Distribution of Wichita, Inc., and Wagner Distribution of Denver, Inc. (Wagner or the Company), which comprise the combined abbreviated statement of revenues and direct expenses for the period of January 1, 2014 through May 30, 2014, and the related notes to the combined abbreviated financial statement (collectively, the financial statement).
Management’s Responsibility for the Financial Statements
Management is responsible for the preparation and fair presentation of the financial statement in accordance with accounting principles generally accepted in the United States of America; this includes the design, implementation and maintenance of internal control relevant to the preparation and fair presentation of financial statements that are free from material misstatement, whether due to fraud or error.
Auditor’s Responsibility
Our responsibility is to express an opinion on the financial statement based on our audit. We conducted our audit in accordance with auditing standards generally accepted in the United States of America. Those standards require that we plan and perform the audit to obtain reasonable assurance about whether the financial statement is free from material misstatement.
An audit involves performing procedures to obtain audit evidence about the amounts and disclosures in the financial statement. The procedures selected depend on the auditor’s judgment, including the assessment of the risks of material misstatement of the financial statement, whether due to fraud or error. In making those risk assessments, the auditor considers internal control relevant to the entity’s preparation and fair presentation of the financial statement in order to design audit procedures that are appropriate in the circumstances, but not for the purpose of expressing an opinion on the effectiveness of the entity’s internal control. Accordingly, we express no such opinion. An audit also includes evaluating the appropriateness of accounting policies used and the reasonableness of significant accounting estimates made by management, as well as evaluating the overall presentation of the financial statement.
We believe that the audit evidence we have obtained is sufficient and appropriate to provide a basis for our audit opinion.
Opinion
In our opinion, the financial statement referred to above presents fairly, in all material respects, the excess of revenues over direct expenses of the Company for the period January 1, 2014 through May 30, 2014, in accordance with accounting principles generally accepted in the United States of America.
/s/ RSM US LLP
Omaha, Nebraska
November 2, 2016
F-190
Table of Contents
WAGNER
(A BUSINESS OF CDM INVESTMENT GROUP, INC.)
COMBINED STATEMENT OF REVENUES AND DIRECT EXPENSES
FOR THE PERIOD FROM JANUARY 1, 2014 THROUGH MAY 30, 2014
(In 000’s)
| Revenues, net |
$ | 35,588 | ||
| Cost of goods sold, exclusive of depreciation |
25,909 | |||
|
|
|
|||
| Gross profit |
9,679 | |||
| Operating expenses: |
||||
| Selling, general and administrative expenses |
6,963 | |||
| Depreciation |
511 | |||
|
|
|
|||
| Total operating expenses |
7,474 | |||
|
|
|
|||
| Excess of revenues over direct operating expenses |
$ | 2,205 | ||
|
|
|
|||
See accompanying notes to the combined abbreviated financial statement.
F-191
Table of Contents
WAGNER
(A BUSINESS OF CDM INVESTMENT GROUP, INC.)
NOTES TO THE COMBINED ABBREVIATED FINANCIAL STATEMENT
FOR THE PERIOD FROM JANUARY 1, 2014 THROUGH MAY 30, 2014
1. DESCRIPTION OF COMPANY AND BASIS OF PRESENTATION
Description of Company—Millard Drywall Services, Inc., Lincoln Drywall Services, Inc., Wagner Interior Supply of Manhattan, Inc., Wagner Distribution of Kansas City, Inc., Wagner Distribution of Springfield, Inc., Wagner Distribution of Wichita, Inc. and Wagner Distribution of Denver, Inc. (collectively referred to as “Wagner” or the Company), a business of CDM Investment Group, Inc. (CDM), is engaged in the wholesale and retail distribution of wallboard, metal framing, suspended ceiling systems, and other products to commercial and residential contractors. The Company operates in Colorado, Kansas, Missouri and Nebraska.
Basis of Presentation—The combined abbreviated statement of revenues and direct operating expenses of the Company for the period from January 1, 2014 through May 30, 2014 was derived from the historical accounting records maintained by CDM and has been prepared in accordance with accounting principles generally accepted in the United States of America (GAAP). The combined abbreviated statement of revenues and direct operating expenses are not intended to be a complete presentation of the results of operations as if the Company business had operated as a stand-alone entity during the period presented and are not necessarily indicative of the results of operations that would have been achieved if the Company had operated as a separate, stand-alone entity for the period presented nor are they necessarily indicative of results of operations to be expected in the future due to changes in the business and the omission of certain operating expenses as described below. All costs directly associated with producing revenues including, but not limited to, all related personnel costs in the amount of approximately $3.85 million, cost of sales in the amount of approximately $25.91 million and other selling, general and administrative costs in the amount of $3.62 million from January 1, 2014 through May 30, 2014 have been included in this combined abbreviated financial statement. Overhead allocation from CDM related to corporate function and other areas shared by the Company business such as interest and corporate income taxes are omitted as they are not directly related to the Company’s revenue. It is impracticable to prepare full financial statements in accordance with the Security Exchange Commission’s (SEC) Rule 3-05 of Regulation S-X as the Company has not been accounted for as a separate entity and historical full financial statements have not been prepared. As such, the historical combined abbreviated statement of revenues and direct operating expenses of the Company is presented in lieu of the full financial statements.
On May 30, 2014, FBM Intermediate Holdings, LLC (FBM) acquired from CDM substantially all of the assets of its distribution division that related to the sale and delivery of metal framing, wallboard, and other products and the related accounts payable of Wagner for cash (FMB acquisition). The acquisition was accounted for by the acquisition method and, accordingly, the results of operations will be included in the financial statement of FBM subsequent to the acquisition date.
2. SUMMARY OF SIGNIFICANT ACCOUNTING POLICIES
Use of Estimates—The preparation of combined abbreviated financial statement in conformity with GAAP requires management to make estimates and assumptions that affect the amounts of revenues and expenses during the reporting period. On an ongoing basis, management evaluates its estimates, including those related to revenue recognition, inventory obsolescence, bad debt expenses, and impairment of long-lived assets. Actual results may differ from these estimates.
F-192
Table of Contents
WAGNER
(A BUSINESS OF CDM INVESTMENT GROUP, INC.)
NOTES TO THE COMBINED ABBREVIATED FINANCIAL STATEMENT—(Continued)
Principles of Combination—The accompanying combined abbreviated financial statement include the net revenues and direct operating expenses directly attributable to the generation of those revenues. The combined abbreviated statement of revenues and direct operating expenses exclude common cost allocations from CDM to the business of Wagner such as interest and corporate income taxes as they are not directly related to the Company’s revenue. Intercompany accounts and transactions are eliminated.
Revenue Recognition—The criteria for recognition of revenue are met when persuasive evidence that an arrangement exists and both title and risk of loss have passed to the customer, the price is fixed or determinable, and collectability is reasonably assured.
All revenues recognized are net of sales taxes collected, estimated returns and allowances for discounts. Sales taxes collected are subsequently remitted to the appropriate government authorities.
Cost of Goods Sold—Cost of goods sold includes the cost of merchandise determined on an average basis, freight, inventory provisions, vendor discounts, and vendor rebates.
Operating Expenses—Operating expenses include selling, general and administrative expenses, and depreciation. Selling, general and administrative expenses are comprised primarily of employee compensation and benefits, warehousing costs, travel, advertising, marketing and facilities costs.
Depreciation of property and equipment in the amount of $0.5 million as included in the selling, general and administrative expenses is computed using the straight-line method on the historical cost basis of the asset for financial reporting purposes over the following useful lives:
| Years | ||
| Building and Improvements |
10—39 | |
| Machinery and equipment |
3—5 | |
| Vehicles |
3—5 | |
| Office furniture and fixtures |
3—7 |
3. RELATED PARTIES
CDM sponsors an Employee Savings Plan, which is a defined contribution plan covering all of the Company’s employees who have completed one year of service, as defined by the Plan, and are age 21 or older, and Employee Stock Ownership Plan (ESOP), a defined contribution plan open to all nonunion employees of the Company who meet minimum age and length of service requirements. The Company recorded defined contribution expense related to these plans in the amount of approximately $18,000 from January 1, 2014 through May 30, 2014.
The Company’s employees participates in CDM’s equity incentive plans. The Company recorded approximately $57,000 of equity-based compensation expense from January 1, 2014 through May 30, 2014, reflecting CDM’s cost related to the Company’s employees.
The Company also has employees covered by collective bargaining agreements that cover various union employees. Under the terms of various union contracts, the Company is required
F-193
Table of Contents
WAGNER
(A BUSINESS OF CDM INVESTMENT GROUP, INC.)
NOTES TO THE COMBINED ABBREVIATED FINANCIAL STATEMENT—(Continued)
to contribute to various health and welfare and pension plans administered by direct unions, based on a defined amount per hour worked. Contributions to these plans totaled approximately $59,000 for January 1, 2014 through May 30, 2014.
4. COMMITMENTS AND CONTINGENCIES
The Company leases direct facilities and equipment under various operating lease agreements expiring through February 2015. These agreements generally require the Company to pay rental amounts and operating expenses.
Rent expense was approximately $0.4 million for the period from January 1, 2014 through May 30, 2014 and is included in selling, general, and administrative expenses in the statement of revenues and direct expenses.
Minimum annual lease commitments under noncancelable leases are summarized as follows:
| (in 000’s) |
Total | |||
| Fiscal 2015 |
$ | 908,396 | ||
| Fiscal 2016 |
90,562 | |||
| Thereafter |
— | |||
|
|
|
|||
| $ | 998,958 | |||
|
|
|
|||
The Company is involved in certain legal actions arising in the ordinary course of business. As of May 30, 2014, there were no proceedings or litigation involving the Company that management believes would have a material adverse impact on its business and results of operations.
5. SUBSEQUENT EVENTS
Management has performed an analysis of activities and transactions subsequent to May 30, 2014, to determine the need for any adjustments to or disclosures within this combined abbreviated financial statement for the period from January 1, 2014 through May 30, 2014. Management has performed their analysis through November 2, 2016, which was the date that the combined abbreviated financial statement was issued and has determined that there are no subsequent events to disclose.
F-194
Table of Contents
12,800,000 Shares
Foundation Building Materials, Inc.
Common Stock
PROSPECTUS
Deutsche Bank Securities
Barclays
RBC Capital Markets
Citigroup
Baird
Raymond James
Stephens Inc.
SunTrust Robinson Humphrey
William Blair
, 2017
Until , 2017 (25 days after the date of this prospectus), all dealers that buy, sell or trade shares of our common stock, whether or not participating in this offering, may be required to deliver a prospectus. This delivery requirement is in addition to the dealers’ obligation to deliver a prospectus when acting as an underwriter and with respect to their unsold allotments or subscriptions.
Table of Contents
PART II
INFORMATION NOT REQUIRED IN PROSPECTUS
Item 13. Other Expenses of Issuance and Distribution.
The following table shows the costs and expenses, other than underwriting discounts and commissions, payable in connection with the sale and distribution of the securities being registered. Except as otherwise noted, we will pay all of these amounts. All amounts except the SEC registration fee, the FINRA fee and the NYSE listing fee are estimated.
| SEC Registration Fee |
$ | 32,414.92 | ||
| FINRA Filing Fee |
42,452.00 | |||
| NYSE Listing Fee |
150,000.00 | |||
| Printing and Engraving Costs |
1,600,000.00 | |||
| Legal Fees and Expenses |
1,800,000.00 | |||
| Accounting Fees and Expenses |
$ | 900,000.00 | ||
| Transfer Agent and Registrar Fees and Expenses |
4,500.00 | |||
| Miscellaneous Expenses |
$ | 3,470,633.08 | ||
|
|
|
|||
| Total |
$ | 8,000,000.00 | ||
|
|
|
| * | To be provided by amendment. |
Item 14. Indemnification of Directors and Officers.
Our amended and restated certificate of incorporation will provide that, to the fullest extent permitted by the Delaware General Corporate Law, or the DGCL, no director shall be personally liable to our company or its stockholders for monetary damages for breach of fiduciary duty as a director. Our amended and restated bylaws will provide that each person who was or is party or is threatened to be made a party to, or was or is otherwise involved in, any threatened, pending or completed proceeding by reason of the fact that he or she is or was a director or officer of our company or was serving at the request of our company as a director, officer, employee, agent or trustee of another entity shall be indemnified and held harmless by us to the full extent authorized by the DGCL against all expense, liability and loss actually and reasonably incurred in connection therewith, subject to certain limitations.
Section 145(a) of the DGCL authorizes a corporation to indemnify any person who was or is a party, or is threatened to be made a party, to a threatened, pending or completed action, suit or proceeding, whether civil, criminal, administrative or investigative (other than an action by or in the right of the corporation), by reason of the fact that the person is or was a director, officer, employee or agent of the corporation, or is or was serving at the request of the corporation as a director, officer, employee or agent of another corporation, partnership, joint venture, trust or other enterprise, against expenses (including attorneys’ fees), judgments, fines and amounts paid in settlement actually and reasonably incurred by the person in connection with such action, suit or proceeding, if the person acted in good faith and in a manner the person reasonably believed to be in, or not opposed to, the best interests of the corporation and, with respect to any criminal action or proceeding, had no reasonable cause to believe the person’s conduct was unlawful.
Section 145(b) of the DGCL provides in relevant part that a corporation may indemnify any person who was or is a party or is threatened to be made a party to any threatened, pending or completed action or suit by or in the right of the corporation to procure a judgment in its favor by reason of the fact that the person is or was a director, officer, employee or agent of the
II-1
Table of Contents
corporation, or is or was serving at the request of the corporation as a director, officer, employee or agent of another corporation, partnership, joint venture, trust or other enterprise against expenses (including attorneys’ fees) actually and reasonably incurred by the person in connection with the defense or settlement of such action or suit if the person acted in good faith and in a manner the person reasonably believed to be in or not opposed to the best interests of the corporation and except that no indemnification shall be made in respect of any claim, issue or matter as to which such person shall have been adjudged to be liable to the corporation unless and only to the extent that the Court of Chancery or the court in which such action or suit was brought shall determine upon application that, despite the adjudication of liability but in view of all the circumstances of the case, such person is fairly and reasonably entitled to indemnity for such expenses which the Court of Chancery or such other court shall deem proper.
The DGCL also provides that indemnification under Sections 145(a) and (b) can only be made upon a determination that indemnification of the present or former director, officer or employee or agent is proper in the circumstances because such person has met the applicable standard of conduct set forth in Sections 145(a) and (b). Such determination shall be made, with respect to a person who is a director or officer at the time of such determination, (1) by a majority vote of directors who are not a party to the action at issue (even though less than a quorum), (2) by a majority vote of a designated committee of these directors (even though less than a quorum), (3) if there are no such directors, or these directors authorize, by the written opinion of independent legal counsel, or (4) by the stockholders.
Section 145(g) of the DGCL also empowers a corporation to purchase and maintain insurance on behalf of any person who is or was a director, officer, employee or agent of the corporation, or is or was serving at the request of the corporation as a director, officer, employee or agent of another corporation, partnership, joint venture, trust or other enterprise against any liability asserted against such person and incurred by such person in any such capacity, or arising out of such person’s status as such, whether or not the corporation would have the power to indemnify such person against such liability under Section 145 of the DGCL.
Section 102(b)(7) of the DGCL permits a corporation to provide for eliminating or limiting the personal liability of one of its directors for any monetary damages related to a breach of fiduciary duty as a director, as long as the corporation does not eliminate or limit the liability of a director for acts or omissions which (1) were in bad faith, (2) were the result of active and deliberate dishonesty and were material to the cause of action so adjudicated, (3) the director derived an improper personal benefit from (such as a financial profit or other advantage to which such director was not legally entitled) or (4) breached the director’s duty of loyalty.
We will enter into indemnification agreements with each of our executive officers and directors that provide, in general, that we will indemnify them to the fullest extent permitted by law in connection with their service to us or on our behalf.
The proposed form of Underwriting Agreement to be filed as Exhibit 1.1 to this Registration Statement will provide for indemnification of our directors and officers by the underwriters against certain liabilities.
Item 15. Recent Sale of Unregistered Securities.
We have not sold any securities, registered or otherwise, within the past three years, except for the common stock of the Company issued upon incorporation on October 27, 2016 to our sole stockholder, LSF9 Cypress Parent 2 LLC. The issuance of the common stock was exempt
II-2
Table of Contents
from the registration requirements of the Securities Act pursuant to Section 4(a)(2) thereof as a transaction by an issuer not involving any public offering.
Item 16. Exhibits and Financial Data Schedules.
(a) Exhibit Index
See the Exhibit Index following the signature page.
(b) Financial Statement Schedule
None. Financial statement schedules have been omitted because the information is included in our consolidated financial statements included elsewhere in this Registration Statement.
Item 17. Undertakings.
(a) The undersigned registrant hereby undertakes to provide to the underwriters at the closing specified in the underwriting agreements, certificates in such denominations and registered in such names as required by the underwriters to permit prompt delivery to each purchaser.
(b) Insofar as indemnification for liabilities arising under the Securities Act of 1933 may be permitted to directors, officers and controlling persons of the registrant pursuant to the foregoing provisions, or otherwise, the registrant has been advised that in the opinion of the Securities and Exchange Commission such indemnification is against public policy as expressed in the Act and is, therefore, unenforceable. In the event that a claim for indemnification against such liabilities (other than the payment by the registrant of expenses incurred or paid by a director, officer or controlling person of the registrant in the successful defense of any action, suit or proceeding) is asserted by such director, officer or controlling person in connection with the securities being registered, the registrant will, unless in the opinion of its counsel the matter has been settled by controlling precedent, submit to a court of appropriate jurisdiction the question whether such indemnification by it is against public policy as expressed in the Act and will be governed by the final adjudication of such issue.
(c) The undersigned registrant hereby undertakes that:
(i) For purposes of determining any liability under the Securities Act of 1933, the information omitted from the form of prospectus filed as part of this registration statement in reliance upon Rule 430A and contained in a form of prospectus filed by the registrant pursuant to Rule 424(b)(1) or (4) or 497(h) under the Securities Act of 1933 shall be deemed to be part of this registration statement as of the time it was declared effective.
(ii) For the purpose of determining any liability under the Securities Act of 1933, each post-effective amendment that contains a form of prospectus shall be deemed to be a new registration statement relating to the securities offered therein, and the offering of such securities at that time shall be deemed to be the initial bona fide offering thereof.
II-3
Table of Contents
SIGNATURES
Pursuant to the requirements of the Securities Act of 1933, as amended, the registrant has duly caused this registration statement to be signed on its behalf by the undersigned, thereunto duly authorized, in the city of Tustin, state of California, on February 3, 2017.
| Foundation Building Materials, Inc. | ||
| By: | /s/ Richard Tilley | |
| Name: Richard Tilley | ||
| Title: Vice President, Secretary and General Counsel | ||
Pursuant to the requirements of the Securities Act of 1933, as amended, the following persons have signed this Registration Statement in the capacities and on the date indicated.
| * Ruben Mendoza |
President and Chief Executive Officer (Principal Executive Officer) |
February 3, 2017 | ||
| * John Gorey |
Chief Financial Officer (Principal Financial Officer, Principal Accounting Officer) |
February 3, 2017 | ||
| * Kyle S. Volluz |
Director | February 3, 2017 | ||
| * | By: | /s/ Richard Tilley | ||
| Name: |
Richard Tilley | |||
| Title: |
Attorney - in -Fact |
II-4
Table of Contents
EXHIBIT INDEX
| Exhibit |
Description of Exhibit | |
| 1.1 | Form of Underwriting Agreement. | |
| 2.1**+ | Share Purchase Agreement, dated as of July 4, 2016, by and among Construction Products Acquisition, LLC, Superior Plus LP and Superior Plus U.S. Holdings Inc. | |
| 2.2**+ | First Amendment to Share Purchase Agreement, dated as of August 9, 2016, by and among Construction Products Acquisition, LLC, Superior Plus LP, and Superior Plus U.S. Holdings Inc. | |
| 3.1** | Amended and Restated Certificate of Incorporation of the Registrant to be adopted. | |
| 3.2** | Amended and Restated Bylaws of the Registrant to be adopted. | |
| 4.1** | Form of Registration Rights Agreement between Foundation Building Materials, Inc. and LSF9 Stardust Holdings, L.P. | |
| 4.2** | Indenture, dated as of August 9, 2016, by and among LSF9 Cypress Holdings LLC, FBM Finance, Inc., each of the guarantors party thereto, and Wilmington Trust, National Association, as Trustee and Collateral Agent. | |
| 5.1 | Opinion of Gibson, Dunn & Crutcher LLP. | |
| 10.1** | ABL Credit Agreement, dated as of August 9, 2016, by and among LSF9 Cypress Parent LLC, LSF9 Cypress Holdings LLC, the Additional US Borrowers party thereto, the Canadian Borrowers party thereto, the lenders party thereto, Goldman Sachs Bank USA, as Administrative Agent, Bank of America, N.A., as Collateral Agent, Goldman Sachs Bank USA, Bank of America, N.A., as Wells Fargo Bank, N.A., as Joint Lead Arrangers and Joint Bookrunners, and RBC Capital Markets, as Joint Bookrunner. | |
| 10.2** | Incremental Facility Amendment to ABL Credit Agreement, dated as of September 23, 2016, by and among LSF9 Cypress Holdings LLC, the Additional US Borrowers party thereto, the Additional Canadian Borrowers party thereto, LSF9 Cypress Parent LLC, the lenders and issuing banks party thereto, Goldman Sachs Bank USA, as Administrative Agent, Bank of America, N.A., as Collateral Agent, and Goldman Sachs Bank USA, Bank of America, N.A. and Wells Fargo Bank, National Association, acting as Joint Lead Arrangers and Joint Bookrunners and RBC Capital Markets, acting as Joint Bookrunner. | |
| 10.3** | Form of Tax Receivable Agreement. | |
| 10.4** | Form of Indemnification Agreement. | |
| 10.5** | Asset Advisory Agreement, dated as of August 10, 2015, by and among Hudson Americas L.P., LSF9 Cypress Parent LLC, and Lone Star Fund IX (U.S.), L.P. | |
| 10.6**# | Employment Agreement by and between Foundation Building Materials, LLC and Ruben Mendoza dated as of October 9, 2015. | |
| 10.7**# | Employment Agreement by and between Foundation Building Materials, LLC and John Gorey dated as of October 9, 2015. | |
| 10.8**# | Employment Agreement by and between Foundation Building Materials, LLC and Pete Welly dated as of October 9, 2015. | |
| 10.9**# | Foundation Building Materials, Inc. 2017 Stock Incentive Plan. | |
II-5
Table of Contents
| Exhibit |
Description of Exhibit | |
|
| ||
| 10.10**# | Form of Grant Notice for 2017 Stock Incentive Plan Nonqualified Stock Options Award. | |
| 10.11**# | Form of Grant Notice for 2017 Stock Incentive Plan Incentive Stock Options Award. | |
| 10.12**# | Form of Grant Notice for 2017 Stock Incentive Plan Restricted Stock Award. | |
| 10.13**# | Form of Grant Notice for 2017 Stock Incentive Plan Restricted Stock Unit Award. | |
| 10.14**# | Form of Grant Notice for 2017 Stock Incentive Plan Stock Award. | |
| 10.15**# | LSF9 Cypress Parent, LLC Long Term Incentive Plan (with form of award agreement). | |
| 10.16**# | First Amendment to LSF9 Cypress Parent, LLC Long Term Incentive Plan. | |
| 15.1 | Awareness Letter of VonLehman & Company Inc. | |
| 21.1 | Subsidiaries of the Registrant. | |
| 23.1 | Consent of Deloitte & Touche LLP. | |
| 23.2 | Consent of Deloitte & Touche LLP. | |
| 23.3 | Consent of Deloitte & Touche LLP. | |
| 23.4 | Consent of Deloitte & Touche LLP. | |
| 23.5 | Consent of Deloitte & Touche LLP. | |
| 23.6 | Consent of Deloitte LLP. | |
| 23.7 | Consent of RSM US LLP. | |
| 23.8 | Consent of VonLehman & Company Inc. | |
| 23.9 | Consent of Gibson, Dunn & Crutcher LLP (included in Exhibit 5.1). | |
| 24.1** | Powers of Attorney. | |
| 99.1** | Consent to be Named of Kevin Barner. | |
| 99.2** | Consent to be Named of Nick Beevers. | |
| 99.3** | Consent to be Named of Court Carruthers. | |
| 99.4** | Consent to be Named of Fareed Khan. | |
| 99.5** | Consent to be Named of Dominic LaValle. | |
| 99.6** | Consent to be Named of Samuel D. Laughlin. | |
| 99.7** | Consent to be Named of Chris Meyer. | |
| 99.8** | Consent to be Named of James Underhill. | |
| 99.9** | Consent to be Named of Grant Wilbeck. | |
| 99.10** | Consent to be Named of Ruben Mendoza. | |
| ** | Previously filed. |
| # | Denotes management compensatory plan or arrangement |
| + | Certain schedules to this agreement have been omitted in accordance with Item 601(b)(2) of Regulation S-K. A copy of any omitted schedules will be furnished supplementally to the SEC upon request. |
II-6