Attached files
| file | filename |
|---|---|
| 8-K - 8-K - CENTRAL VALLEY COMMUNITY BANCORP | a8-kirpresentationfigpartn.htm |

Investor Presentation
FIG Partners West Coast CEO Forum
February 2, 2017
Jim Ford President & CEO
Dave Kinross EVP CFO

Forward-Looking Statements
2
Forward-looking Statements -- Certain matters discussed constitute forward-looking statements
within the meaning of the Private Securities Litigation Reform Act of 1995. All statements contained
herein that are not historical facts, such as statements regarding the Company's current business
strategy and the Company's plans for future development and operations, are based upon current
expectations. These statements are forward-looking in nature and involve a number of risks and
uncertainties. Such risks and uncertainties include, but are not limited to (1) significant increases in
competitive pressure in the banking industry; (2) the impact of changes in interest rates, a decline in
economic conditions at the international, national or local level on the Company's results of
operations, the Company's ability to continue its internal growth at historical rates, the Company's
ability to maintain its net interest margin, and the quality of the Company's earning assets; (3)
changes in the regulatory environment; (4) fluctuations in the real estate market; (5) changes in
business conditions and inflation; (6) changes in securities markets; and (7) the other risks set forth
in the Company's reports filed with the Securities and Exchange Commission, including its Annual
Report on Form 10-K for the year ended December 31, 2015. Therefore, the information set forth in
such forward-looking statements should be carefully considered when evaluating the business
prospects of the Company.

Experienced Management Team
3
Executive Position
Years at
CVCY
Years of
Experience
James M. Ford President & CEO 3 37
David A. Kinross EVP, Chief Financial Officer 11 27
Gary D. Quisenberry EVP Commercial & Business Banking 17 32
Lydia E. Shaw EVP Community Banking 10 32
Patrick J. Carman EVP, Chief Credit Officer 8 45

Overview
4
NASDAQ Symbol CVCY
Market Capitalization $248.4 Million
Institutional Ownership 40%
Insider Ownership 14%
Total Assets $1.4 Billion
Headquarters Fresno, CA
Number of Branches 22
Year Established 1980
Strategic Footprint Bakersfield to
Sacramento
22 Branches in 9 Contiguous Counties
As of December 31, 2016

Financial Highlights
5
2016 2015
Total Average Assets $1.32 Billion $1.22 Billion
Net Income $15.18 Million $10.96 Million
Diluted EPS $1.33 $1.00
Net Interest Margin 4.09% 4.01%
ROA 1.15% 0.90%
ROE 9.84% 8.12%
Cash Dividends per share $0.24 $0.18
Total Cost of Funds 0.09% 0.09%
NPAs to Total Assets 0.18% 0.19%
Leverage Capital Ratio 8.75% 8.65%
Common Equity Tier 1 Ratio 12.48% 13.44%
Tier 1 Risk Based Capital Ratio 12.74% 13.79%
Total Risk Based Capital Ratio 13.72% 15.04%
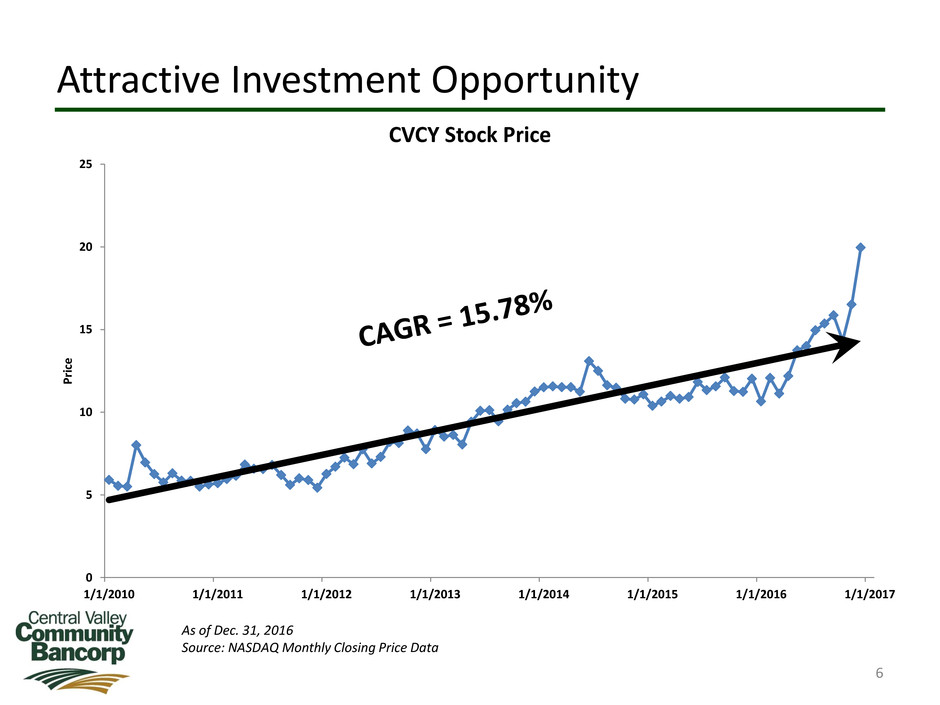
Attractive Investment Opportunity
6
As of Dec. 31, 2016
Source: NASDAQ Monthly Closing Price Data
0
5
10
15
20
25
1/1/2010 1/1/2011 1/1/2012 1/1/2013 1/1/2014 1/1/2015 1/1/2016 1/1/2017
P
ri
ce
CVCY Stock Price
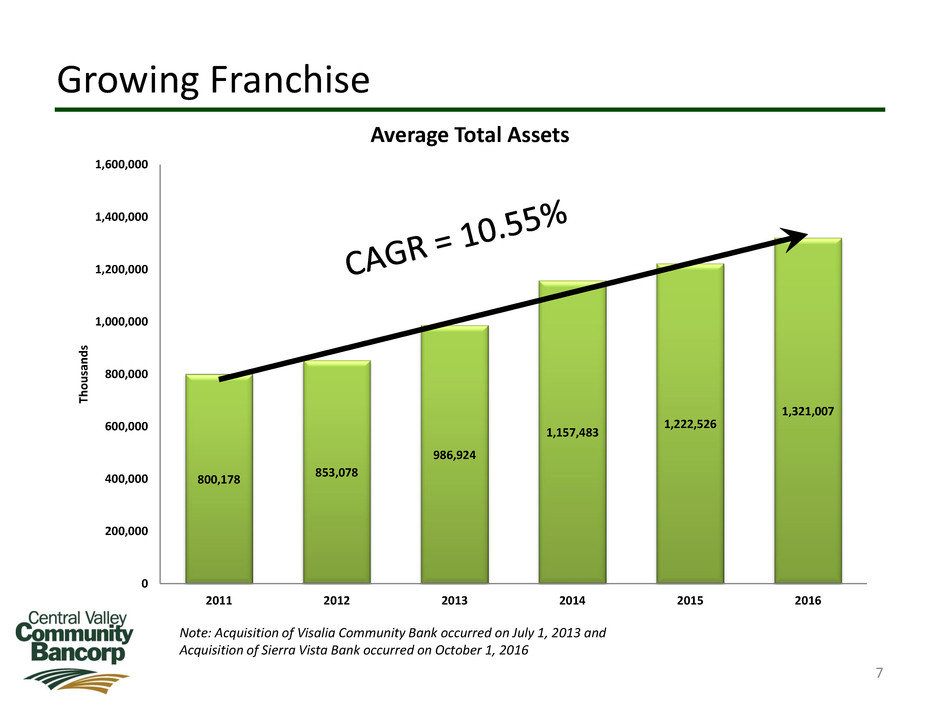
Growing Franchise
7
Note: Acquisition of Visalia Community Bank occurred on July 1, 2013 and
Acquisition of Sierra Vista Bank occurred on October 1, 2016
800,178
853,078
986,924
1,157,483
1,222,526
1,321,007
0
200,000
400,000
600,000
800,000
1,000,000
1,200,000
1,400,000
1,600,000
2011 2012 2013 2014 2015 2016
Th
o
u
sa
n
d
s
Average Total Assets
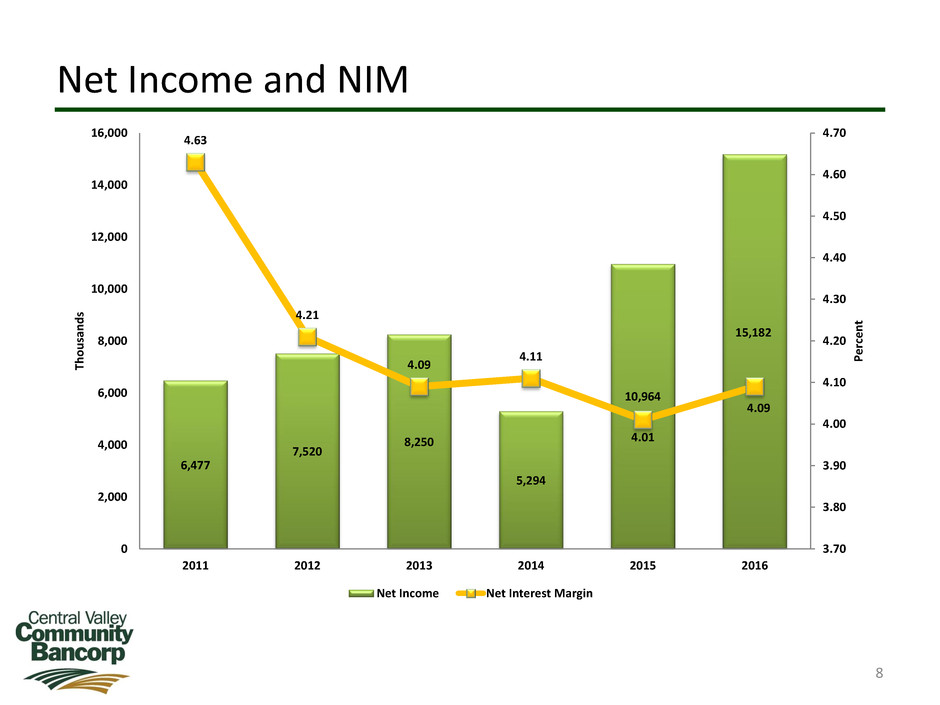
Net Income and NIM
8
6,477
7,520
8,250
5,294
10,964
15,182
4.63
4.21
4.09
4.11
4.01
4.09
3.70
3.80
3.90
4.00
4.10
4.20
4.30
4.40
4.50
4.60
4.70
0
2,000
4,000
6,000
8,000
10,000
12,000
14,000
16,000
2011 2012 2013 2014 2015 2016
Pe
rc
e
n
t
Th
o
u
sa
n
d
s
Net Income Net Interest Margin
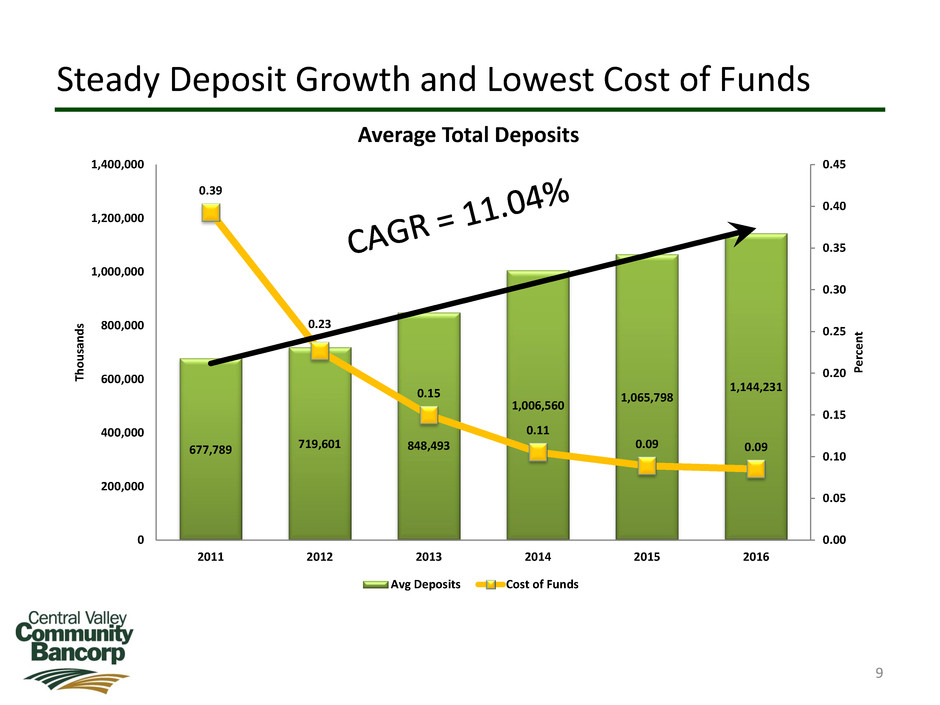
Steady Deposit Growth and Lowest Cost of Funds
9
677,789 719,601 848,493
1,006,560
1,065,798
1,144,231
0.39
0.23
0.15
0.11
0.09 0.09
0.00
0.05
0.10
0.15
0.20
0.25
0.30
0.35
0.40
0.45
0
200,000
400,000
600,000
800,000
1,000,000
1,200,000
1,400,000
2011 2012 2013 2014 2015 2016
Pe
rc
e
n
t
Th
o
u
sa
n
d
s
Average Total Deposits
Avg Deposits Cost of Funds

Attractive Deposit Mix
10
Non-Interest Bearing
40%
Now/Savings
28%
Money Market
20%
TCDs
12%
As of Dec. 31, 2016
Total Deposits = $1.26 Billion

Loan Totals and Yield
11
412,969 394,575
445,300
533,531
578,899
644,282
6.32
6.06
5.96
5.53
5.27 5.29
4.60
4.80
5.00
5.20
5.40
5.60
5.80
6.00
6.20
6.40
0
100,000
200,000
300,000
400,000
500,000
600,000
700,000
2011 2012 2013 2014 2015 2016
Pe
rc
e
n
t
Th
o
u
sa
n
d
s
Average Total Loans
Total Loans Loan Yield

Balanced Loan Portfolio
12
Commercial &
Industrial, 12%
Agriculture
Production & Land,
15%
Owner Occupied
Real Estate, 25%
R/E Construction &
Land, 9%
Commercial Real
Estate, 24%
Other Real Estate,
3%
Equity Loans and
Lines, 9%
Consumer &
Installment, 3%
As of Dec. 31, 2016
Excludes Deferred Loan Fees
Total Loans = $755 Million

Agricultural Loan Commitments
13
Almonds
23%
Table Grapes
12%
Open Land
12% Walnuts
11%
Wine Grapes
9%
Other
8%
Tomatoes
6%
Raisins
5%
Cherries
4%
Tree Fruit
3%
Cotton
3%
Pistachios
1%
Citrus
1%
Wheat
1%
Alfalfa
1%
As of Dec. 31, 2016

On the Horizon
14
Organic Loan Growth
Assimilate Sierra Vista Acquisition
Evaluate Merger Opportunities
Improve Efficiencies
Fee Income Improvements
Relationship Pricing & Customer
Profitability
Closely Monitor Water
Resources
15
Investing in Relationships
