Attached files
| file | filename |
|---|---|
| 8-K - PRICE T ROWE GROUP INC | investordaymaterials.htm |
T. Rowe Price Investor Day • February 2, 2017 1
T. ROWE PRICE
OVERVIEW
February 2, 2017
William J. Stromberg
President and CEO
T. Rowe Price Investor Day
Welcome everyone, and thank you for coming today.
We are here to provide an update on T. Rowe Price and our strategic priorities.
̶ From August 2015 through June 2016, we conducted a thorough strategic review of our
business, and we developed a detailed plan to diversify and grow our business despite the many
headwinds that we and our industry are currently facing.
̶ We are choosing to invest in our business in three general areas to strengthen our competitive
advantages: (1) products – especially multi-asset, (2) distribution, and (3) technology.
̶ We believe that these investments are essential to our long-term success. We recognize that
they raise our expenses and impact our operating profit margins in the near term – but we think
these are the right investments to make and that the payoff will be worth it.
A second purpose of today’s meeting is to introduce you to four leaders who helped develop our plan
and who lead important businesses within T. Rowe Price. Each is an industry veteran and a strong
leader, and each is committed to our long-term business success.
A third reason for hosting this meeting today is to fulfill our commitment to you to provide more
transparency into our business. We want you to understand what we are investing in and why we
think we will be successful.

T. Rowe Price Investor Day • February 2, 2017
2
Forward-looking statements
This presentation, and other statements that T. Rowe Price may make, may contain forward-looking statements within the
meaning of the Private Securities Litigation Reform Act, with respect to T. Rowe Price’s future financial or business
performance, strategies, or expectations.
Forward-looking statements are typically identified by words or phrases such as “trend,” “potential,” “opportunity,”
“pipeline,” “believe,” “comfortable,” “expect,” “anticipate,” “current,” “intention,” “estimate,” “position,” “assume,” “outlook,”
“continue,” “remain,” “maintain,” “sustain,” “seek,” “achieve,” and similar expressions, or future or conditional verbs such as
“will,” “would,” “should,” “could,” “may,” and similar expressions. Forward-looking statements in this presentation may
include, without limitation, information concerning future results of our operations, expenses, earnings, liquidity, cash flow
and capital expenditures, industry or market conditions, amount or composition of AUM, regulatory developments, demand
for and pricing of our products, and other aspects of our business or general economic conditions. T. Rowe Price cautions
that forward-looking statements are subject to numerous assumptions, risks, and uncertainties, which change over time.
Actual results could differ materially from those anticipated in forward-looking statements, and future results could differ
materially from historical performance. Forward-looking statements speak only as of the date they are made, and T. Rowe
Price assumes no duty to and does not undertake to update forward-looking statements.
We caution investors not to rely unduly on any forward-looking statements and urge you to carefully consider the risks
described in our most recent Form 10-K and subsequent Forms 10-Q, filed with the Securities and Exchange Commission.
2
Important Information
This material, including any statements, information, data and content contained within it and any materials, information, images, links,
graphics or recording provided in conjunction with this material are being furnished by T. Rowe Price for general informational purposes only.
Under no circumstances should the material, in whole or in part, be copied or redistributed without consent from T. Rowe Price. The views
contained herein are as of the date of the presentation. The information and data obtained from third-party sources which is contained in the
report were obtained from sources deemed reliable; however, its accuracy and completeness is not guaranteed.
Past performance is not a reliable indicator of future performance. The value of an investment and any income from it can go down as
well as up. Investors may get back less than the amount invested. Certain historical business data may include the use of estimates. This
presentation also includes non-GAAP financial measures. You can find our presentations on the most directly comparable GAAP financial
measures calculated in accordance with GAAP and our reconciliations in the appendix to this presentation and T. Rowe Price’s other periodic
reports.
The products and services discussed in this presentation are available via subsidiaries of T. Rowe Price Group as authorized in countries
through the world. The products and services are not available to all investors or in all countries. Visit troweprice.com to learn more about
the products and services available in your country and the T. Rowe Price Group subsidiary which is authorized to provide them. The
material is not intended for use by persons in jurisdictions which prohibit or restrict the distribution of the material and in certain countries the
material is provided upon specific request. The material does not constitute a distribution, an offer, an invitation, recommendation or
solicitation to sell or buy any securities in any jurisdiction. The material has not been reviewed by any regulatory authority in any jurisdiction.
The material does not constitute advice of any nature and prospective investors are recommended to seek independent legal, financial and
tax advice before making any investment decision.
T. ROWE PRICE, INVEST WITH CONFIDENCE, and the bighorn sheep design are trademarks or registered trademarks of T. Rowe Price
Group, Inc. in the United States and other countries. All other trademarks are the property of T. Rowe Price or their respective owners.
T. Rowe Price Investor Day • February 2, 2017
3
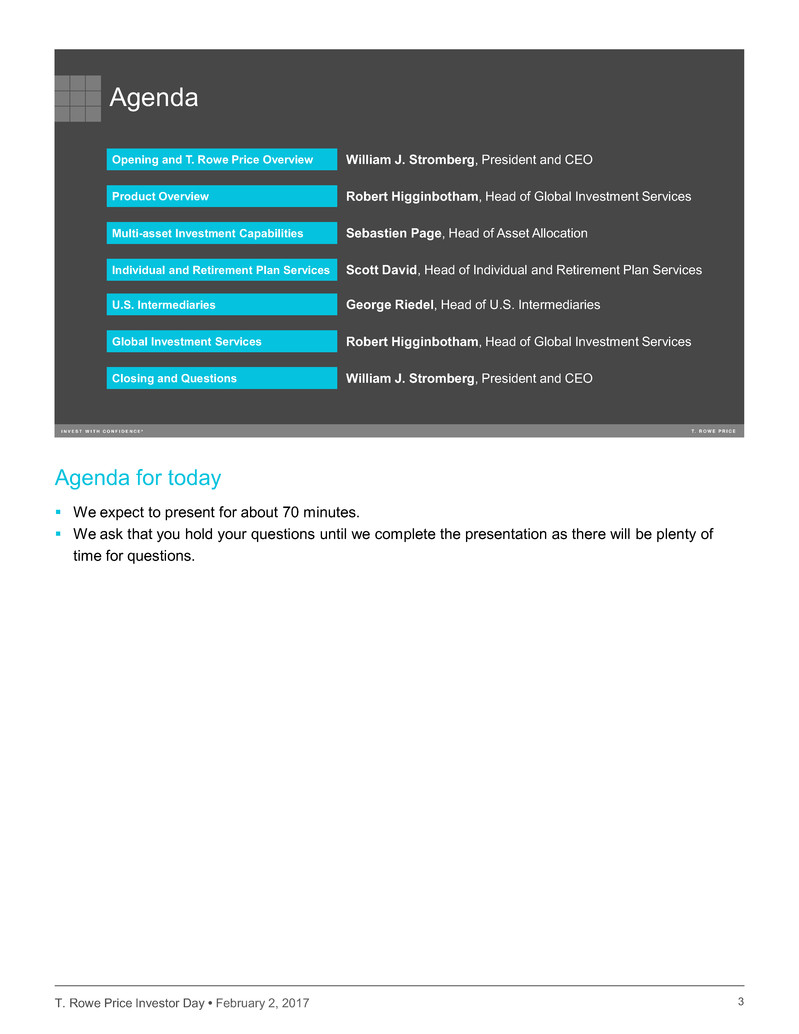
Opening and T. Rowe Price Overview
Agenda
William J. Stromberg, President and CEO
Product Overview
Multi-asset Investment Capabilities
Individual and Retirement Plan Services
Robert Higginbotham, Head of Global Investment Services
Sebastien Page, Head of Asset Allocation
Scott David, Head of Individual and Retirement Plan Services
U.S. Intermediaries
Global Investment Services
Closing and Questions
George Riedel, Head of U.S. Intermediaries
Robert Higginbotham, Head of Global Investment Services
William J. Stromberg, President and CEO
3
Agenda for today
We expect to present for about 70 minutes.
We ask that you hold your questions until we complete the presentation as there will be plenty of
time for questions.
T. Rowe Price Investor Day • February 2, 2017
4
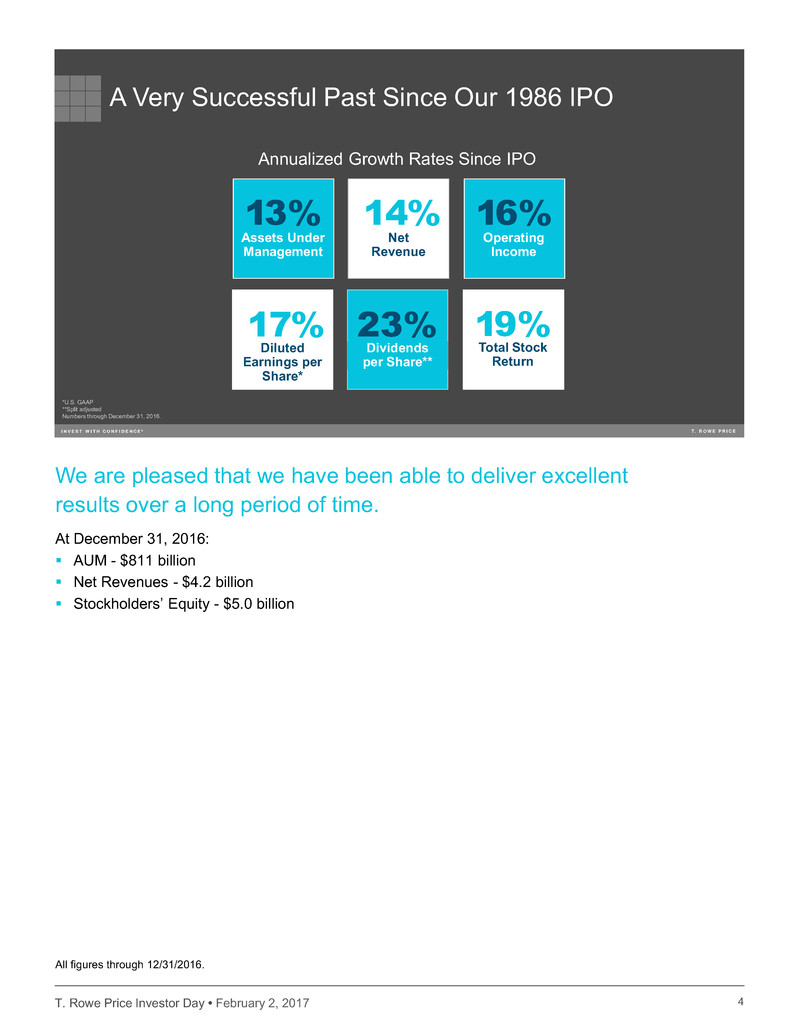
A Very Successful Past Since Our 1986 IPO
13%
Assets Under
Management
14%
Net
Revenue
17%
Diluted
Earnings per
Share*
23%
Dividends
per Share**
19%
Total Stock
Return
16%
Operating
Income
*U.S. GAAP
**Split adjusted
Numbers through December 31, 2016.
Annualized Growth Rates Since IPO
4
We are pleased that we have been able to deliver excellent
results over a long period of time.
At December 31, 2016:
AUM - $811 billion
Net Revenues - $4.2 billion
Stockholders’ Equity - $5.0 billion
All figures through 12/31/2016.
T. Rowe Price Investor Day • February 2, 2017
5
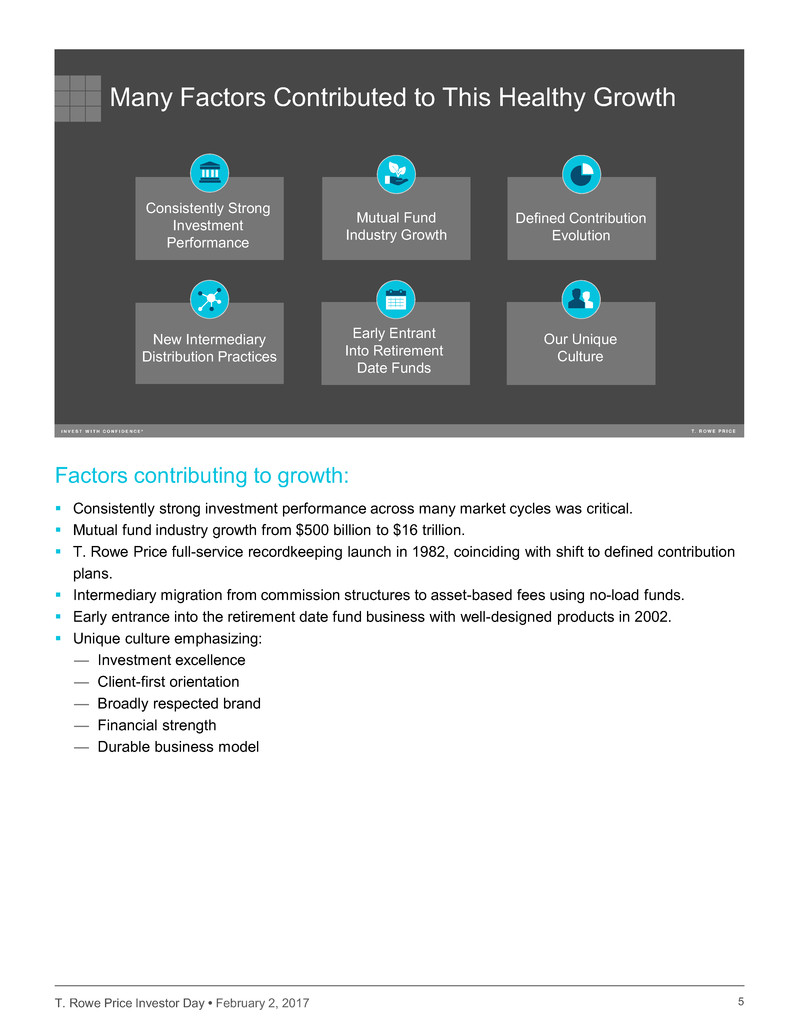
Consistently Strong
Investment
Performance
Many Factors Contributed to This Healthy Growth
New Intermediary
Distribution Practices
Early Entrant
Into Retirement
Date Funds
Our Unique
Culture
Mutual Fund
Industry Growth
Defined Contribution
Evolution
5
Consistently strong investment performance across many market cycles was critical.
Mutual fund industry growth from $500 billion to $16 trillion.
T. Rowe Price full-service recordkeeping launch in 1982, coinciding with shift to defined contribution
plans.
Intermediary migration from commission structures to asset-based fees using no-load funds.
Early entrance into the retirement date fund business with well-designed products in 2002.
Unique culture emphasizing:
— Investment excellence
— Client-first orientation
— Broadly respected brand
— Financial strength
— Durable business model
Factors contributing to growth:

T. Rowe Price Investor Day • February 2, 2017
6
Asset Class*
U.S. Equity
49%
Global Equity
7%
U.S. Fixed
Income
14%
Global Fixed
Income
1%
Asset
Allocation
29%
Diversified by Assets and by Client Type
Numbers represent percentages of total firm AUM as of December 31, 2016.
*Based on investment strategy.
Retirement –
Full-Service
Recordkeeping
13%
Individual
Investors
18%
EMEA/APAC
Intermediaries
2%
U.S.
Intermediaries
47%
Institutional
Investors
20%
Client Type
6
Diversified by…
Asset Class
Integrated global investment platform is a competitive advantage and is built for excellence at
scale.
Broad array of high-performing investment strategies has enabled growth in asset allocation
strategies.
Global capabilities in equity, fixed income, and multi-asset provide significant growth
opportunities.
Client Type
Well diversified by client type – with a heavy emphasis on retirement assets.
Meaningful growth opportunities abound across each client type.

T. Rowe Price Investor Day • February 2, 2017
7
How We Access Clients
T. Rowe Price
U.S. Plan
Sponsors
Global
Institutions
Individual Investors
U.S.
Financial
Intermediaries
EMEA & APAC
Financial
IntermediariesDirect
7
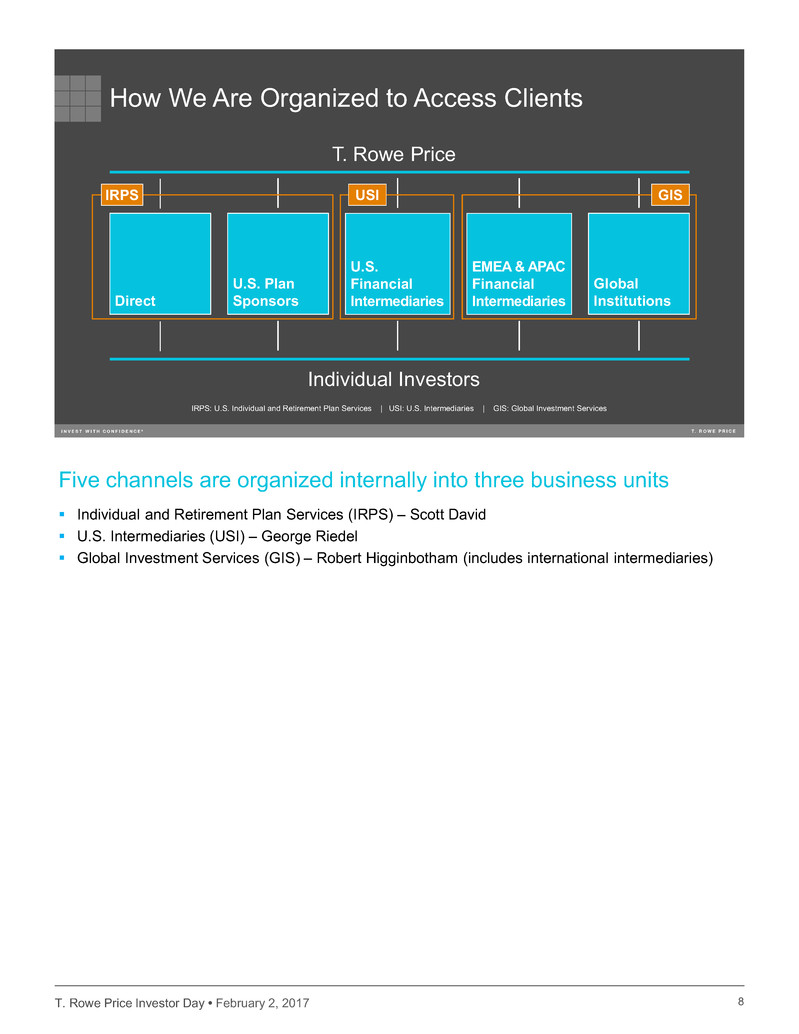
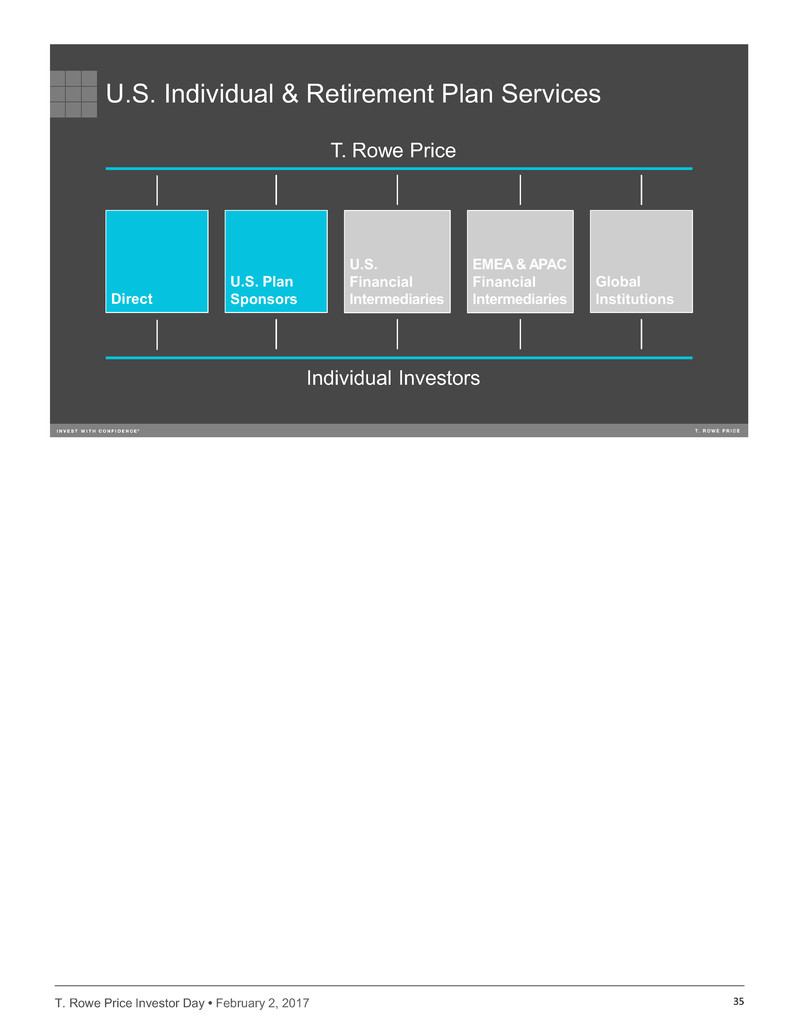
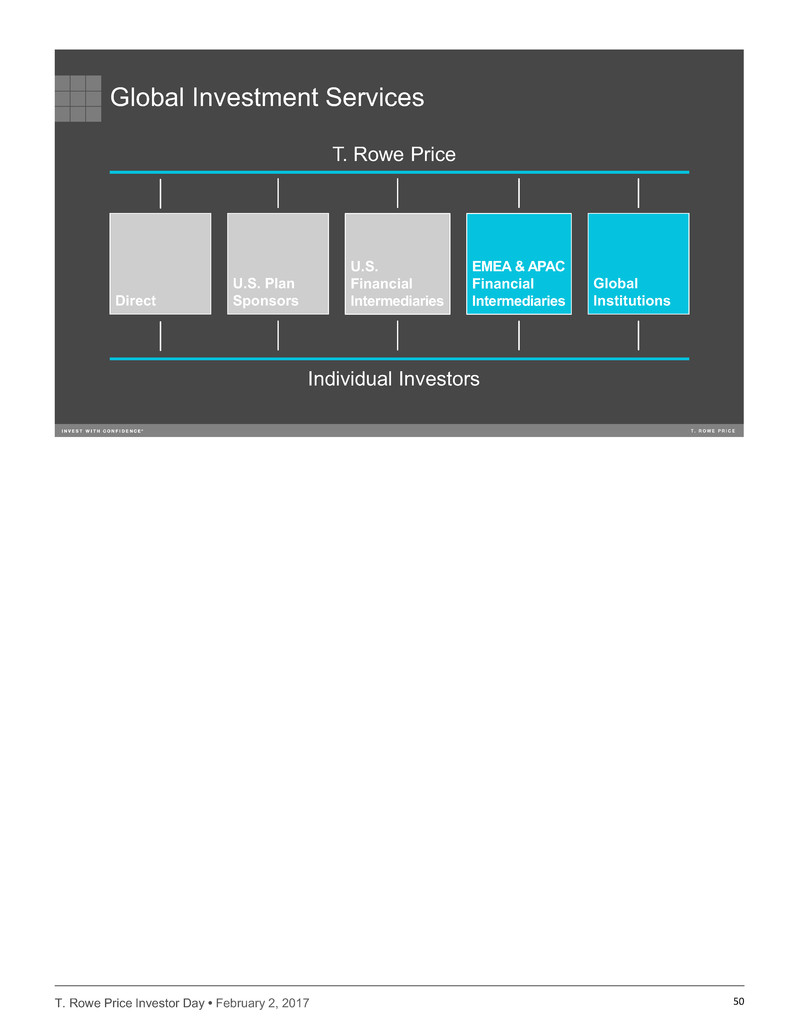
We access clients across the globe through five different channels:
Direct – 1.4+ million individual investors
U.S. Plan Sponsors – 3,600+ plans
U.S. Financial Intermediaries – 1,300+ financial institutions
EMEA & APAC Financial Intermediaries – 290+ financial institutions
Global Institutions – 640+ institutions
T. Rowe Price Investor Day • February 2, 2017
8
T. Rowe Price
U.S. Plan
Sponsors
Global
Institutions
Individual Investors
U.S.
Financial
Intermediaries
EMEA & APAC
Financial
IntermediariesDirect
How We Are Organized to Access Clients
GISUSIIRPS
IRPS: U.S. Individual and Retirement Plan Services | USI: U.S. Intermediaries | GIS: Global Investment Services
8
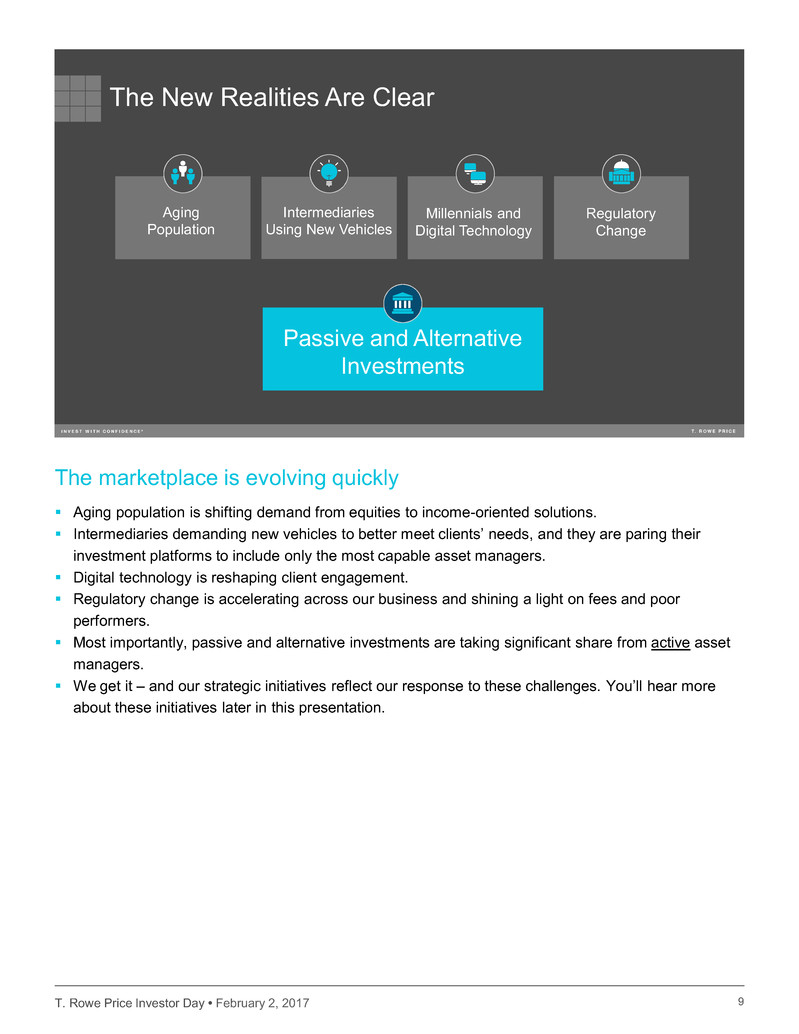
Five channels are organized internally into three business units
Individual and Retirement Plan Services (IRPS) – Scott David
U.S. Intermediaries (USI) – George Riedel
Global Investment Services (GIS) – Robert Higginbotham (includes international intermediaries)
T. Rowe Price Investor Day • February 2, 2017
9
The New Realities Are Clear
Millennials and
Digital Technology
Passive and Alternative
Investments
Regulatory
Change
Intermediaries
Using New Vehicles
Aging
Population
9
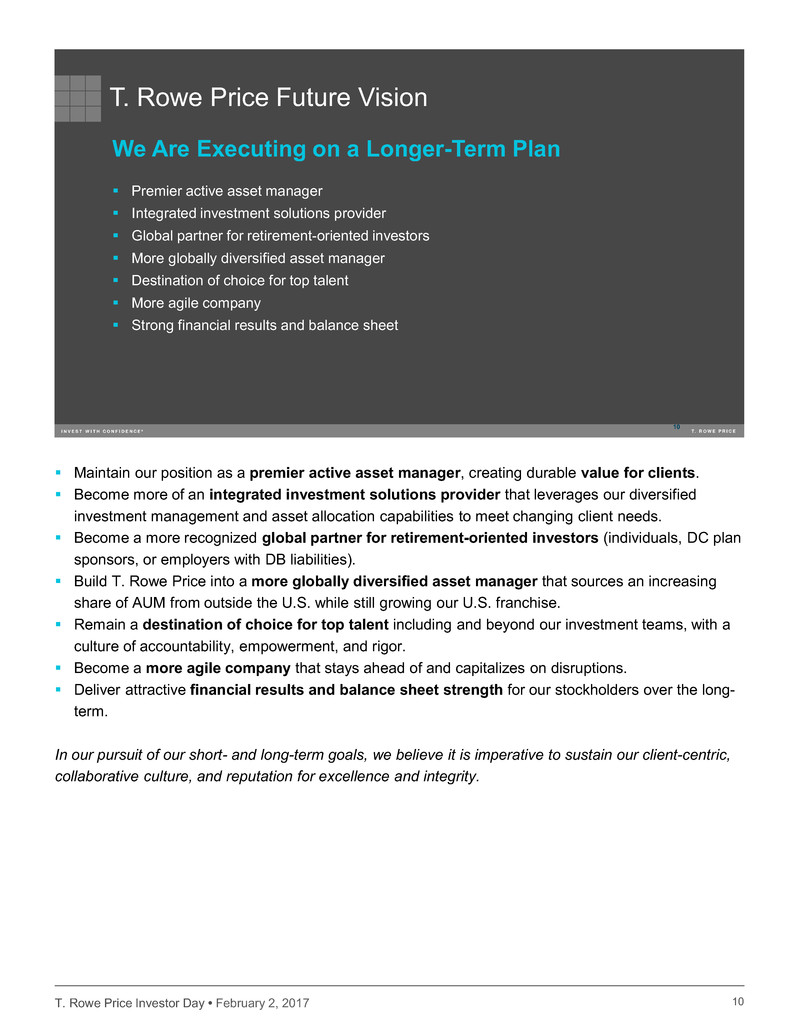
The marketplace is evolving quickly
Aging population is shifting demand from equities to income-oriented solutions.
Intermediaries demanding new vehicles to better meet clients’ needs, and they are paring their
investment platforms to include only the most capable asset managers.
Digital technology is reshaping client engagement.
Regulatory change is accelerating across our business and shining a light on fees and poor
performers.
Most importantly, passive and alternative investments are taking significant share from active asset
managers.
We get it – and our strategic initiatives reflect our response to these challenges. You’ll hear more
about these initiatives later in this presentation.
T. Rowe Price Investor Day • February 2, 2017
10
T. Rowe Price Future Vision
10
We Are Executing on a Longer-Term Plan
Premier active asset manager
Integrated investment solutions provider
Global partner for retirement-oriented investors
More globally diversified asset manager
Destination of choice for top talent
More agile company
Strong financial results and balance sheet
10
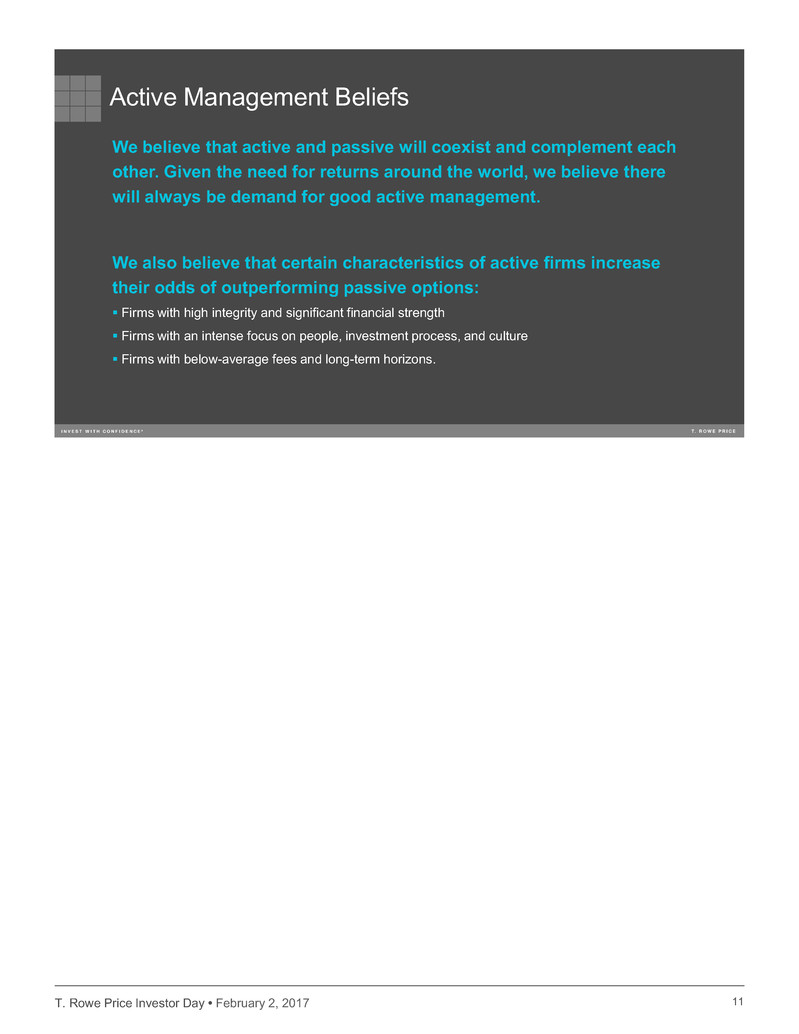
Maintain our position as a premier active asset manager, creating durable value for clients.
Become more of an integrated investment solutions provider that leverages our diversified
investment management and asset allocation capabilities to meet changing client needs.
Become a more recognized global partner for retirement-oriented investors (individuals, DC plan
sponsors, or employers with DB liabilities).
Build T. Rowe Price into a more globally diversified asset manager that sources an increasing
share of AUM from outside the U.S. while still growing our U.S. franchise.
Remain a destination of choice for top talent including and beyond our investment teams, with a
culture of accountability, empowerment, and rigor.
Become a more agile company that stays ahead of and capitalizes on disruptions.
Deliver attractive financial results and balance sheet strength for our stockholders over the long-
term.
In our pursuit of our short- and long-term goals, we believe it is imperative to sustain our client-centric,
collaborative culture, and reputation for excellence and integrity.
T. Rowe Price Investor Day • February 2, 2017
11
Active Management Beliefs
We believe that active and passive will coexist and complement each
other. Given the need for returns around the world, we believe there
will always be demand for good active management.
We also believe that certain characteristics of active firms increase
their odds of outperforming passive options:
Firms with high integrity and significant financial strength
Firms with an intense focus on people, investment process, and culture
Firms with below-average fees and long-term horizons.
11

T. Rowe Price Investor Day • February 2, 2017
12
Active Management Is Hard, We’ve Consistently Done It Well
T. Rowe Price has performed consistently well versus benchmarks,
across broad product offerings, over the long term — including our
important U.S. equity and target date offerings:
U.S. Equity:
Over the last 20 years, 75% of active T. Rowe Price diversified funds (18 funds studied)
outperformed their designated benchmarks in more than 80% of the rolling 10-year periods.1
Target Date Mutual Funds:
Since inception of each Retirement Fund in the series, 100% of the funds (9 funds studied)
have outperformed their designated benchmarks in 100% of the rolling 10-year periods.2
12
Past performance is no guarantee of future results.
1For a more detailed discussion of results and methodology see, “Long-Term Benefits of the T. Rowe Price Approach to Active Management
(April 2016).” All performance is as of 12/31/2015.
2For a more detailed discussion of results and methodology see, “Target Date Strategies: The Benefits of the T. Rowe Price Approach
(January 2017).” All performance is as of 12/31/2015.
T. Rowe Price Investor Day • February 2, 2017
13
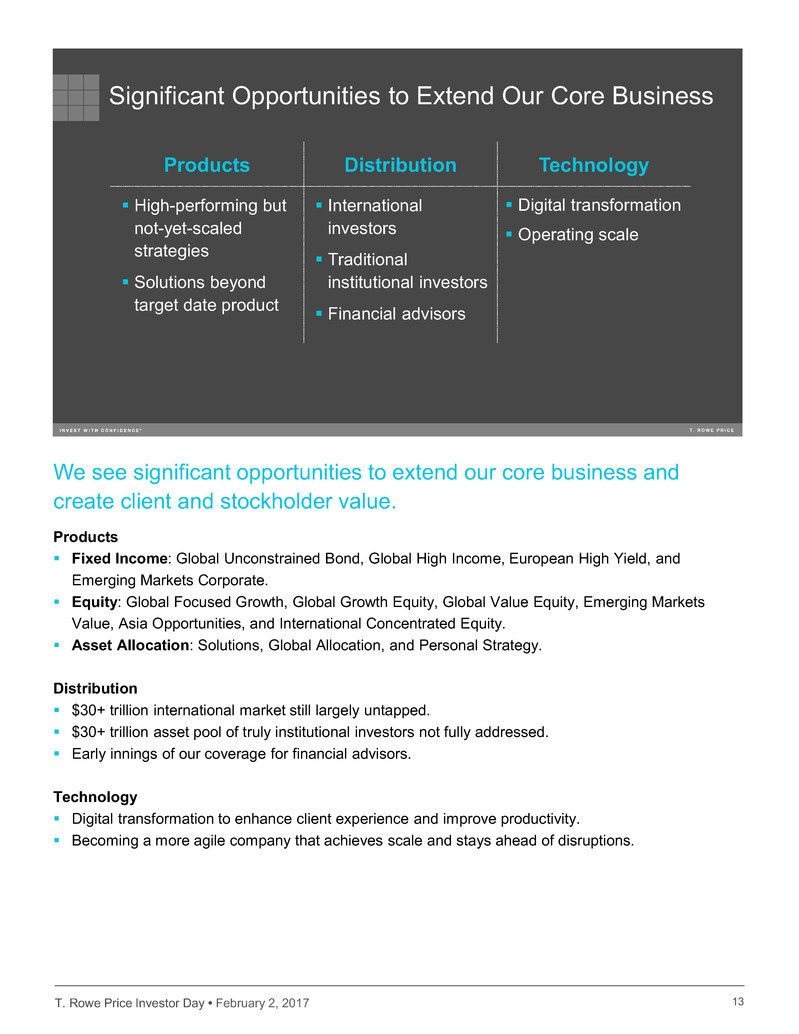
Significant Opportunities to Extend Our Core Business
Products Distribution Technology
High-performing but
not-yet-scaled
strategies
Solutions beyond
target date product
International
investors
Traditional
institutional investors
Financial advisors
Digital transformation
Operating scale
13
Products
Fixed Income: Global Unconstrained Bond, Global High Income, European High Yield, and
Emerging Markets Corporate.
Equity: Global Focused Growth, Global Growth Equity, Global Value Equity, Emerging Markets
Value, Asia Opportunities, and International Concentrated Equity.
Asset Allocation: Solutions, Global Allocation, and Personal Strategy.
Distribution
$30+ trillion international market still largely untapped.
$30+ trillion asset pool of truly institutional investors not fully addressed.
Early innings of our coverage for financial advisors.
Technology
Digital transformation to enhance client experience and improve productivity.
Becoming a more agile company that achieves scale and stays ahead of disruptions.
We see significant opportunities to extend our core business and
create client and stockholder value.
T. Rowe Price Investor Day • February 2, 2017
14
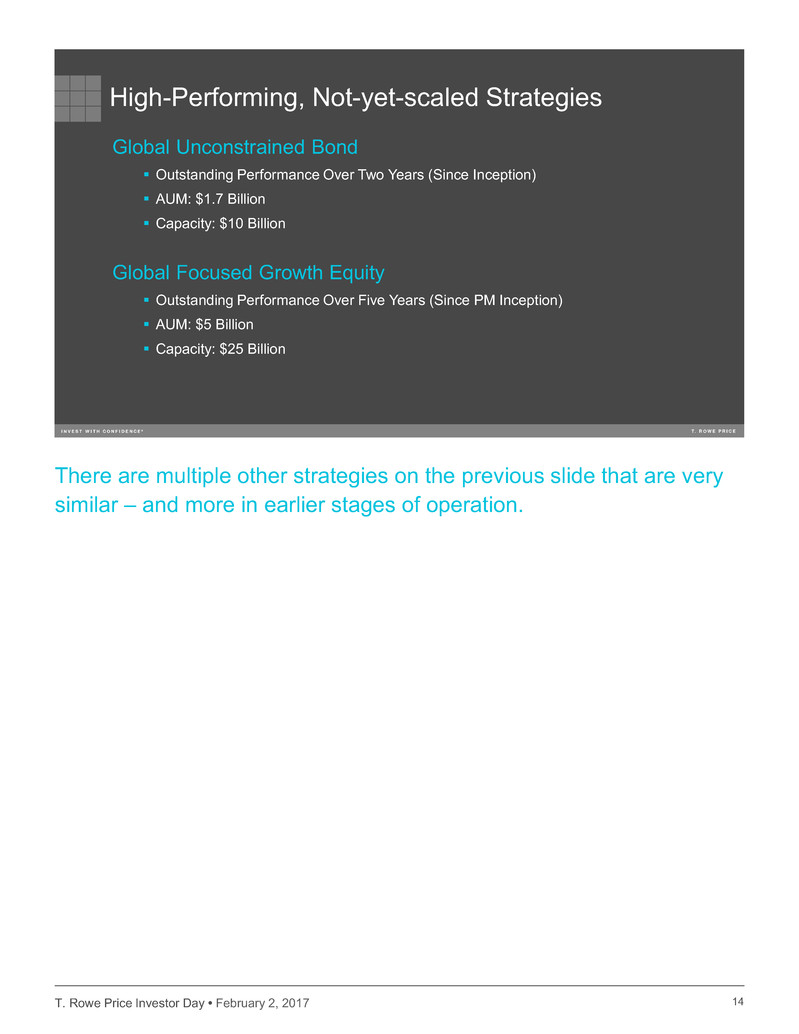
High-Performing, Not-yet-scaled Strategies
Global Unconstrained Bond
Outstanding Performance Over Two Years (Since Inception)
AUM: $1.7 Billion
Capacity: $10 Billion
Global Focused Growth Equity
Outstanding Performance Over Five Years (Since PM Inception)
AUM: $5 Billion
Capacity: $25 Billion
14
There are multiple other strategies on the previous slide that are very
similar – and more in earlier stages of operation.
T. Rowe Price Investor Day • February 2, 2017
15
$-
$500
$1,000
$1,500
$2,000
$2,500
$3,000
$3,500
2016 2017P 2018P 2019P
Ad
ju
st
ed
O
pe
ra
tin
g
Ex
pe
ns
es
* (
$M
)
New Investment (High)
New Investment (Low)
Baseline Growth (Net 4%)
Baseline (2016)
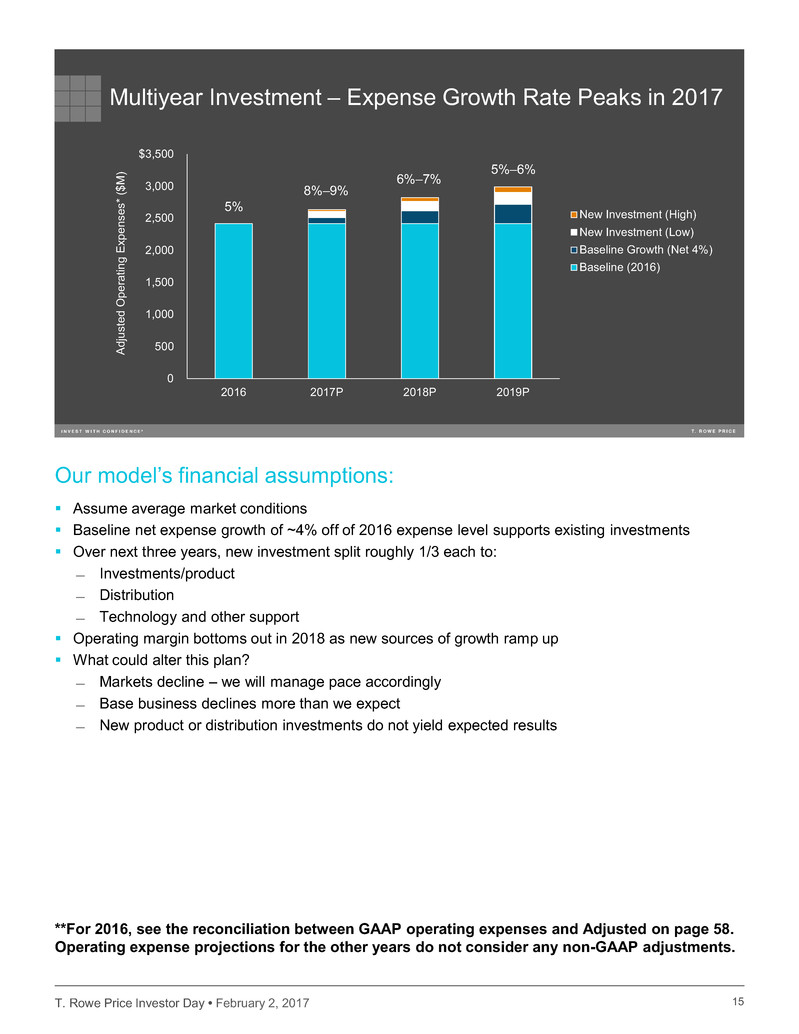
Multiyear Investment – Expense Growth Rate Peaks in 2017
5%
8%–9%
6%–7%
5%–6%
0
15
Assume average market conditions
Baseline net expense growth of ~4% off of 2016 expense level supports existing investments
Over next three years, new investment split roughly 1/3 each to:
̶ Investments/product
̶ Distribution
̶ Technology and other support
Operating margin bottoms out in 2018 as new sources of growth ramp up
What could alter this plan?
̶ Markets decline – we will manage pace accordingly
̶ Base business declines more than we expect
̶ New product or distribution investments do not yield expected results
Our model’s financial assumptions:
**For 2016, see the reconciliation between GAAP operating expenses and Adjusted on page 58.
Operating expense projections for the other years do not consider any non-GAAP adjustments.
T. Rowe Price Investor Day • February 2, 2017 16
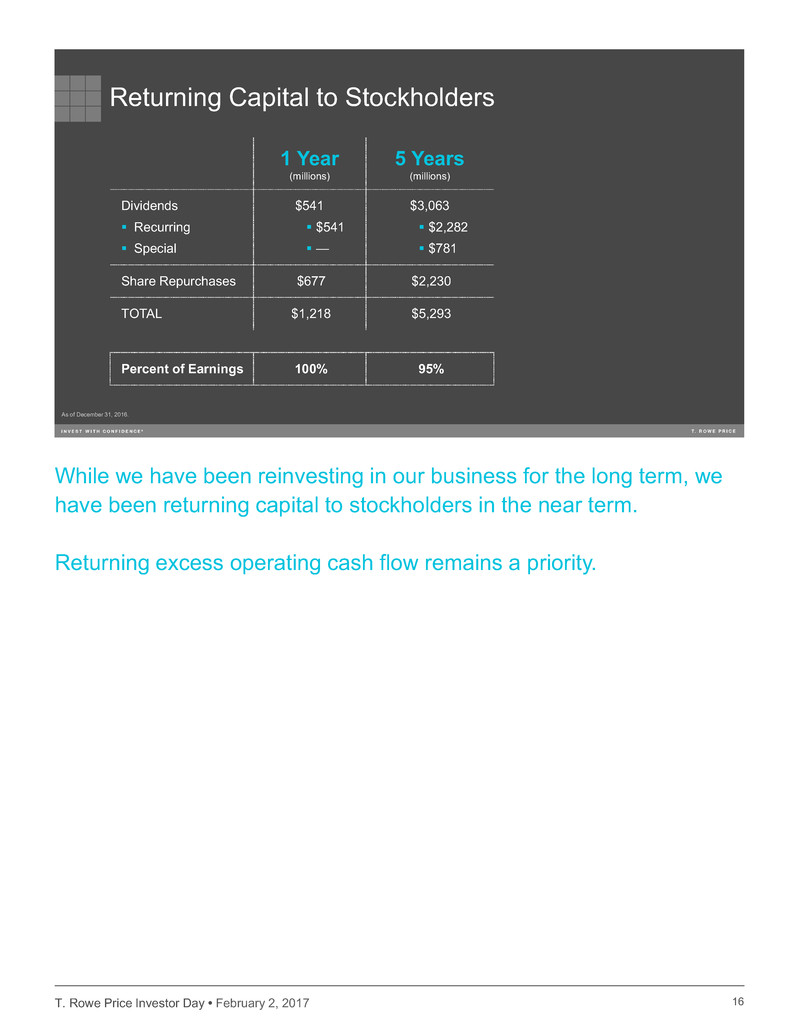
While we have been reinvesting in our business for the long term, we
have been returning capital to stockholders in the near term.
Returning excess operating cash flow remains a priority.
16
As of December 31, 2016.
Returning Capital to Stockholders
1 Year
(millions)
5 Years
(millions)
Dividends
Recurring
Special
$541
$541
—
$3,063
$2,282
$781
Share Repurchases $677 $2,230
TOTAL $1,218 $5,293
Percent of Earnings 100% 95%
T. Rowe Price Investor Day • February 2, 2017
17
Strategic Investments to Grow and Diversify
Investment
Management
Excellence
17
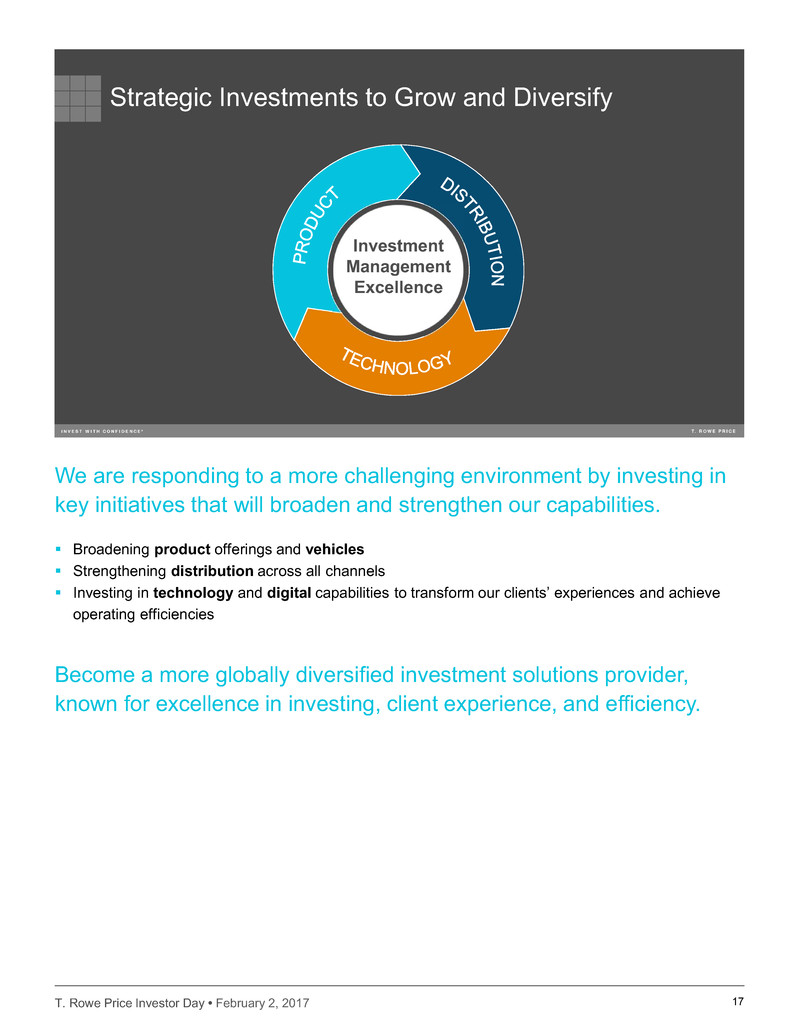
Broadening product offerings and vehicles
Strengthening distribution across all channels
Investing in technology and digital capabilities to transform our clients’ experiences and achieve
operating efficiencies
We are responding to a more challenging environment by investing in
key initiatives that will broaden and strengthen our capabilities.
Become a more globally diversified investment solutions provider,
known for excellence in investing, client experience, and efficiency.
T. Rowe Price Investor Day • February 2, 2017
PRODUCT
CAPABILITIES
T. Rowe Price Investor Day
February 2, 2017
Robert Higginbotham,
Head of Global Investment Services
18

T. Rowe Price Investor Day • February 2, 2017
Key Dimensions of Product
290+
Funds
480+
Share
Classes
$1.3 b Seed Capital
10+
Vehicle
Types
Vehicle Product+ = Market RequirementsInvestment
100+
Investment
Disciplines
Equity Fixed
Income
Multi-
asset
40+
Regulators
54
Market Segments
4
Channels Countries
16
19
Product is the nexus of value creation between client needs and an asset manager’s capabilities
We have the platform in place to drive growth:
— All main asset classes covered
— More than 10 different vehicle types (U.S. mutual fund, SICAV, OEIC, separate account, sub-
advisory, etc.)
— Service clients in 54 market segments where a market segment is defined as a combination of
country (e.g., Australia) and distribution channel (e.g., institutional)
As we build a global business, we seek to create operating leverage through an efficient product
structure
Our corporate balance sheet strength is a significant competitive advantage
As of December 31, 2016.

T. Rowe Price Investor Day • February 2, 2017
0
10
20
30
40
50
60
70
-10 -8 -6 -4 -2 0 2 4 6 8 10 12 14 16
20
15
R
ev
en
ue
(b
ps
)
2015 Net Flows (%)
1 Active core equity includes U.S. large-cap equity; active core fixed income includes core, core plus, and municipal bonds; active specialty equity includes foreign, global, EM, and U.S. small-/mid-cap; active specialty fixed income includes global, EM, high yield,
TIPS, and unconstrained.
Source: McKinsey’s Performance Lens Global Growth Cube. Used with permission.
Market Trends in Product
North America net flow growth and revenue margin by asset class1
North America includes Canada and the United States of America
Active
Passive
Bubble size = 2015 AUM
Alternatives
Active Core
Fixed Income
Passive
Equity
Active Specialty
Fixed Income
Passive Other
Active Specialty
Equity
Active Core
Equity
Passive Fixed
Income
Alternatives
Money Market
Multi-asset
20
U.S. data – 50% total global market and in many sense U.S. leads global trends
While active as a category has seen headwinds, we continue to believe in high-quality active
management:
— We have the focus on quality and we remain dedicated to this line of business
— The revenue pools combined with the stock of assets and the replacement rate within the large
pools continues to present strong potential for commercial returns
— With the continued material funding gaps in defined benefit plans and with the under-saving in
much of the world in defined contribution and discretionary savings, the incremental return from
high-quality active management will be a vital component of successful outcomes for clients
Clients will continue to need high-quality exposure to all main asset classes, and we are well
positioned to deliver across the spectrum of equity and fixed income globally
We already have a material multi-asset solutions business, so we are well placed to benefit from
this trend in customer needs in all regions of the world
1 Active core equity includes U.S. large-cap equity; active core fixed income includes core, core plus, and municipal bonds; active specialty
equity includes foreign, global, EM, and U.S. small-/mid-cap; active specialty fixed income includes global, EM, high yield, TIPS, and
unconstrained.
Source: McKinsey’s Performance Lens Global Growth Cube. Used with permission.
T. Rowe Price Investor Day • February 2, 2017
Market Trends Affecting Product
Increased
Tailoring
Regulation
and Policy
PricingKey Product
Demand Drivers
21
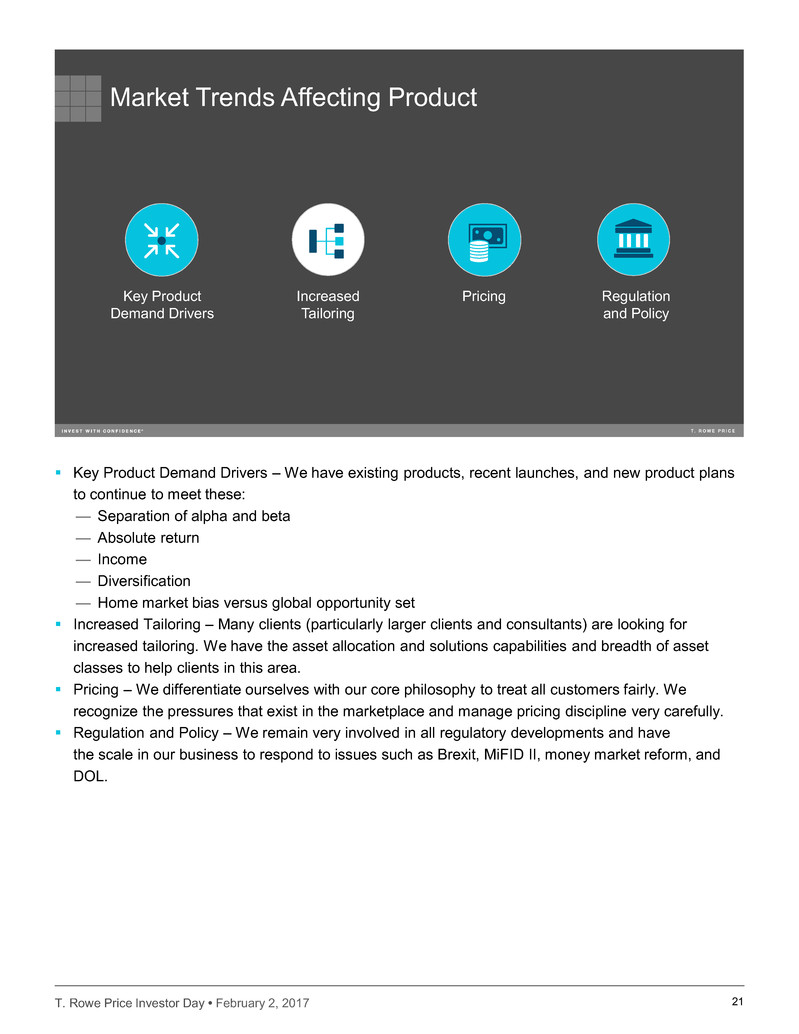
Key Product Demand Drivers – We have existing products, recent launches, and new product plans
to continue to meet these:
— Separation of alpha and beta
— Absolute return
— Income
— Diversification
— Home market bias versus global opportunity set
Increased Tailoring – Many clients (particularly larger clients and consultants) are looking for
increased tailoring. We have the asset allocation and solutions capabilities and breadth of asset
classes to help clients in this area.
Pricing – We differentiate ourselves with our core philosophy to treat all customers fairly. We
recognize the pressures that exist in the marketplace and manage pricing discipline very carefully.
Regulation and Policy – We remain very involved in all regulatory developments and have
the scale in our business to respond to issues such as Brexit, MiFID II, money market reform, and
DOL.
T. Rowe Price Investor Day • February 2, 2017
T. Rowe Price Investment Capability Development
U.S. Equity
Global
Equity
U.S. Fixed
Income
Global Fixed
Income
Asset
Allocation
1950s 1960s 1970s 2010s1980s 2000s1990s
22
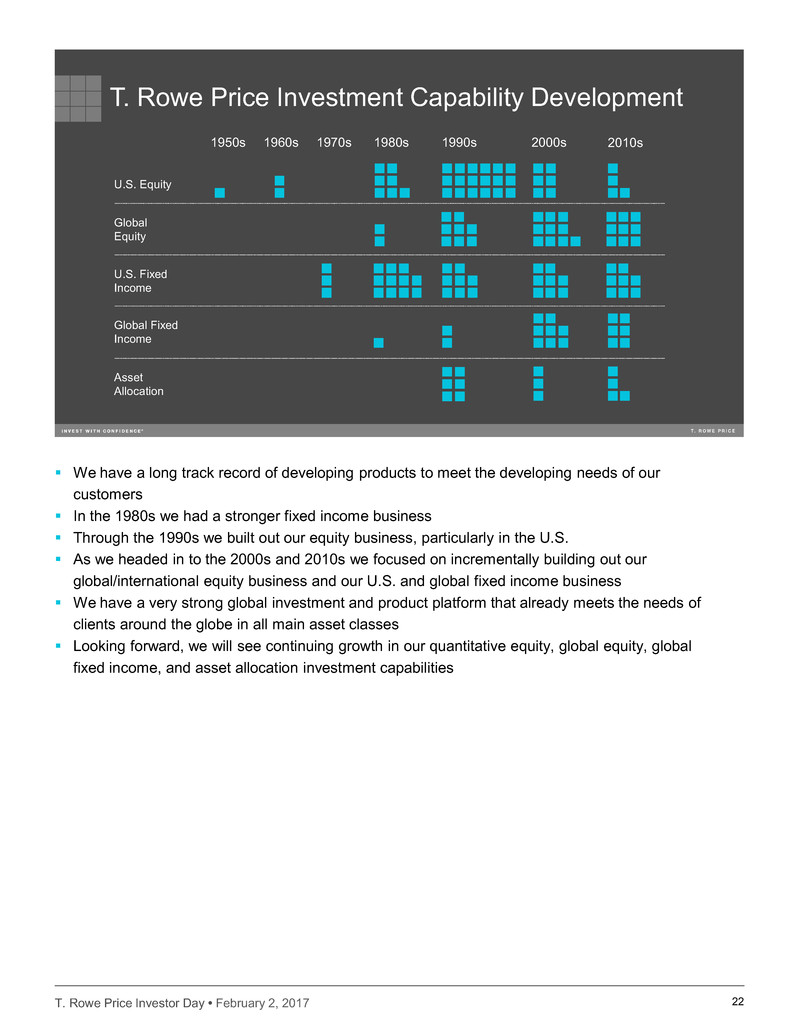
We have a long track record of developing products to meet the developing needs of our
customers
In the 1980s we had a stronger fixed income business
Through the 1990s we built out our equity business, particularly in the U.S.
As we headed in to the 2000s and 2010s we focused on incrementally building out our
global/international equity business and our U.S. and global fixed income business
We have a very strong global investment and product platform that already meets the needs of
clients around the globe in all main asset classes
Looking forward, we will see continuing growth in our quantitative equity, global equity, global
fixed income, and asset allocation investment capabilities
T. Rowe Price Investor Day • February 2, 2017
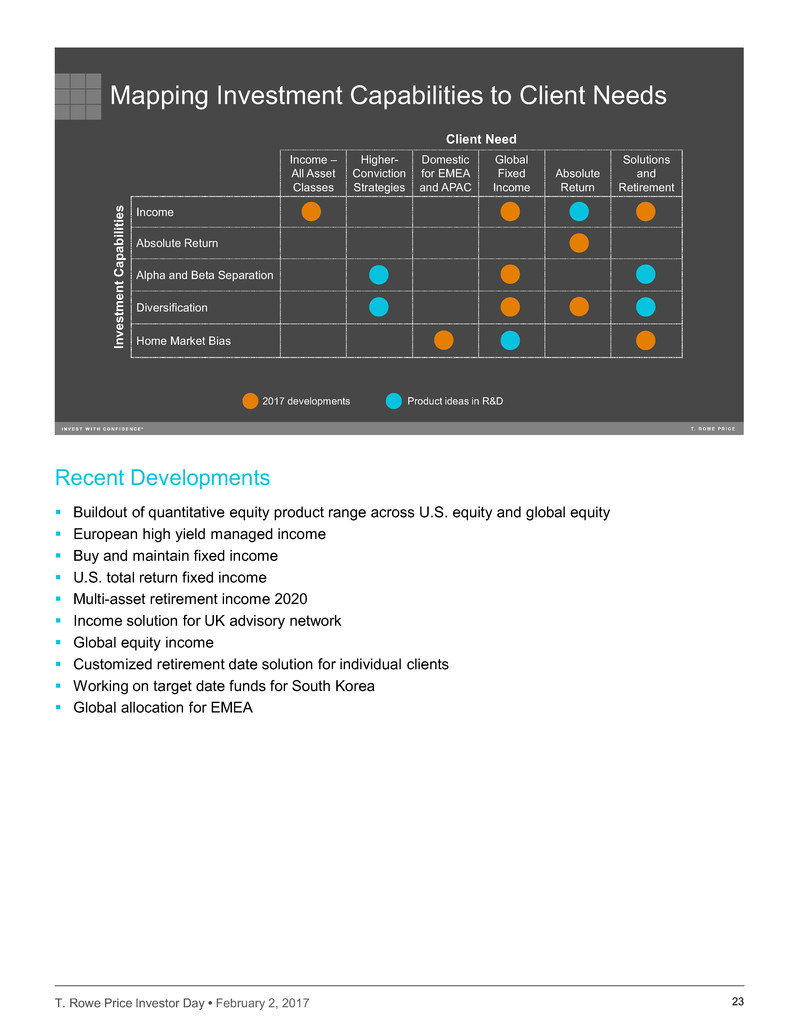
Mapping Investment Capabilities to Client Needs
Client Need
Income –
All Asset
Classes
Higher-
Conviction
Strategies
Domestic
for EMEA
and APAC
Global
Fixed
Income
Absolute
Return
Solutions
and
Retirement
In
ve
st
m
en
t C
ap
ab
ili
tie
s Income
Absolute Return
Alpha and Beta Separation
Diversification
Home Market Bias
2017 developments Product ideas in R&D
23
Recent Developments
Buildout of quantitative equity product range across U.S. equity and global equity
European high yield managed income
Buy and maintain fixed income
U.S. total return fixed income
Multi-asset retirement income 2020
Income solution for UK advisory network
Global equity income
Customized retirement date solution for individual clients
Working on target date funds for South Korea
Global allocation for EMEA
T. Rowe Price Investor Day • February 2, 2017
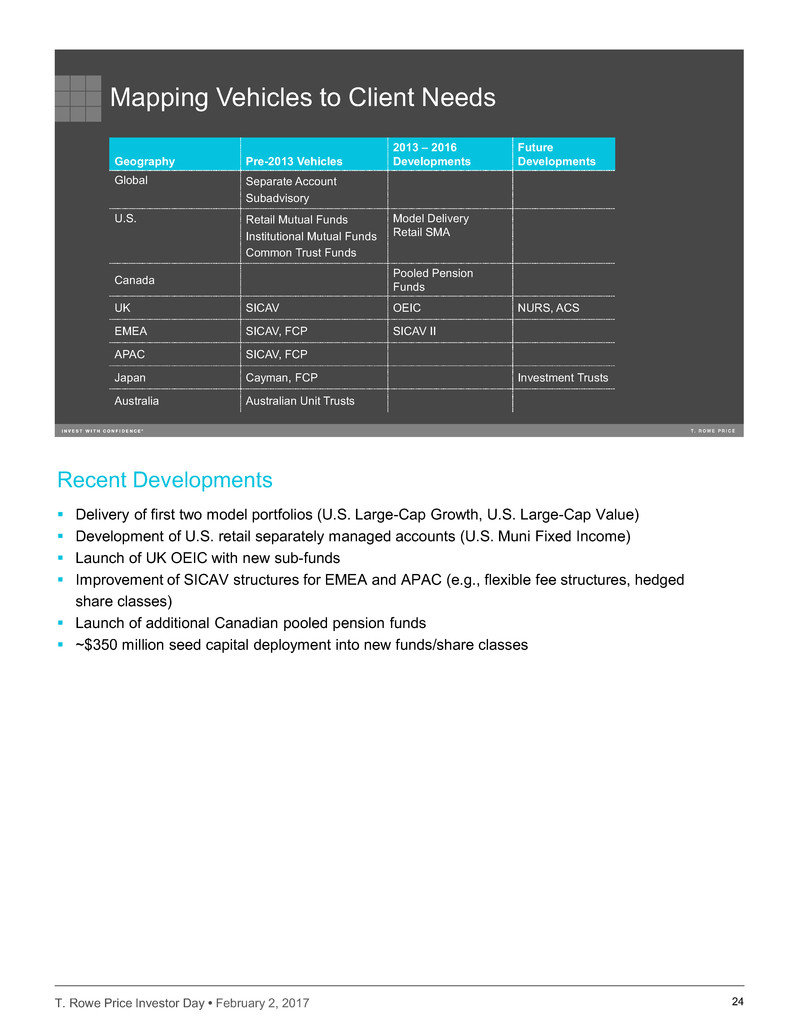
Mapping Vehicles to Client Needs
Geography Pre-2013 Vehicles
2013 – 2016
Developments
Future
Developments
Global Separate Account
Subadvisory
U.S. Retail Mutual Funds
Institutional Mutual Funds
Common Trust Funds
Model Delivery
Retail SMA
Canada Pooled PensionFunds
UK SICAV OEIC NURS, ACS
EMEA SICAV, FCP SICAV II
APAC SICAV, FCP
Japan Cayman, FCP Investment Trusts
Australia Australian Unit Trusts
24
Recent Developments
Delivery of first two model portfolios (U.S. Large-Cap Growth, U.S. Large-Cap Value)
Development of U.S. retail separately managed accounts (U.S. Muni Fixed Income)
Launch of UK OEIC with new sub-funds
Improvement of SICAV structures for EMEA and APAC (e.g., flexible fee structures, hedged
share classes)
Launch of additional Canadian pooled pension funds
~$350 million seed capital deployment into new funds/share classes
T. Rowe Price Investor Day • February 2, 2017 25
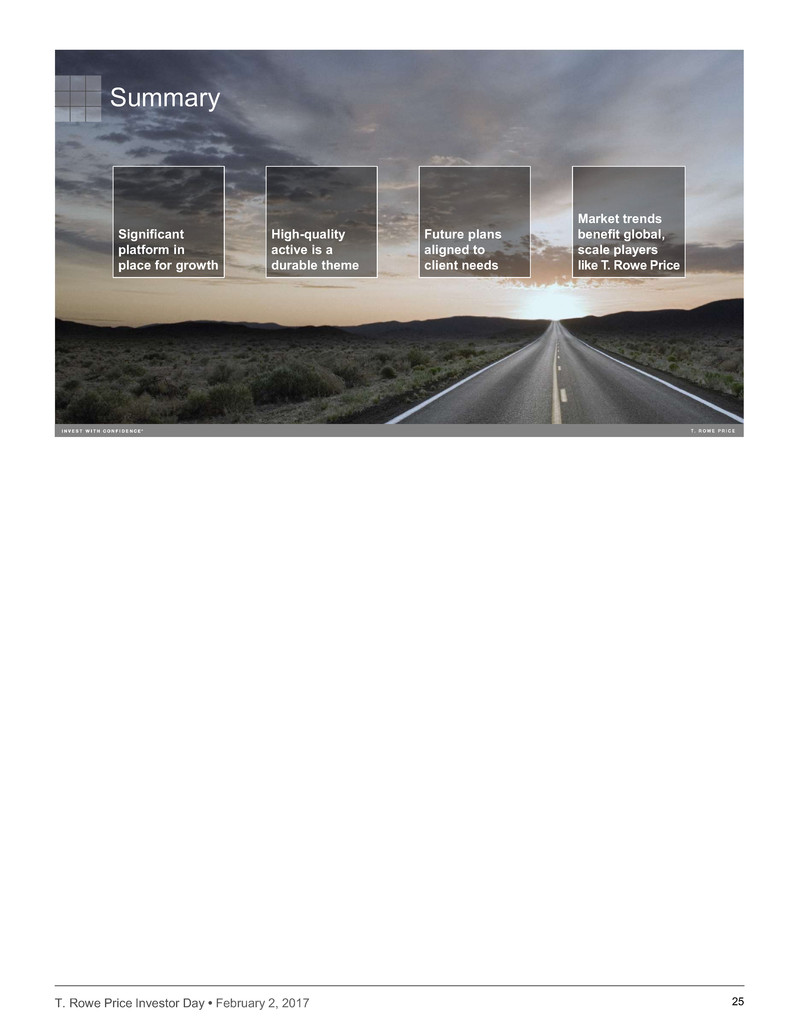
Summary
High-quality
active is a
durable theme
Future plans
aligned to
client needs
Significant
platform in
place for growth
Market trends
benefit global,
scale players
like T. Rowe Price
T. Rowe Price Investor Day • February 2, 2017 26
MULTI-ASSET
INVESTMENT
CAPABILITIES
T. Rowe Price Investor Day
February 2, 2017
Sebastien Page, CFA
Head of Asset Allocation
T. Rowe Price Investor Day • February 2, 2017 27
Year Product
1990 Formed the T. Rowe Price
Asset Allocation Committee
Spectrum Growth and
Spectrum Income Funds
1991 Balanced Fund
1994 Personal Strategy Funds
1996 Spectrum International Fund
2001 College Savings Plans
2002 Retirement Funds
The capabilities are already in place
Our performance has been consistently strong
Our product innovation historically has met the needs of our clients
We are approaching our strategic initiatives from a position of strength.
Year Product
2008 Retirement Hybrid Trusts
2010 Real Assets Fund
2012 Retirement Trusts
2013 Target Retirement Funds
Global Allocation Fund
2015 Managed Volatility Strategy
Retirement I Funds
2016 Global Allocation SICAV
27
As of December 31, 2016.
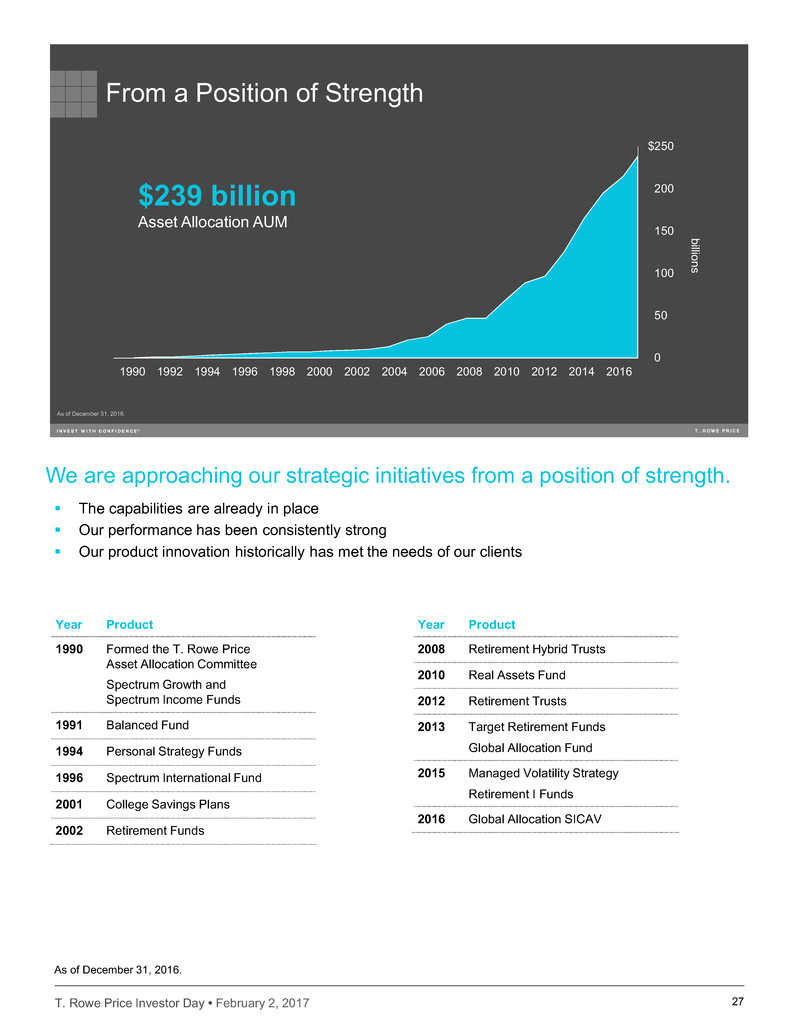
From a Position of Strength
$0
$50
$100
$150
$200
$250
1990 1992 1994 1996 1998 2000 2002 2004 2006 2008 2010 2012 2014 2016
$239 billion
Asset Allocation AUM
billions
As of December 31, 2016.
T. Rowe Price Investor Day • February 2, 2017 28
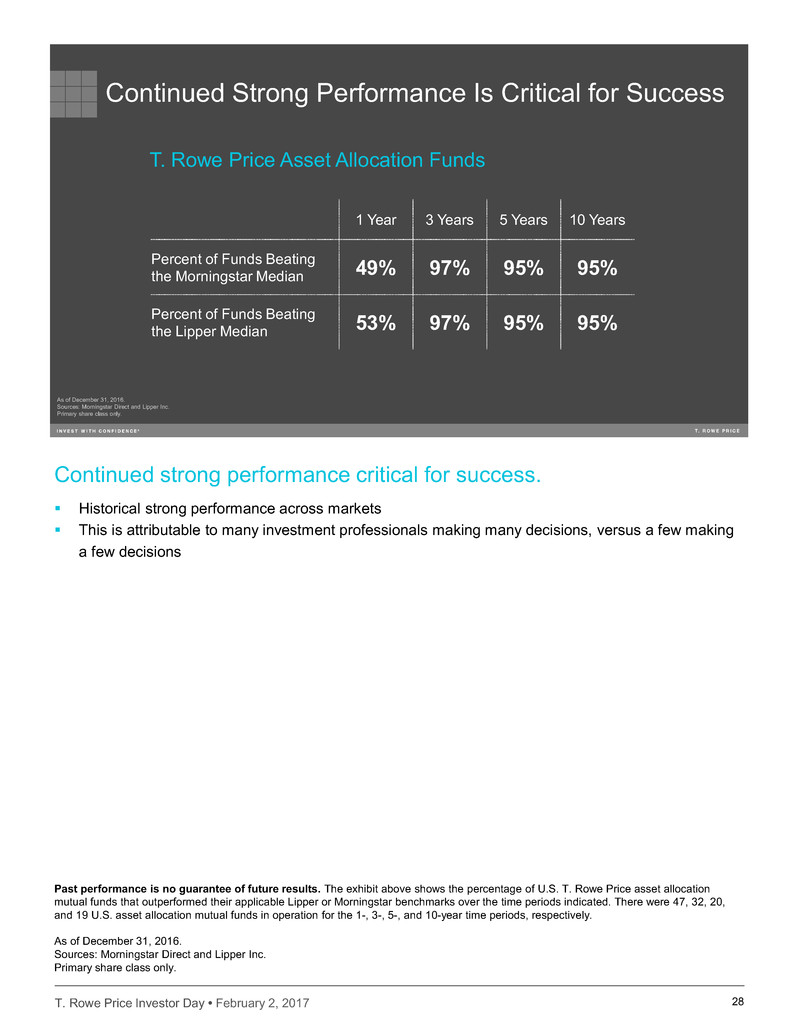
Historical strong performance across markets
This is attributable to many investment professionals making many decisions, versus a few making
a few decisions
Continued strong performance critical for success.
28
As of December 31, 2016.
Sources: Morningstar Direct and Lipper Inc.
Primary share class only.
Continued Strong Performance Is Critical for Success
T. Rowe Price Asset Allocation Funds
1 Year 3 Years 5 Years 10 Years
Percent of Funds Beating
the Morningstar Median 49% 97% 95% 95%
Percent of Funds Beating
the Lipper Median 53% 97% 95% 95%
Past performance is no guarantee of future results. The exhibit above shows the percentage of U.S. T. Rowe Price asset allocation
mutual funds that outperformed their applicable Lipper or Morningstar benchmarks over the time periods indicated. There were 47, 32, 20,
and 19 U.S. asset allocation mutual funds in operation for the 1-, 3-, 5-, and 10-year time periods, respectively.
As of December 31, 2016.
Sources: Morningstar Direct and Lipper Inc.
Primary share class only.
T. Rowe Price Investor Day • February 2, 2017 29
As of December 31, 2016.
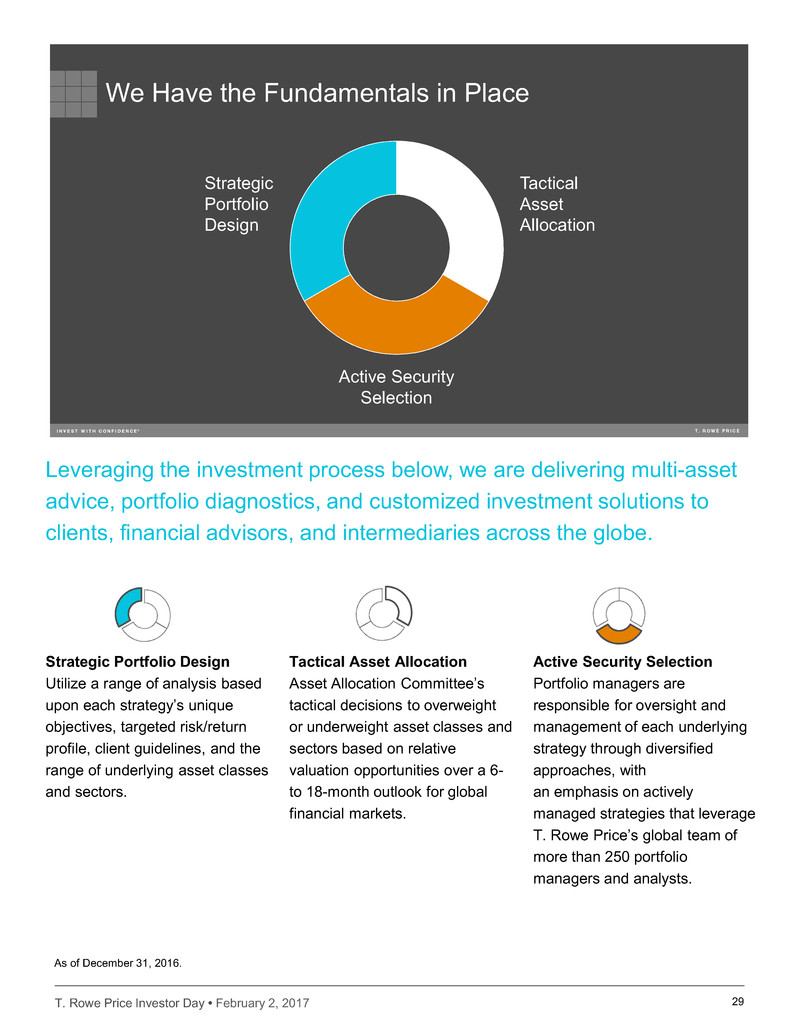
Leveraging the investment process below, we are delivering multi-asset
advice, portfolio diagnostics, and customized investment solutions to
clients, financial advisors, and intermediaries across the globe.
29
We Have the Fundamentals in Place
Strategic
Portfolio
Design
Tactical
Asset
Allocation
Active Security
Selection
Strategic Portfolio Design
Utilize a range of analysis based
upon each strategy’s unique
objectives, targeted risk/return
profile, client guidelines, and the
range of underlying asset classes
and sectors.
Tactical Asset Allocation
Asset Allocation Committee’s
tactical decisions to overweight
or underweight asset classes and
sectors based on relative
valuation opportunities over a 6-
to 18-month outlook for global
financial markets.
Active Security Selection
Portfolio managers are
responsible for oversight and
management of each underlying
strategy through diversified
approaches, with
an emphasis on actively
managed strategies that leverage
T. Rowe Price’s global team of
more than 250 portfolio
managers and analysts.
T. Rowe Price Investor Day • February 2, 2017 30
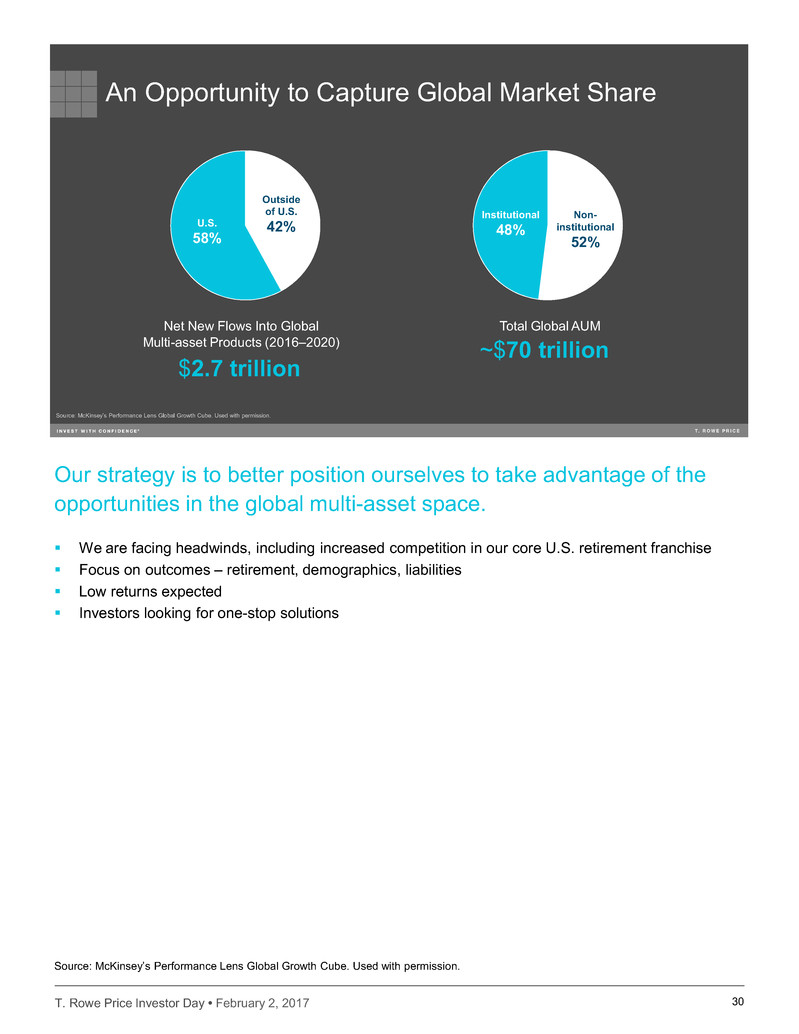
Our strategy is to better position ourselves to take advantage of the
opportunities in the global multi-asset space.
We are facing headwinds, including increased competition in our core U.S. retirement franchise
Focus on outcomes – retirement, demographics, liabilities
Low returns expected
Investors looking for one-stop solutions
30
An Opportunity to Capture Global Market Share
Net New Flows Into Global
Multi-asset Products (2016–2020)
Total Global AUM
Institutional
48%
Non-
institutional
52%
$2.7 trillion
~$70 trillion
Source: McKinsey’s Performance Lens Global Growth Cube. Used with permission.
U.S.
58%
Outside
of U.S.
42%
Source: McKinsey’s Performance Lens Global Growth Cube. Used with permission.
T. Rowe Price Investor Day • February 2, 2017 31
31
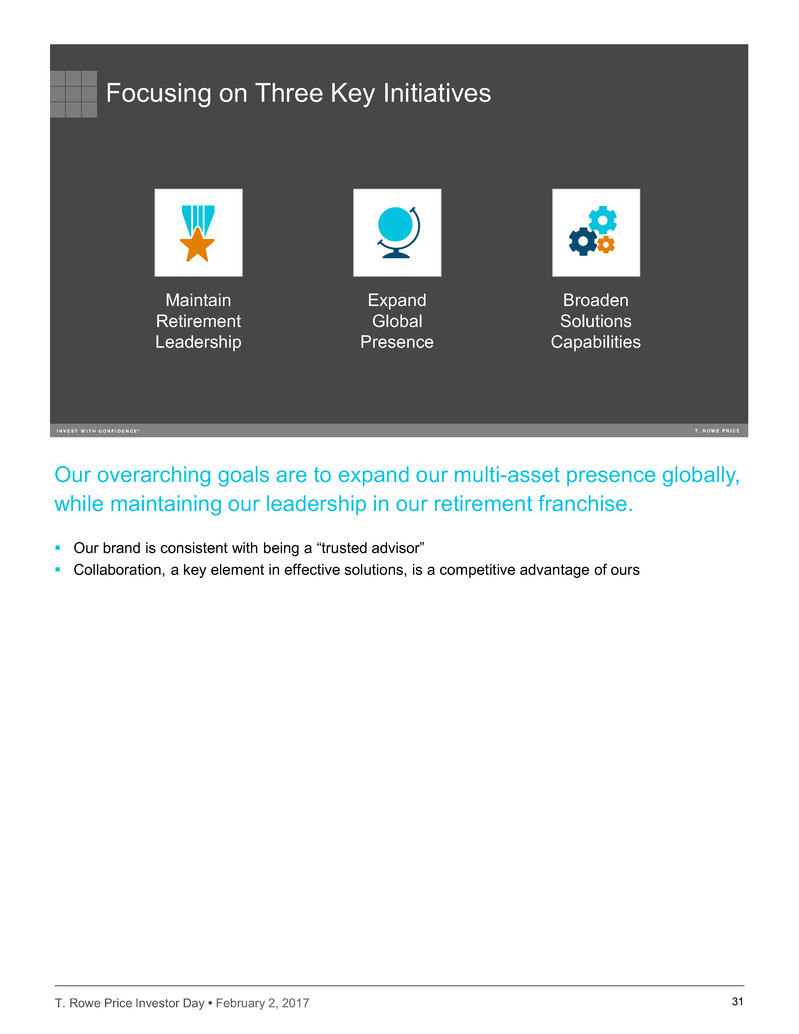
Focusing on Three Key Initiatives
Maintain
Retirement
Leadership
Expand
Global
Presence
Broaden
Solutions
Capabilities
Our overarching goals are to expand our multi-asset presence globally,
while maintaining our leadership in our retirement franchise.
Our brand is consistent with being a “trusted advisor”
Collaboration, a key element in effective solutions, is a competitive advantage of ours
T. Rowe Price Investor Day • February 2, 2017 32
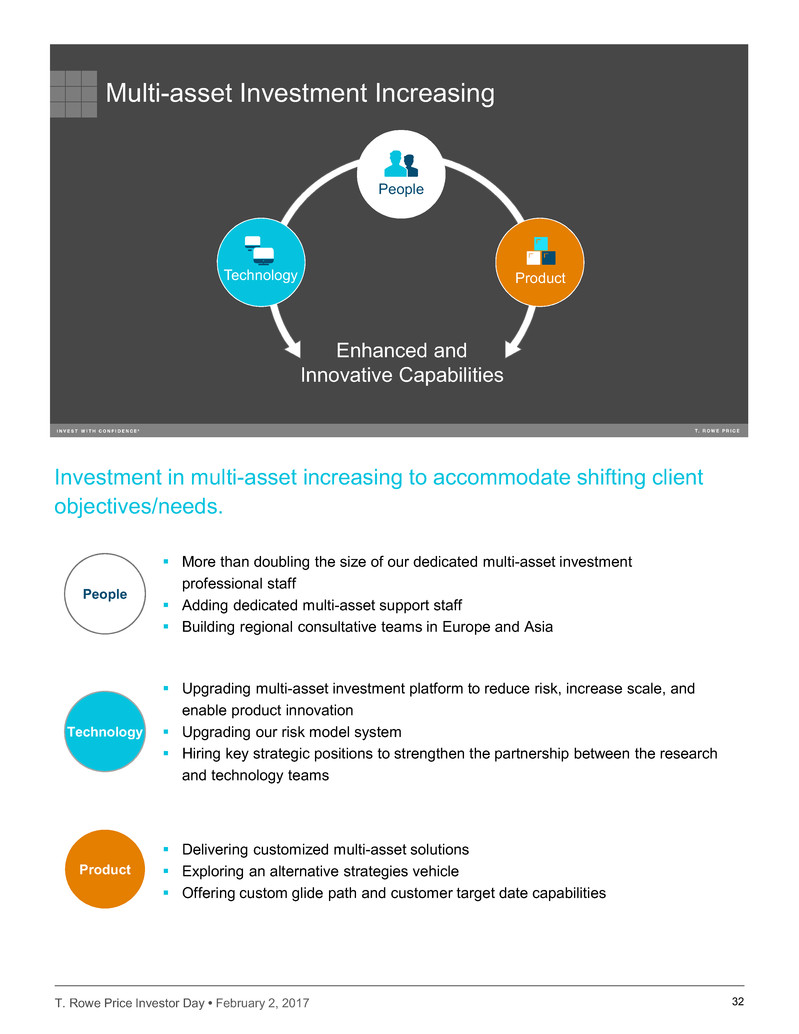
Product
Delivering customized multi-asset solutions
Exploring an alternative strategies vehicle
Offering custom glide path and customer target date capabilities
Technology
Upgrading multi-asset investment platform to reduce risk, increase scale, and
enable product innovation
Upgrading our risk model system
Hiring key strategic positions to strengthen the partnership between the research
and technology teams
People
More than doubling the size of our dedicated multi-asset investment
professional staff
Adding dedicated multi-asset support staff
Building regional consultative teams in Europe and Asia
Investment in multi-asset increasing to accommodate shifting client
objectives/needs.
32
Multi-asset Investment Increasing
ProductTechnology
People
Enhanced and
Innovative Capabilities
T. Rowe Price Investor Day • February 2, 2017 33
33
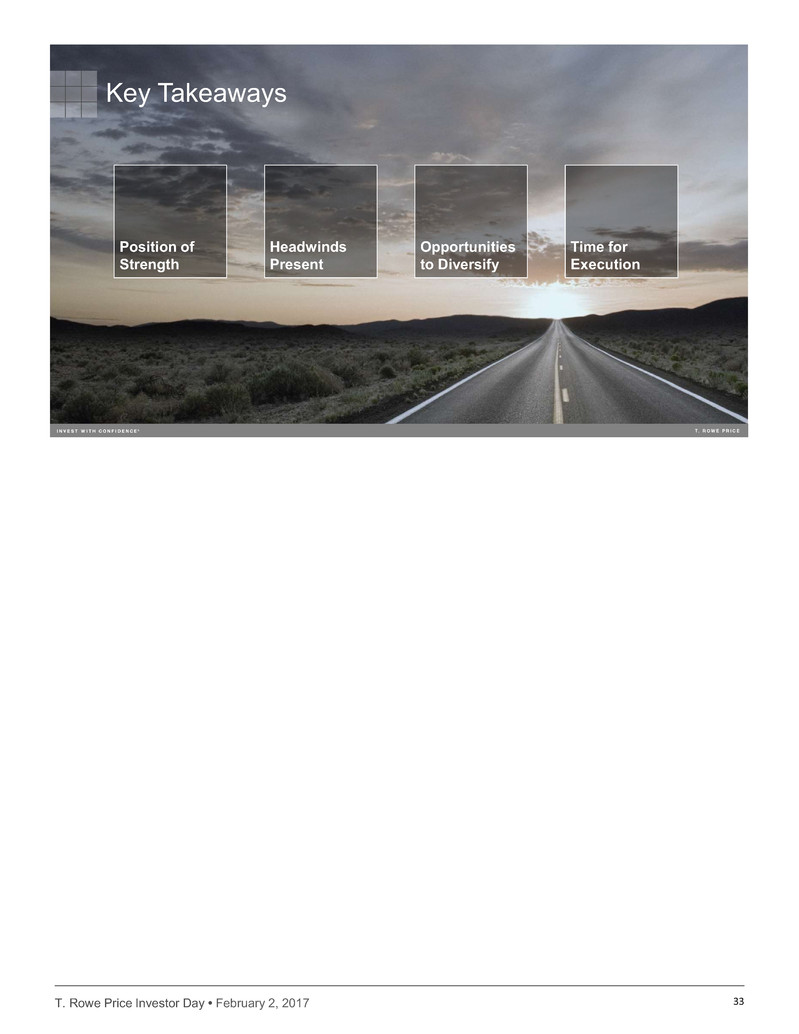
Key Takeaways
Headwinds
Present
Opportunities
to Diversify
Position of
Strength
Time for
Execution
T. Rowe Price Investor Day • February 2, 2017 34
INDIVIDUAL AND
RETIREMENT
PLAN SERVICES
T. Rowe Price Investor Day
February 2, 2017
Scott David,
Head of Individual and Retirement Plan Services
T. Rowe Price Investor Day • February 2, 2017
35
U.S. Individual & Retirement Plan Services
T. Rowe Price
U.S. Plan
Sponsors
Global
Institutions
Individual Investors
U.S.
Financial
Intermediaries
EMEA & APAC
Financial
IntermediariesDirect
35
T. Rowe Price Investor Day • February 2, 2017 36
Products
Investment capabilities
Historically strong
performance
Distribution
Client segments
Products and vehicles
Technology
Operating scale
Digital transformation
36
Investing for the Future
Products
Technology
Distribution
IRPS
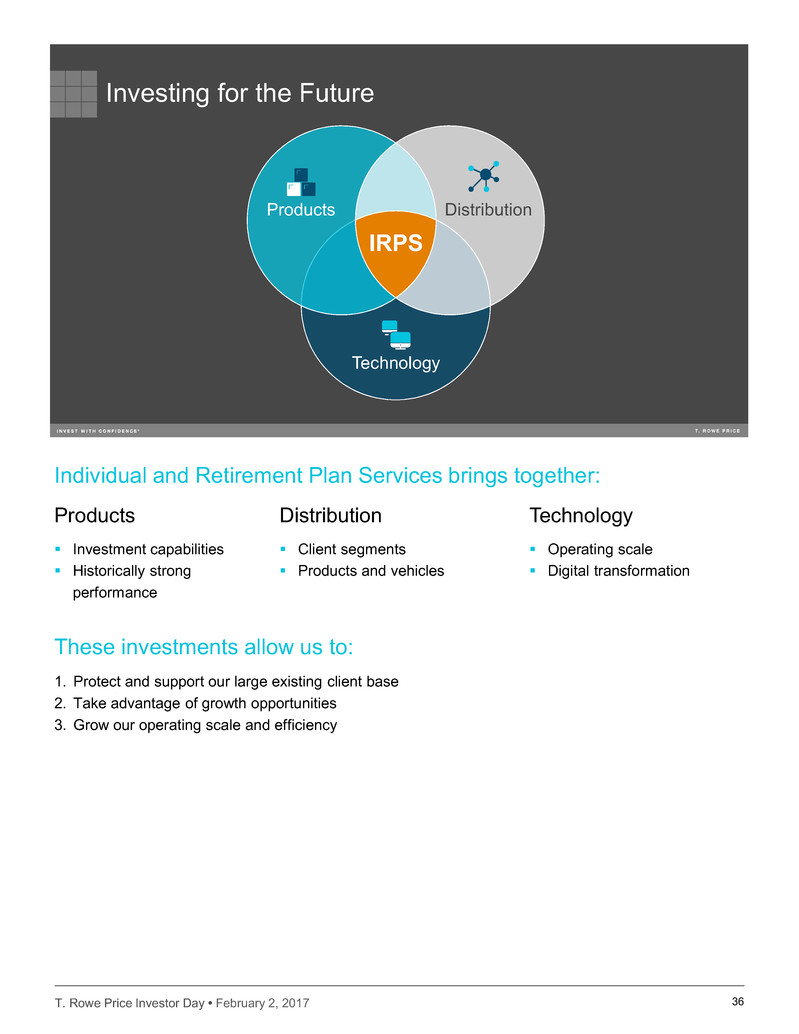
Individual and Retirement Plan Services brings together:
These investments allow us to:
1. Protect and support our large existing client base
2. Take advantage of growth opportunities
3. Grow our operating scale and efficiency
T. Rowe Price Investor Day • February 2, 2017 37
37
T. Rowe Price data as of December 31, 2016.
Industry plan category definitions: Mega – participant base over 5,000; large – participant base between 1,000 and 4,999; medium – participant base between 500 and 999; small – participant base between 100 and 499; micro – participant base below 100
Source: McKinsey’s Performance Lens Global Growth Cube. Used with permission.
Retirement Plan Services Business and Opportunities
0.5%–3%
4.5%–
5.5%
6%–7%
6.5%–
7.5%
Large & Mega Medium Small & Micro Education
3,600 plans
1.9 million participants
$156 billion AUA
$100 billion AUM
Projected Industry AUM CAGR 2015–2020
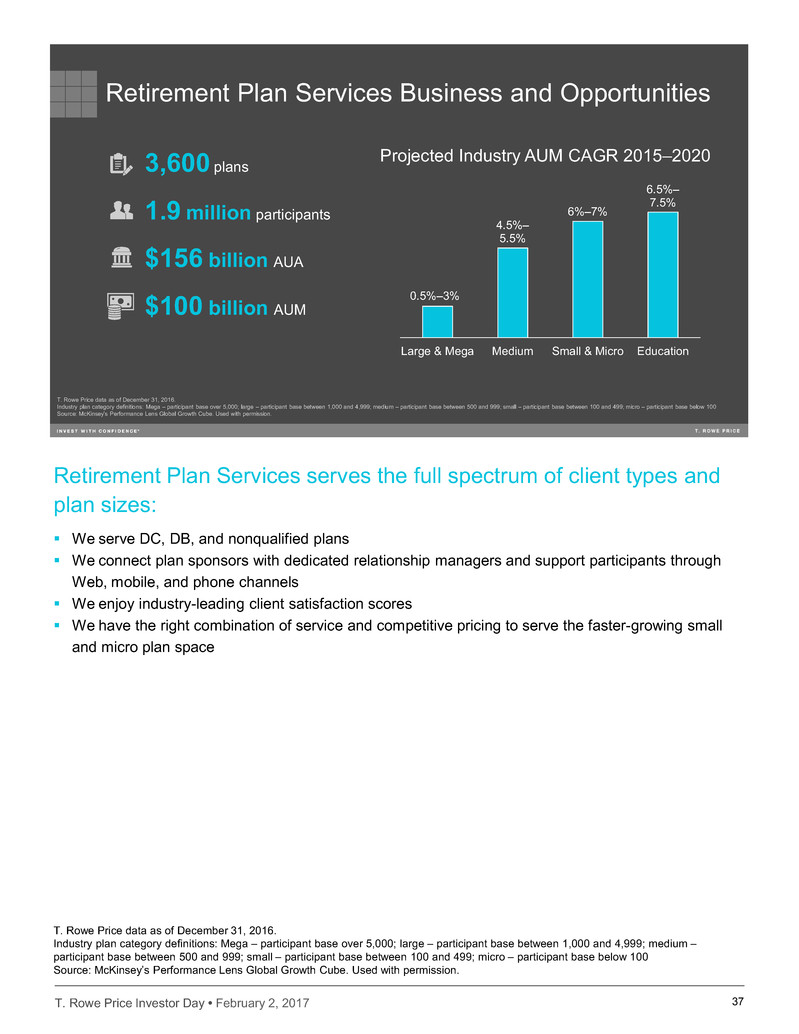
Retirement Plan Services serves the full spectrum of client types and
plan sizes:
We serve DC, DB, and nonqualified plans
We connect plan sponsors with dedicated relationship managers and support participants through
Web, mobile, and phone channels
We enjoy industry-leading client satisfaction scores
We have the right combination of service and competitive pricing to serve the faster-growing small
and micro plan space
T. Rowe Price data as of December 31, 2016.
Industry plan category definitions: Mega – participant base over 5,000; large – participant base between 1,000 and 4,999; medium –
participant base between 500 and 999; small – participant base between 100 and 499; micro – participant base below 100
Source: McKinsey’s Performance Lens Global Growth Cube. Used with permission.

T. Rowe Price Investor Day • February 2, 2017 38
We are focused on capturing the biggest opportunities:
Bring together recordkeeping, sponsor and participant support, and strong asset management
capabilities to drive better outcomes for individuals
Expand our sales teams in a targeted way
Example: We are significantly expanding our small market sales and marketing efforts, along with
targeted hiring for our large and mega plan team.
Continue our multiyear commitment to invest in our technology platform to both increase operating
efficiency and deliver better client outcomes
Deliver innovative enhancements to the client experience across channels so they can engage with
us when and how they choose
Example: Marrying client account data with animation to deliver personalized, engaging video
experiences that encourage clients to take action on areas like asset allocation or increasing
contribution rates.
38
Products
Capture the asset
management
opportunity
Capturing Opportunities in Retirement Plan Services
Distribution
Retain current
clients
Invest in talent to
accelerate growth
in key segments
Technology
Operational scale
Plan sponsor digital
experience
Participant digital
experience
T. Rowe Price Investor Day • February 2, 2017 39
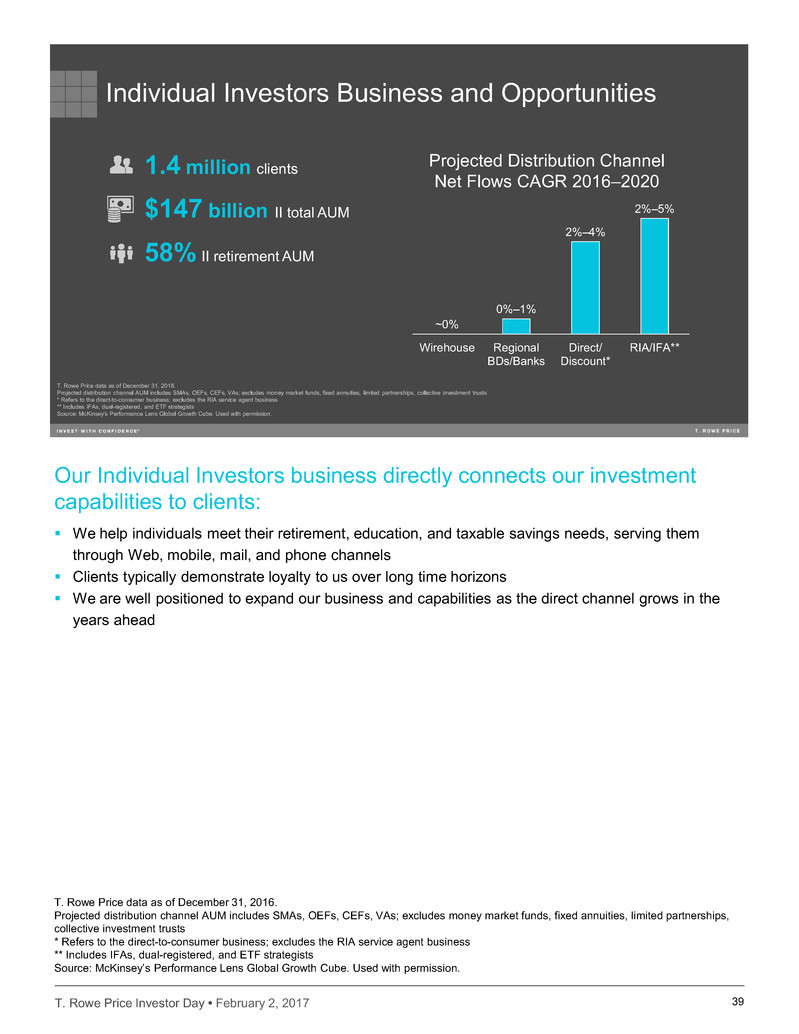
Our Individual Investors business directly connects our investment
capabilities to clients:
We help individuals meet their retirement, education, and taxable savings needs, serving them
through Web, mobile, mail, and phone channels
Clients typically demonstrate loyalty to us over long time horizons
We are well positioned to expand our business and capabilities as the direct channel grows in the
years ahead
39
T. Rowe Price data as of December 31, 2016.
Projected distribution channel AUM includes SMAs, OEFs, CEFs, VAs; excludes money market funds, fixed annuities, limited partnerships, collective investment trusts
* Refers to the direct-to-consumer business; excludes the RIA service agent business
** Includes IFAs, dual-registered, and ETF strategists
Source: McKinsey’s Performance Lens Global Growth Cube. Used with permission.
Individual Investors Business and Opportunities
58% II retirement AUM
1.4 million clients
$147 billion II total AUM
~0%
0%–1%
2%–4%
2%–5%
Wirehouse Regional
BDs/Banks
Direct/
Discount*
RIA/IFA**
Projected Distribution Channel
Net Flows CAGR 2016–2020
T. Rowe Price data as of December 31, 2016.
Projected distribution channel AUM includes SMAs, OEFs, CEFs, VAs; excludes money market funds, fixed annuities, limited partnerships,
collective investment trusts
* Refers to the direct-to-consumer business; excludes the RIA service agent business
** Includes IFAs, dual-registered, and ETF strategists
Source: McKinsey’s Performance Lens Global Growth Cube. Used with permission.
T. Rowe Price Investor Day • February 2, 2017 40
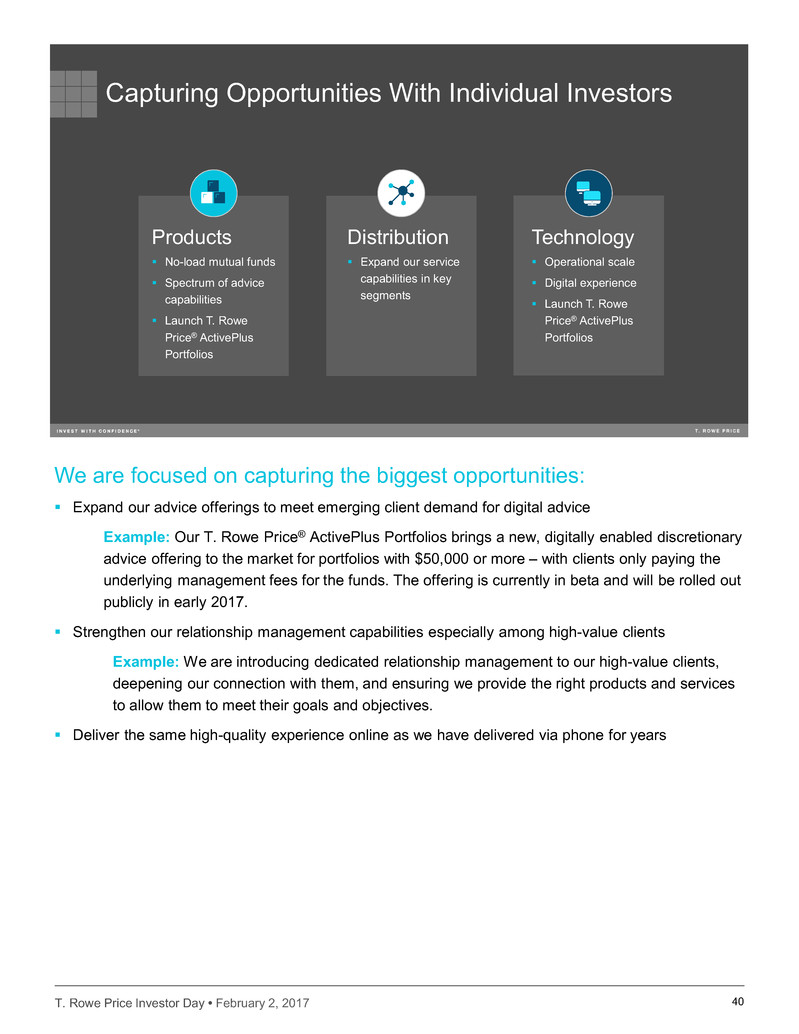
We are focused on capturing the biggest opportunities:
Expand our advice offerings to meet emerging client demand for digital advice
Example: Our T. Rowe Price® ActivePlus Portfolios brings a new, digitally enabled discretionary
advice offering to the market for portfolios with $50,000 or more – with clients only paying the
underlying management fees for the funds. The offering is currently in beta and will be rolled out
publicly in early 2017.
Strengthen our relationship management capabilities especially among high-value clients
Example: We are introducing dedicated relationship management to our high-value clients,
deepening our connection with them, and ensuring we provide the right products and services
to allow them to meet their goals and objectives.
Deliver the same high-quality experience online as we have delivered via phone for years
40
Products
No-load mutual funds
Spectrum of advice
capabilities
Launch T. Rowe
Price® ActivePlus
Portfolios
Capturing Opportunities With Individual Investors
Distribution
Expand our service
capabilities in key
segments
Technology
Operational scale
Digital experience
Launch T. Rowe
Price® ActivePlus
Portfolios
T. Rowe Price Investor Day • February 2, 2017 41
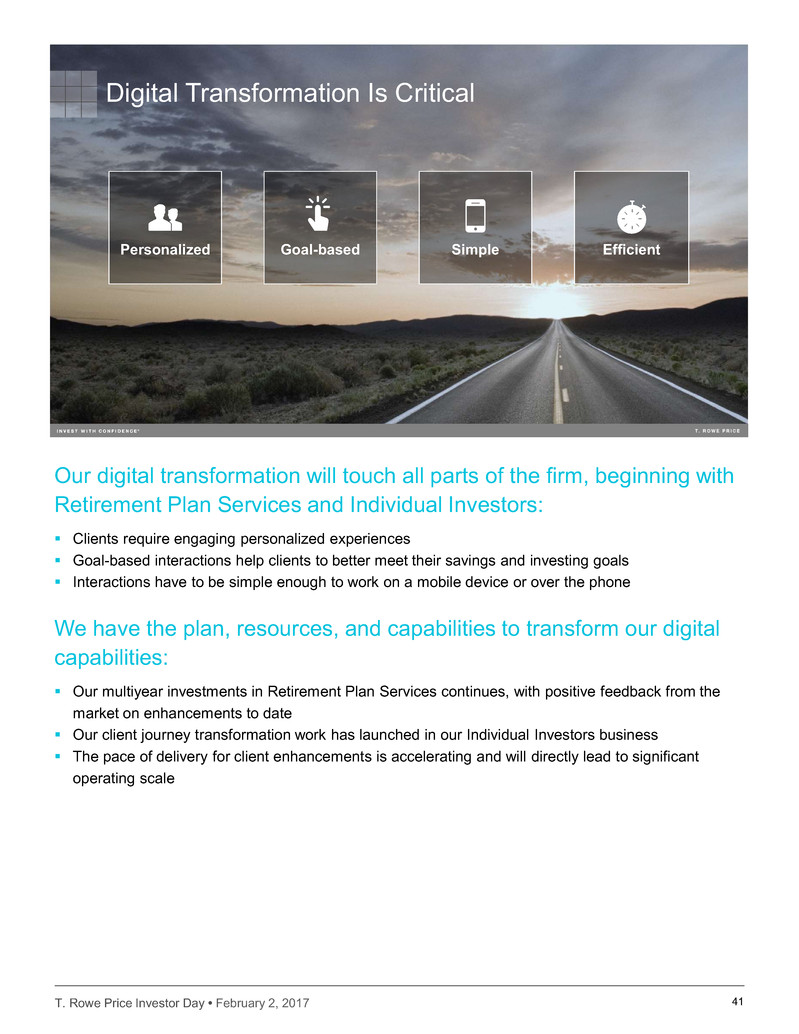
Our digital transformation will touch all parts of the firm, beginning with
Retirement Plan Services and Individual Investors:
Clients require engaging personalized experiences
Goal-based interactions help clients to better meet their savings and investing goals
Interactions have to be simple enough to work on a mobile device or over the phone
We have the plan, resources, and capabilities to transform our digital
capabilities:
Our multiyear investments in Retirement Plan Services continues, with positive feedback from the
market on enhancements to date
Our client journey transformation work has launched in our Individual Investors business
The pace of delivery for client enhancements is accelerating and will directly lead to significant
operating scale
41
Digital Transformation Is Critical
Goal-based SimplePersonalized Efficient
T. Rowe Price Investor Day • February 2, 2017
U.S.
INTERMEDIARIES
T. Rowe Price Investor Day
February 2, 2017
George Riedel,
Head of U.S. Intermediaries
42
T. Rowe Price Investor Day • February 2, 2017
U.S. Intermediaries
T. Rowe Price
U.S. Plan
Sponsors
Global
Institutions
Individual Investors
U.S.
Financial
Intermediaries
EMEA & APAC
Financial
IntermediariesDirect
43
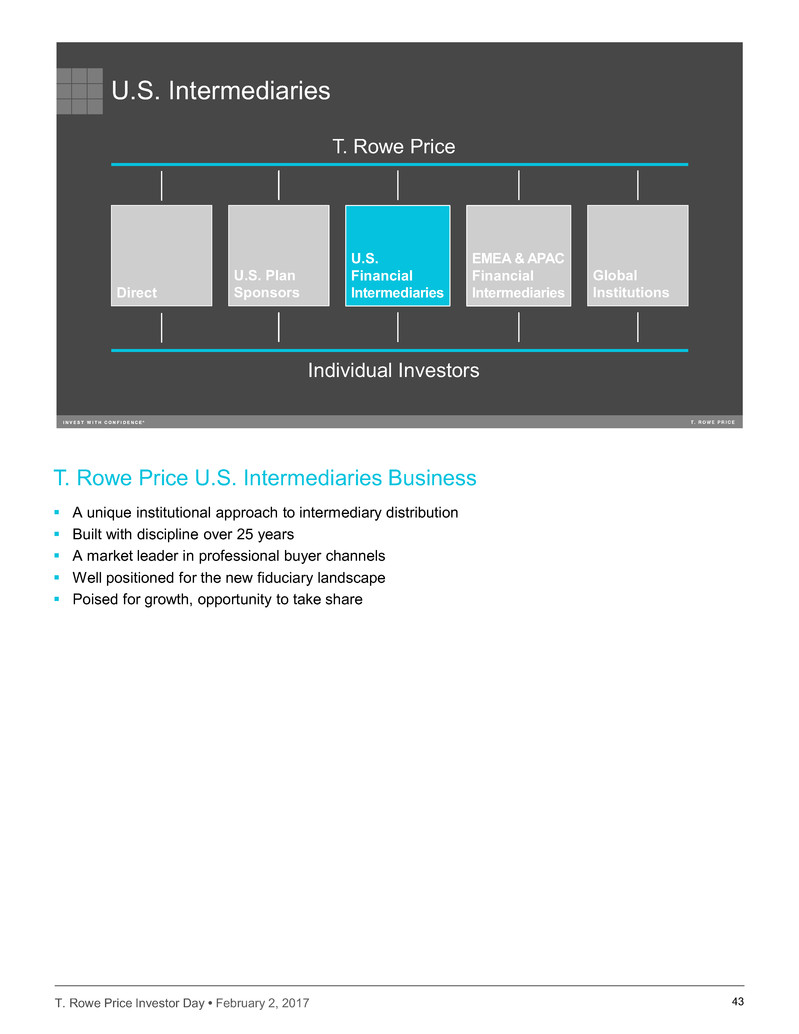
T. Rowe Price U.S. Intermediaries Business
A unique institutional approach to intermediary distribution
Built with discipline over 25 years
A market leader in professional buyer channels
Well positioned for the new fiduciary landscape
Poised for growth, opportunity to take share
T. Rowe Price Investor Day • February 2, 2017 44
Broker/Dealers
Banks
Registered
Investment Advisors
Platform Services
Defined Contribution
Retirement Plans
(investment only)
Insurance
The U.S. Intermediary Landscape
Where We’ve Come From
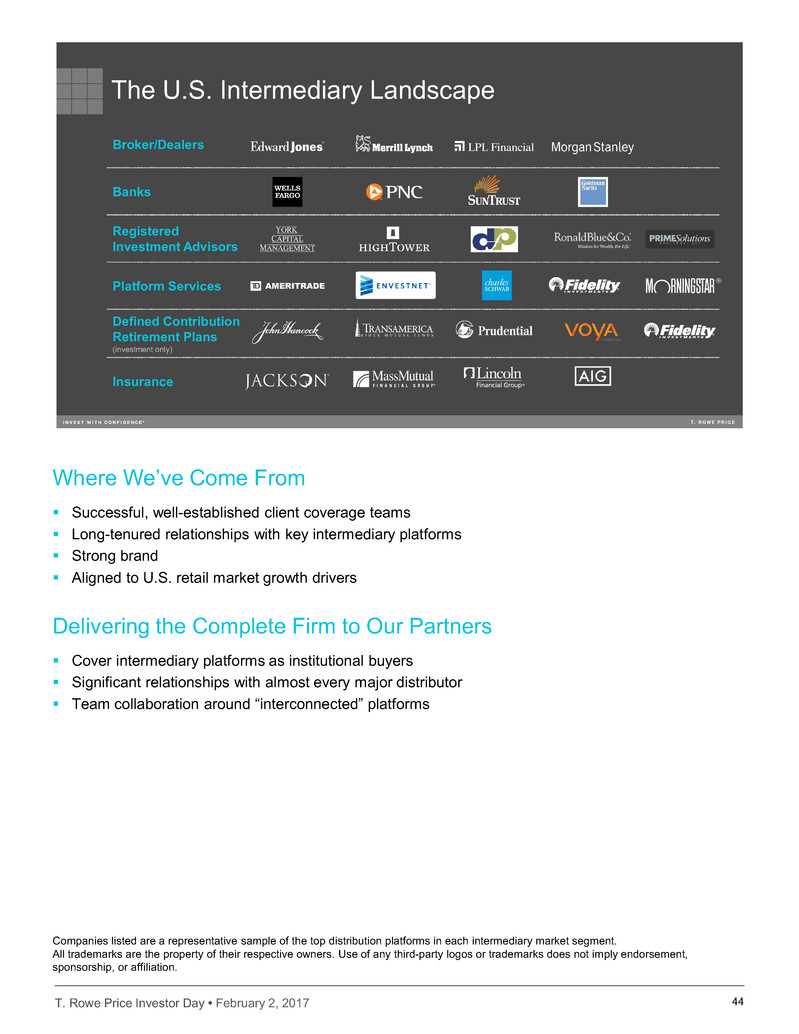
Successful, well-established client coverage teams
Long-tenured relationships with key intermediary platforms
Strong brand
Aligned to U.S. retail market growth drivers
Delivering the Complete Firm to Our Partners
Cover intermediary platforms as institutional buyers
Significant relationships with almost every major distributor
Team collaboration around “interconnected” platforms
Companies listed are a representative sample of the top distribution platforms in each intermediary market segment.
All trademarks are the property of their respective owners. Use of any third-party logos or trademarks does not imply endorsement,
sponsorship, or affiliation.
T. Rowe Price Investor Day • February 2, 2017 45
Sources: Cerulli Associates, U.S. Managed Account Quantitative Update, 2015; T. Rowe Price estimates.
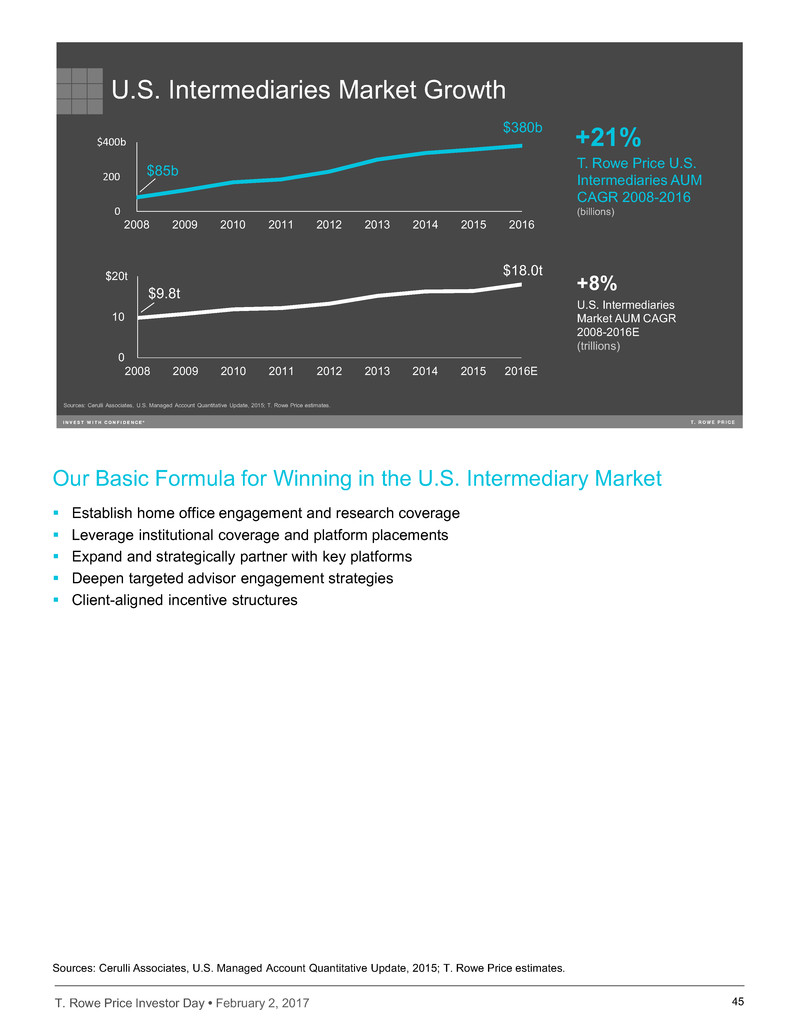
U.S. Intermediaries Market Growth
$0t
$10t
$20t
2008 2009 2010 2011 2012 2013 2014 2015 2016E
+21%
+8%
U.S. Intermediaries
Market AUM CAGR
2008-2016E
(trillions)
T. Rowe Price U.S.
Intermediaries AUM
CAGR 2008-2016
(billions)$0b
$200b
$400b
2008 2009 2010 2011 2012 2013 2014 2015 2016
$380b
$85b
$18.0t
$9.8t
Our Basic Formula for Winning in the U.S. Intermediary Market
Establish home office engagement and research coverage
Leverage institutional coverage and platform placements
Expand and strategically partner with key platforms
Deepen targeted advisor engagement strategies
Client-aligned incentive structures
Sources: Cerulli Associates, U.S. Managed Account Quantitative Update, 2015; T. Rowe Price estimates.
T. Rowe Price Investor Day • February 2, 2017 46
Industry AUM by account type from 2007 to 2015
T. Rowe Price U.S. Intermediaries Nonretirement AUM as of December 31, 2016.
Sources: Cerulli Associates, T. Rowe Price estimates
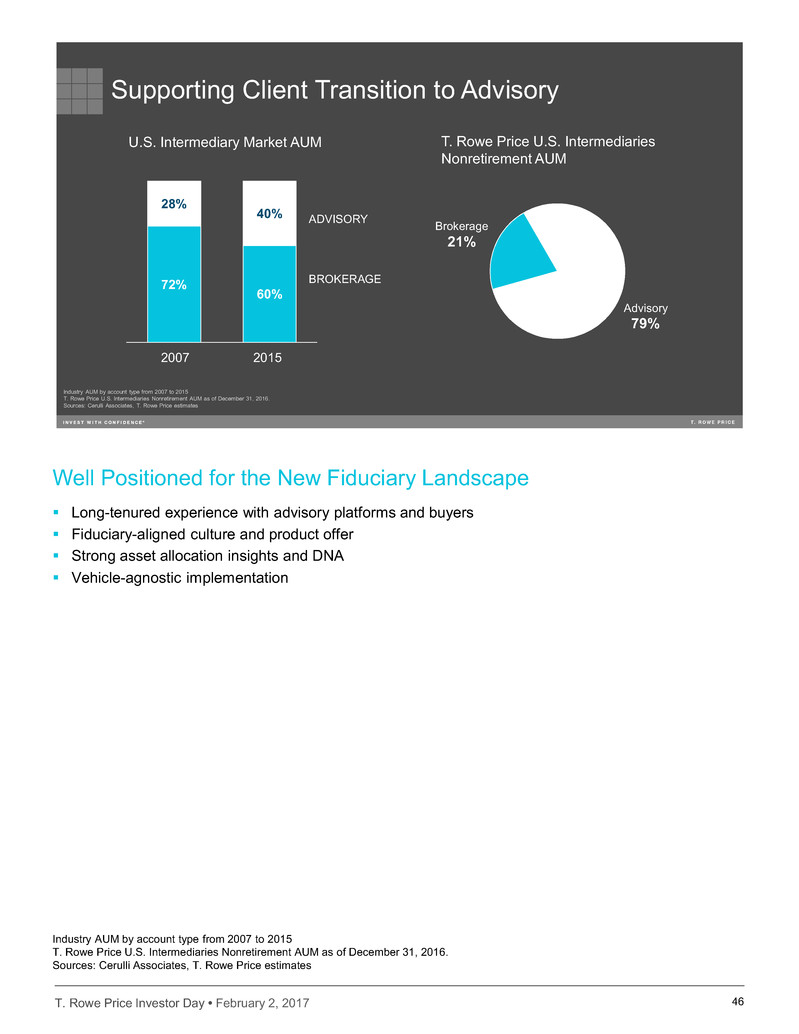
Supporting Client Transition to Advisory
Advisory
79%
U.S. Intermediary Market AUM
72%
60%
28%
40% ADVISORY
BROKERAGE
T. Rowe Price U.S. Intermediaries
Nonretirement AUM
Brokerage
21%
2007 2015
Well Positioned for the New Fiduciary Landscape
Long-tenured experience with advisory platforms and buyers
Fiduciary-aligned culture and product offer
Strong asset allocation insights and DNA
Vehicle-agnostic implementation
Industry AUM by account type from 2007 to 2015
T. Rowe Price U.S. Intermediaries Nonretirement AUM as of December 31, 2016.
Sources: Cerulli Associates, T. Rowe Price estimates
T. Rowe Price Investor Day • February 2, 2017
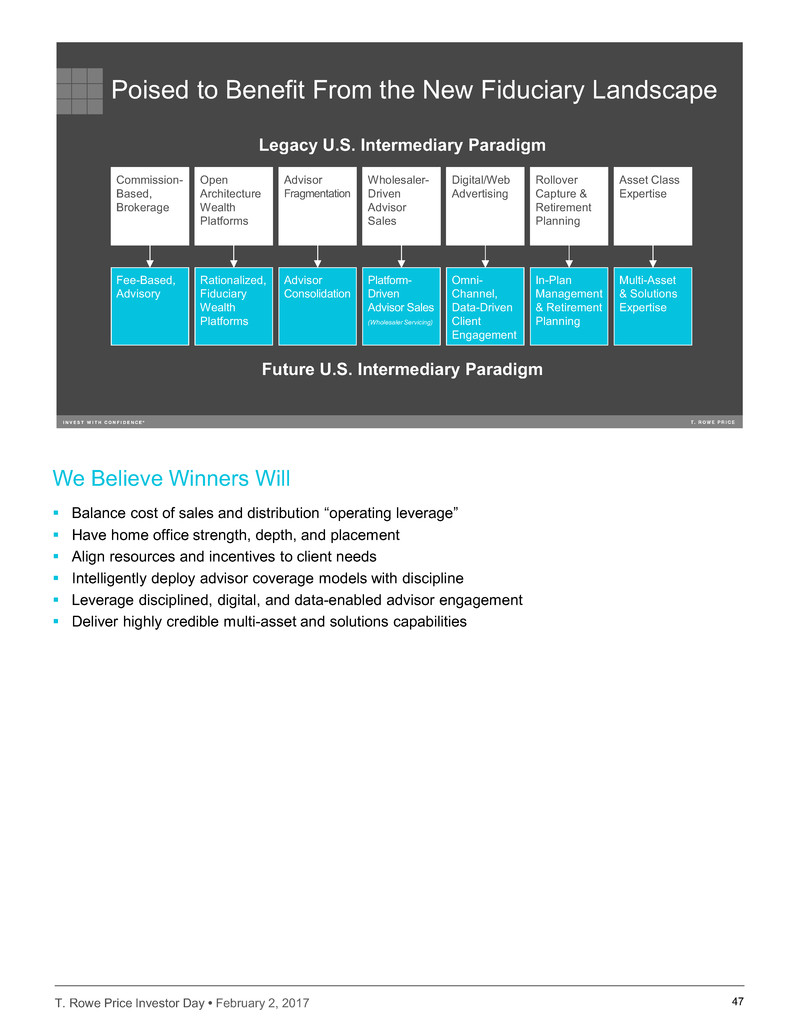
Poised to Benefit From the New Fiduciary Landscape
Fee-Based,
Advisory
Rationalized,
Fiduciary
Wealth
Platforms
Platform-
Driven
Advisor Sales
(Wholesaler Servicing)
In-Plan
Management
& Retirement
Planning
Advisor
Consolidation
Omni-
Channel,
Data-Driven
Client
Engagement
Multi-Asset
& Solutions
Expertise
Commission-
Based,
Brokerage
Open
Architecture
Wealth
Platforms
Wholesaler-
Driven
Advisor
Sales
Rollover
Capture &
Retirement
Planning
Advisor
Fragmentation
Digital/Web
Advertising
Asset Class
Expertise
Legacy U.S. Intermediary Paradigm
Future U.S. Intermediary Paradigm
47
We Believe Winners Will
Balance cost of sales and distribution “operating leverage”
Have home office strength, depth, and placement
Align resources and incentives to client needs
Intelligently deploy advisor coverage models with discipline
Leverage disciplined, digital, and data-enabled advisor engagement
Deliver highly credible multi-asset and solutions capabilities
T. Rowe Price Investor Day • February 2, 2017 48
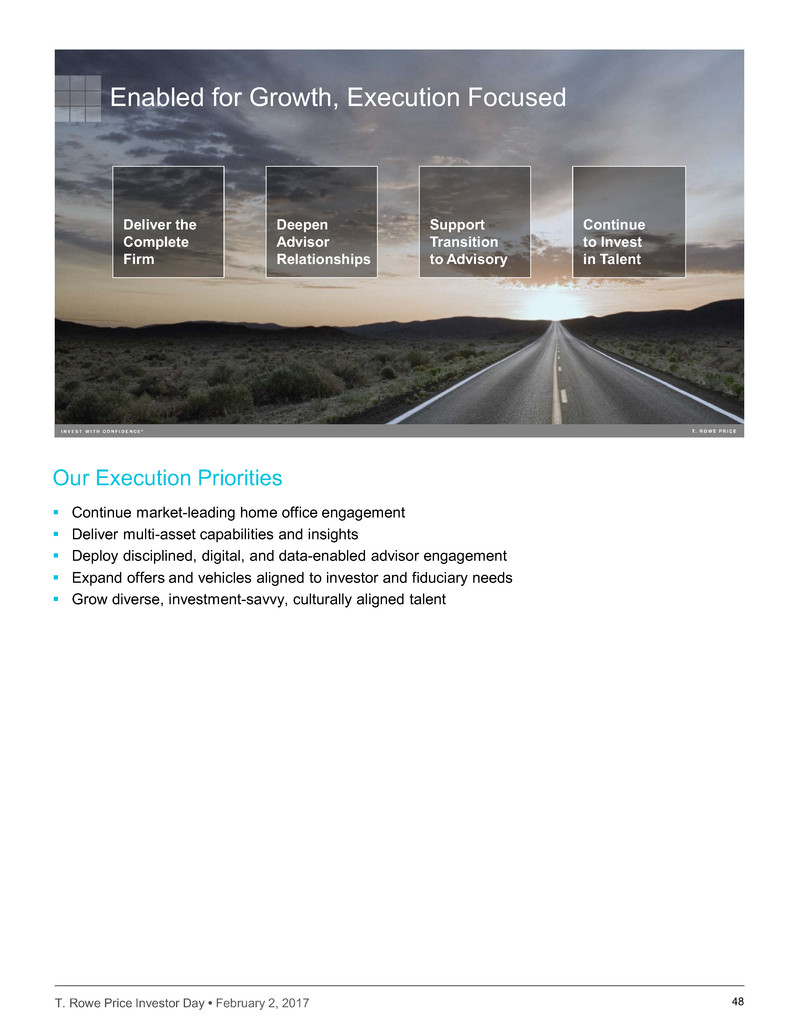
Enabled for Growth, Execution Focused
Deepen
Advisor
Relationships
Support
Transition
to Advisory
Deliver the
Complete
Firm
Continue
to Invest
in Talent
Our Execution Priorities
Continue market-leading home office engagement
Deliver multi-asset capabilities and insights
Deploy disciplined, digital, and data-enabled advisor engagement
Expand offers and vehicles aligned to investor and fiduciary needs
Grow diverse, investment-savvy, culturally aligned talent
T. Rowe Price Investor Day • February 2, 2017
GLOBAL
INVESTMENT
SERVICES
T. Rowe Price Investor Day
February 2, 2017
Robert Higginbotham,
Head of Global Investment Services
49
T. Rowe Price Investor Day • February 2, 2017
Global Investment Services
T. Rowe Price
U.S. Plan
Sponsors
Global
Institutions
Individual Investors
U.S.
Financial
Intermediaries
EMEA & APAC
Financial
IntermediariesDirect
50
T. Rowe Price Investor Day • February 2, 2017
Opportunity
$4,147b
$1,465b
$59,225b AUM
Source: McKinsey’s Performance Lens Global Growth Cube. Used with permission.
Developed
Markets
$249b $291b
$33,817b AUM
$201b $263b
$3,421b AUM
North America Japan
$20,433b AUM $1,554b AUM
Western Europe Australia
$3,354b
$776b $343b $135b
2015 net flows by region, includes money market
2009–2015 net flows by region, includes money market
$5,412b AUM
Asia
Other Emerging
Markets
$3,484b AUM
$376b
$37b
$2,203b
$869b
$8,896b AUM
Emerging
Markets
$2,579b
$906b
51
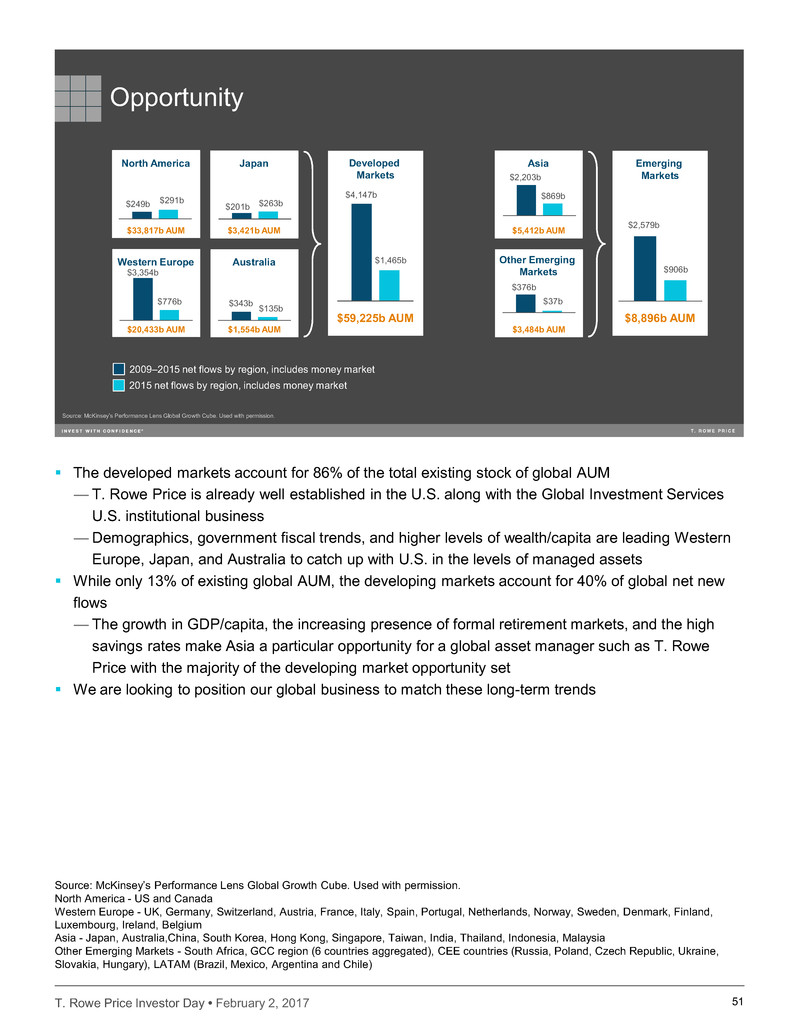
The developed markets account for 86% of the total existing stock of global AUM
— T. Rowe Price is already well established in the U.S. along with the Global Investment Services
U.S. institutional business
— Demographics, government fiscal trends, and higher levels of wealth/capita are leading Western
Europe, Japan, and Australia to catch up with U.S. in the levels of managed assets
While only 13% of existing global AUM, the developing markets account for 40% of global net new
flows
— The growth in GDP/capita, the increasing presence of formal retirement markets, and the high
savings rates make Asia a particular opportunity for a global asset manager such as T. Rowe
Price with the majority of the developing market opportunity set
We are looking to position our global business to match these long-term trends
Source: McKinsey’s Performance Lens Global Growth Cube. Used with permission.
North America - US and Canada
Western Europe - UK, Germany, Switzerland, Austria, France, Italy, Spain, Portugal, Netherlands, Norway, Sweden, Denmark, Finland,
Luxembourg, Ireland, Belgium
Asia - Japan, Australia,China, South Korea, Hong Kong, Singapore, Taiwan, India, Thailand, Indonesia, Malaysia
Other Emerging Markets - South Africa, GCC region (6 countries aggregated), CEE countries (Russia, Poland, Czech Republic, Ukraine,
Slovakia, Hungary), LATAM (Brazil, Mexico, Argentina and Chile)
T. Rowe Price Investor Day • February 2, 2017
Market Trends
Continued DC
Growth in More
Developed
Markets
Exploration of
In-House Asset
Management
Institutionalization
of the Buying
Process
Regulatory
Pressure
52
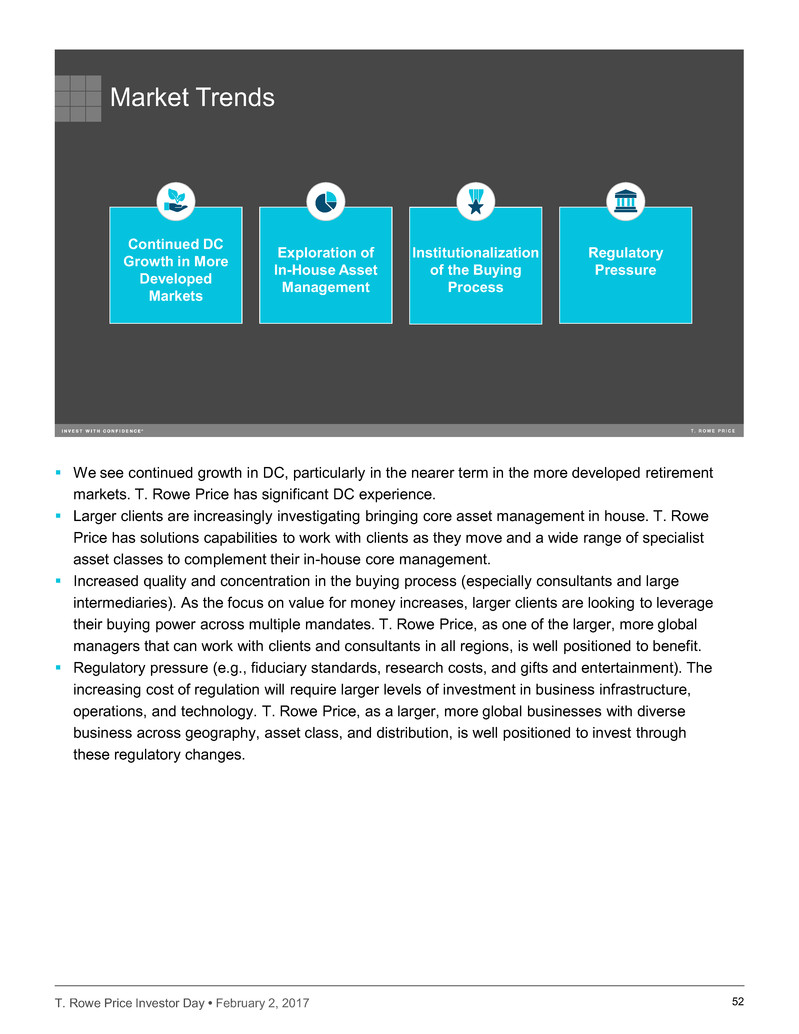
We see continued growth in DC, particularly in the nearer term in the more developed retirement
markets. T. Rowe Price has significant DC experience.
Larger clients are increasingly investigating bringing core asset management in house. T. Rowe
Price has solutions capabilities to work with clients as they move and a wide range of specialist
asset classes to complement their in-house core management.
Increased quality and concentration in the buying process (especially consultants and large
intermediaries). As the focus on value for money increases, larger clients are looking to leverage
their buying power across multiple mandates. T. Rowe Price, as one of the larger, more global
managers that can work with clients and consultants in all regions, is well positioned to benefit.
Regulatory pressure (e.g., fiduciary standards, research costs, and gifts and entertainment). The
increasing cost of regulation will require larger levels of investment in business infrastructure,
operations, and technology. T. Rowe Price, as a larger, more global businesses with diverse
business across geography, asset class, and distribution, is well positioned to invest through
these regulatory changes.
T. Rowe Price Investor Day • February 2, 2017 53
Phase 1: 2000–2013
Primarily Institutional (incl. DC)
Combined Intermediary & Institutional
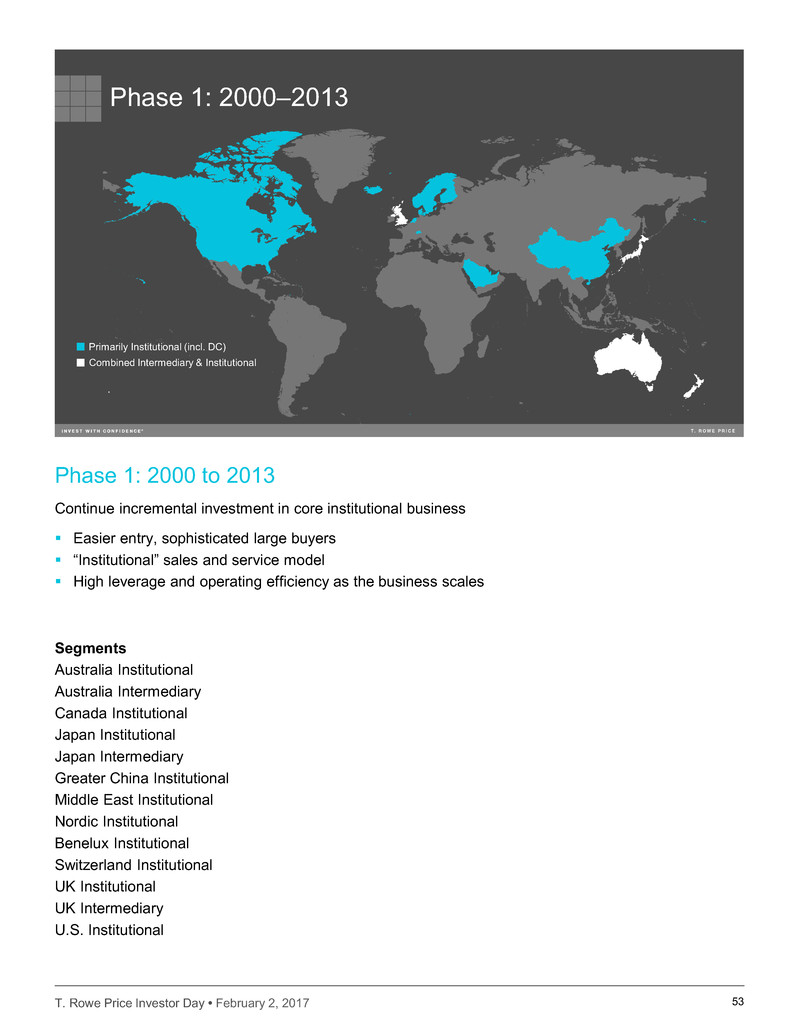
Phase 1: 2000 to 2013
Continue incremental investment in core institutional business
Easier entry, sophisticated large buyers
“Institutional” sales and service model
High leverage and operating efficiency as the business scales
Segments
Australia Institutional
Australia Intermediary
Canada Institutional
Japan Institutional
Japan Intermediary
Greater China Institutional
Middle East Institutional
Nordic Institutional
Benelux Institutional
Switzerland Institutional
UK Institutional
UK Intermediary
U.S. Institutional
T. Rowe Price Investor Day • February 2, 2017 54
Phase 2: 2014
Hong Kong
Singapore
Primarily Intermediary
Primarily Institutional (incl. DC)
Combined Intermediary & Institutional
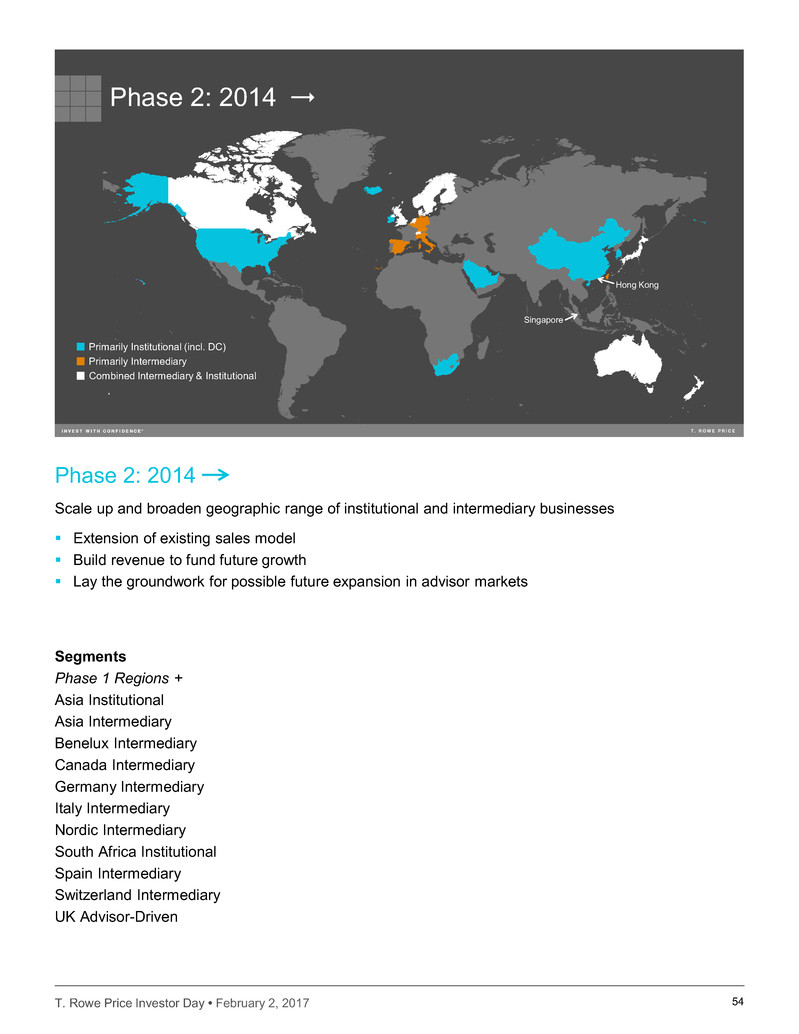
Phase 2: 2014
Scale up and broaden geographic range of institutional and intermediary businesses
Extension of existing sales model
Build revenue to fund future growth
Lay the groundwork for possible future expansion in advisor markets
Segments
Phase 1 Regions +
Asia Institutional
Asia Intermediary
Benelux Intermediary
Canada Intermediary
Germany Intermediary
Italy Intermediary
Nordic Intermediary
South Africa Institutional
Spain Intermediary
Switzerland Intermediary
UK Advisor-Driven
T. Rowe Price Investor Day • February 2, 2017 55
Phase 3: Future
Primarily Institutional (incl. DC)
Combined Intermediary & Institutional
Hong Kong
Singapore
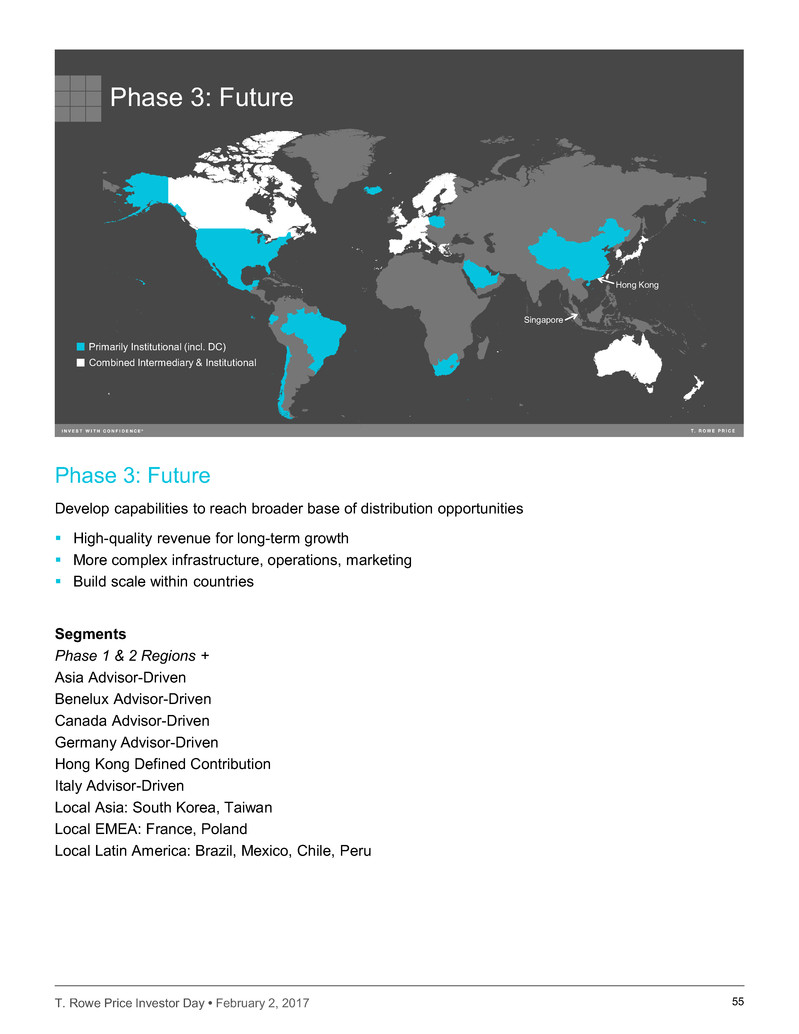
Phase 3: Future
Develop capabilities to reach broader base of distribution opportunities
High-quality revenue for long-term growth
More complex infrastructure, operations, marketing
Build scale within countries
Segments
Phase 1 & 2 Regions +
Asia Advisor-Driven
Benelux Advisor-Driven
Canada Advisor-Driven
Germany Advisor-Driven
Hong Kong Defined Contribution
Italy Advisor-Driven
Local Asia: South Korea, Taiwan
Local EMEA: France, Poland
Local Latin America: Brazil, Mexico, Chile, Peru
T. Rowe Price Investor Day • February 2, 2017 56
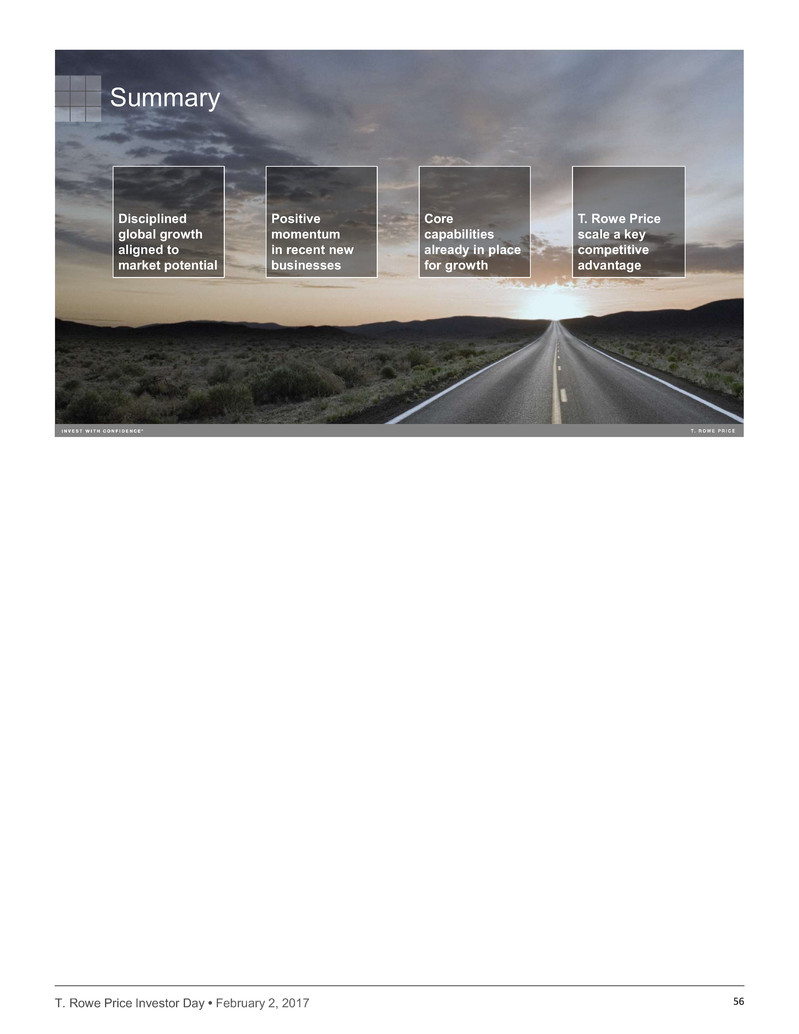
Summary
Positive
momentum
in recent new
businesses
Core
capabilities
already in place
for growth
Disciplined
global growth
aligned to
market potential
T. Rowe Price
scale a key
competitive
advantage
T. Rowe Price Investor Day • February 2, 2017 57
The Plan The Capabilities The Resources
Execution of our plan is designed to
Enhance our ability to deliver value to clients across the globe
Allow us to grow and diversify our business
Create stockholder returns via per-share growth of revenues, earnings, and dividends
T. Rowe Price has the plan, capabilities, and resources to meet the
evolving needs of our clients and the asset management marketplace
T. Rowe Price Investor Day • February 2, 2017
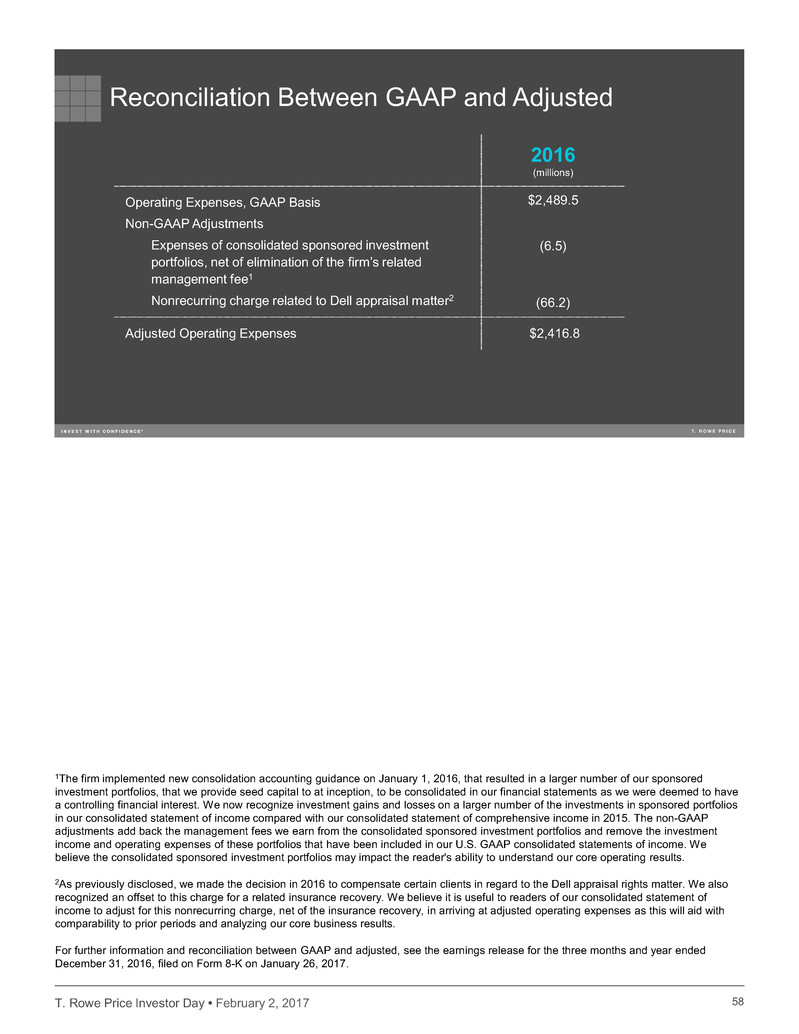
Reconciliation Between GAAP and Adjusted
2016
(millions)
Operating Expenses, GAAP Basis
Non-GAAP Adjustments
Expenses of consolidated sponsored investment
portfolios, net of elimination of the firm’s related
management fee1
Nonrecurring charge related to Dell appraisal matter2
$2,489.5
(6.5)
(66.2)
Adjusted Operating Expenses $2,416.8
58
1The firm implemented new consolidation accounting guidance on January 1, 2016, that resulted in a larger number of our sponsored
investment portfolios, that we provide seed capital to at inception, to be consolidated in our financial statements as we were deemed to have
a controlling financial interest. We now recognize investment gains and losses on a larger number of the investments in sponsored portfolios
in our consolidated statement of income compared with our consolidated statement of comprehensive income in 2015. The non-GAAP
adjustments add back the management fees we earn from the consolidated sponsored investment portfolios and remove the investment
income and operating expenses of these portfolios that have been included in our U.S. GAAP consolidated statements of income. We
believe the consolidated sponsored investment portfolios may impact the reader's ability to understand our core operating results.
2As previously disclosed, we made the decision in 2016 to compensate certain clients in regard to the Dell appraisal rights matter. We also
recognized an offset to this charge for a related insurance recovery. We believe it is useful to readers of our consolidated statement of
income to adjust for this nonrecurring charge, net of the insurance recovery, in arriving at adjusted operating expenses as this will aid with
comparability to prior periods and analyzing our core business results.
For further information and reconciliation between GAAP and adjusted, see the earnings release for the three months and year ended
December 31, 2016, filed on Form 8-K on January 26, 2017.
