Attached files
| file | filename |
|---|---|
| EX-99.1 - EXHIBIT 99.1 - KELLY SERVICES INC | a20164qearningsreleaseform.htm |
| 8-K - 8-K - KELLY SERVICES INC | form8-k2017fourthquarter.htm |

Kelly Services, Inc.
Fourth Quarter and Full Year 2016
February 2, 2017
Exhibit 99.2

Safe Harbor Statement
This release contains statements that are forward looking in nature and, accordingly, are subject to risks and
uncertainties. These factors include, but are not limited to, competitive market pressures including pricing and technology
introductions, changing market and economic conditions, our ability to achieve our business strategy, the risk of damage to
our brand, the risk our intellectual assets could be infringed upon or compromised, our ability to successfully develop new
service offerings, our exposure to risks associated with services outside traditional staffing, including business process
outsourcing, our increasing dependency on third parties for the execution of critical functions, the risks associated with past
and future acquisitions, exposure to risks associated with investments in equity affiliates, material changes in demand from
or loss of large corporate customers, risks associated with conducting business in foreign countries, including foreign
currency fluctuations, availability of full-time employees to lead complex talent supply chain sales and operations,
availability of temporary workers with appropriate skills required by customers, liabilities for employment-related claims and
losses, including class action lawsuits and collective actions, the risk of cyber attacks or other breaches of network or
information technology security as well as risks associated with compliance on data privacy, our ability to sustain critical
business applications through our key data centers, our ability to effectively implement and manage our information
technology programs, our ability to maintain adequate financial and management processes and controls, impairment
charges triggered by adverse industry developments or operational circumstances, unexpected changes in claim trends on
workers’ compensation, disability and medical benefit plans, the impact of the Patient Protection and Affordable Care Act
on our business, the impact of changes in laws and regulations (including federal, state and international tax laws ), the risk
of additional tax or unclaimed property liabilities in excess of our estimates, our ability to maintain specified financial
covenants in our bank facilities to continue to access credit markets, and other risks, uncertainties and factors discussed in
this release and in the Company’s filings with the Securities and Exchange Commission. Actual results may differ materially
from any forward looking statements contained herein, and we have no intention to update these statements.
2

3
Fourth Quarter 2016 Highlights
(YOY Comparisons)
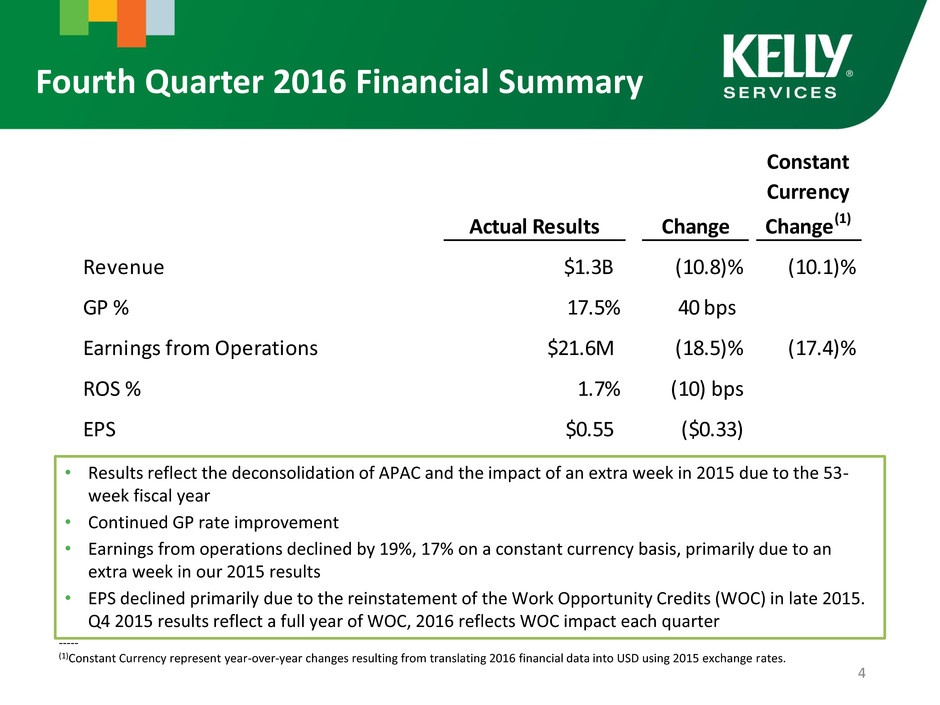
• Total revenue declined 11%, or 10% in constant currency
– Excluding APAC results in 2015, total revenue declined 4% in nominal
and constant currency
– Also, excluding the 53rd week impact in 2015, constant currency
revenue is essentially flat YOY
• Gross profit down 9%, or 8% in constant currency
– Excluding APAC results in 2015, gross profit down 3% in nominal and
constant currency
• Earnings from operations of $21.6 million, down 19% YOY
– Excluding APAC results in 2015, earnings from operations down 12%
YOY
• Diluted earnings per share of $0.55, down $0.33
– Excluding APAC staffing results in 2015, diluted earnings per share
down $0.29
Fourth Quarter 2016 Financial Summary
4
• Results reflect the deconsolidation of APAC and the impact of an extra week in 2015 due to the 53-
week fiscal year
• Continued GP rate improvement
• Earnings from operations declined by 19%, 17% on a constant currency basis, primarily due to an
extra week in our 2015 results
• EPS declined primarily due to the reinstatement of the Work Opportunity Credits (WOC) in late 2015.
Q4 2015 results reflect a full year of WOC, 2016 reflects WOC impact each quarter
-----
(1)Constant Currency represent year-over-year changes resulting from translating 2016 financial data into USD using 2015 exchange rates.
Actual Results Change
Constant
Currency
Change(1)
Revenue $1.3B (10.8)% (10.1)%
GP % 17.5% 40 bps
Earnings from Operations $21.6M (18.5)% (17.4)%
ROS % 1.7% (10) bps
EPS $0.55 ($0.33)

Fourth Quarter 2016 Financial Summary
(Excluding APAC 2015 Results)
5
-----
(1) Excludes 2015 results from APAC and OCG business related to the deconsolidation.
(2) Constant Currency represent year-over-year changes resulting from translating 2016 financial data into USD using 2015 exchange rates.
• Declining revenue growth reflects the impact of an extra week in 2015 due to the 53-week fiscal year.
Excluding the extra week of revenue in 2015, revenue is essentially flat year-over-year in constant
currency
• Earnings from operations declines primarily due to an extra week in our 2015 results
• EPS declined primarily due to the reinstatement of the Work Opportunity Credits (WOC) in late 2015.
Q4 2015 results reflect a full year of WOC, 2016 reflects WOC impact each quarter
Actual Results Change(1)
Constant
Currency
Change(2)
Revenue $1.3B (4.3)% (3.6)%
GP % 17.5% 20 bps
Earnings from Operations $21.6M (12.4)% (11.2)%
ROS % 1.7% (10) bps
EPS 0.55$ (0.29)$

Fourth Quarter 2016 Revenue Growth
6
• Americas and EMEA staffing revenues impacted by extra week in Q4 2015 results
• Americas PT was also impacted by slowing demand
51%
18%
19%
14%
Business Mix
Americas Commercial Americas PT EMEA OCG
-10%
-5%
0%
5%
Americas
Commercial
Americas PT EMEA OCG
YoY Growth
Reported Constant Currency
Fourth Quarter 2016 Gross Profit Growth
7
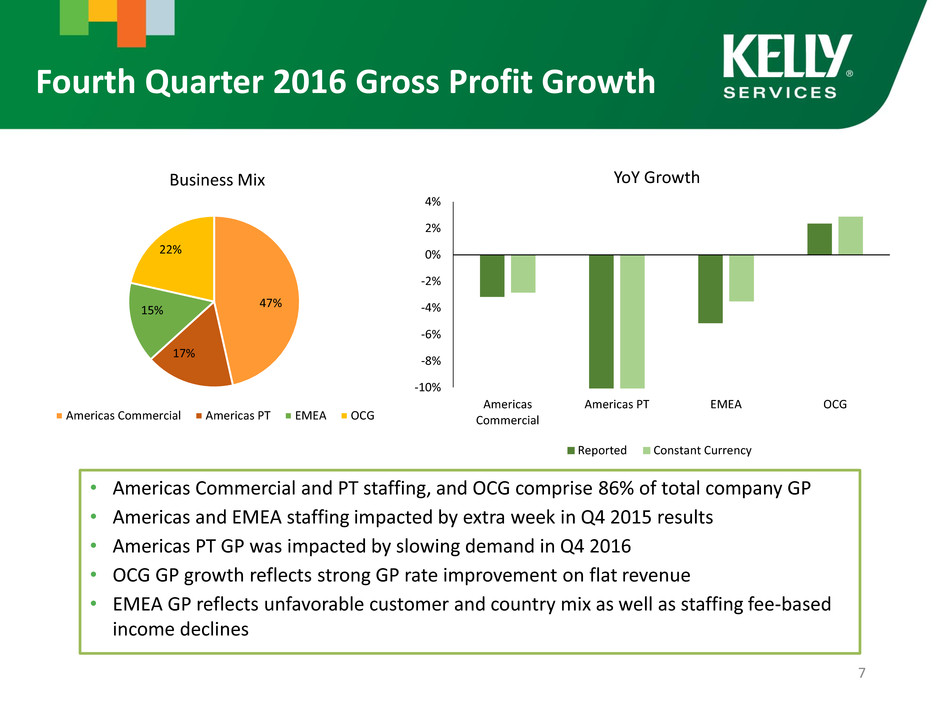
• Americas Commercial and PT staffing, and OCG comprise 86% of total company GP
• Americas and EMEA staffing impacted by extra week in Q4 2015 results
• Americas PT GP was impacted by slowing demand in Q4 2016
• OCG GP growth reflects strong GP rate improvement on flat revenue
• EMEA GP reflects unfavorable customer and country mix as well as staffing fee-based
income declines
47%
17%
15%
22%
Business Mix
Americas Commercial Americas PT EMEA OCG
-10%
-8%
-6%
-4%
-2%
0%
2%
4%
Americas
Commercial
Americas PT EMEA OCG
YoY Growth
Reported Constant Currency
17.1%
17.5%
15.0%
15.5%
16.0%
16.5%
17.0%
17.5%
18.0%
Q4 2015 GP
Rate
Perm Fee and
Other
EMEA GP Rate AMER GP Rate OCG GP Rate FX APAC
Deconsolidation
Q4 2016 GP
Rate
Fourth Quarter 2016 Gross Profit Rate
8
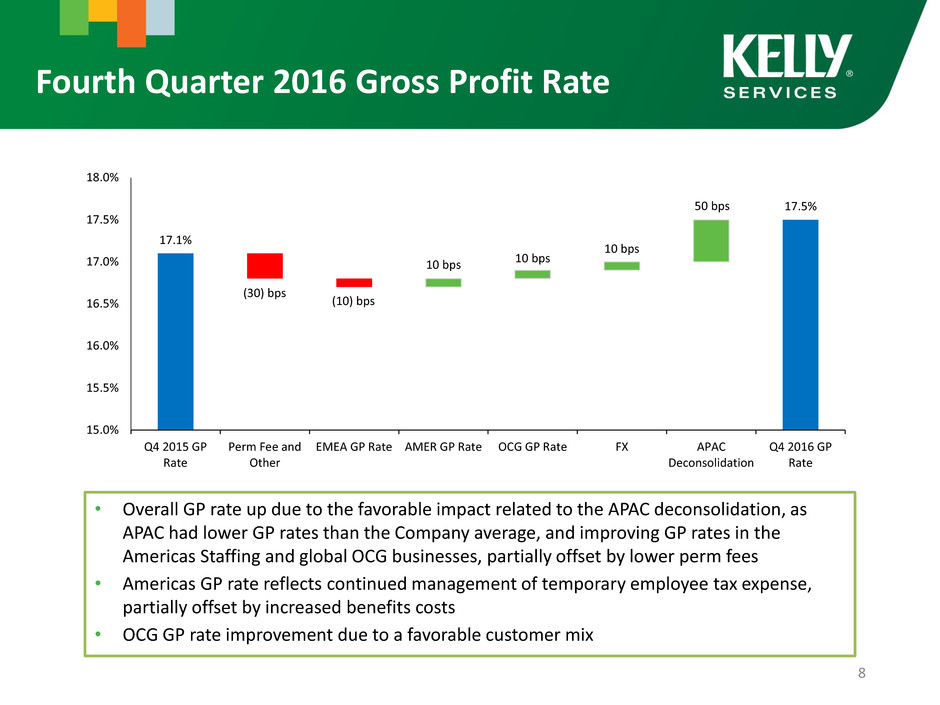
• Overall GP rate up due to the favorable impact related to the APAC deconsolidation, as
APAC had lower GP rates than the Company average, and improving GP rates in the
Americas Staffing and global OCG businesses, partially offset by lower perm fees
• Americas GP rate reflects continued management of temporary employee tax expense,
partially offset by increased benefits costs
• OCG GP rate improvement due to a favorable customer mix
10 bps 10 bps
(10) bps
(30) bps
50 bps
10 bps

$223
$206
$190
$195
$200
$205
$210
$215
$220
$225
Q4 2015 SG&A APAC Corporate FX Amer EMEA OCG Q4 2016 SG&A
Fourth Quarter 2016 SG&A
9
• APAC reflects the deconsolidation of our APAC business upon closing the APAC JV transaction
in the third quarter
• Corporate expenses reflect savings related to lower performance-based compensation ($5.1
million) and lower litigation related expenses
• OCG expense growth results from increasing salaries as well as costs related to additional sales
resources
• Lower Americas expense reflects management of expenses in line with GP
• EMEA expenses reflect targeted investment in recruiters in the branch network
$(11)
$(9)
$(1)
$2
$ in Millions
$(3)
$5

Fourth Quarter 2016 Conversion Rate
10
-----
(1)Conversion rate represents earnings from operations as a percent of gross profit, or return on gross profit.
• APAC results are no longer included in the Company’s earnings from operations
upon closing of the APAC JV transaction at the beginning of the third quarter
$ in Millions
2016 2015
Gross Earnings Conversion Gross Earnings Conversion Change
Profit from Ops Rate(1) Profit from Ops Rate(1) (bps)
Americas 144.9$ 30.5$ 21.0% 153.0$ 36.2$ 23.7% (270)
EMEA 35.0 4.2 12.0% 36.9 7.2 19.4% (740)
APAC - - 0.0% 12.8 1.6 12.2% NM
OCG 49.2 10.8 21.9% 48.0 14.0 29.3% (740)
Total Company 228.0$ 21.6$ 9.5% 249.5$ 26.5$ 10.6% (110)

Fourth Quarter 2016 Conversion Rate
(Excluding APAC 2015 Results)
11
$ in Millions
-----
(1) Excludes 2015 results from APAC and OCG business related to the deconsolidation.
(2) Conversion rate represents earnings from operations as a percent of gross profit, or return on gross profit.
• Although Q4 conversion rate declined year-over-year, full year conversion rate of
7.6% (excluding restructuring expenses) was up 40 bps from the prior year.
2016 2015
Gross Earnings Conversion Gross Earnings Conversion Change
Profit from Ops Rate(2) Profit(1) from Ops(1) Rate(2) (bps)
Americas 144.9$ 30.5$ 21.0% 153.0$ 36.2$ 23.7% (270)
EMEA 35.0 4.2 12.0% 36.9 7.2 19.4% (740)
APAC - - 0.0% - - 0.0% -
OCG 49.2 10.8 21.9% 47.2 13.8 29.2% (730)
Total Company 228.0$ 21.6$ 9.5% 236.0$ 24.7$ 10.4% (90)

$500
$600
$700
$800
$900
$1,000
$1,100
$1,200
$1,300
2015 2016 Q1 2016 Q2 2016 Q3 2016
Accounts Receivable
Excluding APAC APAC
Fourth Quarter 2016 Balance Sheet Data
12
• DSO remained consistent with the same period last year
• Debt free as of the end of the year as a result of cash proceeds from the APAC
transaction and improving free cash flows
$ in Millions
DSO 54 55 53 56 54 Debt-to- 5.8% 4.1% 2.8% 0.9% 0.0%
Equity Ratio
$0
$20
$40
$60
2015 2016 Q1 2016 Q2 2016 Q3 2016
Debt
(and Debt-to-Equity Ratio)
2017 Outlook – Full Year
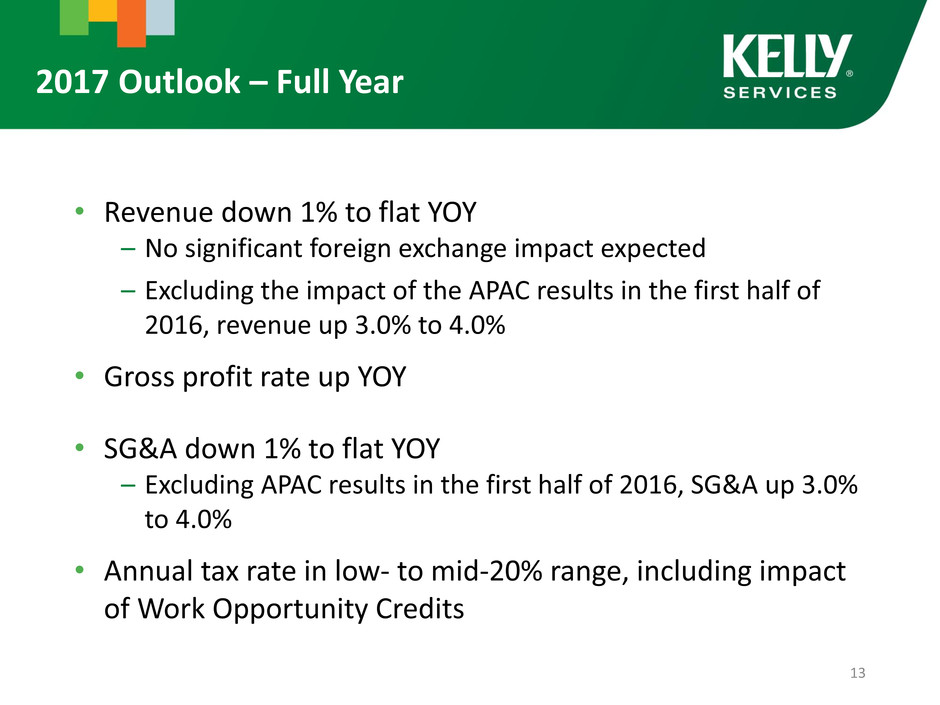
• Revenue down 1% to flat YOY
– No significant foreign exchange impact expected
– Excluding the impact of the APAC results in the first half of
2016, revenue up 3.0% to 4.0%
• Gross profit rate up YOY
• SG&A down 1% to flat YOY
– Excluding APAC results in the first half of 2016, SG&A up 3.0%
to 4.0%
• Annual tax rate in low- to mid-20% range, including impact
of Work Opportunity Credits
13

APPENDIX:
TS KELLY ASIA PACIFIC JOINT VENTURE
14

• Joint Venture capitalizes on the strong reputation of Kelly Services as a
leading talent provider in the region and on Temp Holdings’ regional
presence
– Provides accelerated growth opportunities, larger workforce
solutions presence, and enhanced competitive positioning
– Expands on 14-year strategic partnership between Kelly and Temp
Holdings
• TS Kelly Asia Pacific is expected to be one of the largest workforce
solutions companies in the Asia Pacific region
• Solidifies Kelly’s focus on OCG solutions in the APAC market
– Opportunity to accelerate investment in high growth market
– Kelly’s outsourcing and consulting group, KellyOCG, is not part of the
joint venture and will continue to operate under the complete
control of Kelly
Highlights – TS Kelly Asia Pacific
15

• Expands scope from four geographies to twelve, with
headquarters in Singapore
• Brings together established businesses with approximately $500
million in revenue and 1,600 employees
– TS Kelly North Asia – China, Hong Kong, Taiwan, South Korea
– Kelly Services – Singapore, Malaysia, Australia, New Zealand,
India, Indonesia, Thailand
– Capita – Singapore and Malaysia
– First Alliances – Vietnam
– Intelligence – Indonesia, Vietnam, Singapore, Malaysia
Highlights – TS Kelly Asia Pacific
16
• Closed on July 4, 2016, the JV was formed through asset transfers from Kelly and
Temp Holdings, and a $36.5 million cash payment to Kelly at closing and a $4.5 million
cash true-up payment made to Kelly in Q4 2016
• Temp Holdings owns 51%, Kelly owns 49%
• Beginning in the third quarter, Kelly accounts for its 49% interest as an Equity Method
Investment
– APAC results are no longer included in the individual lines of Kelly’s consolidated
income statement or balance sheet
Equity method investment asset will be reported as a single line item on the
balance sheet
49% share of income reflected as Income from equity method investments
(below earnings from operations), effective on the transaction closing date
» Will no longer be included as revenue, cost of service, and SG&A
expense
TS Kelly Asia Pacific – Transaction Details
17
