Attached files
| file | filename |
|---|---|
| EX-99.1 - EXHIBIT 99.1 - Adtalem Global Education Inc. | a51504425-ex991.htm |
| 8-K - DEVRY EDUCATION GROUP INC. 8-K - Adtalem Global Education Inc. | a51504425.htm |
Exhibit 99.2

2nd Quarter Fiscal 2017 Financial Results February 2, 2017 DeVry Education Group
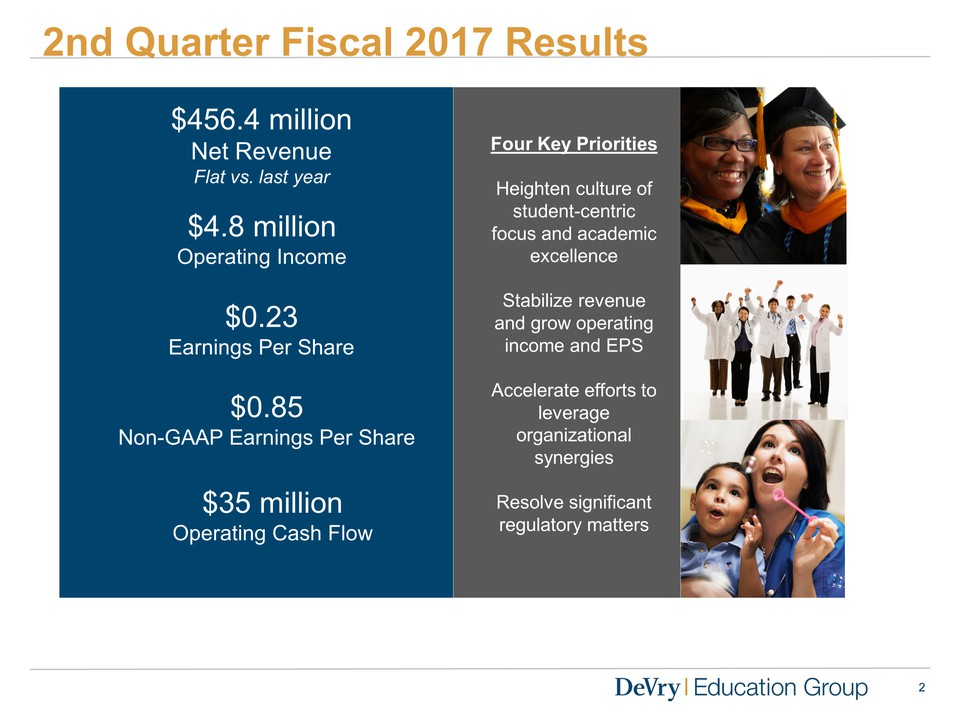
Four Key Priorities Heighten culture of student-centric focus and academic excellence Stabilize revenue and grow operating income and EPS Accelerate efforts to leverage organizational synergies Resolve significant regulatory matters 2nd Quarter Fiscal 2017 Results $0.23 Earnings Per Share $4.8 million Operating Income $35 million Operating Cash Flow $456.4 million Net Revenue Flat vs. last year $0.85 Non-GAAP Earnings Per Share 3
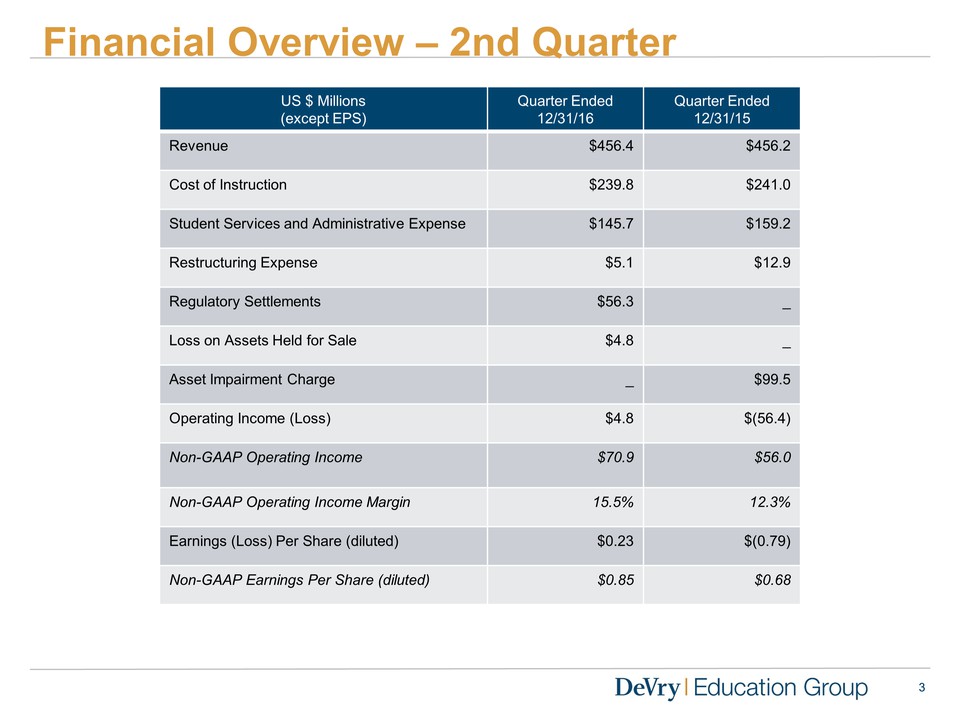
3 Financial Overview – 2nd Quarter US $ Millions (except EPS) Quarter Ended 12/31/16 Quarter Ended 12/31/15 Revenue $456.4 $456.2 Cost of Instruction $239.8 $241.0 Student Services and Administrative Expense $145.7 $159.2 Restructuring Expense $5.1 $12.9 Regulatory Settlements $56.3 _ Loss on Assets Held for Sale $4.8 _ Asset Impairment Charge _ $99.5 Operating Income (Loss) $4.8 $(56.4) Non-GAAP Operating Income $70.9 $56.0 Non-GAAP Operating Income Margin 15.5% 12.3% Earnings (Loss) Per Share (diluted) $0.23 $(0.79) Non-GAAP Earnings Per Share (diluted) $0.85 $0.68
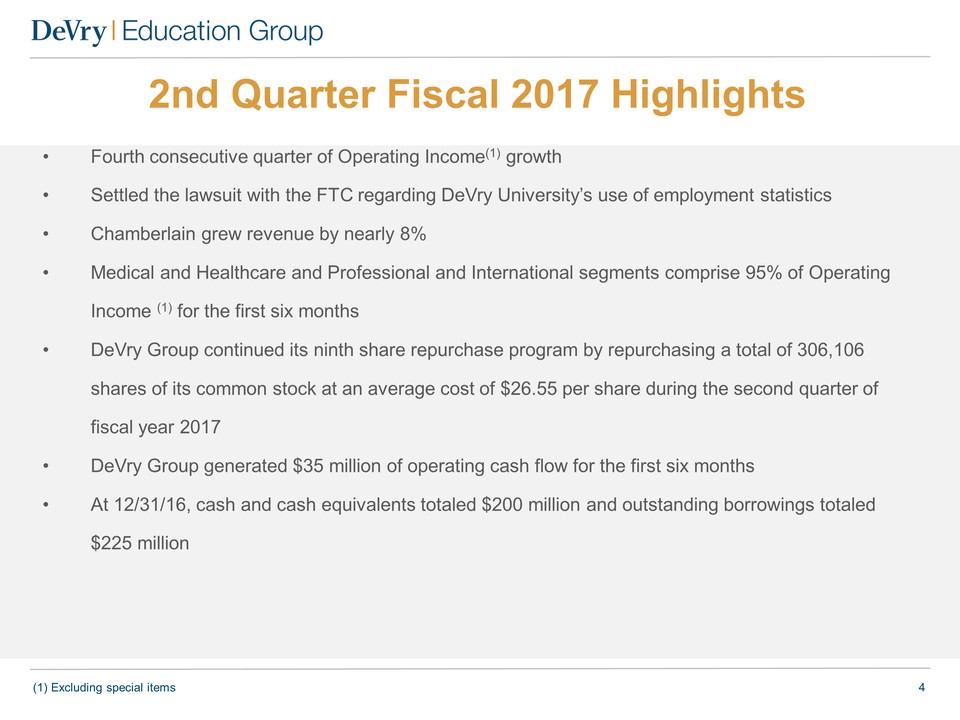
(1) Excluding special items 2nd Quarter Fiscal 2017 Highlights • Fourth consecutive quarter of Operating Income(1) growth • Settled the lawsuit with the FTC regarding DeVry University’s use of employment statistics • Chamberlain grew revenue by nearly 8% • Medical and Healthcare and Professional and International segments comprise 95% of Operating Income (1) for the first six months • DeVry Group continued its ninth share repurchase program by repurchasing a total of 306,106 shares of its common stock at an average cost of $26.55 per share during the second quarter of fiscal year 2017 • DeVry Group generated $35 million of operating cash flow for the first six months • At 12/31/16, cash and cash equivalents totaled $200 million and outstanding borrowings totaled $225 million 4
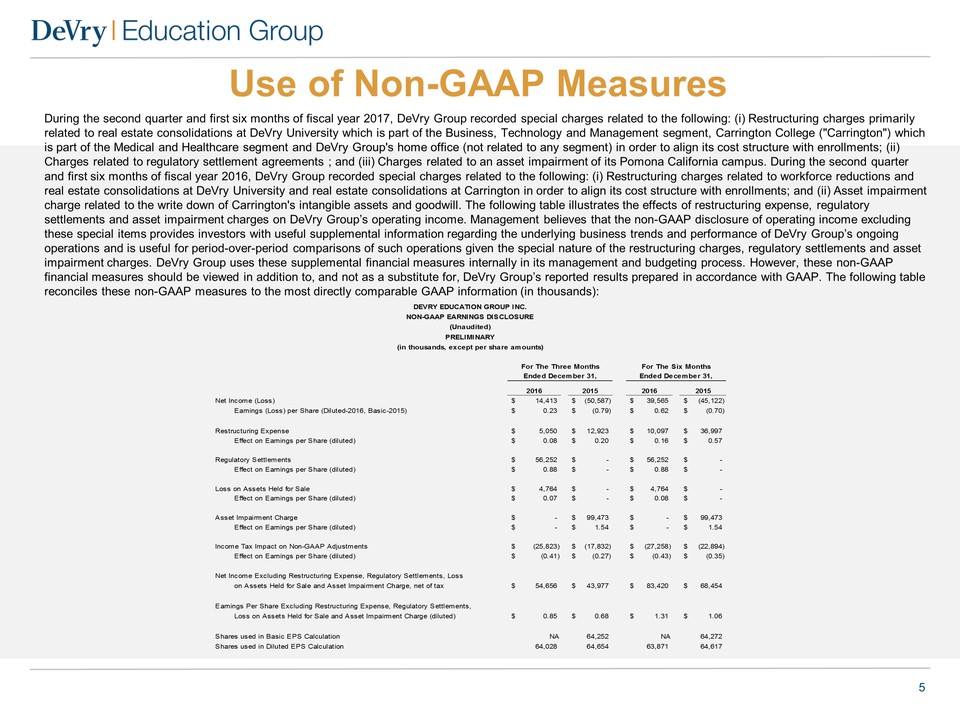
Use of Non-GAAP Measures 5 During the second quarter and first six months of fiscal year 2017, DeVry Group recorded special charges related to the following: (i) Restructuring charges primarily related to real estate consolidations at DeVry University which is part of the Business, Technology and Management segment, Carrington College ("Carrington") which is part of the Medical and Healthcare segment and DeVry Group's home office (not related to any segment) in order to align its cost structure with enrollments; (ii) Charges related to regulatory settlement agreements ; and (iii) Charges related to an asset impairment of its Pomona California campus. During the second quarter and first six months of fiscal year 2016, DeVry Group recorded special charges related to the following: (i) Restructuring charges related to workforce reductions and real estate consolidations at DeVry University and real estate consolidations at Carrington in order to align its cost structure with enrollments; and (ii) Asset impairment charge related to the write down of Carrington's intangible assets and goodwill. The following table illustrates the effects of restructuring expense, regulatory settlements and asset impairment charges on DeVry Group’s operating income. Management believes that the non-GAAP disclosure of operating income excluding these special items provides investors with useful supplemental information regarding the underlying business trends and performance of DeVry Group’s ongoing operations and is useful for period-over-period comparisons of such operations given the special nature of the restructuring charges, regulatory settlements and asset impairment charges. DeVry Group uses these supplemental financial measures internally in its management and budgeting process. However, these non-GAAP financial measures should be viewed in addition to, and not as a substitute for, DeVry Group’s reported results prepared in accordance with GAAP. The following table reconciles these non-GAAP measures to the most directly comparable GAAP information (in thousands): For The Three Months For The Six Months Ended December 31, Ended December 31, 2016 2015 2016 2015 Net Income (Loss) $ 1 4,413 $ (50,587) $ 39,565 $ (45,122) Earnings (Loss) per Share (Diluted-2016, Basic-2015) $ 0.23 $ (0.79) $ 0.62 $ (0.70) Restructuring Expense $ 5,050 $ 12,923 $ 10,097 $ 36,997 Effect on Earnings per Share (diluted) $ 0.08 $ 0.20 $ 0.16 $ 0.57 Regulatory Settlements $ 5 6,252 $ - $ 56,252 $ - Effect on Earnings per Share (diluted) $ 0.88 $ - $ 0.88 $ - Loss on Assets Held for Sale $ 4,764 $ - $ 4,764 $ - Effect on Earnings per Share (diluted) $ 0.07 $ - $ 0.08 $ - Asset Impairment Charge $ - $ 99,473 $ - $ 99,473 Effect on Earnings per Share (diluted) $ - $ 1.54 $ - $ 1.54 Income Tax Impact on Non-GAAP Adjustments $ (25,823) $ (17,832) $ (27,258) $ (22,894) Effect on Earnings per Share (diluted) $ (0.41) $ (0.27) $ (0.43) $ (0.35) Net Income Excluding Restructuring Expense, Regulatory Settlements, Loss on Assets Held for Sale and Asset Impairment Charge, net of tax $ 5 4,656 $ 43,977 $ 83,420 $ 68,454 Earnings Per Share Excluding Restructuring Expense, Regulatory Settlements, Loss on Assets Held for Sale and Asset Impairment Charge (diluted) $ 0.85 $ 0.68 $ 1.31 $ 1.06 Shares used in Basic EPS Calculation NA 64,252 NA 64,272 Shares used in Diluted EPS Calculation 64,028 64,654 63,871 64,617 DEVRY EDUCATION GROUP INC. NON-GAAP EARNINGS DISCLOSURE PRELIMINARY (in thousands, except per share amounts) (Unaudited)
Safe Harbor 6 Certain statements contained in this presentation concerning DeVry Group's future performance, including those statements concerning DeVry Group's expectations or plans, may constitute forward-looking statements subject to the Safe Harbor Provision of the Private Securities Litigation Reform Act of 1995. These forward-looking statements generally can be identified by phrases such as DeVry Group or its management "believes," "expects," "anticipates," "foresees," "forecasts," "estimates" or other words or phrases of similar import. Actual results may differ materially from those projected or implied by these forwardlooking statements. Potential risks, uncertainties and other factors that could cause results to differ are described more fully in Item 1A, "Risk Factors," in DeVry Group's most recent Annual Report on Form 10-K for the year ending June 30, 2016 and filed with the Securities and Exchange Commission (SEC) on August 25, 2016 and its most recent Quarterly Report on Form 10-Q for the quarter ending September 30, 2016 and filed with the SEC on November 2, 2016.