Attached files
| file | filename |
|---|---|
| 8-K - 8-K - CMS ENERGY CORP | d340860d8k.htm |
Exhibit 99.1

CMS ENERGY . . . .
CMS
LISTED
NYSE
Year-End 2016 Results & Outlook
February 2, 2017
Palisades Replacements
Gas Pipelines
CMS ENERGY
This presentation is made as of the
date hereof and contains “forward-looking statements” as defined in Rule 3b-6 of the Securities
Exchange Act of
1934, Rule 175 of the Securities Act of 1933, and relevant legal decisions. The forward-looking statements are subject to risks and uncertainties. All forward-looking statements should be considered in the context of the risk and other factors
detailed from time to time in CMS Energy’s and Consumers Energy’s Securities and Exchange Commission filings. Forward-looking statements should be read in conjunction with “FORWARD-LOOKING STATEMENTS AND INFORMATION” and
“RISK FACTORS” sections of CMS Energy’s and Consumers Energy’s Form 10-K for the year ended December 31, 2015 and as updated in subsequent
10-Qs. CMS Energy’s and Consumers Energy’s “FORWARD-LOOKING STATEMENTS AND INFORMATION” and “RISK FACTORS” sections are incorporated herein by reference and discuss important
factors that could cause CMS Energy’s and Consumers Energy’s results to differ materially from those anticipated in such statements. CMS Energy and Consumers Energy undertake no obligation to update any of the information presented herein
to reflect facts, events or circumstances after the date hereof.
The presentation also includes non-GAAP measures when
describing CMS Energy’s results of operations and financial performance. A reconciliation of each of these measures to the most directly comparable GAAP measure is included in the appendix and posted on our website at www.cmsenergy.com.
CMS Energy provides historical financial results on both a reported (GAAP) and adjusted (non-GAAP) basis and provides
forward-looking guidance on an adjusted basis. Adjustments could include items such as discontinued operations, asset sales, impairments, restructuring costs, regulatory items from prior years, or other items. Management views adjusted earnings as a
key measure of the company’s present operating financial performance and uses adjusted earnings for external communications with analysts and investors. Internally, the company uses adjusted earnings to measure and assess performance. Because
the company is not able to estimate the impact of specific line items, which have the potential to significantly impact, favorably or unfavorably, the company’s reported earnings in future periods, the company is not providing reported earnings
guidance nor is it providing a reconciliation for the comparable future period earnings. The adjusted earnings should be considered supplemental information to assist in fully understanding our business results, rather than as a substitute for the
reported earnings.
Investors and others should note that CMS Energy routinely posts important information on its website and considers the Investor Relations
section, www.cmsenergy.com/investor-relations, a channel of distribution.
1
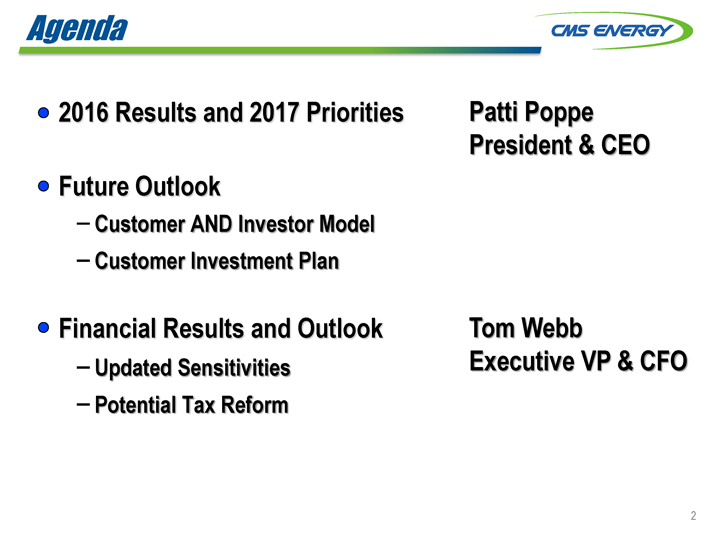
Agenda
CMS ENERGY
2016 Results and 2017 Priorities
Future Outlook
- Customer AND Investor Model
- Customer Investment Plan
Financial Results and Outlook
- Updated Sensitivities
- Potential Tax Reform
Patti Poppe
President & CEO
Tom Webb
Executive VP & CFO
2
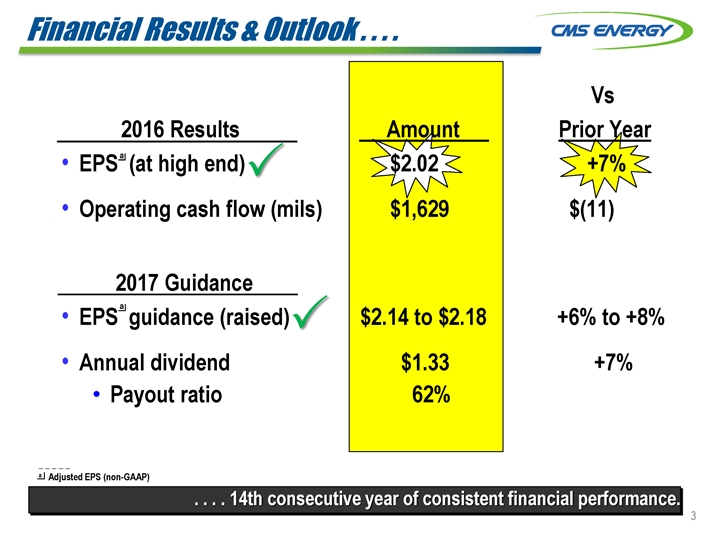
Financial Results & Outlook . . . .
CMS
ENERGY
2016 Results
EPS a (at high end)
Operating cash flow (mils)
2017 Guidance
EPS a guidance (raised)
Annual dividend
Payout ratio
Amount
$2.02
$1,629
$2.14 to $2.18
$1.33
62%
Vs
Prior Year
+7%
$(11)
+6% to +8%
+7%
a Adjusted EPS (non-GAAP)
. . . . 14th consecutive year of consistent financial performance.
3
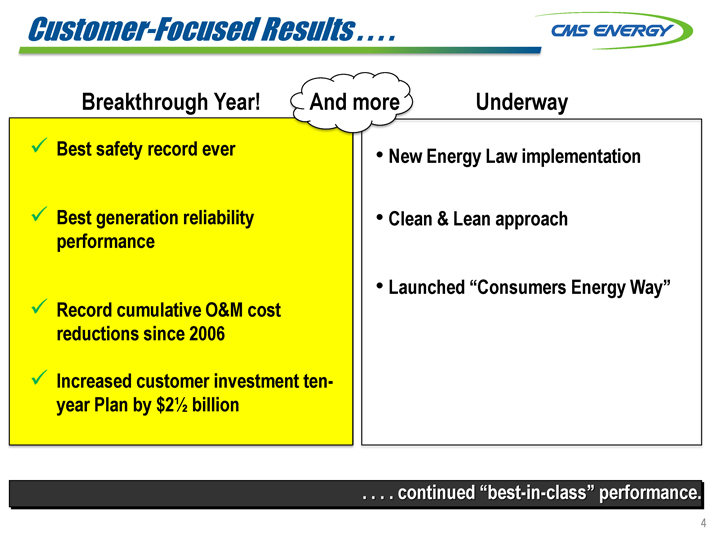
Customer-Focused Results . . . . CMS ENERGY
Breakthrough Year!
Best safety record ever
Best generation reliability performance
Record cumulative O&M cost reductions since 2006
Increased customer investment ten-year Plan by $2 1⁄2 billion
And more Underway
New
Energy Law implementation
Clean & Lean approach
Launched “Consumers
Energy Way”
. . . . continued “best-in-class” performance.
4
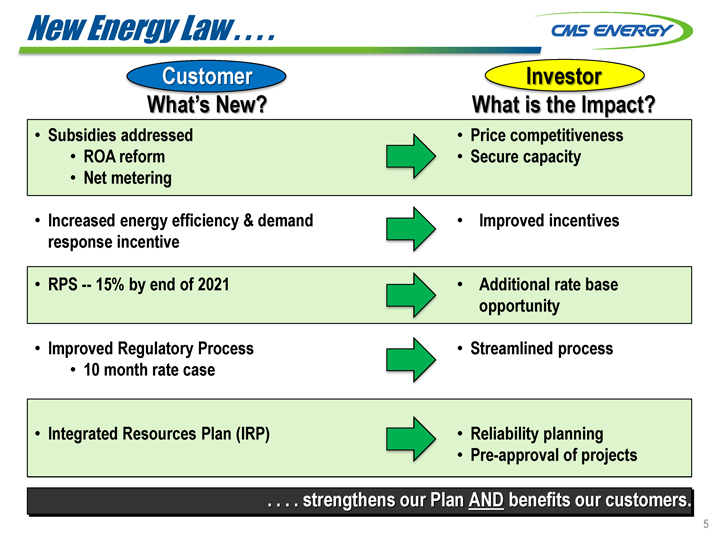
New Energy Law . . . . CMS ENERGY
Customer
What’s New?
• Subsidies addressed
• ROA reform
• Net metering
• Increased energy efficiency & demand response incentive
• RPS -- 15% by end of
2021
• Improved Regulatory Process
• 10 month rate case
• Integrated Resources Plan (IRP)
Investor What is the Impact?
• Price competitiveness
• Secure capacity
• Improved incentives
• Additional rate base opportunity
• Streamlined process
• Reliability planning
• Pre-approval of projects
. . . . strengthens
our Plan AND benefits our customers.
5
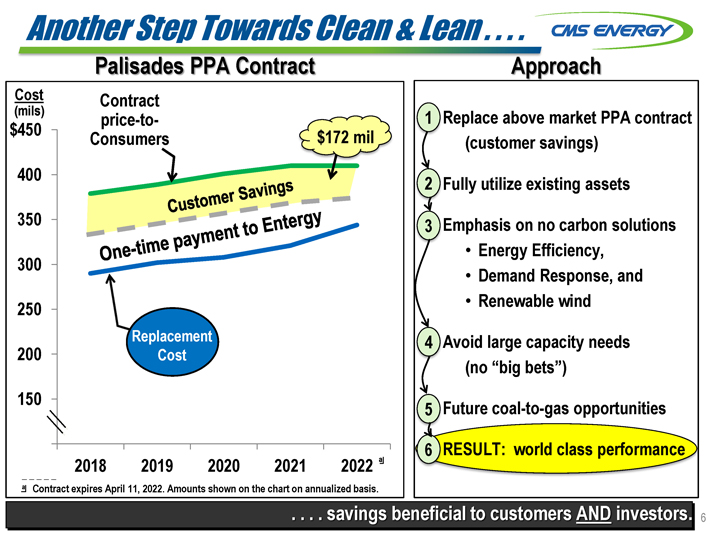
Another Step Towards Clean & Lean . . . . CMS ENERGY
Palisades PPA Contract
Cost (mils) $450 400 350 300 250 200 150
Contract price-to-Consumers $172 mil
Customer Savings
One-time payment to Entergy
Replacement Cost 2018 2019 2020 2021 2022 a
a Contract expires April 11, 2022. Amounts shown on the chart on annualized basis.
Approach
1 Replace above market PPA contract (customer savings)
2 Fully utilize
existing assets
3 Emphasis on no carbon solutions
• Energy Efficiency,
• Demand Response, and
• Renewable wind
4 Avoid large capacity needs (no “big bets”)
5 Future
coal-to-gas opportunities
6 RESULT: world class performance
. . . . savings beneficial to customers AND investors.
6
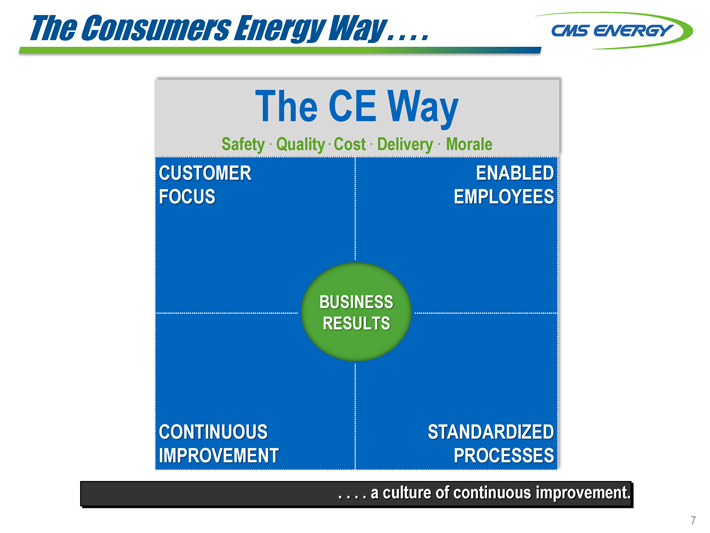
The Consumers Energy Way . . . . CMS ENERGY
The CE
Way Safety Quality Cost Delivery Morale
CUSTOMER FOCUS ENABLED EMPLOYEES BUSINESS RESULTS CONTINUOUS IMPROVEMENT STANDARDIZED PROCESSES
.. . . . a culture of continuous improvement.
7
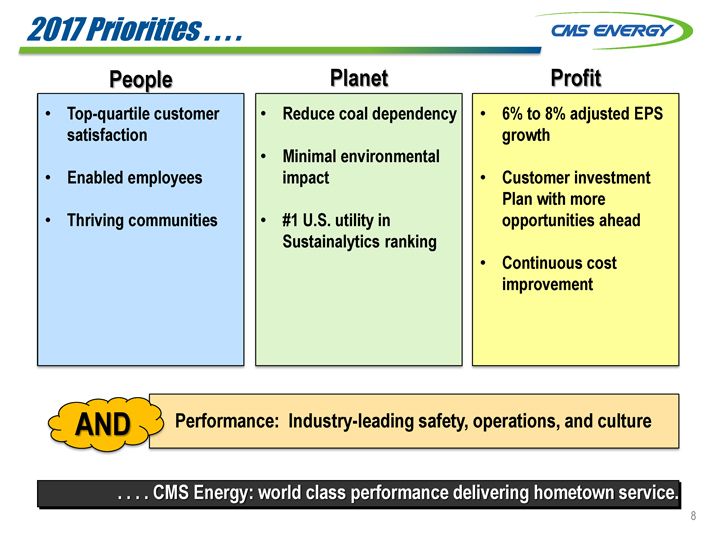
2017 Priorities . . . . CMS ENERGY
People
• Top-quartile customer satisfaction
• Enabled employees
• Thriving communities
Planet
• Reduce coal dependency
• Minimal environmental impact
• #1 U.S. utility in Sustainalytics ranking
Profit
• 6% to 8% adjusted EPS growth
• Customer investment Plan with more opportunities ahead
• Continuous cost
improvement
AND Performance: Industry-leading safety, operations, and culture
. . . . CMS Energy: world class performance delivering hometown service.
8
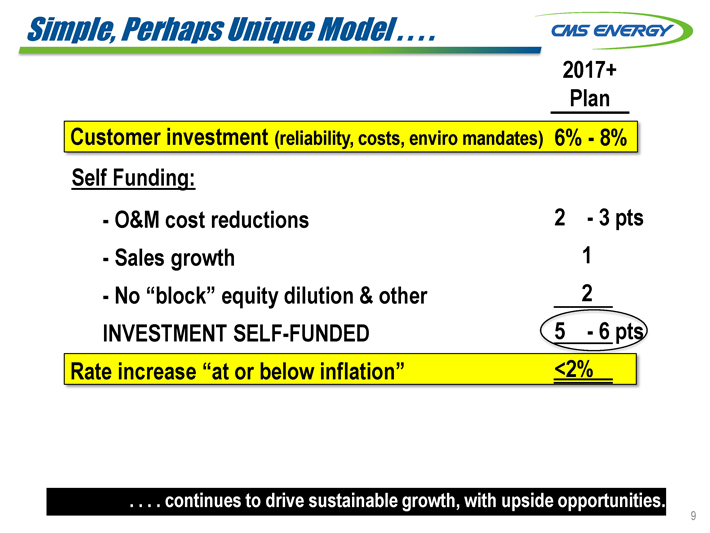
Simple, Perhaps Unique Model . . . . CMS ENERGY
2017+
Plan
Customer investment (reliability, costs, enviro mandates) 6% - 8%
Self Funding:
- O&M cost reductions 2 - 3 pts
- Sales growth 1
- No “block” equity dilution & other 2
INVESTMENT SELF-FUNDED 5 - 6 pts
Rate increase “at or below inflation” <2%
. . . . continues to
drive sustainable growth, with upside opportunities.
9
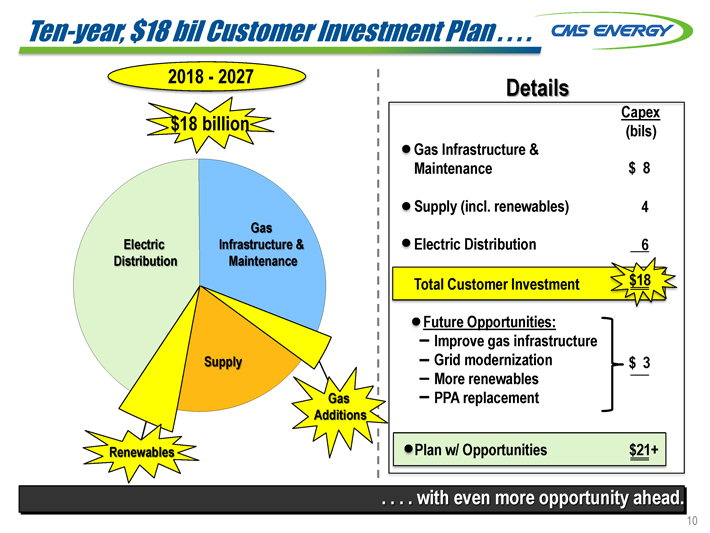
Ten-year, $18 bil Customer Investment Plan . . . . CMS ENERGY
2018 - 2027 $18 billion
Gas Infrastructure & Maintenance Electric Distribution Supply
Gas Additions Renewables
Details
Capex (bils)
• Gas Infrastructure & Maintenance $ 8
• Supply (incl. renewables) 4
• Electric Distribution 6
Total Customer Investment $18
• Future Opportunities:
- Improve gas infrastructure
- Grid modernization $ 3
- More renewables
- PPA replacement
• Plan w/ Opportunities $21+
. . . . with even more opportunity ahead.
10
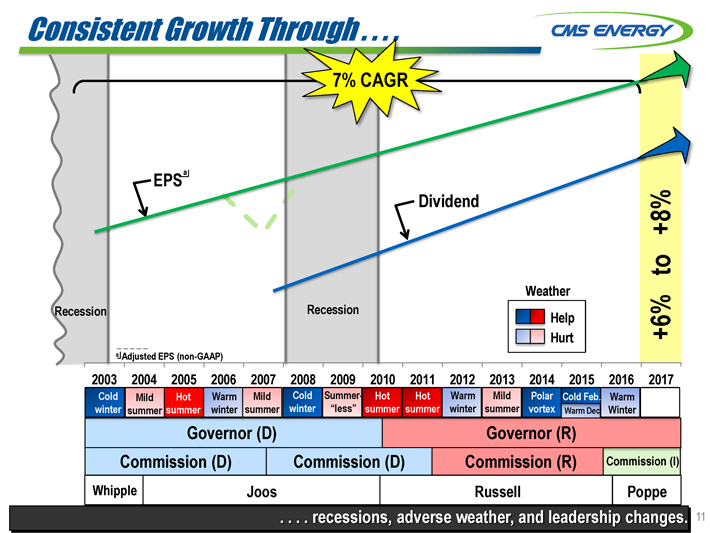
Consistent Growth Through . . . . CMS ENERGY
7%
CAGR
EPS a Dividend Recession Recession
Weather Help Hurt +6% to +8%
a Adjusted EPS (non-GAAP)
2003 2004
2005 2006 2007 2008 2009 2010 2011 2012 2013 2014 2015 2016 2017
Cold winter
Mild summer
Hot summer
Warm winter
Mild summer
Cold winter
Summer- “less”
Hot summer
Hot summer
Warm winter
Mild summer
Polar vortex
Cold Feb.
Warm Dec.
Warm Winter
Governor (D) Governor (R)
Commission (D) Commission (D) Commission (R) Commission (I)
Whipple Joos Russell Poppe
. . . . recessions, adverse weather, and
leadership changes. 11
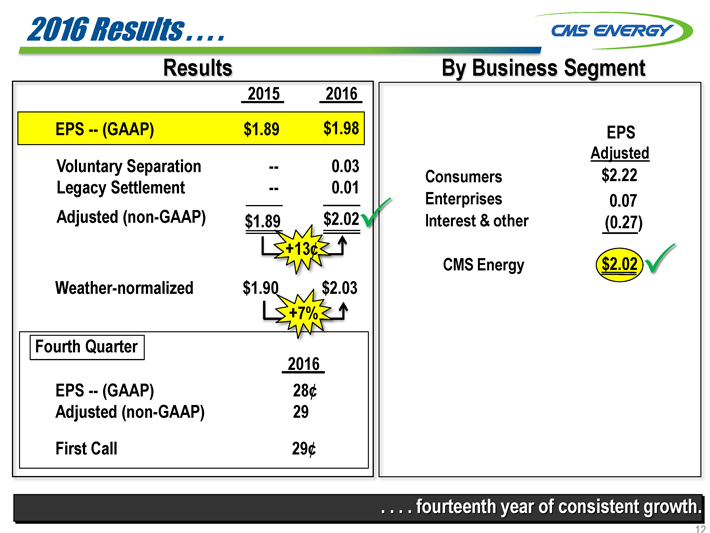
2016 Results . . . .
CMS ENERGY
Results
2015 2016
EPS -- (GAAP) $1.89 $1.98
Voluntary Separation -- 0.03
Legacy Settlement -- 0.01
Adjusted (non-GAAP) $1.89
$2.02
+13¢
Weather-normalized $1.90 $2.03
+7%
Fourth Quarter
2016
EPS -- (GAAP) 28¢
Adjusted (non-GAAP) 29
First Call 29¢
By Business Segment
EPS Adjusted
Consumers $2.22
Enterprises 0.07
Interest & Other (0.27)
CMS Energy $2.02
. . . . fourteenth year of consistent growth.
12
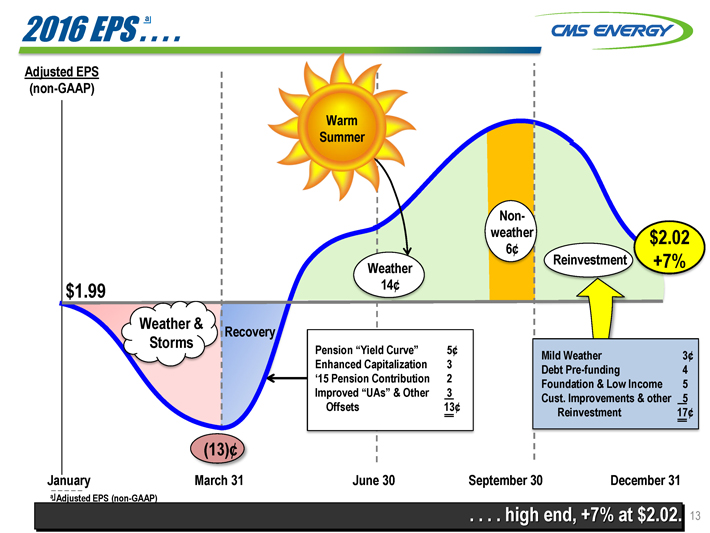
2016 EPSa . . . . CMS ENERGY
Adjusted EPS (non-GAAP)
Warm Summer
$1.99
Weather
14¢
Non-weather 6¢
Reinvestment
$2.02 +7%
Weather & Storms
Recovery
Pension “Yield Curve” 5¢
Enhanced Capitalization 3
‘15 Pension Contribution 2
Improved “UAs” & Other 3
Offsets 13¢
Mild Weather 3¢
Debt Pre-funding 4
Foundation & Low Income 5
Cust. Improvements & other 5
Reinvestment 17¢
(13)¢
January March 31 June 30 September 30 December 31
a Adjusted EPS (non-GAAP)
. . . . high end, +7% at $2.02. 13
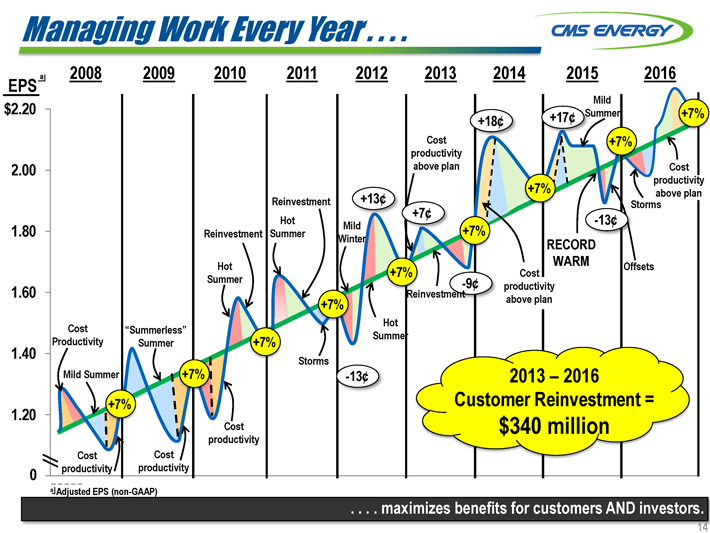
Managing Work Every Year . . . .
CMS ENERGY
2008 2009 2010 2011 2012 2013 2014 2015 2016
EPS a
$ 2.20
2.00
1.80
1.60
1.40
1.20
0
Cost Productivity
Mild Summer
“Summerless” Summer
Reinvestment
Hot Summer
Reinvestment
Hot Summer
Mild Winter
+13¢
Cost productivity above plan
+7¢
+18¢
+17¢
Mild Summer
+7%
+7%
+7%
+7%
+7%
+7%
+7%
+7%
+7%
Cost productivity
Cost productivity
Cost productivity
Storms
-13¢
Hot Summer
Reinvestment
-9¢
Cost productivity above plan
RECORD WARM
-13¢
Storms
Offsets
Cost productivity above plan
2013 – 2016
Customer Reinvestment =
$340 million
a Adjusted EPS (non-GAAP)
. . . . maximizes benefits for customers AND investors.
14
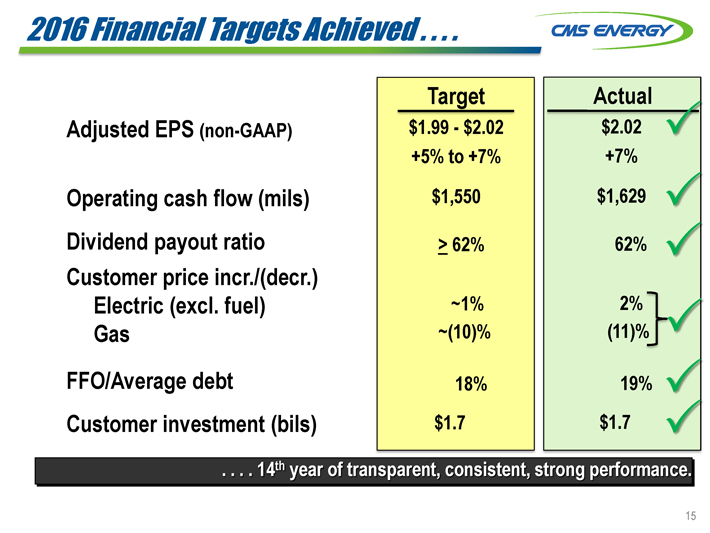
2016 Financial Targets Achieved . . . . CMS ENERGY
Target Actual
Adjusted EPS (non-GAAP)
$1.99 - $2.02 $2.02
+5% to +7% +7%
Operating cash flow (mils) $1,550 $1,629
Dividend payout ratio ³ 62% 62%
Customer price incr./(decr.)
Electric (excl. fuel) ~1% 2%
Gas ~(10)% (11)%
FFO/Average debt 18%19%
Customer investment (bils) $1.7 $1.7
. . . . 14th year of transparent, consistent, strong
performance.
15
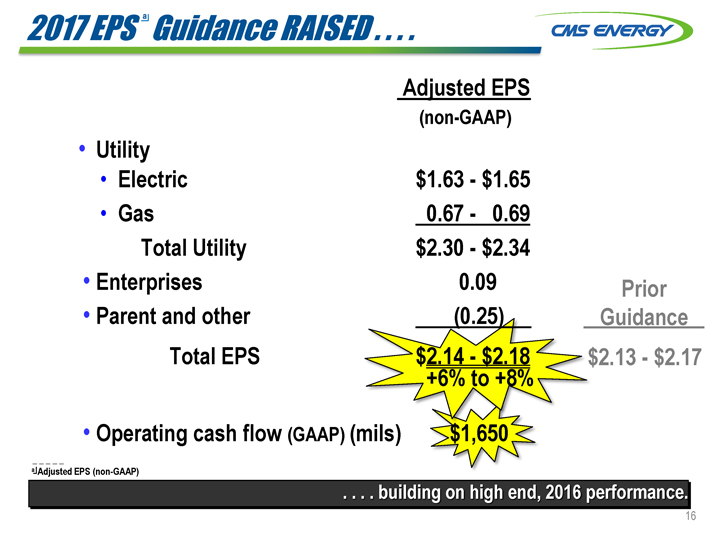
2017 EPS a Guidance RAISED . . . . CMS ENERGY
Adjusted EPS
(non-GAAP)
• Utility
• Electric
$1.63 - $ 1.65
• Gas 0.67 - 0.69
Total Utility $2.30 - $2.34
• Enterprises 0.09
Prior Guidance
• Parent and other (0.25)
Total EPS
$2.14 - $2.18
$2.13 - $2.17
+6% to +8%
• Operating cash flow (GAAP) (mils) $1,650
a Adjusted EPS
(non-GAAP)
. . . . building on high end, 2016 performance.
16
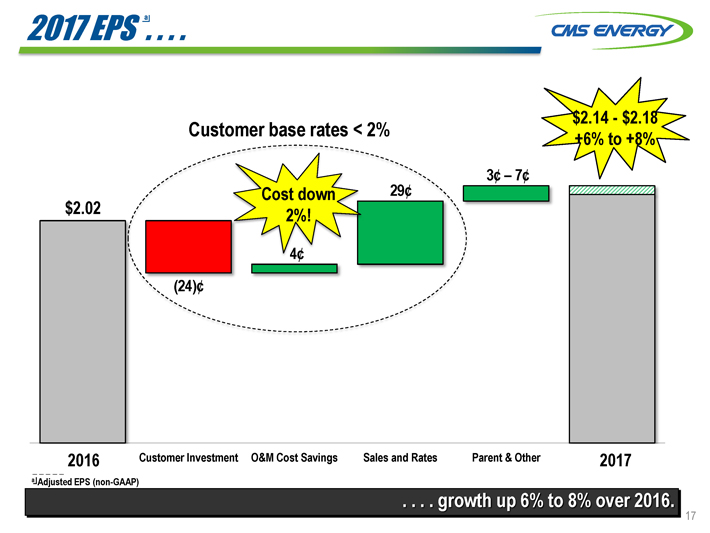
2017 EPS a . . . . CMS ENERGY
$2.02
Customer base rates < 2%
(24)¢
Cost down 2%!
4¢
29¢
3¢ - 7¢
$2.14 - $2.18
+6% to +8%
2016 Customer Investment O&M Cost Savings Sales and Rates Parent & Other 2017
a
Adjusted EPS (non-GAAP)
. . . . growth up 6% to 8% over 2016.
17
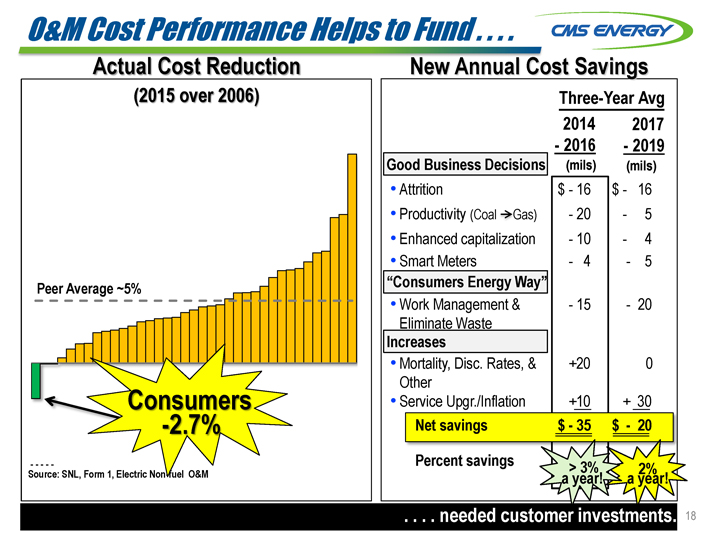
O&M Cost Performance Helps to Fund . . . . CMS ENERGY
Actual Cost Reduction
(2015 over 2006)
Peer Average ~5%
Consumers -2.7%
Source: SNL, Form 1, Electric Non-fuel O&M
New Annual Cost Savings
Three-Year Avg
2014 2017
- 2016 - 2019
Good Business Decisions (mils) (mils)
• Attrition $ - 16 $ - 16
• Productivity (Coal
g Gas) - 20 - 5
• Enhanced capitalization - 10 - 4
• Smart Meters - 4 - 5
“Consumers Energy Way”
• Work Management & - 15 - 20
Eliminate Waste
Increases
• Mortality, Disc. Rates, & Other +20 0
• Service Upgr./Inflation +10 + 30
Net savings $ - 35 $ - 20
Percent savings
> 3% a year!
2% a year!
.....
. . . . needed customer investments. 18
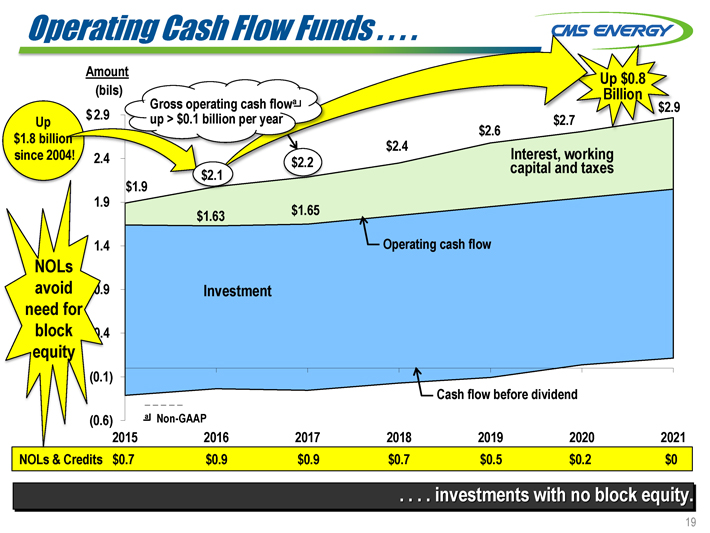
Operating Cash Flow Funds . . . . CMS ENERGY
Up
$1.8 billion
since 2004!
NOLs avoid need for block equity
Amount (bils)
$2.9
2.4
1.9
1.4
0.9
0.4
(0.1)
(0.6)
Gross operating cash flow a up > $0.1 billion per year
$1.9 $2.1 $2.2 $2.4 $2.6 $2.7 $2.9
Up $0.8 Billion
$1.63
$1.65
Interest, working capital and taxes
Investment
Operating cash flow
a Non-GAAP
Cash flow before dividend
2015 2016 2017 2018 2019 2020 2021
NOLs & Credits $0.7 $0.9 $0.9 $0.7 $0.5 $0.2 $0
. . . . investments with no block
equity.
19
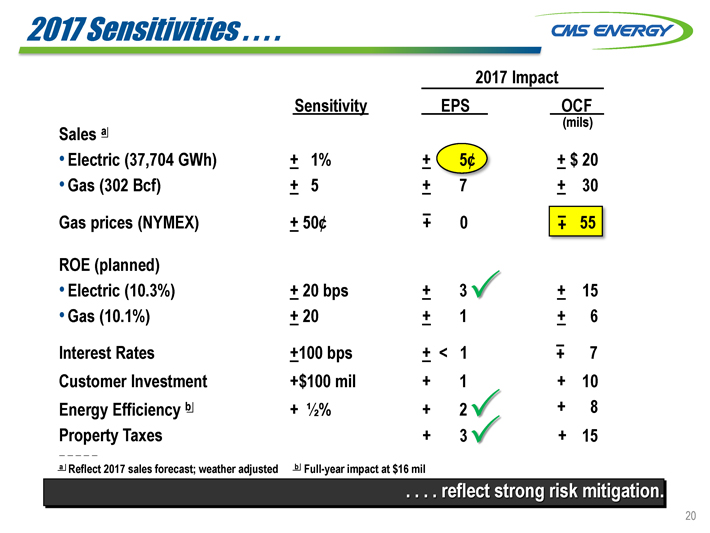
2017 Sensitivities . . . .
CMS ENERGY
2017 Impact
Sensitivity EPS OCF
(mils)
Sales a
Electric (37,704 GWh) + - 1% + - 5¢ + - $ 20
Gas (302 Bcf) + - 5 + - 7 + - 30
Gas prices (NYMEX) + - 50¢ + - 0 + - 55
ROE (planned)
Electric (10.3%) + - 20 bps + - 3 + - 15
Gas (10.1%) + - 20 + - 1 + - 6
Interest Rates + - 100 bps + - < 1 + - 7
Customer Investment +$100 mil + 1 + 10
Energy Efficiency b + 1/2% + 2 + 8
Property _ _ _ _ _ Taxes + 3 + 15
a Reflect 2017 sales forecast; weather adjusted b Full-year impact at $16 mil
. . . . reflect
strong risk mitigation.
20
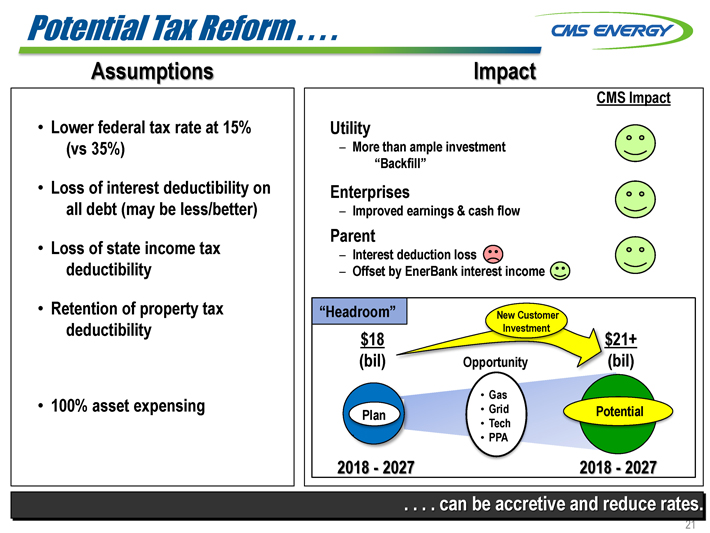
Potential Tax Reform . . . .
CMS Energy
Assumptions
Lower federal tax rate at 15% (vs 35%)
Loss of interest deductibility on all debt (may be less/better)
Loss of state income tax
deductibility
Retention of property tax deductibility
100% asset expensing
Impact
CMS Impact
Utility
– More than ample investment
“Backfill”
Enterprises
– Improved earnings & cash flow
Parent
– Interest deduction loss
– Offset by EnerBank interest income
“Headroom”
$18 (bil)
New Customer Investment
$21+ (bil)
Opportunity
Plan
Gas
Grid
Tech
PPA
Potential
2018 - 2027
2018 - 2027
. . . . can be accretive and reduce rates.
21
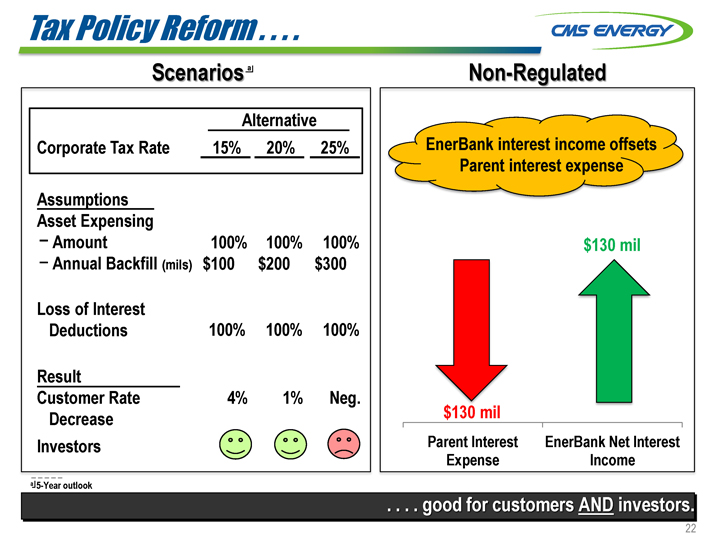
Tax Policy Reform . . . .
CMS ENERGY
Scenarios a
Alternative
Corporate Tax Rate 15% 20% 25%
Assumptions
Asset Expensing
- Amount 100% 100% 100%
- Annual Backfill (mils) $100 $200 $300
Loss of Interest
Deductions 100% 100% 100%
Result
Customer Rate 4% 1% Neg.
Decrease
Investors
Non-Regulated
EnerBank interest income offsets Parent interest expense
$130 mil
Parent Interest Expense
$130 mil
EnerBank Net Interest Income
a 5-Year outlook
. . . . good for customers AND investors.
22
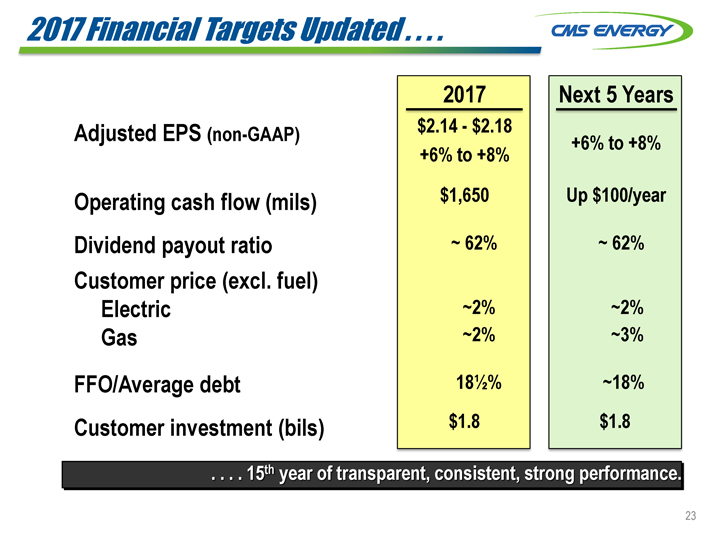
2017 Financial Targets Updated . . . .
2017 Next 5
Years
Adjusted EPS (non-GAAP) $2.14 - $2.18 +6% to +8%
+6% to +8%
Operating cash flow (mils) $1,650 Up $100/year
Dividend payout ratio ~ 62% ~ 62%
Customer price (excl. fuel)
Electric ~2% ~2%
Gas ~2% ~3%
FFO/Average debt 181/2% ~18%
Customer investment (bils) $1.8 $1.8
CMS ENERGY
. . . . 15th year of transparent, consistent, strong performance.
23
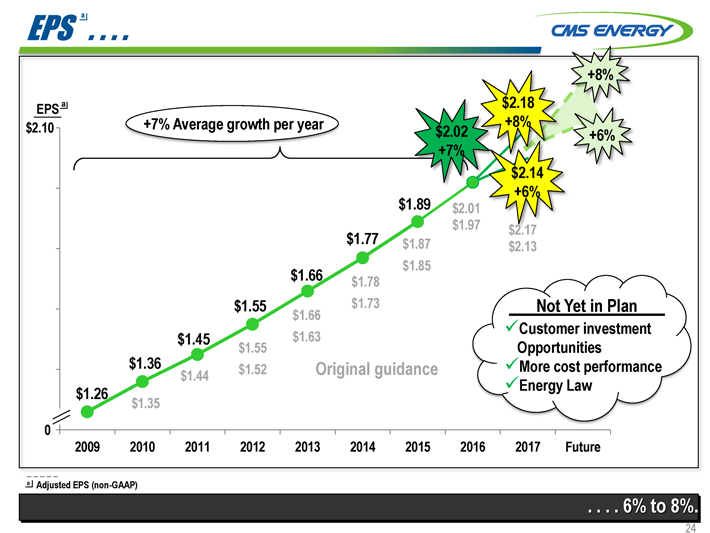
EPS a . . . .
CMS ENERGY
EPS a
$2.10
0
+7% Average growth per year
$2.02 +7%
$2.18 +8%
+8%
$2.14 +6%
+6%
$1.26
$1.36
$1.45
$1.55
$1.66
$1.77
$1.89
$1.35
$1.44
$1.55 $1.52
$1.66 $1.63
$1.78 $1.73
$1.87 $1.85
$2.01 $1.97
$2.17 $2.13
Original guidance
Not Yet in Plan
Customer investment Opportunities
More cost performance
Energy Law
2009 2010 2011 2012 2013 2014 2015 2016 2017 Future
a Adjusted EPS (non-GAAP)
. . . . 6% to 8%.
24

Q & A
Appendix
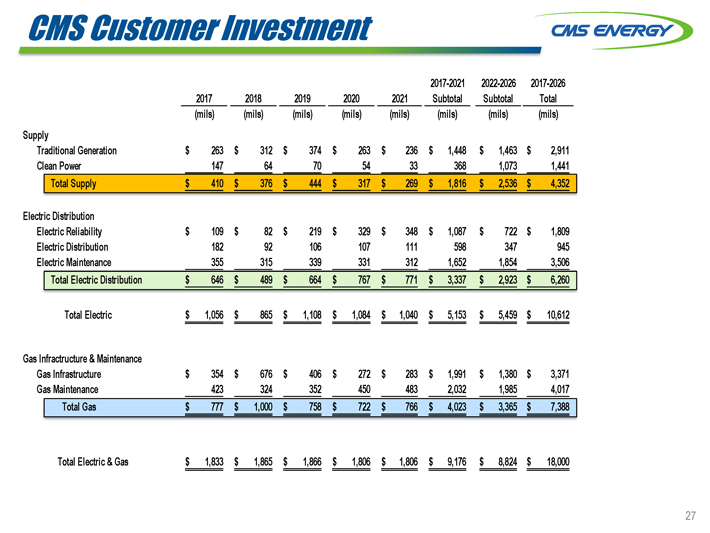
CMS Customer Investment
CMS ENERGY
2017-2021 2022-2026 2017-2026
2017 2018 2019 2020 2021 Subtotal Subtotal Total
(mils) (mils) (mils) (mils) (mils) (mils) (mils) (mils)
Supply
Traditional Generation $ 263 $ 312 $ 374 $ 263 $ 236 $ 1,448 $ 1,463 $ 2,911
Clean Power 147
64 70 54 33 368 1,073 1,441
Total Supply $ 410 $ 376 $ 444 $ 317 $ 269 $ 1,816 $ 2,536 $ 4,352
Electric Distribution
Electric Reliability $109 $ 82 $ 219 $ 329 $ 348 $ 1,087 $ 722 $ 1,809
Electric Distribution 182 92 106 107 111 598 347 945
Electric Maintenance 355
315 339 331 312 1,652 1,854 3,506
Total Electric Distribution $ 646 $ 489 $ 664 $ 767 $ 771 $ 3,337 $ 2,923 $ 6,260
Total Electric $ 1,056 $ 865 $ 1,108 $ 1,084 $ 1,040 $ 5,153 $ 5,459 $ 10,612
Gas
Infractructure & Maintenance
Gas Infrastructure $ 354 $ 676 $ 406 $ 272 $ 283 $ 1,991 $ 1,380 $ 3,371
Gas Maintenance 423 324 352 450 483 2,032 1,985 4,017
Total Gas $ 777 $ 1,000 $ 758 $ 722 $
766 $ 4,023 $ 3,365 $ 7,388
Total Electric & Gas $ 1,833 $ 1,865 $ 1,866 $ 1,806 $ 1,806 $ 9,176 $ 8,824 $ 18,000
27
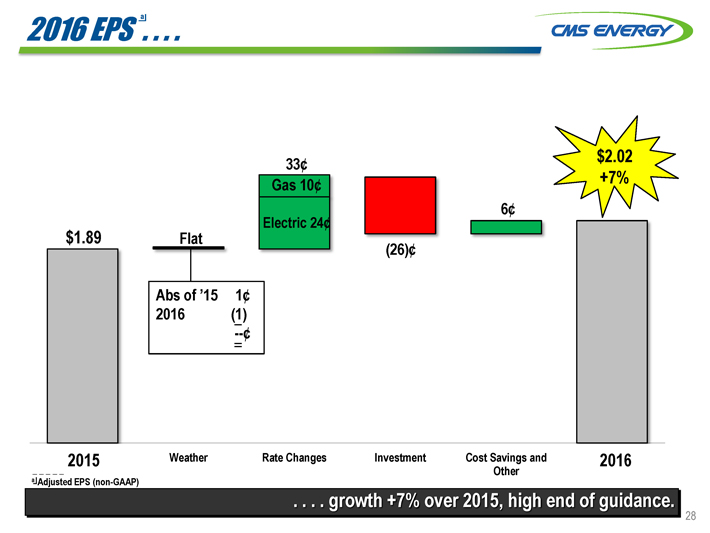
2016 EPS a . . . .
CMS ENERGY
$1.89
Flat
Abs of ’15 1¢
2016 (1)
--¢
33¢ Gas 10¢
Electric 24¢
(26)¢
6¢
$2.02 +7%
2015 Weather Rate Changes Investment Cost Savings and Other 2016
a Adjusted EPS (non-GAAP)
. . . . growth +7% over 2015, high end of guidance.
28
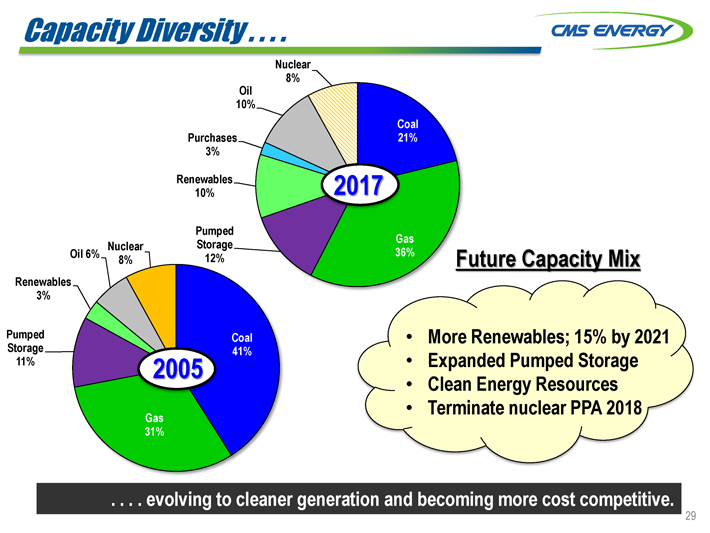
Capacity Diversity . . . .
CMS ENERGY
Pumped Storage 11%
Renewables 3%
Oil 6%
Nuclear 8%
2005
Gas 31%
Coal 41%
Pumped Storage 12%
Renewables 10%
Purchases
3%
Oil 10%
Nuclear 8%
2017
Coal 21%
Gas
36%
Future Capacity Mix
• More Renewables; 15% by 2021
• Expanded Pumped Storage
• Clean Energy Resources
• Terminate nuclear PPA 2018
. . . . evolving to cleaner generation and becoming more cost competitive.
29
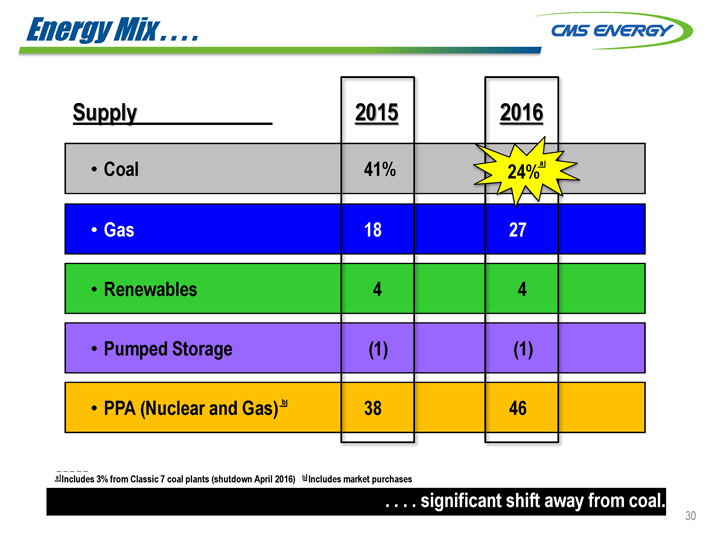
Energy Mix . . . .
CMS ENERGY
Supply 2015 2016
• Coal 41% 24%a
• Gas 18 27
• Renewables 4 4
• Pumped Storage (1) (1)
• PPA (Nuclear and Gas) b 38 46
_ _ _ _ _ a Includes 3% from Classic 7 coal plants (shutdown April 2016) b Includes market purchases
. . . . significant shift away from coal.
30
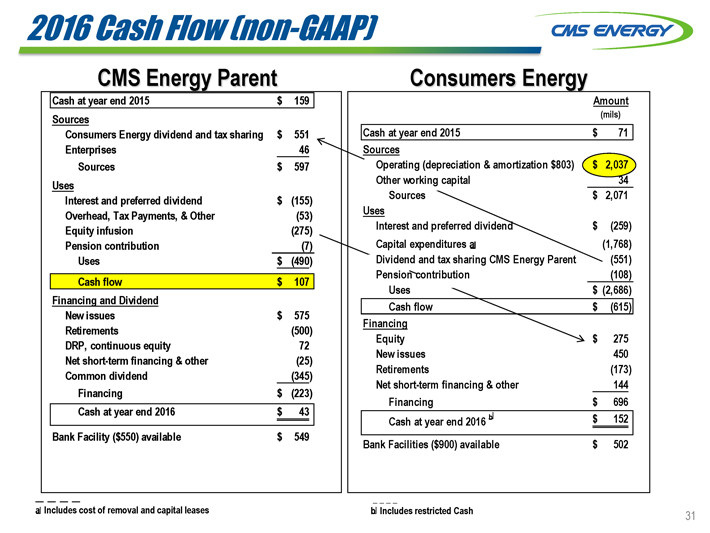
2016 Cash Flow (non-GAAP)
CMS ENERGY
CMS Energy Parent
Cash at year end 2015 $159
Sources
Consumers Energy dividend and tax sharing $551
Enterprises 46
Sources $597
Uses
Interest and preferred dividend $(155)
Overhead, Tax Payments, & Other (53)
Equity infusion (275)
Pension contribution (7)
Uses $(490)
Cash flow $107
Financing and Dividend
New issues $575
Retirements (500)
DRP, continuous equity 72
Net short-term financing & other (25)
Common dividend (345)
Financing $(223)
Cash at year end 2016 $43
Bank Facility ($550) available $549
Consumers Energy
Amount
(mils)
Cash at year end 2015 $71
Sources
Operating (depreciation & amortization $803) $2,037
Other working capital 34
Sources $2,071
Uses
Interest and preferred dividend $(259)
Capital expenditures a (1,768)
Dividend and tax sharing CMS Energy Parent (551)
Pension contribution (108)
Uses $(2,686)
Cash flow $(615)
Financing
Equity $275
New issues 450
Retirements (173)
Net short-term financing & other 144
Financing $696
Cash at year end 2016 b $152
Bank Facilities ($900) available $502
a Includes cost of removal and capital leases b Includes restricted Cash 31
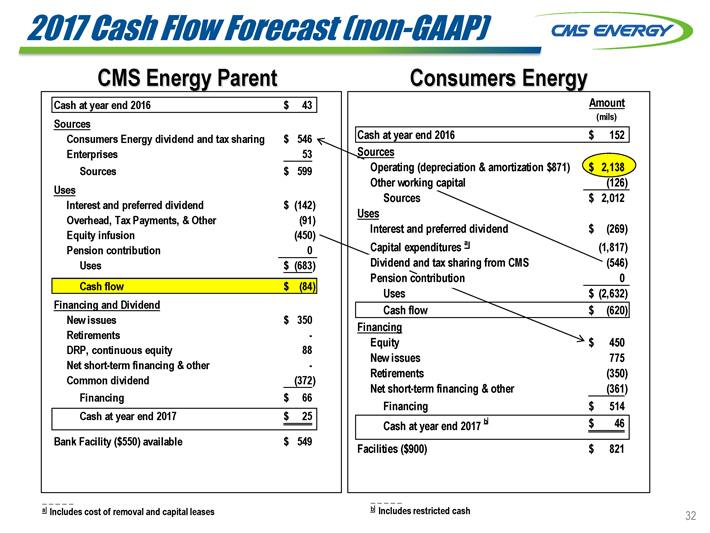
2017 Cash Flow Forecast (non-GAAP)
CMS ENERGY
CMS Energy Parent
Cash at year end 2016 $43
Sources
Consumers Energy dividend and tax sharing $546
Enterprises 53
Sources $599
Uses
Interest and preferred dividend $(142)
Overhead, Tax Payments, & Other (91)
Equity infusion (450)
Pension contribution 0
Uses $(683)
Cash flow $(84)
Financing and Dividend
New issues $350
Retirements —
DRP, continuous equity 88
Net short-term financing & other —
Common dividend (372)
Financing $66
Cash at year end 2017 $25
Bank Facility ($550) available $549
Consumers Energy
Amount
(mils)
Cash at year end 2016 $152
Sources
Operating (depreciation & amortization $871) $2,138
Other working capital (126)
Sources $2,012
Uses
Interest and preferred dividend $(269)
Capital expenditures a (1,817)
Dividend and tax sharing from CMS (546)
Pension contribution 0
Uses $(2,632)
Cash flow $(620)
Financing
Equity $450
New issues 775
Retirements (350)
Net short-term financing & other (361)
Financing $514
Cash at year end 2017 b $46
Facilities ($900) $821
a Includes cost of removal and capital leases b Includes restricted cash
32

GAAP Reconciliation
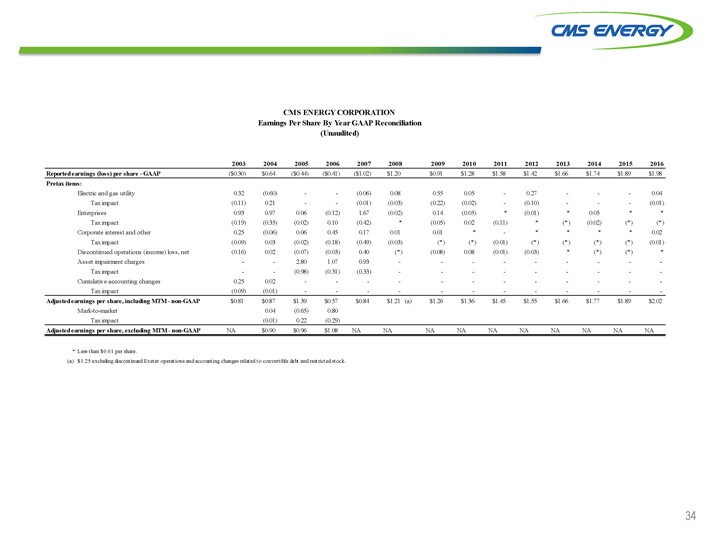
CMS ENERGY
CMS ENERGY CORPORATION
Earnings Per Share By Year GAAP Reconciliation
(Unaudited)
2003 2004 2005 2006 2007 2008 2009 2010 2011 2012 2013 2014 2015 2016
Reported earnings (loss)
per share - GAAP ($0.30) $0.64 ($0.44) ($0.41) ($1.02) $1.20 $0.91 $1.28 $1.58 $1.42 $1.66 $1.74 $1.89 $1.98
Pretax items:
Electric and gas utility 0.32 (0.60) — — (0.06) 0.08 0.55 0.05 — 0.27 — — — 0.04
Tax impact (0.11) 0.21 — — (0.01) (0.03) (0.22) (0.02) — (0.10) — — — (0.01)
Enterprises 0.93 0.97 0.06 (0.12) 1.67 (0.02) 0.14 (0.05)* (0.01)* 0.05* *
Tax impact (0.19)
(0.35) (0.02) 0.10 (0.42)* (0.05) 0.02 (0.11)* (*) (0.02) (*) (*)
Corporate interest and other 0.25 (0.06) 0.06 0.45 0.17 0.01 0.01* -* * * * 0.02
Tax impact (0.09) 0.03 (0.02) (0.18) (0.49) (0.03) (*) (*) (0.01) (*) (*) (*) (*) (0.01)
Discontinued operations (income) loss, net (0.16) 0.02 (0.07) (0.03) 0.40 (*) (0.08) 0.08 (0.01) (0.03)* (*) (*) *
Asset impairment charges — — 2.80 1.07 0.93 — — — — — — — — —
Tax impact — — (0.98) (0.31) (0.33) — — — — — — — — —
Cumulative accounting changes 0.25 0.02 — — — — — — — — — — — —
Tax impact (0.09) (0.01) — — — — — — — — — — — —
Adjusted earnings per share, including MTM - non-GAAP $0.81 $0.87 $1.39 $0.57 $0.84 $1.21 (a) $1.26 $1.36 $1.45 $1.55 $1.66 $1.77 $1.89
$2.02
Mark-to-market 0.04 (0.65) 0.80
Tax impact (0.01) 0.22 (0.29)
Adjusted earnings per share, excluding MTM - non-GAAP NA $0.90 $0.96 $1.08 NA NA NA NA NA NA NA NA NA NA
* Less than $0.01 per share.
(a) $1.25 excluding discontinued Exeter operations and accounting changes related to convertible debt and restricted stock.
34
CMS ENERGY
CMS ENERGY CORPORATION
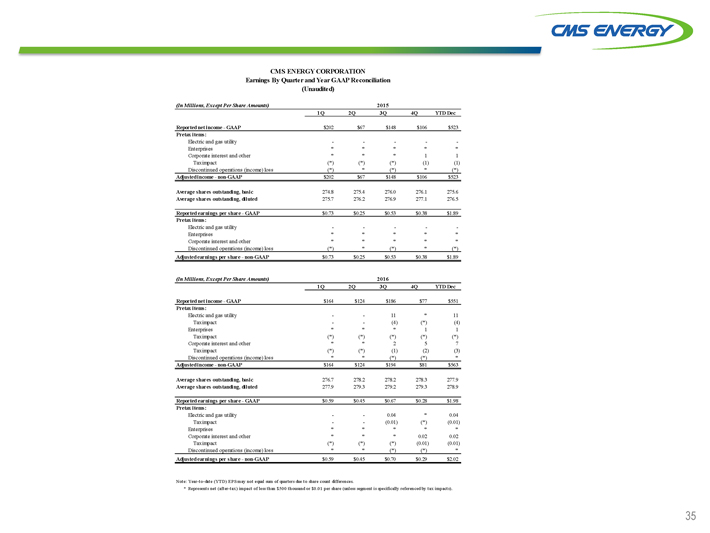
Earnings By Quarter and Year GAAP Reconciliation (Unaudited)
(In Millions, Except Per Share
Amounts) 2015
1Q 2Q 3Q 4Q YTD Dec
Reported net income - GAAP $202 $67 $148
$106 $523
Pretax items:
Electric and gas utility — — — —
—
Enterprises * * * * *
Corporate interest and other * * * 1 1
Tax impact (*) (*) (*) (1) (1)
Discontinued operations (income) loss (*) *
(*) * (*)
Adjusted income - non-GAAP $202 $67 $148 $106 $523
Average shares outstanding, basic 274.8 275.4 276.0 276.1 275.6
Average shares outstanding,
diluted 275.7 276.2 276.9 277.1 276.5
Reported earnings per share - GAAP $0.73 $0.25 $0.53 $0.38 $1.89
Pretax items:
Electric and gas utility — — — — —
Enterprises * * * * *
Corporate interest and other * * * * *
Discontinued operations (income) loss (*) * (*) * (*)
Adjusted earnings per share - non-GAAP $0.73 $0.25 $0.53 $0.38 $1.89
(In Millions, Except Per Share Amounts) 2016
1Q 2Q 3Q 4Q YTD Dec
Reported net income - GAAP $164 $124 $186 $77 $551
Pretax items:
Electric and gas utility — — 11* 11
Tax impact — — (4) (*) (4)
Enterprises * * * 1 1
Tax impact (*) (*) (*) (*) (*)
Corporate interest and other * * 2 5 7
Tax impact (*) (*) (1) (2) (3)
Discontinued operations (income) loss * * (*) (*) *
Adjusted income - non-GAAP $164 $124 $194 $81 $563
Average shares outstanding, basic 276.7 278.2 278.2 278.3 277.9
Average
shares outstanding, diluted 277.9 279.3 279.2 279.3 278.9
Reported earnings per share - GAAP $0.59 $0.45 $0.67 $0.28 $1.98
Pretax items:
Electric and gas utility — — 0.04* 0.04
Tax impact — — (0.01) (*) (0.01)
Enterprises * * * * *
Corporate interest and other * * * 0.02 0.02
Tax impact (*) (*) (*) (0.01) (0.01)
Discontinued operations (income) loss * * (*) (*) *
Adjusted earnings per share - non-GAAP $0.59 $0.45 $0.70 $0.29 $2.02
Note:
Year-to-date (YTD) EPS may not equal sum of quarters due to share count differences.
* Represents net (after-tax) impact of less than $500 thousand or $0.01 per share (unless segment is specifically
referenced by tax impacts).
35
CMS ENERGY
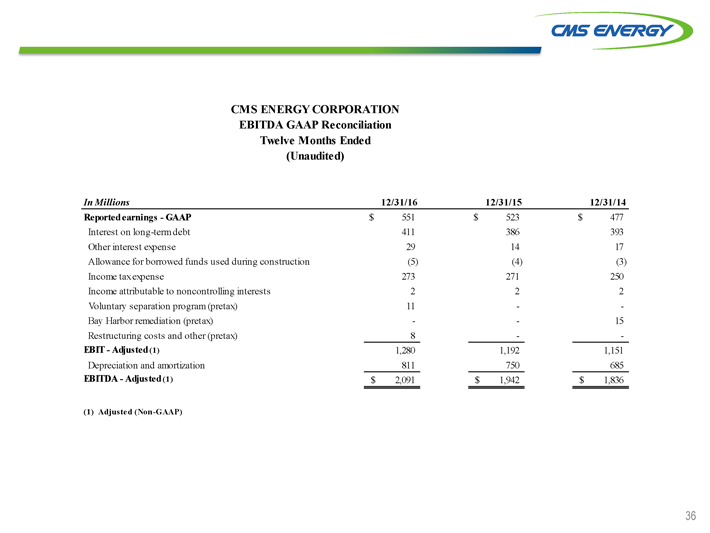
CMS ENERGY CORPORATION
EBITDA GAAP Reconciliation
Twelve Months Ended
(Unaudited)
In Millions 12/31/16 12/31/15 12/31/14
Reported earnings - GAAP $551 $523 $477
Interest on long-term debt 411 386 393
Other interest expense 29 14 17
Allowance for borrowed funds used during construction (5) (4)
(3)
Income tax expense 273 271 250
Income attributable to noncontrolling
interests 2 2 2
Voluntary separation program (pretax) 11 — —
Bay
Harbor remediation (pretax) — — 15
Restructuring costs and other (pretax) 8 — —
EBIT - Adjusted (1) 1,280 1,192 1,151
Depreciation and amortization 811 750 685
EBITDA - Adjusted (1) $2,091 $1,942 $1,836
(1) Adjusted
(Non-GAAP)
36
CMS ENERGY
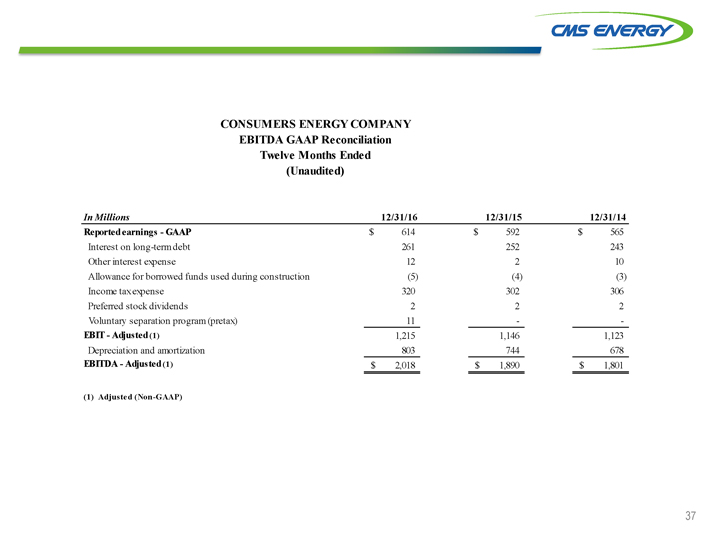
CONSUMERS ENERGY COMPANY
EBITDA GAAP Reconciliation
Twelve Months Ended
(Unaudited)
In Millions 12/31/16 12/31/15 12/31/14
Reported earnings - GAAP $614 $592 $565
Interest on long-term debt 261 252 243
Other interest expense 12 2 10
Allowance for borrowed funds used during construction (5) (4)
(3)
Income tax expense 320 302 306
Preferred stock dividends 2 2 2
Voluntary separation program (pretax) 11 - -
EBIT - Adjusted (1) 1,215 1,146
1,123
Depreciation and amortization 803 744 678
EBITDA - Adjusted (1) $2,018
$1,890 $1,801
(1) Adjusted (Non-GAAP)
37
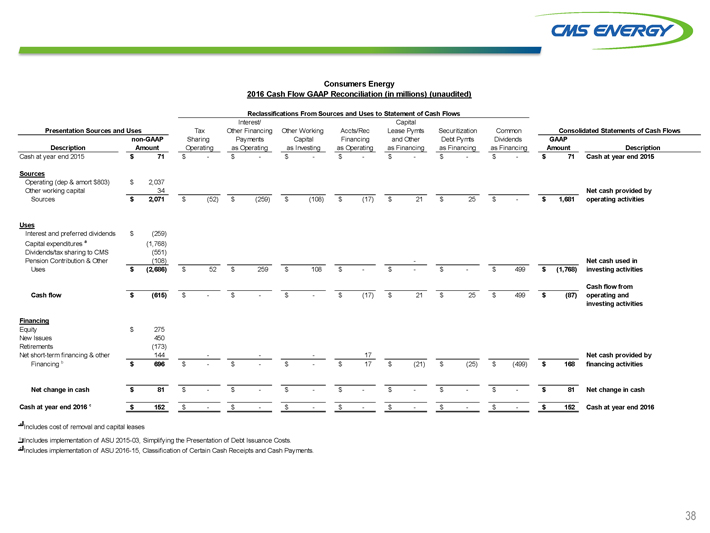
CMS ENERGY
Consumers Energy
2016 Cash Flow GAAP Reconciliation (in millions) (unaudited)
Reclassifications From Sources
and Uses to Statement of Cash Flows
Interest/ Capital
Presentation Sources
and Uses Tax Other Financing Other Working Accts/Rec Lease Pymts Securitization Common Consolidated Statements of Cash Flows
non-GAAP Sharing Payments Capital Financing and Other Debt Pymts Dividends GAAP
Description Amount Operating as Operating as Investing as Operating as Financing as Financing as Financing Amount Description
Cash at year end 2015 $71 $ - $ - $ - $ - $ - $ - $ - $71 Cash at year end 2015
Sources
Operating (dep & amort $803) $2,037
Other working capital 34 Net
cash provided by
Sources $2,071 $(52) $(259) $(108) $(17) $21 $25 $- $1,681 operating activities
Uses
Interest and preferred dividends $(259)
Capital expenditures a (1,768)
Dividends/tax sharing to CMS (551)
Pension Contribution & Other (108) - Net cash used in
Uses $(2,686) $52 $259 $108 $-
$- $- $499 $(1,768) investing activities
Cash flow from
Cash flow $(615) $ -
$ - $ - $(17) $21 $25 $499 $(87) operating and
investing activities
Financing
Equity $275
New Issues 450
Retirements (173)
Net short-term financing & other 144 - - - 17 Net cash provided by
Financing b $696 $ - $ - $ - $17 $(21) $(25) $(499) $168 financing activities
Net change in cash $81 $ - $ - $ - $ - $ - $ - $ - $81 Net change in cash
Cash at year end 2016 c $152 $ - $ - $ - $ - $ - $ - $ - $152 Cash at year end 2016
a Includes cost of removal and capital leases b Includes implementation of ASU 2015-03, Simplifying the Presentation of Debt Issuance Costs.
c Includes implementation of ASU 2016-15, Classification of Certain Cash Receipts and Cash Payments.
38
CMS ENERGY
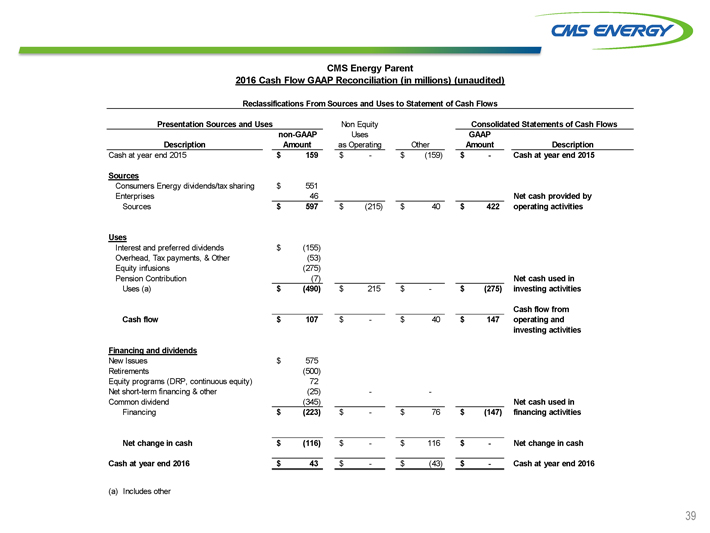
CMS Energy Parent
2016 Cash Flow GAAP Reconciliation (in millions) (unaudited)
Reclassifications From Sources
and Uses to Statement of Cash Flows
Presentation Sources and Uses Non Equity Consolidated Statements of Cash Flows
non-GAAP Uses GAAP
Description Amount as Operating
Other Amount Description
Cash at year end 2015 $159 $ - $(159) $ - Cash at year end 2015
Sources
Consumers Energy dividends/tax sharing $551
Enterprises 46 Net cash provided by
Sources $597 $(215) $40 $422 operating activities
Uses
Interest and preferred dividends $(155)
Overhead, Tax payments, & Other (53)
Equity infusions (275)
Pension Contribution (7) Net cash used in
Uses (a) $(490) $215 $ - $(275) investing activities
Cash flow from
Cash flow $107 $ - $40 $147 operating and
investing activities
Financing and dividends
New Issues $575
Retirements (500)
Equity programs (DRP, continuous equity) 72
Net short-term financing & other (25) - -
Common dividend (345) Net cash used in
Financing $(223) $ - $76 $(147)
financing activities
Net change in cash $(116) $ - $116 $ - Net change in cash
Cash at year end 2016 $43 $ - $(43) $ - Cash at year end 2016
(a) Includes
other
39
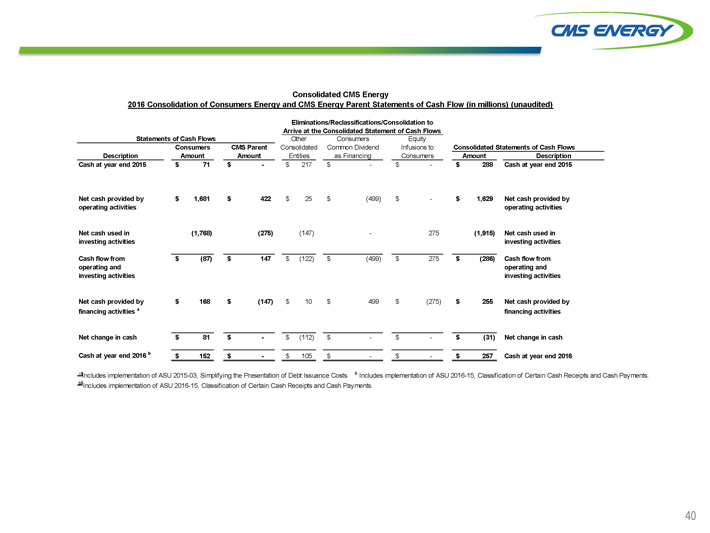
CMS ENERGY
Consolidated CMS Energy
2016 Consolidation of Consumers Energy and CMS Energy Parent Statements of Cash Flow (in millions) (unaudited)
Eliminations/Reclassifications/Consolidation to
Arrive at the Consolidated Statement of Cash
Flows
Statements of Cash Flows Other Consumers Equity
Consumers CMS Parent
Consolidated Common Dividend Infusions to Consolidated Statements of Cash Flows
Description Amount Amount Entities as Financing Consumers Amount Description
Cash at year end 2015 $71 $ - $217 $ - $ - $288 Cash at year end 2015
Net
cash provided by $1,681 $422 $25 $(499) $ - $1,629 Net cash provided by
operating activities operating activities
Net cash used in (1,768) (275) (147) - 275 (1,915) Net cash used in
investing activities
investing activities
Cash flow from $(87) $147 $(122) $(499) $275 $(286) Cash flow from
operating and operating and
investing activities investing activities
Net cash provided by $168 $(147) $10 $499 $(275) $255 Net cash provided by
financing
activities a financing activities
Net change in cash $81 $ - $(112) $ - $ - $(31) Net change in cash
Cash at year end 2016 b $152 $ - $105 $ - $ - $257 Cash at year end 2016
a Includes
implementation of ASU 2015-03, Simplifying the Presentation of Debt Issuance Costs. b Includes implementation of ASU 2016-15, Classification of Certain Cash Receipts and
Cash Payments. b Includes implementation of ASU 2016-15, Classification of Certain Cash Receipts and Cash Payments.
40
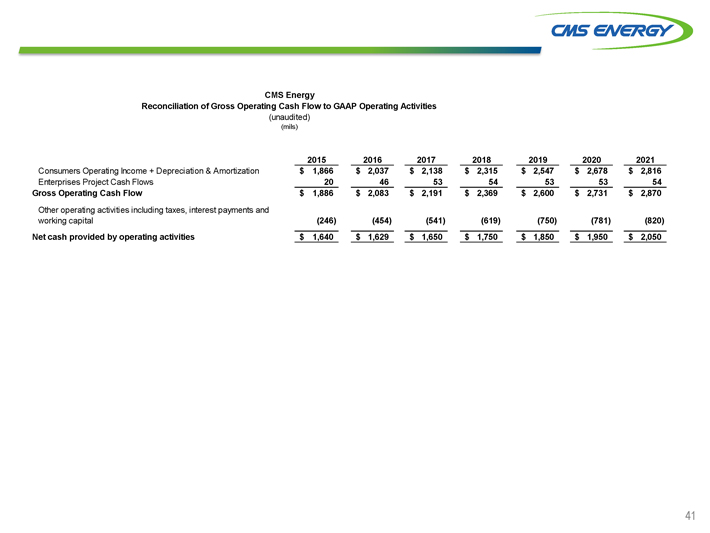
CMS ENERGY
CMS Energy
Reconciliation of Gross Operating Cash Flow to GAAP Operating Activities
(unaudited)
(mils)
2015 2016 2017 2018 2019 2020 2021
Consumers Operating Income + Depreciation & Amortization $1,866 $2,037 $2,138 $2,315 $2,547 $2,678 $2,816
Enterprises Project Cash Flows 20 46 53 54 53 53 54
Gross Operating Cash Flow $1,886 $2,083
$2,191 $2,369 $2,600 $2,731 $2,870
Other operating activities including taxes, interest payments and working capital (246) (454) (541) (619) (750) (781) (820)
Net cash provided by operating activities $1,640 $1,629 $1,650 $1,750 $1,850 $1,950 $2,050
41
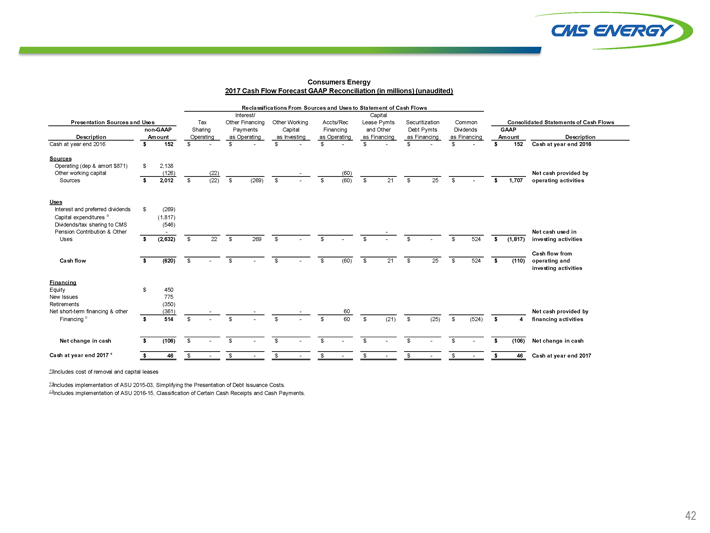
CMS ENERGY
Consumers Energy
2017 Cash Flow Forecast GAAP Reconciliation (in millions) (unaudited)
Reclassifications From
Sources and Uses to Statement of Cash Flows
Interest/ Capital
Presentation
Sources and Uses Tax Other Financing Other Working Accts/Rec Lease Pymts Securitization Common Consolidated Statements of Cash Flows
non-GAAP Sharing Payments Capital Financing and Other Debt Pymts Dividends GAAP
Description Amount Operating as Operating as Investing as Operating as Financing as Financing as Financing Amount Description
Cash at year end 2016 $152 $ - $ - $ - $ - $ - $ - $ - $152 Cash at year end 2016
Sources
Operating (dep & amort $871) $2,138
Other working capital (126) (22)
- (60) Net cash provided by
Sources $2,012 $(22) $(269) $ - $(60) $21 $25 $ - $1,707 operating activities
Uses
Interest and preferred dividends $(269)
Capital expenditures a (1,817)
Dividends/tax sharing to CMS (546)
Pension Contribution & Other - - Net cash used in
Uses $(2,632) $22 $269 $ - $ - $ -
$ - $524 $(1,817) investing activities
Cash flow from
Cash flow $(620) $ - $
- $ - $(60) $21 $25 $524 $(110) operating and
investing activities
Financing
Equity $450
New Issues 775
Retirements (350)
Net short-term financing & other (361) - - - 60 Net cash provided
by
Financing b $514 $ - $ - $ - $60 $(21) $(25) $(524) $4 financing activities
Net change in cash $(106) $ - $ - $ - $ - $ - $ - $ - $(106) Net change in cash
Cash at year end 2017 c $46 $ - $ - $ - $ - $ - $ - $ - $46 Cash at year end 2017
a Includes cost of removal and capital leases
b Includes implementation of ASU 2015-03, Simplifying the Presentation of Debt Issuance Costs. c Includes implementation of ASU 2016-15, Classification of Certain Cash Receipts and Cash Payments.
42
CMS ENERGY
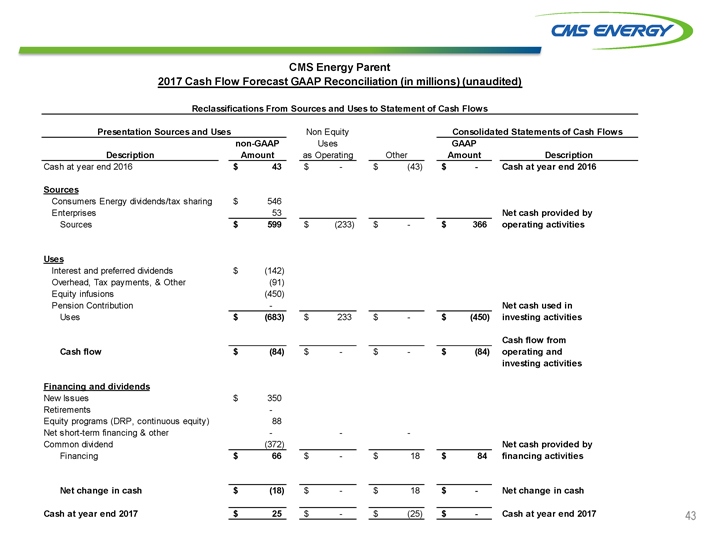
CMS Energy Parent
2017 Cash Flow Forecast GAAP Reconciliation (in millions) (unaudited)
Reclassifications From
Sources and Uses to Statement of Cash Flows
Presentation Sources and Uses Non Equity Consolidated Statements of Cash Flows
non-GAAP Uses GAAP
Description Amount as Operating
Other Amount Description
Cash at year end 2016 $43 $ - $(43) $ - Cash at year end 2016
Sources
Consumers Energy dividends/tax sharing $546
Enterprises 53 Net cash provided by
Sources $599 $(233) $ - $366 operating activities
Uses
Interest and preferred dividends $(142)
Overhead, Tax payments, & Other (91)
Equity infusions (450)
Pension Contribution - Net cash used in
Uses $(683) $233 $ - $(450) investing activities
Cash flow from
Cash flow $(84) $ - $ - $(84) operating and
investing activities
Financing and dividends
New Issues $350
Retirements -
Equity programs (DRP, continuous equity) 88
Net short-term financing & other - - -
Common dividend (372) Net cash provided by
Financing $66 $ - $18 $84
financing activities
Net change in cash $(18) $ - $18 $ - Net change in cash
Cash at year end 2017 $25 $ - $(25) $ - Cash at year end 2017
43
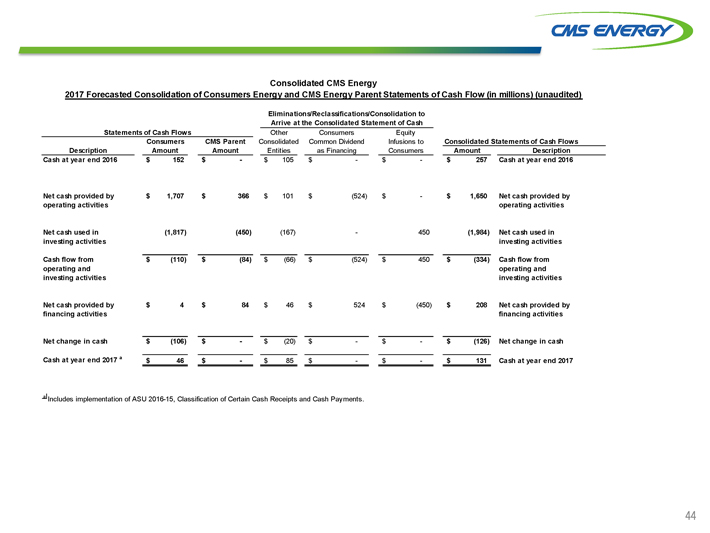
CMS ENERGY
Consolidated CMS Energy
2017 Forecasted Consolidation of Consumers Energy and CMS Energy Parent Statements of Cash Flow (in millions) (unaudited)
Eliminations/Reclassifications/Consolidation to
Arrive at the Consolidated Statement of Cash
Statements of Cash Flows Other Consumers Equity
Consumers CMS Parent
Consolidated Common Dividend Infusions to Consolidated Statements of Cash Flows
Description Amount Amount Entities as Financing Consumers Amount Description
Cash at year end 2016 $152 $ - $105 $ - $ - $257 Cash at year end 2016
Net
cash provided by $1,707 $366 $101 $(524) $ - $1,650 Net cash provided by
operating activities operating activities
Net cash used in (1,817) (450) (167) - 450 (1,984) Net cash used in
investing activities
investing activities
Cash flow from $(110) $(84) $(66) $(524) $450 $(334) Cash flow from
operating and operating and
investing activities investing activities
Net cash provided by $4 $84 $46 $524 $(450) $208 Net cash provided by
financing activities
financing activities
Net change in cash $(106) $ - $(20) $ - $ - $(126) Net change in cash
Cash at year end 2017 a $46 $ - $85 $ - $ - $131 Cash at year end 2017
a Includes
implementation of ASU 2016-15, Classification of Certain Cash Receipts and Cash Payments.
44