Attached files
| file | filename |
|---|---|
| EX-99.1 - EXHIBIT 99.1 - BEACON ROOFING SUPPLY INC | v457852_ex99-1.htm |
| 8-K - 8-K - BEACON ROOFING SUPPLY INC | v457852_8k.htm |
Exhibit 99.2

NASDAQ: BECN February 2, 2017 2017 First Quarter Earnings Call

2017 First Quarter Earnings Call February 2, 2017 www.BECN.com 2 Forward Looking Statements This presentation contains information about management's view of the Company's future expectations, plans and prospects that constitute forward - looking statements for purposes of the safe harbor provisions under the Private Securities Litigation Reform Act of 1995 . Actual results may differ materially from those indicated by such forward - looking statements as a result of various important factors, including, but not limited to, those set forth in the "Risk Factors" section of the Company's latest Form 10 - K . In addition, the forward - looking statements included in this presentation represent the Company's views as of the date of this presentation and these views could change . However, while the Company may elect to update these forward - looking statements at some point, the Company specifically disclaims any obligation to do so, other than as required by federal securities laws . These forward - looking statements should not be relied upon as representing the Company's views as of any date subsequent to the date of this presentation . This presentation contains references to certain financial measures that are not presented in accordance with Generally Accepted Accounting Principles (“GAAP") . The Company utilizes non - GAAP financial measures to analyze and report operating results that are unaffected by differences in capital structures, capital investment cycles, and varying ages of related assets . Although the Company believes these measures provide a useful representation of performance, non - GAAP financial measures should not be considered in isolation or as a substitute for any items calculated in accordance with GAAP . A reconciliation of these non - GAAP financial measures to their most directly comparable GAAP financial measure can be found in the Appendix to this presentation as well as Company’s latest Form 8 - K, filed with the SEC on February 2 , 2017 .

2017 First Quarter Earnings Call February 2, 2017 www.BECN.com 3 Highlights □ Record first quarter net sales of $1.0 billion, 2.6% above the prior year □ Third consecutive quarter with over $1 billion in net sales □ Residential existing market same day growth of 6.5%...11 quarters in a row of resi growth □ First quarter gross margin improvement of 117 basis points to 25.1% of net sales □ First quarter net income grew to $20.4 million vs. $7.1 million in the prior year □ First quarter EPS of $0.33 ($0.44 Adjusted) vs. $0.12 ($0.41 Adjusted) in the prior year □ Adjusted EBITDA grew 9.0% to $80.0 million, or 8.0% of sales □ Lowered Net D ebt L everage R atio to 3.0x, down from 4.2x on 12/31/2015 □ Completed 3 acquisitions in the fiscal year to date

2017 First Quarter Earnings Call February 2, 2017 www.BECN.com 4 0% 50% 100% FY 2017 FY 2016 13.4% 13.6% 32.5% 35.8% 54.1% 50.6% Residential Roofing Non-Residential Roofing Complementary $- $200 $400 $600 $800 $1,000 FY 2017 FY 2016 $955.1 $973.5 $237.3 $232.5 Sales Gross Profit / Margin Existing Market Product Mix Northeast (10.6%) Mid-Atlantic 7.8% Southeast 4.7% Southwest 16.0% Midwest (0.6%) West (24.4%) Canada (5.5%) Total (0.3%) Existing Market Sales Growth (Decline)* $ in millions 23.9% Existing Market Sales, Gross Profit & Gross Margin 24.8% Existing Market results above exclude results from acquired branches until they have been under ownership for at least four full fiscal quarters at the start of the fiscal reporting period. Quarterly Results *Same days
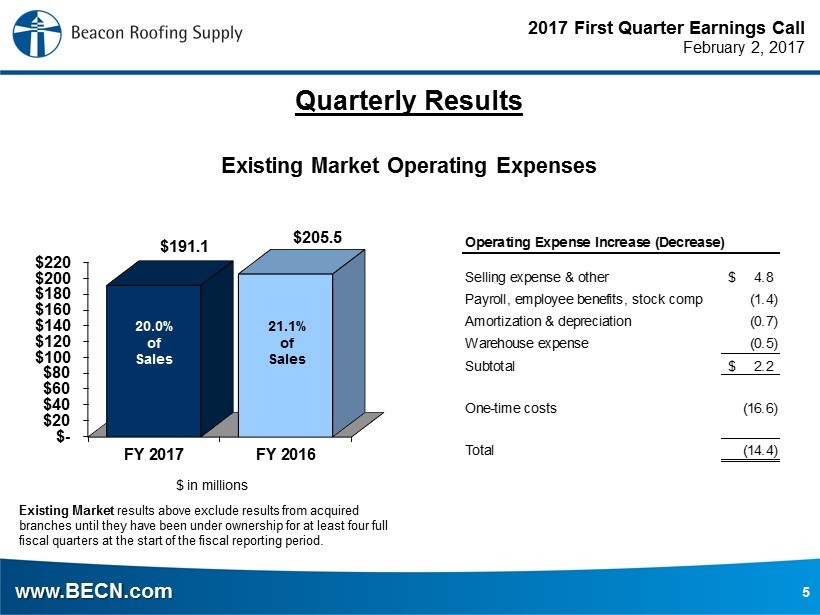
2017 First Quarter Earnings Call February 2, 2017 www.BECN.com 5 $- $20 $40 $60 $80 $100 $120 $140 $160 $180 $200 $220 FY 2017 FY 2016 $191.1 $205.5 $ in millions 20.0% of Sales 21.1% of Sales Existing Market Operating Expenses Existing Market results above exclude results from acquired branches until they have been under ownership for at least four full fiscal quarters at the start of the fiscal reporting period. Selling expense & other 4.8$ Payroll, employee benefits, stock comp (1.4) Amortization & depreciation (0.7) Warehouse expense (0.5) Subtotal 2.2$ One-time costs (16.6) Total (14.4) Operating Expense Increase (Decrease) Quarterly Results

2017 First Quarter Earnings Call February 2, 2017 www.BECN.com 6 19.8% of Sales $30 $0 $10 $20 $30 $40 $50 $60 FY16 Target FY16 Achievement FY17 Goal in millions ~$40 ~$55 RSG Synergy Highlights

2017 First Quarter Earnings Call February 2, 2017 www.BECN.com 7 Q1 Q1 2017 2016 Integration Costs $0.0 $14.1 Misc. SG&A $0.0 $9.8 Op Ex Stock Comp. Expense $0.0 $4.3 Op Ex Transaction Costs $2.7 $9.6 Misc. SG&A $1.2 $5.0 Op Ex Interest Expense $1.6 $3.8 Other (income) / expense (Gain) / Loss on Assets $0.0 $0.8 Op Ex Incremental Amortization $8.0 $5.7 Op Ex Total $10.7 $29.5 (In millions) P&L Line Item RSG and Other Fiscal 2016 - 2017 Acquisition Costs
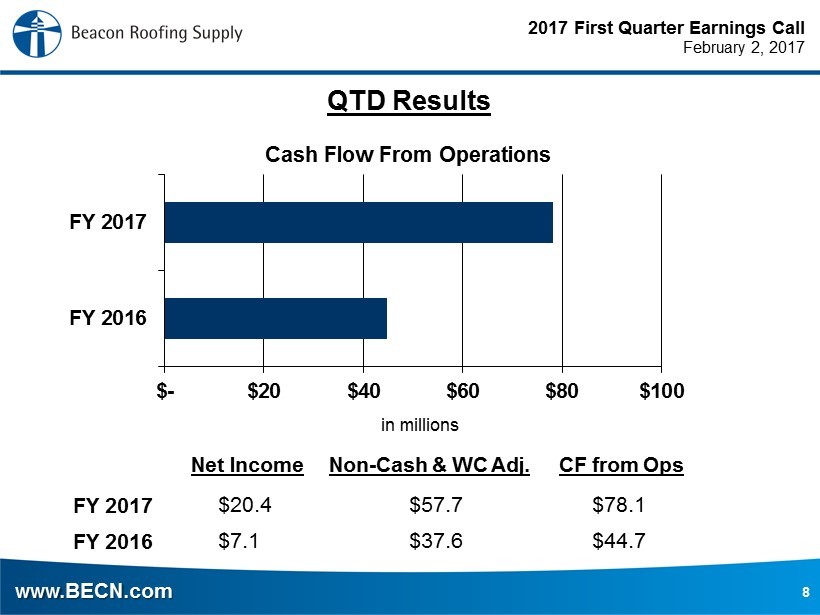
2017 First Quarter Earnings Call February 2, 2017 www.BECN.com 8 $- $20 $40 $60 $80 $100 FY 2016 FY 2017 $78.1 $44.7 in millions Cash Flow From Operations CF from Ops $57.7 $37.6 Non - Cash & WC Adj. $20.4 $7.1 Net Income FY 2017 FY 2016 QTD Results

2017 First Quarter Earnings Call February 2, 2017 www.BECN.com 9 4.3x 4.2x 3.6x 3.3x 3.0x 2.0x 10/1/2015 Pro Forma 12/31/2015 3/31/2016 9/30/2016 12/31/2016 FY18 Goal Net Debt Leverage Ratio 1.6% 0.8% 0.6% 1.0% 0.8% - 1.3% 2014 2015 2016 2017 Est. Long Term Capital Expenditures as % of Sales 20.6% 18.6% 18.5% 17.5 - 18.5% 20 - 40 bps Impr . 2014 2015 2016 2017 Est. Long Term Working Capital as % of Sales 0.0 1.0 2.0 3.0 4.0 5.0 6.0 7.0 FYQ1 FYQ2 FYQ3 FYQ4 FY14 FY15 FY16 FY17 Inventory Turns Balance Sheet Metrics

2017 First Quarter Earnings Call February 2, 2017 www.BECN.com 10 Sales Growth Assumptions • Normal 2016/2017 winter lowers available work days; traditional snow/ice boosts 2H’17 demand • Spring season storm demand is normal; below 2016 levels, but above softer 2014 - 2015 years • Organic growth framework • First Half: Flat to down low single digits • Second Half: Up mid to high single digits Organic Growth Rate by Product Line • Residential: • Up low - mid single digits • Continued strength in core re - roofing • Normal storm demand • Non - residential: • Up mid single digits • Easy 2nd half comparisons • Complementary products: • Up mid single digits • Beneficiary of growth initiatives 2017 Revenue Growth
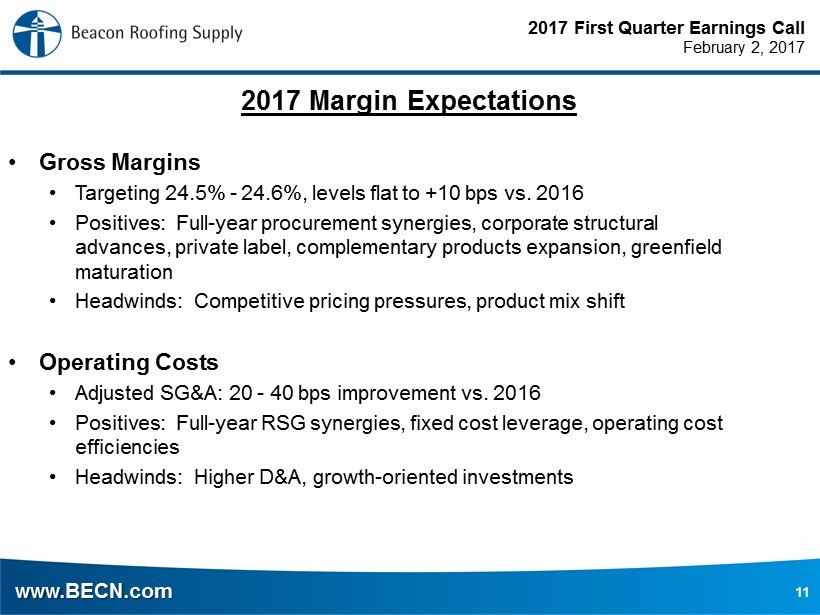
2017 First Quarter Earnings Call February 2, 2017 www.BECN.com 11 • Gross Margins • Targeting 24.5% - 24.6%, levels flat to +10 bps vs. 2016 • Positives: Full - year procurement synergies, corporate structural advances, private label, complementary products expansion, greenfield maturation • Headwinds: Competitive pricing pressures, product mix shift • Operating Costs • Adjusted SG&A: 20 - 40 bps improvement vs. 2016 • Positives: Full - year RSG synergies, fixed cost leverage, operating cost efficiencies • Headwinds: Higher D&A, growth - oriented investments 2017 Margin Expectations
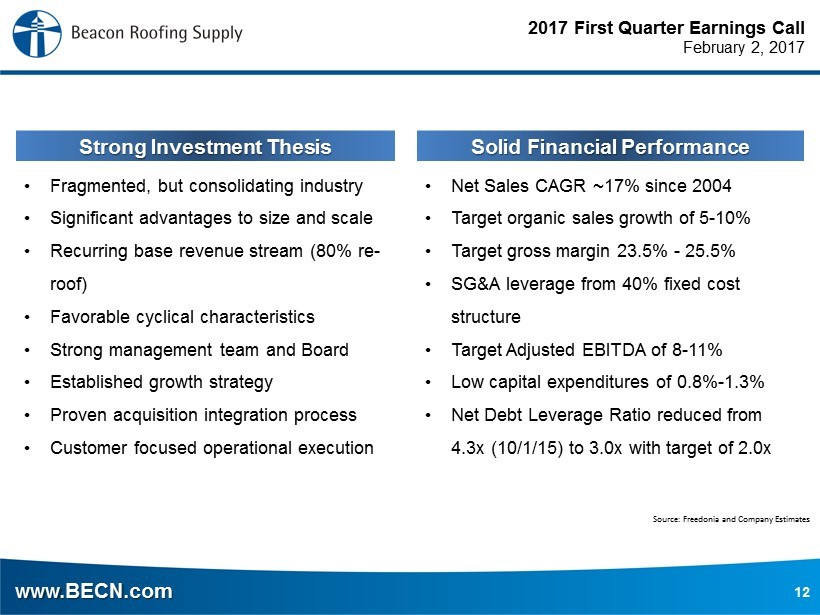
2017 First Quarter Earnings Call February 2, 2017 www.BECN.com 12 Source: Freedonia and Company Estimates Strong Investment Thesis Solid Financial Performance • Fragmented, but consolidating industry • Significant advantages to size and scale • Recurring base revenue stream (80% re - roof) • Favorable cyclical characteristics • Strong management team and Board • Established growth strategy • Proven acquisition integration process • Customer focused operational execution • Net Sales CAGR ~17% since 2004 • Target organic sales growth of 5 - 10% • Target gross margin 23.5% - 25.5% • SG&A leverage from 40% fixed cost structure • Target Adjusted EBITDA of 8 - 11% • Low capital expenditures of 0.8% - 1.3% • Net Debt Leverage Ratio reduced from 4.3x (10/1/15) to 3.0x with target of 2.0x

2017 First Quarter Earnings Call February 2, 2017 www.BECN.com 13 19.8% of Sales Adjusted Net Income is defined as net income excluding non - recurring costs related to acquisitions completed in fiscal years 2016 and 2017, as well as the incremental amortization of acquired intangibles. We believe that Adjusted Net Income is an operating performance metric that is useful to investors because it permits investors to better understand year - over - year changes in underlying operating performance. Adjusted net income per share or “Adjusted EPS” is calculated by dividing the Adjusted Net Income for the period by the weighted - average diluted shares outstanding for the period. Non - GAAP Adjustments are comprised entirely of non - recurring costs related to acquisitions completed in fiscal years 2016 and 2017 - See "RSG and Other Fiscal 2016 - 2017 Acquisition Costs" slide for further detail. While we believe Adjusted Net Income and Adjusted EPS are useful measures for investors, these are not measurements presented in accordance with United States Generally Accepted Accounting Principles (“GAAP”). You should not consider Adjusted Net Income or Adjusted EPS in isolation or as a substitute for net income and net los s per share or diluted earnings per share calculated in accordance with GAAP. (In millions) Actual Non-GAAP Adjustments Actual (Adjusted) Actual Non-GAAP Adjustments Actual (Adjusted) Net sales 1,002.2$ -$ 1,002.2$ 976.5$ -$ 976.5$ Cost of products sold 751.1 - 751.1 743.3 - 743.3 Gross profit 251.1 - 251.1 233.2 - 233.2 Operating expense 204.1 (9.1) 195.0 206.3 (25.7) 180.6 Income from operations 47.0 9.1 56.1 26.9 25.7 52.6 Interest expense, financing costs and other 13.6 (1.6) 12.0 16.3 (3.8) 12.5 Income before provision for income taxes 33.4 10.7 44.1 10.6 29.5 40.1 Provision for income taxes 13.0 4.1 17.1 3.5 11.9 15.4 Net Income 20.4$ 6.5$ 27.0$ 7.1$ 17.6$ 24.7$ Reconciliation of EPS to Adjusted EPS: EPS 0.33$ 0.12$ Non-GAAP Adjustments per share impact 0.11 0.29 Adjusted EPS 0.44$ 0.41$ Three Months Ended December 31, 2016 Three Months Ended December 31, 2015 Reconciliation: Adjusted Net Income/Adjusted EPS

2017 First Quarter Earnings Call February 2, 2017 www.BECN.com 14 Adjusted EBITDA is defined as net income plus interest expense (net of interest income), income taxes, depreciation and amortization, adj ustments to contingent consideration, stock - based compensation and non - recurring acquisition costs from acquisitions completed in fiscal years 2016 and 2017. We believe that Adjusted EBITDA is an operating performance measure that provides investors and analysts with a measure of operating results unaffected by differences in capital structures, capital investment cycles, and ages of related assets amon g o therwise comparable companies. Acquisition costs reflect all non - recurring charges related to acquisitions completed in fiscal years 2016 and 2017 (excluding the impact of tax) that are not embedded in other balances of the table. Certain portions of the total acquisition costs incurred are included in interest expense, income taxes, depreciation and amortization, and stock - ba sed compensation . While we believe Adjusted EBITDA is a useful measure for investors, it is not a measurement presented in accordance GAAP. You sh ould not consider Adjusted EBITDA in isolation or as a substitute for net income, cash flows from operations, or any other items calculated in accordance with GAAP. In addition, Adjusted EBITDA has inherent mat erial limitations as a performance measure. It does not include interest expense. Because we have borrowed money, interest expense is a necessary element of our costs. In addition, Adjusted EBITDA does not include d epr eciation and amortization expense. Because we have capital and intangible assets, depreciation and amortization expense is a necessary element of our costs. Adjusted EBITDA also does not i ncl ude stock - based compensation, which is a necessary element of our costs because we make stock awards to key members of management as an important incentive to maximize overall company performance and as a ben efit. Moreover, Adjusted EBITDA does not include taxes, and payment of taxes is a necessary element of our operations. Accordingly, since Adjusted EBITDA excludes these items, it has material limi tat ions as a performance measure. We separately monitor capital expenditures, which impact depreciation expense, as well as amortization expense, interest expense, stock - based compensation expense, and income tax expense. Because not all companies use identical calculations, our presentation of Adjusted EBITDA may not be comparable to other similarly titled measures of other companies . Reconciliation: Adjusted EBITDA 2016 2015 2016 Net Sales 1,002.2$ 976.5$ 4,127.1$ Net Income 20.4$ 7.1$ 89.9$ Acquisition costs 1.2 15.7 24.7 Interest expense, net 13.2 16.3 58.1 Income taxes 13.0 3.5 56.6 Depreciation and amortization 28.4 23.7 100.2 Stock-based compensation 3.8 7.2 17.7 Adjusted EBITDA 80.0$ 73.4$ 347.4$ Adjusted EBITDA as a % of net sales 8.0% 7.5% 8.4% Twelve Months Ended September 30, Three Months Ended December 31,

2017 First Quarter Earnings Call February 2, 2017 www.BECN.com 15 Reconciliation: Net Debt Leverage Ratio 1 1 Net debt leverage ratio = Total debt, net of cash / Trailing 4 quarter Adjusted EBITDA (In millions) Gross total debt as of December 31, 2016 1,134.0$ Cash and cash equivalents as of December 31, 2016 (73.3)$ Net debt as of December 31, 2016 1,060.7$ Adjusted EBITDA for the three months ended December 31, 2016 80.0$ Adjusted EBITDA for the twelve months ended September 30, 2016 347.4$ 427.4$ Less: Adjusted EBITDA for the three months ended December 31, 2015 73.4$ Pro Forma Adjusted EBITDA for the twelve months ended December 31, 2016 354.0$ Net Debt Leverage Ratio as of December 31, 2016 3.0$