Attached files
| file | filename |
|---|---|
| 8-K - FORM 8-K - SB ONE BANCORP | v458082_8k.htm |
Exhibit 99.1

••• FIG Partners ••• 8th Annual West Coast Bank CEO Forum ••• February 2017 •••

2 This confidential presentation, and the oral presentation that supplements it, have been developed by Sussex Bancorp (“Sussex” or the “Company”), were prepared exclusively for the benefit and internal use of the recipient and are not an offer or the solicitation of an offer to buy securities. Neither this presentation, nor the oral presentation that supplements it, nor any of their contents, may be used, reproduced, disseminated, quoted or referred to for any other purpose, in whole or in part, without the prior written consent of the Company. Some of the statements contained in this presentation are “forward - looking statements” within the meaning of Section 27A of the Securities Act of 1933, as amended, and Section 21E of the Securities Exchange Act of 1934, as amended. When used in this presentation, words such as “may,” “plan,” “contemplate,” “anticipate,” “believe,” “intend,” “continue,” “expect,” “project,” “predict,” “estimate,” “target,” “could,” “is likely,” “should,” “would,” “will,” or similar expressions are intended to identify “forward - looking statements” within the meaning of the Private Securities Litigation Reform Act of 1995. You are cautioned not to place undue reliance on any forward - looking statements, which speak only as of the date made. These statements may relate to the Company’s future financial performance, strategic plans or objectives, revenue, expense or earnings projections, or other financial items. By their nature, these statements are subject to numerous uncertainties that could cause actual results to differ materially from those anticipated in the statements . Factors that could cause actual results to differ materially from the results anticipated or projected include, but are not limited to, the following: ( i ) competition in the industry and markets in which the Company operates; (ii) levels of non - performing assets; (iii) changes in general interest rates; (iv) loan demand; (v) rapid changes in technology affecting the financial services industry; (vi) real estate values; (vii) changes in government regulation; and (viii) general economic and business conditions. 2

Ticker Symbol SBBX Closing Price (January 27, 2017) $21.05 Price to tangible book 178.2% Price to LTM EPS 17.9x Price to 2017 Yr. est. EPS* 14.8x Annualized Dividend/ Yield $0.16 / 0.8% 52 week high (12/22/16) $21.95 52 week low (2/12/16) $11.43 1. Company Overview • Founded in 1975 • Commercial Bank - Operates Tri - State Insurance Agency • Total Assets of $847 million & 11 branches [ Bergen County, NJ (1), Sussex County, NJ (8) Warren County, NJ (1 mini) and Queens County ,NY (1)] • Market Cap: $101 million • Corporate Office: Rockaway, NJ • Regional Operations: Sussex County, NJ • Regional Lending Offices: Sussex , Bergen, Morris Counties, NJ & Queens NYC * Source: SNL 3
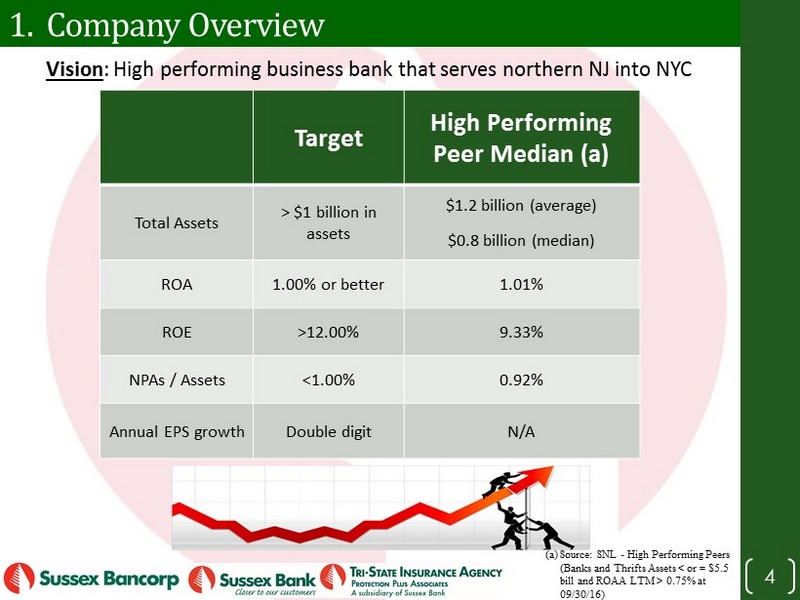
Target High Performing Peer Median (a) Total Assets > $1 billion in assets $1.2 billion (average) $0.8 billion (median) ROA 1.00% or better 1.01% ROE >12.00% 9.33% NPAs / Assets <1.00% 0.92% Annual EPS growth Double digit N/A (a) Source: SNL - High Performing Peers (Banks and Thrifts Assets < or = $5.5 bill and ROAA LTM > 0.75% at 09/30/16) 1. Company Overview Vision : High performing business bank that serves northern NJ into NYC 4

Our Model for generating long term Shareholder V alue 1. Company Overview 5
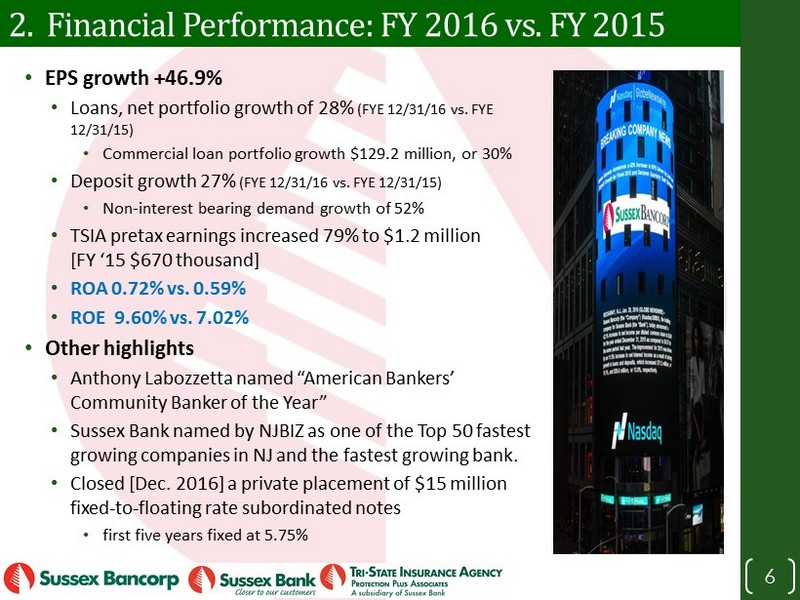
• EPS growth +46.9% • Loans, net portfolio growth of 28 % (FYE 12/31/16 vs. FYE 12/31/15) • Commercial loan portfolio growth $129.2 million, or 30% • Deposit growth 27% (FYE 12/31/16 vs. FYE 12/31/15) • Non - interest bearing demand growth of 52% • TSIA pretax earnings increased 79% to $1.2 million [ FY ‘15 $670 thousand] • ROA 0.72% vs. 0.59% • ROE 9.60% vs. 7.02 % • Other highlights • Anthony Labozzetta named “American Bankers’ Community Banker of the Year” • Sussex Bank named by NJBIZ as one of the Top 50 fastest growing companies in NJ and the fastest growing bank. • Closed [Dec. 2016 ] a private placement of $15 million fixed - to - floating rate subordinated notes • first five years fixed at 5.75 % 2. Financial Performance: FY 2016 vs. FY 2015 6

FY 2014 FY 2015 FY 2016 Targets NJ Banks and Thrifts Avg. (a) Loans, net annual growth 20.5% 15.1% 27.9% 15 to 20% 14.4% Deposit annual growth 6.5% 13.0% 27.6% 16.7% NPAs to assets 2.02% 1.49% 1.10% <1.00% 1.25% ROA 0.46% 0.59% 0.72% >1.00% 0.57% ROE 5.25% 7.02% 9.60% >12.00% 5.45% Net Interest Margin 3.49% 3.45% 3.37% 3.44% Net non - interest income (expense) as % of assets (2.30)% (2.24)% (1.92%) (2.18)% Tri - state Insurance income before tax $501k $670k (+33%) $1.2m (+79%) 20% N/A Diluted EPS $0.57 $0.81 (+42%) $1.19 (+47%) Double digit N/A 2. Financial Performance (a) Source : SNL - NJ Banks and Thrifts (41) 9/30/16 7

2. Financial Performance: Earnings 8

2. Financial Performance: Profitability 9

3 . Lending Other CML NBV Orig. '15 & '16 66% Top 20 NBV Orig. '15 & '16 34% • Commercial loans grew 30% (FYE 16 vs FYE 15) • Relationship driven • Strong credit risk management culture • NPA’s to assets (excluding performing TDRs) down to 1.02% Commercial Loans originated in 2015 and 2016 • Net funded $ 284 million (balances at December 31, 2016) • Associated unfunded commitments +$35.1 million (total exposure $316.5 million) • Rate: 4.0% • Term: 4.7 yrs. Rate: 3.86% Term: 5.0 yrs. Avg. Bal: $4.9M DSCR: 1.70x LTV: <60% Rate: 4.09% Term: 4.5 yrs. Avg. Bal: $545k 10

Sources: SNL and internal data at December 31, 2016 3 . Lending: Market Penetration 11

• Increased Bank capital in 4Q16 • Continued focus on organic growth • Geographically diversified • CRE concentration ▪ Average loan balance $1.4 million ▪ Weighted average LTV of less than 60% ▪ Weighted average DSCR of greater than 1.5x • Engaged a third party to provide CRE data analytics and stress testing 3 . Lending: Concentrations CRE Concentration R atio 12

3 . Lending: Concentrations Sources: SNL and internal data at December 31, 2016 13

4. Deposits Deposit growth for FYE 16 vs. FYE 15 • Non - interest bearing demand +52% • Savings, money market and interest - bearing demand +18% • Time deposit growth largely broker deposits • Overall core deposit growth driven by Astoria and Oradell Banking Centers Astoria Banking Center (opened in March 2015) • Total deposits of approximately $63 million with a cost of deposits of under 0.45% Oradell Banking Center (opened in March 2016) • Total deposits of approximately $42 million with a cost of deposits of 0.61% 14

Sources: SNL and internal data at December 31, 2016 4. Deposits: Market Penetration 15

5 . Tri - State Insurance Agency • Access to over 20 insurance companies • Net promoter score (NPS®) of 75.7% as compared to agency industry average of 62.1 (a) (in millions) 16 (a) Source: Selective Insurance 2015 research

• During 2016, new hires included a Chief Lending Officer, Chief Credit Officer, Chief Administration Officer and a new BSA Officer / Compliance Manager 7. Capital • Targeting opening 1 to 2 new banking centers for 2017 • Expanding and enhancing x Commercial loan sales and underwriting platform x Digital channels, cash management products/strategies and C&I platform • Total tangible equity to total assets of 6.8% at December 31, 2016 • All bank capital ratios are deemed “well capitalized” at December 31, 2016 • Completed a $15 million private sub debt offering in December 2016 • Continuing to evaluate opportunities to raise capital 6. Talent Management 8. Strategic Initiatives 2017 9. Strategic Partnerships 17

Growing Shareholder Value 18

1. Strategic talent management 2. Grow our business 3. Continue to strengthen profitability Resulting in : x Higher EPS and tangible book value growth x Outperforming the total returns of the broader market and bank indices over the long run Growing Shareholder Value 19

One Year Total Return Source: SNL as of January 27, 2017 Stock Performance 20

Total Return since January 1, 2010 through January 27, 2017 Source : SNL as of January 27, 2017 Stock Performance 21

22

23 Click on the photo’s below for more information!

24