Attached files
| file | filename |
|---|---|
| 8-K - FORM 8-K - LEHMAN BROTHERS HOLDINGS INC. PLAN TRUST | d335741d8k.htm |
Exhibit 99.1
UNITED STATES BANKRUPTCY COURT
SOUTHERN DISTRICT OF NEW YORK
In re:
|
|
Chapter 11 Case No. | |
| Lehman Brothers Holdings Inc., et al., | 08-13555 | |
| Jointly Administered | ||
| Debtors. |
||
QUARTERLY FINANCIAL REPORT
AS OF OCTOBER 6, 2016
BALANCE SHEETS, ACCOMPANYING SCHEDULES, AND
POST-ELEVENTH DISTRIBUTION CASH FLOW ESTIMATES
| DEBTORS’ ADDRESS: | LEHMAN BROTHERS HOLDINGS INC. | |
| c/o KRISTINE DICKSON, EXECUTIVE VICE PRESIDENT—FINANCE | ||
| 1271 AVENUE OF THE AMERICAS | ||
| 40th FLOOR | ||
| NEW YORK, NY 10020 | ||
| DEBTORS’ ATTORNEYS: | WEIL, GOTSHAL & MANGES LLP | |
| c/o JACQUELINE MARCUS, GARRETT A. FAIL | ||
| 767 FIFTH AVENUE | ||
| NEW YORK, NY 10153 | ||
| REPORT PREPARER: | LEHMAN BROTHERS HOLDINGS INC., AS PLAN ADMINISTRATOR | |
| Date: February 1, 2017 |
Quarterly Financial Report as of October 6, 2016 (Unaudited)
Table of Contents
| I. |
Schedule of Debtors | 3 | ||||||||
| II. |
Notes to the Balance Sheets and Management’s Discussion & Analysis | 4 | ||||||||
| Note 1 – Basis of Presentation | 4 | |||||||||
| Note 2 – Use of Estimates | 5 | |||||||||
| Note 3 – Cash and Short-Term Investment | 5 | |||||||||
| Note 4 – Cash and Short-Term Investments Pledged or Restricted | 6 | |||||||||
| Note 5 – Financial Instruments and Other Inventory Positions | 7 | |||||||||
| Note 6 – Receivables from Controlled Affiliates and Other Assets | 10 | |||||||||
| Note 7 – Investments in Affiliates | 12 | |||||||||
| Note 8 – Due from/to Affiliates | 13 | |||||||||
| Note 9 – Payables to Controlled Affiliates and Other Liabilities | 24 | |||||||||
| Note 10 – Taxes Payable | 25 | |||||||||
| Note 11 – Liabilities Subject to Compromise | 26 | |||||||||
| Note 12 – Legal Proceedings | 29 | |||||||||
| Note 13 – Currency Translation | 32 | |||||||||
| Note 14 – Financial Systems and Control Environment | 32 | |||||||||
| Note 15 – Subsequent Event | 32 | |||||||||
| III. |
Balance Sheets | 33 | ||||||||
| IV. |
Accompanying Schedules | 36 | ||||||||
| V. |
Post-Eleventh Distribution Cash Flow Estimates | 42 | ||||||||
QUESTIONS
The Company has established an email address to receive questions from readers regarding this presentation and its other financial disclosures. The Company plans to review questions received, and for those subjects which the Company determines a response would not (i) violate a confidentiality provision, (ii) place the Company in a competitive or negotiation disadvantage, or (iii) be unduly burdensome relative to the value of information requested, the Company shall endeavor to post a response (maintaining the anonymity of the originators of the questions). The Company assumes no obligation to respond to email inquiries.
Please email questions, with document references as relevant, to:
QUESTIONS@lehmanholdings.com
The Company’s previously posted responses can be found on the Epiq website maintained for the Company:
www.lehman-docket.com under the Key Documents tab and the Responses to Questions Submitted category
Page 2
Quarterly Financial Report as of October 6, 2016 (Unaudited)
I. Schedule of Debtors
The twenty three entities listed below (the “Debtors”) filed for bankruptcy in the United States Bankruptcy Court for the Southern District of New York (the “Bankruptcy Court”) on the dates indicated below. On December 6, 2011, the Bankruptcy Court confirmed the Modified Third Amended Joint Chapter 11 Plan of Lehman Brothers Holdings Inc. and its Affiliated Debtors (the “Plan”). On March 6, 2012, the “Effective Date” (as defined in the Plan) occurred. As of the date hereof, the following Debtors’ chapter 11 cases remain open:
| Case No. | Date Filed (“Commencement Date”) |
|||||||
| Lehman Brothers Holdings Inc. (“LBHI”) |
08-13555 | 9/15/2008 | ||||||
| Lehman Brothers Commodity Services Inc. (“LBCS”) |
08-13885 | 10/3/2008 | ||||||
| Lehman Brothers Special Financing Inc. (“LBSF”) |
08-13888 | 10/3/2008 | ||||||
| Lehman Brothers OTC Derivatives Inc. (“LOTC”) |
08-13893 | 10/3/2008 | ||||||
| Lehman Brothers Derivative Products Inc. (“LBDP”) |
08-13899 | 10/5/2008 | ||||||
| Lehman Commercial Paper Inc. (“LCPI”) |
08-13900 | 10/5/2008 | ||||||
| Lehman Brothers Commercial Corporation (“LBCC”) |
08-13901 | 10/5/2008 | ||||||
| Lehman Brothers Financial Products Inc. (“LBFP”) |
08-13902 | 10/5/2008 | ||||||
| Lehman Scottish Finance L.P. |
08-13904 | 10/5/2008 | ||||||
| BNC Mortgage LLC |
09-10137 | 1/9/2009 | ||||||
| LB Rose Ranch LLC |
09-10560 | 2/9/2009 | ||||||
| Structured Asset Securities Corporation |
09-10558 | 2/9/2009 | ||||||
The following Debtors’ chapter 11 cases were closed in 2016, pursuant to final decrees entered by the Bankruptcy Court (Docket No. 51920 and No. 54163):
| Case No. | Date Filed | Date Closed | ||||||||||
| LB 745 LLC |
08-13600 | 9/16/2008 | 1/28/2016 | |||||||||
| PAMI Statler Arms LLC |
08-13664 | 9/23/2008 | 1/28/2016 | |||||||||
| CES Aviation LLC |
08-13905 | 10/5/2008 | 1/28/2016 | |||||||||
| CES Aviation V LLC |
08-13906 | 10/5/2008 | 1/28/2016 | |||||||||
| CES Aviation IX LLC |
08-13907 | 10/5/2008 | 1/28/2016 | |||||||||
| LB 2080 Kalakaua Owners LLC |
09-12516 | 4/23/2009 | 1/28/2016 | |||||||||
| LB Somerset LLC |
09-17503 | 12/22/2009 | 1/28/2016 | |||||||||
| LB Preferred Somerset LLC |
09-17505 | 12/22/2009 | 1/28/2016 | |||||||||
| East Dover Limited |
08-13908 | 10/5/2008 | 12/15/2016 | |||||||||
| Luxembourg Residential Properties Loan Finance S.a.r.l |
09-10108 | 1/7/2009 | 12/15/2016 | |||||||||
| Merit LLC |
09-17331 | 12/14/2009 | 12/15/2016 | |||||||||
Page 3
Quarterly Financial Report as of October 6, 2016 (Unaudited)
II. Notes to the Balance Sheets and Management’s Discussion & Analysis
Page 4
Quarterly Financial Report as of October 6, 2016 (Unaudited)
Page 5
Quarterly Financial Report as of October 6, 2016 (Unaudited)
Note 4 – Cash and Short-Term Investments Pledged or Restricted
The following table summarizes the components of restricted cash as of October 6, 2016:
| Debtors | Debtor- Controlled |
Total Debtors and Debtor- Controlled Entities |
||||||||||||||||||||||||||
| ($ in millions) | LBHI | LBSF | LCPI | Other | Total | |||||||||||||||||||||||
| Reserves for Claims: |
||||||||||||||||||||||||||||
| Disputed unsecured claims (1) |
$ | 1,089 | $ | 854 | $ | 0 | $ | 146 | $ | 2,089 | $ | — | $ | 2,089 | ||||||||||||||
| Distributions on Allowed Claims (not remitted) (2) |
86 | 0 | 0 | 1 | 87 | — | 87 | |||||||||||||||||||||
| Secured, Admin, Priority Claims and Other |
64 | 16 | 2 | 8 | 90 | — | 90 | |||||||||||||||||||||
|
|
|
|
|
|
|
|||||||||||||||||||||||
| Subtotal, Claims Reserves |
1,239 | 870 | 2 | 154 | 2,266 | — | 2,266 | |||||||||||||||||||||
| Citigroup (3) |
2,008 | — | — | — | 2,008 | — | 2,008 | |||||||||||||||||||||
| Other (4) |
177 | 1 | 0 | 25 | 202 | 29 | 231 | |||||||||||||||||||||
|
|
|
|
|
|
|
|||||||||||||||||||||||
| Total |
$ | 3,424 | $ | 871 | $ | 2 | $ | 179 | $ | 4,476 | $ | 29 | $ | 4,505 | ||||||||||||||
|
|
|
|
|
|
|
|||||||||||||||||||||||
| Totals may not foot due to rounding. | ||||||||||||||||||||||||||||
| (1) | Represents the cash reserve for the principal amount of disputed unsecured claims subsequent to the eleventh Plan Distribution on October 6, 2016. Amounts of claim reserves at LBSF exclude amounts invested in a loan to LBHI in the amount of $345 million (refer to Note 6 – Receivables from Controlled Affiliates and Other Assets). |
| (2) | Includes (i) $79 million related to the Office of Foreign Asset Control (“OFAC”) and (ii) $8 million related to other open items. |
| (3) | Represents cash deposited prior to the Commencement Date by the Company in connection with certain requests and/or documents executed by the Company and Citigroup Inc. (“Citigroup”). The Company has recorded reserves against this cash in Secured Claims Payable to Third Parties because Citigroup has asserted claims. The Company commenced litigation against Citigroup regarding these deposits (refer to Note 12 – Legal Proceedings). |
| (4) | Includes: (i) $87 million related to various pre-petition balances on administrative hold by Citigroup, (ii) $55 million related to misdirected wires and other cash received by LBHI for the benefit of third parties and Non-Controlled Affiliates (reported as a payable), and (iii) $89 million of various miscellaneous items. |
Page 6
Quarterly Financial Report as of October 6, 2016 (Unaudited)
Note 5 – Financial Instruments and Other Inventory Positions
Financial instruments and other inventory positions are reported at estimated “recovery values,” which are determined by utilizing market prices, certain assumptions, estimates and/or pricing models to estimate future undiscounted cash flows.
The table below presents recovery values as of October 6, 2016 by asset portfolio, and the changes in recovery values since the previously filed Quarterly Financial Report as of June 30, 2016:
| (Activity 07/01/16—10/06/16) | ||||||||||||||||||||
| Inventory as of | Transfers and | Recovery | Inventory as of | |||||||||||||||||
| $ in millions |
June 30, 2016 | Reclassifications | Value Change (1) | Cash Activities (2) | October 6, 2016 | |||||||||||||||
| Commercial Real Estate |
||||||||||||||||||||
| Debtors: |
||||||||||||||||||||
| Lehman Brothers Holdings Inc. |
$ | 34 | $ | — | $ | 1 | $ | (1 | ) | $ | 34 | |||||||||
| Lehman Commercial Paper Inc. |
124 | 0 | (6 | ) | (10 | ) | 108 | |||||||||||||
| LB Rose Ranch LLC |
— | — | 1 | — | 1 | |||||||||||||||
|
|
|
|
|
|
|
|
|
|
|
|||||||||||
| Subtotal Debtors |
158 | 0 | (4 | ) | (11 | ) | 142 | |||||||||||||
|
Debtor-Controlled |
178 | (0 | ) | (20 | ) | (87 | ) | 71 | ||||||||||||
|
|
|
|
|
|
|
|
|
|
|
|||||||||||
| Total Commercial Real Estate |
336 | — | (24 | ) | (98 | ) | 213 | |||||||||||||
|
|
|
|
|
|
|
|
|
|
|
|||||||||||
| Loans and Residential Real Estate |
||||||||||||||||||||
| Debtors: |
||||||||||||||||||||
| Lehman Brothers Holdings Inc. (3) |
61 | — | 6 | (12 | ) | 56 | ||||||||||||||
| Lehman Commercial Paper Inc. |
76 | — | 5 | (48 | ) | 33 | ||||||||||||||
|
|
|
|
|
|
|
|
|
|
|
|||||||||||
| Subtotal Debtors |
137 | — | 11 | (59 | ) | 89 | ||||||||||||||
|
Debtor-Controlled |
31 | — | 2 | (1 | ) | 31 | ||||||||||||||
|
|
|
|
|
|
|
|
|
|
|
|||||||||||
| Total Loans and Residential Real Estate |
168 | — | 13 | (60 | ) | 121 | ||||||||||||||
|
|
|
|
|
|
|
|
|
|
|
|||||||||||
| Private Equity / Principal Investments (PEPI) |
||||||||||||||||||||
| Debtors: |
||||||||||||||||||||
| Lehman Brothers Holdings Inc. |
0 | — | 0 | (0 | ) | 0 | ||||||||||||||
| Lehman Commercial Paper Inc. |
3 | — | — | — | 3 | |||||||||||||||
|
|
|
|
|
|
|
|
|
|
|
|||||||||||
| Subtotal Debtors |
3 | — | 0 | (0 | ) | 3 | ||||||||||||||
|
Debtor-Controlled (3) |
823 | — | 324 | (186 | ) | 961 | ||||||||||||||
|
|
|
|
|
|
|
|
|
|
|
|||||||||||
| Total Private Equity / Principal Investments |
826 | — | 324 | (186 | ) | 964 | ||||||||||||||
|
|
|
|
|
|
|
|
|
|
|
|||||||||||
| Derivative Receivables and Related Assets |
||||||||||||||||||||
| Debtors: |
||||||||||||||||||||
| Lehman Brothers Special Financing Inc. |
133 | — | 31 | (31 | ) | 133 | ||||||||||||||
| Lehman Brothers OTC Derivatives Inc. |
0 | — | — | — | 0 | |||||||||||||||
|
|
|
|
|
|
|
|
|
|
|
|||||||||||
| Subtotal Debtors |
133 | — | 31 | (31 | ) | 133 | ||||||||||||||
|
Debtor-Controlled |
1 | — | 1 | (2 | ) | 1 | ||||||||||||||
|
|
|
|
|
|
|
|
|
|
|
|||||||||||
| Total Derivative Receivables and Related Assets |
133 | — | 32 | (33 | ) | 133 | ||||||||||||||
|
|
|
|
|
|
|
|
|
|
|
|||||||||||
|
Totals |
$ | 1,463 | $ | — | $ | 345 | $ | (377 | ) | $ | 1,431 | |||||||||
|
|
|
|
|
|
|
|
|
|
|
|||||||||||
|
|
|
|
|
|||||||||||||||||
| (1) | Represents adjustments to recovery values based on changes in market prices, realized gains or losses from assets sales above or below previously recorded recovery values, assumptions and/or estimates which, in the Company’s judgment, impact the Company’s recoverable value on the underlying assets. |
| (2) | Cash activities are presented net of disbursements. Amounts may differ from previously filed Schedules of Cash Receipts and Disbursements mainly due to timing and classification differences. Cash activities related to Derivative Receivables and Related Assets include collections on open and terminated trades, net of hedging activities. |
| (3) | Inventory balances as of October 6, 2016 include (i) an investment in Formula One of $462 million in PEPI that is encumbered by LB I Group Inc. for the benefit of LCPI, (ii) an investment in First Data Corporation of $247 million in PEPI that is encumbered by LB I Group Inc. for the benefit of LB UK Holdings (Delaware) Inc., and (iii) residential mortgage backed securities of $13 million in Loans and Residential Real Estate that are encumbered by LBHI for the benefit of Lehman Brothers Pass-Through Securities Inc. (“LPTSI”). |
Page 7
Quarterly Financial Report as of October 6, 2016 (Unaudited)
Note 5 – Financial Instruments and Other Inventory Positions (continued)
Page 8
Quarterly Financial Report as of October 6, 2016 (Unaudited)
Note 5 – Financial Instruments and Other Inventory Positions (continued)
Page 9
Quarterly Financial Report as of October 6, 2016 (Unaudited)
Note 6 – Receivables from Debtors and Debtor-Controlled Entities and Other Assets
Receivables from Debtors and Debtor-Controlled Entities and Other Assets includes: (i) $2.5 billion related to certain post-petition activities between and among Debtors and Debtor-Controlled Entities, with the corresponding liabilities reflected in Payables to Debtors and Debtor-Controlled Entities and Other Liabilities, and (ii) $474 million of other assets.
The following table summarizes the main components of Receivables from Debtors and Debtor-Controlled Entities and Other Assets as of October 6, 2016:
| Debtors | Debtor- | Total Debtors and Debtor- |
||||||||||||||||||||||||||
| $ in millions | LBHI | LCPI | LBSF | Other Debtors |
Total | Controlled Entities |
Controlled Entities |
|||||||||||||||||||||
| Encumbered Financial Inventory (1) |
$ | — | $ | 462 | $ | — | $ | — | $ | 462 | $ | 13 | $ | 475 | ||||||||||||||
| Secured Notes (2) |
— | — | 345 | 958 | 1,303 | 69 | 1,372 | |||||||||||||||||||||
| Fundings and other activites (3) |
197 | 6 | 0 | 58 | 262 | 415 | 677 | |||||||||||||||||||||
|
|
|
|
|
|
|
|||||||||||||||||||||||
| Receivables from Debtors and Debtor-Controlled Entities |
197 | 468 | 345 | 1,016 | 2,026 | 497 | 2,523 | |||||||||||||||||||||
| Receivable related to Fenway (4) |
88 | — | — | — | 88 | — | 88 | |||||||||||||||||||||
| Affiliate Claims (5) |
164 | 1 | 18 | 1 | 184 | 0 | 184 | |||||||||||||||||||||
| Collateral Posted on Hedges |
95 | 4 | — | — | 100 | — | 100 | |||||||||||||||||||||
| Subrogated Receivable |
40 | — | — | — | 40 | — | 40 | |||||||||||||||||||||
| Other |
16 | 0 | (0 | ) | (0 | ) | 16 | 47 | 63 | |||||||||||||||||||
|
|
|
|
|
|
|
|||||||||||||||||||||||
| Total Other Assets |
403 | 5 | 18 | 1 | 427 | 47 | 474 | |||||||||||||||||||||
|
|
|
|
|
|
|
|||||||||||||||||||||||
| Total Receivables from Debtors and Debtor-Controlled Entities and Other Assets |
$ | 600 | $ | 473 | $ | 363 | $ | 1,016 | $ | 2,452 | $ | 545 | $ | 2,997 | ||||||||||||||
|
|
|
|
|
|
|
|||||||||||||||||||||||
| (1) | Includes (i) $462 million of Private Equity/Principal Investment assets encumbered by LB I Group Inc. for the benefit of LCPI, and (ii) $13 million of Residential Real Estate assets encumbered by LBHI for the benefit of LPTSI. |
| (2) | Includes (i) loans to LBHI from LOTC of $546 million, LBCC of $262 million and a Debtor-Controlled Entity of $69 million, secured by LBHI assets; (ii) loans from LBFP to LCPI and LBSF of $140 million and $10 million, respectively, secured by LCPI and LBSF assets; and (iii) an investment of $345 million of LBSF’s cash reserves for disputed claims in secured notes issued by LBHI. |
| (3) | Includes (i) $226 million of cash collections at LCPI for the benefit of LCPI Properties Inc., a wholly owned subsidiary of LCPI; (ii) $197 million primarily related to fundings (e.g. capital calls) by LBHI and cost allocations; and (iii) $99 million related to a promissory note issued by LBHI to a Debtor-Controlled Entity, LBHK Funding (Cayman) No.1 Ltd, of which LBHI is the ultimate economic beneficiary. |
| (4) | Represents unsecured claims asserted by LBHI against LCPI based on the Fenway transactions, as disclosed in Section 6.5(h) of the Plan, net of $142 million of payments received by LBHI as a result of Plan Distributions. |
| (5) | Includes (i) $147 million of affiliate claims acquired through settlements with third parties valued at estimated recoveries, net of distributions; and (ii) $37 million from a total return swap related to future distributions on LBI claims held by LBHI; LBHI has recorded an offsetting payable of $37 million in Payables to Controlled Affiliates and other liabilities. |
Page 10
Quarterly Financial Report as of October 6, 2016 (Unaudited)
Note 6 – Receivables from Debtors and Debtor-Controlled Entities and Other Assets (continued)
Page 11
Quarterly Financial Report as of October 6, 2016 (Unaudited)
Page 12
Quarterly Financial Report as of October 6, 2016 (Unaudited)
Page 13
Quarterly Financial Report as of October 6, 2016 (Unaudited)
Note 8 – Due from/to Affiliates (continued)
(a) Intercompany Balances Among Debtors and Debtor-Controlled Entities
The table below presents the Due from/to Debtors and Debtor-Controlled Entities balances as of October 6, 2016, and the related activity since the previously filed Quarterly Financial Report as of June 30, 2016:
| Activity 7/01/16 - 10/6/16 | ||||||||||||||||||||||||
| $ in millions | As of June 30, 2016 |
Cash Receipts | Cash Distributions |
Transfers / Claim Assignments (2) |
Withdrawal / Debt Forgiveness / Other (3) |
As of October 6, 2016 |
||||||||||||||||||
| Due From Controlled |
||||||||||||||||||||||||
| Debtors: |
||||||||||||||||||||||||
| Lehman Brothers Holdings Inc. |
$ | 28,408 | $ | (1,142 | ) | $ | — | $ | 385 | $ | (56 | ) | $ | 27,595 | ||||||||||
| Lehman Commercial Paper Inc. |
4,903 | (74 | ) | — | — | (89 | ) | 4,740 | ||||||||||||||||
| Lehman Brothers Special Financing Inc. |
505 | (16 | ) | — | — | (2 | ) | 486 | ||||||||||||||||
| Other Debtors |
581 | (11 | ) | — | 1 | 11 | 582 | |||||||||||||||||
|
|
|
|
|
|
|
|
|
|
|
|
|
|||||||||||||
| Subtotal Debtors |
34,396 | (1,243 | ) | — | 386 | (136 | ) | 33,403 | ||||||||||||||||
| Debtor-Controlled |
4,060 | (82 | ) | — | 2 | (1 | ) | 3,979 | ||||||||||||||||
|
|
|
|
|
|
|
|
|
|
|
|
|
|||||||||||||
| Total |
$ | 38,457 | $ | (1,325 | ) | $ | — | $ | 387 | $ | (137 | ) | $ | 37,382 | ||||||||||
|
|
|
|
|
|
|
|
|
|
|
|
|
|||||||||||||
| Due To Controlled (1) |
||||||||||||||||||||||||
| Debtors: |
||||||||||||||||||||||||
| Lehman Brothers Holdings Inc. |
$ | 4,316 | $ | — | $ | (90 | ) | $ | 2 | $ | 13 | $ | 4,241 | |||||||||||
| Lehman Commercial Paper Inc. |
3,978 | — | (203 | ) | — | (3 | ) | 3,772 | ||||||||||||||||
| Lehman Brothers Special Financing Inc. |
10,482 | — | (85 | ) | — | (106 | ) | 10,291 | ||||||||||||||||
| Other Debtors |
836 | — | (141 | ) | 3 | (1 | ) | 697 | ||||||||||||||||
|
|
|
|
|
|
|
|
|
|
|
|
|
|||||||||||||
| Subtotal Debtors |
19,611 | — | (519 | ) | 6 | (97 | ) | 19,001 | ||||||||||||||||
| Debtor-Controlled |
12,040 | — | (591 | ) | 381 | (39 | ) | 11,791 | ||||||||||||||||
|
|
|
|
|
|
|
|
|
|
|
|
|
|||||||||||||
| Total |
$ | 31,651 | $ | — | $ | (1,111 | ) | $ | 387 | $ | (136 | ) | $ | 30,792 | ||||||||||
|
|
|
|
|
|
|
|
|
|
|
|
|
|||||||||||||
| (1) | “Due to Debtors and Debtor-Controlled Entities” balances are reflected in Liabilities Subject to Compromise on the October 6, 2016 Balance Sheets. |
| (2) | As a result of the Lehman Brothers Asia Holdings Ltd (“LBAH”) Master Deed of Assignment (refer to the LBAH Scheme of Arrangement section in Note 9 of the Balance Sheets as of December 31, 2015, Docket No. 52332, for additional information), LBAH assigned to LBHI all of its claims against various Non-Controlled Affiliates and Debtor-Controlled Entities of approximately $385 million, net of distributions of $284 million: |
| (3) | Primarily includes (i) debt forgiveness by LBHI and LCPI of $184 million resulting from the corporate restructuring of a Debtor-Controlled Entity, and (ii) an adjustment to claims, net of catch-up Debtor Plan Distributions and intercompany funding adjustments between Debtors, of $93 million as a result of an income tax refund of $335 million (refer to Note 10 – Taxes Payable for additional information); partially offset by accrued interest of $146 million recorded by a Debtor-Controlled Entity due to LBHI. |
Page 14
Quarterly Financial Report as of October 6, 2016 (Unaudited)
Note 8 – Due from/to Affiliates (continued)
(a) Intercompany Balances Among Debtors and Debtor-Controlled Entities (continued)
The following table presents a summary of Due from/to Debtors and Debtor-Controlled Entities for Debtors as of October 6, 2016:
| LBHI | LBSF | LCPI | Other Debtors | Total Debtors | ||||||||||||||||||||||||||||||||||||
| $ in millions | Due from | Due to | Due from | Due to | Due from | Due to | Due from | Due to | Due from | Due to | ||||||||||||||||||||||||||||||
| Lehman Brothers Holdings Inc |
$ | — | $ | — | $ | 180 | $ | (9,909 | ) | $ | 128 | $ | (3,371 | ) | $ | 85 | $ | (212 | ) | $ | 392 | $ | (13,492 | ) | ||||||||||||||||
| LB Special Financing Inc |
9,909 | (180 | ) | — | — | 97 | (233 | ) | 281 | (36 | ) | 10,287 | (449 | ) | ||||||||||||||||||||||||||
| Lehman Commercial Paper Inc |
3,371 | (128 | ) | 233 | (97 | ) | — | — | 142 | (348 | ) | 3,746 | (572 | ) | ||||||||||||||||||||||||||
| Structured Asset Securities Corp |
88 | — | 0 | — | — | (141 | ) | — | — | 88 | (141 | ) | ||||||||||||||||||||||||||||
| LB Commodity Services Inc |
80 | (40 | ) | — | (269 | ) | — | (1 | ) | — | (0 | ) | 80 | (311 | ) | |||||||||||||||||||||||||
| LB Commercial Corporation |
41 | (21 | ) | 36 | — | 104 | — | 0 | — | 183 | (21 | ) | ||||||||||||||||||||||||||||
| Merit, LLC |
3 | (14 | ) | — | (13 | ) | 158 | — | — | — | 160 | (27 | ) | |||||||||||||||||||||||||||
| LB OTC Derivatives Inc |
0 | (0 | ) | 0 | — | — | — | — | — | 0 | (0 | ) | ||||||||||||||||||||||||||||
| Other Debtors |
0 | (9 | ) | 0 | — | 86 | (0 | ) | 0 | (0 | ) | 86 | (9 | ) | ||||||||||||||||||||||||||
| RACERS Claims (1) |
820 | — | — | — | — | — | — | — | 820 | — | ||||||||||||||||||||||||||||||
|
|
|
|||||||||||||||||||||||||||||||||||||||
| Total Debtors |
$ | 14,312 | $ | (392 | ) | $ | 449 | $ | (10,287 | ) | $ | 572 | $ | (3,746 | ) | $ | 508 | $ | (596 | ) | $ | 15,842 | $ | (15,022 | ) | |||||||||||||||
| Lehman Ali Inc: |
||||||||||||||||||||||||||||||||||||||||
| Lehman Ali Inc (PCO) |
— | (2,441 | ) | — | (0 | ) | 2,492 | — | 0 | — | 2,492 | (2,441 | ) | |||||||||||||||||||||||||||
| LCPI Properties Inc |
0 | (493 | ) | — | — | — | (0 | ) | — | (0 | ) | 0 | (493 | ) | ||||||||||||||||||||||||||
| LB I Group Inc: |
||||||||||||||||||||||||||||||||||||||||
| LB I Group Inc (PCO) |
1,594 | (28 | ) | 7 | — | 45 | (1 | ) | — | — | 1,646 | (28 | ) | |||||||||||||||||||||||||||
| LB Offshore Partners Ltd |
363 | — | — | (0 | ) | 1 | — | — | — | 364 | (0 | ) | ||||||||||||||||||||||||||||
| DL Mortgage Corp |
— | (183 | ) | 0 | — | 764 | — | — | — | 764 | (183 | ) | ||||||||||||||||||||||||||||
| 314 Commonwealth Ave Inc: |
||||||||||||||||||||||||||||||||||||||||
| 314 Commonwealth Ave Inc (PCO) |
792 | (86 | ) | — | (2 | ) | — | — | — | (86 | ) | 792 | (174 | ) | ||||||||||||||||||||||||||
| LB U.K. Holdings (Delaware) Inc: |
||||||||||||||||||||||||||||||||||||||||
| LB U.K. Holdings (Delaware) Inc (PCO) |
177 | (35 | ) | — | — | — | — | — | (14 | ) | 177 | (49 | ) | |||||||||||||||||||||||||||
| Other: |
||||||||||||||||||||||||||||||||||||||||
| Pami Ali LLC |
1,791 | (64 | ) | 1 | — | 833 | (2 | ) | — | — | 2,625 | (66 | ) | |||||||||||||||||||||||||||
| Luxembourg Finance Sarl |
1,051 | — | 28 | — | — | — | 74 | — | 1,152 | — | ||||||||||||||||||||||||||||||
| Real Estate Private Equity Inc |
597 | — | — | — | — | — | — | — | 597 | — | ||||||||||||||||||||||||||||||
| SMF No.1 Limited |
191 | — | — | — | — | — | — | — | 191 | — | ||||||||||||||||||||||||||||||
| Repe LBREP II Holdings, L.P. |
189 | — | — | — | — | — | — | — | 189 | — | ||||||||||||||||||||||||||||||
| Lehman Brothers Global Services Inc. |
55 | — | — | (0 | ) | — | (0 | ) | — | (0 | ) | 55 | (0 | ) | ||||||||||||||||||||||||||
| LB Pass-Through Securities Inc |
45 | — | — | — | — | — | — | — | 45 | — | ||||||||||||||||||||||||||||||
| LB Private Equity Advisers LLC |
— | (86 | ) | — | (0 | ) | — | — | — | — | — | (86 | ) | |||||||||||||||||||||||||||
| Other |
667 | (433 | ) | 1 | (1 | ) | 33 | (23 | ) | (0 | ) | (2 | ) | 701 | (459 | ) | ||||||||||||||||||||||||
| LB Re Financing No.1 Limited |
5,771 | — | — | — | — | — | — | — | 5,771 | — | ||||||||||||||||||||||||||||||
|
|
|
|||||||||||||||||||||||||||||||||||||||
| Total Debtor-Controlled Entities |
$ | 13,284 | $ | (3,849 | ) | $ | 37 | $ | (4 | ) | $ | 4,168 | $ | (26 | ) | $ | 74 | $ | (101 | ) | $ | 17,562 | $ | (3,979 | ) | |||||||||||||||
|
|
|
|||||||||||||||||||||||||||||||||||||||
| Total |
$ | 27,595 | $ | (4,241 | ) | $ | 486 | $ | (10,291 | ) | $ | 4,740 | $ | (3,772 | ) | $ | 582 | $ | (697 | ) | $ | 33,403 | $ | (19,001 | ) | |||||||||||||||
|
|
|
|||||||||||||||||||||||||||||||||||||||
“PCO” – parent company only
| (1) | Refer to Section IV.I.b of the Disclosure Statement for further information on the RACERS Claims. |
Page 15
Quarterly Financial Report as of October 6, 2016 (Unaudited)
Note 8 – Due from/to Affiliates (continued)
(a) Intercompany Balances Among Debtors and Debtor-Controlled Entities (continued)
The following table presents a summary of Due from/to Affiliates balances for Debtor-Controlled Entities as of October 6, 2016:
| Lehman ALI Inc. | LB I Group Inc. | 314 Commonwealth Ave. Inc. |
LB UK Holdings Delaware Inc. |
Other Debtor- Controlled Entities |
||||||||||||||||||||||||||||||||||||
| $ in millions | Due from | Due to | Due from | Due to | Due from | Due to | Due from | Due to | Due from | Due to | ||||||||||||||||||||||||||||||
|
|
|
|||||||||||||||||||||||||||||||||||||||
| Debtors: |
||||||||||||||||||||||||||||||||||||||||
| Lehman Brothers Holdings Inc. |
$ | 2,934 | $ | — | $ | 211 | $ | (1,958 | ) | $ | 86 | $ | (792 | ) | $ | 35 | $ | (177 | ) | $ | 583 | $ | (4,585 | ) | ||||||||||||||||
| Lehman Commercial Paper Inc. |
— | (2,492 | ) | 1 | (810 | ) | — | — | — | — | 25 | (866 | ) | |||||||||||||||||||||||||||
| Lehman Brothers Special Financing Inc. |
— | — | — | (7 | ) | 2 | — | — | — | 1 | (30 | ) | ||||||||||||||||||||||||||||
| Lehman Brothers Commercial Corporation |
— | — | — | — | — | 14 | — | — | — | |||||||||||||||||||||||||||||||
| Luxembourg Residential Properties Loan Fin S.a.r.l. |
— | — | — | — | 86 | — | — | — | — | — | ||||||||||||||||||||||||||||||
|
|
|
|
|
|
|
|
|
|
|
|||||||||||||||||||||||||||||||
| Total Debtors |
$ | 2,934 | $ | (2,492 | ) | $ | 212 | $ | (2,774 | ) | $ | 174 | $ | (792 | ) | $ | 49 | $ | (177 | ) | $ | 609 | $ | (5,481 | ) | |||||||||||||||
| Debtor-Controlled: |
||||||||||||||||||||||||||||||||||||||||
| 314 Commonwealth Ave Inc |
$ | 45 | $ | — | $ | — | $ | — | $ | — | $ | — | $ | — | $ | — | $ | — | $ | — | ||||||||||||||||||||
| Lehman Ali Inc (1) |
— | — | — | — | — | (45 | ) | — | — | 225 | — | |||||||||||||||||||||||||||||
| Repe LBREP III LLC (1) |
— | — | — | — | — | — | — | — | 119 | — | ||||||||||||||||||||||||||||||
| Real Estate Private Equity Inc (1) |
— | — | — | — | — | — | — | — | 219 | — | ||||||||||||||||||||||||||||||
| LB I Group Inc. |
— | — | — | — | — | — | — | — | — | (299 | ) | |||||||||||||||||||||||||||||
| LCPI Properties Inc. |
— | — | — | — | — | — | — | — | — | (167 | ) | |||||||||||||||||||||||||||||
| Pami ALI LLC |
167 | (225 | ) | 299 | — | — | — | — | — | — | (338 | ) | ||||||||||||||||||||||||||||
| Other |
25 | (0 | ) | 28 | (29 | ) | 0 | (2 | ) | 26 | (23 | ) | (1 | ) | (97 | ) | ||||||||||||||||||||||||
|
|
|
|
|
|
|
|
|
|
|
|||||||||||||||||||||||||||||||
| Total Debtor-Controlled Entities |
$ | 237 | $ | (225 | ) | $ | 327 | $ | (29 | ) | $ | 0 | $ | (47 | ) | $ | 26 | $ | (23 | ) | $ | 562 | $ | (901 | ) | |||||||||||||||
|
|
|
|
|
|
|
|
|
|
|
|||||||||||||||||||||||||||||||
| Total |
$ | 3,171 | $ | (2,717 | ) | $ | 539 | $ | (2,803 | ) | $ | 174 | $ | (839 | ) | $ | 75 | $ | (200 | ) | $ | 1,171 | $ | (6,382 | ) | |||||||||||||||
|
|
|
|
|
|
|
|
|
|
|
|||||||||||||||||||||||||||||||
| Non-Controlled Affiliates: (2) |
||||||||||||||||||||||||||||||||||||||||
| Lehman Brothers Holdings Intermediate 2 Ltd |
$ | — | $ | — | $ | — | $ | — | $ | — | $ | — | $ | 77 | $ | — | $ | 749 | $ | — | ||||||||||||||||||||
| Lehman Brothers Holdings PLC |
— | — | — | — | — | — | 145 | (53 | ) | 2 | — | |||||||||||||||||||||||||||||
| LB Commercial Corp Asia Limited |
— | — | — | — | — | — | — | 968 | — | |||||||||||||||||||||||||||||||
| LB UK RE Holdings Limited |
— | — | — | — | 6 | — | — | — | — | — | ||||||||||||||||||||||||||||||
| Other |
0 | — | 1 | (1 | ) | — | — | 102 | (3 | ) | 51 | (30 | ) | |||||||||||||||||||||||||||
|
|
|
|
|
|
|
|
|
|
|
|||||||||||||||||||||||||||||||
| Total |
$ | 0 | $ | — | $ | 1 | $ | (1 | ) | $ | 6 | $ | — | $ | 323 | $ | (56 | ) | $ | 1,771 | $ | (30 | ) | |||||||||||||||||
|
|
|
|
|
|
|
|
|
|
|
|||||||||||||||||||||||||||||||
| (1) | “Due from” balances at Other Debtor-Controlled Entities are related to receivables recorded by Pami ALI LLC. |
| (2) | Certain “Due from” balances are recorded in the local currency of the respective Non-Controlled Affiliates and as a result, balances may fluctuate as a result of changes in foreign exchange rates. Due from/to Affiliates balances include both settled and unresolved balances with Non-Controlled Affiliates. |
Page 16
Quarterly Financial Report as of October 6, 2016 (Unaudited)
Note 8 – Due from/to Affiliates (continued)
(b) Intercompany balances among Debtors and Debtor-Controlled Entities and Non-Controlled Affiliates
The table below presents the Due from/to Non-Controlled Affiliates balances as of October 6, 2016, and the related activity since the previously filed Quarterly Financial Report as of June 30, 2016:
| Activity 7/01/16—10/6/16 | ||||||||||||||||||||||||
| $ in millions | As of June 30, 2016 |
Cash Receipts (1) |
Cash Distributions |
Claim Assignments (2) |
Other (3) | As of October 6, 2016 |
||||||||||||||||||
| Due From Non-Controlled |
||||||||||||||||||||||||
| Debtors: |
||||||||||||||||||||||||
| Lehman Brothers Holdings Inc. |
$ | 18,987 | $ | (1,336 | ) | $ | — | $ | 3,877 | $ | (3,189 | ) | $ | 18,339 | ||||||||||
| Lehman Commercial Paper Inc. |
136 | (0 | ) | — | — | (0 | ) | 136 | ||||||||||||||||
| Lehman Brothers Special Financing Inc. |
1,204 | (40 | ) | — | (429 | ) | (21 | ) | 714 | |||||||||||||||
| Other Debtors |
368 | (21 | ) | — | (66 | ) | 2 | 282 | ||||||||||||||||
|
|
|
|
|
|
|
|
|
|
|
|
|
|||||||||||||
| Subtotal Debtors |
20,694 | (1,398 | ) | — | 3,382 | (3,208 | ) | 19,470 | ||||||||||||||||
| Debtor-Controlled |
1,157 | (45 | ) | — | 1,002 | (13 | ) | 2,101 | ||||||||||||||||
|
|
|
|
|
|
|
|
|
|
|
|
|
|||||||||||||
| Total |
$ | 21,851 | $ | (1,442 | ) | $ | — | $ | 4,384 | $ | (3,221 | ) | $ | 21,571 | ||||||||||
|
|
|
|
|
|
|
|
|
|
|
|
|
|||||||||||||
| Due To Non-Controlled (4) |
||||||||||||||||||||||||
| Debtors: |
||||||||||||||||||||||||
| Lehman Brothers Holdings Inc. |
$ | 39,403 | $ | — | $ | (821 | ) | $ | (3 | ) | $ | 16 | $ | 38,595 | ||||||||||
| Lehman Commercial Paper Inc. |
649 | — | (29 | ) | — | (6 | ) | 615 | ||||||||||||||||
| Lehman Brothers Special Financing Inc. |
974 | — | (8 | ) | — | (0 | ) | 966 | ||||||||||||||||
| Other Debtors |
91 | — | (0 | ) | (5 | ) | (6 | ) | 80 | |||||||||||||||
|
|
|
|
|
|
|
|
|
|
|
|
|
|||||||||||||
| Subtotal Debtors |
41,117 | — | (858 | ) | (8 | ) | 4 | 40,255 | ||||||||||||||||
| Debtor-Controlled |
466 | — | — | (379 | ) | 0 | 87 | |||||||||||||||||
|
|
|
|
|
|
|
|
|
|
|
|
|
|||||||||||||
| Total |
$ | 41,583 | $ | — | $ | (858 | ) | $ | (387 | ) | $ | 4 | $ | 40,343 | ||||||||||
|
|
|
|
|
|
|
|
|
|
|
|
|
|||||||||||||
| (1) | Between July 1, 2016 and October 6, 2016, the Company collected approximately $1,442 million from: |
| $ in millions |
LBHI | LBSF | LCPI | Other Debtors |
Debtor- Controlled Entities |
Total | ||||||||||||||||||
| Lehman Brothers Bankhaus A.G. (“Bankhaus”) (i) |
$ | 794 | $ | — | $ | 0 | $ | 16 | $ | — | $ | 809 | ||||||||||||
| Lehman Brothers Asia Holding Ltd |
169 | — | — | — | — | 169 | ||||||||||||||||||
| Lehman Brothers Finance S.A. |
130 | — | — | — | — | 130 | ||||||||||||||||||
| Lehman Brothers Commercial Corp. Asia Ltd |
28 | — | — | 2 | 37 | 67 | ||||||||||||||||||
| Lehman Brothers Treasury Co. B.V. (“LBT”) (ii) |
47 | 14 | — | 2 | — | 63 | ||||||||||||||||||
| Lehman Brothers Australia Ltd |
47 | — | — | — | — | 47 | ||||||||||||||||||
| Lehman Brothers (Luxembourg) S.A. |
43 | — | — | — | — | 43 | ||||||||||||||||||
| LB Investments PTE Ltd |
32 | — | — | — | — | 32 | ||||||||||||||||||
| LB RE Financing No.3 Limited |
— | 26 | — | — | — | 26 | ||||||||||||||||||
| Lehman Commercial Mortgage Conduit Ltd |
21 | — | — | — | — | 21 | ||||||||||||||||||
| Other |
25 | — | 0 | 2 | 8 | 34 | ||||||||||||||||||
|
|
|
|
|
|
|
|
|
|
|
|
|
|||||||||||||
| $ | 1,336 | $ | 40 | $ | 0 | $ | 21 | $ | 45 | $ | 1,442 | |||||||||||||
|
|
|
|
|
|
|
|
|
|
|
|
|
|||||||||||||
| (i) | Receipts at LBHI primarily relate to direct claims against Bankhaus that were previously assigned to LBHI as a result of the Bankhaus Creditors’ Settlement (refer to Note 8(c) – Settlements with Non-Controlled Affiliates for further information). |
| (ii) | Pursuant to agreements with LBT, LBSF and LBCS, LBHI deducted and withheld approximately $56 million from its eleventh Plan Distribution (“Withheld Distributions”) due from LBHI to LBT to offset amounts due to LBHI, LBSF and LBCS from LBT. The Withheld Distributions were then distributed to LBSF, LBCS and LBHI for inclusion in their respective eleventh Plan Distributions. |
Page 17
Quarterly Financial Report as of October 6, 2016 (Unaudited)
| (2) | Primarily includes the: |
| (i) | assignment from LBAH to LBHI of LBAH’s claims against various Non-Controlled Affiliates ($4.4 billion, net of distributions; see table below for detail of claims by legal entity) and Debtor-Controlled Entities ($385 million, net of distributions) in consideration for LBHI’s receivables from LBAH, per the LBAH Master Deed of Assignment. As a result, LBHI recorded debt forgiveness of $3.1 billion (reflected in “Other”) and no longer has a receivable from LBAH. The assigned claims were recorded gross, net of distributions collected; |
Claim Assignments from LBAH to LBHI:
| $ in millions |
Gross Amount | Distributions at Assignment |
Net Amount | |||||||||
| Lehman Brothers Japan Inc |
$ | 2,876 | $ | (2,470 | ) | $ | 406 | |||||
| Sunrise Finance Co., Ltd |
2,208 | (1,130 | ) | 1,078 | ||||||||
| Lehman Brothers Commercial Corporation Asia Ltd |
1,766 | (1,022 | ) | 743 | ||||||||
| Lehman Brothers Holdings Japan Inc |
1,718 | (792 | ) | 927 | ||||||||
| Lehman Brothers Asia Pacific (Singapore) Pte Ltd |
685 | (121 | ) | 564 | ||||||||
| Lehman Brothers Asia Capital Company |
402 | (82 | ) | 320 | ||||||||
| Lehman Brothers Real Estate Australia Commercial Pty Ltd |
165 | — | 165 | |||||||||
| Other |
490 | (290 | ) | 201 | ||||||||
|
|
|
|
|
|
|
|||||||
| $ | 10,310 | $ | (5,907 | ) | $ | 4,403 | ||||||
|
|
|
|
|
|
|
|||||||
| (ii) | contribution from LBHI to LPTSI of LBHI’s claims against Lehman Brothers Commercial Corp. Asia Ltd (“LBCCA”) of $2.3 billion, net of $1.3 billion of distributions, as a result of a corporate restructure; and |
| (iii) | assignment from LBSF to LBHI of LBSF’s claims against LB RE Financing No. 3 Limited of $421 million, net of distributions, in exchange for incremental value received by LBSF as a result of LBHI’s withdrawal of its claim against FIN3. LBHI received this claim, which had not been allowed by FIN3, from Bankhaus. |
| (3) | “Due From Non-Controlled” balances are recorded in the local currency of the Non-Controlled Affiliate and as a result, balances fluctuate due to changes in foreign exchange rates. Other includes the impact of movements in foreign exchange rates of approximately $118 million. |
| (4) | “Due to Non-Controlled” balances are reflected in Liabilities Subject to Compromise herein. |
Page 18
Quarterly Financial Report as of October 6, 2016 (Unaudited)
Note 8 – Due from/to Affiliates (continued)
(b) Intercompany balances among Debtors and Debtor-Controlled Entities and Non-Controlled Affiliates (continued)
The following table presents a summary of Due from/to Non-Controlled Affiliates for Debtors as of October 6, 2016:
| LBHI | LBSF | LCPI | Other Debtors | Total Debtors | ||||||||||||||||||||||||||||||||||||
| $ in millions | Due from | Due to | Due from | Due to | Due from | Due to | Due from | Due to | Due from | Due to | ||||||||||||||||||||||||||||||
| Europe |
||||||||||||||||||||||||||||||||||||||||
| Lehman Brothers Treasury Co B.V. (1) |
$ | 2,195 | $ | (23,269 | ) | $ | 685 | $ | — | $ | — | $ | — | $ | 108 | $ | — | $ | 2,988 | $ | (23,269 | ) | ||||||||||||||||||
| Lehman Brothers Finance S.A. |
8,656 | (699 | ) | — | — | — | — | — | — | 8,656 | (699 | ) | ||||||||||||||||||||||||||||
| Lehman Brothers Bankhaus A.G. |
418 | (32 | ) | — | (109 | ) | — | (90 | ) | 9 | — | 427 | (230 | ) | ||||||||||||||||||||||||||
| LB UK RE Holdings Limited |
610 | — | — | — | — | — | — | — | 610 | — | ||||||||||||||||||||||||||||||
| Lehman Brothers (Luxembourg) S.A. |
324 | — | — | — | — | — | — | — | 324 | — | ||||||||||||||||||||||||||||||
| Thayer Properties Limited |
182 | — | — | — | — | (0 | ) | — | — | 182 | (0 | ) | ||||||||||||||||||||||||||||
| LB (PTG) Ltd |
139 | — | — | — | 0 | — | (0 | ) | — | 139 | — | |||||||||||||||||||||||||||||
| LB Lease & Finance No.1 Ltd |
— | — | — | — | — | — | — | — | — | — | ||||||||||||||||||||||||||||||
| LB (Luxembourg) Equity Finance S.A |
53 | (57 | ) | — | — | — | — | — | — | 53 | (57 | ) | ||||||||||||||||||||||||||||
| Longmeade Limited |
8 | — | — | — | — | (57 | ) | — | — | 8 | (57 | ) | ||||||||||||||||||||||||||||
| LB RE Financing No.2 Limited (2) |
0 | (4,574 | ) | — | — | — | — | — | — | 0 | (4,574 | ) | ||||||||||||||||||||||||||||
| Lehman Brothers Limited |
29 | (245 | ) | — | (2 | ) | — | (1 | ) | — | (0 | ) | 29 | (249 | ) | |||||||||||||||||||||||||
| Lehman Brothers International (Europe) (3) |
0 | (759 | ) | — | (550 | ) | — | — | — | — | 0 | (1,309 | ) | |||||||||||||||||||||||||||
| LB Luxembourg Investments Sarl |
0 | (434 | ) | — | — | — | — | — | — | 0 | (434 | ) | ||||||||||||||||||||||||||||
| Eldon Street Holdings Limited |
— | (433 | ) | — | — | — | (0 | ) | — | — | — | (433 | ) | |||||||||||||||||||||||||||
| LB RE Financing No.3 Limited |
421 | — | — | — | — | — | — | — | 421 | — | ||||||||||||||||||||||||||||||
| LB Holdings Intermediate 2 Ltd |
— | (208 | ) | — | — | — | — | — | — | — | (208 | ) | ||||||||||||||||||||||||||||
| Wood Street Investments Ltd |
— | (186 | ) | — | — | — | — | — | — | — | (186 | ) | ||||||||||||||||||||||||||||
| Storm Funding Ltd |
— | (101 | ) | — | (3 | ) | — | (42 | ) | — | 0 | — | (146 | ) | ||||||||||||||||||||||||||
| Asia |
||||||||||||||||||||||||||||||||||||||||
| Sunrise Finance Co. Ltd |
1,090 | (19 | ) | — | (14 | ) | — | (0 | ) | — | (0 | ) | 1,090 | (33 | ) | |||||||||||||||||||||||||
| LB Commercial Corp. Asia Limited |
773 | — | — | — | — | (1 | ) | — | (54 | ) | 773 | (55 | ) | |||||||||||||||||||||||||||
| Lehman Brothers Holdings Japan Inc. |
925 | (32 | ) | — | — | — | — | — | — | 925 | (32 | ) | ||||||||||||||||||||||||||||
| LB Asia Pacific (Singapore) PTE |
925 | — | — | — | — | — | — | — | 925 | — | ||||||||||||||||||||||||||||||
| Lehman Brothers Japan Inc. |
410 | (78 | ) | — | (131 | ) | — | — | 17 | — | 427 | (209 | ) | |||||||||||||||||||||||||||
| LB Asia Capital Company |
344 | — | 29 | — | 133 | — | 148 | — | 655 | — | ||||||||||||||||||||||||||||||
| LB Investments PTE Ltd |
271 | (1 | ) | — | (3 | ) | — | — | — | (0 | ) | 271 | (5 | ) | ||||||||||||||||||||||||||
| LB Securities Asia Limited |
13 | (5 | ) | — | — | — | — | — | — | 13 | (5 | ) | ||||||||||||||||||||||||||||
| Other |
||||||||||||||||||||||||||||||||||||||||
| Claims held by third parties (4) |
— | (7,267 | ) | — | (83 | ) | — | (398 | ) | — | (1 | ) | — | (7,750 | ) | |||||||||||||||||||||||||
| Other |
552 | (193 | ) | 0 | (71 | ) | 2 | (26 | ) | — | (24 | ) | 554 | (314 | ) | |||||||||||||||||||||||||
|
|
|
|
|
|
|
|
|
|
|
|||||||||||||||||||||||||||||||
| Total |
18,339 | $ | (38,595 | ) | $ | 714 | $ | (966 | ) | $ | 136 | $ | (615 | ) | $ | 282 | $ | (80 | ) | $ | 19,470 | $ | (40,255 | ) | ||||||||||||||||
|
|
|
|
|
|
|
|
|
|
|
|||||||||||||||||||||||||||||||
| (1) | LBT is included in the defined term “Non-Controlled Affiliates,” but LBHI has no direct or indirect equity interest in LBT. |
| (2) | Distributions from LBHI to LB RE Financing No.2 Limited (“FIN2”) are subsequently remitted from FIN2 to LB RE Financing No. 1 Limited (“FIN1”); FIN1 then pays these monies to LBHI to satisfy its obligations. |
| (3) | LBHI owns allowed claims against LBIE in the aggregate face amount of £353 million. |
Page 19
Quarterly Financial Report as of October 6, 2016 (Unaudited)
Note 8 – Due from/to Affiliates (continued)
(b) Intercompany balances among Debtors and Debtor-Controlled Entities and Non-Controlled Affiliates (continued)
| (4) | “Claims held by third parties” represent claims, net of distributions, originally held by Non-Controlled Affiliates, according to their respective settlement agreements with the Company, that are currently held by third parties, including: |
| ($ in millions) | ||||||||||||||||
| Orignal creditor |
LBHI | LBSF | LCPI | Total | ||||||||||||
| Lehman Brothers Bankhaus A.G. |
$ | (5,005 | ) | $ | — | $ | (232 | ) | $ | (5,237 | ) | |||||
| Lehman Brothers Securities NV |
(518 | ) | (46 | ) | — | (564 | ) | |||||||||
| Storm Funding Ltd |
(594 | ) | — | — | (594 | ) | ||||||||||
| LB Asia Capital Company |
(418 | ) | — | — | (418 | ) | ||||||||||
| Lehman Re Limited |
(291 | ) | (16 | ) | (112 | ) | (418 | ) | ||||||||
| LB Securities Asia Limited |
(134 | ) | — | — | (134 | ) | ||||||||||
| Lehman Brothers Asia Limited |
(128 | ) | — | — | (128 | ) | ||||||||||
| Lehman Brothers Futures Asia Limited |
(61 | ) | — | — | (61 | ) | ||||||||||
| Lehman Brothers Asia holdings Limited |
— | (22 | ) | (52 | ) | (74 | ) | |||||||||
| Other |
(119 | ) | — | (2 | ) | (121 | ) | |||||||||
|
|
|
|
|
|
|
|
|
|||||||||
| Total Claims held by third parties |
$ | (7,267 | ) | $ | (83 | ) | $ | (398 | ) | $ | (7,749 | ) | ||||
|
|
|
|
|
|
|
|
|
|||||||||
The following table presents, on an aggregate basis for Debtors and Debtor-Controlled Entities, admitted claims, receivables, and collections to date from Non-Controlled Affiliates:
| $ in millions |
Local Currency |
Admitted Claims in Local Currency |
Collections To Date in Local Currency (5) |
Admitted and Unsettled Filed Claims in USD |
Collections To Date in USD (5) |
Net Receivables in USD |
||||||||||||||||||
| Europe |
||||||||||||||||||||||||
| Lehman Brothers Finance S.A. |
CHF | 9,582 | (1,107 | ) | $ | 9,785 | $ | (1,128 | ) | $ | 8,656 | |||||||||||||
| Lehman Brothers Treasury Co B.V. |
USD | 4,342 | (1,434 | ) | 4,342 | (1,434 | ) | 2,907 | ||||||||||||||||
| Lehman Brothers Treasury Co B.V. (1) |
Various | — | — | 113 | (32 | ) | 81 | |||||||||||||||||
| Lehman Brothers Bankhaus A.G. |
EUR | 203 | (180 | ) | 226 | (217 | ) | 9 | ||||||||||||||||
| Lehman Brothers Bankhaus A.G. - Assigned (2) |
EUR | 9,383 | (9,008 | ) | 10,454 | (10,036 | ) | 418 | ||||||||||||||||
| LB UK RE Holdings Limited |
GBP | 1,188 | (700 | ) | 1,498 | (882 | ) | 616 | ||||||||||||||||
| Lehman Brothers (Luxembourg) S.A. |
EUR | 759 | (468 | ) | 846 | (522 | ) | 324 | ||||||||||||||||
| LB Holdings Intermediate 2 Ltd (3) (4) |
— | — | — | 826 | — | 826 | ||||||||||||||||||
| Lehman Brothers International (Europe) |
GBP | 359 | 359 | 454 | (454 | ) | — | |||||||||||||||||
| LB RE Financing No.3 Limited |
GBP | 353 | (19 | ) | 445 | (24 | ) | 421 | ||||||||||||||||
| LB Commercial Mortgage Conduit Ltd |
GBP | 240 | (206 | ) | 303 | (259 | ) | 43 | ||||||||||||||||
| Thayer Properties Limited |
GBP | 172 | (28 | ) | 216 | (35 | ) | 182 | ||||||||||||||||
| LB (PTG) Ltd |
GBP | 170 | (60 | ) | 214 | (76 | ) | 139 | ||||||||||||||||
| Lehman Brothers Holdings Plc |
GBP | 160 | (8 | ) | 202 | (13 | ) | 189 | ||||||||||||||||
| LB (Luxembourg) Equity Finance S.A |
EUR | 96 | (48 | ) | 107 | (53 | ) | 53 | ||||||||||||||||
| Longmeade Limited |
GBP | 43 | (17 | ) | 54 | (21 | ) | 33 | ||||||||||||||||
| Asia |
||||||||||||||||||||||||
| Sunrise Finance Co. Ltd |
JPY | 233,672 | (119,679 | ) | 2,244 | (1,149 | ) | 1,095 | ||||||||||||||||
| Lehman Brothers Holdings Japan Inc. |
JPY | 178,617 | (82,289 | ) | 1,715 | (790 | ) | 925 | ||||||||||||||||
| LB Asia Capital Company |
HKD | 6,398 | (1,312 | ) | 825 | (169 | ) | 656 | ||||||||||||||||
| LB Asia Pacific (Singapore) PTE (4) |
USD | 366 | — | 366 | — | 366 | ||||||||||||||||||
| LB Asia Pacific (Singapore) PTE (4) |
SGD | 931 | (164 | ) | 678 | (119 | ) | 559 | ||||||||||||||||
| LB Commercial Corp. Asia Limited |
HKD | 32,615 | (19,103 | ) | 4,204 | (2,462 | ) | 1,742 | ||||||||||||||||
| LB Investments PTE Ltd (4) |
USD | 456 | (231 | ) | 456 | (231 | ) | 225 | ||||||||||||||||
| LB Investments PTE Ltd (4) |
SGD | 130 | (66 | ) | 95 | (48 | ) | 46 | ||||||||||||||||
| LB Securities Asia Limited |
HKD | 2,126 | (2,022 | ) | 274 | (261 | ) | 13 | ||||||||||||||||
| Lehman Brothers Japan Inc. |
JPY | 316,163 | (271,542 | ) | 3,036 | (2,607 | ) | 428 | ||||||||||||||||
| GKI Development Inc. |
KRW | 103,363 | (90,393 | ) | 93 | (81 | ) | 12 | ||||||||||||||||
| Lehman Brothers Australia Ltd |
AUD | 111 | (63 | ) | 84 | (48 | ) | 36 | ||||||||||||||||
| Sail Investor PTE Ltd |
USD | 63 | (60 | ) | 63 | (60 | ) | 3 | ||||||||||||||||
| Other (6) |
11,606 | (11,038 | ) | 568 | ||||||||||||||||||||
|
|
|
|
|
|||||||||||||||||||||
| Total |
$ | 55,823 | $ | (34,252 | ) | $ | 21,571 | |||||||||||||||||
|
|
|
|
|
|||||||||||||||||||||
Page 20
Quarterly Financial Report as of October 6, 2016 (Unaudited)
Note 8 – Due from/to Affiliates (continued)
(b) Intercompany balances among Debtors and Debtor-Controlled Entities and Non-Controlled Affiliates (continued)
| (1) | Represents claims against LBT that were admitted in eight different currencies. |
| (2) | Includes gross claims against Lehman Brothers Bankhaus A.G. of € 9.314 billion that were assigned as a result of the Harmonizing Resolution (refer to Note 8(c) – Settlements with Non-Controlled Affiliates for further information), net of €7.823 billion of distributions received by owners of the claims prior to the assignment of the claims to LBHI. |
| (3) | “Admitted and Unsettled Filed Claims in USD” includes the unsettled historical receivable balances for filed claims which have not yet been admitted. |
| (4) | Includes allowed claims that are deemed subordinated against LB Asia Pacific (Singapore) PTE of $366 million and LB Investments PTE Ltd of $6 million. A filed subordinated claim by LB Holdings Scottish LP 3 of $6.139 billion against LB Holdings Intermediate 2 Ltd is fully reserved in the Balance Sheets. |
| (5) | “Collections to Date in Local Currency” and “Collections to Date in USD” include distributions received on the claims prior to the assignments of the claims to LBHI and Debtor-Controlled Entities. |
| (6) | LB Lease & Finance No.1 Ltd made a final distribution, which included a distribution in kind of a £22.8 million claim against Lehman Brothers Limited that is included in “Other”. |
| (7) | Other claims against Lehman Brothers Finance S.A., Bankhaus, LBT and LBIE, acquired through settlements with third parties are included in Affiliate Claims receivables in the Balance Sheets (refer to Note 6 – Receivables from Controlled Affiliates and Other Assets for additional information). |
Page 21
Quarterly Financial Report as of October 6, 2016 (Unaudited)
Note 8 – Due from/to Affiliates (continued)
(c) Settlements with Non-Controlled Affiliates
Page 22
Quarterly Financial Report as of October 6, 2016 (Unaudited)
Note 8 – Due from/to Affiliates (continued)
(c) Settlements with Non-Controlled Affiliates (continued)
Page 23
Quarterly Financial Report as of October 6, 2016 (Unaudited)
Note 9 – Payables to Debtors and Debtor-Controlled Entities and Other Liabilities
Payables to Debtors and Debtor-Controlled Entities and Other Liabilities includes: (i) $2.5 billion related to certain post-petition activities between and among Debtors and Debtor-Controlled Entities, with the corresponding assets reflected in Receivables from Debtors and Debtor-Controlled Entities and Other Assets and (ii) $414 million of other liabilities.
The following table summarizes the main components of Payables to Debtors and Debtor-Controlled Entities and Other Liabilities as of October 6, 2016:
| Debtors | Debtor- | Total Debtors and Debtor- |
||||||||||||||||||||||||||
| $ in millions | LBHI | LCPI | LBSF | Other Debtors |
Total | Controlled Entities |
Controlled Entities |
|||||||||||||||||||||
| Encumbered Financial Inventory (1) |
$ | 13 | $ | — | $ | — | $ | — | $ | 13 | $ | 462 | $ | 475 | ||||||||||||||
| Secured Notes (2) |
1,222 | 140 | 10 | — | 1,372 | — | 1,372 | |||||||||||||||||||||
| Fundings and other activites (3) |
240 | 241 | 13 | 39 | 533 | 143 | 677 | |||||||||||||||||||||
|
|
|
|
|
|
|
|||||||||||||||||||||||
| Payables to Controlled Affiliates |
1,475 | 381 | 23 | 39 | 1,918 | 605 | 2,523 | |||||||||||||||||||||
| Distributions on Allowed Claims (not remitted) |
85 | 0 | 0 | — | 86 | — | 86 | |||||||||||||||||||||
| Misdirected wires |
55 | — | — | — | 55 | — | 55 | |||||||||||||||||||||
| LBHI2 Loan (4) |
104 | — | — | — | 104 | — | 104 | |||||||||||||||||||||
| Other |
58 | 12 | 0 | 1 | 71 | 98 | 169 | |||||||||||||||||||||
|
|
|
|
|
|
|
|||||||||||||||||||||||
| Total Other Liabilities |
303 | 12 | 0 | 1 | 316 | 98 | 414 | |||||||||||||||||||||
|
|
|
|
|
|
|
|||||||||||||||||||||||
| Total Payables to Controlled Affiliates and other liabilities |
$ | 1,778 | $ | 393 | $ | 24 | $ | 40 | $ | 2,234 | $ | 703 | $ | 2,937 | ||||||||||||||
|
|
|
|
|
|
|
|||||||||||||||||||||||
Refer to Note 6 - Receivables from Debtors and Debtor-Controlled Entities and Other Assets for footnote 1 through 3 explanations.
| (4) | Represents a loan from LBHI2 to LBHI of £82.6 million, collateralized by LBHI’s claims against LBIE, the proceeds of which were received in September 2016. |
Page 24
Quarterly Financial Report as of October 6, 2016 (Unaudited)
Note 10 – Taxes Payable
Page 25
Quarterly Financial Report as of October 6, 2016 (Unaudited)
Note 11 – Liabilities Subject to Compromise
The table below presents the Company’s estimates of claim values as of October 6, 2016 by claim category, and the changes in estimates since the previously filed Quarterly Financial Report as of June 30, 2016:
| ($ billions) | Period Ending October 6, 2016 | October 6, 2016 Claims Balance | ||||||||||||||||||||||||||||||||||
| Claim Category |
June 30, 2016 Claims Balance |
Allowed Claims | Change in Estimated Active Claims |
October 6, 2016 Claims Balance |
LBHI | LCPI | LBSF | Other Debtors |
||||||||||||||||||||||||||||
| Direct Claims: |
||||||||||||||||||||||||||||||||||||
| Debt |
$ | 99.2 | $ | — | $ | — | $ | 99.2 | $ | 98.5 | $ | — | $ | — | $ | 0.7 | ||||||||||||||||||||
| Derivatives |
24.1 | 0.1 | (0.2 | ) | 24.1 | 0.0 | 0.0 | 21.6 | 2.4 | |||||||||||||||||||||||||||
| Other |
13.6 | 0.0 | (0.2 | ) | 13.4 | 6.3 | 6.7 | 0.1 | 0.4 | |||||||||||||||||||||||||||
|
|
|
|
|
|
|
|
|
|
|
|
|
|
|
|
|
|||||||||||||||||||||
| Total Direct Claims |
136.9 | 0.2 | (0.3 | ) | 136.8 | 104.8 | 6.8 | 21.7 | 3.5 | |||||||||||||||||||||||||||
|
|
|
|
|
|
|
|
|
|
|
|
|
|
|
|
|
|||||||||||||||||||||
| Affiliate Claims Direct |
108.5 | 0.0 | (0.2 | ) | 108.3 | 58.8 | 23.1 | 21.0 | 5.4 | |||||||||||||||||||||||||||
| Affiliate Guarantee Claims |
12.7 | — | 0.0 | 12.7 | 12.7 | — | — | — | ||||||||||||||||||||||||||||
| Third Party Guarantee Claims (1) |
69.2 | (0.6 | ) | (0.1 | ) | 68.5 | 68.5 | — | — | — | ||||||||||||||||||||||||||
|
|
|
|
|
|
|
|
|
|
|
|
|
|
|
|
|
|||||||||||||||||||||
| Total Liabilities Subject to Compromise |
327.3 | (0.3 | ) | (0.6 | ) | 326.3 | 244.9 | 29.9 | 42.7 | 8.9 | ||||||||||||||||||||||||||
|
|
|
|
|
|
|
|
|
|
|
|
|
|
|
|
|
|||||||||||||||||||||
| Taxes Payable |
0.2 | — | (0.1 | ) | 0.1 | 0.1 | 0.0 | — | 0.0 | |||||||||||||||||||||||||||
| Secured Claims Payable to Third parties |
2.0 | — | (0.0 | ) | 2.0 | 2.0 | — | — | — | |||||||||||||||||||||||||||
|
|
|
|
|
|
|
|
|
|
|
|
|
|
|
|
|
|||||||||||||||||||||
| Total Claims |
$ | 329.5 | $ | (0.3 | ) | $ | (0.7 | ) | $ | 328.5 | $ | 247.0 | $ | 29.9 | $ | 42.7 | $ | 8.9 | ||||||||||||||||||
|
|
|
|
|
|
|
|
|
|
|
|
|
|
|
|
|
|||||||||||||||||||||
| Allowed Claims |
320.7 | (0.3 | ) | — | 320.3 | 240.5 | 29.9 | 41.6 | 8.3 | |||||||||||||||||||||||||||
| Estimated Unresolved Claims to be Allowed |
8.8 | — | (0.7 | ) | 8.1 | 6.5 | 0.0 | 1.1 | 0.6 | |||||||||||||||||||||||||||
|
|
|
|
|
|
|
|
|
|
|
|
|
|
|
|
|
|||||||||||||||||||||
| Total Claims |
$ | 329.5 | $ | (0.3 | ) | $ | (0.7 | ) | $ | 328.5 | $ | 247.0 | $ | 29.9 | $ | 42.7 | $ | 8.9 | ||||||||||||||||||
|
|
|
|
|
|
|
|
|
|
|
|
|
|
|
|
|
|||||||||||||||||||||
| Less : Claims Distributions and other reductions (2) (3) |
|
(137.8 | ) | (88.4 | ) | (24.0 | ) | (17.9 | ) | (7.5 | ) | |||||||||||||||||||||||||
| Post Petition Interest paid (3) |
(0.2 | ) | — | — | — | (0.2 | ) | |||||||||||||||||||||||||||||
|
|
|
|
|
|
|
|
|
|
|
|||||||||||||||||||||||||||
| Net Claim Liability at October 6, 2016 |
$ | 190.4 | $ | 158.6 | $ | 5.8 | $ | 24.8 | $ | 1.2 | ||||||||||||||||||||||||||
|
|
|
|
|
|
|
|
|
|
|
|||||||||||||||||||||||||||
|
|
|
|||||||||||||||||||||||||||||||||||
All values that are exactly zero are shown as “-”. Values between zero and $0.5 million appear as “0”. Totals may not foot due to rounding.
| (1) | Reduction in Third Party Guarantee Claims primarily related to settlement agreements with certain creditors. As a result of the settlement agreements, claims previously allowed at approximately $770 million were expunged during the period ending October 6, 2016. |
| (2) | Claim Distributions and other reductions include (i) distributions on allowed claims, (ii) reductions of the liabilities related to certain satisfied claims, (iii) the assignment of claims to their respective parents, and (iv) certain netting agreements between Debtors and Non-Controlled Affiliates. |
Page 26
Quarterly Financial Report as of October 6, 2016 (Unaudited)
Note 11 – Liabilities Subject to Compromise (continued)
| (3) | Claims Distributions and other reductions and Post-Petition Interest paid include: |
| ($ in billions) | Total Debtors |
LBHI | LCPI | LBSF | Other Debtors |
|||||||||||||||
|
|
|
|||||||||||||||||||
| Claims Distributions and Post Petition Interest paid |
$ | 113.6 | $ | 74.2 | $ | 18.8 | $ | 14.0 | $ | 6.6 | ||||||||||
| Other Reductions |
||||||||||||||||||||
| Intercompany Funding Adjustments |
7.8 | — | 4.1 | 2.9 | 0.8 | |||||||||||||||
| Plan Adjustments |
(0.6 | ) | (2.7 | ) | 1.0 | 0.8 | 0.3 | |||||||||||||
| Assignment of Claims (a) |
5.6 | 5.5 | 0.1 | — | — | |||||||||||||||
| Third Party Guarantees Satisfied (b) |
10.3 | 10.3 | — | — | — | |||||||||||||||
| Freddie Mac Settlement |
1.1 | 1.1 | — | — | — | |||||||||||||||
| Convenience Claims and other |
0.4 | 0.1 | — | 0.1 | 0.2 | |||||||||||||||
|
|
|
|
|
|
|
|
|
|
|
|||||||||||
| Total Claims Distributions and other reductions and Post Petition Interest paid |
$ | 138.1 | $ | 88.4 | $ | 24.0 | $ | 17.9 | $ | 7.8 | ||||||||||
|
|
|
|
|
|
|
|
|
|
|
|||||||||||
| (a) | Claims assigned by Non-Controlled Affiliates (primarily LBSN of $3.2 billion and LB UK Financing Limited of $2.1 billion), net of distributions, to LBHI in connection with settlement agreements with Non-Controlled Affiliates. |
| (b) | Allowed Guarantee claims (primarily Bankhaus $7.4 billion, LBCS $1.5 billion, LBF $0.4 billion, LOTC $0.2 billion and LBCC $0.2 billion), net of distributions, deemed satisfied as a result of distributions to creditors from the combination of the primary obligor and LBHI as the guarantor. |
Page 27
Quarterly Financial Report as of October 6, 2016 (Unaudited)
Note 11 – Liabilities Subject to Compromise (continued)
Page 28
Quarterly Financial Report as of October 6, 2016 (Unaudited)
Note 12 – Legal Proceedings
The Company is involved in a number of judicial, regulatory and mediation proceedings concerning matters arising in connection with the bankruptcy proceedings and various other matters. The Company is unable at this time to determine the financial impact of such proceedings and the impact that any potential recoveries or liabilities may have upon the Balance Sheets. As more information becomes available, the Company may record revisions, which may be material, in future Balance Sheets.
Affirmative litigations:
| Counterparty | Debtor(s) | Commenced | Court | Court Reference | Most Recent Disclosure | |||||
| JP Morgan Chase Bank N.A. (“Deficiency Objection”) |
LBHI | May 2010 | Bankruptcy Court | 08-13555 (SCC) | (a) | |||||
| U.S. Department of Justice / Internal Revenue Service (“Stock Loan”) |
LBHI | July 2015 | Bankruptcy Court | 15-2152 (SCC) | (b) | |||||
| Merrill Lynch Capital Services | LBSF | June 2014 | Bankruptcy Court | 14-020030 (SCC) | (c) | |||||
| Republic of Italy | LBDP | September 2009 | Civil Court of Rome | Not applicable | (d) | |||||
| Mortgage Sellers | LBHI | Various | Various | Various | (e) | |||||
| Federal Home Loan Bank of Cincinnati (“FHLB Cin”) |
LBSF | April 2013 | Bankruptcy Court | 13-01330 (SCC) | (f) | |||||
| Bank of America National Association et al. (“SPV Avoidance Actions”) |
LBSF | September 2010 | Bankruptcy Court | 10-03547 (SCC) | March 31, 2016 Balance Sheets - Docket No. 53409 | |||||
| Federal Home Loan Bank of New York | LBSF | May 2015 | Bankruptcy Court | 15-01110 (SCC) | June 30, 2015 Balance Sheets - Docket No. 50983 | |||||
| Citibank N.A. (“Citigroup litigation”) |
LBHI | June 2014 | Bankruptcy Court | 12-010044 (SCC) | June 30, 2014 Balance Sheets - Docket No. 46422 | |||||
| Credit Suisse Group AG | LBHI, LBSF LBCS, LBCC |
November 2013 | Bankruptcy Court | 13-01676 (SCC) | September 30, 2013 Balance Sheets - Docket No. 42236 | |||||
| Ballyrock ABS CDO 2007-1 Limited Wells Fargo Bank N.A. (“Ballyrock litigation”) |
LBSF | February 2009 | Bankruptcy Court | 09-01032 (SCC) | March 31, 2012 Balance Sheets - Docket No. 29731 | |||||
|
Other litigations:
|
||||||||||
| Counterparty | Debtor(s) | Commenced | Court | Court Reference | Most Recent Disclosure | |||||
| Lehman Brothers International (Europe) (in administration) (“LBIE Waterfall Applications”) |
LBHI | Not applicable | Not applicable | Not applicable | (g) | |||||
| RMBS Trustee | LBHI SASCO |
September 2009 | Bankruptcy Court | 08-13555 (SCC) | March 31, 2016 Balance Sheets - Docket No. 53409 | |||||
Page 29
Quarterly Financial Report as of October 6, 2016 (Unaudited)
Note 12 – Legal Proceedings (continued)
Page 30
Quarterly Financial Report as of October 6, 2016 (Unaudited)
Note 12 – Legal Proceedings (continued)
Page 31
Quarterly Financial Report as of October 6, 2016 (Unaudited)
Page 32
Quarterly Financial Report as of October 6, 2016 (Unaudited)
III. Balance Sheets
LEHMAN BROTHERS HOLDINGS INC. and Other Debtors and Debtor-Controlled Entities
Balance Sheets As of October 6, 2016
(Unaudited)
| ($ in millions) | Lehman Brothers Holdings Inc. 08-13555 |
Lehman Brothers Special Financing Inc. 08-13888 |
Lehman Brothers Commodity Services Inc. 08-13885 |
Lehman Brothers Commercial Corporation 08-13901 |
Lehman Brothers OTC Derivatives Inc. 08-13893 |
Lehman Brothers Financial Products Inc. 08-13902 |
Lehman Brothers Derivative Products Inc. 08-13899 |
Lehman Inc. |
Luxembourg Residential Properties Loan Finance S.a.r.l. 09-10108 |
Other Debtors (2) |
Total Debtor Entities (1) |
Total Debtor- Controlled Entities (3) |
Total Company |
|||||||||||||||||||||||||||||||||||||||
| Assets |
||||||||||||||||||||||||||||||||||||||||||||||||||||
| Cash and short-term investments |
$ | 109 | $ | 17 | $ | 0 | $ | 3 | $ | 4 | $ | 87 | $ | 169 | $ | 7 | $ | — | $ | 11 | $ | 407 | $ | 244 | $ | 651 | ||||||||||||||||||||||||||
| Cash and short-term investments pledged or restricted |
3,424 | 871 | 101 | 60 | 0 | 0 | 0 | 2 | — | 17 | 4,476 | 29 | 4,505 | |||||||||||||||||||||||||||||||||||||||
| Financial instruments and other inventory positions: |
||||||||||||||||||||||||||||||||||||||||||||||||||||
| Commercial Real Estate |
34 | — | — | — | — | — | — | 108 | — | 1 | 142 | 71 | 214 | |||||||||||||||||||||||||||||||||||||||
| Loans and Residential Real Estate |
56 | — | — | — | — | — | — | 33 | — | — | 89 | 31 | 121 | |||||||||||||||||||||||||||||||||||||||
| Principal investments |
0 | — | — | — | — | — | — | 3 | — | — | 3 | 961 | 964 | |||||||||||||||||||||||||||||||||||||||
| Derivative Receivables and Related Assets |
— | 133 | — | — | 0 | — | — | — | — | — | 133 | 1 | 133 | |||||||||||||||||||||||||||||||||||||||
|
|
|
|
|
|
|
|
|
|
|
|
|
|
|
|
|
|
|
|
|
|
|
|
|
|
|
|||||||||||||||||||||||||||
| Total Financial instruments and other inventory positions |
90 | 133 | — | — | 0 | — | — | 144 | — | 1 | 367 | 1,064 | 1,432 | |||||||||||||||||||||||||||||||||||||||
| Receivables from Debtors and Debtor-Controlled Entities and other assets |
600 | 363 | 35 | 262 | 547 | 153 | — | 473 | 0 | 20 | 2,452 | 545 | 2,997 | |||||||||||||||||||||||||||||||||||||||
| Investments in Affiliates |
(26,378 | ) | 266 | — | — | — | — | — | 788 | — | (402 | ) | (25,726 | ) | (21,864 | ) | (47,590 | ) | ||||||||||||||||||||||||||||||||||
| Due from Affiliates: |
||||||||||||||||||||||||||||||||||||||||||||||||||||
| Debtors and Debtor- Controlled Entities |
27,595 | 486 | 311 | 21 | 0 | 8 | 0 | 4,740 | 0 | 243 | 33,403 | 3,979 | 37,382 | |||||||||||||||||||||||||||||||||||||||
| Non-Controlled Affiliates |
18,339 | 714 | 113 | 169 | — | — | — | 136 | — | — | 19,470 | 2,101 | 21,571 | |||||||||||||||||||||||||||||||||||||||
|
|
|
|
|
|
|
|
|
|
|
|
|
|
|
|
|
|
|
|
|
|
|
|
|
|
|
|||||||||||||||||||||||||||
| Total Due from Affiliates |
45,934 | 1,200 | 424 | 190 | 0 | 8 | 0 | 4,876 | 0 | 243 | 52,874 | 6,080 | 58,953 | |||||||||||||||||||||||||||||||||||||||
|
|
|
|
|
|
|
|
|
|
|
|
|
|
|
|
|
|
|
|
|
|
|
|
|
|
|
|||||||||||||||||||||||||||
| Total Assets |
$ | 23,780 | $ | 2,849 | $ | 560 | $ | 515 | $ | 551 | $ | 248 | $ | 169 | $ | 6,291 | $ | 0 | $ | (111 | ) | $ | 34,851 | $ | (13,902 | ) | $ | 20,948 | ||||||||||||||||||||||||
|
|
|
|
|
|
|
|
|
|
|
|
|
|
|
|
|
|
|
|
|
|
|
|
|
|
|
|||||||||||||||||||||||||||
| Liabilities and Stockholders’ Equity Liabilities |
||||||||||||||||||||||||||||||||||||||||||||||||||||
| Payables to Debtors and Debtor-Controlled Entities and other liabilities |
$ | 1,778 | $ | 24 | $ | — | $ | 1 | $ | 29 | $ | — | $ | 1 | $ | 393 | $ | — | $ | 8 | $ | 2,234 | $ | 703 | $ | 2,937 | ||||||||||||||||||||||||||
| Due to Affiliates: |
||||||||||||||||||||||||||||||||||||||||||||||||||||
| Debtor-Controlled Entities |
— | — | — | — | — | — | — | 0 | — | — | 0 | 11,791 | 11,791 | |||||||||||||||||||||||||||||||||||||||
| Non-Controlled Affiliates |
— | — | — | — | — | — | — | — | — | — | — | 87 | 87 | |||||||||||||||||||||||||||||||||||||||
|
|
|
|
|
|
|
|
|
|
|
|
|
|
|
|
|
|
|
|
|
|
|
|
|
|
|
|||||||||||||||||||||||||||
| Total Due to Affiliates |
— | — | — | — | — | — | — | 0 | — | — | 0 | 11,878 | 11,878 | |||||||||||||||||||||||||||||||||||||||
| Secured Claims Payable to Third Parties |
2,008 | — | — | — | — | — | — | — | — | — | 2,008 | — | 2,008 | |||||||||||||||||||||||||||||||||||||||
| Taxes Payable |
127 | — | 1 | 0 | — | — | 0 | 10 | — | — | 138 | 2 | 140 | |||||||||||||||||||||||||||||||||||||||
| Liabilities Subject to Compromise |
156,508 | 24,781 | 293 | 326 | 19 | 0 | 1 | 5,807 | 171 | 341 | 188,247 | 0 | 188,247 | |||||||||||||||||||||||||||||||||||||||
|
|
|
|
|
|
|
|
|
|
|
|
|
|
|
|
|
|
|
|
|
|
|
|
|
|
|
|||||||||||||||||||||||||||
| Total Liabilities |
160,421 | 24,804 | 294 | 327 | 48 | 0 | 1 | 6,210 | 171 | 350 | 192,627 | 12,583 | 205,210 | |||||||||||||||||||||||||||||||||||||||
| Stockholders’ Equity |
(136,641 | ) | (21,955 | ) | 265 | 188 | 502 | 248 | 167 | 81 | (171 | ) | (460 | ) | (157,776 | ) | (26,486 | ) | (184,262 | ) | ||||||||||||||||||||||||||||||||
|
|
|
|
|
|
|
|
|
|
|
|
|
|
|
|
|
|
|
|
|
|
|
|
|
|
|
|||||||||||||||||||||||||||
| Total Liabilities and Stockholders’ Equity |
$ | 23,780 | $ | 2,849 | $ | 560 | $ | 515 | $ | 551 | $ | 248 | $ | 169 | $ | 6,291 | $ | 0 | $ | (111 | ) | $ | 34,851 | $ | (13,902 | ) | $ | 20,948 | ||||||||||||||||||||||||
|
|
|
|
|
|
|
|
|
|
|
|
|
|
|
|
|
|
|
|
|
|
|
|
|
|
|
|||||||||||||||||||||||||||
See accompanying Notes to Balance Sheets
Note: All values that are exactly zero are shown as “—”. Values between zero and $500,000 appear as “0”.
| (1) | Balances for Debtors do not reflect the impact of eliminations of intercompany balances and investments in subsidiaries. |
| (2) | Certain Other Debtor’s Balance Sheets are presented on page 34. |
| (3) | Certain Debtor-Controlled Entities’ Balance Sheets are presented on page 35. |
Page 33
Quarterly Financial Report as of October 6, 2016 (Unaudited)
LEHMAN BROTHERS HOLDINGS INC. and Other Debtors and Debtor-Controlled Entities
Balance Sheets As of October 6, 2016 (Certain Other Debtors)
(Unaudited)
| ($ in millions) | Structured Asset Securities Corporation 09-10558 |
East Dover Ltd 08-13908 |
Lehman Scottish Finance LP 08-13904 |
LB Rose Ranch 09-10560 |
BNC Mortgage 09-10137 |
PAMI Statler LLC (2) |
MERIT LLC 09-17331 |
Other Debtors (1) |
||||||||||||||||||||||||
| Assets |
||||||||||||||||||||||||||||||||
| Cash and short-term investments |
$ | 0 | $ | 0 | $ | — | $ | (0 | ) | $ | 11 | $ | — | $ | 0 | $ | 11 | |||||||||||||||
| Cash and short-term investments pledged or restricted |
12 | — | 2 | 0 | 3 | — | (0 | ) | 17 | |||||||||||||||||||||||
| Financial instruments and other inventory positions: |
||||||||||||||||||||||||||||||||
| Commercial Real Estate |
— | — | — | 1 | — | — | — | 1 | ||||||||||||||||||||||||
| Loans and Residential Real Estate |
— | — | — | — | — | — | — | — | ||||||||||||||||||||||||
| Principal investments |
— | — | — | — | — | — | — | — | ||||||||||||||||||||||||
| Derivative Receivables and Related Assets |
— | — | — | — | — | — | — | — | ||||||||||||||||||||||||
|
|
|
|
|
|
|
|
|
|
|
|
|
|
|
|
|
|||||||||||||||||
| Total Financial instruments and other inventory positions |
— | — | — | 1 | — | — | — | 1 | ||||||||||||||||||||||||
| Receivables from Debtors and Debtor-Controlled Entities and other assets |
0 | — | — | 3 | — | — | 17 | 20 | ||||||||||||||||||||||||
| Investments in Affiliates |
— | — | (402 | ) | — | — | — | — | (402 | ) | ||||||||||||||||||||||
| Due from Affiliates: |
||||||||||||||||||||||||||||||||
| Debtors and Debtor-Controlled Entities |
141 | — | 74 | — | 1 | — | 27 | 243 | ||||||||||||||||||||||||
| Non-Controlled Affiliates |
— | — | — | — | — | — | — | 0 | ||||||||||||||||||||||||
|
|
|
|
|
|
|
|
|
|
|
|
|
|
|
|
|
|||||||||||||||||
| Total Due from Affiliates |
141 | — | 74 | — | 1 | — | 27 | 243 | ||||||||||||||||||||||||
|
|
|
|
|
|
|
|
|
|
|
|
|
|
|
|
|
|||||||||||||||||
| Total Assets |
$ | 153 | $ | 0 | $ | (327 | ) | $ | 3 | $ | 15 | $ | — | $ | 44 | $ | (111 | ) | ||||||||||||||
|
|
|
|
|
|
|
|
|
|
|
|
|
|
|
|
|
|||||||||||||||||
| Liabilities and Stockholders’ Equity |
||||||||||||||||||||||||||||||||
| Liabilities |
||||||||||||||||||||||||||||||||
| Payables to Debtors and Debtor-Controlled Entities and other liabilities |
$ | 3 | $ | 0 | $ | 2 | $ | 0 | $ | 3 | $ | — | $ | — | $ | 8 | ||||||||||||||||
| Due to Affiliates: |
||||||||||||||||||||||||||||||||
| Debtor-Controlled Entities |
— | — | — | — | — | — | — | — | ||||||||||||||||||||||||
| Non-Controlled Affiliates |
— | — | — | — | — | — | — | — | ||||||||||||||||||||||||
|
|
|
|
|
|
|
|
|
|
|
|
|
|
|
|
|
|||||||||||||||||
| Total Due to Affiliates |
— | — | — | — | — | — | — | — | ||||||||||||||||||||||||
| Secured Claims Payable to Third Parties |
— | — | — | — | — | — | — | — | ||||||||||||||||||||||||
| Taxes Payable |
— | — | — | — | — | — | — | — | ||||||||||||||||||||||||
| Liabilities Subject to Compromise |
121 | — | — | 2 | 4 | — | 215 | 341 | ||||||||||||||||||||||||
|
|
|
|
|
|
|
|
|
|
|
|
|
|
|
|
|
|||||||||||||||||
| Total Liabilities |
123 | 0 | 2 | 2 | 7 | — | 215 | 350 | ||||||||||||||||||||||||
| Stockholders’ Equity
|
|
30
|
|
|
0
|
|
|
(329
|
)
|
|
1
|
|
|
8
|
|
|
—
|
|
|
(171
|
)
|
|
(460
|
)
| ||||||||
|
|
|
|
|
|
|
|
|
|
|
|
|
|
|
|
|
|||||||||||||||||
| Total Liabilities and Stockholders’ Equity |
$ | 153 | $ | 0 | $ | (327 | ) | $ | 3 | $ | 15 | $ | — | $ | 44 | $ | (111 | ) | ||||||||||||||
|
|
|
|
|
|
|
|
|
|
|
|
|
|
|
|
|
|||||||||||||||||
| See accompanying Notes to Balance Sheets |
||||||||||||||||||||||||||||||||
Note: All values that are exactly zero are shown as “—”. Values between zero and $500,000 appear as “0”.
(1) Balances for Debtors do not reflect the impact of eliminations of intercompany balances and investments in subsidiaries.
Page 34
Quarterly Financial Report as of October 6, 2016 (Unaudited)
LEHMAN BROTHERS HOLDINGS INC. and Other Debtors and Debtor-Controlled Entities
Balance Sheets As of October 6, 2016 (Debtor-Controlled Entities)
(Unaudited)
| ($ in millions) | Lehman ALI Inc. (2) |
Property Asset Management Inc. (3) |
LB I Group Inc. (3) |
Lehman Brothers Bancorp Inc. (3) |
PAMI Holdings LLC |
314 Common- wealth Ave Inc. (3) |
LB U.K. Holdings (Delaware) Inc. |
PAMI ALI LLC |
Lux Finance Sarl |
Other Debtor- Controlled Entities |
Debtor - Controlled Group Elims (1) |
Total Debtor- Controlled Entities |
||||||||||||||||||||||||||||||||||||
| Assets |
||||||||||||||||||||||||||||||||||||||||||||||||
| Cash and short-term investments |
$ | 14 | $ | 2 | $ | 12 | $ | 82 | $ | 23 | $ | 0 | $ | 0 | $ | 1 | $ | 1 | $ | 109 | $ | — | $ | 244 | ||||||||||||||||||||||||
| Cash and short-term investments pledged or restricted |
0 | 3 | 4 | 2 | — | — | — | 0 | — | 20 | — | 29 | ||||||||||||||||||||||||||||||||||||
| Financial instruments and other inventory positions: |
||||||||||||||||||||||||||||||||||||||||||||||||
| Commercial Real Estate |
(8 | ) | 23 | — | — | 44 | (0 | ) | (0 | ) | 11 | — | 2 | — | 71 | |||||||||||||||||||||||||||||||||
| Loans and Residential Real Estate |
20 | 0 | 1 | 0 | — | — | — | — | — | 11 | — | 31 | ||||||||||||||||||||||||||||||||||||
| Principal investments |
0 | — | 764 | — | — | — | (0 | ) | 0 | — | 197 | — | 961 | |||||||||||||||||||||||||||||||||||
| Derivative Receivables and Related Assets |
— | — | — | — | — | — | — | — | — | 1 | — | 1 | ||||||||||||||||||||||||||||||||||||
|
|
|
|
|
|
|
|
|
|
|
|
|
|
|
|
|
|
|
|
|
|
|
|
|
|||||||||||||||||||||||||
| Total Financial instruments and other inventory positions |
12 | 23 | 764 | 0 | 44 | (0 | ) | (0 | ) | 12 | — | 210 | — | 1,064 | ||||||||||||||||||||||||||||||||||
| Receivables from Debtors and Debtor-Controlled Entities and other assets |
248 | 0 | 25 | 69 | 0 | 1 | 356 | 0 | — | 200 | (355 | ) | 545 | |||||||||||||||||||||||||||||||||||
| Investments in Affiliates |
(28,981 | ) | 1 | 0 | 8 | — | (86 | ) | 46 | (375 | ) | — | (217 | ) | 7,740 | (21,864 | ) | |||||||||||||||||||||||||||||||
| Due from Affiliates: |
||||||||||||||||||||||||||||||||||||||||||||||||
| Debtors and Debtor-Controlled Entities |
3,171 | — | 539 | — | — | 174 | 75 | 629 | — | 542 | (1,150 | ) | 3,979 | |||||||||||||||||||||||||||||||||||
| Non-Controlled Affiliates |
0 | — | 1 | — | — | 6 | 323 | 25 | 749 | 996 | — | 2,101 | ||||||||||||||||||||||||||||||||||||
|
|
|
|
|
|
|
|
|
|
|
|
|
|
|
|
|
|
|
|
|
|
|
|
|
|||||||||||||||||||||||||
| Total Due from Affiliates |
3,171 | — | 539 | — | — | 180 | 398 | 654 | 749 | 1,538 | (1,150 | ) | 6,080 | |||||||||||||||||||||||||||||||||||
|
|
|
|
|
|
|
|
|
|
|
|
|
|
|
|
|
|
|
|
|
|
|
|
|
|||||||||||||||||||||||||
| Total Assets |
$ | (25,536 | ) | $ | 29 | $ | 1,344 | $ | 161 | $ | 66 | $ | 95 | $ | 801 | $ | 293 | $ | 750 | $ | 1,861 | $ | 6,235 | $ | (13,902 | ) | ||||||||||||||||||||||
|
|
|
|
|
|
|
|
|
|
|
|
|
|
|
|
|
|
|
|
|
|
|
|
|
|||||||||||||||||||||||||
| Liabilities and Stockholders’ Equity Liabilities |
||||||||||||||||||||||||||||||||||||||||||||||||
| Payables to Debtors and Debtor-Controlled Entities and other liabilities |
$ | 3 | $ | 2 | $ | 712 | $ | 63 | $ | 7 | $ | 0 | $ | 1 | $ | 52 | $ | — | $ | 221 | $ | (357 | ) | $ | 703 | |||||||||||||||||||||||
| Due to Affiliates: |
||||||||||||||||||||||||||||||||||||||||||||||||
| Debtor-Controlled Entities |
2,717 | — | 2,803 | 71 | — | 839 | 200 | 3,093 | 1,152 | 2,066 | (1,150 | ) | 11,791 | |||||||||||||||||||||||||||||||||||
| Non-Controlled Affiliates |
— | — | 1 | — | — | — | 56 | 0 | — | 30 | — | 87 | ||||||||||||||||||||||||||||||||||||
|
|
|
|
|
|
|
|
|
|
|
|
|
|
|
|
|
|
|
|
|
|
|
|
|
|||||||||||||||||||||||||
| Total Due to Affiliates |
2,717 | — | 2,805 | 71 | — | 839 | 256 | 3,093 | 1,152 | 2,095 | (1,150 | ) | 11,878 | |||||||||||||||||||||||||||||||||||
| Secured Claims Payable to Third Parties |
— | — | — | — | — | — | — | — | — | — | — | — | ||||||||||||||||||||||||||||||||||||
| Taxes Payable |
— | — | 2 | — | — | — | — | — | — | — | — | 2 | ||||||||||||||||||||||||||||||||||||
| Liabilities Subject to Compromise |
— | — | — | — | — | — | — | — | — | 0 | — | 0 | ||||||||||||||||||||||||||||||||||||
|
|
|
|
|
|
|
|
|
|
|
|
|
|
|
|
|
|
|
|
|
|
|
|
|
|||||||||||||||||||||||||
| Total Liabilities |
2,720 | 2 | 3,519 | 134 | 7 | 839 | 257 | 3,145 | 1,152 | 2,316 | (1,507 | ) | 12,583 | |||||||||||||||||||||||||||||||||||
| Stockholders’ Equity |
(28,256 | ) | 26 | (2,175 | ) | 27 | 59 | (744 | ) | 544 | (2,852 | ) | (402 | ) | (455 | ) | 7,742 | (26,486 | ) | |||||||||||||||||||||||||||||
|
|
|
|
|
|
|
|
|
|
|
|
|
|
|
|
|
|
|
|
|
|
|
|
|
|||||||||||||||||||||||||
| Total Liabilities and Stockholders’ Equity |
$ | (25,536 | ) | $ | 29 | $ | 1,344 | $ | 161 | $ | 66 | $ | 95 | $ | 801 | $ | 293 | $ | 750 | $ | 1,861 | $ | 6,235 | $ | (13,902 | ) | ||||||||||||||||||||||
|
|
|
|
|
|
|
|
|
|
|
|
|
|
|
|
|
|
|
|
|
|
|
|
|
|||||||||||||||||||||||||
| See accompanying Notes to Balance Sheets |
||||||||||||||||||||||||||||||||||||||||||||||||
| Note: | All values that are exactly zero are shown as “—”. Values between zero and $500,000 appear as “0”. |
| (1) | Balances reflect the impact of eliminations of (i) intercompany balances only between Debtor-Controlled Entities and (ii) investments in subsidiaries only between Debtor-Controlled Entities. |
| (2) | Lehman Ali Inc is reflected on a consolidated basis: |
- excluding (i) separately reported wholly-owned subsidiaries that are Debtor entities (e.g. LCPI, LBSF and East Dover Ltd) and (ii) separately reported Debtor-Controlled Entities and their direct subsidiaries (e.g. 314 Commonwealth Ave Inc., Property Asset Management Inc. and Pami ALI LLC), and
- including wholly owned subsidiaries of LCPI (e.g. LCPI Properties Inc.).
| (3) | Entities are reflected on a consolidated basis, e.g. Property Asset Management Inc. includes its wholly owned subsidiary, Orbit RE LLC. |
Page 35
Quarterly Financial Report as of October 6, 2016 (Unaudited)
IV. Accompanying Schedules
Commercial Real Estate – by Product Type (1)
| $ in millions |
Lehman Brothers Holdings Inc. |
Lehman Commercial Paper Inc. |
LB Rose Ranch LLC |
Total Debtor Entities |
Property Asset Management Inc. |
PAMI Holdings LLC |
Other Debtor- Controlled Entities |
Total LBHI Controlled Entities |
Cost and Unpaid Principal Balances (2) |
|||||||||||||||||||||||||||||||
| Commercial Real Estate |
||||||||||||||||||||||||||||||||||||||||
| North America |
||||||||||||||||||||||||||||||||||||||||
| Whole loans |
$ | — | $ | 4 | $ | — | $ | 4 | $ | — | $ | — | $ | — | $ | 4 | $ | 4 | ||||||||||||||||||||||
| Equity |
— | — | — | — | 17 | 36 | 0 | 53 | 200 | |||||||||||||||||||||||||||||||
| Real Estate Owned and Other (3) |
34 | (6 | ) | 1 | 28 | 5 | 8 | (5 | ) | 37 | 306 | |||||||||||||||||||||||||||||
|
|
|
|
|
|
|
|
|
|
|
|
|
|
|
|
|
|
|
|||||||||||||||||||||||
| Subtotal |
34 | (2 | ) | 1 | 33 | 23 | 44 | (5 | ) | 94 | 511 | |||||||||||||||||||||||||||||
| Europe |
||||||||||||||||||||||||||||||||||||||||
| Whole loans |
— | 62 | — | 62 | — | — | — | 62 | 168 | |||||||||||||||||||||||||||||||
| Equity |
— | 48 | — | 48 | — | — | 10 | 58 | 176 | |||||||||||||||||||||||||||||||
| Other |
— | — | — | — | — | — | 0 | 0 | 0 | |||||||||||||||||||||||||||||||
|
|
|
|
|
|
|
|
|
|
|
|
|
|
|
|
|
|
|
|||||||||||||||||||||||
| Subtotal |
— | 110 | — | 110 | — | — | 10 | 120 | 345 | |||||||||||||||||||||||||||||||
|
|
|
|
|
|
|
|
|
|
|
|
|
|
|
|
|
|
|
|||||||||||||||||||||||
| Total Commercial Real Estate |
$ | 34 | $ | 108 | $ | 1 | $ | 143 | $ | 23 | $ | 44 | $ | 5 | $ | 213 | $ | 856 | ||||||||||||||||||||||
|
|
|
|
|
|
|
|
|
|
|
|
|
|
|
|
|
|
|
|||||||||||||||||||||||
|
|
|
|
|
|
|
|||||||||||||||||||||||||||||||||||
Notes:
| (1) | Refer to the accompanying Notes to the Balance Sheets for further discussion on valuation and additional disclosures. |
| (2) | Cost and Unpaid Principal Balances primarily include: (i) for whole loans, the remaining outstanding principal balance; (ii) for equity, the total acquisition amount net of distributions deemed return of capital; (iii) for REO, the cost/unpaid principal balance as determined in (i) or (ii) as of the date of ownership of the property plus or minus principal balance changes subsequent to ownership. |
| (3) | Includes reserves of $19.5 million and $8.5 million at LCPI and Jupiter Enterprises LP, respectively, for future litigation costs. |
Page 36
Quarterly Financial Report as of October 6, 2016 (Unaudited)
Commercial Real Estate – By Property Type and Region (1)
| $ in millions |
North America |
Europe | Total | Cost and Unpaid Principal Balances (2) |
||||||||||||
| Commercial Real Estate |
||||||||||||||||
| Senior Whole Loans |
||||||||||||||||
| Land/Other |
$ | 4 | $ | — | $ | 4 | $ | 4 | ||||||||
|
|
|
|
|
|
|
|
|
|||||||||
| Total Senior Whole Loans by Type |
4 | — | 4 | 4 | ||||||||||||
| B-Note/Mezz Whole Loans |
||||||||||||||||
| Office/Industrial |
— | 62 | 62 | 168 | ||||||||||||
|
|
|
|
|
|
|
|
|
|||||||||
| Total B-Notes/Mezz Whole Loans by Type |
— | 62 | 62 | 168 | ||||||||||||
| Equity |
||||||||||||||||
| Hotel |
— | 10 | 10 | 72 | ||||||||||||
| Mixed-use |
— | 48 | 48 | 105 | ||||||||||||
| Condominium |
36 | — | 36 | 173 | ||||||||||||
| Land/Other |
17 | — | 17 | 27 | ||||||||||||
|
|
|
|
|
|
|
|
|
|||||||||
| Total Equity by Type |
53 | 58 | 111 | 377 | ||||||||||||
| Real Estate Owned |
||||||||||||||||
| Land |
21 | — | 21 | 305 | ||||||||||||
| Other |
15 | 0 | 16 | 2 | ||||||||||||
|
|
|
|
|
|
|
|
|
|||||||||
| Total Real Estate Owned by Type |
37 | 0 | 37 | 307 | ||||||||||||
|
|
|
|
|
|
|
|
|
|||||||||
| Total Commercial Real Estate |
$ | 94 | $ | 120 | $ | 213 | $ | 856 | ||||||||
|
|
|
|
|
|
|
|
|
|||||||||
Notes:
| (1) | Refer to the accompanying Notes to the Balance Sheets for further discussion on valuation and additional disclosures. |
| (2) | Cost and Unpaid Principal Balances primarily include: (i) for whole loans, the remaining outstanding principal balance; (ii) for equity, the total acquisition amount net of distributions deemed return of capital; (iii) for REO, the cost/unpaid principal balance as determined in (i) or (ii) as of the date of ownership of the property plus or minus principal balance changes subsequent to ownership. |
Page 37
Quarterly Financial Report as of October 6, 2016 (Unaudited)
Loans and Residential Real Estate (1)
| $ in millions | Debtor Entities | |||||||||||||||||
| Lehman Brothers Holdings Inc. |
Lehman Commercial Paper Inc. |
Debtor - Controlled Entities |
Total LBHI- Controlled Entities |
|||||||||||||||
| Notional | ||||||||||||||||||
| Loans (2) |
5 | 197 | 24 | 226 | ||||||||||||||
| Residential Real Estate (3) |
183 | 0 | 38 | 221 | ||||||||||||||
|
|
|
|
|
|
|
|
|
|||||||||||
| Total Loans and Residential Real Estate |
$ | 188 | $ | 197 | $ | 62 | $ | 447 | ||||||||||
|
|
|
|
|
|
|
|
|
|||||||||||
| Recovery Value | ||||||||||||||||||
| Loans (4) |
0 | 32 | 20 | 53 | ||||||||||||||
| Equity positions—Loans |
26 | 1 | 1 | 28 | ||||||||||||||
| Residential Real Estate (5) |
30 | 0 | 11 | 40 | ||||||||||||||
|
|
|
|
|
|
|
|
|
|||||||||||
| Total Loans and Residential Real Estate |
$ | 56 | $ | 33 | $ | 31 | $ | 121 | ||||||||||
|
|
|
|
|
|
|
|
|
|||||||||||
Notes:
| (1) | This schedule reflects loans and residential real estate assets that are included on the Balance Sheets. Refer to the accompanying Notes to the Balance Sheets for further discussion on valuation and additional disclosures. |
| (2) | Represents the remaining outstanding principal balance. |
| (3) | Cost information for residential mortgage backed securities (“RMBS”) (Recovery Value $40 million / Cost $221 million) represents the initial Class Principal amount. RMBS consists of Excess Spread, Residual, Interest-Only and Subordinated tranches. Cost information is not included for legal claims, mortgage servicing rights and RMBS with zero recovery value. |
| (4) | Includes approximately $32 million in LCPI related to defaulted securities with past maturity dates. |
| (5) | Includes approximately $13 million of RMBS assets encumbered by LBHI for the benefit of LPTSI, a Debtor-Controlled Entity. |
Page 38
Quarterly Financial Report as of October 6, 2016 (Unaudited)
Private Equity / Principal Investments – by Legal Entity and Product Type
| $ in millions |
Total (1) | Assets held for the benefit of another legal entity (3) |
Total per Balance Sheets |
|||||||||
| By Legal Entity |
||||||||||||
| Debtors: |
||||||||||||
| Lehman Brothers Holdings Inc. |
$ | 0 | $ | — | $ | 0 | ||||||
| Lehman Commercial Paper Inc. |
465 | (462 | ) | 3 | ||||||||
|
|
|
|
|
|
|
|||||||
| Total Debtors |
465 | (462 | ) | 3 | ||||||||
| Debtor-Controlled: |
||||||||||||
| LB I Group Inc. (2) |
55 | 708 | 764 | |||||||||
| Other Debtor-Controlled |
445 | (247 | ) | 198 | ||||||||
|
|
|
|
|
|
|
|||||||
| Total Debtor-Controlled |
500 | 462 | 961 | |||||||||
|
|
|
|
|
|
|
|||||||
| Total |
$ | 964 | $ | — | $ | 964 | ||||||
|
|
|
|
|
|
|
|||||||
| By Product Type |
||||||||||||
| Private Equity / Diversified Funds |
$ | 778 | ||||||||||
| Real Estate Funds |
180 | |||||||||||
| Other |
7 | |||||||||||
|
|
|
|||||||||||
| Total |
$ | 964 | ||||||||||
|
|
|
|||||||||||
|
|
|
|||||||||||
| Investments at cost (4) |
$ | 983 | ||||||||||
| Unpaid Principal Balances (5) |
$ | 4 | ||||||||||
Notes:
| (1) | The amounts include the unencumbered assets held by a legal entity and the economic interests in the assets held by another legal entity. Refer to the accompanying Notes to the Balance Sheets for further discussion on valuation and additional disclosures. |
| (2) | LB I Group Inc. (read LB “one” Group Inc.) is presented on a consolidated basis. |
| (3) | “Assets held for the benefit of another legal entity” represents a reconciliation of the assets encumbered from LB I Group Inc. to LCPI and LB U.K. Holdings (Delaware) Inc. |
| (4) | Cost information primarily includes: (i) for direct equity investments and hedge funds, the total amount funded net of distributions deemed return of capital; (ii) for partnership interests with no redemptions, the original amount funded; (iii) for partnership interests with redemptions or distributions, the ratio of cost to recovery value for the underlying portfolio assets applied to the Net Asset Value for the Company’s positions; and (iv) value for assets that have been recorded at de minimis recovery value amounts. |
| (5) | Represents the remaining outstanding principal balance on corporate loans. |
Page 39
Quarterly Financial Report as of October 6, 2016 (Unaudited)
Derivative Assets and Liabilities (1)
| $ in millions | Lehman Brothers Holdings Inc. |
LB 745 LLC | Lehman Brothers Special Financing Inc. |
Lehman Brothers Commodity Services Inc. |
Lehman Brothers OTC Derivatives Inc. |
Lehman Brothers Commercial Corporation |
Lehman Commercial Paper Inc. |
Lehman Brothers Financial Products Inc. |
Lehman Brothers Derivative Products Inc. |
Total Debtors |
||||||||||||||||||||||||||||||
| Assets - Receivables, Net |
||||||||||||||||||||||||||||||||||||||||
| Open |
$ | — | $ | — | $ | 69 | $ | — | $ | — | $ | — | $ | — | $ | — | $ | — | $ | 69 | ||||||||||||||||||||
| Terminated / Matured |
— | — | 34 | — | — | — | — | — | — | 34 | ||||||||||||||||||||||||||||||
|
|
|
|
|
|
|
|
|
|
|
|
|
|
|
|
|
|
|
|
|
|||||||||||||||||||||
| Total |
— | — | 103 | — | — | — | — | — | — | 103 | ||||||||||||||||||||||||||||||
| Other Derivative Related Assets (2) |
— | — | 29 | — | 0 | — | — | — | — | 29 | ||||||||||||||||||||||||||||||
|
|
|
|
|
|
|
|
|
|
|
|
|
|
|
|
|
|
|
|
|
|||||||||||||||||||||
| Total Derivatives and Related Assets |
$ | — | $ | — | $ | 133 | $ | — | $ | 0 | $ | — | $ | — | $ | — | $ | — | $ | 133 | ||||||||||||||||||||
|
|
|
|
|
|
|
|
|
|
|
|
|
|
|
|
|
|
|
|
|
|||||||||||||||||||||
| # of Counterparty contracts |
||||||||||||||||||||||||||||||||||||||||
| Open |
— | — | 65 | — | — | — | — | — | — | 65 | ||||||||||||||||||||||||||||||
| Termed / Matured |
— | — | 186 | — | — | 1 | — | — | 2 | 189 | ||||||||||||||||||||||||||||||
|
|
|
|
|
|
|
|
|
|
|
|
|
|
|
|
|
|
|
|
|
|||||||||||||||||||||
| Total |
— | — | 251 | — | — | 1 | — | — | 2 | 254 | ||||||||||||||||||||||||||||||
|
|
|
|
|
|
|
|
|
|
|
|
|
|
|
|
|
|
|
|
|
|||||||||||||||||||||
| SPV Receivables (3) |
$ | — | $ | — | $ | 13 | $ | — | $ | — | $ | — | $ | — | $ | — | $ | — | $ | 13 | ||||||||||||||||||||
| Liabilities—Payables |
||||||||||||||||||||||||||||||||||||||||
| Agreed (4) |
$ | (22 | ) | $ | (2 | ) | $ | (20,318 | ) | $ | (1,347 | ) | $ | (494 | ) | $ | (387 | ) | $ | (39 | ) | $ | (57 | ) | $ | (77 | ) | $ | (22,743 | ) | ||||||||||
| Pending Resolution (5) |
— | — | (1,271 | ) | (40 | ) | (0 | ) | (26 | ) | — | — | — | (1,337 | ) | |||||||||||||||||||||||||
|
|
|
|
|
|
|
|
|
|
|
|
|
|
|
|
|
|
|
|
|
|||||||||||||||||||||
| Total |
$ | (22 | ) | $ | (2 | ) | $ | (21,589 | ) | $ | (1,387 | ) | $ | (494 | ) | $ | (413 | ) | $ | (39 | ) | $ | (57 | ) | $ | (77 | ) | $ | (24,080 | ) | ||||||||||
|
|
|
|
|
|
|
|
|
|
|
|
|
|
|
|
|
|
|
|
|
|||||||||||||||||||||
| # of Counterparty contracts |
4 | 1 | 1,710 | 185 | 92 | 135 | 1 | 10 | 39 | 2,177 | ||||||||||||||||||||||||||||||
Notes:
| (1) | Refer to the accompanying Notes to the Balance Sheets for further discussion regarding derivative amounts recorded. Derivatives liabilities are presented prior to distributions on allowed claims. |
| (2) | Amounts primarily include notes in various special purpose vehicles, deposits with various brokers for OTC hedges and equity positions in various corporations. |
| (3) | Represents the portion of derivatives receivables resulting from transactions with counterparties deemed as special purpose vehicles including receivables from entities that structurally subordinate the rights of the Debtor. |
| (4) | Agreed is defined as claims that are recorded at values agreed upon with counterparties and classified as allowed or accepted as filed. |
| (5) | Pending Resolution are recorded at expected claim amounts estimated by the Company. |
Page 40
Quarterly Financial Report as of October 6, 2016 (Unaudited)
Significant Restructurings, Settlements, Sales, Wind-down, or Liquidations
July 1, 2016 – October 6, 2016
| $ in millions |
Actual Cash Collected |
Post-Ninth Distribution Cash Flow Estimates (1) (3) |
06/30/16 Balance Sheets Value (2) (3) |
Realized Gain / (Loss) Relative to Post-Ninth Distribution Cash Flow Estimate |
Realized Gain / (Loss) Relative to 06/30/16 Balance Sheets Value |
|||||||||||||||
| Loans and Residential Real Estate |
||||||||||||||||||||
| Other Loans |
$ | 50 | $ | 2 | $ | 49 | $ | 48 | $ | 1 | ||||||||||
| Other Residential Real Estate |
20 | 10 | 10 | 10 | 10 | |||||||||||||||
|
|
|
|
|
|
|
|
|
|
|
|||||||||||
| Total Loans and Residential Real Estate |
$ | 70 | $ | 12 | $ | 59 | $ | 58 | $ | 11 | ||||||||||
|
|
|
|
|
|
|
|
|
|
|
|||||||||||
| Private Equity / Principal Investments |
||||||||||||||||||||
| Formula One |
$ | 123 | $ | 70 | $ | 70 | $ | 53 | $ | 53 | ||||||||||
| Other Direct sales |
23 | 19 | 21 | 4 | 2 | |||||||||||||||
| GP and LP Stakes in PE and Hedge Funds |
40 | 40 | 40 | 0 | 0 | |||||||||||||||
|
|
|
|
|
|
|
|
|
|
|
|||||||||||
| Total Private Equity / Principal Investments |
$ | 186 | $ | 129 | $ | 131 | $ | 57 | $ | 55 | ||||||||||
|
|
|
|
|
|
|
|
|
|
|
|||||||||||
| Derivatives |
||||||||||||||||||||
| Other sales |
$ | 33 | $ | 22 | $ | 9 | $ | 11 | $ | 23 | ||||||||||
|
|
|
|
|
|
|
|
|
|
|
|||||||||||
| Total Derivatives |
$ | 33 | $ | 22 | $ | 9 | $ | 11 | $ | 23 | ||||||||||
|
|
|
|
|
|
|
|
|
|
|
|||||||||||
| Real Estate |
||||||||||||||||||||
| Other sales |
$ | 103 | $ | 97 | $ | 99 | $ | 5 | $ | 4 | ||||||||||
|
|
|
|
|
|
|
|
|
|
|
|||||||||||
| Total Real Estate |
$ | 103 | $ | 97 | $ | 99 | $ | 5 | $ | 4 | ||||||||||
|
|
|
|
|
|
|
|
|
|
|
|||||||||||
|
|
|
|
|
|
|
|
|
|
|
|||||||||||
| Total Significant Monetizations |
$ | 391 | $ | 260 | $ | 298 | $ | 131 | $ | 93 | ||||||||||
|
|
|
|
|
|
|
|
|
|
|
|||||||||||
All values that are exactly zero are shown as “-”. Values between zero and $0.5 million appear as “0”. Totals may not foot due to rounding.
Notes:
| (1) | Represents estimated recoveries reflected in the Post Ninth Distribution Cash Flow Estimates for the asset. |
| (2) | Represents the recorded value reported on the prior period Balance Sheets (as of June 30, 2016) for the asset |
| (3) | Estimated recovery value of the Company’s interest in Formula One was calculated based on the investment’s value at the time of the sale to Liberty Media Corporation of $530 million. |
Page 41
Quarterly Financial Report as of October 6, 2016 (Unaudited)
V. Post-Eleventh Distribution Cash Flow Estimates
Table of Contents
| A. |
Basis of Presentation |
43 | ||||
| B. |
Highlights |
46 | ||||
| C. |
Summary |
47 | ||||
| D. |
Recoveries from Non-Controlled Affiliates |
48 | ||||
| E. |
Operating Expenses |
50 | ||||
| F. |
Debtors and Debtor-Controlled Entities Schedules |
52 | ||||
Page 42
Quarterly Financial Report as of October 6, 2016 (Unaudited)
A. Basis of Presentation
Page 43
Quarterly Financial Report as of October 6, 2016 (Unaudited)
Key Assumptions (continued)
Page 44
Quarterly Financial Report as of October 6, 2016 (Unaudited)
Presentation Differences
Page 45
Quarterly Financial Report as of October 6, 2016 (Unaudited)
B. Highlights
Estimated Recoveries
Total estimates of aggregate gross recoveries, before operating disbursements and payments in satisfaction of secured, priority, administrative and unsecured claims of Debtors and liabilities of Debtor-Controlled Entities, increased by $0.8 billion to $98.8 billion in the Post-D11 Cash Flow Estimates as compared to $98.0 billion in the Post-D9 CFE. Net of operating disbursements, total estimated net recoveries increased by $0.8 billion to $95.1 billion. This increase in the Company’s estimated recoveries was primarily driven by (i) an increase in the estimates for the Private Equity/Principal Investments portfolio, and (ii) the September 2016 receipt of the IRS income tax refund of $335 million, which had been excluded from prior estimates as a potential litigation recovery.
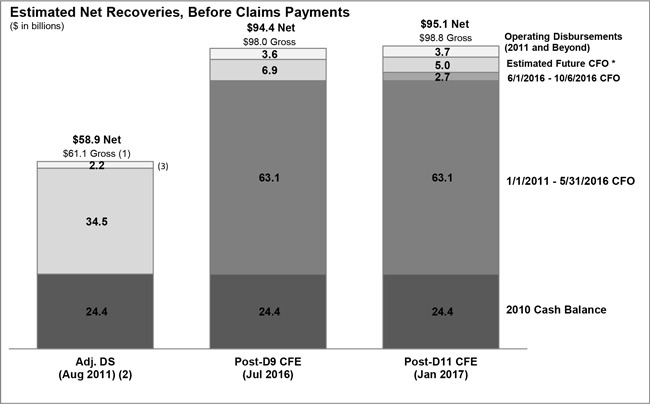
| (*) | CFO refers to Cash From Operations |
| (1) | Refer to the “Responses to Questions Received From Creditors” posted to www.lehman-docket.com on October 30, 2014, for a reconciliation of these figures. |
| (2) | Estimates included in DS Exhibit 7, adjusted for certain Presentation Adjustments (refer to the 2012+ CFE for further information). |
| (3) | The Operating Expense estimates in DS Exhibit 7 reflected the estimated costs for expected personnel and infrastructure requirements to support the workforce for each year from 2011 to 2014. These Operating Expense estimates did not include estimates for costs beyond 2014. |
Page 46
Quarterly Financial Report as of October 6, 2016 (Unaudited)
C. Summary
The Company estimates that Total Post-D11 CFE Cash From Operations will be $5.0 billion, an increase in estimates of $0.8 billion compared to estimates presented in the Post-D9 CFE. This increase is primarily driven by (i) a $284 million increase in estimated recoveries related to the Formula One investment in the Private Equity/Principal Investments portfolio, and (ii) an income tax refund of $335 million in Other related to the 1997-2010 IRS audit periods (these recoveries were excluded from prior estimates).
These increases were partially offset by a (i) $133 million reduction in estimated Recoveries from Non-Controlled Affiliates, primarily driven by fluctuations in foreign exchange rates, and (ii) $30 million increase in Operating Expenses, largely driven by increased estimates for formula-driven Incentive Fees.
Cash activities between June 1, 2016 and October 6, 2016 included (i) the collection of $1.5 billion of recoveries from Non-Controlled Affiliates, primarily driven by recoveries from Bankhaus, LBAH, and LBF, (ii) the monetization of inventory of $1.4 billion, primarily in the Private Equity/Principal Investments and Commercial Real Estate portfolios, (iii) the receipt of the income tax refund of $335 million in Other, and (iv) operating expenses of $61 million, including professional fees related to the Company’s claims mitigation and litigation activities.
Of the $1.8 billion of remaining Estimated Net Receipts shown in the Post-D11 CFE, the Company anticipates that approximately 55% will be collected by the end of 2017.
| ($ in millions) | Post-D9 Cash Flow Estimates |
Less: Cash Activity 6/1/16-10/6/16 excluding D10 |
Recovery Value Change |
Transfers, Reclassifications, Adjustments (a) |
Post-D11 Cash Flow Estimates |
|||||||||||||||
| Net Receipts |
||||||||||||||||||||
| Commercial Real Estate |
$ | 474 | $ | (224 | ) | $ | (37 | ) | $ | — | $ | 213 | ||||||||
| Loans (Corporate & Residential) |
124 | (69 | ) | 65 | — | 121 | ||||||||||||||
| Private Equity / Principal Investments |
1,014 | (336 | ) | 287 | — | 965 | ||||||||||||||
| Derivatives |
99 | (54 | ) | 89 | — | 133 | ||||||||||||||
| Other |
315 | (674 | ) | 551 | 120 | 312 | ||||||||||||||
|
|
|
|
|
|
|
|
|
|
|
|||||||||||
| Sub-Total - Net Receipts |
$ | 2,026 | $ | (1,357 | ) | $ | 954 | $ | 120 | $ | 1,744 | |||||||||
| Recoveries From Non-Controlled Affiliates |
||||||||||||||||||||
| Europe |
$ | 4,177 | $ | (1,170 | ) | $ | (200 | ) | $ | (11 | ) | $ | 2,796 | |||||||
| Asia |
1,360 | (326 | ) | 68 | (44 | ) | 1,058 | |||||||||||||
|
|
|
|
|
|
|
|
|
|
|
|||||||||||
| Sub-Total - Recoveries From Non-Controlled Affiliates |
$ | 5,537 | $ | (1,496 | ) | $ | (133 | ) | $ | (55 | ) | $ | 3,853 | |||||||
| Operating Expenses |
||||||||||||||||||||
| Professional Fees |
$ | (237 | ) | $ | 37 | $ | (3 | ) | $ | — | $ | (204 | ) | |||||||
| Compensation & Benefits |
(171 | ) | 14 | (0 | ) | 4 | (153 | ) | ||||||||||||
| Incentive Fees |
(169 | ) | 3 | (25 | ) | — | (191 | ) | ||||||||||||
| Other Administrative Expenses |
(65 | ) | 8 | (1 | ) | (4 | ) | (62 | ) | |||||||||||
|
|
|
|
|
|
|
|
|
|
|
|||||||||||
| Sub-Total - Operating Expenses |
$ | (641 | ) | $ | 61 | $ | (30 | ) | $ | — | $ | (610 | ) | |||||||
| Total Cash From Operations (CFO) |
$ | 6,921 | $ | (2,791 | ) | $ | 792 | $ | 65 | $ | 4,987 | |||||||||
|
|
|
|
|
|
|
|
|
|
|
|||||||||||
| (a) | Includes an adjustment in Other Net Receipts to offset cash received in September 2016 related to the $107 million loan from LBHI2 to LBHI, collateralized by LBHI’s claims against LBIE. LBHI has recorded a liability related to this loan in Payables to Debtors and Debtor-Controlled Entities and Other Liabilities (see Note 9 in the Notes to the Balance Sheets). |
Page 47
Quarterly Financial Report as of October 6, 2016 (Unaudited)
D. Recoveries from Non-Controlled Affiliates
The Company estimates that Post-D11 CFE Recoveries from Non-Controlled Affiliates will be $3.9 billion, which reflects a decrease in estimates of $0.1 billion compared to Total Recoveries from Non-Controlled Affiliates presented in the Post-D9 CFE. The decrease was primarily driven by US Dollar appreciation against the British Pound and Euro, partially offset by an increase in estimated recoveries from Non-Controlled Affiliates.
| ($ in millions) | Post-D9 Cash Flow Estimates |
Less: Prior Period Activity |
Estimate Changes |
Transfers, Reclassifications, Adjustments |
Post-D11 Cash Flow Estimates |
|||||||||||||||
| Recoveries from Non-Controlled Affiliates |
||||||||||||||||||||
| Europe |
$ | 4,177 | $ | (1,170 | ) | $ | (200 | ) | $ | (11 | ) | $ | 2,796 | |||||||
| Asia |
1,360 | (326 | ) | 68 | (44 | ) | 1,058 | |||||||||||||
|
|
|
|
|
|
|
|
|
|
|
|||||||||||
| Total - Recoveries from Non-Controlled Affiliates |
$ | 5,537 | $ | (1,496 | ) | $ | (133 | ) | $ | (55 | ) | $ | 3,853 | |||||||
Page 48
Quarterly Financial Report as of October 6, 2016 (Unaudited)
Recoveries from Non-Controlled Affiliates (continued)
Page 49
Quarterly Financial Report as of October 6, 2016 (Unaudited)
E. Operating Expenses
The Company estimates that Post-D11 CFE Operating Expenses will be $0.6 billion, which reflects an increase in estimates of $30 million compared to Total Operating Expenses presented in the Post-D9 CFE.
| ($ in millions) | Post-D9 Cash Flow Estimates |
Less: Prior Period Activity |
Estimate Changes |
Reclasses / Transfers |
Post-D11 Cash Flow Estimates |
|||||||||||||||
| Operating Expenses |
||||||||||||||||||||
| Professional Fees |
$ | (237 | ) | $ | 37 | $ | (3 | ) | $ | — | $ | (204 | ) | |||||||
| Compensation and Benefits |
(171 | ) | 14 | (0 | ) | 4 | (153 | ) | ||||||||||||
| Incentive Fees |
(169 | ) | 3 | (25 | ) | — | (191 | ) | ||||||||||||
| Other Administrative Expenses |
(65 | ) | 8 | (1 | ) | (4 | ) | (62 | ) | |||||||||||
|
|
|
|
|
|
|
|
|
|
|
|||||||||||
| Total - Operating Expenses |
$ | (641 | ) | $ | 61 | $ | (30 | ) | $ | — | $ | (610 | ) | |||||||
Page 50
Quarterly Financial Report as of October 6, 2016 (Unaudited)
Operating Expenses (continued)
Page 51
Quarterly Financial Report as of October 6, 2016 (Unaudited)
F. Debtors and Debtor-Controlled Entities Schedules
LBHI
The Company estimates that Total Post-D11 CFE Cash From Operations, including Intercompany Receipts, at LBHI will be $5.3 billion, which reflects an increase in estimates of $0.9 billion compared to estimates presented in the Post-D9 CFE.
| ($ in millions) | Post-D9 Cash Flow Estimates |
Less: Cash Activity 6/1/16-10/6/16 excluding D10 |
Recovery Value Change |
Transfers, Reclassifications, Adjustments (a) |
Post-D11 Cash Flow Estimates |
|||||||||||||||
| Net Receipts |
||||||||||||||||||||
| Commercial Real Estate |
$ | 34 | $ | (1 | ) | $ | 1 | $ | — | $ | 34 | |||||||||
| Loans (Corporate & Residential) |
59 | (12 | ) | 9 | — | 56 | ||||||||||||||
| Private Equity / Principal Investments |
0 | (0 | ) | 0 | — | 0 | ||||||||||||||
| Derivatives |
— | — | — | — | — | |||||||||||||||
| Other |
227 | (572 | ) | 463 | 120 | 238 | ||||||||||||||
|
|
|
|
|
|
|
|
|
|
|
|||||||||||
| Sub-Total - Net Receipts |
$ | 320 | $ | (585 | ) | $ | 473 | $ | 120 | $ | 328 | |||||||||
| Recoveries From Non-Controlled Affiliates |
||||||||||||||||||||
| Europe |
$ | 2,461 | $ | (1,074 | ) | $ | (21 | ) | $ | 132 | $ | 1,498 | ||||||||
| Asia |
1,329 | (284 | ) | 70 | (144 | ) | 970 | |||||||||||||
|
|
|
|
|
|
|
|
|
|
|
|||||||||||
| Sub-Total - Recoveries From Non-Controlled Affiliates |
$ | 3,791 | $ | (1,358 | ) | $ | 49 | $ | (12 | ) | $ | 2,469 | ||||||||
| Operating Expenses |
||||||||||||||||||||
| Professional Fees |
$ | (156 | ) | $ | 27 | $ | (10 | ) | $ | — | $ | (139 | ) | |||||||
| Compensation & Benefits |
(107 | ) | 9 | 1 | 4 | (93 | ) | |||||||||||||
| Incentive Fees |
(110 | ) | 2 | (18 | ) | — | (125 | ) | ||||||||||||
| Other Administrative Expenses |
(42 | ) | 4 | 4 | (4 | ) | (38 | ) | ||||||||||||
|
|
|
|
|
|
|
|
|
|
|
|||||||||||
| Sub-Total - Operating Expenses |
$ | (414 | ) | $ | 42 | $ | (23 | ) | $ | — | $ | (395 | ) | |||||||
| Total Cash From Operations (CFO) |
$ | 3,697 | $ | (1,902 | ) | $ | 499 | $ | 109 | $ | 2,402 | |||||||||
|
|
|
|
|
|
|
|
|
|
|
|||||||||||
| Pre-Petition Intercompany Receipts from Controlled Entities |
3,815 | (1,409 | ) | 390 | 151 | 2,948 | ||||||||||||||
| Net Post-Petition Intercompany Receipts from / (Payables to) Controlled Entities |
(1,174 | ) | (44 | ) | (115 | ) | — | (1,333 | ) | |||||||||||
| Investments in Affiliates |
1,249 | (174 | ) | 136 | 47 | 1,258 | ||||||||||||||
| Total CFO + Intercompany Receipts |
$ | 7,587 | $ | (3,529 | ) | $ | 910 | $ | 307 | $ | 5,275 | |||||||||
|
|
|
|
|
|
|
|
|
|
|
|||||||||||
| (a) | Transfers, Reclassifications and Adjustments primarily include: |
| • | an adjustment in Other Net Receipts to offset cash received in September 2016 related to the $107 million loan from LBHI2 to LBHI, collateralized by LBHI’s claims against LBIE; LBHI has recorded a liability related to this loan in Payables to Debtors and Debtor-Controlled Entities and Other Liabilities (see Note 9 in the Notes to the Balance Sheets), |
| • | an adjustment in Recoveries From Non-Controlled Affiliates – Europe for claims against LBIE purchased by LBHI in the aggregate face amount of £153 million, |
| • | an adjustment in Recoveries From Non-Controlled Affiliates – Asia for LBHI’s contribution of its claims against LBCCA in the aggregate face amount of $2.3 billion, net of $1.3 billion of distributions, to LPTSI as a result of a corporate restructuring, |
| • | $114 million in “Pre-Petition intercompany Receipts from Controlled Entities” of future distributions that will be recovered by way of subrogation on account of guarantee claims corresponding to primary claims against LCPI and LBCS, and |
| • | $42 million in “Investments in Affiliates” related to the restructuring of LPTSI, which had been consolidated under ALI in previous Balance Sheets. |
Page 52
Quarterly Financial Report as of October 6, 2016 (Unaudited)
Page 53
Quarterly Financial Report as of October 6, 2016 (Unaudited)
LCPI
The Company estimates that Total Post-D11 CFE Cash From Operations, including Intercompany Receipts, at LCPI will be $1.1 billion, which reflects an increase in estimates of $0.4 billion compared to estimates presented in the Post-D9 CFE.
| ($ in millions) | Post-D9 Cash Flow Estimates |
Less: Cash Activity 6/1/16-10/6/16 excluding D10 |
Recovery Value Change |
Transfers, Reclassifications, Adjustments (a) |
Post-D11 Cash Flow Estimates |
|||||||||||||||
| Net Receipts |
||||||||||||||||||||
| Commercial Real Estate |
$ | 194 | $ | (77 | ) | $ | (10 | ) | $ | 0 | $ | 107 | ||||||||
| Loans (Corporate & Residential) |
35 | (55 | ) | 53 | — | 33 | ||||||||||||||
| Private Equity / Principal Investments |
3 | — | — | — | 3 | |||||||||||||||
| Derivatives |
— | — | — | — | — | |||||||||||||||
| Other |
5 | (4 | ) | (1 | ) | — | 1 | |||||||||||||
|
|
|
|
|
|
|
|
|
|
|
|||||||||||
| Sub-Total - Net Receipts |
$ | 237 | $ | (136 | ) | $ | 43 | $ | 0 | $ | 144 | |||||||||
| Recoveries From Non-Controlled Affiliates |
||||||||||||||||||||
| Europe |
$ | 21 | $ | (0 | ) | $ | (0 | ) | $ | (20 | ) | $ | 1 | |||||||
| Asia |
0 | — | (0 | ) | — | — | ||||||||||||||
|
|
|
|
|
|
|
|
|
|
|
|||||||||||
| Sub-Total - Recoveries From Non-Controlled Affiliates |
$ | 22 | $ | (0 | ) | $ | (0 | ) | $ | (20 | ) | $ | 1 | |||||||
| Operating Expenses |
||||||||||||||||||||
| Professional Fees |
$ | (5 | ) | $ | 1 | $ | (0 | ) | $ | — | $ | (4 | ) | |||||||
| Compensation & Benefits |
(9 | ) | 2 | (4 | ) | — | (11 | ) | ||||||||||||
| Incentive Fees |
(25 | ) | 1 | (7 | ) | — | (32 | ) | ||||||||||||
| Other Administrative Expenses |
(5 | ) | 1 | (2 | ) | — | (6 | ) | ||||||||||||
|
|
|
|
|
|
|
|
|
|
|
|||||||||||
| Sub-Total - Operating Expenses |
$ | (44 | ) | $ | 5 | $ | (13 | ) | $ | — | $ | (53 | ) | |||||||
| Total Cash From Operations (CFO) |
$ | 215 | $ | (132 | ) | $ | 29 | $ | (20 | ) | $ | 93 | ||||||||
|
|
|
|
|
|
|
|
|
|
|
|||||||||||
| Pre-Petition Intercompany Receipts from Controlled Entities |
702 | (74 | ) | (19 | ) | — | 609 | |||||||||||||
| Net Post-Petition Intercompany Receipts from / (Payables to) Controlled Entities |
(145 | ) | (74 | ) | 331 | — | 112 | |||||||||||||
| Investments in Affiliates |
324 | (35 | ) | 28 | — | 318 | ||||||||||||||
| Total CFO + Intercompany Receipts |
$ | 1,096 | $ | (314 | ) | $ | 369 | $ | (20) | $ | 1,131 | |||||||||
|
|
|
|
|
|
|
|
|
|
|
|||||||||||
| (a) | Transfers, Reclassifications and Adjustments include an adjustment in Recoveries From Non-Controlled Affiliates – Europe of $20 million for claims against LBIE purchased by LBHI. |
Page 54
Quarterly Financial Report as of October 6, 2016 (Unaudited)
LBSF
The Company estimates that Total Post-D11 CFE Cash From Operations, including Intercompany Receipts, at LBSF will be $0.5 billion, which reflects an increase in estimates of $0.1 billion compared to estimates presented in the Post-D9 CFE.
| ($ in millions) | Post-D9 Cash Flow Estimates |
Less: Cash Activity 6/1/16-10/6/16 excluding D10 |
Recovery Value Change |
Transfers, Reclassifications, Adjustments |
Post-D11 Cash Flow Estimates |
|||||||||||||||
| Net Receipts |
||||||||||||||||||||
| Commercial Real Estate |
$ | — | $ | — | $ | — | $ | — | $ | — | ||||||||||
| Loans (Corporate & Residential) |
— | — | — | — | — | |||||||||||||||
| Private Equity / Principal Investments |
— | — | — | — | — | |||||||||||||||
| Derivatives |
98 | (52 | ) | 87 | — | 133 | ||||||||||||||
| Other |
29 | (74 | ) | 68 | — | 23 | ||||||||||||||
|
|
|
|
|
|
|
|
|
|
|
|||||||||||
| Sub-Total - Net Receipts |
$ | 127 | $ | (126 | ) | $ | 155 | $ | — | $ | 156 | |||||||||
| Recoveries From Non-Controlled Affiliates |
||||||||||||||||||||
| Europe |
$ | 62 | $ | (22 | ) | $ | (7 | ) | $ | (5 | ) | $ | 28 | |||||||
| Asia |
1 | (0 | ) | 0 | (1 | ) | 0 | |||||||||||||
|
|
|
|
|
|
|
|
|
|
|
|||||||||||
| Sub-Total - Recoveries From Non-Controlled Affiliates |
$ | 63 | $ | (22 | ) | $ | (7 | ) | $ | (5 | ) | $ | 28 | |||||||
| Operating Expenses |
||||||||||||||||||||
| Professional Fees |
$ | (70 | ) | $ | 6 | $ | 10 | $ | — | $ | (54 | ) | ||||||||
| Compensation & Benefits |
(34 | ) | 1 | 0 | — | (32 | ) | |||||||||||||
| Incentive Fees |
(20 | ) | (0 | ) | (3 | ) | — | (23 | ) | |||||||||||
| Other Administrative Expenses |
(13 | ) | 1 | (2 | ) | — | (14 | ) | ||||||||||||
|
|
|
|
|
|
|
|
|
|
|
|||||||||||
| Sub-Total - Operating Expenses |
$ | (137 | ) | $ | 9 | $ | 5 | $ | — | $ | (123 | ) | ||||||||
| Total Cash From Operations (CFO) |
$ | 54 | $ | (140 | ) | $ | 153 | $ | (5 | ) | $ | 62 | ||||||||
|
|
|
|
|
|
|
|
|
|
|
|||||||||||
| Pre-Petition Intercompany Receipts from Controlled Entities |
119 | (16 | ) | 6 | — | 109 | ||||||||||||||
| Net Post-Petition Intercompany Receipts from / (Payables to) Controlled Entities |
368 | 31 | (66 | ) | — | 333 | ||||||||||||||
| Investments in Affiliates |
1 | — | (1 | ) | — | 0 | ||||||||||||||
| Total CFO + Intercompany Receipts |
$ | 543 | $ | (125 | ) | $ | 92 | $ | (5 | ) | $ | 504 | ||||||||
|
|
|
|
|
|
|
|
|
|
|
|||||||||||
Page 55
Quarterly Financial Report as of October 6, 2016 (Unaudited)
Other Debtors
| ($ in millions) | LOTC | LBCC | LBCS | LBFP | Merit | LBDP | Other Debtors |
Total Other Debtors |
||||||||||||||||||||||||
|
POST-D11 CASH FLOW ESTIMATES |
||||||||||||||||||||||||||||||||
| Net Receipts |
||||||||||||||||||||||||||||||||
| Commercial Real Estate |
$ | — | $ | — | $ | — | $ | — | $ | — | $ | — | $ | 1 | $ | 1 | ||||||||||||||||
| Loans (Corporate & Residential) |
— | — | — | — | — | — | — | — | ||||||||||||||||||||||||
| Private Equity / Principal Investments |
— | — | — | — | — | — | — | — | ||||||||||||||||||||||||
| Derivatives |
— | — | — | — | — | — | — | — | ||||||||||||||||||||||||
| Other |
1 | 0 | 0 | 0 | 0 | 0 | — | 1 | ||||||||||||||||||||||||
|
|
|
|
|
|
|
|
|
|
|
|
|
|
|
|
|
|||||||||||||||||
|
Sub-Total - Net Receipts |
$ | 1 | $ | 0 | $ | 0 | $ | 0 | $ | 0 | $ | 0 | $ | 1 | $ | 2 | ||||||||||||||||
| Recoveries From Non-Controlled Affiliates |
||||||||||||||||||||||||||||||||
| Europe |
$ | — | $ | 3 | $ | 12 | $ | — | $ | — | $ | — | $ | — | $ | 15 | ||||||||||||||||
| Asia |
— | 14 | 0 | — | — | — | — | 14 | ||||||||||||||||||||||||
|
Sub-Total - Recoveries From Non-Controlled Affiliates |
$ | — | $ | 17 | $ | 12 | $ | — | $ | — | $ | — | $ | — | $ | 29 | ||||||||||||||||
| Operating Expenses |
||||||||||||||||||||||||||||||||
| Professional Fees |
$ | (1 | ) | $ | (1 | ) | $ | (2 | ) | $ | (0 | ) | $ | (0 | ) | $ | (0 | ) | $ | (1 | ) | $ | (5 | ) | ||||||||
| Compensation & Benefits |
(1 | ) | (1 | ) | (1 | ) | (1 | ) | (0 | ) | (0 | ) | (1 | ) | (6 | ) | ||||||||||||||||
| Incentive Fees |
(2 | ) | (2 | ) | (5 | ) | (1 | ) | — | (0 | ) | (2 | ) | (11 | ) | |||||||||||||||||
|
Other Administrative Expenses |
(1 | ) | (1 | ) | (0 | ) | (1 | ) | (0 | ) | (0 | ) | (1 | ) | (4 | ) | ||||||||||||||||
|
|
|
|
|
|
|
|
|
|
|
|
|
|
|
|
|
|||||||||||||||||
|
Sub-Total - Operating Expenses |
$ | (4 | ) | $ | (5 | ) | $ | (7 | ) | $ | (2 | ) | $ | (0 | ) | $ | (1 | ) | $ | (5 | ) | $ | (25 | ) | ||||||||
|
Total Cash From Operations (CFO) |
$ | (4 | ) | $ | 12 | $ | 5 | $ | (2 | ) | $ | (0 | ) | $ | (1 | ) | $ | (4 | ) | $ | 6 | |||||||||||
|
|
|
|
|
|
|
|
|
|
|
|
|
|
|
|
|
|||||||||||||||||
|
Pre-Petition Intercompany Receipts from Controlled Entities |
$ | 0 | $ | 1 | $ | 8 | $ | — | $ | 1 | $ | 0 | $ | 85 | $ | 95 | ||||||||||||||||
| Net Post-Petition Intercompany Receipts from / (Payables to) Controlled Entities |
517 | 260 | 34 | 138 | 17 | (1 | ) | (7 | ) | 958 | ||||||||||||||||||||||
| Investments in Affiliates |
— | — | — | — | — | — | — | — | ||||||||||||||||||||||||
| Total Post-D11 CFO + Intercompany Receipts |
$ | 513 | $ | 273 | $ | 47 | $ | 136 | $ | 18 | $ | (2 | ) | $ | 73 | $ | 1,058 | |||||||||||||||
|
|
|
|
|
|
|
|
|
|
|
|
|
|
|
|
|
|||||||||||||||||
|
|
|
|
|
|
|
|
|
|
|
|
|
|
|
|
|
|||||||||||||||||
| Cash Activity, 6/1/16-10/6/16 excluding D10 |
$ | 5 | $ | (120 | ) | $ | 21 | $ | 2 | $ | 0 | $ | 20 | $ | 6 | $ | (65 | ) | ||||||||||||||
| Transfers, Reclassifications, Adjustments |
— | 5 | 30 | — | 23 | — | — | 58 | ||||||||||||||||||||||||
|
|
|
|
|
|
|
|
|
|
|
|
|
|
|
|
|
|||||||||||||||||
| Total Post-D11 CFE, including Prior Period Activity |
$ | 518 | $ | 158 | $ | 98 | $ | 138 | $ | 41 | $ | 18 | $ | 80 | $ | 1,051 | ||||||||||||||||
| Total Post-D9 CFE |
510 | 152 | 71 | 142 | 24 | 18 | 83 | 999 | ||||||||||||||||||||||||
| Variance, Post-D11 CFE (including Prior Period) vs. Post-D9 CFE (a) |
8 | 6 | 28 | (4 | ) | 18 | 1 | (3 | ) | 52 | ||||||||||||||||||||||
| (a) | Variances in LBCS and Merit primarily related to an adjustment in Recoveries From Non-Controlled Affiliates – Europe for claims against LBIE purchased by LBHI. |
Page 56
Quarterly Financial Report as of October 6, 2016 (Unaudited)
Debtor-Controlled Entities
| ($ in millions) | Post-D9 Cash Flow Estimates |
Less: Cash Activity 6/1/16-10/6/16 excluding D10 |
Recovery Value Change |
Transfers, Reclassifications, Adjustments (a) |
Post-D11 Cash Flow Estimates |
|||||||||||||||
| Net Receipts |
||||||||||||||||||||
| Commercial Real Estate |
$ | 246 | $ | (146 | ) | $ | (29 | ) | $ | (0 | ) | $ | 71 | |||||||
| Loans (Corporate & Residential) |
30 | (1 | ) | 3 | — | 31 | ||||||||||||||
| Private Equity / Principal Investments |
1,010 | (336 | ) | 287 | — | 961 | ||||||||||||||
| Derivatives |
1 | (2 | ) | 2 | — | 1 | ||||||||||||||
| Other |
52 | (4 | ) | 1 | — | 49 | ||||||||||||||
|
|
|
|
|
|
|
|
|
|
|
|||||||||||
| Sub-Total - Net Receipts |
$ | 1,340 | $ | (489 | ) | $ | 263 | $ | (0 | ) | $ | 1,113 | ||||||||
| Recoveries From Non-Controlled Affiliates |
||||||||||||||||||||
| Europe |
$ | 1,548 | $ | (57 | ) | $ | (172 | ) | $ | (66 | ) | $ | 1,253 | |||||||
| Asia |
8 | (37 | ) | (3 | ) | 106 | 73 | |||||||||||||
|
|
|
|
|
|
|
|
|
|
|
|||||||||||
| Sub-Total - Recoveries From Non-Controlled Affiliates |
$ | 1,556 | $ | (94 | ) | $ | (176 | ) | $ | 40 | $ | 1,325 | ||||||||
| Operating Expenses |
||||||||||||||||||||
| Professional Fees |
$ | (2 | ) | $ | 2 | $ | (1 | ) | $ | — | $ | (2 | ) | |||||||
| Compensation & Benefits |
(16 | ) | 1 | 4 | — | (11 | ) | |||||||||||||
| Incentive Fees |
0 | (0 | ) | 0 | — | — | ||||||||||||||
| Other Administrative Expenses |
(2 | ) | 2 | (0 | ) | — | (1 | ) | ||||||||||||
|
|
|
|
|
|
|
|
|
|
|
|||||||||||
| Sub-Total - Operating Expenses |
$ | (20 | ) | $ | 4 | $ | 2 | $ | — | $ | (14 | ) | ||||||||
| Total Cash From Operations (CFO) |
$ | 2,875 | $ | (579 | ) | $ | 89 | $ | 39 | $ | 2,424 | |||||||||
|
|
|
|
|
|
|
|
|
|
|
|||||||||||
| Pre-Petition Intercompany Receipts from Controlled Entities |
419 | (180 | ) | 61 | (0 | ) | 300 | |||||||||||||
| Net Post-Petition Intercompany Receipts from / (Payables to) Controlled Entities |
151 | (28 | ) | (193 | ) | — | (70 | ) | ||||||||||||
| Investments in Affiliates |
485 | — | (14 | ) | — | 472 | ||||||||||||||
| Total CFO + Intercompany Receipts |
$ | 3,930 | $ | (786 | ) | $ | (56 | ) | $ | 39 | $ | 3,126 | ||||||||
|
|
|
|
|
|
|
|
|
|
|
|||||||||||
|
|
|
|
|
|||||||||||||||||
| (a) | Transfers, Reclassifications and Adjustments primarily include (i) an adjustment in Recoveries From Non-Controlled Affiliates – Europe for claims against LBIE purchased by LBHI, and (ii) an adjustment in Recoveries From Non-Controlled Affiliates – Asia for LBHI’s contribution of its claims against LBCCA in the aggregate face amount of $2.3 billion, net of $1.3 billion of distributions, to LPTSI as a result of a corporate restructuring. |
Page 57