Attached files
| file | filename |
|---|---|
| 8-K - 8-K - HEALTHCARE REALTY TRUST INC | hr-2017investorpresentatio.htm |
February 2017

This presentation contains disclosures that are “forward-looking statements” as defined in Section 27A of the Securities Act of 1933, as amended, and Section 21E of
the Securities Exchange Act of 1934, as amended. Forward-looking statements include all statements that do not relate solely to historical or current facts and can be
identified by the use of words and phrases such as “can,” “may,” “payable,” “indicative,” “annualized,” “expect,” “expected,” “future cash or NOI,” “deferred revenue,” “rent
increases,” “range of expectations,” “budget,” “components of expected 2016 FFO,” and other comparable terms in this presentation. These forward-looking statements
are made as of the date of this presentation and are not guarantees of future performance. These statements are based on the current plans and expectations of
Company management and are subject to a number of unknown risks, uncertainties, assumptions and other factors that could cause actual results to differ materially
from those described in this release or implied by such forward-looking statements. Such risks and uncertainties include, among other things, the following: changes
in the economy; increases in interest rates; the availability and cost of capital at expected rates; changes to facility-related healthcare regulations; competition for
quality assets; negative developments in the operating results or financial condition of the Company's tenants, including, but not limited to, their ability to pay rent
and repay loans; the Company's ability to reposition or sell facilities with profitable results; the Company's ability to re-lease space at similar rates as vacancies occur;
the Company's ability to renew expiring long-term single-tenant net leases; the Company's ability to timely reinvest proceeds from the sale of assets at similar yields;
government regulations affecting tenants' Medicare and Medicaid reimbursement rates and operational requirements; unanticipated difficulties and/or expenditures
relating to future acquisitions and developments; changes in rules or practices governing the Company's financial reporting; the Company may be required under
purchase options to sell properties and may not be able to reinvest the proceeds from such sales at rates of return equal to the return received on the properties sold;
uninsured or underinsured losses related to casualty or liability; the incurrence of impairment charges on its real estate properties or other assets; and other legal and
operational matters. Other risks, uncertainties and factors that could cause actual results to differ materially from those projected are detailed under the heading “Risk
Factors,” in the Company's Annual Report on Form 10-K filed with the Securities and Exchange Commission (“SEC”) for the year ended December 31, 2015 and other
risks described from time to time thereafter in the Company's SEC filings. The Company undertakes no obligation to publicly update or revise any forward-looking
statements, whether as a result of new information, future events or otherwise.
Information as of September 30, 2016, unless otherwise disclosed.
3
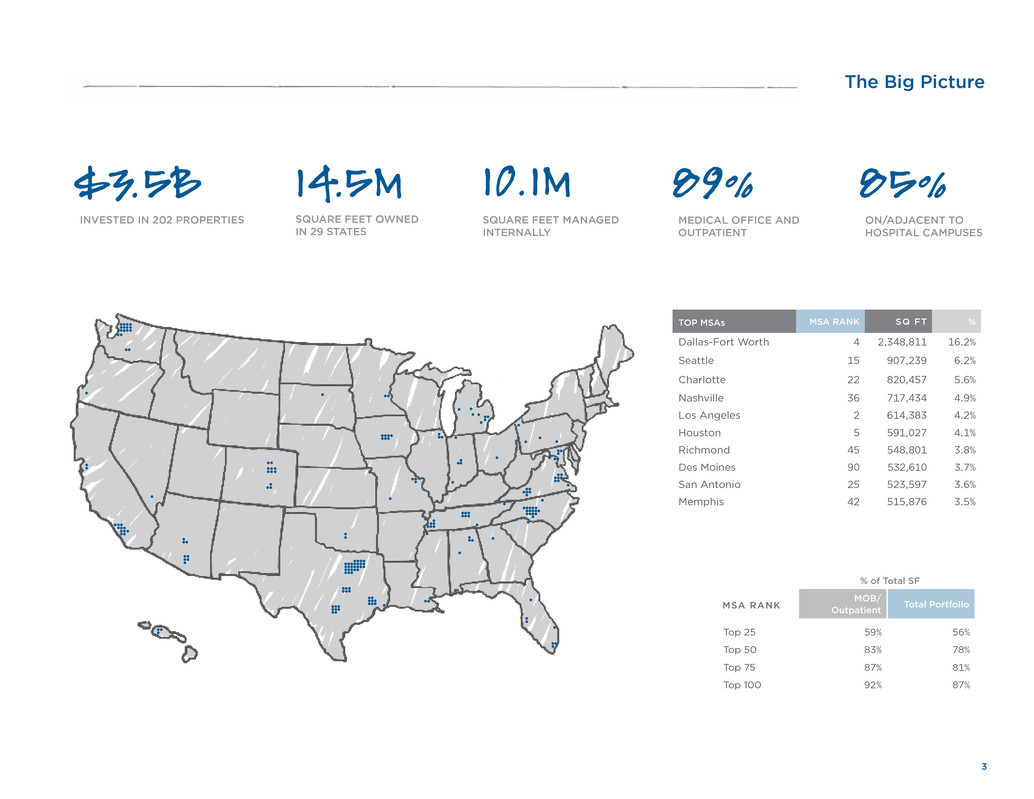
TOP MSAs MSA RANK SQ FT %
Dallas-Fort Worth 4 2,348,811 16.2%
Seattle 15 907,239 6.2%
Charlotte 22 820,457 5.6%
Nashville 36 717,434 4.9%
Los Angeles 2 614,383 4.2%
Houston 5 591,027 4.1%
Richmond 45 548,801 3.8%
Des Moines 90 532,610 3.7%
San Antonio 25 523,597 3.6%
Memphis 42 515,876 3.5%
The Big Picture
$3.5B 14.5M 10.1M
INVESTED IN 202 PROPERTIES SQUARE FEET OWNED
IN 29 STATES
SQUARE FEET MANAGED
INTERNALLY
89%
MEDICAL OFFICE AND
OUTPATIENT
85%
ON/ADJACENT TO
HOSPITAL CAMPUSES
% of Total SF
MSA RANK
MOB/
Outpatient
Total Portfolio
Top 25 59% 56%
Top 50 83% 78%
Top 75 87% 81%
Top 100 92% 87%
4
(CHI)
(Ascension)
(CHI)
Health System Affiliations
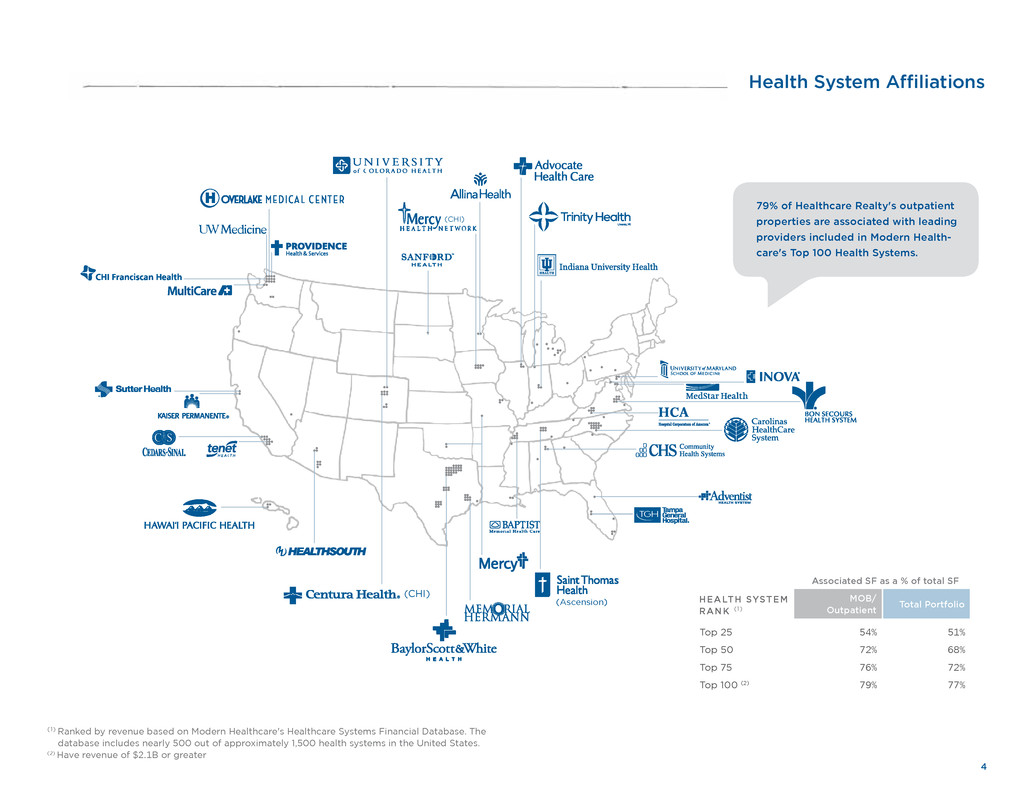
79% of Healthcare Realty's outpatient
properties are associated with leading
providers included in Modern Health-
care's Top 100 Health Systems.
Associated SF as a % of total SF
HEALTH SYSTEM
RANK (1)
MOB/
Outpatient
Total Portfolio
Top 25 54% 51%
Top 50 72% 68%
Top 75 76% 72%
Top 100 (2) 79% 77%
(1) Ranked by revenue based on Modern Healthcare's Healthcare Systems Financial Database. The
database includes nearly 500 out of approximately 1,500 health systems in the United States.
(2) Have revenue of $2.1B or greater
5
Portfolio History
93
A
S
S
E
TS
(
in
m
ill
io
ns
)
99 0596 02 0894 00 0697 03 09 10 1195 01 0798 04
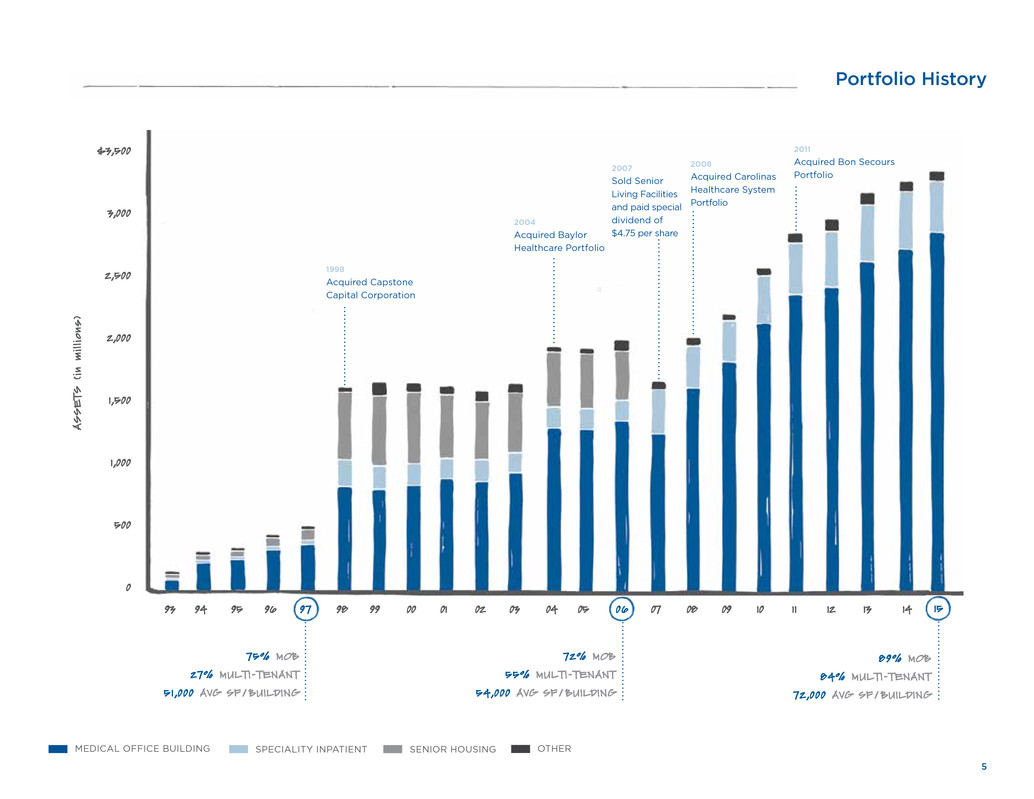
2008
Acquired Carolinas
Healthcare System
Portfolio
2011
Acquired Bon Secours
Portfolio
1998
Acquired Capstone
Capital Corporation
2004
Acquired Baylor
Healthcare Portfolio
2007
Sold Senior
Living Facilities
and paid special
dividend of
$4.75 per share
3,000
1,000
2,000
0
12 13
1,500
2,500
$3,500
500
MEDICAL OFFICE BUILDING SPECIALITY INPATIENT SENIOR HOUSING OTHER
75% MOB
27% MULTI-TENANT
51 ,000 AVG SF / BUILDING
72% MOB
55% MULTI-TENANT
54,000 AVG SF / BUILDING
14 15
89% MOB
84% MULTI-TENANT
72,000 AVG SF / BUILDING
6
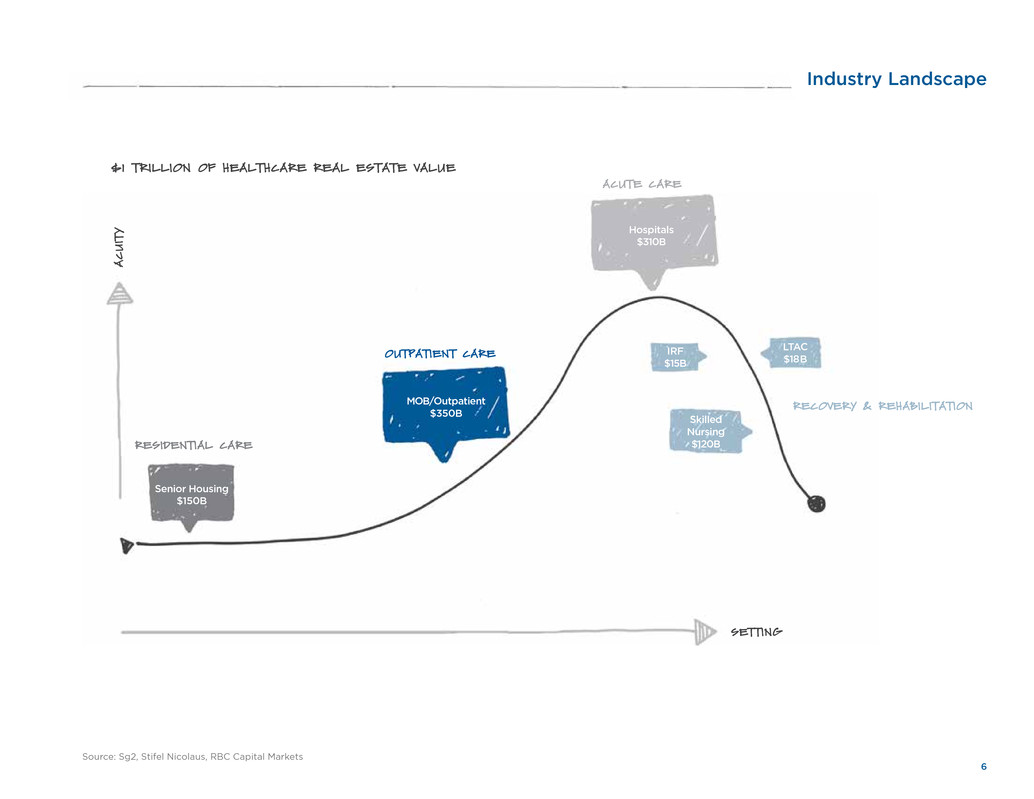
Industry Landscape
$1 TRILLION OF HEALTHCARE REAL ESTATE VALUE
Source: Sg2, Stifel Nicolaus, RBC Capital Markets
A
C
U
IT
Y
SETTING
OUTPATIENT CARE
RESIDENTIAL CARE
ACUTE CARE
RECOVERY & REHABILITATION
Senior Housing
$150B
MOB/Outpatient
$350B
Hospitals
$310B
Skilled
Nursing
$120B
LTAC
$18B
IRF
$15B
7
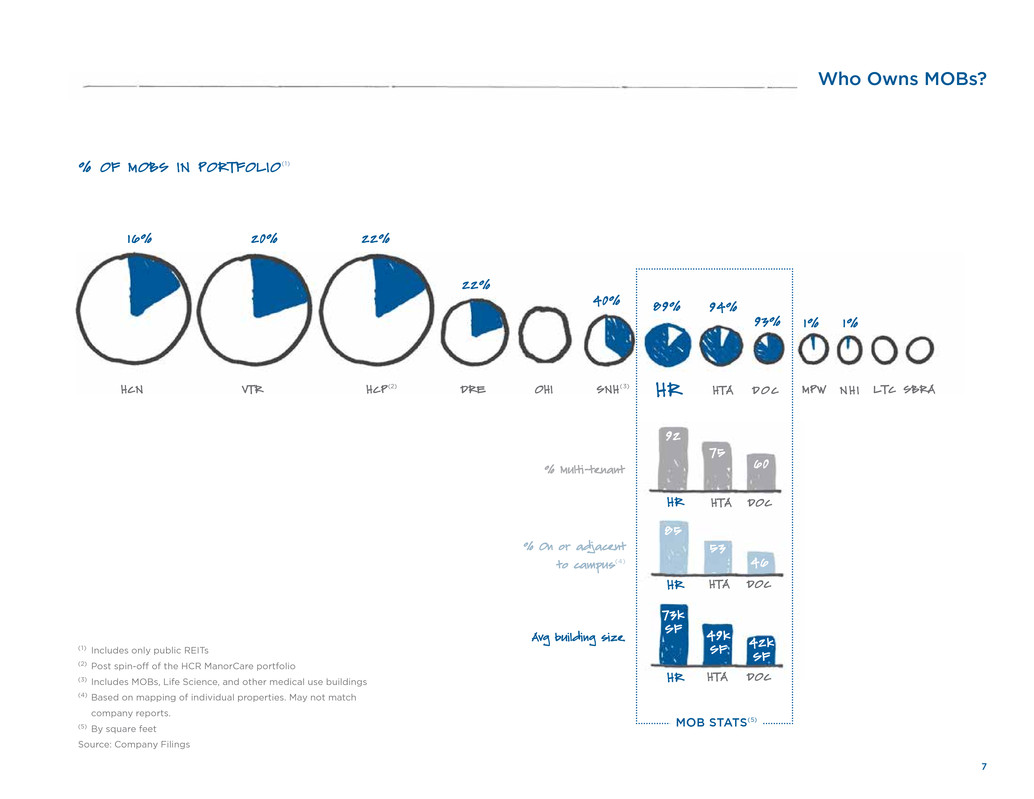
Who Owns MOBs?
HCN VTR HCP (2)
DRE OHI SNH (3) HR MPW HTA D O C LTC SBRA
16% 20% 22%
22%
40%
1% 1%
89% 94%
% Multi-tenant
% On or adjacent
to campus(4)
Avg building size
53
75
49k
SF
85
92
73k
SF
HR
HR
HR
% OF MOBS IN PORTFOLIO (1)
(1) Includes only public REITs
(2) Post spin-off of the HCR ManorCare portfolio
(3) Includes MOBs, Life Science, and other medical use buildings
(4) Based on mapping of individual properties. May not match
company reports.
(5) By square feet
Source: Company Filings
HTA
HTA
HTA
MOB STATS(5)
N H I
93%
46
60
42k
SF
DOC
DOC
DOC

8
ON -C AM PU
S
0 - 25 0 Y AR
DS25 1 YARDS - 0 . 25
M I L
ES
OFF -CAMPUS
HR
ON-C AM PU
S
0 - 25 0 Y AR
DS25 1 YARDS - 0 . 2
5
M I
LE
S
OFF -CAMPUS
HTA
SF % OF TOTAL SF % OF TOTAL SF % OF TOTAL
On-campus 8.9M 67.4% 4.5M 27.6% 2.5M 26.0%
Adjacent 2.3M 17.7% 4.1M 24.9% 1.9M 20.4%
0 - 250 yards 1.2M 9.2% 2.7M 16.4% 1.2M 12.7%
251 yards - 0.25 miles 1.1M 8.5% 1.4M 8.5% 731K 7.7%
Off-campus 2.0M 14.9% 7.8M 47.5% 5.1M 53.6%
0.25 - 0.5 miles 130K 1.0% 76K 0.5% 484K 5.1%
0.5 - 1 miles 305K 2.3% 735K 4.5% 575K 6.0%
1 - 2 miles 590K 4.4% 2.5M 15.2% 781K 8.2%
2 - 5 miles 477K 3.6% 2.5M 15.4% 1.7M 17.6%
5 - 10 miles 332K 2.5% 1.8M 10.9% 1.2M 12.3%
10 + miles 143K 1.1% 165K 1.0% 418K 4.4%
TOTAL SF 13.2M 100.0% 16.3M 100.0% 9.5M 100.0%
MOB Proximity to Hospital
OFF-CAMPUS
15.1%
ON -C AM PU
S
0 - 25 0 Y AR
DS25 1 YARDS - 0 . 25
M I L
ES
OFF -CAMPUS
DOC
Based on mapping of individual properties. May not match company reports.
Source: Company reports; S&P Global Market Intelligence; other public sources
85.1%
ON- AND ADJ
52.5% 46.4%

9
MOB Portfolio Comparison
% OF TOTAL MOB SF
Top 100
Health Systems
Top 100
MSAs
85
46
53
59
70
83
HR DOCHTAHCN VTRHCP
92
70
77
87
93
89
78
3939
49
56
79
HR DOCHTAVTRHCNHCP
66
19
27
3536
68
HR DOCHTAVTRHCNHCP
On or Adjacent
to Campus(1)
All Three
Attributes
NOT FOR PROFIT
HR DOCHTAVTRHCNHCP
(1) Based on mapping of individual properties. May not match company reports.
(2) Pro Forma for the acquisition of 51 MOBs associated with CHI
Source: Company reports; Modern Healthcare; BLS.gov; Nielsen; other public sources
%
%
%
%
ON CAMPUS
PROJECTED
POPULATION
GROWTH RATE
5.9 5.7
5.0
4.4 4.4 4.5
67
62
35
49
28
26
66
26
39 44
23
35
(1) Based on mapping of individual properties. May not match company reports. Includes properties located no more than 0.25 miles from a hospital campus.
Source: Company reports; Modern Healthcare; BLS.gov; Nielsen; other public sources
10
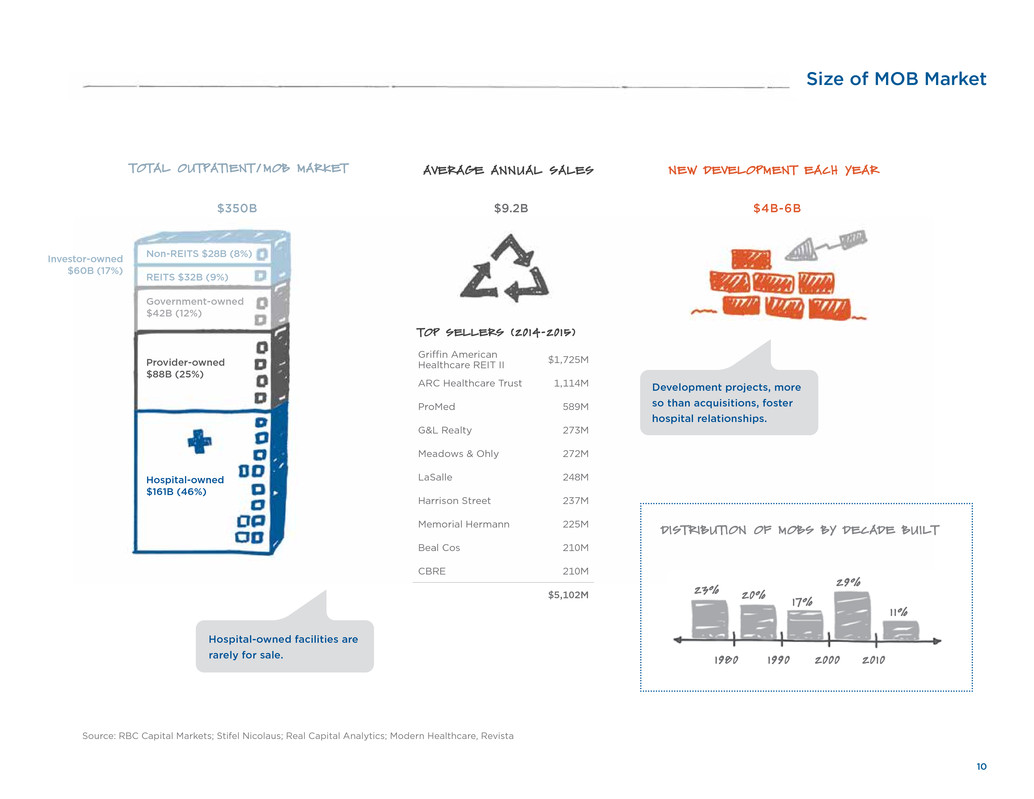
NEW DEVELOPMENT EACH YEARTOTAL OUTPATIENT / MOB MARKET AVERAGE ANNUAL SALES
Hospital-owned
$161B (46%)
Investor-owned
$60B (17%)
$9.2B $4B-6B$350B
Development projects, more
so than acquisitions, foster
hospital relationships.
Hospital-owned facilities are
rarely for sale.
TOP SELLERS (2014-2015)
Griffin American
Healthcare REIT II $1,725M
ARC Healthcare Trust 1,114M
ProMed 589M
G&L Realty 273M
Meadows & Ohly 272M
LaSalle 248M
Harrison Street 237M
Memorial Hermann 225M
Beal Cos 210M
CBRE 210M
$5,102M
Size of MOB Market
Source: RBC Capital Markets; Stifel Nicolaus; Real Capital Analytics; Modern Healthcare, Revista
DISTRIBUTION OF MOBS BY DECADE BUILT
1980
1 1%
1990 2000 2010
29%
17%20%
23%
Provider-owned
$88B (25%)
Government-owned
$42B (12%)
Non-REITS $28B (8%)
REITS $32B (9%)
11
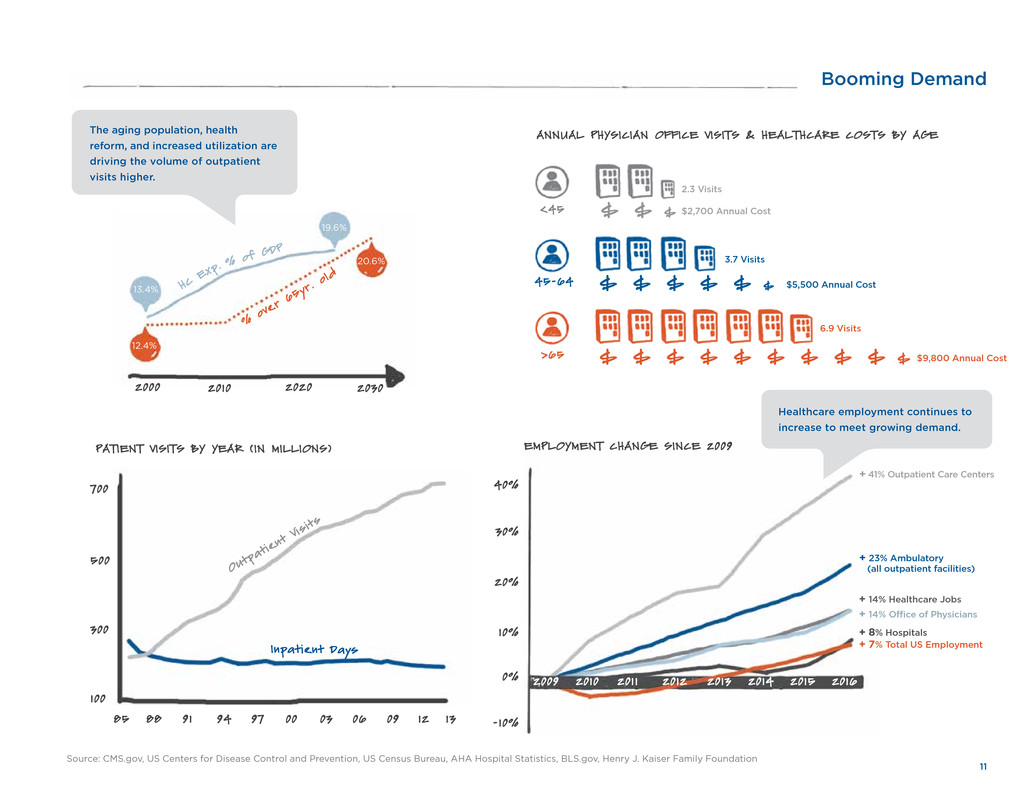
Booming Demand
ANNUAL PHYSICIAN OFFICE VISITS & HEALTHCARE COSTS BY AGE
2.3 Visits
3.7 Visits
6.9 Visits
<45
>65
45-64
2000 2020 2030
%
ove
r 6
5yr
. o
ld
13.4%
12.4%
19.6%
20.6%
Source: CMS.gov, US Centers for Disease Control and Prevention, US Census Bureau, AHA Hospital Statistics, BLS.gov, Henry J. Kaiser Family Foundation
85 88 91 94 97 00
700
500
300
100
Ou
tpa
tie
nt
Vis
its
Inpatient Days
PATIENT VISITS BY YEAR ( IN MILLIONS) EMPLOYMENT CHANGE SINCE 2009
2009 2010 201 1 2012 2013 2014
30%
20%
10%
0%
-10%
+ 41% Outpatient Care Centers
+ 23% Ambulatory
(all outpatient facilities)
+ 14% Healthcare Jobs
+ 14% Office of Physicians
+ 7% Total US Employment
The aging population, health
reform, and increased utilization are
driving the volume of outpatient
visits higher.
Healthcare employment continues to
increase to meet growing demand.
2010
03 06 09 12
HC
Ex
p. %
of G
DP
2015
$ $ $ $ $ $ $ $ $ $ $9,800 Annual Cost
$ $ $ $ $ $ $5,500 Annual Cost
$ $ $ $2,700 Annual Cost
13
2016
+ 8% Hospitals
40%

12
Source: Dixon Hughes Goodman, AHA Annual Survey data for Community hospitals, Modern Healthcare
2002 2014
100%
50%
0%
PRA
CTIC
ES
OWN
ED
BY H
OSP
ITAL
S
PRACTICES OWNED BY PHYSICIANS
Provider Trends
Inpatient vs. Outpatient
1994 2014
28% 46%
2009 2015
30%
0%
PHYSICIAN COMPENSATION GROWTH 2009–2015
10%
Pediatrics 29.6%
Internal Med. & Family Practice 20.9%
Oncology 15.6%
Cardiology 15.1%
General Surgery 14.8%
Obstetric/Gynecology 14.0%
Dermatology 13.6%
Orthopedic Surgery 10.4%
HOSPITALS' GROSS REVENUE
20%
As more of hospitals' revenue comes from
outpatient services, more physicians are em-
ployed by hospitals, and their compensation
is increasing steadily.
13
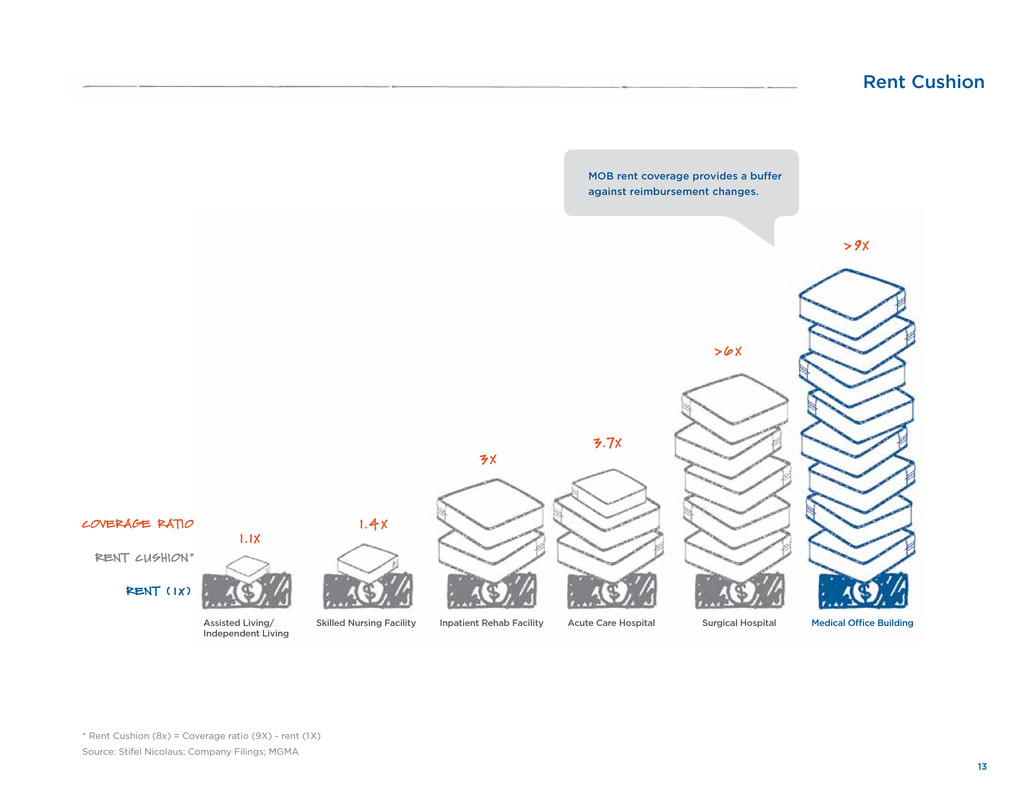
Rent Cushion
RENT ( 1 x )
RENT CUSHION*
COVERAGE RATIO
1 . 1X
1 .4 X
3 X
3.7X
> 6 X
> 9X
Assisted Living/
Independent Living
Skilled Nursing Facility Inpatient Rehab Facility Acute Care Hospital Surgical Hospital Medical Office Building
* Rent Cushion (8x) = Coverage ratio (9X) - rent (1X)
Source: Stifel Nicolaus; Company Filings; MGMA
MOB rent coverage provides a buffer
against reimbursement changes.
14
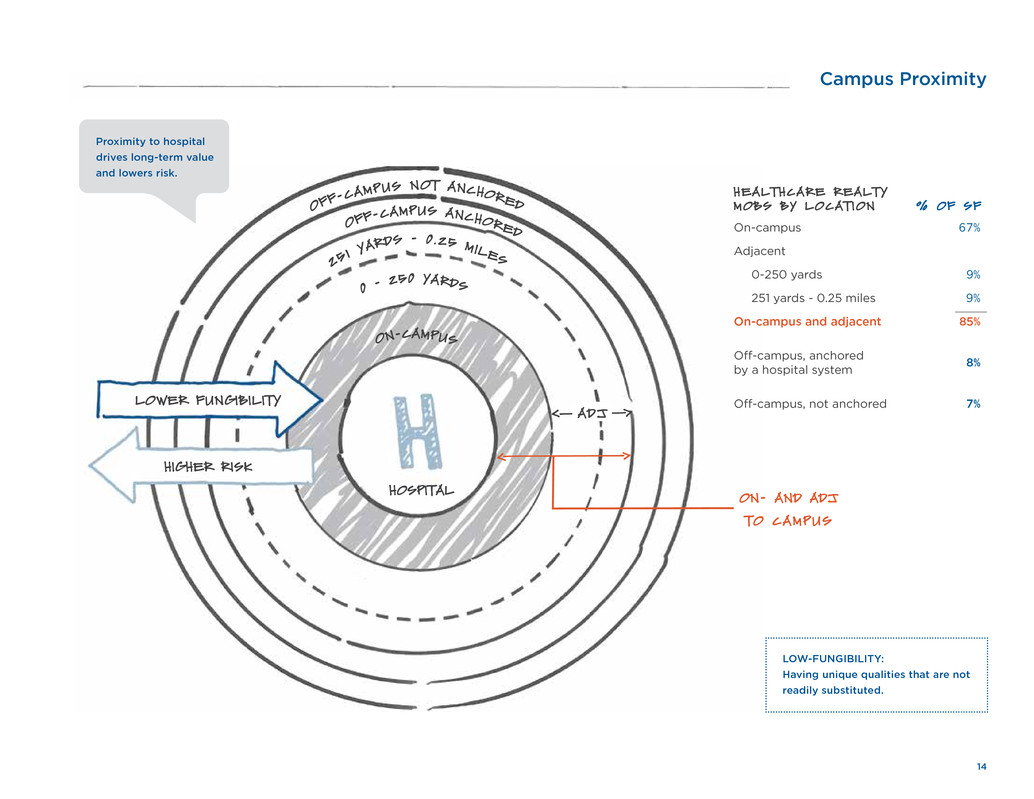
HOSPITAL
ON-CAMPUS
0 - 2
50 YARDS
25
1 YA
RDS - 0 .25 MILES
OFF-
CAMPUS ANCHORED
OFF
-CAMP
US NOT ANCHORED
< >
HIGHER RISK
LOWER FUNGIBILITY
ADJ
< >
ON- AND ADJ
TO CAMPUS
Campus Proximity
LOW-FUNGIBILITY:
Having unique qualities that are not
readily substituted.
Proximity to hospital
drives long-term value
and lowers risk.
HEALTHCARE REALTY
MOBS BY LOCAT ION % OF SF
On-campus 67%
Adjacent
0-250 yards 9%
251 yards - 0.25 miles 9%
On-campus and adjacent 85%
Off-campus, anchored
by a hospital system
8%
Off-campus, not anchored 7%
15
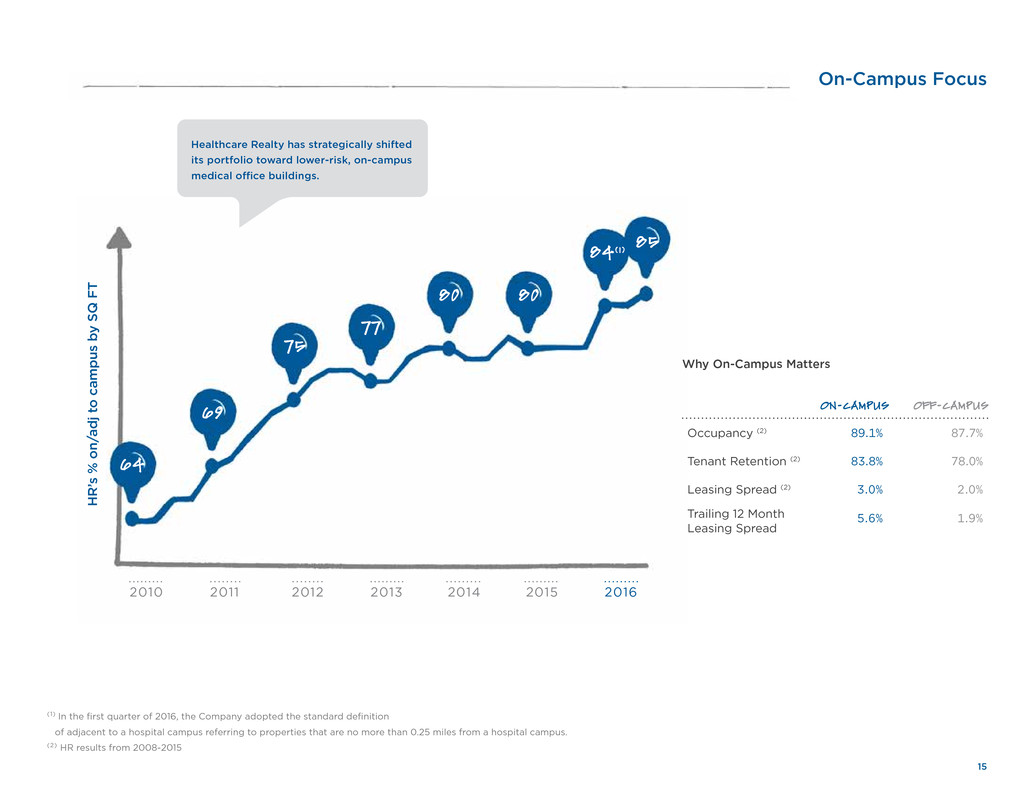
On-Campus Focus
H
R
’s
%
o
n/
ad
j t
o
c
am
p
us
b
y
S
Q
F
T 80
75
69
64
Healthcare Realty has strategically shifted
its portfolio toward lower-risk, on-campus
medical office buildings.
Why On-Campus Matters
ON-CAMPUS OFF-CAMPUS
Occupancy (2) 89.1% 87.7%
Tenant Retention (2) 83.8% 78.0%
Leasing Spread (2) 3.0% 2.0%
Trailing 12 Month
Leasing Spread
5.6% 1.9%
(1) In the first quarter of 2016, the Company adopted the standard definition
of adjacent to a hospital campus referring to properties that are no more than 0.25 miles from a hospital campus.
(2) HR results from 2008-2015
77
84(1)
2010 2011 2012 2013 2014 2015 2016
85
80
16
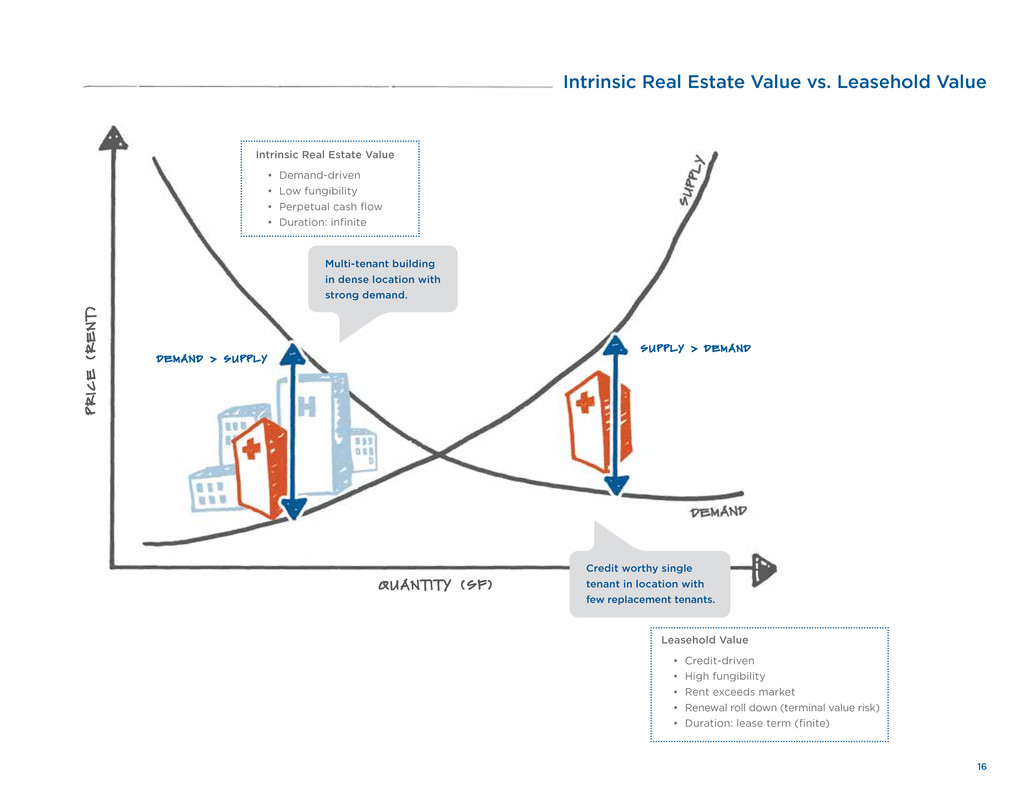
Intrinsic Real Estate Value vs. Leasehold Value
Multi-tenant building
in dense location with
strong demand.
Credit worthy single
tenant in location with
few replacement tenants.
Leasehold Value
• Credit-driven
• High fungibility
• Rent exceeds market
• Renewal roll down (terminal value risk)
• Duration: lease term (finite)
Intrinsic Real Estate Value
• Demand-driven
• Low fungibility
• Perpetual cash flow
• Duration: infinite
DEMAND > SUPPLY
SUPPLY > DEMAND
QUANT I T Y (SF )
P
R
IC
E
(
R
E
N
T)
17
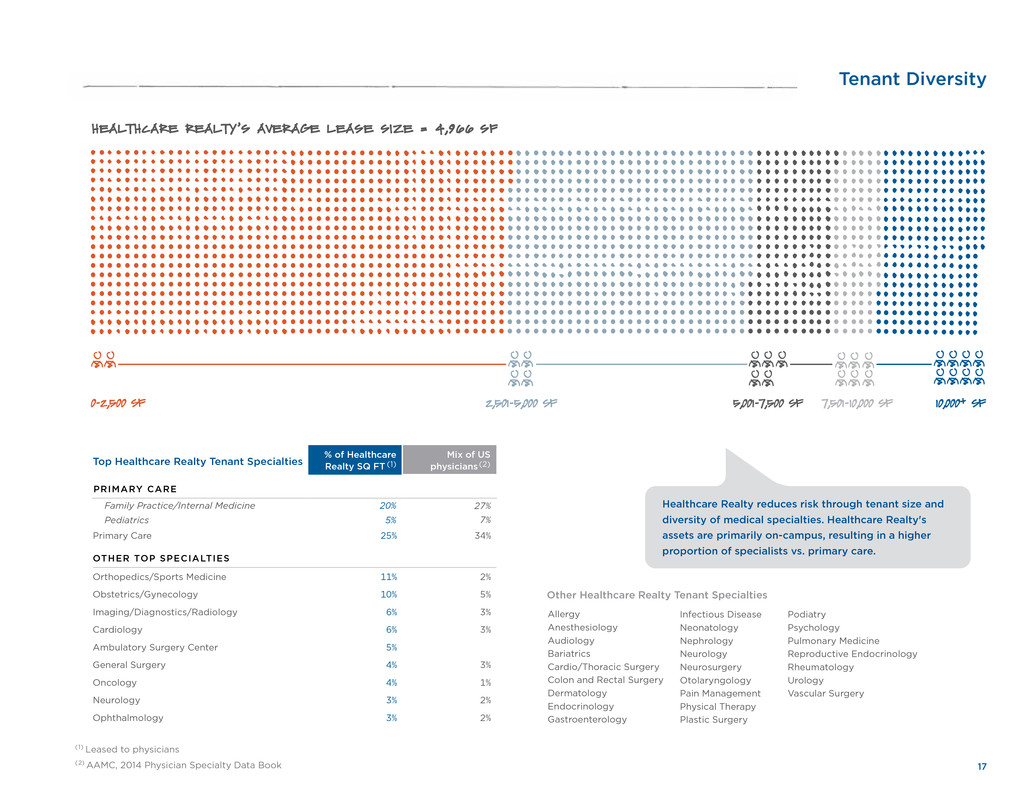
0-2,500 SF 2,501-5,000 SF 5,001-7,500 SF 7,501-10,000 SF 10,000+ SF
Tenant Diversity
Allergy
Anesthesiology
Audiology
Bariatrics
Cardio/Thoracic Surgery
Colon and Rectal Surgery
Dermatology
Endocrinology
Gastroenterology
Infectious Disease
Neonatology
Nephrology
Neurology
Neurosurgery
Otolaryngology
Pain Management
Physical Therapy
Plastic Surgery
Podiatry
Psychology
Pulmonary Medicine
Reproductive Endocrinology
Rheumatology
Urology
Vascular Surgery
Healthcare Realty reduces risk through tenant size and
diversity of medical specialties. Healthcare Realty's
assets are primarily on-campus, resulting in a higher
proportion of specialists vs. primary care.
HEALTHCARE REALTY’S AVERAGE LEASE SIZE = 4,966 SF
Top Healthcare Realty Tenant Specialties
% of Healthcare
Realty SQ FT (1)
Mix of US
physicians(2)
PRIMARY CARE
Family Practice/Internal Medicine 20% 27%
Pediatrics 5% 7%
Primary Care 25% 34%
OTHER TOP SPECIALTIES
Orthopedics/Sports Medicine 11% 2%
Obstetrics/Gynecology 10% 5%
Imaging/Diagnostics/Radiology 6% 3%
Cardiology 6% 3%
Ambulatory Surgery Center 5%
General Surgery 4% 3%
Oncology 4% 1%
Neurology 3% 2%
Ophthalmology 3% 2%
Other Healthcare Realty Tenant Specialties
(1) Leased to physicians
(2) AAMC, 2014 Physician Specialty Data Book
18
Historical Investment Activity
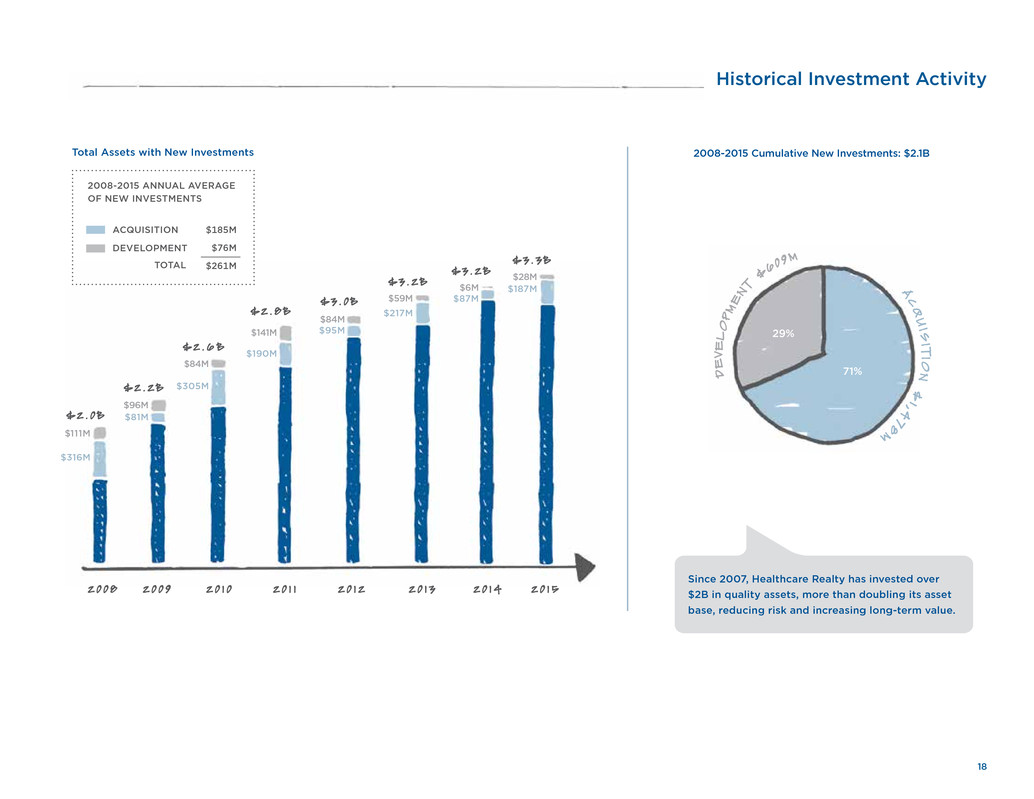
2008-2015 Cumulative New Investments: $2.1B
Total Assets with New Investments
Since 2007, Healthcare Realty has invested over
$2B in quality assets, more than doubling its asset
base, reducing risk and increasing long-term value.
29%
A
C
Q
U
I S
I T
IO
N
$
1,4
78M
D
E
VE
L
O
PM
E
NT
$
60
9M
71%
2 0 1 22 0 0 8 2 0 0 9 2 0 1 0 2 0 1 1
$316M
$111M
$81M
$96M
$305M
$84M
$190M
$95M$141M
$84M
$2 . 0 B
$ 2 . 2 B
$ 2 . 6 B
$ 2 . 8 B
$ 3 . 0 B
2 0 1 3
$217M
$59M
$3 . 2 B
$87M
$6M
$3 . 2 B
2 0 1 4
$187M
$28M
$3 . 3 B
2 0 1 5
2008-2015 ANNUAL AVERAGE
OF NEW INVESTMENTS
ACQUISITION
DEVELOPMENT
$185M
$76M
$261MTOTAL

19
Recent MOB Acquisitions
MCMURRAY MEDICAL
BUILDING
Seattle 60k SQ FT
On the campus of Northwest Hospital and Medical
Center, part of AA+ rated UW Medicine
MERIDIAN MEDICAL
PAVILION
Seattle 70k SQ FT
Adjacent to Northwest Hospital and Medical
Center, part of AA+ rated UW Medicine
VALLEY PROF.
CENTER NORTH
Seattle 47k SQ FT
On the campus of Valley Medical Center, part of AA+
rated UW Medicine
TALBOT PROF.
CENTER
Seattle 87k SQ FT
On the campus of Valley Medical Center, part of AA+
rated UW Medicine
SWEDISH ORTHO.
INSTITUTE
Seattle 53k SQ FT
On the campus of Swedish Medical Center, part of
AA- rated Providence Health & Services
STEVENS HEALTH
CENTER
Seattle 30k SQ FT
On the campus of Swedish Edmonds Hospital, part of
AA- rated Providence Health
HIGHLINE MEDICAL
PAVILION
Seattle 36k SQ FT
On the campus of Highline Medical Center, part of
A- rated CHI
THREE TREE
MEDICAL ARTS
Seattle 60k SQ FT
On campus and attached to Highline Medical Center, part
of A- rated CHI
TACOMA MED CTR. Tacoma 33k SQ FT
Adjacent to Tacoma General Hospital, part of AA- rated
MultiCare Health
CIV IC CENTER PL. San Jose 111k SQ FT
Adjacent to Washington Hospital Healthcare System and
AA- rated Kaiser Permanente Hospital
BROADWAY-WEBSTER
MEDICAL PLAZA
Oakland 100k SQ FT
On the campus of Alta Bates Summit Medical Center, part
of AA- rated Sutter Health
UNION MED. PLAZA Denver 48k SQ FT
Adjacent to Healthcare Realty's MOB developments on
the campus of St. Anthony Hospital, part of A- rated CHI
WEST HILLS
MEDICAL CENTER
Los Angeles 63k SQ FT
On the campus of West Hills Hospital and Medical Center,
part of BB rated HCA
UNITY PROF.
BUILDING Minneapolis 64k SQ FT
On campus and attached to Unity Hospital, part of AA-
rated Allina Health
BEL AIR PHYSICIANS
PAVILION I&I I Baltimore 114k SQ FT
On campus and attached to Upper Chesapeake Health
Medical Center, part of A- rated University of Maryland
Medical Center
LOUDOUN I I MOB Washington, DC 104k SQ FT
On the campus of Loudoun Hospital, part of AA+ rated
Inova Health System
WEST NORMAN
PROF. BUILDING Oklahoma City 69k SQ FT
On the campus of BBB rated Norman Regional
Healthplex
Healthcare Realty targets on-cam-
pus, multi-tenant MOBs associated
with market-leading hospitals.
20
Healthcare
Demand/Need
Patient
Affluence
PHYSICIAN OFFICE VISITS
INPATIENT PROCEDURES
PHYSICIAN NEED
INCOME
INSURED POPULATION / PAYOR MIX
POPULATION GROWTH
HIGHEST RISK
LOWEST RISK
MOB Differentiation
On/off campus
Hospital strength
Tenant mix
Building size
Ground lease vs. fee simple
Building condition/functionality
Competition
Parking
Financial measures:
Growth profile
Lease rates
Capital needs
Operating expenses
Lease turnover/expirations
6-6.5%
7% +
5-6%
6.5-7%
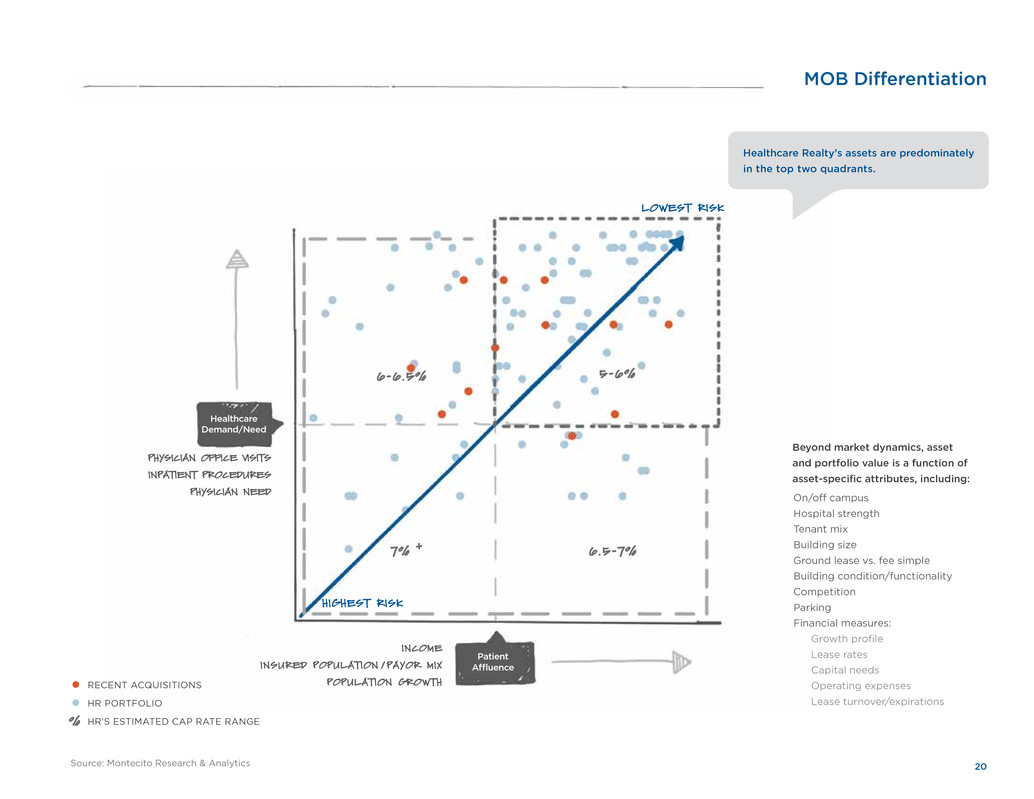
Beyond market dynamics, asset
and portfolio value is a function of
asset-specific attributes, including:
Source: Montecito Research & Analytics
Healthcare Realty’s assets are predominately
in the top two quadrants.
RECENT ACQUISITIONS
HR PORTFOLIO
HR’S ESTIMATED CAP RATE RANGE%
21
Acquisition Discipline
On-Campus Deals
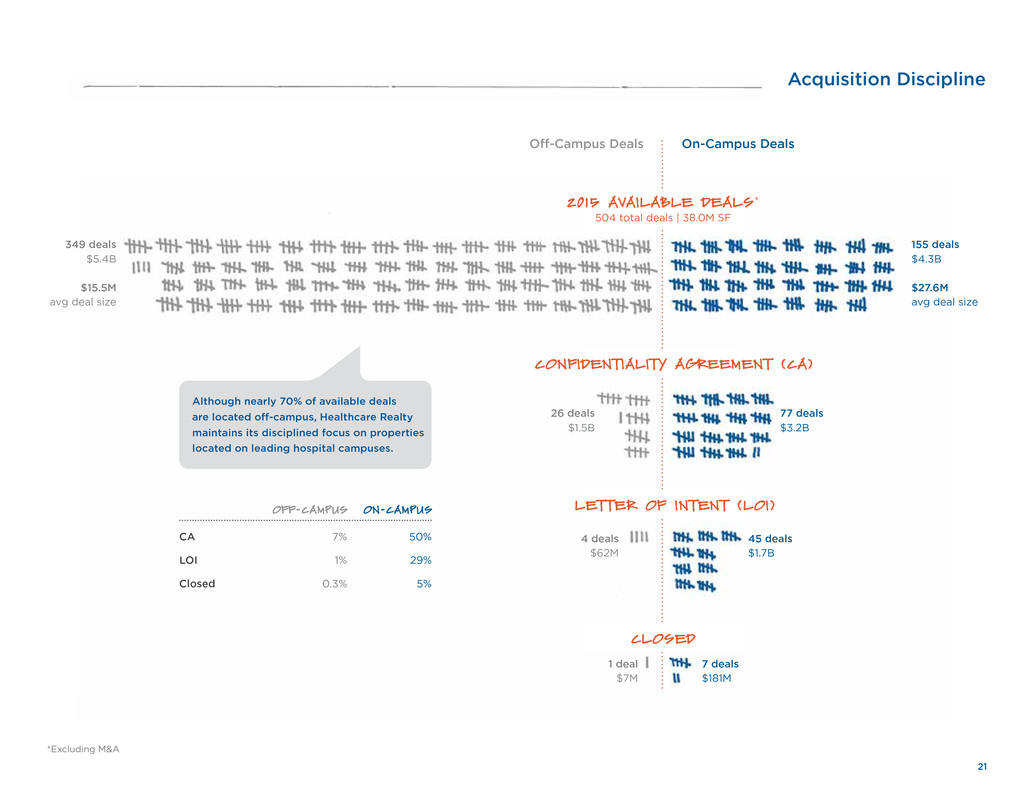
2015 AVAILABLE DEALS *
504 total deals | 38.0M SF
CONFIDENTIALITY AGREEMENT (CA)
LETTER OF INTENT (LOI)
CLOSED
Off-Campus Deals
*Excluding M&A
Although nearly 70% of available deals
are located off-campus, Healthcare Realty
maintains its disciplined focus on properties
located on leading hospital campuses.
349 deals
$5.4B
$15.5M
avg deal size
155 deals
$4.3B
$27.6M
avg deal size
26 deals
$1.5B
77 deals
$3.2B
4 deals
$62M
45 deals
$1.7B
1 deal
$7M
7 deals
$181M
OFF-CAMPUS ON-CAMPUS
CA 7% 50%
LOI 1% 29%
Closed 0.3% 5%
22
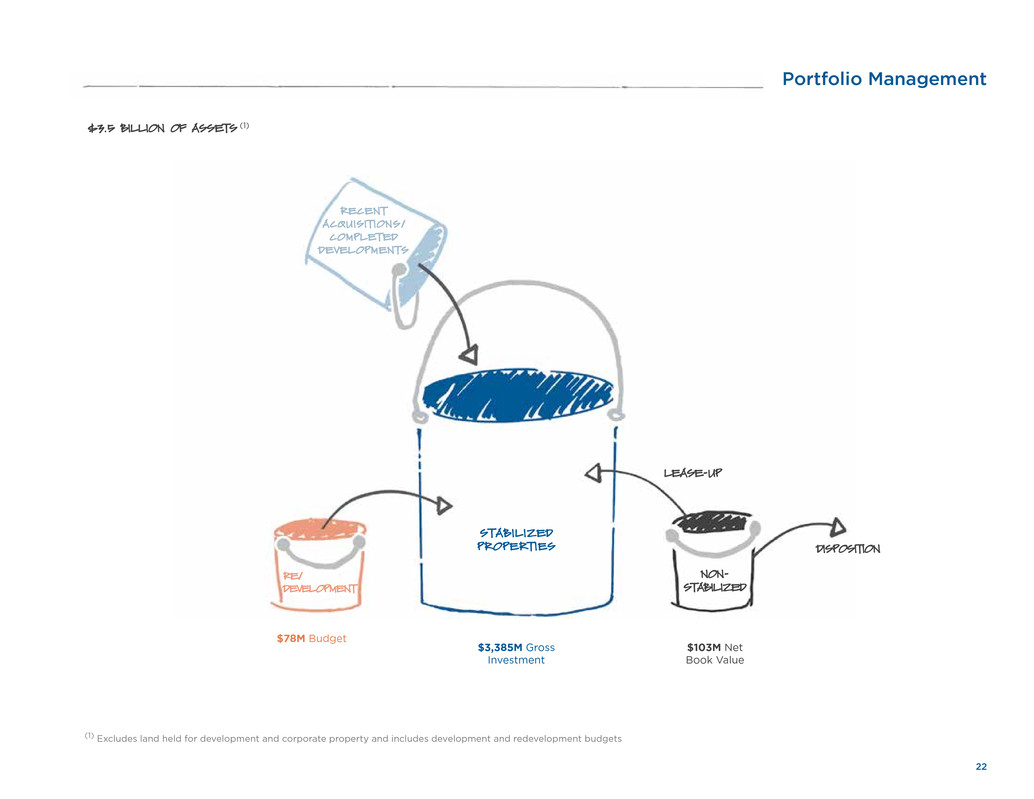
Portfolio Management
$3.5 BILLION OF ASSETS (1)
NON-
STABILIZED
STABILIZED
PROPERTIES
LEASE-UP
RECENT
ACQUISIT IONS/
COMPLETED
DEVELOPMENTS
DISPOSITION
(1) Excludes land held for development and corporate property and includes development and redevelopment budgets
$78M Budget
$3,385M Gross
Investment
$103M Net
Book Value
RE/
DEVELOPMENT
23
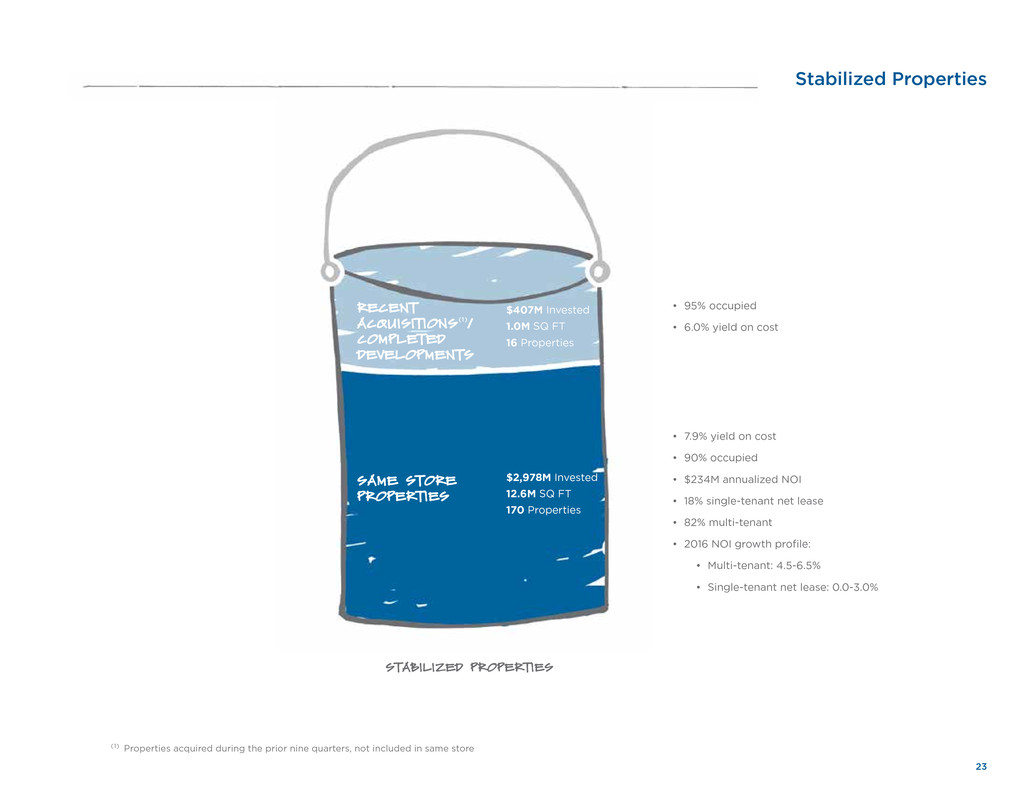
Stabilized Properties
STABILIZED PROPERTIES
• 7.9% yield on cost
• 90% occupied
• $234M annualized NOI
• 18% single-tenant net lease
• 82% multi-tenant
• 2016 NOI growth profile:
• Multi-tenant: 4.5-6.5%
• Single-tenant net lease: 0.0-3.0%
• 95% occupied
• 6.0% yield on cost
RECENT
ACQUISIT IONS (1)/
COMPLETED
DEVELOPMENTS
SAME STORE
PROPERTIES
$407M Invested
1.0M SQ FT
16 Properties
$2,978M Invested
12.6M SQ FT
170 Properties
(1) Properties acquired during the prior nine quarters, not included in same store
24
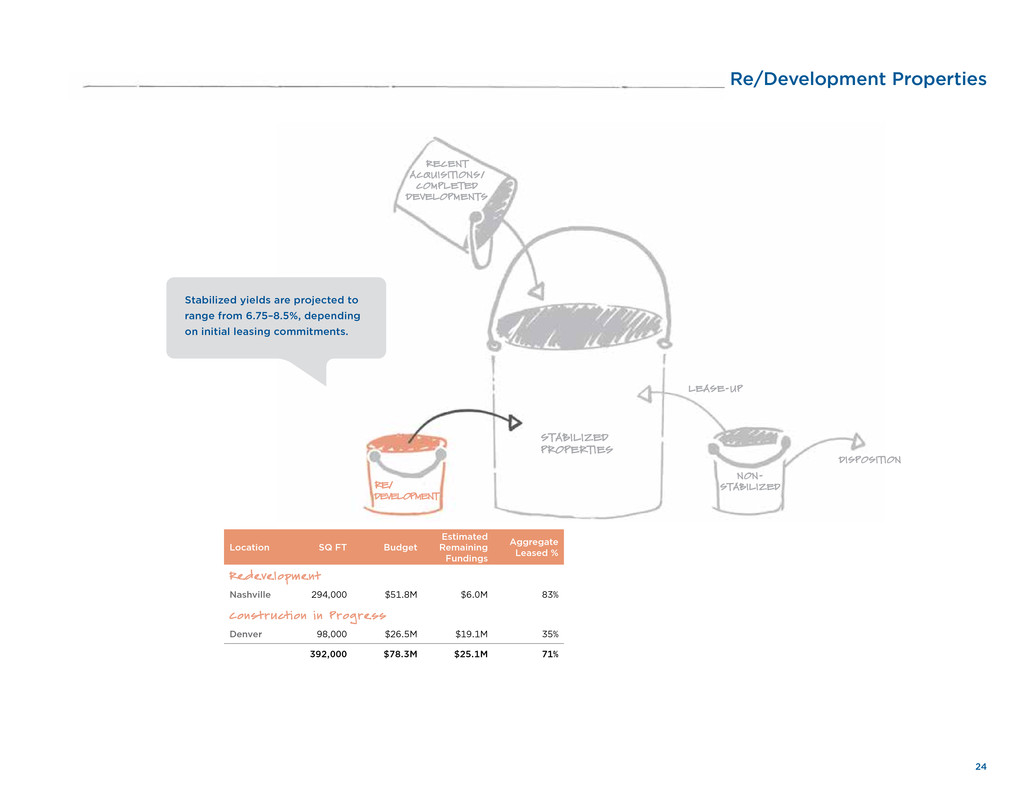
Re/Development Properties
NON-
STABILIZED
STABILIZED
PROPERTIES
LEASE-UP
RECENT
ACQUISIT IONS/
COMPLETED
DEVELOPMENTS
DISPOSIT ION
Stabilized yields are projected to
range from 6.75–8.5%, depending
on initial leasing commitments.
RE/
DEVELOPMENT
Location SQ FT Budget
Estimated
Remaining
Fundings
Aggregate
Leased %
Redevelopment
Nashville 294,000 $51.8M $6.0M 83%
Construction in Progress
Denver 98,000 $26.5M $19.1M 35%
392,000 $78.3M $25.1M 71%

25
Non-Stabilized Assets
NON-
STABILIZED
STABILIZED
PROPERTIES
LEASE-UP
RECENT
ACQUISIT IONS/
COMPLETED
DEVELOPMENTS
DISPOSITION
Through routine asset management,
Healthcare Realty recycles capital into
new assets. The Company projects
$50M–$75M in dispositions in 2016 with a
blended cap rate range of 7.5-8.5%.
RE/
DEVELOPMENT
(1) Reflects Net Book Value
REPOSITION ASSETS HELD
FOR SALE Positive NOI Negative NOI
Investment (1) $74.4M $14.4M $14.3M
Occupancy 69% 32% 88%
3Q16 NOI Annualized $4.1M ($0.7M) $2.3M
# of properties 10 6 3
SQ FT 702k 250k 128k
$23.9M sales price
116k square feet
2 properties
2016 DISPOSITIONS
26
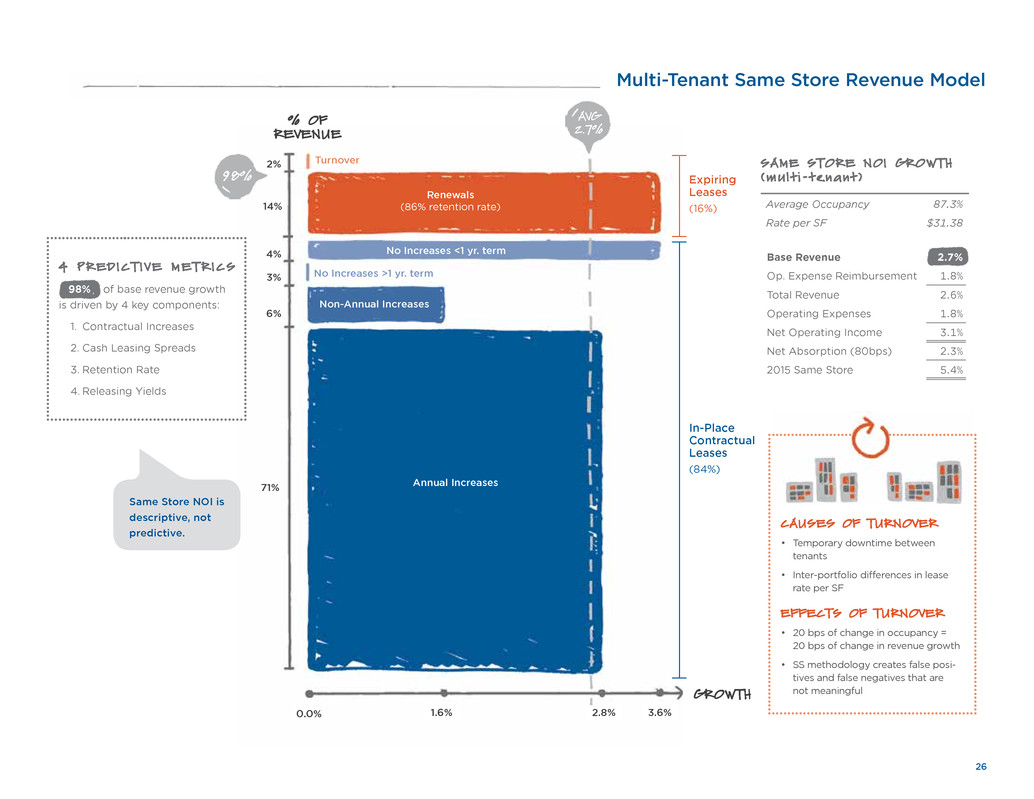
Multi-Tenant Same Store Revenue Model
CAUSES OF TURNOVER
• Temporary downtime between
tenants
• Inter-portfolio differences in lease
rate per SF
EFFECTS OF TURNOVER
• 20 bps of change in occupancy =
20 bps of change in revenue growth
• SS methodology creates false posi-
tives and false negatives that are
not meaningful
2.8%
No Increases <1 yr. term
Renewals
(86% retention rate)
Turnover
Expiring
Leases
(16%)
In-Place
Contractual
Leases
(84%)
No Increases >1 yr. term
% OF
REVENUE
Non-Annual Increases
1.6%0.0%
98%
71%
6%
3%
4%
14%
2%
AVG
2.7%
Annual Increases
3.6%
Average Occupancy 87.3%
Rate per SF $31.38
Base Revenue 2.7%
Op. Expense Reimbursement 1.8%
Total Revenue 2.6%
Operating Expenses 1.8%
Net Operating Income 3.1%
Net Absorption (80bps) 2.3%
2015 Same Store 5.4%
SAME STORE NO I GROWTH
(mu l t i - tenant )
GROWTH
98% of base revenue growth
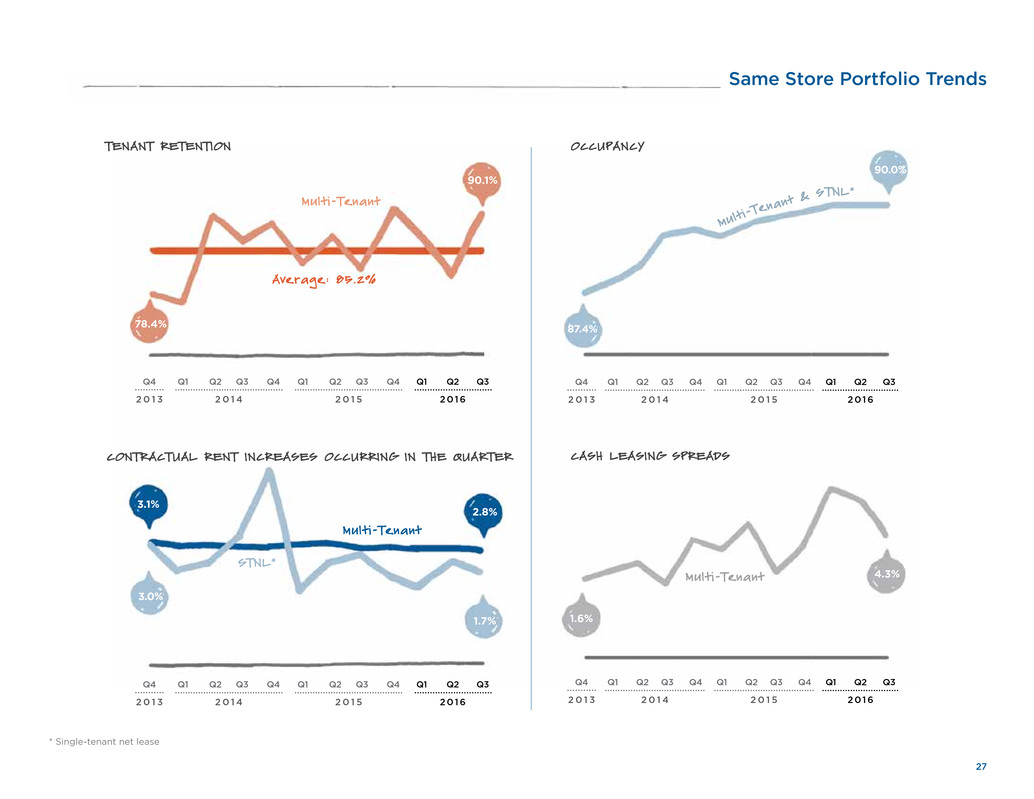
is driven by 4 key components:
1. Contractual Increases
2. Cash Leasing Spreads
3. Retention Rate
4. Releasing Yields
4 P RE D I C T I V E ME T R I C S
Same Store NOI is
descriptive, not
predictive.
27
Q4 Q1 Q2 Q3 Q4 Q1 Q2 Q3 Q4 Q1 Q2 Q3
2 0 1 3 2 0 1 4 2 0 1 5 2016
Q4 Q1 Q2 Q3 Q4 Q1 Q2 Q3 Q4 Q1 Q2 Q3
2 0 1 3 2 0 1 4 2 0 1 5 2016
Same Store Portfolio Trends
* Single-tenant net lease
Q4 Q1 Q2 Q3 Q4 Q1 Q2 Q3 Q4 Q1 Q2 Q3
2 0 1 3 2 0 1 4 2 0 1 5 2016
TENANT RETENTION OCCUPANCY
CONTRACTUAL RENT INCREASES OCCURRING IN THE QUARTER CASH LEASING SPREADS
3.0%
78.4%
3.1%
87.4%
90.0%
4.3%
90.1%
1.7%
Mult i-Tenant
Average: 85.2%
Mult i-Tenant
STNL*
Mult i-Tenant
2.8%
1.6%
Mult
i-Ten
ant &
STNL*
Q4 Q1 Q2 Q3 Q4 Q1 Q2 Q3 Q4 Q1 Q2 Q3
2 0 1 3 2 0 1 4 2 0 1 5 2016
28
2012
1,345
81.3%
1.0%
1.8
1.6
0.2
0.9
2013
1,436
80.9%
1.8%
1.7
1.0
2.7
1.6
2014
1,863
85.4%
2.3%
2.0
2.5
1.4
4.0
2015
1,581
86.0%
3.3%
3.6
5.0
2.1
3.7
2016
1,834
86.2%
5.9%
7.2
6.3
4.3
2017
1,737
%
O
F
L
E
A
S
E
D
S
F
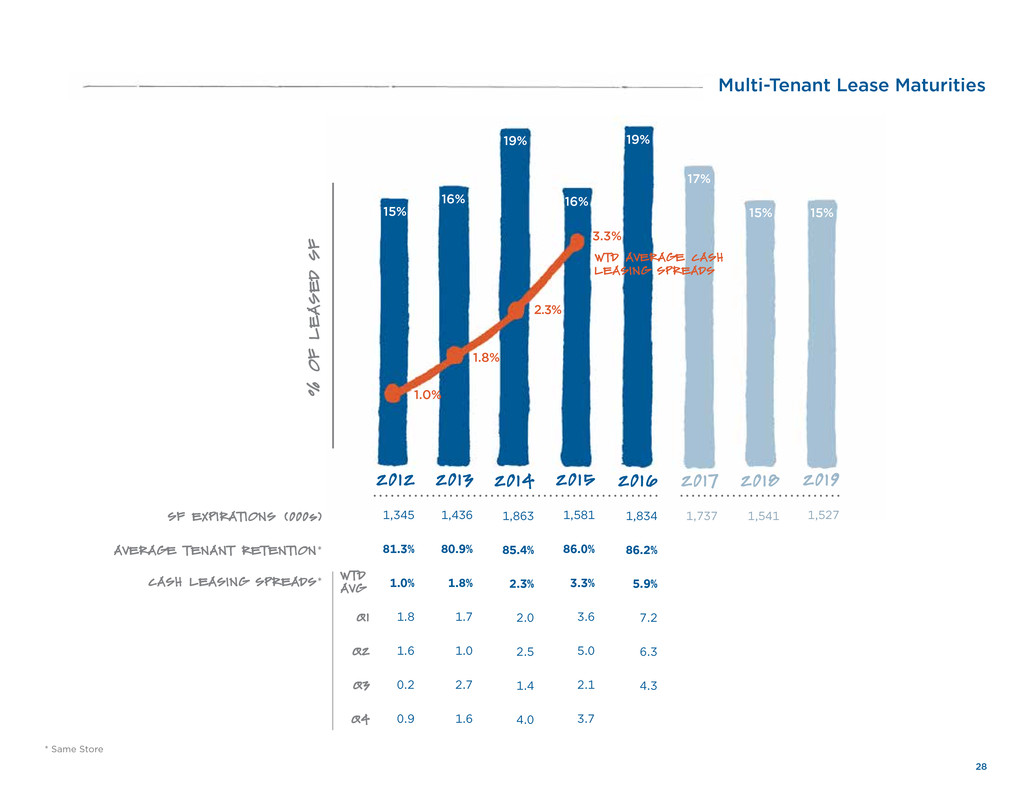
SF EXPIRATIONS (000s)
AVERAGE TENANT RETENTION*
CASH LEASING SPREADS*
Multi-Tenant Lease Maturities
WTD AVERAGE CASH
LEASING SPREADS
1.0%
1.8%
3.3%
2018
1,541
WTD
AVG
Q1
Q2
Q3
Q4
2019
1,527
* Same Store
2.3%
15%
16%
19%
16%
19%
17%
15% 15%
29
OLD RENT TERM
NEW RENT TENANT IMPROVEMENTS
GROSS INVESTMENT RENT CONCESSIONS
RENT BUMP LEASING COMMISSIONS
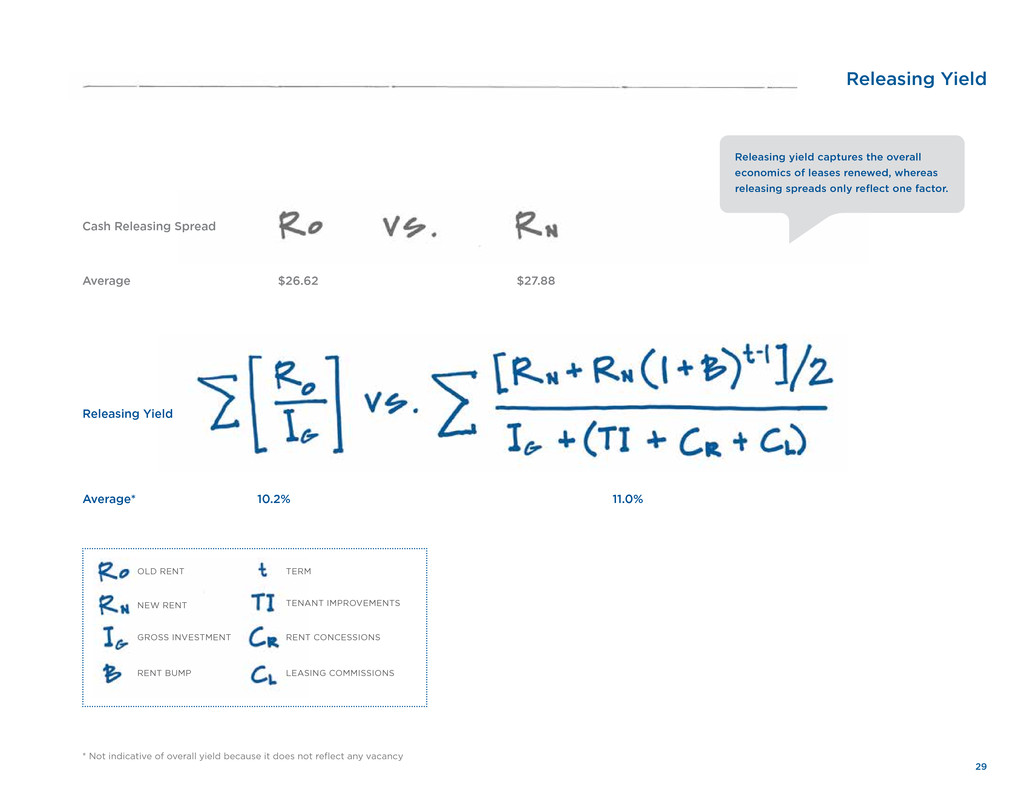
Cash Releasing Spread
Average
Releasing Yield
Average*
Releasing Yield
10.2% 11.0%
$26.62 $27.88
* Not indicative of overall yield because it does not reflect any vacancy
Releasing yield captures the overall
economics of leases renewed, whereas
releasing spreads only reflect one factor.

30
<0% 0%
50%
1% 2% 3% 4% 5% >6%
2012
WTD AVG
1.0%
2014
WTD AVG
2.3%
2016
WTD AVG
5.9%
0%
40%
30%
20%
10%
6%
CASH LEAS ING
SPREAD
D ISTR IBUT ION
2016 YTD
2014
2012
1%
18%
22%
13%
31%
44%
49%
30%
22%
37%
21%
12%
2012
2014
20
16
20
16
20
14
201
2
Cash Leasing Spread Distribution
31
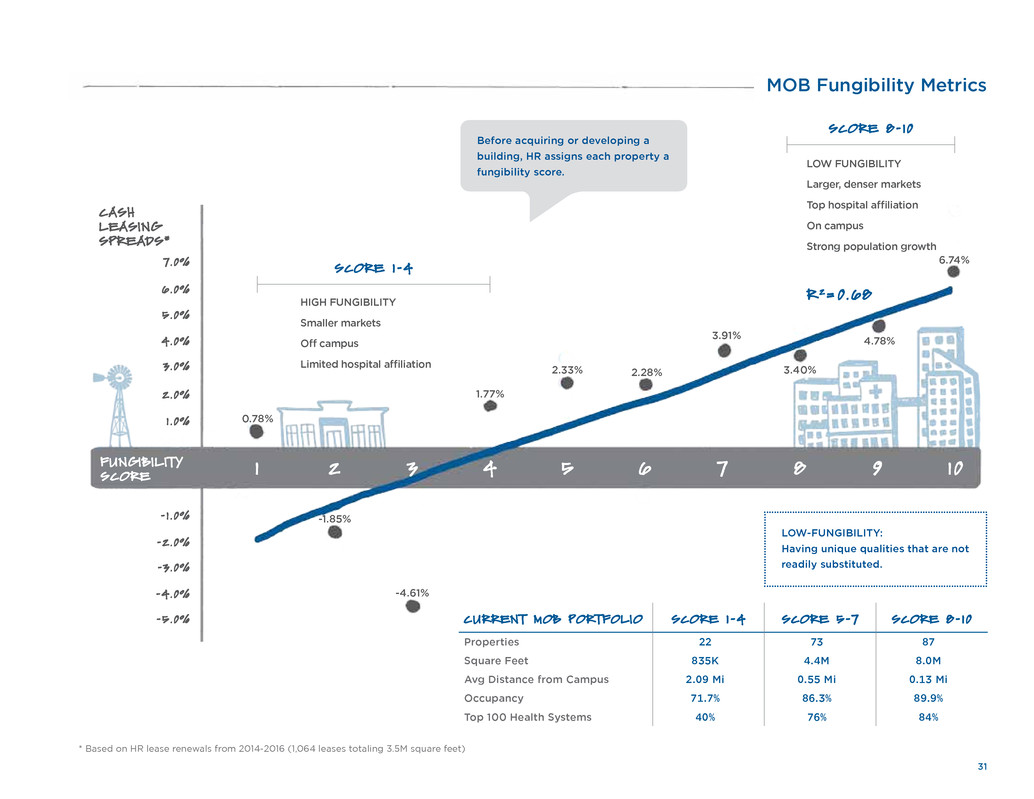
MOB Fungibility Metrics
-1 .0%
1.0%
2.0%
3.0%
4.0%
5.0%
6.0%
FUNGIBILITY
SCORE 1 2 3 4 5 6 7 8 9 10
CASH
LEASING
SPREADS*
* Based on HR lease renewals from 2014-2016 (1,064 leases totaling 3.5M square feet)
CURRENT MOB PORTFOLIO SCORE 1-4 SCORE 5-7 SCORE 8-10
Properties 22 73 87
Square Feet 835K 4.4M 8.0M
Avg Distance from Campus 2.09 Mi 0.55 Mi 0.13 Mi
Occupancy 71.7% 86.3% 89.9%
Top 100 Health Systems 40% 76% 84%
HIGH FUNGIBILITY
Smaller markets
Off campus
Limited hospital affiliation
SCORE 1-4
LOW FUNGIBILITY
Larger, denser markets
Top hospital affiliation
On campus
Strong population growth
SCORE 8-10
LOW-FUNGIBILITY:
Having unique qualities that are not
readily substituted.
Before acquiring or developing a
building, HR assigns each property a
fungibility score.
0.78%
-1.85%
-4.61%
1.77%
2.33% 2.28%
3.91%
3.40%
4.78%
6.74%7.0%
-2.0%
-3.0%
-4.0%
-5.0%
R 2= 0.68

32
HR MOB Portfolio Evolution
1
2
3
4
5
6
7
8
9
10
2006
F
U
N
G
IB
IL
IT
Y
S
C
O
R
E
20 1 1 2016
SF CHANGE
(2006-2016)
7.3%
24.2%
29.0%
14.2%
13.2%
5.9%
2.7%
2.1%
1.4%
0.1%
6.2%
23.0%
19.9%
9.9%
13.8%
8.6%
9.2%
5.1%
2.5%
1.7%
5.5%
22.8%
18.9%
8.4%
11.4%
12.3%
8.1%
6.7%
3.5%
2.5%
+ 497K
+ 1.3M
+ 2.2M
+ 1.2M
+ 780K
- 268K
- 336K
- 296K
- 114K
- 191K
WTD AVG
6.5
WTD AVG
6.8
WTD AVG
7.5
100% 100% 100%
8,504,364 SF 12,648,255 SF 13,244,839 SF 4,740,475 SF
33
Capital Stack and Maturities
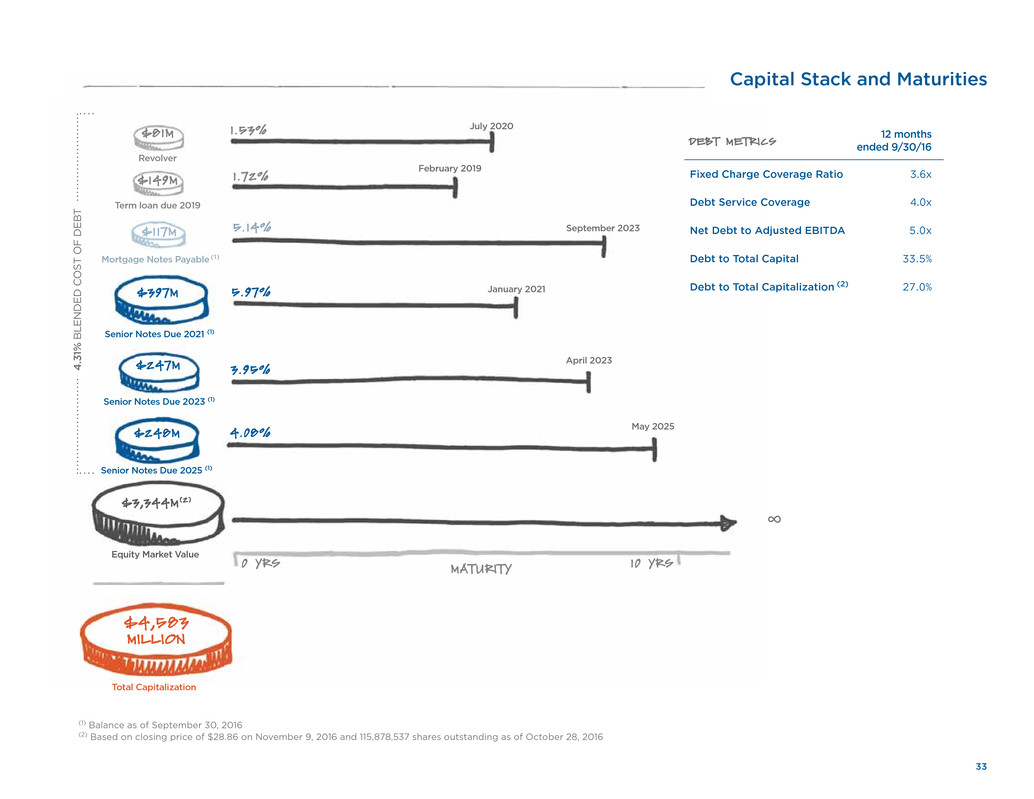
$81M
$247M
$248M
$397M
$117M
$3,344M(2)
Revolver
Senior Notes Due 2023 (1)
Senior Notes Due 2025 (1)
Senior Notes Due 2021 (1)
Mortgage Notes Payable (1)
Equity Market Value
$4,583
MILLION
July 2020
May 2025
1 .53%
January 2021
April 2023
September 2023
∞
0 YRS 10 YRS
4.08%
5.97%
3.95%
5.14%
(1) Balance as of September 30, 2016
(2) Based on closing price of $28.86 on November 9, 2016 and 115,878,537 shares outstanding as of October 28, 2016
DEBT METRICS 12 months ended 9/30/16
Fixed Charge Coverage Ratio 3.6x
Debt Service Coverage 4.0x
Net Debt to Adjusted EBITDA 5.0x
Debt to Total Capital 33.5%
Debt to Total Capitalization (2) 27.0%
MATURITY
Total Capitalization
4
.3
1%
B
LE
N
D
E
D
C
O
ST
O
F
D
E
B
T
$149M
Term loan due 2019
February 2019
1 .72%
34
Healthcare Realty
Healthcare Realty Trust is a real estate investment trust that integrates owning, managing, financing
and developing real estate properties associated primarily with the delivery of outpatient healthcare
services throughout the United States. As of September 30, 2016, the Company had investments of
approximately $3.5 billion in 202 real estate properties located in 29 states totalling approximately
14.5 million square feet. The Company provided leasing and property management services to approxi-
mately 10.1 million square feet nationwide.
