Attached files
| file | filename |
|---|---|
| 8-K - FORM 8-K - FIRST SOUTH BANCORP INC /VA/ | v457977_8k.htm |
Exhibit 99.1

Appendix NASDAQ: FSBK February 2017

2 CAUTIONARY NOTE REGARDING FORWARD - LOOKING STATEMENTS Certain statements in this presentation may contain “forward - looking statements” within the meaning of the Private Securities Litigation Reform Act of 1995 , such as statements relating to future plans and expectations, and are thus prospective . Such forward - looking statements include but are not limited to statements with respect to plans, objectives, expectations, and intentions and other statements that are not historical facts, and other statements identified by words such as “believes,” “expects,” “anticipates,” “estimates,” “intends,” “plans,” “targets,” and “projects,” as well as similar expressions . Such statements are subject to risks, uncertainties, and other factors which could cause actual results to differ materially from future results expressed or implied by such forward - looking statements . Although we believe that the assumptions underlying the forward - looking statements are reasonable, any of the assumptions could prove to be inaccurate . Therefore, we can give no assurance that the results contemplated in the forward - looking statements will be realized . The inclusion of this forward - looking information should not be construed as a representation by First South Bancorp, Inc . (the “Company”), or any person that such future events, plans, or expectations will occur or be achieved . FACTORS THAT COULD CAUSE ACTUAL RESULTS TO DIFFER MATERIALLY FROM THE RESULTS ANTICIPATED MAY INCLUDE, BUT ARE NOT LIMITED TO, THE FOLLOWING : ( 1 ) competitive pressures among depository and other financial institutions may increase significantly and have an effect on pricing, spending, third - party relationships and revenues ; ( 2 ) the strength of the United States economy in general and the strength of the local economies in which we conduct operations may be different than expected resulting in, among other things, a deterioration in the credit quality or a reduced demand for credit, including the resultant effect on the Company’s loan portfolio and allowance for loan losses ; ( 3 ) the rate of delinquencies and amounts of charge - offs, the level of allowance for loan loss, the rates of loan growth, or adverse changes in asset quality in our loan portfolio, which may result in increased credit risk - related losses and expenses ; ( 4 ) the risk that the preliminary financial information reported herein and our current preliminary analysis will be different when our review is finalized ; ( 5 ) changes in the U . S . legal and regulatory framework ; ( 6 ) adverse conditions in the stock market, the public debt market and other capital markets (including changes in interest rate conditions) could have a negative impact on the Company . All subsequent written and oral forward - looking statements concerning the Company or any person acting on its behalf is expressly qualified in its entirety by the cautionary statements above . We do not undertake any obligation to update any forward - looking statement to reflect circumstances or events that occur after the date the forward - looking statements are made .

3 C h arlo t t e Ash eville Washington Fayetteville W il m ing t on h Winston Salem Gr e e ns boro Elizabeth City Morehead City FIRST SOUTH AT A GLANCE 4 th Oldest Active Bank Headquartered in North Carolina • Headquarters in Washington, NC • 30 offices • NASDAQ: FSBK Key Franchise Highlights (1) Attractive Footprint • Established in 1902 D u rham Greenville Raleig Rocky Mount Lum ber t on • Market Cap.: $116 million 2016 Financial Highlights (1) Market data as of January 26, 2017 (*) See non - GAAP reconciliation at the end of the presentation Source: SNL Financial LC • Avg. Daily Volume (1 Year): 6,401 • Trading Price: $12.20 per share Balance Sheet Assets ($MM) Net Loans HFI ($MM) $991 $692 Income Statement Net Income ($MM) R O A A ( % ) $6.96 0 . 72 % Deposits ($MM) $871 ROAE (%) 8 . 0 % • P/TBV (2016): 142% Trust Preferred ($MM) $10 Adj. Pre - Tax Pre - Prov. Operating Rev. ($MM)* $10 . 8 5 Tang. Common Equity ($MM) $81 Adj. PTPP Op. Rev./ Avg. Assets (%)* 1 . 13 % • P/E (2016): 16.7x • Dividend Yield: 1.0% TCE Ratio (%) 8.3% Net Interest Margin (%) 3.71% TBV per share ($) $8.57 Nonint. Exp. / Avg. Assets (%) 3.73% NPAs / Assets (%) 0.63% Nonint. Inc. / Avg. Assets (%) 1.48% Reserves / Total Gross Loans (%) 1.23% EPS ($) $0.73

4 OUR EXECUTIVE TEAM J. Randy Woodson Sherry Correll Nick Nicholson Bruce W. Elder Position: President & CEO First South Tenure: 5 years Banking Experience: 33 years Experienc e : Crescent Financial, Mutual Community Savings Position: Chief Banking Officer First South Tenure: 9 years Banking Experience: 33 years Experienc e : Crestar, Valley Bank Position: Director of Bank Operations First South Tenure: 32 years Banking Experience: 41 years Experienc e : People’s Bank, Southern Bank Scott McLean Position: Chief Financial Officer First South Tenure: 5 years Banking Experience: 29 years Experienc e : KeySource, Bank of America, Federal Reserve Position: Chief Credit Officer First South Tenure: 11 years Banking Experience: 34 years Experienc e : Wachovia, United Carolina Bank Position: Director of Mortgage Banking First South Tenure: 15 years Banking Experience: 38 years Experienc e : United Federal Bank Paul Jaber

5 COMPANY TURNAROUND (1) Corresponding share prices do not include dividends Source: SNL Financial; market data as of January 26, 2017 Total Return and Key Company Highlights Since 2011 Bruce Elder hired as CEO Reinstated Common Dividend Sold Problem Loan Portfolio Acquired 9 Bank of America Branches Consolidated/Closed Six Branches ▪ Bruce Elder hired as CEO and Scott McLean hired as CFO in 2012 ▪ Initiated a transformative strategic plan in September 2012 focused on: - Improving the quality of earning assets - Enhancing franchise value through expansion of the geographic footprint and customer base - Investing in new and existing markets to grow the franchise - Executing plans to improve financial performance and build shareholder value - Consolidating six branches (two more in process) - Continuing to rationalize entire branch network ▪ Acquired 9 Eastern NC Bank of America branches in December of 2014 - $172.7 million of deposits transferred - $1.3 million of loans transferred ▪ Company now positioned to deliver stronger financial performance through greater efficiencies T u r n ar oun d Announced Consolidation of Two Branches $12.20 $10.81 $9.26 $7.82 $6.39 $4.80 Share Price (1) $3.20
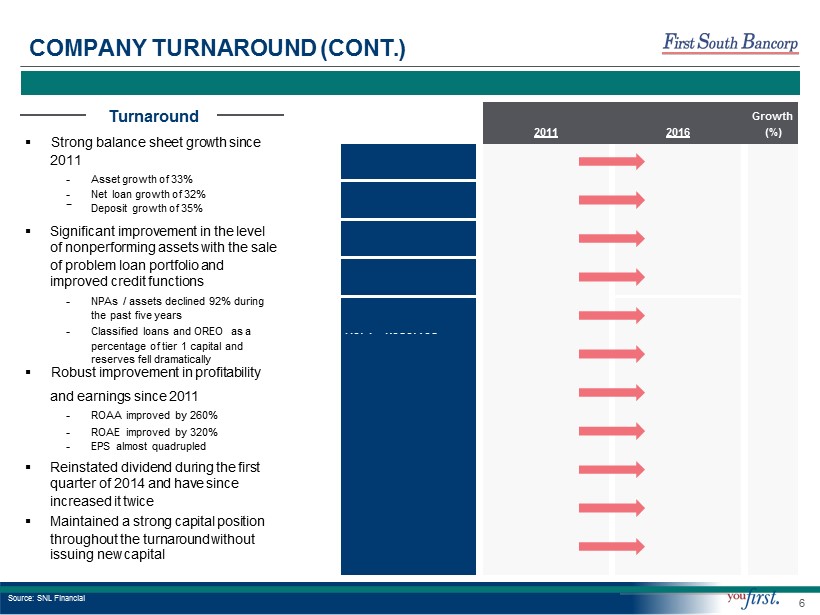
COMPANY TURNAROUND (CONT.) ▪ Strong balance sheet growth since ▪ Robust improvement in profitability Strong Growth and Improved Health Turnaround Growth 2011 2016 (%) 2011 Assets ($000s) - Asset growth of 33% 746,941 990,637 33 - Net loan growth of 32% - Deposit growth of 35% Total Net Loans ($000s) 525,202 691,969 32 ▪ Significant improvement in the level of nonperforming assets with the sale Deposits ($000s) 642,617 870,600 35 of problem loan portfolio and improved credit functions NPAs / Assets (%) 8.04 0.63 - 92 - NPAs / assets declined 92% during the past five years Classified + OREO / 95.7 12.6 - 87 - Classified loans and OREO as a Tier 1 + Reserves percentage of tier 1 capital and reserves fell dramatically ROAA (%) 0.20 0.72 260 and earnings since 2011 - ROAA improved by 260% ROAE (%) 1.9 8.0 320 - ROAE improved by 320% - EPS almost quadrupled EPS ($) 0.16 0.73 356 ▪ Reinstated dividend during the first quarter of 2014 and have since Dividends / Share ($) 0.00 0.12 NA increased it twice ▪ Maintained a strong capital position TCE Ratio (%) 10.8 8.3 - 23 throughout the turnaround without issuing new capital TBV / Share ($) 8.06 8.57 6 Source: SNL Financial 6
7 EFFECTIVE BUSINESS MODEL Full Service Community Bank ▪ Provide retail and commercial services demanded by consumers in our markets ▪ Commercial platform with products and services focused on small - to mid - sized businesses ▪ Significant retail delivery platform ▪ Strong mortgage expertise ▪ Unique business lines and services distinguish First South Bank from other North Carolina community banks Focus On Operating Performance ▪ 2016 return on average assets of 0.72%, up significantly from last year ▪ 2016 return on average equity of 8.0% and efficiency ratio of 76.5%, significantly improved since last year ▪ Recently recognized by SNL Financial as having one of the fastest rates of year - over - year quarterly operating revenue growth for community banks with total assets less than $1 billion - Business Lines & Services ▪ Mortgage servicing ▪ Equipment leasing ▪ Investments through LPL ▪ Streamlined merchant bankcard process ▪ Significant investment in mobile banking ▪ SBA servicing and loan sales Ranked 10 th out of 116 in terms of number of SBA loan originations in North Carolina Strategic Opportunities ▪ Continue to evaluate branch network to determine whether or not additional branch consolidations or market exits make financial sense ▪ Investing in Raleigh, Durham, Wilmington, and Williamston, NC ▪ The Board continues to prudently explore potential whole - bank and branch acquisition opportunities

8 7.1% 6.8% 4.7% 3.8% OPERATING IN TOP NORTH CAROLINA ECONOMIES Source: SNL Financial; NC Department of Commerce; Wake County Economic Development; Research Triangle Park The NC Triangle Top Employers & Institutions Fayetteville Top Employers & Institutions Greenville Top Employers & Institutions Wilmington Top Employers & Institutions ▪ The NC Triangle (Raleigh - Durham - Chapel Hill) is home to Research Triangle Park, a prominent technology hub with more than 200 companies and over 50,000 workers ▪ The NC Triangle is also supported by three major research universities: UNC Chapel Hill, Duke University, and NC State University ▪ Fayetteville is home to Fort Bragg, one of the largest military bases in the world ▪ The Greenville economy is supported by East Carolina University and robust employers like Vidant Medical Center ▪ Wilmington’s strong coastal economy is supported by commercial ports, UNC Wilmington, tourism, and major employers like Verizon Vibrant Economies Projected Population Growth (2017 to 2022) 8.2% NC (5 . 0 % ) USA (3 . 8 % )

9 COMPETITIVE POSITIONING (1) Community banks defined as banks with less than $10 billion in assets; excludes merger targets and RBC Bank (Georgia), National Association Note: Financial data as of the most recent period available; certain bank level data shown Source: SNL Financial LC First South is the 11 th Largest Community Bank Headquartered in North Carolina (1) Positioned for Growth ▪ There are relatively few community banking franchises left in North Carolina near the $1 billion asset threshold due to the ongoing wave of consolidation ▪ The higher performance of larger institutions is attributable to their increased scale and ability to absorb operating and regulatory expenses ▪ We are nimble enough to deliver strong customer service and competitive products through talented, experienced bankers with local decision - making authority but large enough to begin reaping the benefits of enhanced scale R a nk (#) Company C i t y Assets ( $000 s ) LTM R O A A (%) 1 Bank of America Corporation Charlotte 2 , 187 , 702 , 00 0 0.82 2 BB&T Corporation Winston - Salem 219 , 276 , 00 0 1.12 3 First Citizens BancShares, Inc. Raleigh 32 , 990 , 83 6 0.70 4 Capital Bank Financial Corp. Raleigh 7 , 792 , 45 8 0.81 5 First Bancorp Southern Pines 3 , 537 , 48 0 0.77 6 Park Sterling Corporation Charlotte 3 , 226 , 93 8 0.62 7 HomeTrust Bancshares, Inc. Asheville 2 , 754 , 10 9 0.46 8 Southern BancShares (N.C.), Inc. Mount Olive 2 , 491 , 10 8 0.60 9 Live Oak Bancshares, Inc. Wilmington 1 , 669 , 74 0 1.11 10 Paragon Commercial Corporation Raleigh 1 , 503 , 76 7 0.95 11 Fidelity BancShares (N.C.), Inc. Fuquay - Varina 1 , 419 , 26 5 0.52 12 Entegra Financial Corp. Franklin 1 , 292 , 87 7 0.55 13 Peoples Bancorp of North Carolina, Inc. Newton 1 , 087 , 99 1 0.85 14 First South Bancorp, Inc. Washington 990 , 63 7 0.72 15 Piedmont Federal Savings Bank Winston - Salem 898 , 64 9 0.29 16 Select Bancorp, Inc. Dunn 844 , 77 4 0.83 17 ASB Bancorp, Inc. Asheville 797 , 24 0 0.70 18 North State Bancorp Raleigh 752 , 66 9 1.06 19 Four Oaks Fincorp, Inc. Four Oaks 722 , 85 6 0.49 20 F & M Financial Corporation Salisbury 574 , 95 2 0.65 21 Uwharrie Capital Corp Albemarle 552 , 21 2 0.36 22 Oak Ridge Financial Services, Inc. Oak Ridge 380 , 95 7 0.71 23 Carolina Trust BancShares, Inc. Lincolnton 372 , 16 9 0.29 24 First Federal Savings Bank of Lincolnton Lincolnton 369 , 31 7 0.87 34 Other Institutions 5 , 414 , 37 6
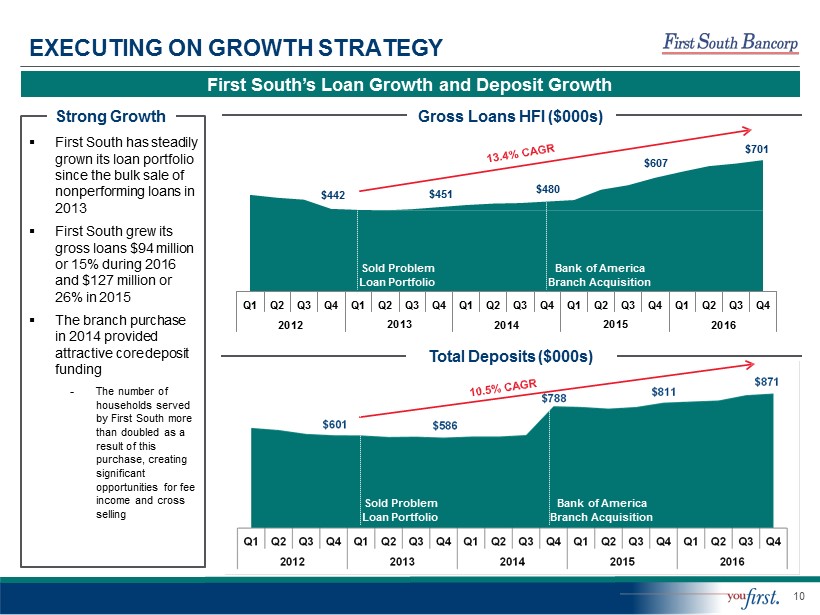
10 $442 $451 $480 $607 $701 Q 4 Q 1 Q 2 Q 3 Q4 2 0 1 2 Q 1 Q 2 Q 3 Q 4 Q 1 Q 2 Q3 2 0 1 3 2 0 1 4 Q 4 Q 1 Q 2 Q 3 Q 4 Q 1 Q 2 Q3 2 0 1 5 2 0 1 6 EXECUTING ON GROWTH STRATEGY First South’s Loan Growth and Deposit Growth Total Deposits ($000s) ▪ First South has steadily grown its loan portfolio since the bulk sale of nonperforming loans in 2013 ▪ First South grew its gross loans $94 million or 15% during 2016 and $127 million or 26% in 2015 ▪ The branch purchase in 2014 provided attractive core deposit funding - The number of households served by First South more than doubled as a result of this purchase, creating significant opportunities for fee income and cross selling Strong Growth Gross Loans HFI ($000s) Bank of America Branch Acquisition Bank of America Branch Acquisition Sold Problem Loan Portfolio Sold Problem Loan Portfolio
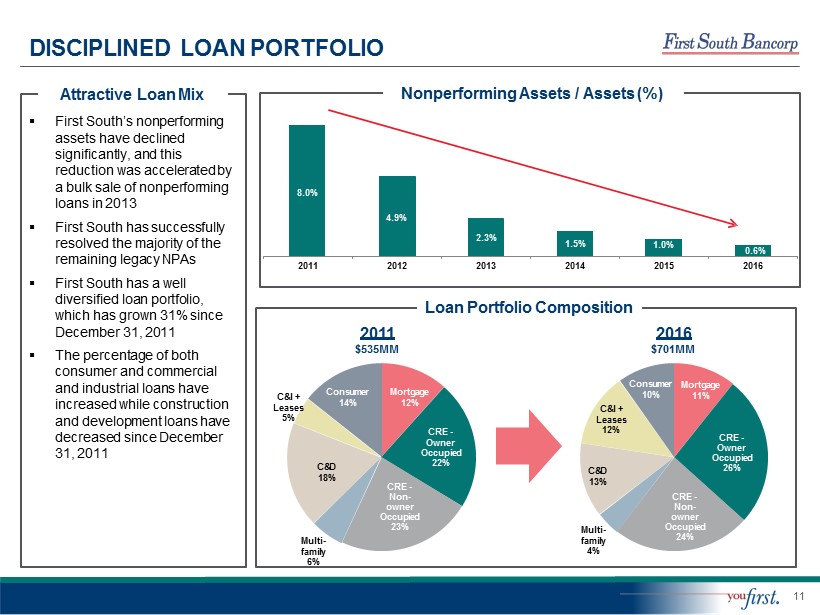
11 M o r tgage 11% CRE - Owner Oc c upied 26% CRE - Non - owner Oc c upied 24% M ulti - family 4% C&D 13% C&I + Le ase s 12% Consumer 10% M o r tgage 12% CRE - Owner Oc c upied 22% CRE - Non - owner O cc upi e d 23% M ulti - family 6% C&D 18% C&I + Le ase s 5% Consumer 14% 8.0% 4.9% 2.3% 1.5% 1.0% 0.6% 2011 2012 2013 2014 2015 2016 DISCIPLINED LOAN PORTFOLIO ▪ First South’s nonperforming assets have declined significantly, and this reduction was accelerated by a bulk sale of nonperforming loans in 2013 ▪ First South has successfully resolved the majority of the remaining legacy NPAs ▪ First South has a well diversified loan portfolio, which has grown 31% since December 31, 2011 ▪ The percentage of both consumer and commercial and industrial loans have increased while construction and development loans have decreased since December 31, 2011 Attractive Loan Mix Nonperforming Assets / Assets (%) Loan Portfolio Composition 2011 $ 5 3 5 M M 2016 $ 7 0 1 M M

12 1.09% 0.73% 0.47% 0.43% 0.38% 0.41% 2011 2012 2013 2014 2015 2016 Nonint. Bea r ing 23% Interest Bea r ing Demand 22% S a v ings 17% M oney M a r k e t 9% T ime 29% Nonint. Bea r ing 15% Int eres t Bea r ing Demand 20% Sa v ings Money 5% Market 2% T ime 58% DEPOSIT COMPOSITION Cost of Funds (%) Deposit Composition 2011 $ 6 4 3 M M 2016 $ 8 7 1 M M ▪ The branch purchase significantly improved First South’s deposit base - The purchase lowered the cost of funds significantly as only 23% of the acquired balances were certificates of deposit ▪ First South has greatly increased its level of non - time deposit funding as time deposits have shrunk by half as a percentage of total deposits ▪ First South has increased its percentage of noninterest bearing deposits Improving Deposit Mix

13 $9 , 799 $9 , 251 $8,456 $12 , 840 $13 , 589 1.34% 1.34% 1.17% 1.43% 1.41% 2012 2013 2014 Core Noninterest Income ($000s) 201 5 2016 Core Noninterest Income / AA (%) REVENUE TRENDS First South’s Revenue Growth ▪ First South has grown its net interest income but its margin initially declined as a result of the acquired branches ▪ First South’s net interest margin rebounded in 2016 as further progress was made in redeploying the acquired deposits and changing the earning assets mix ▪ First South’s noninterest income has increased significantly and has benefited from the branch purchase ▪ In 2016, First South purchased mortgage servicing rights to $84 million of mortgage loans, 75% of which are secured by properties located in the Bank’s current footprint, to leverage its mortgage servicing infrastructure and provide cross selling opportunities Core Noninterest Income* Revenue Growth Net Interest Margin $29 , 894 $26 , 826 $26 , 427 $29 , 396 $32 , 605 4.43% 4.34% 4.06% 3.64% 3.71% 2012 2016 2013 2014 Net Interest Income ($000s) 2015 NIM (%) (*) See non - GAAP reconciliation at the end of the presentation
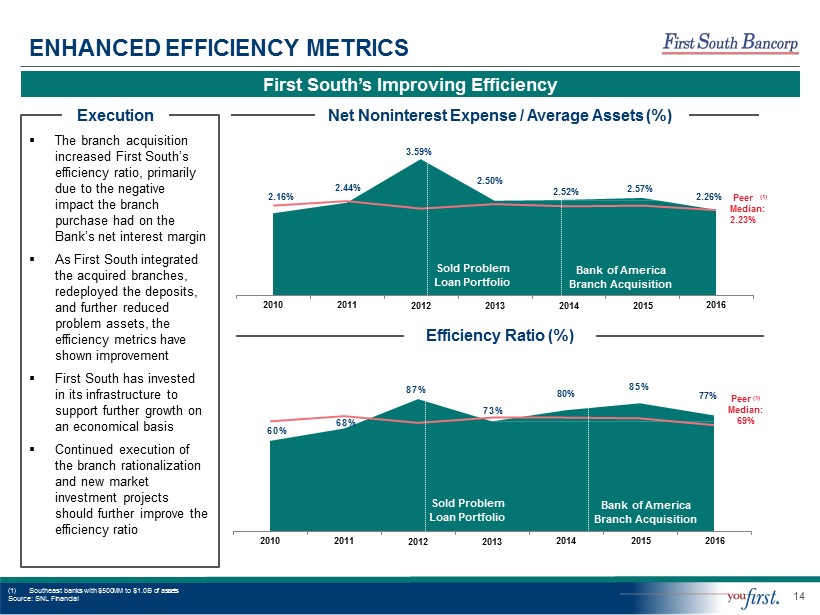
14 ENHANCED EFFICIENCY METRICS First South’s Improving Efficiency ▪ The branch acquisition increased First South’s efficiency ratio, primarily due to the negative impact the branch purchase had on the Bank’s net interest margin ▪ As First South integrated the acquired branches, redeployed the deposits, and further reduced problem assets, the efficiency metrics have shown improvement ▪ First South has invested in its infrastructure to support further growth on an economical basis ▪ Continued execution of the branch rationalization and new market investment projects should further improve the efficiency ratio Efficiency Ratio (%) Execution Net Noninterest Expense / Average Assets (%) 2.16% 2.44% 3.59% 2.50% 2.52% 2.57% 2 . 26 % 2010 2011 2016 Bank of America Branch Acquisition 2014 2015 Sold Problem Loan Portfolio 2012 2013 60% 68% 87% 73% 80% 85% 77% 2010 2011 2014 2015 2016 Bank of America Branch Acquisition Sold Problem Loan Portfolio 2012 2013 Peer ( 1 ) M e d i a n : 2 . 23 % (1) Southeast banks with $500MM to $1.0B of assets Source: SNL Financial Peer (1) M e d i a n: 69%

15 CREATING SHAREHOLDER VALUE Adjusted Pre - Tax Pre - Provision Earnings ($)* Core ROAA and ROAE (%)* ▪ First South’s profitability increased in 2016 compared to 2015 primarily driven by increased interest income from significant growth in the loan portfolio ▪ Pre - tax, pre - provision operating revenue to average assets, Core ROAA, and Core ROAE increased in 2016 ▪ 2015 results reflect the integration of the branch acquisition ▪ Acquired deposits were fully redeployed in the loan portfolio 18 months after the acquisition, resulting in higher second half of 2016 earnings Execution $12,873 $10,206 $8,724 $6,918 $10,847 1.76% 1.48% 1 . 21 % 0 . 77 % 1 . 13 % 2012 201 3 2014 Pre - Tax Pre - Provision Operating Earnings ($) 2015 2016 PTPP Operating Earnings / AA (%) (7.0%) (0.81%) 7.8% 0 . 87% 7.0% 0 . 76 % 5.4% 0 . 49% 8.0% 0 . 72 % 2012 2013 2014 2015 2016 Core ROAA (%) Core ROAE (%) (*) See non - GAAP reconciliation at the end of the presentation

16 ($1.13) $0.62 $0 . 42 $0 . 49 $0.73 2012 2013 2014 2015 2016 CREATING SHAREHOLDER VALUE (CONT.) Earnings Per Share ($) ▪ First South’s turnaround efforts have driven strong shareholder results ▪ Earnings per share have increased meaningfully over prior years ▪ Tangible book value per share has also grown attractively ▪ First South has reinstated a dividend ▪ Internal capital generation was more than sufficient to support the robust balance sheet growth in 2016 Execution $ - $ - $0 . 10 $0 . 10 $0 . 12 2012 2016 Dividends Per Share ($) $7.22 $7.32 $7 . 67 $8.02 $8.57 2012 2013 2014 2015 2016 2013 2014 2015 Tangible Book Value Per Share ($)
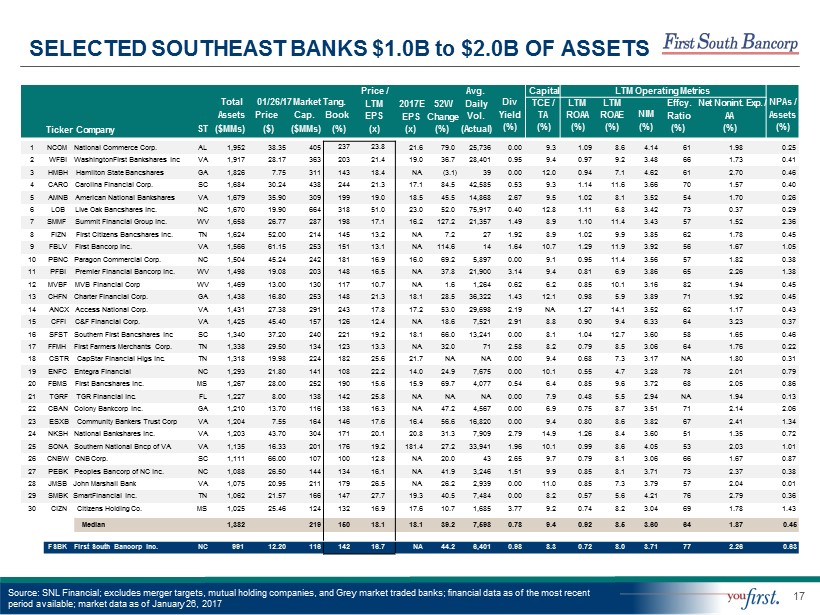
17 SELECTED SOUTHEAST BANKS $1.0B to $2.0B OF ASSETS Source: SNL Financial; excludes merger targets, mutual holding companies, and Grey market traded banks; financial data as of the most recent period available; market data as of January 26, 2017 Ticker Company Total A ss e ts ST ($MMs) 01/26/17 Market Tang. Price Cap. Book ($) ($MMs) (%) Price / L T M EPS (x) 2017E 52W EPS Change (x) (%) Avg. Daily Vol. ( A c t u a l ) Div Y i e l d (%) Capital LTM Operating Metrics NPAs / A ss e ts (%) TCE / TA ( % ) LTM R O A A (%) LTM R O A E (%) N I M ( % ) Effcy. Net Nonint. Exp. / Ratio AA (%) (%) 1 NCOM National Commerce Corp. AL 1,952 38 . 3 5 405 237 23.8 21 . 6 79.0 25 , 73 6 0.00 9.3 1 . 0 9 8.6 4.14 61 1.98 0 . 2 5 2 WFBI WashingtonFirst Bankshares Inc VA 1,917 28 . 1 7 363 203 21.4 19 . 0 36.7 28 , 40 1 0.95 9.4 0 . 9 7 9.2 3.48 66 1.73 0 . 4 1 3 HMBH Hamilton State Bancshares GA 1,826 7 . 7 5 311 143 18.4 NA (3.1) 39 0.00 12.0 0 . 9 4 7.1 4.62 61 2.70 0 . 4 6 4 CARO Carolina Financial Corp. SC 1,684 30 . 2 4 438 244 21.3 17 . 1 84.5 42 , 58 5 0.53 9.3 1 . 1 4 11.6 3.66 70 1.57 0 . 4 0 5 AMNB American National Bankshares VA 1,679 35 . 9 0 309 199 19.0 18 . 5 45.5 14 , 86 8 2.67 9.5 1 . 0 2 8.1 3.52 54 1.70 0 . 2 6 6 LOB Live Oak Bancshares Inc. NC 1,670 19 . 9 0 664 318 51.0 23 . 0 52.0 75 , 91 7 0.40 12.8 1 . 1 1 6.8 3.42 73 0.37 0 . 2 9 7 SMMF Summit Financial Group Inc. WV 1,658 26 . 7 7 287 198 17.1 16 . 2 127.2 21 , 35 7 1.49 8.9 1 . 1 0 11.4 3.43 57 1.52 2 . 3 6 8 FIZN First Citizens Bancshares Inc. TN 1,624 52 . 0 0 214 145 13.2 NA 7.2 27 1.92 8.9 1 . 0 2 9.9 3.85 62 1.78 0 . 4 5 9 FBLV First Bancorp Inc. VA 1,566 61 . 1 5 253 151 13.1 NA 114.6 14 1.64 10.7 1 . 2 9 11.9 3.92 56 1.67 1 . 0 5 10 PBNC Paragon Commercial Corp. NC 1,504 45 . 2 4 242 181 16.9 16 . 0 69.2 5 , 89 7 0.00 9.1 0 . 9 5 11.4 3.56 57 1.82 0 . 3 8 11 PFBI Premier Financial Bancorp Inc. WV 1,498 19 . 0 8 203 148 16.5 NA 37.8 21 , 90 0 3.14 9.4 0 . 8 1 6.9 3.86 65 2.26 1 . 3 8 12 MVBF MVB Financial Corp WV 1,469 13 . 0 0 130 117 10.7 NA 1.6 1 , 26 4 0.62 6.2 0 . 8 5 10.1 3.16 82 1.94 0 . 4 5 13 CHFN Charter Financial Corp. GA 1,438 16 . 8 0 253 148 21.3 18 . 1 28.5 36 , 32 2 1.43 12.1 0 . 9 8 5.9 3.89 71 1.92 0 . 4 5 14 ANCX Access National Corp. VA 1,431 27 . 3 8 291 243 17.8 17 . 2 53.0 29 , 69 8 2.19 NA 1 . 2 7 14.1 3.52 62 1.17 0 . 4 3 15 CFFI C&F Financial Corp. VA 1,425 45 . 4 0 157 126 12.4 NA 18.6 7 , 52 1 2.91 8.8 0 . 9 0 9.4 6.33 64 3.23 0 . 3 7 16 SFST Southern First Bancshares Inc SC 1,340 37 . 2 0 240 221 19.2 18 . 1 66.0 13 , 24 1 0.00 8.1 1 . 0 4 12.7 3.60 58 1.65 0 . 4 6 17 FFMH First Farmers Merchants Corp. TN 1,338 29 . 5 0 134 123 13.3 NA 32.0 71 2.58 8.2 0 . 7 9 8.5 3.06 64 1.76 0 . 2 2 18 CSTR CapStar Financial Hlgs Inc. TN 1,318 19 . 9 8 224 182 25.6 21 . 7 NA NA 0.00 9.4 0 . 6 8 7.3 3.17 NA 1.80 0 . 3 1 19 ENFC Entegra Financial NC 1,293 21 . 8 0 141 108 22.2 14 . 0 24.9 7 , 67 5 0.00 10.1 0 . 5 5 4.7 3.28 78 2.01 0 . 7 9 20 FBMS First Bancshares Inc. MS 1,267 28 . 0 0 252 190 15.6 15 . 9 69.7 4 , 07 7 0.54 6.4 0 . 8 5 9.6 3.72 68 2.05 0 . 8 6 21 TGRF TGR Financial Inc. FL 1,227 8 . 0 0 138 142 25.8 NA NA NA 0.00 7.9 0 . 4 8 5.5 2.94 NA 1.94 0 . 1 3 22 CBAN Colony Bankcorp Inc. GA 1,210 13 . 7 0 116 138 16.3 NA 47.2 4 , 56 7 0.00 6.9 0 . 7 5 8.7 3.51 71 2.14 2 . 0 6 23 ESXB Community Bankers Trust Corp VA 1,204 7 . 5 5 164 146 17.6 16 . 4 56.6 16 , 82 0 0.00 9.4 0 . 8 0 8.6 3.82 67 2.41 1 . 3 4 24 NKSH National Bankshares Inc. VA 1,203 43 . 7 0 304 171 20.1 20 . 8 31.3 7 , 90 9 2.79 14.9 1 . 2 6 8.4 3.60 51 1.35 0 . 7 2 25 SONA Southern National Bncp of VA VA 1,135 16 . 3 3 201 176 19.2 181 . 4 27.2 33 , 94 1 1.96 10.1 0 . 9 9 8.6 4.05 53 2.03 1 . 0 1 26 CNBW CNB Corp. SC 1,111 66 . 0 0 107 100 12.8 NA 20.0 43 2.65 9.7 0 . 7 9 8.1 3.06 66 1.67 0 . 8 7 27 PEBK Peoples Bancorp of NC Inc. NC 1,088 26 . 5 0 144 134 16.1 NA 41.9 3 , 24 6 1.51 9.9 0 . 8 5 8.1 3.71 73 2.37 0 . 3 8 28 JMSB John Marshall Bank VA 1,075 20 . 9 5 211 179 26.5 NA 26.2 2 , 93 9 0.00 11.0 0 . 8 5 7.3 3.79 57 2.04 0 . 0 1 29 SMBK SmartFinancial Inc. TN 1,062 21 . 5 7 166 147 27.7 19 . 3 40.5 7 , 48 4 0.00 8.2 0 . 5 7 5.6 4.21 76 2.79 0 . 3 6 30 CIZN Citizens Holding Co. MS 1,025 25 . 4 6 124 132 16.9 17 . 6 10.7 1 , 68 5 3.77 9.2 0 . 7 4 8.2 3.04 69 1.78 1 . 4 3 Median 1,382 219 150 18.1 18 . 1 39.2 7 , 59 8 0.78 9.4 0 . 9 2 8.5 3.60 64 1.87 0 . 4 5 FSBK First South Bancorp Inc. NC 991 12 . 2 0 116 142 16.7 NA 44.2 6 , 40 1 0.98 8.3 0 . 7 2 8.0 3.71 77 2.26 0 . 6 3

18 Strong Profitability Durable Brand • 115 year old institution, headquartered in Washington, North Carolina, with 30 branches throughout Eastern and Central North Carolina • Strong values and culture Well - Capitalized Experienced Acquiror A t t ra c t i v e Currency Leadership • Highly - qualified and experienced board and management • Executive team averages approximately 35 years of banking experience • ROAA of 0.72% in 2016 • Recent and expected strong loan growth to drive higher earnings • Tangible common equity to tangible assets of 8.3% • The Bank has an 8.89% leverage ratio and a 13.01% total risk - based ratio • Recently acquired 9 branches and $173 million of deposits from Bank of America • Excellent relationship with regulators - Closed acquisition of branches in three months • Exceptional shareholder return (~43% total return in 2016) • Price to tangible book value of 142% and price to LTM EPS of 16.7x • Dividend yield of 1.0% • NASDAQ listed: average daily trading volume of over 6,000 shares (1 year) WHY FIRST SOUTH? Clean Asset Quality • NPAs/assets of 0.63% • The Company continues to emphasize asset quality as a crucial driver of its short - and long - term success Note: Market data as of January 26, 2017 Source: SNL Financial LC
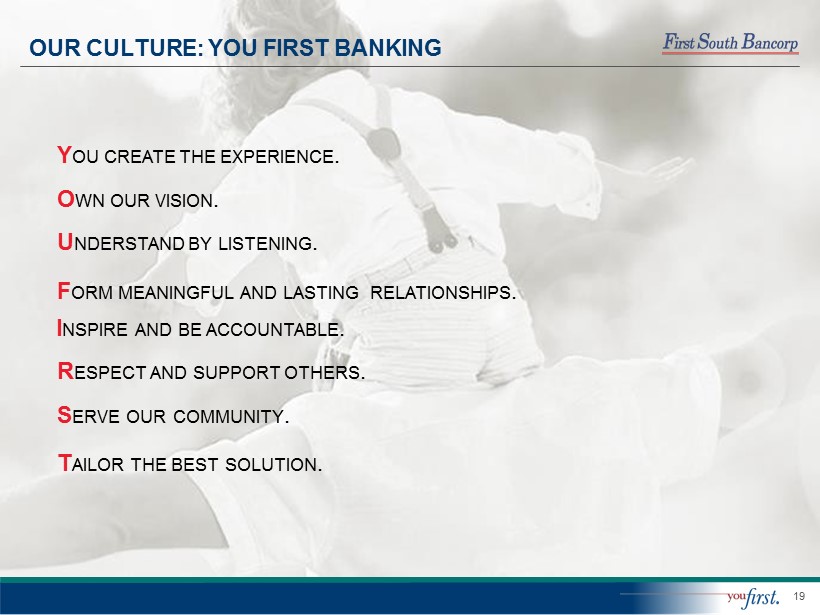
19 OUR CULTURE: YOU FIRST BANKING Y OU CREATE THE EXPERIENCE . O WN OUR VISION . U NDERSTAND BY LISTENING . F ORM MEANINGFUL AND LASTING RELATIONSHIPS . I NSPIRE AND BE ACCOUNTABLE . R ESPECT AND SUPPORT OTHERS . S ERVE OUR COMMUNITY . T AILOR THE BEST SOLUTION .

Appendix Append i x

21 OUR DIRECTORS Director Experience Age Term Frederick Holscher Chairman • Director of First South since 1985 and current general counsel for the Bank • President of Rodman, Holscher, Francisco & Peck • UNC Chapel Hill & UNC School of Law 68 2006 – 2018 Marshall Singleton Vice Chairman • Director of First South since 1990 • Former owner of B.E. Singleton & Sons, a highway construction firm • The Citadel University 77 2006 – 2017 Bruce W. Elder President & CEO • President of First South since 2012 • CFO / SVP of Crescent Financial Corporation from 1998 – 2012 • CPA; North Carolina State University 54 2012 – 2019 Lindsey Crisp • President & CEO of Carver Machine Works, Inc. since 2005 • CPA, Dixon Hughes Goodman, LLP from 2001 to 2005 • East Carolina University 44 2015 – 2018 Steve Griffin • Owner of Griffin Farms, Inc., Gold Petiole Farms LLC, and Big Swamp LLC • Monsanto Corporation’s Leadership School • North Carolina State University 62 2015 – 2018 Steve Lee • Director of First South since 2013 • Owner of Lee Chevrolet, Inc. • Chowan College 66 2013 – 2019

22 NON - GAAP RECONCILIATION – PTPP OPERATING EARNINGS (Dollars in thousands) FYE December 31, Non - GAAP Financial Measures 2012 2013 2014 2015 2016 Pre - Tax Pre - Provision Operating Earnings Income (Loss) Before Taxes $ (18,144) $ 9,112 $ 5 , 43 9 $ 6,520 $ 9 , 92 2 Provision for Credit Losses 23 , 25 2 1 , 08 5 1 , 10 0 800 970 Branch Acquisition Costs - - 1 , 32 0 425 FHLB Prepayment Penalty 345 OREO Maintenance Expenses 969 620 445 436 303 Securities (Gain) Loss ( 1 , 547 ) ( 548 ) ( 14 ) ( 1 , 418 ) ( 467 ) OREO Valuations 7 , 81 4 546 204 195 250 OREO (Gain) Loss 529 (609 ) ( 115 ) (40 ) ( 131 ) Pre - Tax Pre - Provision Operating Earnings $ 12,873 $ 10,206 $ 8 , 72 4 $ 6,918 $ 10 , 84 7 PTPP Op. Earnings / Average Assets and Average Equity Pre - Tax Pre - Provision Operating Earnings $ 12,873 $ 10,206 $ 8 , 72 4 $ 6,918 $ 10 , 84 7 Average Assets 732 , 09 1 688 , 22 6 723 , 66 0 897 , 79 5 961 , 85 6 Average Equity 85 , 29 5 76 , 66 9 78 , 91 3 81 , 89 3 86 , 84 4 PTPP Op. Earnings / AA (%) 1 . 76 % 1 . 48 % 1 . 21 % 0 . 77 % 1 . 13 % PTPP Op. Earnings / AE (%) 15 . 1 % 13 . 3 % 11 . 1 % 8 . 4 % 12 . 5 % This presentation contains certain financial information determined by methods other than in accordance with accounting principles generally accepted in the United States (“GAAP”). These non - GAAP financial measures include pre - tax, pre - provision operating earnings; core net income; and core noninterest income. Management believes that these non - GAAP financial measures provide a greater understanding of ongoing operations. These non - GAAP measures are supplemental and are not a substitute for any analysis based on GAAP financial measures. Because not all companies use the same calculation of non - GAAP measures, this presentation may not be comparable to other similarly titled measures as calculated by other companies.
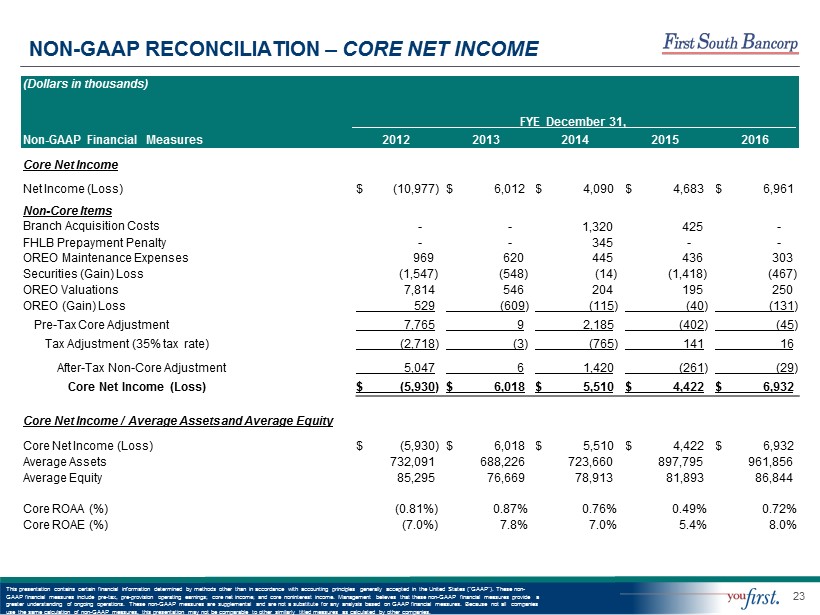
23 NON - GAAP RECONCILIATION – CORE NET INCOME (Dollars in thousands) FYE December 31, Non - GAAP Financial Measures 2012 2013 2014 2015 2016 Core Net Income Net Income (Loss) $ (10,977) $ 6,012 $ 4 , 09 0 $ 4,683 $ 6 , 96 1 Non - Core Items Branch Acquisition Costs - - 1 , 32 0 425 - FHLB Prepayment Penalty - - 345 - - OREO Maintenance Expenses 969 620 445 436 303 Securities (Gain) Loss ( 1 , 547 ) ( 548 ) ( 14 ) ( 1 , 418 ) ( 467 ) OREO Valuations 7 , 81 4 546 204 195 250 OREO (Gain) Loss 529 (609 ) ( 115 ) (40 ) ( 131 ) Pre - Tax Core Adjustment 7,765 9 2 , 18 5 (402 ) ( 45 ) Tax Adjustment (35% tax rate) (2,718 ) (3 ) ( 765 ) 141 16 After - Tax Non - Core Adjustment 5,047 6 1 , 42 0 (261 ) ( 29 ) Core Net Income (Loss) $ (5,930 ) $ 6,018 $ 5 , 51 0 $ 4,422 $ 6 , 93 2 Core Net Income / Average Assets and Average Equity Core Net Income (Loss) $ (5,930) $ 6,018 $ 5 , 51 0 $ 4,422 $ 6 , 93 2 Average Assets 732 , 09 1 688 , 22 6 723 , 66 0 897 , 79 5 961 , 85 6 Average Equity 85 , 29 5 76 , 66 9 78 , 91 3 81 , 89 3 86 , 84 4 Core ROAA (%) ( 0 . 81 % ) 0 . 87 % 0 . 76 % 0 . 49 % 0 . 72 % Core ROAE (%) ( 7 . 0 % ) 7 . 8 % 7 . 0 % 5 . 4 % 8 . 0 % This presentation contains certain financial information determined by methods other than in accordance with accounting principles generally accepted in the United States (“GAAP”). These non - GAAP financial measures include pre - tax, pre - provision operating earnings; core net income; and core noninterest income. Management believes that these non - GAAP financial measures provide a greater understanding of ongoing operations. These non - GAAP measures are supplemental and are not a substitute for any analysis based on GAAP financial measures. Because not all companies use the same calculation of non - GAAP measures, this presentation may not be comparable to other similarly titled measures as calculated by other companies.

24 NON - GAAP RECONCILIATION – CORE NONINTEREST INCOME (Dollars in thousands) FYE December 31, Non - GAAP Financial Measures 2012 2013 2014 2015 2016 Core Noninterest Income Noninterest Income $ 10,817 $ 10,408 $ 8 , 58 5 $ 14,298 $ 14 , 18 7 Non - Core Items Securities (Gain) Loss ( 1 , 547 ) ( 548 ) ( 14 ) ( 1 , 418 ) ( 467 ) OREO (Gain) Loss 529 (609 ) ( 115 ) (40 ) ( 131 ) Total Non - Core Adjustment (1,018 ) (1,157 ) ( 129 ) (1,458 ) ( 598 ) Core Noninterest Income $ 9,799 $ 9,251 $ 8 , 45 6 $ 12,840 $ 13 , 58 9 Core Noninterest Income / Average Assets and Average Equity Core Noninterest Income $ 9,799 $ 9,251 $ 8 , 45 6 $ 12,840 $ 13 , 58 9 Average Assets 732 , 09 1 688 , 22 6 723 , 66 0 897 , 79 5 961 , 85 6 Average Equity 85 , 29 5 76 , 66 9 78 , 91 3 81 , 89 3 86 , 84 4 Core Noninterest Income / AA (%) 1 . 34 % 1 . 34 % 1 . 17 % 1 . 43 % 1 . 41 % Core Noninterest Income / AE (%) 11 . 5 % 12 . 1 % 10 . 7 % 15 . 7 % 15 . 6 % This presentation contains certain financial information determined by methods other than in accordance with accounting principles generally accepted in the United States (“GAAP”). These non - GAAP financial measures include pre - tax, pre - provision operating earnings; core net income; and core noninterest income. Management believes that these non - GAAP financial measures provide a greater understanding of ongoing operations. These non - GAAP measures are supplemental and are not a substitute for any analysis based on GAAP financial measures. Because not all companies use the same calculation of non - GAAP measures, this presentation may not be comparable to other similarly titled measures as calculated by other companies.