Attached files
| file | filename |
|---|---|
| EX-99.1 - EXHIBIT 99.1 - CIRRUS LOGIC, INC. | a51502897_ex991.htm |
| 8-K - CIRRUS LOGIC, INC. 8-K - CIRRUS LOGIC, INC. | a51502897.htm |
Exhibit 99.2
February 1, 2017 Letter to Shareholders Q3 FY17 1 CIRRUS LOGIC, INC. 800 WEST SIXTH STREET, AUSTIN, TEXAS 78701
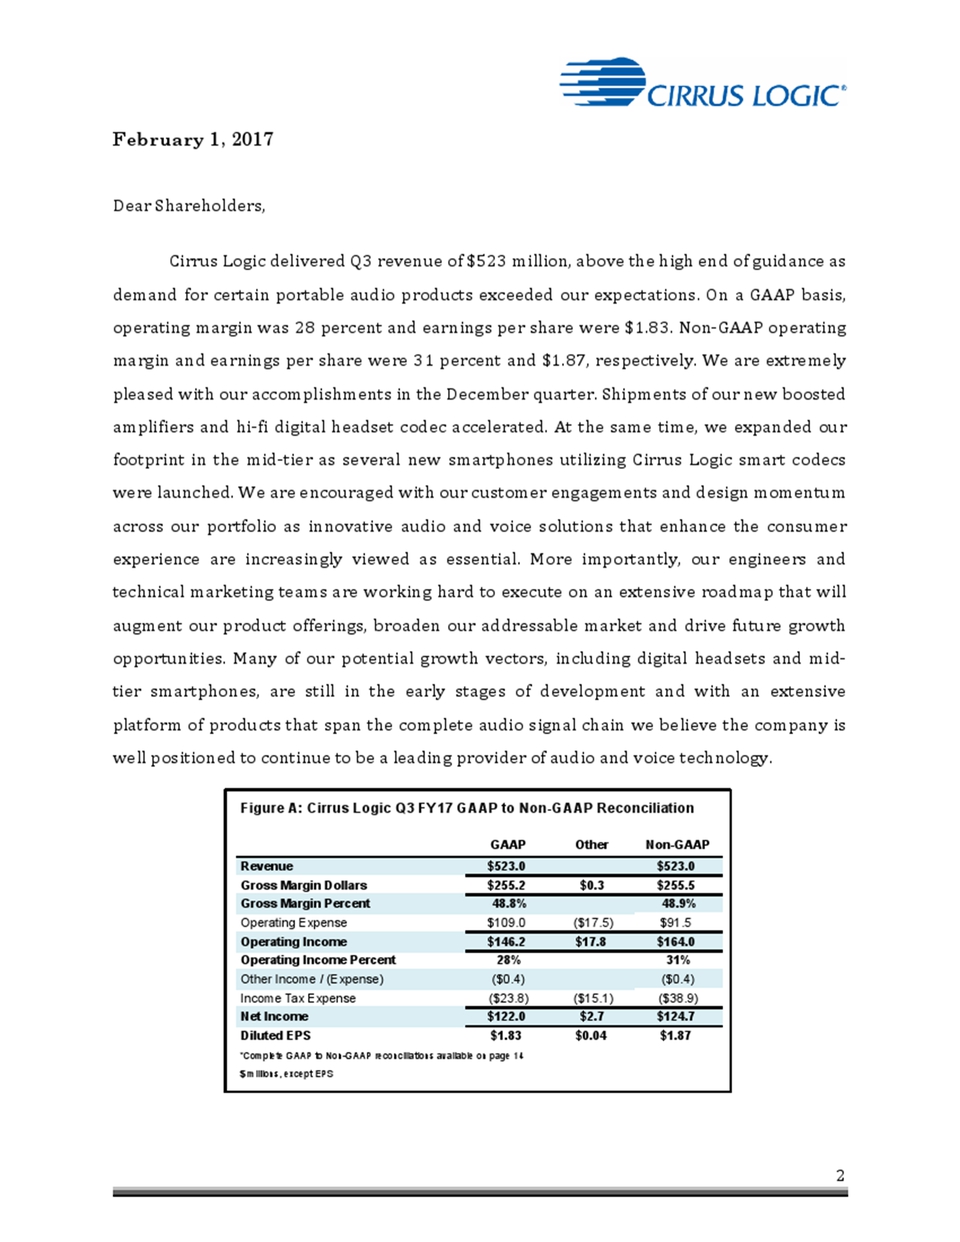
2 February 1, 2017 Dear Shareholders, Cirrus Logic delivered Q3 revenue of $523 million, above the high end of guidance as demand for certain portable audio products exceeded our expectations. On a GAAP basis, operating margin was 28 percent and earnings per share were $1.83. Non-GAAP operating margin and earnings per share were 31 percent and $1.87, respectively. We are extremely pleased with our accomplishments in the December quarter. Shipments of our new boosted amplifiers and hi-fi digital headset codec accelerated. At the same time, we expanded our footprint in the mid-tier as several new smartphones utilizing Cirrus Logic smart codecs were launched. We are encouraged with our customer engagements and design momentum across our portfolio as innovative audio and voice solutions that enhance the consumer experience are increasingly viewed as essential. More importantly, our engineers and technical marketing teams are working hard to execute on an extensive roadmap that will augment our product offerings, broaden our addressable market and drive future growth opportunities. Many of our potential growth vectors, including digital headsets and midtier smartphones, are still in the early stages of development and with an extensive platform of products that span the complete audio signal chain we believe the company is well positioned to continue to be a leading provider of audio and voice technology. Figure A: Cirrus Logic Q3 FY17 GAAP to Non-GAAP Reconciliation GAAP Other Non-GAAP Revenue $523.0 $523.0 Gross Margin Dollars $255.2 $0.3 $255.5 Gross Margin Percent 48.8% 48.9% Operating Expense $109.0 ($17.5) $91.5 Operating Income $146.2 $17.8 $164.0 Operating Income Percent 28% 31% Other Income / (Expense) ($0.4) ($0.4) Income Tax Expense ($23.8) ($15.1) ($38.9) Net Income $122.0 $2.7 $124.7 Diluted EPS $1.83 $0.04 $1.87 *Complete GAAP to Non-GAAP reconciliations available on page 14 $ millions, except EPS
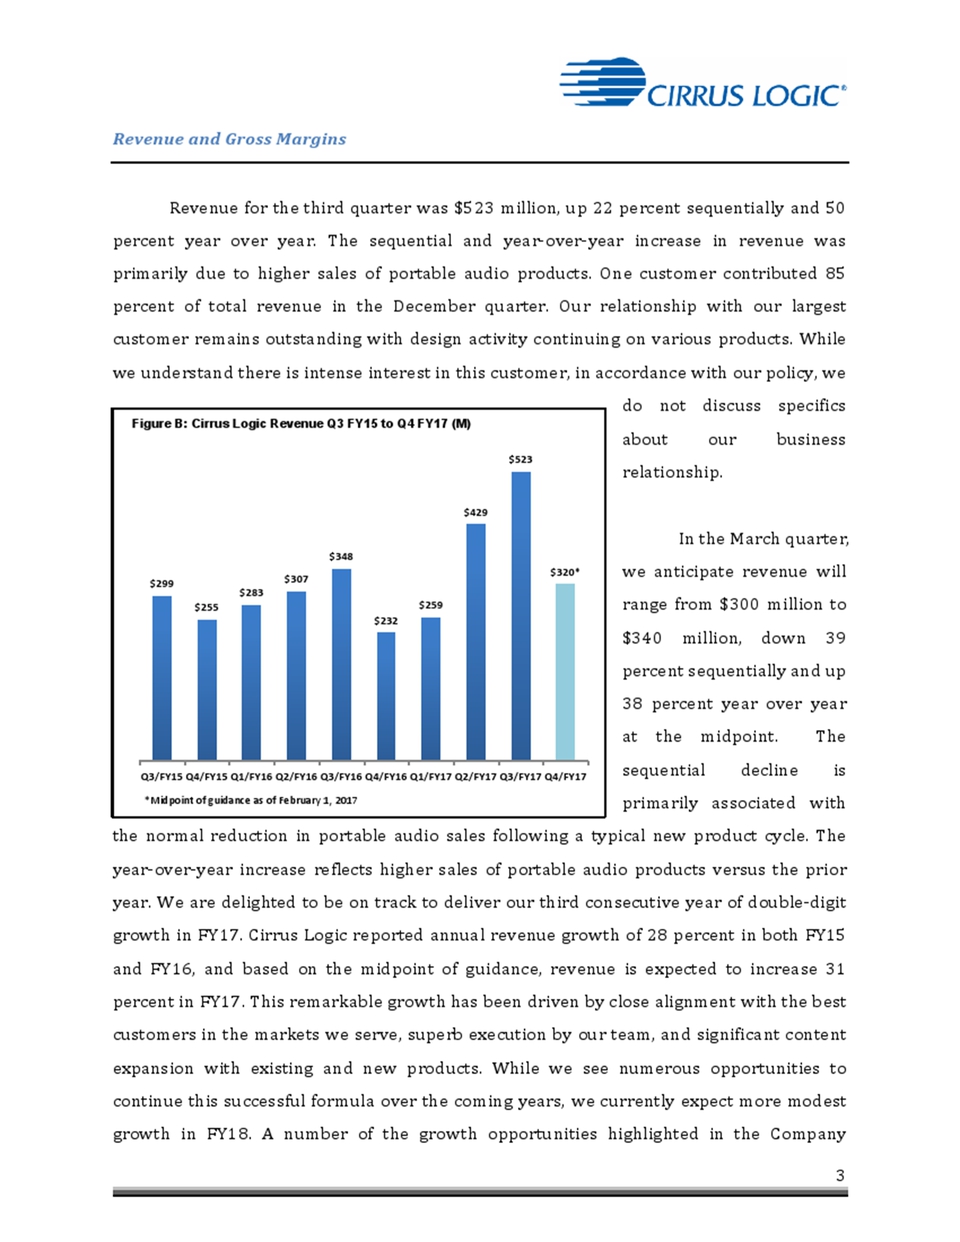
3 Revenue and Gross Margins Revenue for the third quarter was $523 million, up 22 percent sequentially and 50 percent year over year. The sequential and year-over-year increase in revenue was primarily due to higher sales of portable audio products. One customer contributed 85 percent of total revenue in the December quarter. Our relationship with our largest customer remains outstanding with design activity continuing on various products. While we understand there is intense interest in this customer, in accordance with our policy, we do not discuss specifics about our business relationship. In the March quarter, we anticipate revenue will range from $300 million to $340 million, down 39 percent sequentially and up 38 percent year over year at the midpoint. The sequential decline is primarily associated with the normal reduction in portable audio sales following a typical new product cycle. The year-over-year increase reflects higher sales of portable audio products versus the prior year. We are delighted to be on track to deliver our third consecutive year of double-digit growth in FY17. Cirrus Logic reported annual revenue growth of 28 percent in both FY15 and FY16, and based on the midpoint of guidance, revenue is expected to increase 31 percent in FY17. This remarkable growth has been driven by close alignment with the best customers in the markets we serve, superb execution by our team, and significant content expansion with existing and new products. While we see numerous opportunities to continue this successful formula over the coming years, we currently expect much more modest growth in FY18. A number of the growth opportunities highlighted in the Company $299 $255 $283 $307 $348 $232 $259 $429 $523 $320* Q3/FY15 Q4/FY15 Q1/FY16 Q2/FY16 Q3/FY16 Q4/FY16 Q1/FY17 Q2/FY17 Q3/FY17 Q4/FY17 *Midpoint of guidance as of February 1, 2017 Figure B: Cirrus Logic Revenue Q3 FY15 to Q4 FY17 (M)
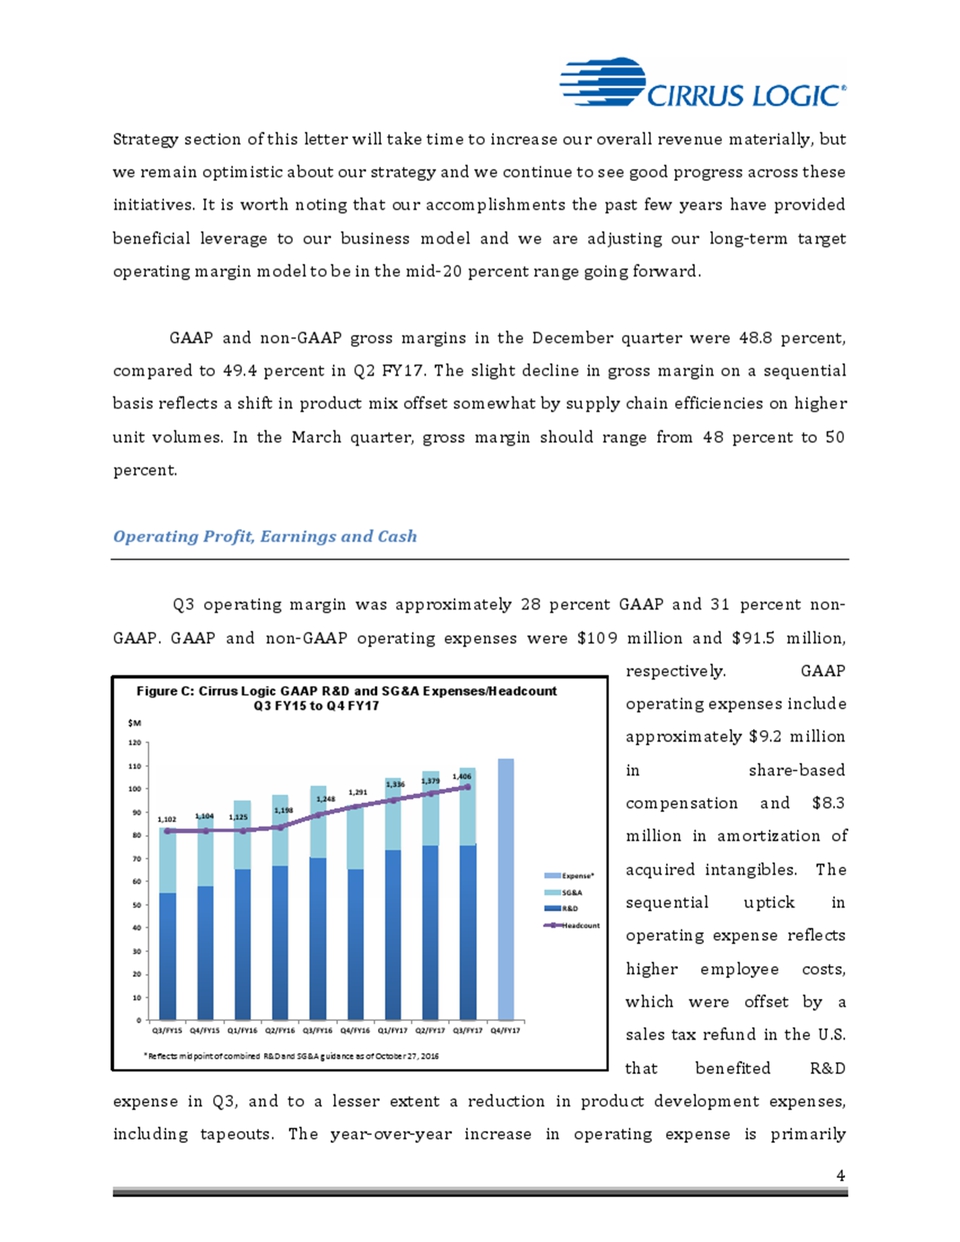
4 Strategy section of this letter will take time to increase our overall revenue materially, but we remain optimistic about our strategy and we continue to see good progress across these initiatives. It is worth noting that our accomplishments the past few years have provided beneficial leverage to our business model and we are adjusting our long-term target operating margin model to be in the mid-20 percent range going forward. GAAP and non-GAAP gross margins in the December quarter were 48.8 percent, compared to 49.4 percent in Q2 FY17. The slight decline in gross margin on a sequential basis reflects a shift in product mix offset somewhat by supply chain efficiencies on higher unit volumes. In the March quarter, gross margin should range from 48 percent to 50 percent. Operating Profit, Earnings and Cash Q3 operating margin was approximately 28 percent GAAP and 31 percent non-GAAP. GAAP and non-GAAP operating expenses were $109 million and $91.5 million, respectively. GAAP operating expenses include approximately $9.2 million in share-based compensation and $8.3 million in amortization of acquired intangibles. The sequential uptick in operating expense reflects higher employee costs, which were offset by a sales tax refund in the U.S. that benefited R&D expense in Q3, and to a lesser extent a reduction in product development expenses, including tapeouts. The year-over-year increase in operating expense is primarily Figure C: Cirrus Logic GAAP R&D and SG&A Expenses/Headcount Q3 FY15 to Q4 FY17 1,102 1,104 1,125 1,198 1,248 1,291 1,336 1,379 1,406 0 10 20 30 40 50 60 70 80 90 100 110 120 Q3/FY15 Q4/FY15 Q1/FY16 Q2/FY16 Q3/FY16 Q4/FY16 Q1/FY17 Q2/FY17 Q3/FY17 Q4/FY17 Expense* SG&A R&D Headcount $M *Reflects midpoint of combined R&D and SG&A guidance as of October 27, 2016
5 associated with employee costs, including significant growth in headcount, variable compensation and facilities-related expenses associated with the headcount. The increase also reflects additional contractors working to accelerate key R&D projects. In the March quarter GAAP R&D and SG&A expenses should range from $110 million to $116 million, including roughly $11 million in share-based compensation and $8 million in amortization of acquired intangibles. The expected sequential increase in operating expense is largely due to the absence of any sales tax refund benefiting R&D expense, as the most recent sales tax audit and the associated refund were completed in Q3. Going forward, we are adjusting our long-term target operating margin model to be in the mid-20 percent range, revised up from our previous model of 20 percent. Our total headcount exiting Q3 was 1,406. GAAP earnings per share for the quarter were $1.83, compared to $1.30 the prior quarter and $0.63 in Q3 FY16. Non-GAAP earnings per share were $1.87, versus $1.33 in Q2 FY17 and $0.82 in Q3 FY16. We note that the Q2 FY17 GAAP and non-GAAP earnings per share results have been updated since our last quarterly report to reflect Cirrus Logic’s adoption of the Accounting Standards Update (ASU) 2016-09, Compensation – Stock Compensation (Topic 718): Improvements to Employee Share-Based Payment Accounting, which is discussed in detail in the tax section of this document. Our ending cash balance in the December quarter was $382.7 million, up from $231.4 million the prior quarter. Cash from operations was approximately $208.1 million. The company’s balance sheet reflects $100 million of debt, down $40 million from the September quarter. Interest expense related to this debt is currently expected to be roughly $250,000 in Q4. The company has approximately $175.8 million remaining in our share repurchase program. We will continue to evaluate potential uses of cash including acquisitions, the repurchase of shares and repayment of debt. Taxes and Inventory GAAP tax expense for the December quarter was $23.8 million, resulting in an effective tax rate of 16.3 percent. Non-GAAP tax expense and the effective tax rate for the
6 quarter was $38.9 million and 23.7 percent, respectively. During the quarter, the Company adopted Accounting Standards Update (ASU) 2016-09, Compensation – Stock Compensation (Topic 718): Improvements to Employee Share-Based Payment Accounting. Generally speaking, the amount of compensation cost recognized for stock-based compensation in GAAP net income differs from the amount a company can ultimately deduct on its tax return. The new guidance requires all of the tax effects related to stockbased compensation to be recorded through GAAP tax expense in the quarter in which they occur. While this will eliminate some administrative complexities, it will increase the volatility of our reported GAAP income tax expense and thus we do not intend to provide GAAP tax rate guidance going forward due to the inherent difficulty in predicting future stock price and other related share-based compensation information. We estimate that our worldwide non-GAAP effective tax rate in FY17 will range from 24 percent to 26 percent. Moving forward, we expect this rate to decrease gradually. Q3 inventory was $154.1 million, down from the prior quarter. Inventory in the March quarter is expected to be down slightly as we continue to fulfill product demand. Company Strategy Cirrus Logic’s comprehensive portfolio of products that spans the complete audio signal chain, proven execution and solid relationships with many of the market leaders has contributed to the company’s ability to deliver strong revenue, operating profit and earnings per share growth the past few years. During the quarter, shipments of our new hifi digital headset codec and boosted amplifiers accelerated. We gained traction in the midtier and China markets where we are shipping smart codecs into several recently launched smartphones. We continue to collaborate with numerous Chinese OEMs on various platforms and models that are expected to utilize a variety of components including hi-fi DACs, smart codecs and boosted amplifiers. The success of our boosted amplifier product line has been outstanding, shipping over 1.5 billion units since launching in FY13, and we expect units to continue to grow in FY18. While we are extremely pleased with this performance, we are even more encouraged as we look to the future. Our engagements
7 with new and existing customers are solid and we believe this business will remain robust as we move into FY18 and beyond. Further, we are excited to have our first 55-nanometer boosted amplifiers back from the fab and expect to begin sampling these products in the June quarter. In MEMS microphones, we continued to make a significant investment in the December quarter, in terms of both new product development and manufacturing readiness. This investment is expected to position us to provide meaningful differentiation to our microphone product line while achieving the supply assurances required by our customers. The company remains focused on the development of innovative new products across our portfolio and expanding our customer base, which we believe are important for growth. As we wrap up FY17, we are optimistic about the company’s future as we have numerous multi-year growth vectors that are expected to drive opportunities in the coming years. FY17 has been a great year for Cirrus Logic smart codecs. We broadened our portfolio with new products designed for flagship and mid-tier smartphones and expanded into the emerging digital headset market. We continue to be actively engaged with a variety of OEMs interested in deploying compelling audio and voice technology across flagship and mid-tier devices. Our engineers are optimizing our portfolio to deliver higher analog performance with careful consideration for enabling key features and supporting ongoing demands for lower systems cost. In FY18, we anticipate an ASP decline at a key Android OEM as they transition to a high performance smart codec with optimizations that address handset model specific requirements. Our relationship with this customer remains strong and we see opportunities to increase our smart codec content in future smartphones. We continue to push the envelope with improvements to the mixed signal audio performance and system level integration with our new components. We have made significant headway in securing approval of other Cirrus Logic products with the same OEM and expect to expand into additional categories of both smartphone and accessory devices in FY18. We believe the transition of analog headsets to digitally connected products will occur over multiple years, fueled by OEMs’ desire to offer consumers a differentiated user
8 experience that reaches beyond their mobile devices. While the adoption of digital headsets in the Android market has been slow, we are very encouraged to see more OEMs moving to the USB-C interface, which is essential in this transition. There are numerous handsets on the market today that have removed the 3.5mm jack and Cirrus Logic is supplying components in several of these bundled digital headsets and/or adaptors. As this market continues to develop, the company is focused on introducing a variety of solutions over the next year that enable new audio and voice features at different price points. These products range from high-fidelity digital components for the mainstream market up to ANC smart codecs that target the high end. The digital headset market is highly fragmented and currently requires a substantial amount of resources to support bringing customer products to market for the high end given the complexity of the design. Traditionally analog headsets have not included active electronics and the shift to digital requires expertise in electronics and acoustics, as well as a complete redesign of the manufacturing process. Over the next six to nine months, in addition to introducing new chips and software, we expect to launch new development tools that aim to dramatically reduce the time it takes our customers to design and bring to market their headsets and increase our support infrastructure to facilitate scaling our support of customers. We believe this adds an additional layer of differentiation for our technology and customer support compared to our competitors. We are extremely pleased with our digital headset progress this past quarter and their meaningful contribution to revenue in FY17. Shipments of our new hi-fi codecs accelerated and design activity remained robust as we worked closely with customers on the development and production of mainstream and high-end headsets. We continue to expect the first ANC headset utilizing Cirrus Logic technology to be launched in Q4 of FY17 and interest and design activity with additional customers remains high. While our long-term outlook for success in ANC is strong, we believe the majority of digital headset revenue in FY18 will be driven by our hi-fi codecs. Cirrus Logic’s business model is focused on delivering innovative, high performance analog and digital signal processing components to leaders in fast growing markets where our technology helps to differentiate end products. Over the past five years there has been a meaningful shift in the requirements for audio and voice technology as consumer devices
9 have become more sophisticated and intricately entwined in our lives. While the need for best in class hardware remains unchanged, the ability to enhance our smart codecs and amplifiers with software algorithms that enable end device features has become more critical. Furthermore, Cirrus Logic is able to introduce new features and use cases that drive better consumer experiences while supporting a wide range of OEMs. We offer smart codecs that are customized with our internally developed audio and voice algorithms, as well as third party and customer IP. Included with our platform of products, we supply the device and software, along with the system level drivers, tools, and test capability that provide a more turn-key experience for OEMs. These are scalable across various customers and tiers, which is particularly important in the highly fragmented mid-tier and China markets where sensitivity to time to market and cost are meaningful. Our portfolio of low power, low latency digital signal processor devices provides customers a platform to respond to the dynamic needs of the market through continuous development of new features and capabilities after the hardware is complete. Recognizing the crucial role of software several years ago, the company has invested significantly in the development of an extensive team of engineers dedicated to the creation of new algorithms, embedded implementation, system/platform drivers, development tools, quality assurance and testing. We believe this investment will uniquely position the company for continued success as we leverage our extensive portfolio of products across a wide range of customers and markets. Cirrus Logic’s longer-term investment in voice biometrics is an example of a potentially disruptive and exciting new technology that is heavily dependent on the combination of sophisticated hardware and software. As our lives are becoming increasingly digitally connected, an additional layer of security for our devices and applications has become vital. We believe authentication via voice biometrics offers both a compelling enhancement to the user experience and an additional, complementary way of protecting the user’s security and privacy. In addition to developing the necessary hardware and software algorithms, the company is working closely with the appropriate standards bodies, customers and security consultants to define and drive the performance and security expectations and requirements across different use cases and features. We
10 expect to tape out our first component in the next few months and should begin sampling to customers in mid-FY18. While we are excited with our progress and believe the opportunity for voice biometrics is substantial across multiple markets, we do not anticipate revenue in FY18. While Cirrus Logic is delighted to be on track to deliver our third consecutive year of more than 25 percent annual revenue growth, we are also optimistic about our future as we are participating in markets where demand for compelling audio and voice technology is just beginning to accelerate. We believe the company is well positioned to capitalize on these opportunities in the coming years given the breadth of our product portfolio, robust roadmap and solid relationships with many of the leading players in these markets. We remain laser focused on executing key strategic initiatives that we believe will position the company for future growth. In FY18, we are expanding our portfolio of smart codecs, amplifiers, and MEMS microphones that target flagship and mid-tier smartphones, digital headsets and other mobile devices. As we move throughout the next several years we expect to further penetrate OEMs three through ten, expand content with existing customers and drive additional flagship features into the mid-tier. Longer-term, we expect to continue to introduce innovative new technologies such as voice biometrics and expand into adjacent markets such as smart home, wearables and automotive. Our Unique Corporate Culture With a corporate culture focused on innovation, Cirrus Logic was recently ranked in the top 15 on Great Place to Work and Fortune’s Best Workplaces in Technology list. This latest recognition was based on our employees’ assessment of Cirrus Logic’s culture, management, opportunities for advancement and other traits that have contributed to an exceptional workplace. This adds to the numerous awards that we have received globally during this past year for our outstanding corporate culture, which is a critical element to our ability to attract, retain and motivate our talented employees. With
11 this in mind we have developed an environment that encourages innovation, creativity and timely execution, while promoting integrity, trust and camaraderie. Summary and Guidance For the March quarter we expect the following results: • Revenue to range between $300 million and $340 million; • GAAP gross margin to be between 48 percent and 50 percent; and • Combined GAAP R&D and SG&A expenses to range between $110 million and $116 million, including approximately $11 million in share-based compensation expense and $8 million in amortization of acquired intangibles. In summary, Cirrus Logic reported excellent results in the December quarter as demand for portable audio components drove significant expansion of revenue, operating profit and earnings per share. We are pleased with our accomplishments this past quarter and as we look ahead we are extremely excited to be a leading provider of technology for the rapidly evolving audio and voice market. With a passion for delivering innovative solutions that enable compelling and unique users experiences at ultra low power levels, the company has built an extensive portfolio of boosted amplifiers, smart codecs and MEMS microphones, coupled with a robust product roadmap that we believe will fuel our future success. Sincerely, Jason Rhode Thurman Case President and Chief Executive Officer Chief Financial Officer
12 Conference Call Q&A Session Cirrus Logic will host a live Q&A session at 5 p.m. EST today to answer questions related to its financial results and business outlook. Participants may listen to the conference call on the Cirrus Logic website. Participants who would like to submit a question to be addressed during the call are requested to email investor.relations@cirrus.com. A replay of the webcast can be accessed on the Cirrus Logic website approximately two hours following its completion, or by calling (404) 537-3406, or toll-free at (855) 859-2056 (Access Code: 47722143). Use of Non-GAAP Financial Information To supplement Cirrus Logic's financial statements presented on a GAAP basis, Cirrus has provided non-GAAP financial information, including gross margins, operating expenses, net income, operating profit and income, tax expenses and diluted earnings per share. A reconciliation of the adjustments to GAAP results is included in the tables below. We are also providing guidance on our non-GAAP expected effective tax rate. We are not able to provide guidance on our GAAP tax rate or a related reconciliation without unreasonable efforts since our future GAAP tax rate depends on our future stock price and related share-based compensation information that is not currently available. Non-GAAP financial information is not meant as a substitute for GAAP results, but is included because management believes such information is useful to our investors for informational and comparative purposes. In addition, certain non-GAAP financial information is used internally by management to evaluate and manage the company. The non-GAAP financial information used by Cirrus Logic may differ from that used by other companies. These non-GAAP measures should be considered in addition to, and not as a substitute for, the results prepared in accordance with GAAP. Safe Harbor Statement Except for historical information contained herein, the matters set forth in this news release contain forward-looking statements, including future revenue growth opportunities, our expected model for operating margins, and our estimates of fourth quarter fiscal year 2017 revenue, gross margin, combined research and development and selling, general and administrative expense levels, sharebased compensation expense and amortization of acquired intangibles. In some cases, forward-looking statements are identified by words such as “expect,” “anticipate,” “foresee,” “target,” “project,” “believe,” “goals,” “opportunity,” “estimates,” “intend,” and variations of these types of words and similar expressions. In addition, any statements that refer to our plans, expectations, strategies or other characterizations of future events or circumstances are forward-looking statements. These forward-looking statements are based on our current expectations, estimates and assumptions and are subject to certain risks and uncertainties that could cause actual results to differ materially. These risks and uncertainties include, but are not limited to, the following: the level of orders and shipments during
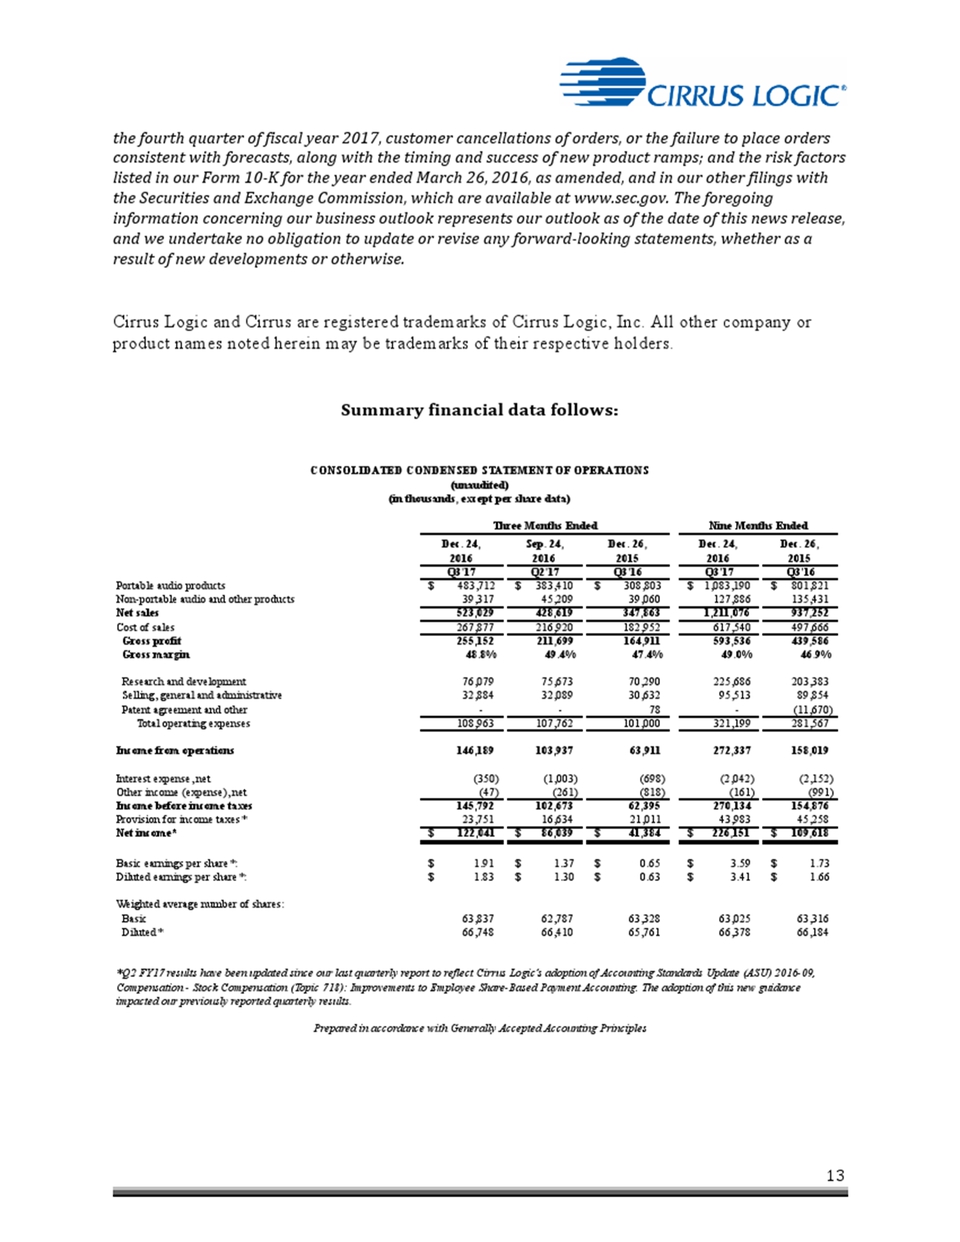
13 the fourth quarter of fiscal year 2017, customer cancellations of orders, or the failure to place orders consistent with forecasts, along with the timing and success of new product ramps; and the risk factors listed in our Form 10-K for the year ended March 26, 2016, as amended, and in our other filings with the Securities and Exchange Commission, which are available at www.sec.gov. The foregoing information concerning our business outlook represents our outlook as of the date of this news release, and we undertake no obligation to update or revise any forward-looking statements, whether as a result of new developments or otherwise. Cirrus Logic and Cirrus are registered trademarks of Cirrus Logic, Inc. All other company or product names noted herein may be trademarks of their respective holders. Summary financial data follows: Dec. 24, Sep. 24, Dec. 26, Dec. 24, Dec. 26, 2016 2016 2015 2016 2015 Q3'17 Q2'17 Q3'16 Q3'17 Q3'16 Portable audio products $ 483,712 $ 383,410 $ 308,803 $ 1 ,083,190 $ 801,821 Non-portable audio and other products 39,317 45,209 39,060 127,886 135,431 CONSOLIDATED CONDENSED STATEMENT OF OPERATIONS (unaudited) (in thousands, except per share data) Three Months Ended Nine Months Ended Net sales 523,029 428,619 347,863 1 ,211,076 937,252 Cost of sales 267,877 216,920 182,952 617,540 497,666 Gross profit 255,152 211,699 164,911 593,536 439,586 Gross margin 48.8% 49.4% 47.4% 49.0% 46.9% Research and development 76,079 75,673 70,290 225,686 203,383 Selling, general and administrative 32,884 32,089 30,632 95,513 89,854 Patent agreement and other - - 78 - ( 11,670) Total operating expenses 108,963 107,762 101,000 321,199 281,567 Income from operations 146,189 103,937 63,911 272,337 158,019 Interest expense, net (350) (1,003) (698) (2,042) (2,152) Other income (expense), net (47) (261) (818) (161) (991) Income before income taxes 145,792 102,673 62,395 270,134 154,876 Provision for income taxes* 23,751 16,634 21,011 43,983 45,258 Net income* $ 122,041 $ 86,039 $ 41,384 $ 226,151 $ 109,618 Basic earnings per share*: $ 1.91 $ 1.37 $ 0.65 $ 3.59 $ 1.73 Diluted earnings per share*: $ 1.83 $ 1.30 $ 0.63 $ 3.41 $ 1.66 Weighted average number of shares: Basic 63,837 62,787 63,328 63,025 63,316 Diluted* 66,748 66,410 65,761 66,378 66,184 *Q2 FY17 results have been updated since our last quarterly report to reflect Cirrus Logic’s adoption of Accounting Standards Update (ASU) 2016-09, Compensation - Stock Compensation (Topic 718): Improvements to Employee Share-Based Payment Accounting. The adoption of this new guidance impacted our previously reported quarterly results. Prepared in accordance with Generally Accepted Accounting Principles
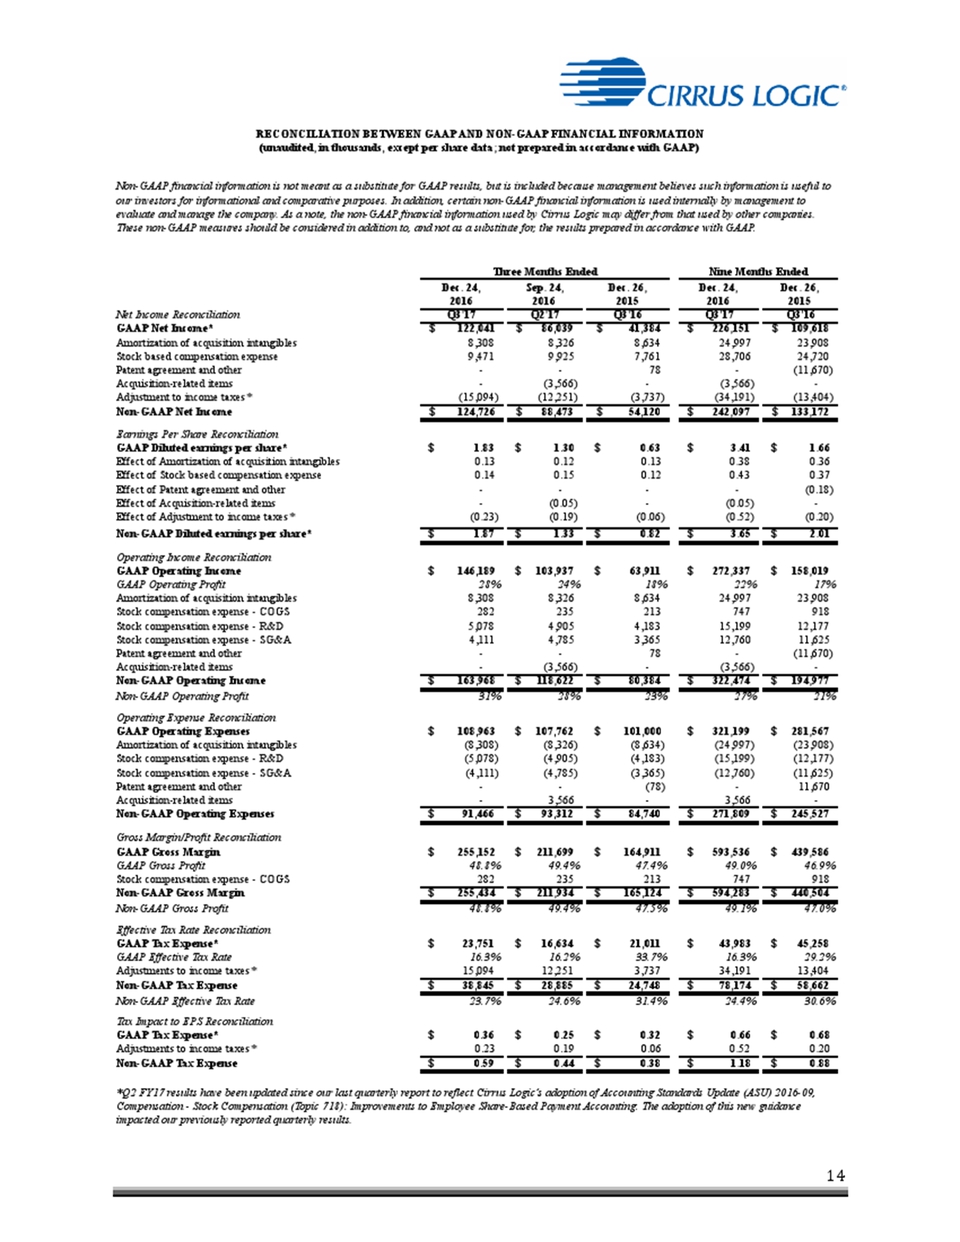
14 Dec. 24, Sep. 24, Dec. 26, Dec. 24, Dec. 26, 2016 2016 2015 2016 2015 Net Income Reconciliation Q3'17 Q2'17 Q3'16 Q3'17 Q3'16 GAAP Net Income* $ 1 22,041 $ 86,039 $ 41,384 $ 226,151 $ 109,618 Amortization of acquisition intangibles 8,308 8,326 8,634 24,997 23,908 Stock based compensation expense 9,471 9,925 7,761 28,706 24,720 RECONCILIATION BETWEEN GAAP AND NON-GAAP FINANCIAL INFORMATION (unaudited, in thousands, except per share data; not prepared in accordance with GAAP) Non-GAAP financial information is not meant as a substitute for GAAP results, but is included because management believes such information is useful to our investors for informational and comparative purposes. In addition, certain non-GAAP financial information is used internally by management to evaluate and manage the company. As a note, the non-GAAP financial information used by Cirrus Logic may differ from that used by other companies. These non-GAAP measures should be considered in addition to, and not as a substitute for, the results prepared in accordance with GAAP. Three Months Ended Nine Months Ended Patent agreement and other - - 78 - ( 11,670) Acquisition-related items - (3,566) - (3,566) - Adjustment to income taxes (15,094) ( 12,251) (3,737) (34,191) ( 13,404) Non-GAAP Net Income $ 1 24,726 $ 88,473 $ 54,120 $ 242,097 $ 133,172 Earnings Per Share Reconciliation GAAP Diluted earnings per share* $ 1.83 $ 1.30 $ 0.63 $ 3.41 $ 1.66 Effect of Amortization of acquisition intangibles 0.13 0.12 0.13 0.38 0.36 Effect of Stock based compensation expense 0.14 0.15 0.12 0.43 0.37 Effect of Patent agreement and other - - - - (0.18) Effect of Acquisition-related items - (0.05) - (0.05) - Effect of Adjustment to income taxes (0.23) (0.19) (0.06) (0.52) (0.20) Non-GAAP Diluted earnings per share* $ 1.87 $ 1.33 $ 0.82 $ 3.65 $ 2.01 Operating Income Reconciliation GAAP Operating Income $ 146,189 $ 103,937 $ 63,911 $ 272,337 $ 158,019 GAAP Operating Profit 28% 24% 18% 22% 17% Amortization of acquisition intangibles 8,308 8,326 8,634 24,997 23,908 Stock compensation expense - COGS 282 235 213 747 918 Stock compensation expense - R&D 5,078 4,905 4,183 15,199 12,177 Stock compensation expense - SG&A 4,111 4,785 3,365 12,760 11,625 Patent agreement and other - - 78 - ( 11,670) Acquisition-related items - (3,566) - (3,566) - Non-GAAP Operating Income $ 16368 $ 118,622 $ 80,384 $ 322,474 $ 194,977 Non-GAAP Operating Profit 31% 28% 23% 27% 21% Operating Expense Reconciliation GAAP Operating Expenses $ 108,963 $ 107,762 $ 101,000 $ 321,199 $ 281,567 Amortization of acquisition intangibles (8,308) (8,326) (8,634) (24,997) ( 23,908) Stock compensation expense - R&D (5,078) (4,905) (4,183) (15,199) ( 12,177) Stock compensation expense - SG&A (4,111) (4,785) (3,365) (12,760) ( 11,625) Patent agreement and other - - (78) - 11,670 Acquisition-related items - 3,566 - 3,566 - Non-GAAP Operating Expenses $ 91,466 $ 93,312 $ 84,740 $ 271,809 $ 245,527 Gross Margin/Profit Reconciliation GAAP Gross Margin $ 255,152 $ 211,699 $ 164,911 $ 593,536 $ 439,586 GAAP Gross Profit 48.8% 49.4% 47.4% 49.0% 46.9% Stock compensation expense - COGS 282 235 213 747 918 Non-GAAP Gross Margin $ 255,434 $ 211,934 $ 165,124 $ 594,283 $ 440,504 Non-GAAP Gross Profit 48.8% 49.4% 47.5% 49.1% 47.0% Effective Tax Rate Reconciliation GAAP Tax Expense* $ 23,751 $ 16,634 $ 21,011 $ 43,983 $ 45,258 GAAP Effective Tax Rate 16.3% 16.2% 33.7% 16.3% 29.2% Adjustments to income taxes* 15,094 12,251 3,737 34,191 13,404 Non-GAAP Tax Expense $ 38,845 $ 28,885 $ 24,748 $ 78,174 $ 58,662 Non-GAAP Effective Tax Rate 23.7% 24.6% 31.4% 24.4% 30.6% Tax Impact to EPS Reconciliation GAAP Tax Expense* $ 0.36 $ 0.25 $ 0.32 $ 0.66 $ 0.68 Adjustments to income taxes* 0.23 0.19 0.06 0.52 0.20 Non-GAAP Tax Expense $ 0.59 $ 0.44 $ 0.38 $ 1.18 $ 0.88 *Q2 FY17 results have been updated since our last quarterly report to reflect Cirrus Logic’s adoption of Accounting Standards Update (ASU) 2016-09, Compensation - Stock Compensation (Topic 718): Improvements to Employee Share-Based Payment Accounting. The adoption of this new guidance impacted our previously reported quarterly results.
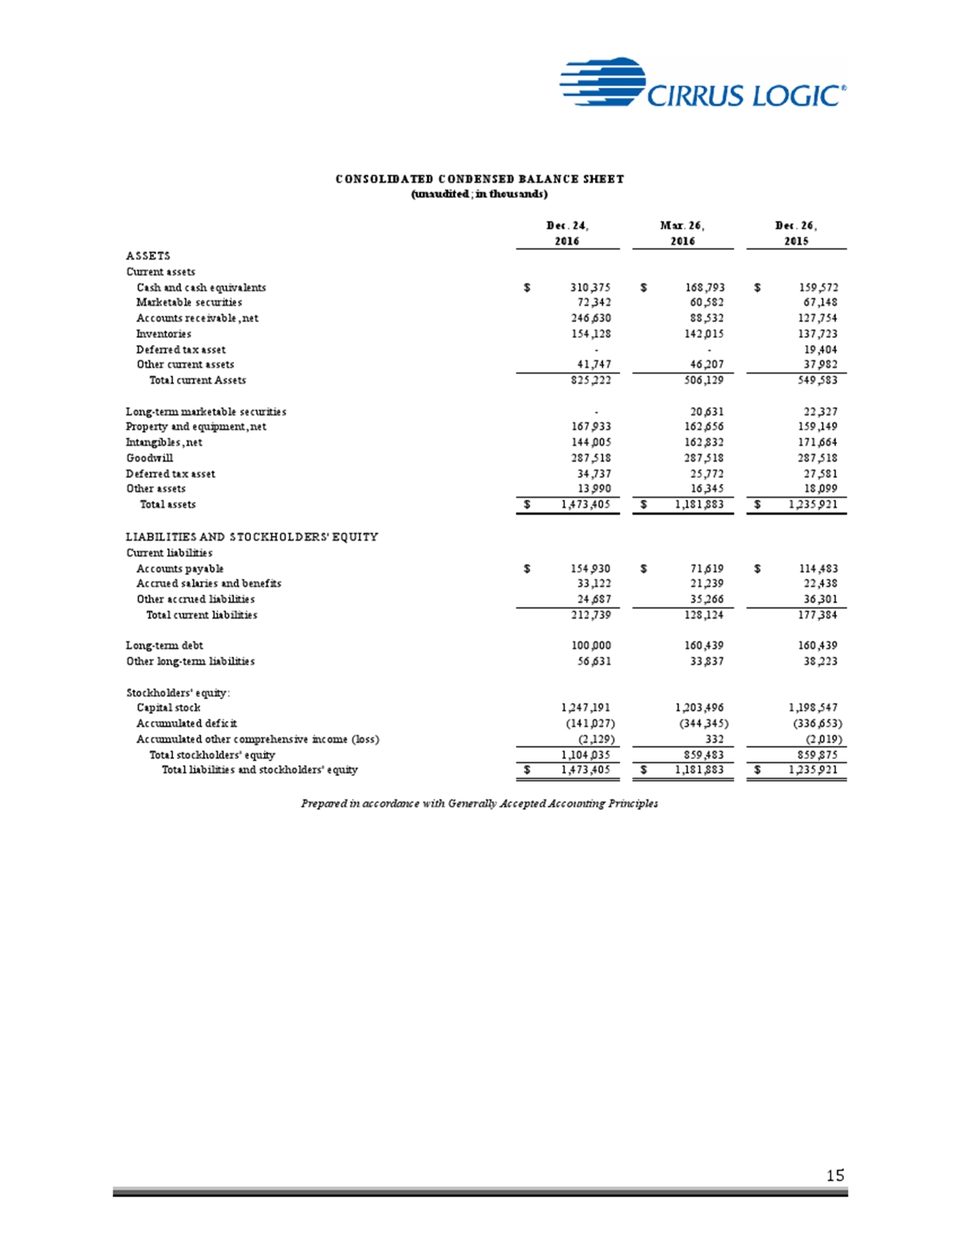
15 Dec. 24, 2016 CONSOLIDATED CONDENSED BALANCE SHEET (unaudited; in thousands) Mar. 26, Dec. 26, 2016 2015 ASSETS Current assets Cash and cash equivalents $ 310,375 $ 168,793 $ 159,572 Marketable securities 72,342 Accounts receivable, net 246,630 Inventories 154,128 Deferred tax asset - Other current assets 41,747 Total current Assets 825,222 Long-term marketable securities - Property and equipment, net 167,933 Intangibles, net 144,005 Goodwill 287,518 60,582 67,148 88,532 127,754 142,015 137,723 - 19,404 46,207 37,982 506,129 549,583 20,631 22,327 162,656 159,149 162,832 171,664 287,518 287,518 Deferred tax asset 34,737 Other assets 13,990 Total assets $ 1,473,405 LIABILITIES AND STOCKHOLDERS' EQUITY Current liabilities Accounts payable $ 154,930 Accrued salaries and benefits 33,122 25,772 27,581 16,345 18,099 $ 1,181,883 $ 1,235,921 $ 71,619 $ 114,483 21,239 22,438 Other accrued liabilities 24,687 Total current liabilities 212,739 35,266 36,301 128,124 177,384 Long-term debt 100,000 Other long-term liabilities 56,631 Stockholders' equity: Capital stock 1,247,191 Accumulated deficit (141,027) Accumulated other comprehensive income (loss) (2,129) Total stockholders' equity 1,104,035 Total liabilities and stockholders' equity $ 1,473,405 Prepared in accordance with Generally Accepted Accounting Principles 160,439 160,439 33,837 38,223 1,203,496 1,198,547 (344,345) (336,653) 332 (2,019) 859,483 859,875 $ 1,181,883 $ 1,235,921