Attached files
| file | filename |
|---|---|
| 8-K - 8-K - PRICE T ROWE GROUP INC | a8-k2.htm |
1
Revised on January 27, 2017, to reflect revision to net flows sourced from the firm’s target date portfolios (page 2)
NEWS RELEASE
T. ROWE PRICE GROUP REPORTS FOURTH QUARTER AND ANNUAL
2016 RESULTS
Assets Under Management Ended 2016 at $810.8 Billion
BALTIMORE (January 26, 2017) - T. Rowe Price Group, Inc. (NASDAQ-GS: TROW) today reported its fourth
quarter of 2016 results, including net revenues of $1.1 billion, net income of $379.8 million, and diluted
earnings per common share of $1.50. The firm recognized in its fourth quarter of 2016 operating expenses an
insurance recovery of $100 million before taxes, or $.24 in diluted after-tax earnings per share. The recovery
was a partial offset to the $166.2 million nonrecurring operating charge related to the Dell appraisal rights
matter recorded in the second quarter of 2016.
Financial Highlights
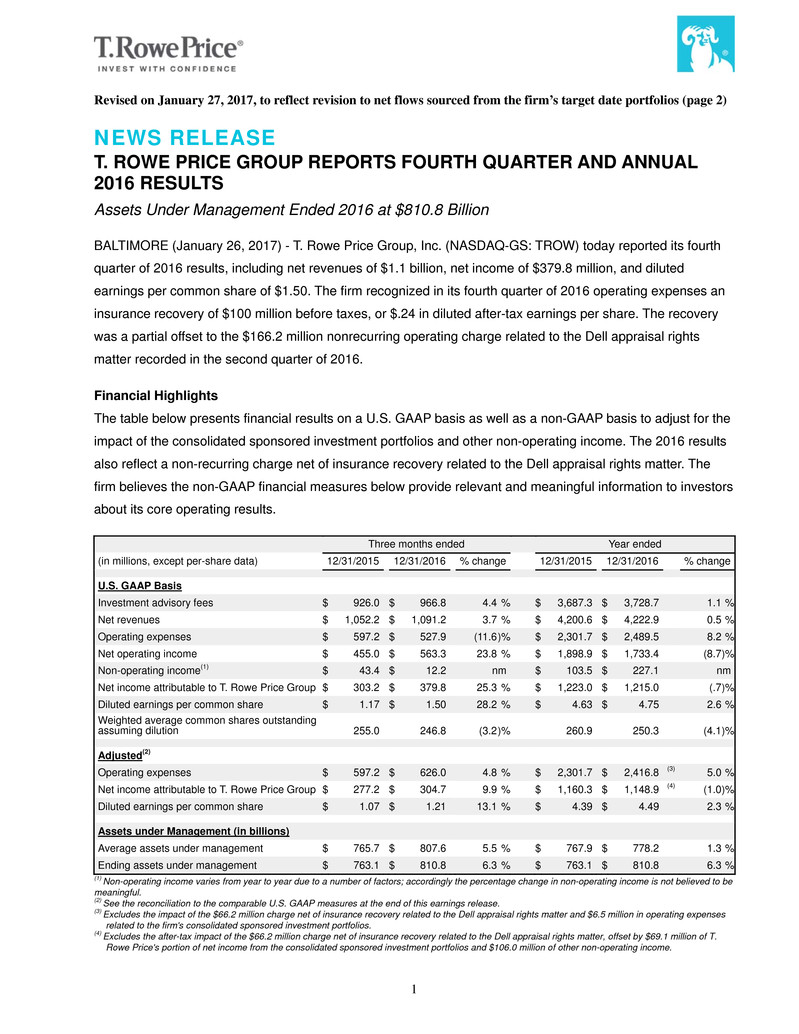
The table below presents financial results on a U.S. GAAP basis as well as a non-GAAP basis to adjust for the
impact of the consolidated sponsored investment portfolios and other non-operating income. The 2016 results
also reflect a non-recurring charge net of insurance recovery related to the Dell appraisal rights matter. The
firm believes the non-GAAP financial measures below provide relevant and meaningful information to investors
about its core operating results.
Three months ended Year ended
(in millions, except per-share data) 12/31/2015 12/31/2016 % change 12/31/2015 12/31/2016 % change
U.S. GAAP Basis
Investment advisory fees $ 926.0 $ 966.8 4.4 % $ 3,687.3 $ 3,728.7 1.1 %
Net revenues $ 1,052.2 $ 1,091.2 3.7 % $ 4,200.6 $ 4,222.9 0.5 %
Operating expenses $ 597.2 $ 527.9 (11.6)% $ 2,301.7 $ 2,489.5 8.2 %
Net operating income $ 455.0 $ 563.3 23.8 % $ 1,898.9 $ 1,733.4 (8.7)%
Non-operating income(1) $ 43.4 $ 12.2 nm $ 103.5 $ 227.1 nm
Net income attributable to T. Rowe Price Group $ 303.2 $ 379.8 25.3 % $ 1,223.0 $ 1,215.0 (.7)%
Diluted earnings per common share $ 1.17 $ 1.50 28.2 % $ 4.63 $ 4.75 2.6 %
Weighted average common shares outstanding assuming dilution 255.0 246.8 (3.2)% 260.9 250.3 (4.1)%
Adjusted(2)
Operating expenses $ 597.2 $ 626.0 4.8 % $ 2,301.7 $ 2,416.8 (3) 5.0 %
Net income attributable to T. Rowe Price Group $ 277.2 $ 304.7 9.9 % $ 1,160.3 $ 1,148.9 (4) (1.0)%
Diluted earnings per common share $ 1.07 $ 1.21 13.1 % $ 4.39 $ 4.49 2.3 %
Assets under Management (in billions)
Average assets under management $ 765.7 $ 807.6 5.5 % $ 767.9 $ 778.2 1.3 %
Ending assets under management $ 763.1 $ 810.8 6.3 % $ 763.1 $ 810.8 6.3 %
(1) Non-operating income varies from year to year due to a number of factors; accordingly the percentage change in non-operating income is not believed to be
meaningful.
(2) See the reconciliation to the comparable U.S. GAAP measures at the end of this earnings release.
(3) Excludes the impact of the $66.2 million charge net of insurance recovery related to the Dell appraisal rights matter and $6.5 million in operating expenses
related to the firm's consolidated sponsored investment portfolios.
(4) Excludes the after-tax impact of the $66.2 million charge net of insurance recovery related to the Dell appraisal rights matter, offset by $69.1 million of T.
Rowe Price's portion of net income from the consolidated sponsored investment portfolios and $106.0 million of other non-operating income.
2
Assets Under Management
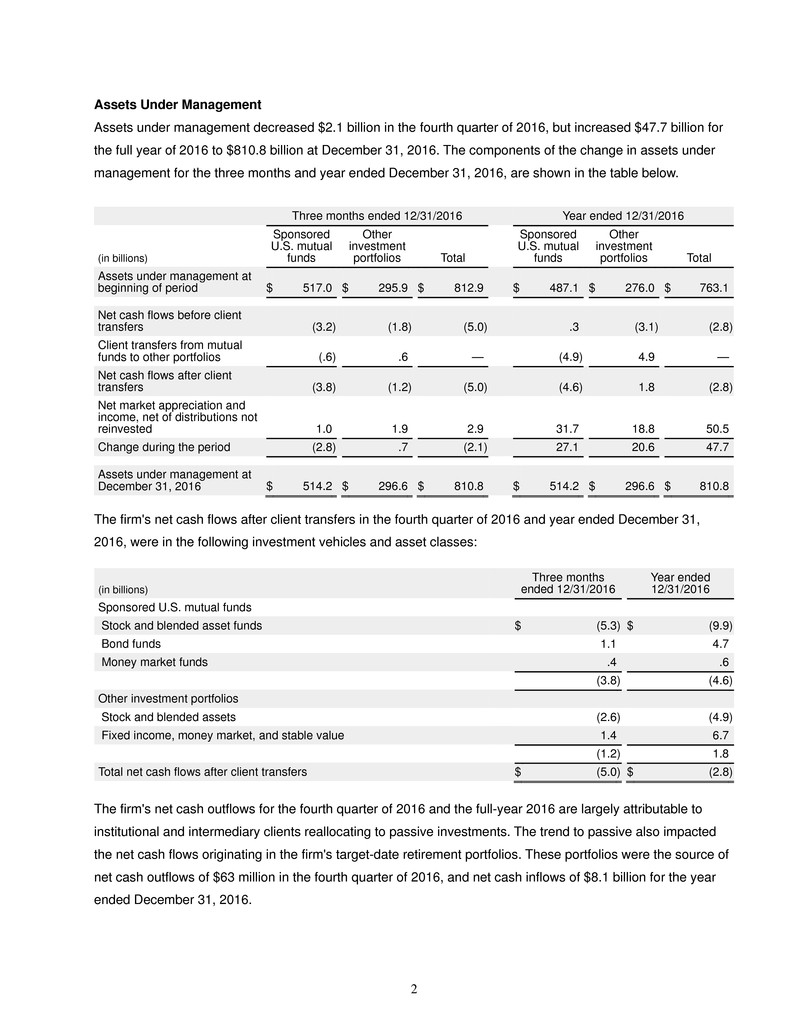
Assets under management decreased $2.1 billion in the fourth quarter of 2016, but increased $47.7 billion for
the full year of 2016 to $810.8 billion at December 31, 2016. The components of the change in assets under
management for the three months and year ended December 31, 2016, are shown in the table below.
Three months ended 12/31/2016 Year ended 12/31/2016
(in billions)
Sponsored U.S. mutual funds
Other investment portfolios Total
Sponsored U.S. mutual funds
Other investment portfolios Total
Assets under management at beginning of period $ 517.0 $ 295.9 $ 812.9 $ 487.1
$ 276.0 $ 763.1
Net cash flows before client transfers (3.2) (1.8) (5.0) .3
(3.1) (2.8)
Client transfers from mutual
funds to other portfolios (.6) .6 — (4.9) 4.9 —
Net cash flows after client transfers (3.8) (1.2) (5.0) (4.6) 1.8 (2.8)
Net market appreciation and income, net of distributions not reinvested 1.0 1.9 2.9 31.7
18.8 50.5
Change during the period (2.8) .7 (2.1) 27.1 20.6 47.7
Assets under management at
December 31, 2016 $ 514.2 $ 296.6 $ 810.8 $ 514.2
$ 296.6 $ 810.8
The firm's net cash flows after client transfers in the fourth quarter of 2016 and year ended December 31,
2016, were in the following investment vehicles and asset classes:
(in billions) Three months ended 12/31/2016 Year ended 12/31/2016
Sponsored U.S. mutual funds
Stock and blended asset funds $ (5.3) $ (9.9)
Bond funds 1.1 4.7
Money market funds .4 .6
(3.8) (4.6)
Other investment portfolios
Stock and blended assets (2.6) (4.9)
Fixed income, money market, and stable value 1.4 6.7
(1.2) 1.8
Total net cash flows after client transfers $ (5.0) $ (2.8)
The firm's net cash outflows for the fourth quarter of 2016 and the full-year 2016 are largely attributable to
institutional and intermediary clients reallocating to passive investments. The trend to passive also impacted
the net cash flows originating in the firm's target-date retirement portfolios. These portfolios were the source of
net cash outflows of $63 million in the fourth quarter of 2016, and net cash inflows of $8.1 billion for the year
ended December 31, 2016.
3
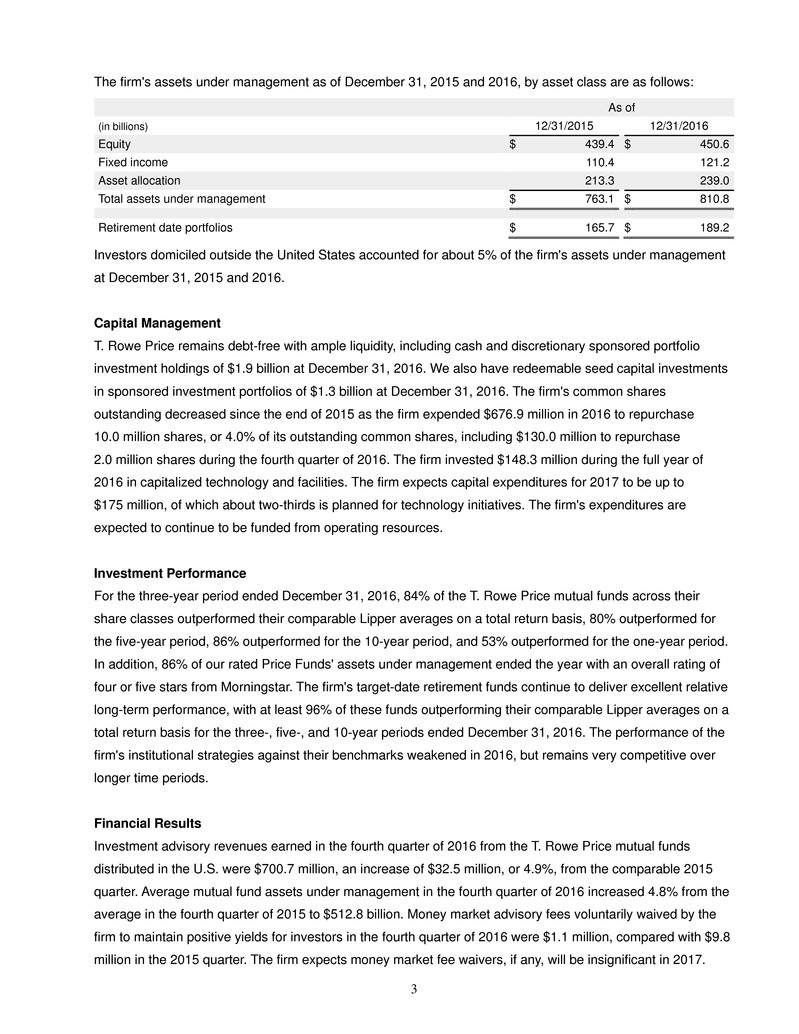
The firm's assets under management as of December 31, 2015 and 2016, by asset class are as follows:
As of
(in billions) 12/31/2015 12/31/2016
Equity $ 439.4 $ 450.6
Fixed income 110.4 121.2
Asset allocation 213.3 239.0
Total assets under management $ 763.1 $ 810.8
Retirement date portfolios $ 165.7 $ 189.2
Investors domiciled outside the United States accounted for about 5% of the firm's assets under management
at December 31, 2015 and 2016.
Capital Management
T. Rowe Price remains debt-free with ample liquidity, including cash and discretionary sponsored portfolio
investment holdings of $1.9 billion at December 31, 2016. We also have redeemable seed capital investments
in sponsored investment portfolios of $1.3 billion at December 31, 2016. The firm's common shares
outstanding decreased since the end of 2015 as the firm expended $676.9 million in 2016 to repurchase
10.0 million shares, or 4.0% of its outstanding common shares, including $130.0 million to repurchase
2.0 million shares during the fourth quarter of 2016. The firm invested $148.3 million during the full year of
2016 in capitalized technology and facilities. The firm expects capital expenditures for 2017 to be up to
$175 million, of which about two-thirds is planned for technology initiatives. The firm's expenditures are
expected to continue to be funded from operating resources.
Investment Performance
For the three-year period ended December 31, 2016, 84% of the T. Rowe Price mutual funds across their
share classes outperformed their comparable Lipper averages on a total return basis, 80% outperformed for
the five-year period, 86% outperformed for the 10-year period, and 53% outperformed for the one-year period.
In addition, 86% of our rated Price Funds' assets under management ended the year with an overall rating of
four or five stars from Morningstar. The firm's target-date retirement funds continue to deliver excellent relative
long-term performance, with at least 96% of these funds outperforming their comparable Lipper averages on a
total return basis for the three-, five-, and 10-year periods ended December 31, 2016. The performance of the
firm's institutional strategies against their benchmarks weakened in 2016, but remains very competitive over
longer time periods.
Financial Results
Investment advisory revenues earned in the fourth quarter of 2016 from the T. Rowe Price mutual funds
distributed in the U.S. were $700.7 million, an increase of $32.5 million, or 4.9%, from the comparable 2015
quarter. Average mutual fund assets under management in the fourth quarter of 2016 increased 4.8% from the
average in the fourth quarter of 2015 to $512.8 billion. Money market advisory fees voluntarily waived by the
firm to maintain positive yields for investors in the fourth quarter of 2016 were $1.1 million, compared with $9.8
million in the 2015 quarter. The firm expects money market fee waivers, if any, will be insignificant in 2017.
4
Investment advisory revenues earned in the fourth quarter of 2016 from other investment portfolios were
$266.1 million, an increase of $8.3 million, or 3.2%, from the comparable 2015 quarter. Average assets under
management in the fourth quarter of 2016 were $294.8 billion, an increase of 6.7% from the average in the
fourth quarter of 2015.
Operating expenses, excluding the $100.0 million insurance recovery related to the Dell appraisal rights
matter, were $627.9 million in the fourth quarter of 2016, an increase of $30.7 million from the comparable
2015 quarter. Based on planned initiatives, the firm currently expects that its planned operating expenses,
excluding the net charge related to the Dell appraisal rights matter, will grow in the high single-digit range in
2017 versus 2016. The firm could elect to moderate the pace of spending on its planned initiatives should
markets decline significantly. In addition, other events not currently planned or expected could impact the
firm's expense levels.
Compensation and related costs increased $24.8 million from the fourth quarter of 2015, due primarily to
additional headcount, increases in bonus and stock based compensation, and higher benefits. Average staff
size increased by 5.6% from the fourth quarter of 2015, and the firm employed 6,329 associates at
December 31, 2016.
Advertising and promotion costs were $27.2 million in the fourth quarter of 2016, compared with $27.0 million
in the comparable 2015 period. The firm currently expects advertising and promotion costs for 2017 to be up to
10% higher than the 2016 year as the firm executes on a number of strategic initiatives.
Occupancy and facility costs, together with depreciation expense were $78.7 million in the fourth quarter of
2016, an increase of $6.1 million, or 8.4%, compared to the fourth quarter of 2015. The increase is primarily
attributable to the added costs to update and enhance technology capabilities, including related maintenance
programs, and to renovate existing facilities.
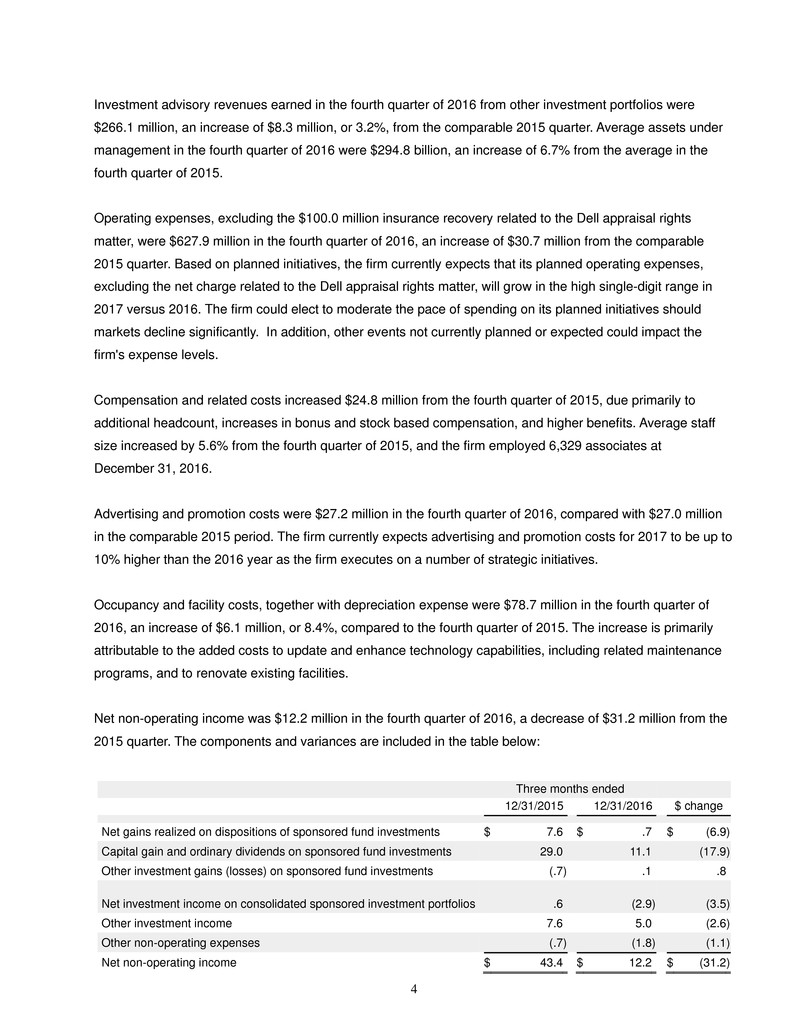
Net non-operating income was $12.2 million in the fourth quarter of 2016, a decrease of $31.2 million from the
2015 quarter. The components and variances are included in the table below:
Three months ended
12/31/2015 12/31/2016 $ change
Net gains realized on dispositions of sponsored fund investments $ 7.6 $ .7 $ (6.9)
Capital gain and ordinary dividends on sponsored fund investments 29.0 11.1 (17.9)
Other investment gains (losses) on sponsored fund investments (.7 ) .1 .8
Net investment income on consolidated sponsored investment portfolios .6
(2.9) (3.5)
Other investment income 7.6 5.0 (2.6)
Other non-operating expenses (.7 ) (1.8) (1.1)
Net non-operating income $ 43.4 $ 12.2 $ (31.2)
5
As compared to the prior year, the firm consolidates a larger number of sponsored investment portfolios in
which it is deemed to have a controlling interest. The consolidation of these portfolios results in the recognition
of each portfolio's investment income and operating expenses in the firm's consolidated statement of income,
including the portion attributable to unrelated third party investors. The portion attributable to third party
investors is removed from the firm's net income to arrive at net income attributable to T. Rowe Price Group,
which is used in the calculation of earnings per share. A table detailing the impact on the firm's consolidated
statement of income is included in the tables at the end of this earnings release.
The firm's effective tax rate for the fourth quarter of 2016 was 36.3%, which contributed to the 36.0% effective
tax rate for 2016. The firm currently estimates its effective tax rate for 2017 will be about 36.5%. The firm's
2017 estimate assumes the tax benefits earned from stock-based compensation will be similar to those earned
in 2016.
Management Commentary
William J. Stromberg, the company’s president and chief executive officer, commented: “U.S. stocks advanced
sharply in the fourth quarter of 2016, lifting major indexes to record highs and resulting in strong full-year gains
for many investors. Economic growth finished 2016 on a strong note and investors grew more optimistic that
the incoming administration and Congress will succeed in reducing regulations and taxes. International equity
markets delivered positive but less strong results, held back by a strengthening U.S. dollar. Fixed income
returns suffered in the quarter as interest rates rose following the U.S. elections. Full year returns, though,
were solid, led by high yield and emerging market bonds.
“We experienced net cash outflows for the fourth quarter and the year, largely as a result of clients reallocating
from active U.S. equity strategies to passive products. The trend to passive has been persistent and has
accelerated in recent years. We cannot predict when it will reach a new equilibrium. Over the long term though,
we expect well-executed active management to play an important ongoing role for investors and we are
reinvesting in our company with the objective of sustaining the strong investment and service results we have
historically achieved for our clients.
“Our previously announced initiatives in product, distribution, and technology are moving ahead as planned.
We are expanding our asset allocation business to meet the growing demands of global solution-seeking
investors. We are continuing the buildout of our distribution capabilities to capitalize on opportunities in key
markets outside of the U.S., as well as with intermediaries in the U.S., where regulatory changes are creating
opportunities. And we are investing to enhance our clients’ technology-enabled experiences across all of our
businesses. For example, our new T. Rowe Price ActivePlus Portfolios discretionary advice service was beta
tested this past quarter and is formally launching to clients in early 2017.
6
“As we invest to strengthen our company for the long term, we have continued to return cash to stockholders in
the near term paying $541 million of dividends and investing $677 million to repurchase 4% of our shares in
2016. Over the past three years, we have returned a total of $4.1 billion to stockholders in dividends and share
repurchases, more than 110% of our net earnings over this period of time.
“This is a time of significant change in the asset management industry and we are responding by investing to
strengthen our long-term value proposition to our clients and to our stockholders. We believe that delivering
excellent long-term net investment performance to our clients with outstanding service and support will lead to
attractive stockholder returns over time.”
Other Matters
The financial results presented in this release are unaudited. KPMG LLP is currently completing its audits of
the firm's 2016 consolidated financial statements and internal controls over financial reporting at December 31,
2016. The firm expects that KPMG will complete its work in early February and that it will then file its Form
10-K Annual Report for 2016 with the U.S. Securities and Exchange Commission. The Form 10-K will include
additional information, including the firm's audited consolidated financial statements, management's report on
internal controls over financial reporting at December 31, 2016, and the reports of KPMG.
Certain statements in this earnings release may represent “forward-looking information,” including information
relating to anticipated changes in revenues, net income and earnings per common share, anticipated changes
in the amount and composition of assets under management, anticipated expense levels, estimated tax rates,
and expectations regarding financial results, future transactions, new products and services, investments,
capital expenditures, dividends, stock repurchases, and other market conditions. For a discussion concerning
risks and other factors that could affect future results, see the firm's 2015 Form 10-K.
Founded in 1937, Baltimore-based T. Rowe Price (troweprice.com) is a global investment management
organization that provides a broad array of mutual funds, subadvisory services, and separate account
management for individual and institutional investors, retirement plans, and financial intermediaries. The
organization also offers a variety of sophisticated investment planning and guidance tools. T. Rowe Price's
disciplined, risk-aware investment approach focuses on diversification, style consistency, and fundamental
research.
CONTACT T. ROWE PRICE, PUBLIC RELATIONS
Brian Lewbart
410-345-2242
brian_lewbart@troweprice.com
Briana Wessell
410-577-8025
briana_wessell@troweprice.com
7
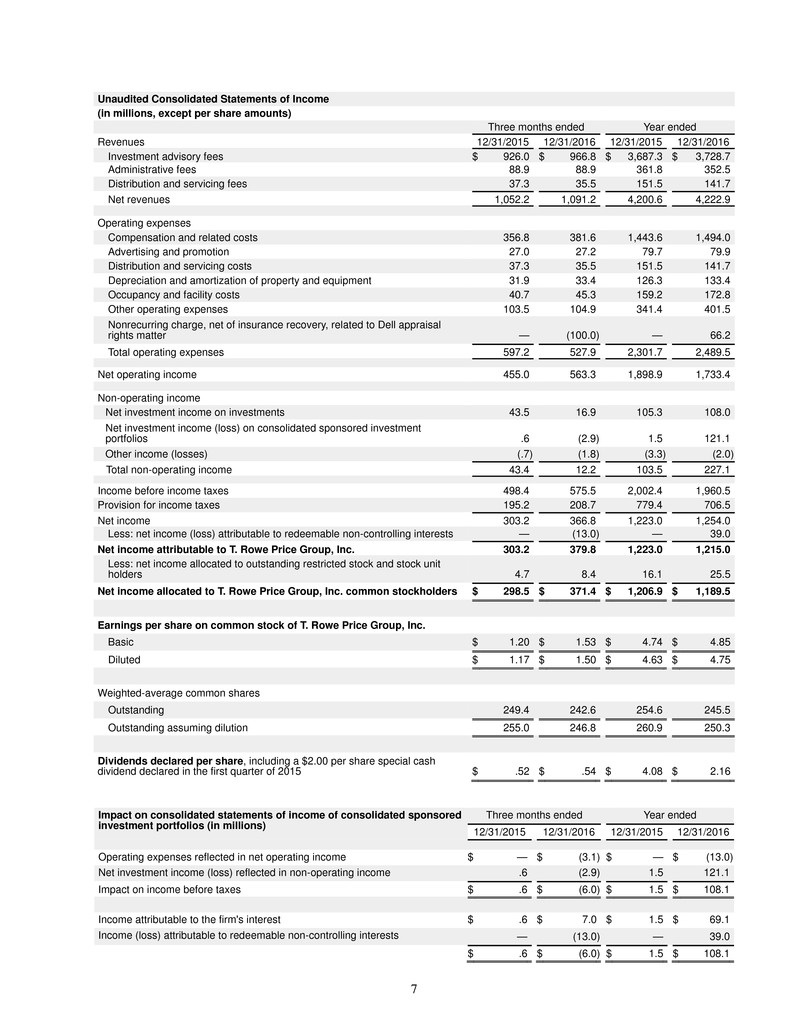
Unaudited Consolidated Statements of Income
(in millions, except per share amounts)
Three months ended Year ended
Revenues 12/31/2015 12/31/2016 12/31/2015 12/31/2016
Investment advisory fees $ 926.0 $ 966.8 $ 3,687.3 $ 3,728.7 Administrative fees 88.9 88.9 361.8 352.5
Distribution and servicing fees 37.3 35.5 151.5 141.7
Net revenues 1,052.2 1,091.2 4,200.6 4,222.9
Operating expenses
Compensation and related costs 356.8 381.6 1,443.6 1,494.0
Advertising and promotion 27.0 27.2 79.7 79.9
Distribution and servicing costs 37.3 35.5 151.5 141.7
Depreciation and amortization of property and equipment 31.9 33.4 126.3 133.4
Occupancy and facility costs 40.7 45.3 159.2 172.8
Other operating expenses 103.5 104.9 341.4 401.5
Nonrecurring charge, net of insurance recovery, related to Dell appraisal rights matter — (100.0) — 66.2
Total operating expenses 597.2 527.9 2,301.7 2,489.5
Net operating income 455.0 563.3 1,898.9 1,733.4
Non-operating income
Net investment income on investments 43.5 16.9 105.3 108.0
Net investment income (loss) on consolidated sponsored investment portfolios .6 (2.9) 1.5 121.1
Other income (losses) (.7) (1.8) (3.3) (2.0)
Total non-operating income 43.4 12.2 103.5 227.1
Income before income taxes 498.4 575.5 2,002.4 1,960.5
Provision for income taxes 195.2 208.7 779.4 706.5
Net income 303.2 366.8 1,223.0 1,254.0 Less: net income (loss) attributable to redeemable non-controlling interests — (13.0) — 39.0
Net income attributable to T. Rowe Price Group, Inc. 303.2 379.8 1,223.0 1,215.0
Less: net income allocated to outstanding restricted stock and stock unit holders 4.7 8.4 16.1 25.5
Net income allocated to T. Rowe Price Group, Inc. common stockholders $ 298.5 $ 371.4 $ 1,206.9 $ 1,189.5
Earnings per share on common stock of T. Rowe Price Group, Inc.
Basic $ 1.20 $ 1.53 $ 4.74 $ 4.85
Diluted $ 1.17 $ 1.50 $ 4.63 $ 4.75
Weighted-average common shares
Outstanding 249.4 242.6 254.6 245.5
Outstanding assuming dilution 255.0 246.8 260.9 250.3
Dividends declared per share, including a $2.00 per share special cash dividend declared in the first quarter of 2015 $ .52 $ .54
$ 4.08 $ 2.16
Impact on consolidated statements of income of consolidated sponsored
investment portfolios (in millions) Three months ended Year ended 12/31/2015 12/31/2016 12/31/2015 12/31/2016
Operating expenses reflected in net operating income $ — $ (3.1) $ — $ (13.0)
Net investment income (loss) reflected in non-operating income .6 (2.9 ) 1.5 121.1
Impact on income before taxes $ .6 $ (6.0) $ 1.5 $ 108.1
Income attributable to the firm's interest $ .6 $ 7.0 $ 1.5 $ 69.1
Income (loss) attributable to redeemable non-controlling interests — (13.0 ) — 39.0
$ .6 $ (6.0) $ 1.5 $ 108.1
8
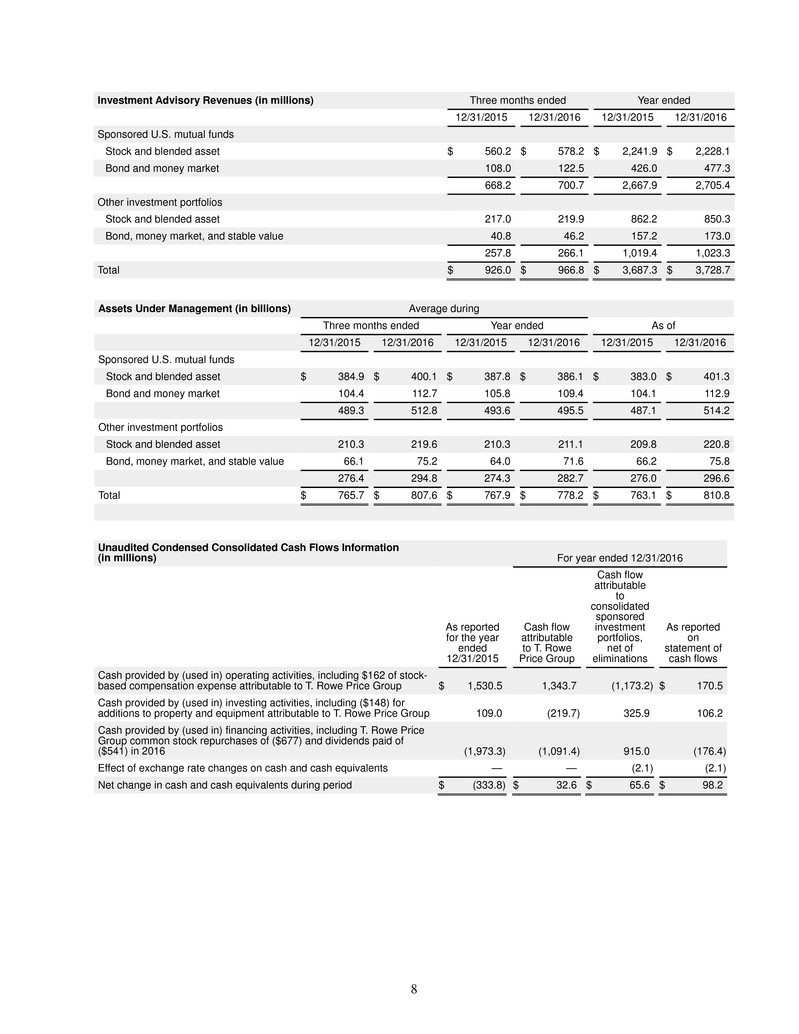
Investment Advisory Revenues (in millions) Three months ended Year ended
12/31/2015 12/31/2016 12/31/2015 12/31/2016
Sponsored U.S. mutual funds
Stock and blended asset $ 560.2 $ 578.2 $ 2,241.9 $ 2,228.1
Bond and money market 108.0 122.5 426.0 477.3
668.2 700.7 2,667.9 2,705.4
Other investment portfolios
Stock and blended asset 217.0 219.9 862.2 850.3
Bond, money market, and stable value 40.8 46.2 157.2 173.0
257.8 266.1 1,019.4 1,023.3
Total $ 926.0 $ 966.8 $ 3,687.3 $ 3,728.7
Assets Under Management (in billions) Average during
Three months ended Year ended As of
12/31/2015 12/31/2016 12/31/2015 12/31/2016 12/31/2015 12/31/2016
Sponsored U.S. mutual funds
Stock and blended asset $ 384.9 $ 400.1 $ 387.8 $ 386.1 $ 383.0 $ 401.3
Bond and money market 104.4 112.7 105.8 109.4 104.1 112.9
489.3 512.8 493.6 495.5 487.1 514.2
Other investment portfolios
Stock and blended asset 210.3 219.6 210.3 211.1 209.8 220.8
Bond, money market, and stable value 66.1 75.2 64.0 71.6 66.2 75.8
276.4 294.8 274.3 282.7 276.0 296.6
Total $ 765.7 $ 807.6 $ 767.9 $ 778.2 $ 763.1 $ 810.8
Unaudited Condensed Consolidated Cash Flows Information (in millions) For year ended 12/31/2016
As reported
for the year ended
12/31/2015
Cash flow
attributable to T. Rowe
Price Group
Cash flow attributable
to consolidated sponsored
investment portfolios, net of
eliminations
As reported
on statement of
cash flows
Cash provided by (used in) operating activities, including $162 of stock-
based compensation expense attributable to T. Rowe Price Group $ 1,530.5 1,343.7
(1,173.2) $ 170.5
Cash provided by (used in) investing activities, including ($148) for
additions to property and equipment attributable to T. Rowe Price Group 109.0 (219.7) 325.9 106.2
Cash provided by (used in) financing activities, including T. Rowe Price
Group common stock repurchases of ($677) and dividends paid of ($541) in 2016 (1,973.3) (1,091.4) 915.0 (176.4)
Effect of exchange rate changes on cash and cash equivalents — — (2.1) (2.1)
Net change in cash and cash equivalents during period $ (333.8) $ 32.6 $ 65.6 $ 98.2
9
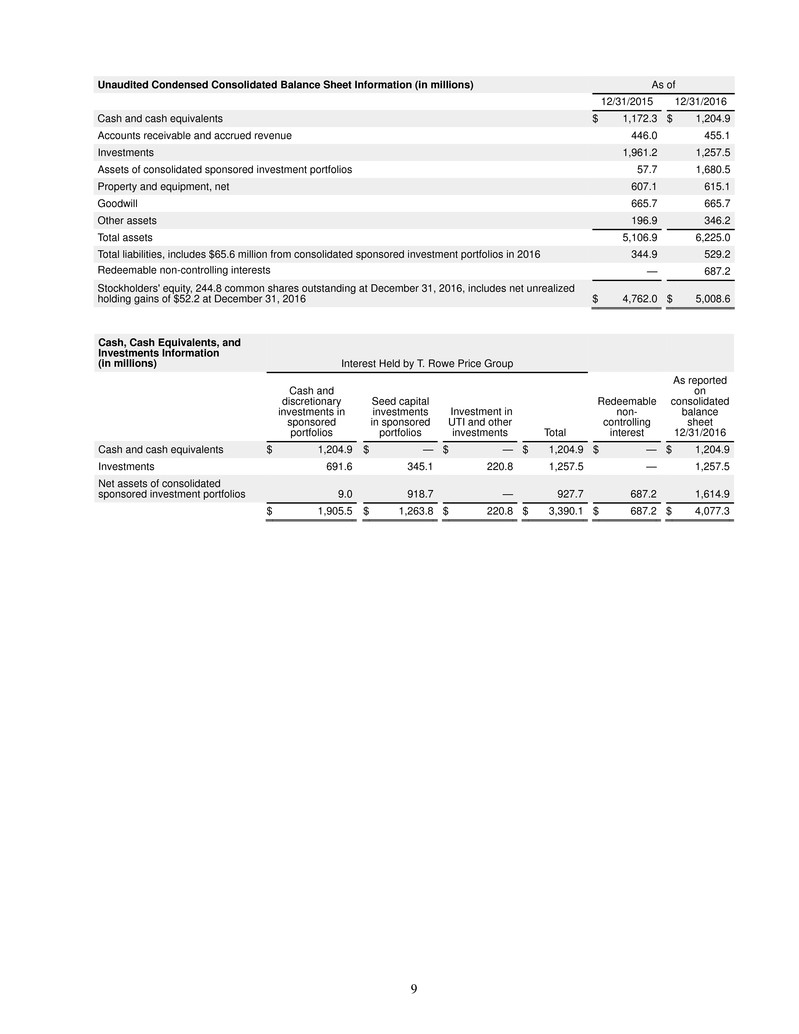
Unaudited Condensed Consolidated Balance Sheet Information (in millions) As of
12/31/2015 12/31/2016
Cash and cash equivalents $ 1,172.3 $ 1,204.9
Accounts receivable and accrued revenue 446.0 455.1
Investments 1,961.2 1,257.5
Assets of consolidated sponsored investment portfolios 57.7 1,680.5
Property and equipment, net 607.1 615.1
Goodwill 665.7 665.7
Other assets 196.9 346.2
Total assets 5,106.9 6,225.0
Total liabilities, includes $65.6 million from consolidated sponsored investment portfolios in 2016 344.9 529.2
Redeemable non-controlling interests — 687.2
Stockholders' equity, 244.8 common shares outstanding at December 31, 2016, includes net unrealized
holding gains of $52.2 at December 31, 2016 $ 4,762.0 $ 5,008.6
Cash, Cash Equivalents, and
Investments Information (in millions) Interest Held by T. Rowe Price Group
Cash and discretionary
investments in sponsored portfolios
Seed capital
investments in sponsored portfolios
Investment in
UTI and other investments Total
Redeemable
non-controlling interest
As reported
on consolidated
balance sheet 12/31/2016
Cash and cash equivalents $ 1,204.9 $ — $ — $ 1,204.9 $ — $ 1,204.9
Investments 691.6 345.1 220.8 1,257.5 — 1,257.5
Net assets of consolidated
sponsored investment portfolios 9.0 918.7 — 927.7
687.2 1,614.9
$ 1,905.5 $ 1,263.8 $ 220.8 $ 3,390.1 $ 687.2 $ 4,077.3
10
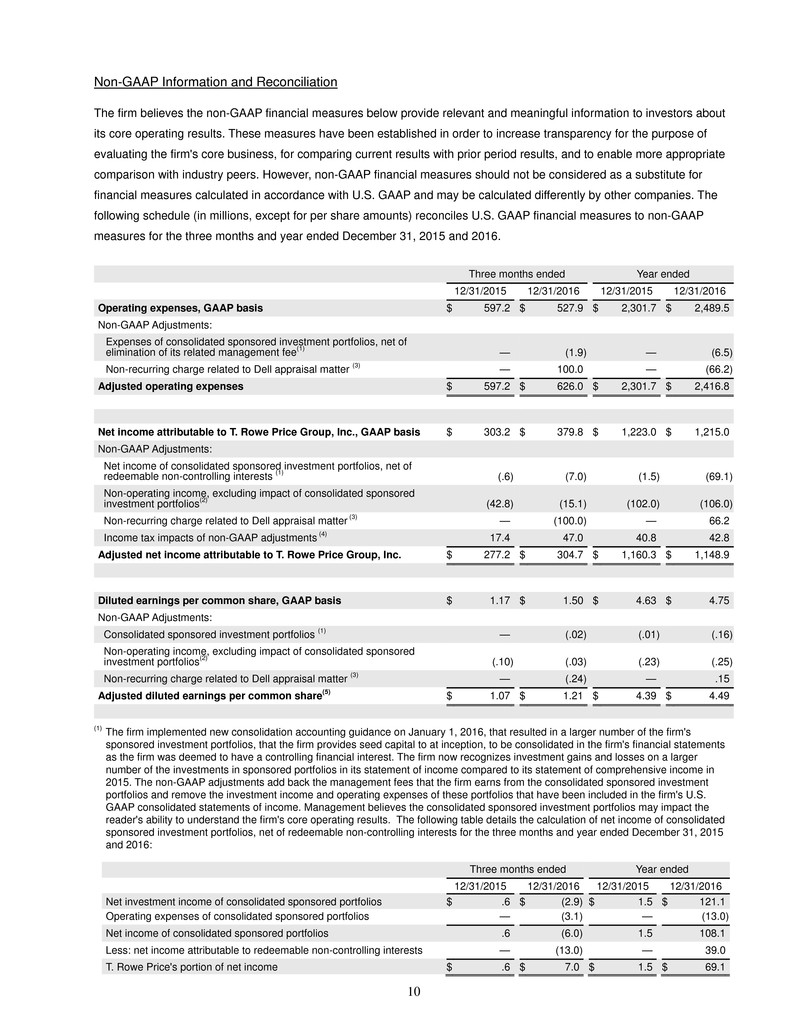
Non-GAAP Information and Reconciliation
The firm believes the non-GAAP financial measures below provide relevant and meaningful information to investors about
its core operating results. These measures have been established in order to increase transparency for the purpose of
evaluating the firm's core business, for comparing current results with prior period results, and to enable more appropriate
comparison with industry peers. However, non-GAAP financial measures should not be considered as a substitute for
financial measures calculated in accordance with U.S. GAAP and may be calculated differently by other companies. The
following schedule (in millions, except for per share amounts) reconciles U.S. GAAP financial measures to non-GAAP
measures for the three months and year ended December 31, 2015 and 2016.
Three months ended Year ended
12/31/2015 12/31/2016 12/31/2015 12/31/2016
Operating expenses, GAAP basis $ 597.2 $ 527.9 $ 2,301.7 $ 2,489.5
Non-GAAP Adjustments:
Expenses of consolidated sponsored investment portfolios, net of
elimination of its related management fee(1) — (1.9 ) — (6.5)
Non-recurring charge related to Dell appraisal matter (3) — 100.0 — (66.2)
Adjusted operating expenses $ 597.2 $ 626.0 $ 2,301.7 $ 2,416.8
Net income attributable to T. Rowe Price Group, Inc., GAAP basis $ 303.2 $ 379.8 $ 1,223.0 $ 1,215.0
Non-GAAP Adjustments:
Net income of consolidated sponsored investment portfolios, net of redeemable non-controlling interests (1) (.6) (7.0 ) (1.5) (69.1)
Non-operating income, excluding impact of consolidated sponsored investment portfolios(2) (42.8) (15.1 ) (102.0) (106.0)
Non-recurring charge related to Dell appraisal matter (3) — (100.0 ) — 66.2
Income tax impacts of non-GAAP adjustments (4) 17.4 47.0 40.8 42.8
Adjusted net income attributable to T. Rowe Price Group, Inc. $ 277.2 $ 304.7 $ 1,160.3 $ 1,148.9
Diluted earnings per common share, GAAP basis $ 1.17 $ 1.50 $ 4.63 $ 4.75
Non-GAAP Adjustments:
Consolidated sponsored investment portfolios (1) — (.02 ) (.01) (.16)
Non-operating income, excluding impact of consolidated sponsored
investment portfolios(2) (.10) (.03 ) (.23) (.25)
Non-recurring charge related to Dell appraisal matter (3) — (.24 ) — .15
Adjusted diluted earnings per common share(5) $ 1.07 $ 1.21 $ 4.39 $ 4.49
(1) The firm implemented new consolidation accounting guidance on January 1, 2016, that resulted in a larger number of the firm's
sponsored investment portfolios, that the firm provides seed capital to at inception, to be consolidated in the firm's financial statements
as the firm was deemed to have a controlling financial interest. The firm now recognizes investment gains and losses on a larger
number of the investments in sponsored portfolios in its statement of income compared to its statement of comprehensive income in
2015. The non-GAAP adjustments add back the management fees that the firm earns from the consolidated sponsored investment
portfolios and remove the investment income and operating expenses of these portfolios that have been included in the firm's U.S.
GAAP consolidated statements of income. Management believes the consolidated sponsored investment portfolios may impact the
reader's ability to understand the firm's core operating results. The following table details the calculation of net income of consolidated
sponsored investment portfolios, net of redeemable non-controlling interests for the three months and year ended December 31, 2015
and 2016:
Three months ended Year ended
12/31/2015 12/31/2016 12/31/2015 12/31/2016
Net investment income of consolidated sponsored portfolios $ .6 $ (2.9) $ 1.5 $ 121.1
Operating expenses of consolidated sponsored portfolios — (3.1 ) — (13.0)
Net income of consolidated sponsored portfolios .6 (6.0 ) 1.5 108.1
Less: net income attributable to redeemable non-controlling interests — (13.0 ) — 39.0
T. Rowe Price's portion of net income $ .6 $ 7.0 $ 1.5 $ 69.1
11
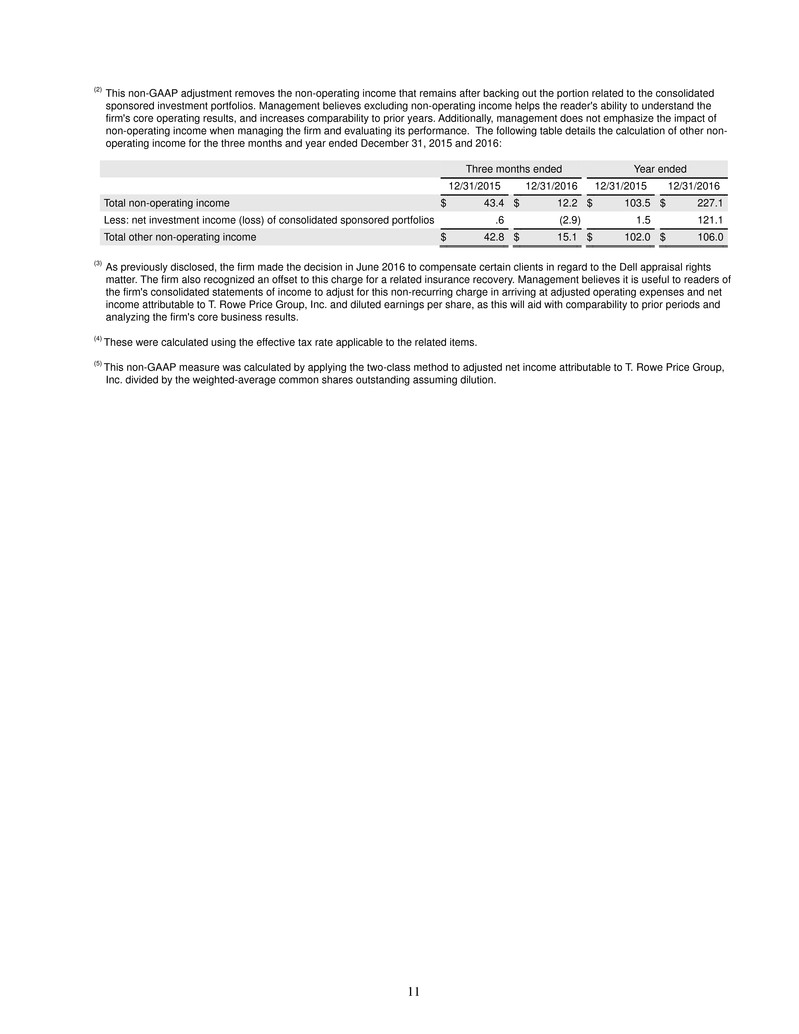
(2) This non-GAAP adjustment removes the non-operating income that remains after backing out the portion related to the consolidated
sponsored investment portfolios. Management believes excluding non-operating income helps the reader's ability to understand the
firm's core operating results, and increases comparability to prior years. Additionally, management does not emphasize the impact of
non-operating income when managing the firm and evaluating its performance. The following table details the calculation of other non-
operating income for the three months and year ended December 31, 2015 and 2016:
Three months ended Year ended
12/31/2015 12/31/2016 12/31/2015 12/31/2016
Total non-operating income $ 43.4 $ 12.2 $ 103.5 $ 227.1
Less: net investment income (loss) of consolidated sponsored portfolios .6 (2.9 ) 1.5 121.1
Total other non-operating income $ 42.8 $ 15.1 $ 102.0 $ 106.0
(3) As previously disclosed, the firm made the decision in June 2016 to compensate certain clients in regard to the Dell appraisal rights
matter. The firm also recognized an offset to this charge for a related insurance recovery. Management believes it is useful to readers of
the firm's consolidated statements of income to adjust for this non-recurring charge in arriving at adjusted operating expenses and net
income attributable to T. Rowe Price Group, Inc. and diluted earnings per share, as this will aid with comparability to prior periods and
analyzing the firm's core business results.
(4) These were calculated using the effective tax rate applicable to the related items.
(5) This non-GAAP measure was calculated by applying the two-class method to adjusted net income attributable to T. Rowe Price Group,
Inc. divided by the weighted-average common shares outstanding assuming dilution.
