Attached files
| file | filename |
|---|---|
| EX-99.5 - EXHIBIT 99.5 - INNOVATE Corp. | s001514x3_ex99-5.htm |
| EX-99.4 - EXHIBIT 99.4 - INNOVATE Corp. | s001514x3_ex99-4.htm |
| EX-99.3 - EXHIBIT 99.3 - INNOVATE Corp. | s001514x3_ex99-3.htm |
| EX-99.2 - EXHIBIT 99.2 - INNOVATE Corp. | s001514x3_ex99-2.htm |
| EX-99.1 - EXHIBIT 99.1 - INNOVATE Corp. | s001514x3_ex99-1.htm |
| 8-K - FORM 8-K - INNOVATE Corp. | s001514x3_8k.htm |
Exhibit 99.6
INVESTOR PRESENTATION MATERIALS

HC2 HOLDINGS, INC. © HC2 Holdings, Inc. 2017 Investor Presentation January 26, 2017

© 2 0 1 7 H C 2 H OL D I NGS , I NC. HC2 Holdings, Inc. 9 Wh o We Are Wh at We Do Di v e r s i f i e d h o l d i n g c omp a n y P e rma n e n t c a p i t a l S t r a t e g i c a n d f i n a n c i a l p a r t n e r T e am o f v i s i o n a r i e s B u y a n d b u i l d c omp a n i e s E x e c u t e b u s i n e s s p l a n s De l i v e r s u s t a i n a b l e v a l u e f o r s h a r e h o l d e r s

© 2017 HC2 HOLDINGS, INC. Clear focus on delivering sustainable value for all stakeholders Value operator with long-term outlook Acquire controlling equity interests in diverse industries creating value through growth in operating subsidiaries Strong capital base allows funding of subsidiary growth Speed of execution gives HC2 a competitive advantage over traditional private equity firms Envision Execute Empower –Seek to build value over the long-term –Expansive network results in unique deal flow –Target a barbell investment strategy •Stable cash flow generation •Early-stage companies with option value Envision –Partner with experienced management teams –Establish specific operating objectives –Provide financial expertise –Execute strategy Empower Management –Focus on speed of execution –Capitalize on opportunities –Deliver sustainable value Execute HC2 Value Philosophy 10

© 2 0 1 7 H C 2 H OL D I NGS , I NC. HC2 Company Snapshot 11 Early Stage and Other Holdings Core Operating Subsidiaries One of the largest steel fabrication and erection companies in the U.S. Recently changed name to DBM Global Inc. Offers full suite of integrated steel construction and professional services 92% ownership Manufacturing: DBM GLOBAL (SCHUFF) Marine Services: GMSL Leading provider of subsea cable installation, maintenance and protection in telecom, offshore power and oil & gas JV’s with Huawei Marine Networks & S.B. Submarine Systems (China Telecom) Acquired 100% interest in offshore renewables specialist CWind 95% ownership Premier distributor of natural gas motor fuel throughout the U.S. Currently own or operate ~40 natural gas fueling stations throughout United States; Up from two stations since HC2’s initial investment in August 2014 49.9% ownership Utilities: ANG Telecom: PTGI ICS One of the largest International wholesale telecom service companies Global sales presence Internal and scalable offshore back office operations 100% ownership Life Sciences: PANSEND BeneVir: Oncolytic viral immunotherapy for treatment of solid cancer tumors R2 Dermatology: Medical device to brighten skin based on Mass. General Hospital technology Genovel: Novel, patented, “Mini Knee” and “Anatomical Knee” replacements MediBeacon: Unique non-invasive real-time monitoring of kidney function Triple Ring Technologies: R&D engineering company specializing in medical devices, homeland security , imaging, sensors, optics, fluidics, robotics & mobile healthcare Nervve: Provider of video and image search technology for information extraction and powerful analytics applications Dusenberry Martin Racing: Owns worldwide exclusive licensing rights to NASCAR® simulation style racing titles on interactive entertainment platforms Other: Core Financial Services Subsidiaries Newly formed insurance unit Executive Chair: James P. Corcoran Acquisition of American Financial Group’s (“AFG”) long-term care and life insurance businesses 100% ownership ~$76m of statutory surplus ~$2.1b in total GAAP assets Insurance: CIG All data as of September 30, 2016 except number of ANG stations which include stations acquired through acquisition of Questar Fueling Co. and Constellation CNG as announced on December 20, 2016.

Overview of Investments

© 2017 HC2 HOLDINGS, INC. Select Customers: DBM Global Inc. (Schuff Intl.) – Company Snapshot 14 DBM Global Inc. is focused on delivering world class, sustainable value to its clients through a highly collaborative portfolio of companies which provide better designs, more efficient construction and superior asset management solutions. The Company offers integrated steel construction services from a single source and professional services which include design-assist, design-build, engineering, BIM participation, 3D steel modeling/detailing, fabrication, advanced field erection, project management, and state-of-the-art steel management systems. Major market segments include commercial, healthcare, convention centers, stadiums, gaming and hospitality, mixed use and retail, industrial, public works, bridges, transportation, and international projects. Facilities in the U.S. and Panama (JV) Founded in 1976 and headquartered in Phoenix, AZ Business Description: Wilshire Grand Rustin Roach – President and CEO Michael Hill – CFO and Treasurer Scott Sherman – VP, General Counsel Select Management: Apple World Headquarters

© 2017 HC2 HOLDINGS, INC. CORE ACTIVITIES The largest structural steel fabricator and erector in the U.S. In-house structural & design engineering expertise Provides structural steel fabrication & erection services for smaller projects leveraging subcontractors and in-house project managers Manufactures equipment for use in the petrochemical oil & gas industries, such as: pollution control scrubbers, tunnel liners, pressure vessels, strainers, filters & separators A highly experienced global Detailing and 3D BIM Modelling company A global Building Information Modelling (BIM), Steel Detailing and Rebar Detailing firm PRODUCTS AND SERVICE OFFERINGS Structural Steel fabrication Steel erection services Structural engineering & design services Preconstruction engineering services BIM (Building Information Modeling) Project Management (proprietary SIMS plat.) Structural Steel fabrication (subcontracted) Steel erection services (subcontracted) Project Management (proprietary SIMS platform) Design engineering Fabrication services Steel Detailing 3D BIM Modelling BIM Management Integrated Project Delivery (IPD) 3D Animation and Visualization Steel Detailing Rebar Detailing 3D BIM Modelling Connection Design Forensic Modelling & Animation INDUSTRIES SERVED Commercial Conv. & Event Centers Energy Government Healthcare Industrial & Mining Infrastructure Leisure Retail Transportation Commercial Government Healthcare Leisure Retail Transportation Petrochemical Oil & gas infrastructure Pipelines Commercial Conv. & Event Centers Energy Government Healthcare Industrial & Mining Infrastructure Leisure Retail Transportation Commercial Conv. & Event Centers Energy Government Healthcare Industrial & Mining Infrastructure Leisure Retail Transportation

© 2017 HC2 HOLDINGS, INC. $526.1 $513.8 $506.0 $0.0 $100.0 $200.0 $300.0 $400.0 $500.0 $600.0 PF 2014 2015 LTM 9/30/16 DBM Global Historical Financial Summary 16 Revenue(1) Adj. EBITDA(1) Free Cash Flow(1) (2) Backlog(1) $45.8 $52.0 $53.8 8.7% 10.1% 10.6% 0.0% 2.0% 4.0% 6.0% 8.0% 10.0% 12.0% 14.0% $0.0 $10.0 $20.0 $30.0 $40.0 $50.0 $60.0 $70.0 PF 2014 2015 LTM 9/30/16 Adj. EBITDA Adj. EBITDA Margin % $2.9 $2.9 $8.2 $8.0 $2.1 $3.1 $42.9 $49.1 $45.6 $0.0 $10.0 $20.0 $30.0 $40.0 $50.0 PF 2014 2015 LTM 9/30/16 Maintenance CapEx Growth CapEx $357.0 $380.8 $318.2 >$500.0 $0.0 $100.0 $200.0 $300.0 $400.0 $500.0 PF 2014 2015 9/30/16 ($USD millions) 1.Includes pro forma financials for the 5 months ended May 26, 2014, prior to our acquisition of a controlling interest. 2.Free Cash Flow defined as Adjusted EBITDA less Maintenance Capital Expenditures. Total Backlog is >$500.0 million inclusive of contracts awarded, but not yet signed
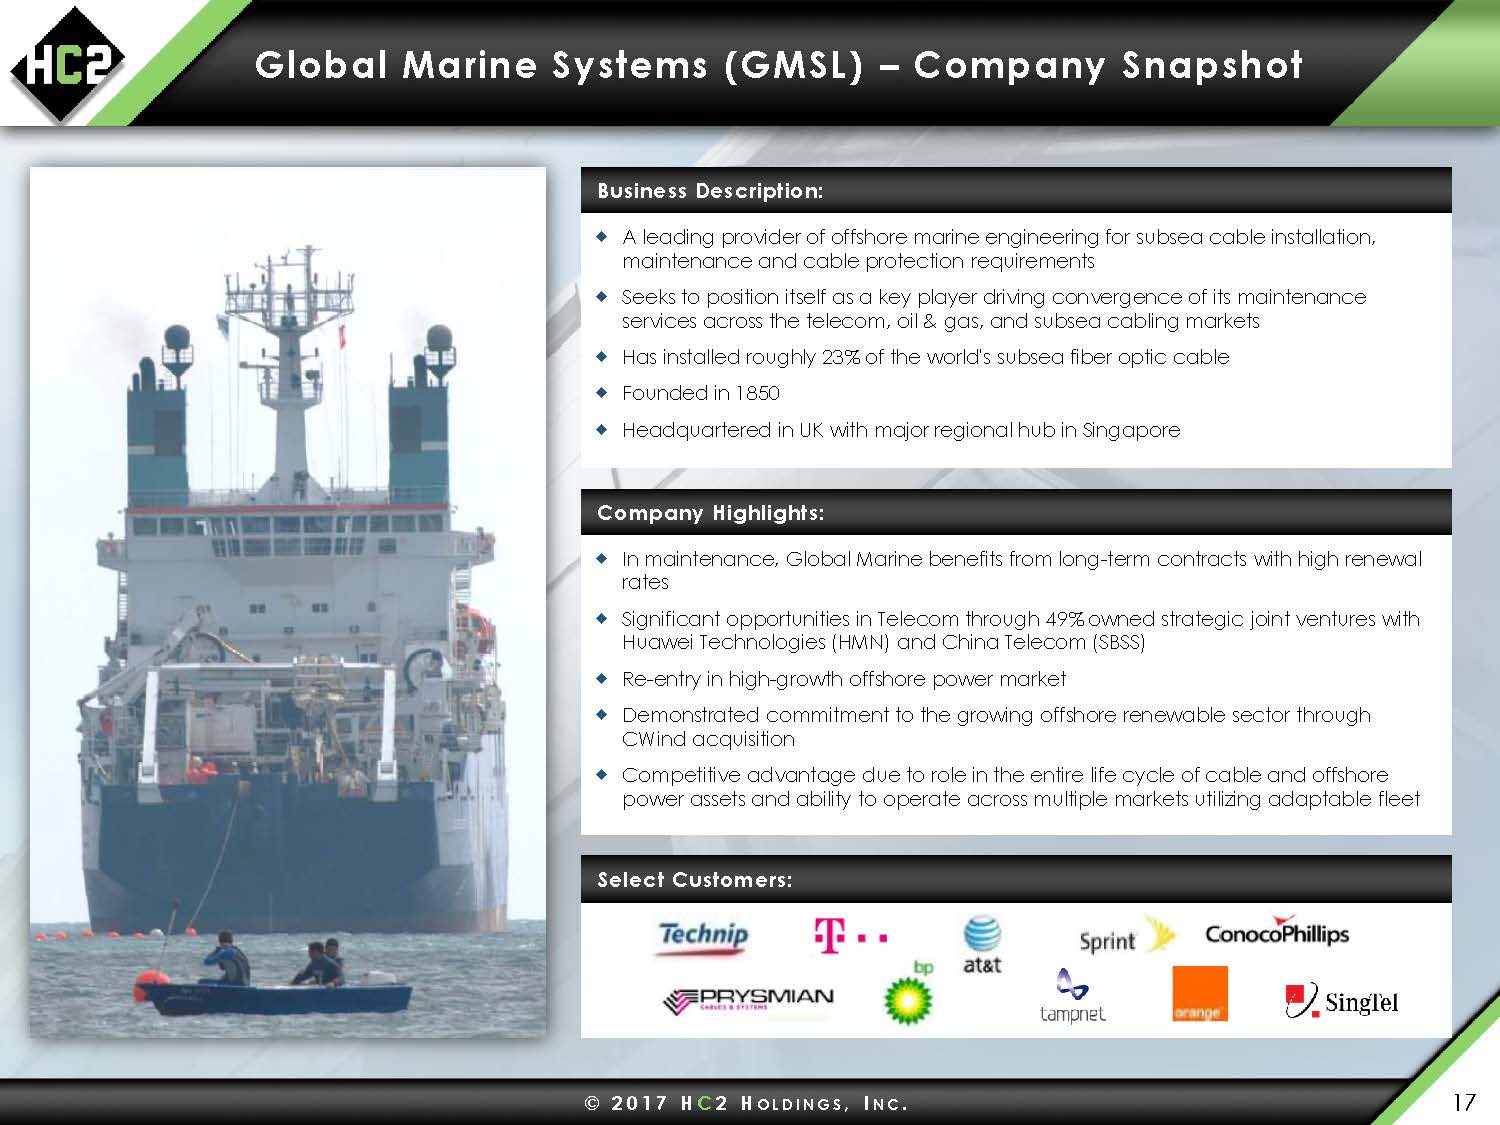
© 2017 HC2 HOLDINGS, INC. Global Marine Systems (GMSL) – Company Snapshot 17 A leading provider of offshore marine engineering for subsea cable installation, maintenance and cable protection requirements Seeks to position itself as a key player driving convergence of its maintenance services across the telecom, oil & gas, and subsea cabling markets Has installed roughly 23% of the world's subsea fiber optic cable Founded in 1850 Headquartered in UK with major regional hub in Singapore Business Description: In maintenance, Global Marine benefits from long-term contracts with high renewal rates Significant opportunities in Telecom through 49% owned strategic joint ventures with Huawei Technologies (HMN) and China Telecom (SBSS) Re-entry in high-growth offshore power market Demonstrated commitment to the growing offshore renewable sector through CWind acquisition Competitive advantage due to role in the entire life cycle of cable and offshore power assets and ability to operate across multiple markets utilizing adaptable fleet Company Highlights: Select Customers:

© 2017 HC2 HOLDINGS, INC. Global Marine Systems (GMSL) – Company Snapshot 18 TELECOM MAINTENANCE TELECOM INSTALLATION OFFSHORE POWER OIL & GAS CORE ACTIVITIES Provision of vessels on standby to repair fiber optic telecom cables in defined geographic zones Location of fault, cable recovery, jointing and re-deployment of cables Operation of depots storing cable and spare parts across the globe Management of customer data through the life of the cable system Provision of turnkey repeated telecom systems via Huawei Marine Networks (“HMN”) joint-venture “Installation only” contracts for telecom customers Services include route planning, route survey, cable mapping, route engineering, laying, trenching and burial at all depths Installation for inter-array power cables for offshore wind market Re-entered market in November 2015 after expiry of non-compete with Prysmian Acquired majority interest in offshore renewables specialist CWind Offshore wind construction support services Fiber optic communications and power infrastructure to offshore platforms Inter-platform and subsea well command & control and power Permanent Reservoir Monitoring (“PRM”) systems Maintenance & Repair VESSELS Cable Retriever Pacific Guardian Wave Sentinel Wave Venture Cable Innovator CS Sovereign Networker Cable Innovator CS Sovereign Cable Innovator CS Sovereign Networker JOINT VENTURE Sino British Submarine Systems in Asia (SBSS) Joint venture (49%) with China Telecom International Cableship Pte Ltd (“ICPL”), joint venture (30%) with SingTel and ASEAN Cableship SCDPL – joint venture (40%) with SingTel Huawei Marine Networks Joint venture (49%) with Huawei Technologies Sino British Submarine Systems in Asia (SBSS) Joint venture (49%) with China Telecom Sino British Submarine Systems in Asia Joint venture (49%) with China Telecom Sino British Submarine Systems in Asia Joint venture (49%) with China Telecom

© 2017 HC2 HOLDINGS, INC. Global Marine Historical Financial Summary 19 $50.0 $42.1 $37.0 29.8% 31.2% 25.5% 0% 10% 20% 30% 40% 50% 60% $0.0 $10.0 $20.0 $30.0 $40.0 $50.0 $60.0 PF 2014 2015 LTM 9/30/16 Adj. EBITDA Adj. EBITDA Margin $3.3 $4.8 $4.4 $5.9 $5.5 $3.3 $10.7 $9.9 $0.0 $5.0 $10.0 $15.0 $20.0 $25.0 PF 2014 2015 LTM 9/30/16 Maintenance Growth Revenue(1) Adj. EBITDA(1) Capital Expenditures(1) Free Cash Flow(1) (3) $46.7 $37.3 $32.6 $0.0 $10.0 $20.0 $30.0 $40.0 $50.0 $60.0 PF 2014 2015 LTM 9/30/16 $86.2 $84.6 $107.4 $39.3 $30.9 $34.5 $42.1 $19.4 $3.4 $167.7 $134.9 $145.3 $0.0 $50.0 $100.0 $150.0 $200.0 PF 2014 2015 LTM 9/30/16 Maintenance Telecom Install O&G / Power Install ($USD millions) (2) 1.Financials adjusted for discontinued operations. Includes pro forma financials for the period ending Sept. 22, 2014, prior to our acquisition of a controlling interest. 2.LTM 9/30/16 Maintenance Revenue reflects the acquisition of CWind, which occurred in February 2016. 3.Free Cash Flow defined as Adjusted EBITDA less Maintenance Capital Expenditures.

© 2017 HC2 HOLDINGS, INC. American Natural Gas – Company Snapshot 20 Designs, builds, owns, operates and maintains compressed natural gas commercial fueling stations for transportation Current HC2 ownership 49.9% with ability to increase to 63% In-depth experience in the natural gas fueling industry Building a premier nationwide network of publicly accessible heavy duty CNG fueling stations throughout the United States designed and located to serve fleet customers –Recently acquired 18 CNG stations from Questar Fueling Co. and Constellation CNG(1) –Currently ~40 stations owned and/or operated –Expect to expand station footprint via organic and select M&A opportunities American transportation sector is rapidly converting from foreign-dependent diesel fuel to clean burning natural gas: –Dramatically reduces emissions –Extends truck life –Significantly reduces fuel cost Given the cost effectiveness of CNG, its environmental friendliness and the abundance of natural gas reserves in the United States, CNG is the best candidate for alternatives to gasoline and diesel for the motor vehicle market LTM Revenue and Adj. EBITDA of $7 million and $2 million, respectively 1.As announced on December 20, 2016.

© 2017 HC2 HOLDINGS, INC. PTGi International Carrier Services (“PTGi ICS”) 21 Leading international wholesale telecom service company providing voice and data call termination to the telecom industry worldwide Provides transit and termination of telephone calls through its own global network of next-generation IP soft switches and media gateways, connecting the networks of incumbent telephone companies, mobile operators and OTT companies worldwide Restructured in 2014 PTGI ICS now delivers industry leading technology via best of breed sales and operational support teams –3Q16: Sixth consecutive quarter of positive Adjusted EBITDA In business since 1997, recognized as a trusted business partner globally Headquartered in Herndon, Virginia with representation across North America, South America, the Middle East and Europe LTM Revenue and Adj. EBITDA of $701 million and $5 million, respectively All data as of September 30, 2016.

© 2017 HC2 HOLDINGS, INC. Continental Insurance Group – Company Snapshot 22 Continental Insurance Group (“CIG”) provides long-term care, life and annuity coverage that help protect policy and certificate holders from the financial hardships associated with illness, injury, loss of life, or income continuation The formation of CIG to invest in the long-term care and life insurance sector is consistent with HC2’s overall strategy of taking advantage of dislocated and undervalued operating businesses Through CIG, HC2 intends to build an attractive platform of insurance businesses James P. Corcoran, Executive Chair, has extensive experience in the insurance industry on both the corporate and regulatory side as the former Superintendent of Insurance of the State of New York Combined measures as of September 30, 2016: –Statutory Surplus ~$76 million –GAAP Assets of ~$2.1 billion Recently completed merging CGI and UTA into one legal entity(1) –Meaningful cost savings, lower required statutory capital 1.Merger and re-domestication as Texas-based company completed December 2016.

© 2017 HC2 HOLDINGS, INC. Pansend Life Sciences 23 HC2’s Life Sciences Segment Is Focused on the Development of Innovative Healthcare Technologies and Products 80% equity ownership of company focused on immunotherapy; Oncolytic virotherapy for treatment of solid cancer tumors Founded by Dr. Matthew Mulvey & Dr. Ian Mohr (who co-developed T-Vec); Biovex (owner of T-Vec) acquired by Amgen for ~$1billion Benevir’s T-Stealth is a second generation oncolytic virus with new features and new intellectual property BeneVir holds exclusive worldwide license to develop BV-2711 (T-Stealth) 61% equity ownership of dermatology company focused on lightening and brightening skin Founded by Pansend in partnership with Mass. General Hospital and inventors Dr. Rox Anderson, Dieter Manstein and Dr. Henry Chan Over $10 billion global market 77% equity ownership in company with unique knee replacements based on technology from Dr. Peter Walker, NYU Dept. of Orthopedic Surgery and one of the pioneers of the original Total Knee. “Mini-Knee” for early osteoarthritis of the knee “Anatomical Knee” – A Novel Total Knee Replacement Strong patent portfolio 35% equity ownership in company with unique technology and device for monitoring of real-time kidney function Current standard diagnostic tests measure kidney function are often inaccurate and not real-time MediBeacon’s Optical Renal Function Monitor will be first and only, non-invasive system to enable real-time, direct monitoring of renal function at point-of-care $3.5 billion potential market Profitable technology and product development company Areas of expertise include medical devices , homeland security, imaging systems, sensors, optics, fluidics, robotics and mobile healthcare Located in Silicon Valley and Boston area with over 90,000 square feet of working laboratory and incubator space Contract R&D market growing rapidly Customers include Fortune 500 companies and start-ups

Financial Overview

© 2017 HC2 HOLDINGS, INC. Historical Consolidated Revenue and Adj. EBITDA 25 ($USD millions) Core Operating Revenue(1) $162.0 $460.4 $701.0 $526.1 $513.8 $506.0 $167.8 $134.9 $145.3 $2.5 $6.8 $6.5 $858.4 $1,115.8 $1,358.8 $0 $200 $400 $600 $800 $1,000 $1,200 $1,400 PF 2014 2015 LTM 9/30/16 PTGi ICS DBM Global Global Marine ANGCore Operating Adj. EBITDA(1) (2) -$1.2 $2.0 $5.1 $45.8 $52.0 $53.8 $50.0 $42.1 $37.0 -$0.4 $0.9 $1.9 $94.3 $97.1 $97.8 -$10 $10 $30 $50 $70 $90 $110 PF 2014 2015 LTM 9/30/16 PTGi ICS DBM Global Global Marine ANG 1.Global Marine financials adjusted for discontinued operations. Includes pro forma DBM Global financials for the 5 months ended May 26, 2014, prior to our acquisition of a controlling interest. Includes Pro forma Global Marine financials for the period ending Sept. 22, 2014, prior to our acquisition of a controlling interest. Includes Pro forma ANG financials for the 7 months ended July 31, 2014, prior to our acquisition of a controlling interest. 2.Adjusted EBITDA does not include results of our Insurance segment. Non-Core Operating Revenue PF 2014 2015 LTM 9/30/16 CIG - $2.9 $102.7 Pansend - - - Other - 2.1 3.2 Non-Operating Corp. - - - Total Core + Non-Core $858.4 $1,120.8 $1,464.7

© 2017 HC2 HOLDINGS, INC. Free Cash Flow Generation 26 ($USD millions) 1.Free Cash Flow defined as Adjusted EBITDA less Maintenance Capital Expenditures. LTM 9/30/16Core Operating Adj. EBITDA$97.8Less: Non-Operating Corporate Adj. EBITDA$22.0Less: DBM Global Maintenance Capex8.2 Less: GMSL Maintenance Capex4.4 Less: PTGi ICS Maintenance Capex- Less: ANG Maintenance Capex0.4 Less: HC2 Capex0.3 Free Cash Flow (1)$62.4Less: DBM Global Growth Capex$3.1Less: GMSL Growth Capex5.5 Less: PTGi ICS Growth Capex0.8 Less: ANG Growth Capex6.9 Free Cash Flow after Growth Capex$46.1

Appendix

© 2 0 1 7 H C 2 H OL D I NGS , I NC. Subsidiary Capitalization 28 ($USD millions) DBM Capitalization GMSL Capitalization 1. Line of credit balance of $1.9 million was attributable to a DBM subsidiary joint venture, which was exited subsequent to September 30, 2016. Revolving Credit Facility ($50 million) $0.0 LIBOR plus 4.0% Notes 10.1 HOPSA Line of Credit(1) 1.9 Total Debt $12.0 LTM 9/30/16 Adj. EBITDA $53.8 Debt / LTM 9/30/16 Adj. EBITDA 0.2x Notes payable and revolving lines of credit $20.8 LIBOR plus 3.65% Notes 3.0 Capital Leases 52.8 Total Debt $76.6 LTM 9/30/16 Adj. EBITDA $37.0 Total Debt / LTM 9/30/16 Adj. EBITDA 2.1x

© 2017 HC2 HOLDINGS, INC. LTM 9/30/16 Adjusted EBITDA Reconciliation 29 ($USD thousands) 1.Adjusted EBITDA is not calculated for our Insurance segment, but included for purposes of reconciling to the consolidated Net income (loss) attributable to HC2 Holdings, Inc. Note: Last Twelve Months’ (“LTM”) September 30, 2016 financials are calculated as twelve months ended December 31, 2015 financials less nine months ended September 30, 2015 financials plus nine months ended September 30, 2016 financials. A breakdown of reported financials are shown for reference on a standalone basis on the following pages. When viewing the financials provided in this lender presentation in conjunction with the financials as reported in our public filings, the reader should note the following changes in segment terminology: (1) DBM Global = Manufacturing, (2) GMSL = Marine Services, (3) PTGi ICS = Telecom, (4) ANG = Utilities, and (5) Pansend = Life Sciences. Further information may be found in the HC2 Holdings, Inc. public filings. LTM September 30, 2016Other andNon-operatingHC2 HoldingsDBM GlobalGMSLPTGi ICSANGPansendEliminationsCorporateEx InsuranceInsuranceHC2 HoldingsNet Income (loss) attributable to HC2 Holdings, Inc.$28,979$11,672$7,085$123($3,536)($45,308)($33,180)($34,165)($10,360)($44,525)Depreciation and amortization1,789 20,025 512 1,908 99 2,343 4 26,680 Depreciation and amortization (included in cost of revenue)4,972 - - - - - - 4,972 Asset impairment expense- 547 - - - - - 547 (Gain) loss on sale or disposal of assets(637) (31) - - - 1 - (667) Lease termination costs- - 239 - - 1 - 240 Interest expense1,232 4,598 - 152 - 1 35,441 41,424 Other (income) expense, net(367) (439) (2,564) (409) (3,224) 16,662 (60) 9,599 Foreign currency transaction (gain) loss- (3,205) - - - - - (3,205) Income tax (benefit) expense16,025 (534) (237) (347) (1,037) 8,616 (39,684) (17,198) Loss from discontinued operations- - - - - (23) - (23) Noncontrolling interest1,409 563 - 292 (2,771) (2,063) - (2,570) Share-based compensation expense- 1,307 - 133 255 238 8,437 10,370 Acquisition and nonrecurring items428 266 18 97 23 - 6,996 7,827 Other costs- 2,181 12 - - (76) - 2,117 Adjusted EBITDA(1)$53,830$36,950$5,065$1,949($10,191)($19,608)($22,046)$45,948

© 2 0 1 7 H C 2 H OL D I NGS , I NC. 9 Months Ended 9/30/16 Adjusted EBITDA Reconciliation 30 ($USD thousands) Nine Months Ended September 30, 2016 Other and Non-operating HC2 Holdings DBM Global GMSL PTGi ICS ANG Pansend Eliminations Corporate Ex Insurance Insurance HC2 Holdings Net Income (loss) attributable to HC2 Holdings, Inc. $20,710 $8,780 $4,007 $68 ($2,991) ($21,264) ($30,417) ($21,107) ($11,978) ($33,085) Depreciation and amortization 1,263 15,747 389 1,479 87 1,050 4 20,019 Depreciation and amortization (included in cost of revenue) 3,048 - - - - - - 3,048 (Gain) loss on sale or disposal of assets (963) (10) - - - - - (973) Lease termination costs - - 179 - - - - 179 Interest expense 917 3,683 - 142 - 1 26,871 31,614 Other (income) expense, net (88) (1,190) (574) (399) (3,223) 9,888 (311) 4,103 Foreign currency transaction (gain) loss - (1,970) - - - - - (1,970) Income tax (benefit) expense 12,641 (756) - - - - (21,481) (9,596) Noncontrolling interest 1,240 510 - 249 (2,302) (2,062) - (2,365) Share-based compensation expense - 1,307 - 107 184 238 4,833 6,669 Acquisition and nonrecurring items 428 266 18 27 - - 3,335 4,073 Adjusted EBITDA(1) $39,196 $26,367 $4,019 $1,673 ($8,245) ($12,149) ($17,166) $33,694 1. Adjusted EBITDA is not calculated for our Insurance segment, but included for purposes of reconciling to the consolidated Net income (loss) attributable to HC2 Holdings, Inc.
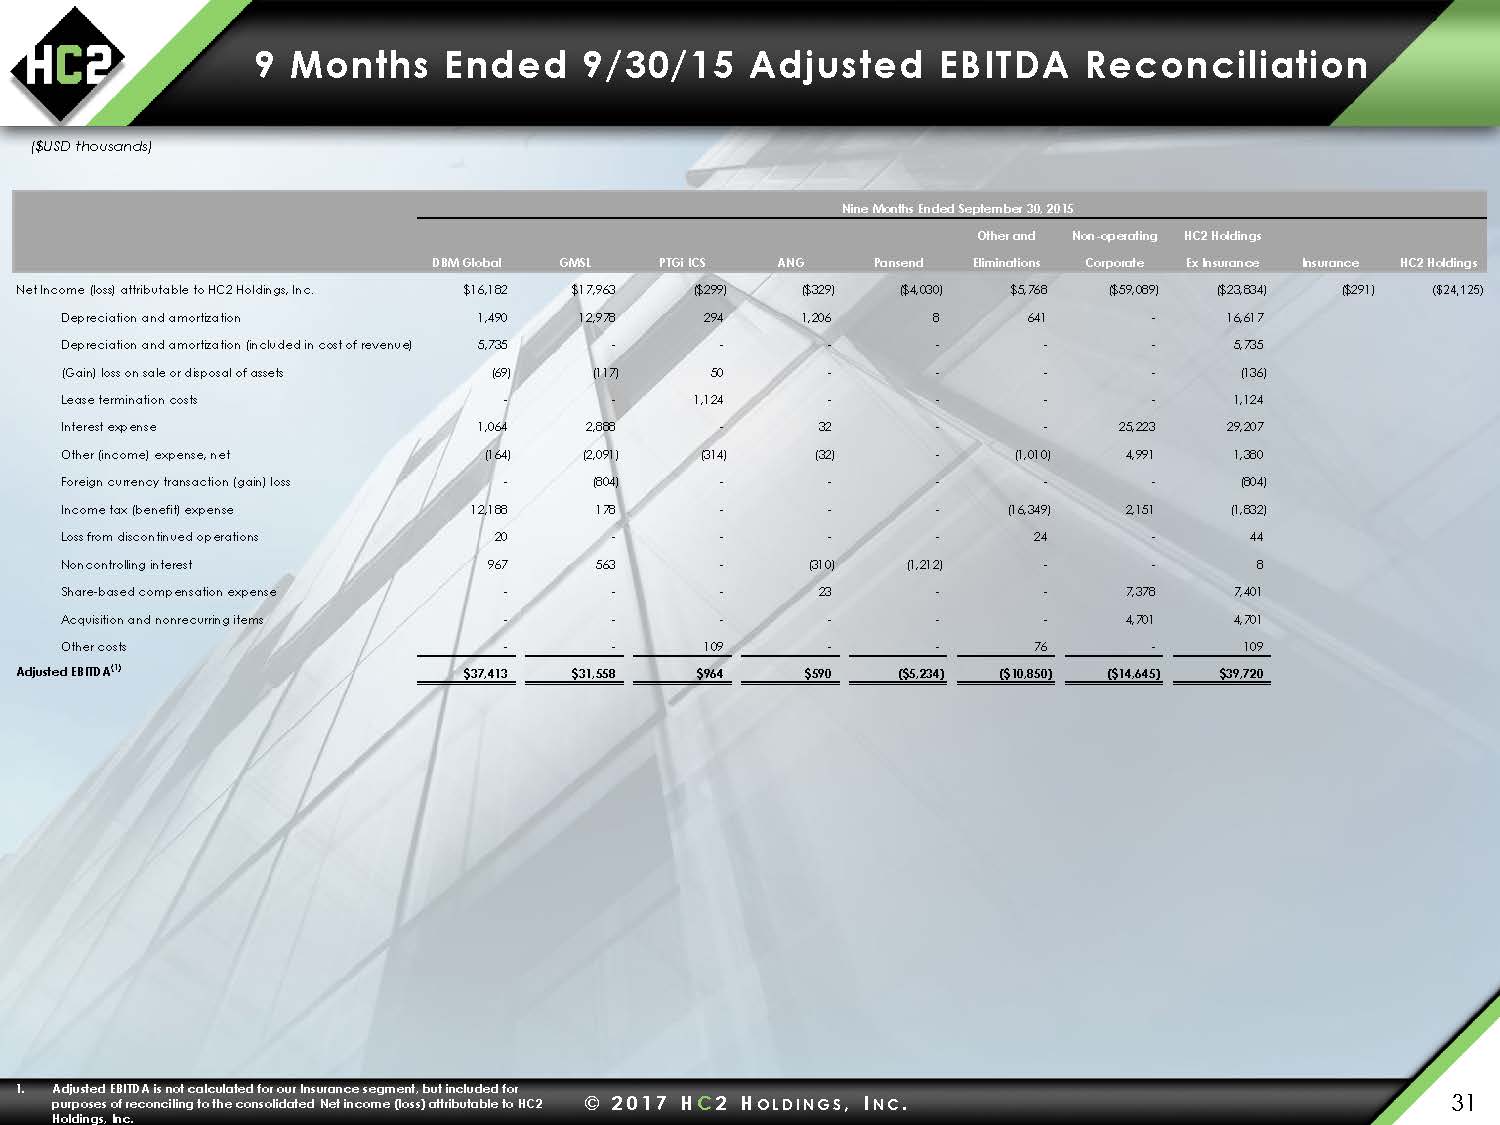
© 2 0 1 7 H C 2 H OL D I NGS , I NC. 9 Months Ended 9/30/15 Adjusted EBITDA Reconciliation 31 ($USD thousands) Nine Months Ended September 30, 2015 Other and Non-operating HC2 Holdings DBM Global GMSL PTGi ICS ANG Pansend Eliminations Corporate Ex Insurance Insurance HC2 Holdings Net Income (loss) attributable to HC2 Holdings, Inc. $16,182 $17,963 ($299) ($329) ($4,030) $5,768 ($59,089) ($23,834) ($291) ($24,125) Depreciation and amortization 1,490 12,978 294 1,206 8 641 - 16,617 Depreciation and amortization (included in cost of revenue) 5,735 - - - - - - 5,735 (Gain) loss on sale or disposal of assets (69) (117) 50 - - - - (136) Lease termination costs - - 1,124 - - - - 1,124 Interest expense 1,064 2,888 - 32 - - 25,223 29,207 Other (income) expense, net (164) (2,091) (314) (32) - (1,010) 4,991 1,380 Foreign currency transaction (gain) loss - (804) - - - - - (804) Income tax (benefit) expense 12,188 178 - - - (16,349) 2,151 (1,832) Loss from discontinued operations 20 - - - - 24 - 44 Noncontrolling interest 967 563 - (310) (1,212) - - 8 Share-based compensation expense - - - 23 - - 7,378 7,401 Acquisition and nonrecurring items - - - - - - 4,701 4,701 Other costs - - 109 - - 76 - 109 Adjusted EBITDA(1) $37,413 $31,558 $964 $590 ($5,234) ($10,850) ($14,645) $39,720 1. Adjusted EBITDA is not calculated for our Insurance segment, but included for purposes of reconciling to the consolidated Net income (loss) attributable to HC2 Holdings, Inc.
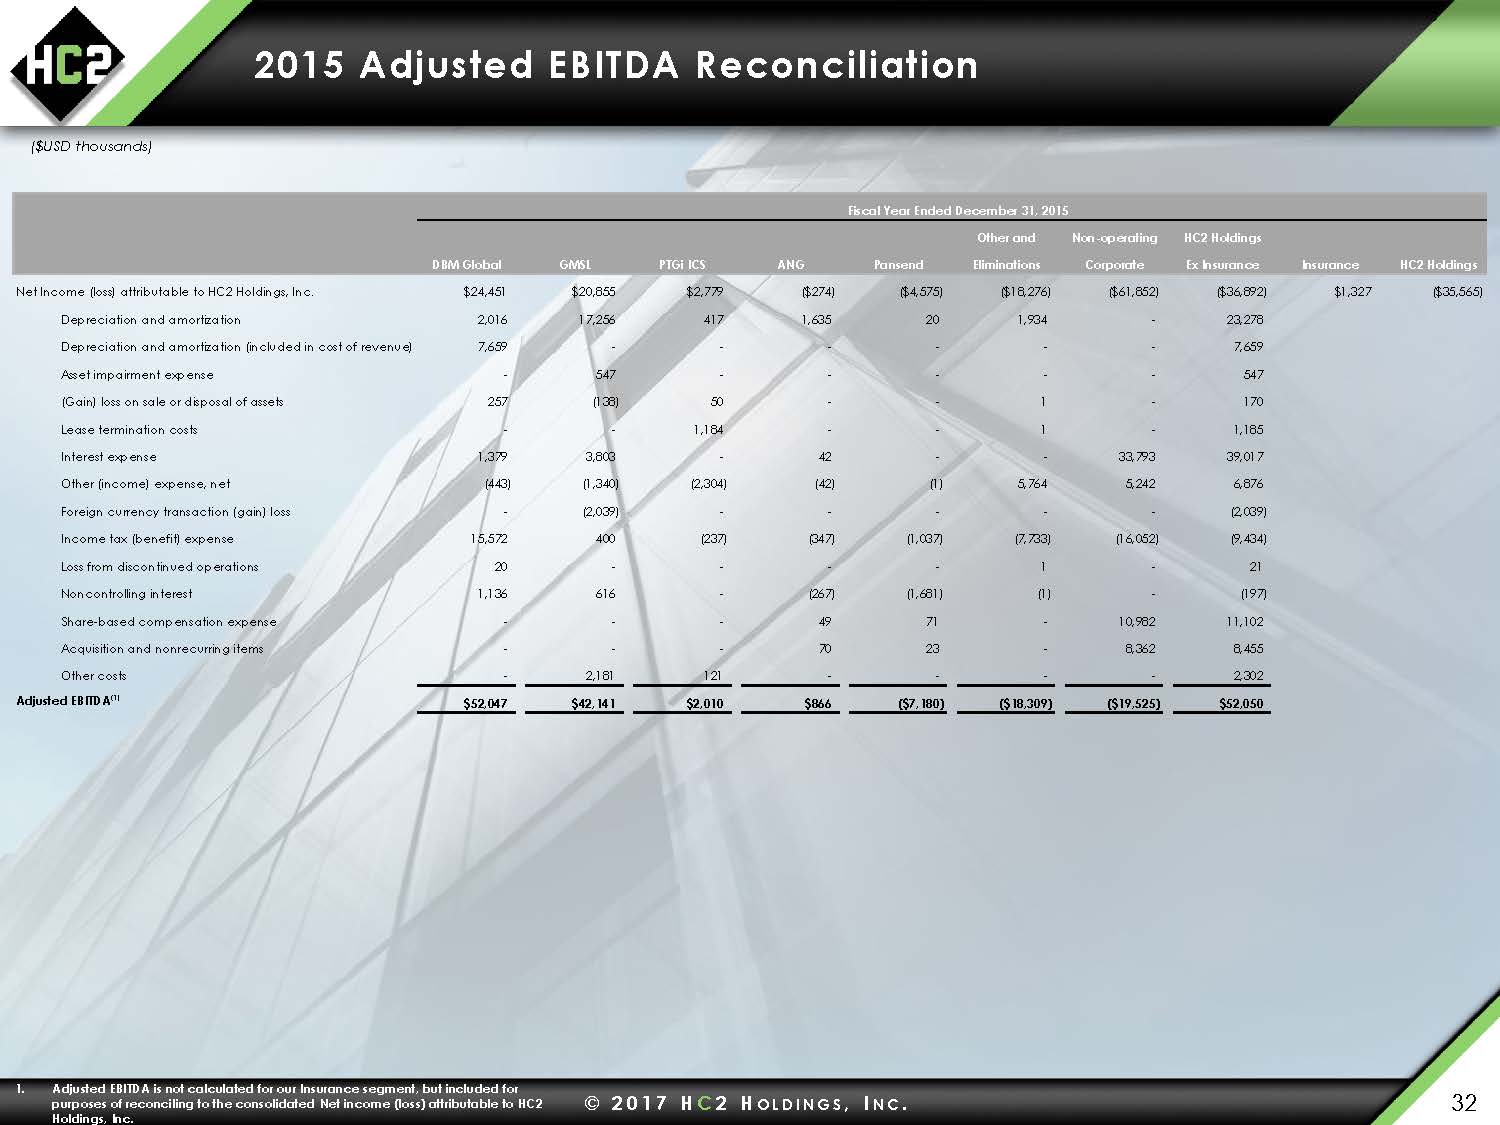
© 2 0 1 7 H C 2 H OL D I NGS , I NC. 2015 Adjusted EBITDA Reconciliation 32 ($USD thousands) Fiscal Year Ended December 31, 2015 Other and Non-operating HC2 Holdings DBM Global GMSL PTGi ICS ANG Pansend Eliminations Corporate Ex Insurance Insurance HC2 Holdings Net Income (loss) attributable to HC2 Holdings, Inc. $24,451 $20,855 $2,779 ($274) ($4,575) ($18,276) ($61,852) ($36,892) $1,327 ($35,565) Depreciation and amortization 2,016 17,256 417 1,635 20 1,934 - 23,278 Depreciation and amortization (included in cost of revenue) 7,659 - - - - - - 7,659 Asset impairment expense - 547 - - - - - 547 (Gain) loss on sale or disposal of assets 257 (138) 50 - - 1 - 170 Lease termination costs - - 1,184 - - 1 - 1,185 Interest expense 1,379 3,803 - 42 - - 33,793 39,017 Other (income) expense, net (443) (1,340) (2,304) (42) (1) 5,764 5,242 6,876 Foreign currency transaction (gain) loss - (2,039) - - - - - (2,039) Income tax (benefit) expense 15,572 400 (237) (347) (1,037) (7,733) (16,052) (9,434) Loss from discontinued operations 20 - - - - 1 - 21 Noncontrolling interest 1,136 616 - (267) (1,681) (1) - (197) Share-based compensation expense - - - 49 71 - 10,982 11,102 Acquisition and nonrecurring items - - - 70 23 - 8,362 8,455 Other costs - 2,181 121 - - - - 2,302 Adjusted EBITDA(1) $52,047 $42,141 $2,010 $866 ($7,180) ($18,309) ($19,525) $52,050 1. Adjusted EBITDA is not calculated for our Insurance segment, but included for purposes of reconciling to the consolidated Net income (loss) attributable to HC2 Holdings, Inc.

© 2017 HC2 HOLDINGS, INC. 2014 Adjusted EBITDA Reconciliation 33 ($USD thousands) 1.DBM Global includes financials pro forma for the 5 months ended May 26, 2014, prior to our acquisition of a controlling interest. 2.GMSL includes financials pro forma for the period ended September 22, 2014, prior to our acquisition of a controlling interest. 3.PTGi ICS financials do not include any pro forma adjustments. 4.ANG financials pro forma for the 7 months ended July 31, 2014, prior to our acquisition of a controlling interest. 5.Adjusted EBITDA is not calculated for our Insurance segment, but included for purposes of reconciling to the consolidated Net income (loss) attributable to HC2 Holdings, Inc. As ReportedFiscal Year Ended December 31, 2014Pro FormaHC2 HoldingsNon-operatingActualDBM Global(1)GMSL(2)PTGi ICS(3)ANG(4)PansendCorporateOtherHC2 HoldingsNet Income (loss) attributable to HC2 Holdings, Inc.($14,391)$19,278$17,718($1,068)$236($3,759)($51,410)$29,219$10,214Depreciation and amortization6,334 4,139 14,776 528 484 1 - - 19,928 Depreciation and amortization (included in cost of revenue)4,350 4,350 - - - - - - 4,350 Asset impairment expense291 - - 291 - - - - 291 (Gain) loss on sale or disposal of assets(162) (2) 104 (160) - - - - (58) Interest expense12,347 1,627 4,708 1 20 - 10,700 - 17,056 Loss on early extinguishment of debt11,969 - - - - - 11,969 - 11,969 Other (income) expense, net(702) (476) (2,410) (831) (1,431) - 217 1,610 (3,321) Income tax (benefit) expense(22,869) 13,318 1,069 58 103 - (963) (31,828) (18,243) Loss from discontinued operations146 35 3,007 - - - - 157 3,199 Noncontrolling interest2,559 3,569 3,059 - 229 (1,038) - 1 5,820 Share-based compensation expense11,028 - - - - - 11,028 - 11,028 Acquisition and related charges13,044 - 7,966 - - - 5,078 - 13,044 Adjusted EBITDA(5)$23,944$45,838$49,997($1,181)($359)($4,796)($13,381)($841)$75,277
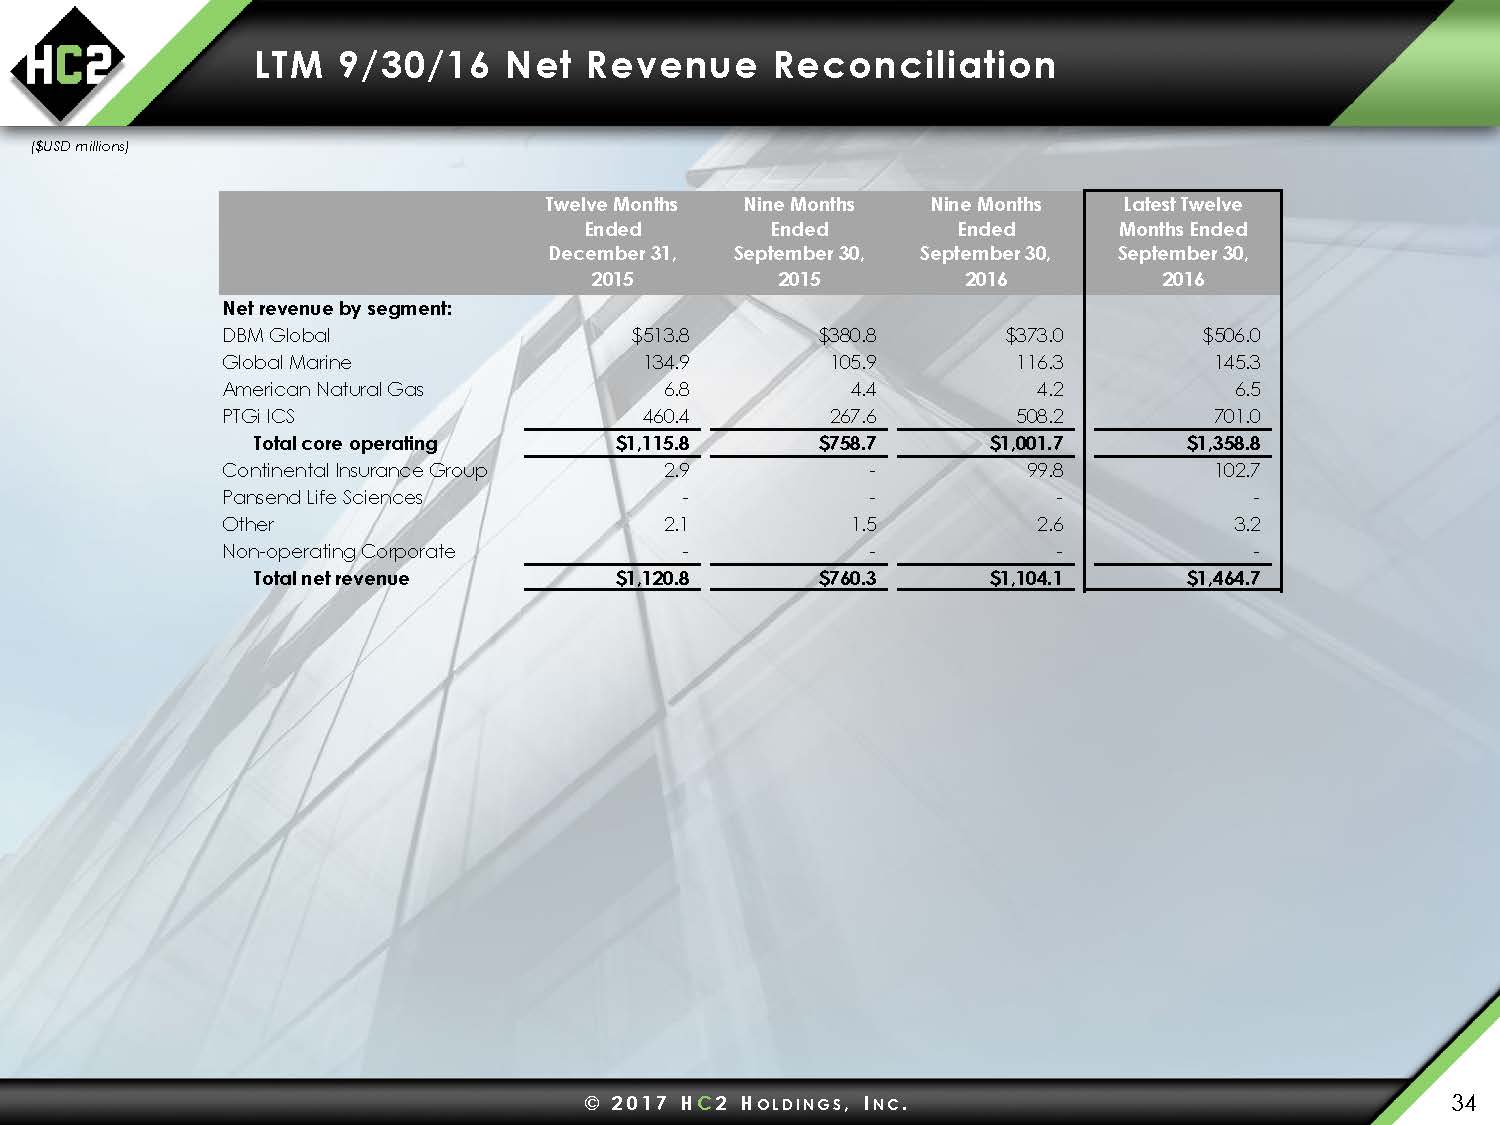
© 2017 HC2 HOLDINGS, INC. LTM 9/30/16 Net Revenue Reconciliation 34 ($USD millions) Twelve Months Ended December 31,Nine Months Ended September 30,Nine Months Ended September 30,Latest Twelve Months Ended September 30,2015201520162016Net revenue by segment:DBM Global$513.8$380.8$373.0$506.0Global Marine134.9 105.9 116.3 145.3 American Natural Gas6.8 4.4 4.2 6.5 PTGi ICS460.4 267.6 508.2 701.0 Total core operating$1,115.8$758.7$1,001.7$1,358.8Continental Insurance Group2.9 - 99.8 102.7 Pansend Life Sciences- - - - Other2.1 1.5 2.6 3.2 Non-operating Corporate- - - - Total net revenue$1,120.8$760.3$1,104.1$1,464.7

HC2 HOLDINGS, INC. © HC2 Holdings, Inc. 2017 A n d r e w G . B a c k m a n • i r @ h c 2 . c o m • 2 1 2 . 2 3 5 . 2 6 9 1 • 4 5 0 P a r k A v e n u e , 3 0 t h F l o o r , N e w Y o r k , N Y 1 0 0 2 2 January 26, 2017