Attached files
| file | filename |
|---|---|
| EX-99.1 - EXHIBIT 99.1 - COLUMBUS MCKINNON CORP | exhibit9911262017.htm |
| 8-K - 8-K RESULTS OF OPERATIONS AND FINANCIAL CONDITION 01.26.17 - COLUMBUS MCKINNON CORP | a8k1262017.htm |

© 2015 Columbus McKinnon Corporation. All Rights Reserved. Confidential and Proprietary. NASDAQ: CMCO
Timothy T. Tevens
President & Chief Executive Officer
Gregory P. Rustowicz
Vice President – Finance & Chief Financial Officer
Q3 Fiscal Year 2017
Earnings Conference Call
January 26, 2017
2
© 2017 Columbus McKinnon Corporation
These slides contain (and the accompanying oral discussion will contain) “forward-looking
statements” within the meaning of the Private Securities Litigation Reform Act of 1995. Such
statements involve known and unknown risks, uncertainties and other factors that could cause
the actual results of the Company to differ materially from the results expressed or implied by
such statements, including general economic and business conditions, conditions affecting the
industries served by the Company and its subsidiaries, conditions affecting the Company’s
customers and suppliers, competitor responses to the Company’s products and services, the
overall market acceptance of such products and services, the integration of acquisitions and
other factors disclosed in the Company’s periodic reports filed with the Securities and Exchange
Commission. Consequently such forward looking statements should be regarded as the
Company’s current plans, estimates and beliefs. The Company does not undertake and
specifically declines any obligation to publicly release the results of any revisions to these
forward-looking statements that may be made to reflect any future events or circumstances after
the date of such statements or to reflect the occurrence of anticipated or unanticipated events.
Safe Harbor Statement

3
© 2017 Columbus McKinnon Corporation
Strong Balance Sheet and Financial
Flexibility to Execute Plans
1/3 of sales in developing
markets and 2/3 in
developed markets
Organic growth (trend line):
- U.S. & Western Europe at
GDP+
- Emerging Markets at
double digits
Acquisitions:
$200 - $300 million
Continued introduction of
new products:
20% of sales
$1B in Revenue
Operating margin:
12% - 14%
Working capital/sales:
17%
Inventory turns:
6x
DSO: < 50 days
Profitable &
Efficient
Long-Term Objectives
Debt to total Capitalization:
30%
Flex to 50% for acquisitions
Financial Flexibility
4
© 2017 Columbus McKinnon Corporation
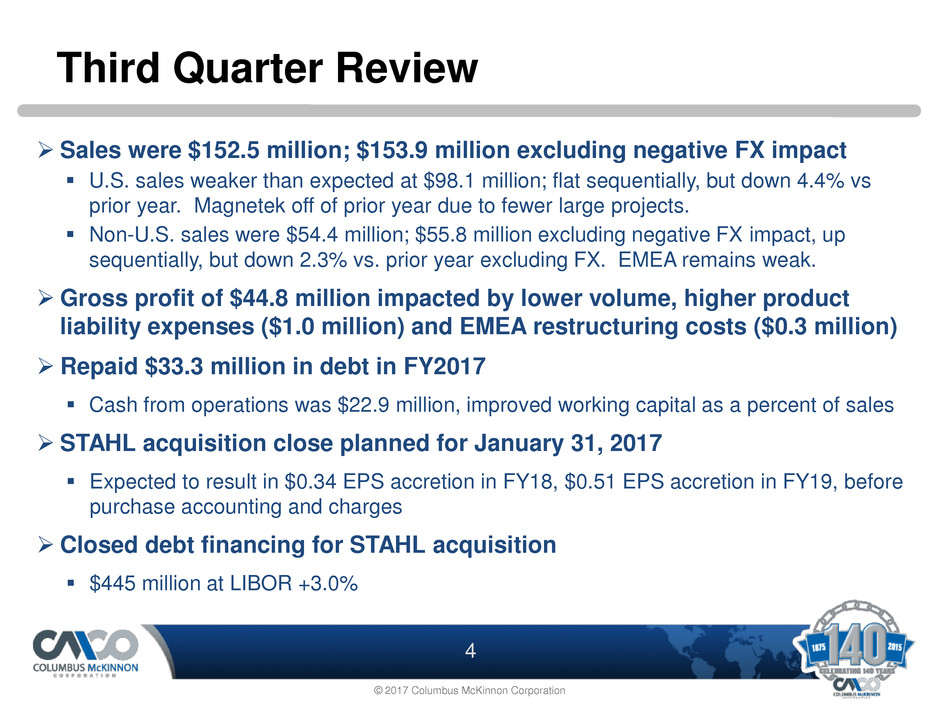
Sales were $152.5 million; $153.9 million excluding negative FX impact
U.S. sales weaker than expected at $98.1 million; flat sequentially, but down 4.4% vs
prior year. Magnetek off of prior year due to fewer large projects.
Non-U.S. sales were $54.4 million; $55.8 million excluding negative FX impact, up
sequentially, but down 2.3% vs. prior year excluding FX. EMEA remains weak.
Gross profit of $44.8 million impacted by lower volume, higher product
liability expenses ($1.0 million) and EMEA restructuring costs ($0.3 million)
Repaid $33.3 million in debt in FY2017
Cash from operations was $22.9 million, improved working capital as a percent of sales
STAHL acquisition close planned for January 31, 2017
Expected to result in $0.34 EPS accretion in FY18, $0.51 EPS accretion in FY19, before
purchase accounting and charges
Closed debt financing for STAHL acquisition
$445 million at LIBOR +3.0%
Third Quarter Review

5
© 2017 Columbus McKinnon Corporation
U.S. Industrial Market Stabilizing
77.5%
78.1%
78.6%
78.4%
78.6%
77.3%
76.4%
76.4%
75.4%
74.9%
75.4%
75.3%
75.5%
74.0%
75.0%
76.0%
77.0%
78.0%
79.0%
80.0%
U.S. Total Industrial Capacity Utilization
Source: U.S. Board of Governors of the Federal Reserve System (FRB)
Stabilizing to up

6
© 2017 Columbus McKinnon Corporation
Sales down 3.7%, or $5.8 million, excluding FX
Up sequentially from Q2; Q3 is typically
weaker given seasonality
U.S. sales down 4.4%
Fewer large projects, weaker December
Non-U.S. sales down 2.3% excluding FX
EMEA off low-single digits, S. Africa improving
Latin America double digit growth
APAC region slowing
$159.7
$152.5
Q3 FY16 Q3 FY17
Sales
Sales up Sequentially
($ in millions)
Pricing $ 0.2 0.1%
Volume (6.0) (3.8)%
Subtotal excluding FX impact (5.8) (3.7)%
Foreign currency translation $(1.4) (0.8)%

7
© 2017 Columbus McKinnon Corporation
Gross Profit Impacted
Gross margin of 29.4%
$1.0 million unfavorable product liability includes
$0.5 million legal settlement and actuarial adjustment
Productivity net of other cost changes includes
$0.3 million of restructuring costs in EMEA
Gross margin of 30.2% excluding atypical
items
$48.3
$44.8
Q3 FY16 Q3 FY17
30.3%* 29.4%*
Gross Profit and Margin
($ in millions)
*as % of sales
Prior-year purchase accounting & restructuring costs $ 1.1
Product liability (1.0)
Productivity, net of other cost changes (1.2)
Sales volume and mix (2.0)
Subtotal excluding FX impact (3.1)
Foreign currency translation $ (0.4)
Gross Profit Bridge
8
© 2017 Columbus McKinnon Corporation
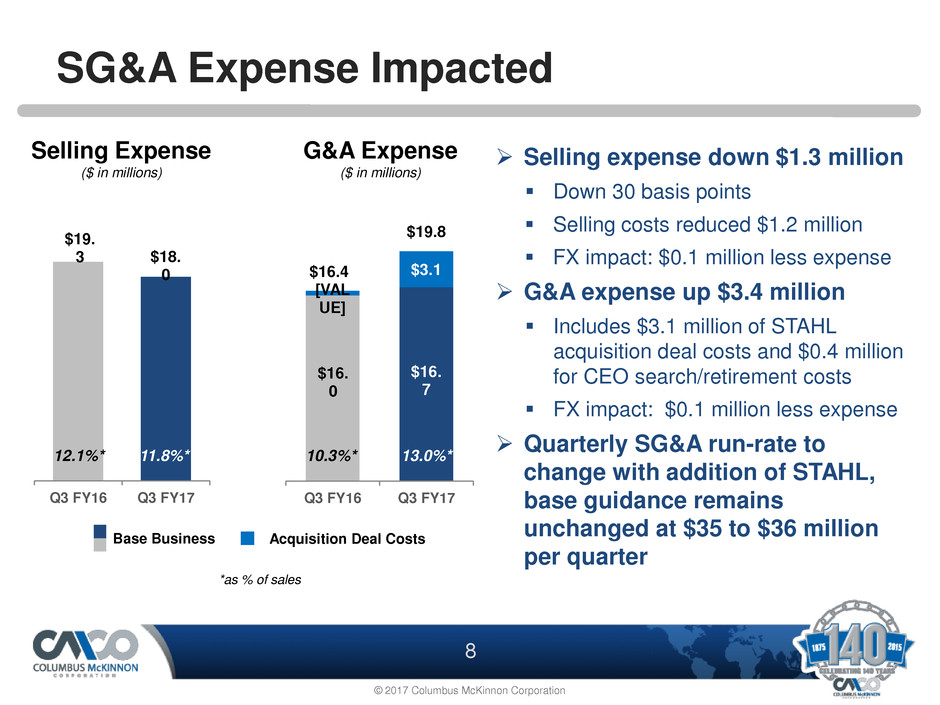
$16.
0
$16.
7
[VAL
UE]
$3.1
Q3 FY16 Q3 FY17
$16.4
$19.8 $19.
3 $18.
0
Q3 FY16 Q3 FY17
SG&A Expense Impacted
Selling expense down $1.3 million
Down 30 basis points
Selling costs reduced $1.2 million
FX impact: $0.1 million less expense
G&A expense up $3.4 million
Includes $3.1 million of STAHL
acquisition deal costs and $0.4 million
for CEO search/retirement costs
FX impact: $0.1 million less expense
Quarterly SG&A run-rate to
change with addition of STAHL,
base guidance remains
unchanged at $35 to $36 million
per quarter
Selling Expense
($ in millions)
G&A Expense
($ in millions)
12.1%* 11.8%*
*as % of sales
10.3%* 13.0%*
Base Business Acquisition Deal Costs

9
© 2017 Columbus McKinnon Corporation
Operating margin impacted by STAHL
acquisition and atypical costs
Positioned to Grow!
Income from Operations Impacted
Income from operations was $5.3 million,
or 3.5% of sales
Adjusted for STAHL acquisition deal costs,
operating margin was 5.5%
$3.1 million of STAHL acquisition deal costs
Operating margin negatively impacted by lower
volume, EMEA restructuring costs, inventory
reductions, higher product liability costs and
CEO search/retirement costs
Atypical costs had 1.2% impact
$11.0
$5.3
$1.5
$3.1
Q3 FY16 Q3 FY17
$12.5
$8.5
(1) Adjusted operating income and margin are non-GAAP financial measures. Please see supplemental slides for a reconciliation from GAAP operating income to
non-GAAP adjusted operating income and other important disclosures regarding the use of non-GAAP financial measures.
Non-GAAP
Adjustments
Income from Operations
7.8%* 5.5%*
Adjusted Income from
Operations and Margin(1)
(non-GAAP) ($ in millions)
*Non-GAAP margin as % of sales

10
© 2017 Columbus McKinnon Corporation
Diluted EPS
Earnings per Share
Net income was $0.5 million
Non-GAAP adjusted net income(1) was $4.5 million
excluding:
STAHL acquisition costs of $3.1 million
FX option revaluation loss to hedge STAHL purchase price
of $1.8 million
Adjusted to reflect normalized 30% tax rate
Adjusted diluted EPS of $0.22 impacted by atypical
costs ($0.06/share impact)
Fiscal 2017 effective tax rate of 31% to 36%
Higher than previous guidance due to non-deductible
STAHL acquisition costs
Est. quarterly average diluted shares:
22.0M (March 31, 2017) and 22.8M (June 30, 2017)
$0.34
$0.22
Q3 FY16 Q3 FY17
Adjusted Diluted EPS(1)
(non-GAAP)
(1) Adjusted net income and diluted earnings per share (EPS) are non-GAAP financial measures. Please see supplemental slides for a reconciliation from GAAP net
income and diluted EPS to non-GAAP adjusted net income and diluted EPS and other important disclosures regarding the use of non-GAAP financial measures.
$0.36
$0.02
Q3 FY16 Q3 FY17
11
© 2017 Columbus McKinnon Corporation
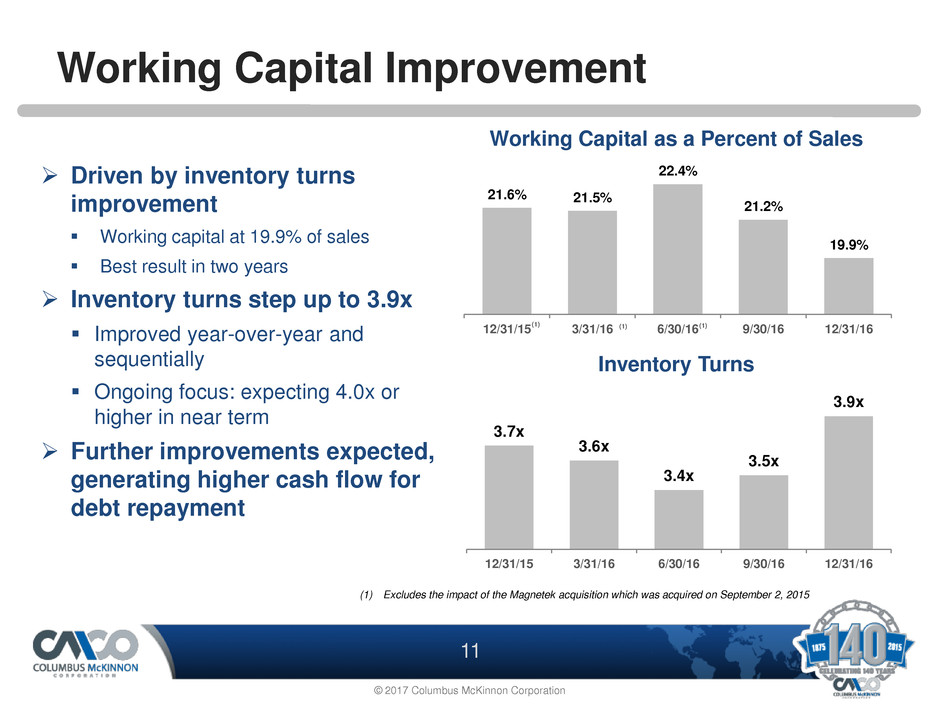
Driven by inventory turns
improvement
Working capital at 19.9% of sales
Best result in two years
Inventory turns step up to 3.9x
Improved year-over-year and
sequentially
Ongoing focus: expecting 4.0x or
higher in near term
Further improvements expected,
generating higher cash flow for
debt repayment
21.6% 21.5%
22.4%
21.2%
19.9%
12/31/15 3/31/16 6/30/16 9/30/16 12/31/16
Working Capital Improvement
3.7x
3.6x
3.4x
3.5x
3.9x
12/31/15 3/31/16 6/30/16 9/30/16 12/31/16
Working Capital as a Percent of Sales
Inventory Turns
(1) Excludes the impact of the Magnetek acquisition which was acquired on September 2, 2015
(1) (1) (1)

12
© 2017 Columbus McKinnon Corporation
Strong operating free cash flow in quarter ($20 million) and year to date
($37 million)
Year-to-date cash from operating activities increased over 45%
Capital expenditures guidance unchanged
Estimated at approximately $16 million in FY2017(1)
Strong Cash Flow
Note: Components may not add to totals due to rounding
Three Months
Ended
December 31,
Nine Months
Ended
December 31,
2016 2015 2016 2015
Net cash provided by operating activities $ 22.9 $ 28.8 $ 48.5 $ 32.9
Capital expenditures (2.8) (6.8) (11.3) (15.5)
Operating free cash flow $ 20.0 $ 22.0 $ 37.2 $ 17.4
(1) Capital expenditure guidance is as of January 26, 2017
FCF will help to
quickly de-lever

13
© 2017 Columbus McKinnon Corporation
Capital allocation priorities
De-lever balance sheet
Maintain dividend
Flexible Capital Structure Supports Growth Strategy
* Net total capitalization = total capitalization minus cash
Net debt / net total capitalization* 38.4 %
Debt / total capitalization 44.5 %
Cash
Total debt
Shareholders’ equity
Total capitalization
Net debt
($ in millions)
De-levering Balance Sheet
Debt/Total Cap Goal: 30%
Flex to ~50% for Acquisitions
$ 51.5
234.1
292.3
$ 526.4
$ 182.6
December 31,
2016
Total debt $445
Shareholders equity $339
Total capitalization $784
Net debt $410
Net debt / net total capitalization*
55%
Debt / total capitalization 57%
December 31,
2016 Pro-forma with STAHL

14
© 2017 Columbus McKinnon Corporation
Outlook
STAHL acquisition creates increased shareholder value
2nd largest hoist manufacturer in world
Strengthens position in EMEA with powered wire rope and electric chain hoists
Product development opportunities; leverage Magnetek; “Smart Hoists”
Expecting improved Q4 in U.S.
Automotive, Oil & Gas and Alternative Energy industries
Continue to take market share
Improved quotation activity, price increase, normal year-end activity
$4 million Rail & Road shipments expected
Showing signs of improvement in Latin America
Lowering quote activity, but hit rate improving in China, Rest of Asia slow
Still weak in EMEA, STAHL will enhance market presence
Backlog of $97.9 million, $107.1 million in Q2
Continue to drive customer intimacy, drive FCF and execute growth
strategy
15
© 2017 Columbus McKinnon Corporation
Replay Number: 412-317-6671 passcode: 13652416
Telephone replay available through February 2, 2017
Webcast / PowerPoint / Replay available at
www.cmworks.com/investors
Transcript, when available, at www.cmworks.com/investors
Conference Call Playback Info

© 2015 Columbus McKinnon Corporation. All Rights Reserved. Confidential and Proprietary. NASDAQ: CMCO
Supplemental
Information
17
© 2017 Columbus McKinnon Corporation
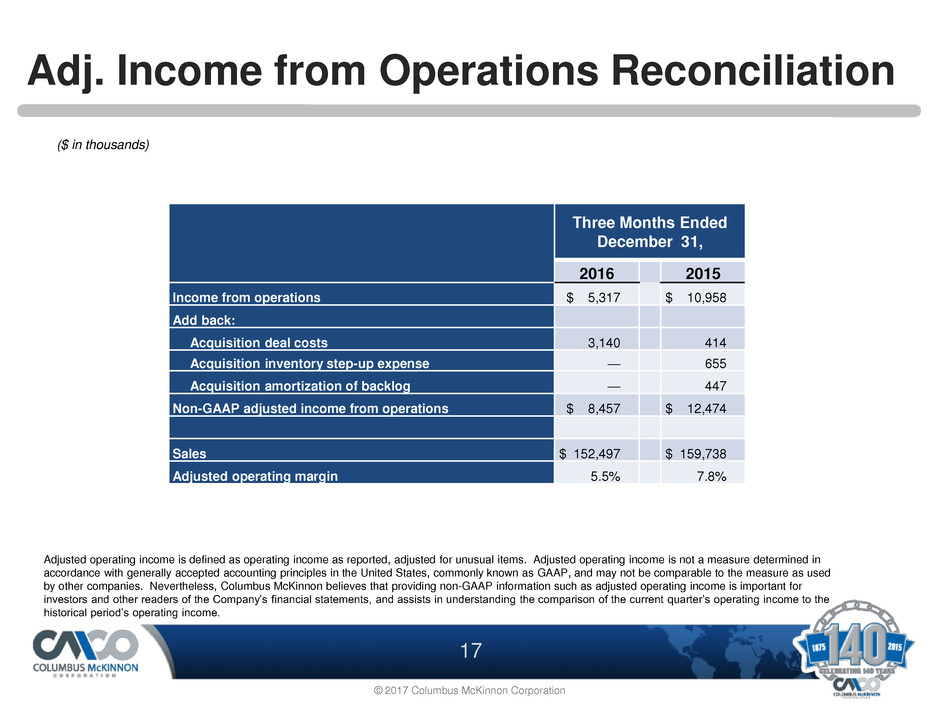
Adj. Income from Operations Reconciliation
Adjusted operating income is defined as operating income as reported, adjusted for unusual items. Adjusted operating income is not a measure determined in
accordance with generally accepted accounting principles in the United States, commonly known as GAAP, and may not be comparable to the measure as used
by other companies. Nevertheless, Columbus McKinnon believes that providing non-GAAP information such as adjusted operating income is important for
investors and other readers of the Company’s financial statements, and assists in understanding the comparison of the current quarter’s operating income to the
historical period’s operating income.
Three Months Ended
December 31,
2016 2015
Income from operations $ 5,317 $ 10,958
Add back:
Acquisition deal costs 3,140 414
Acquisition inventory step-up expense — 655
Acquisition amortization of backlog — 447
Non-GAAP adjusted income from operations $ 8,457 $ 12,474
Sales $ 152,497 $ 159,738
Adjusted operating margin 5.5% 7.8%
($ in thousands)

18
© 2017 Columbus McKinnon Corporation
Adjusted Diluted EPS Reconciliation
Adjusted net income and diluted EPS are defined as net income and diluted EPS as reported, adjusted for certain items and to apply a normalized tax rate. Adjusted net income and diluted
EPS are not measures determined in accordance with generally accepted accounting principles in the United States, commonly known as GAAP, and may not be comparable to the measure
as used by other companies. Nevertheless, Columbus McKinnon believes that providing non-GAAP information, such as adjusted net income and diluted EPS, is important for investors and
other readers of the Company’s financial statements and assists in understanding the comparison of the current quarter’s and current year’s net income and diluted EPS to the
historical periods’ net income and diluted EPS.
(1) Applies normalized tax rate of 30% to GAAP pre-tax income and non-GAAP adjustments above, which are each pre-tax.
Three Months Ended
December 31,
2016 2015
Net income $ 505 $ 7,227
Add back:
Acquisition deal costs 3,140 414
Loss on revaluation of foreign exchange option 1,826 —
Acquisition inventory step-up expense — 655
Acquisition amortization of backlog — 447
Normalize tax rate to 30% (1) (934) (1,795)
Non-GAAP adjusted net income $ 4,537 $ 6,948
Average diluted shares outstanding 20,490 20,295
Diluted earnings per share - GAAP $ 0.02 $ 0.36
Diluted earnings per share - Non-GAAP $ 0.22 $ 0.34
($ in thousands, except per share data)
