Attached files
| file | filename |
|---|---|
| 8-K - 8-K - BASIC ENERGY SERVICES, INC. | a8-kforinvestorpresentatio.htm |

NYSE: BAS
Investor Presentation
January 2017
OUR LIFE’S WORK IS THE LIFE OF THE WELLTM
Forward-Looking Statements
This presentation contains forward-looking statements. Basic has based these forward-looking statements largely on its current expectations
and projections about future events and financial trends affecting the financial condition of its business. These forward-looking statements are
subject to a number of risks, uncertainties and assumptions, including, among other things, the risk factors discussed in this presentation and
other factors, most of which are beyond Basic’s control.
The words “believe,” “may,” “estimate,” “continue,” “anticipate,” “intend,” “plan,” “expect” and similar expressions are intended to identify
forward-looking statements. All statements other than statements of current or historical fact contained in this presentation are forward-looking
statements.
Although Basic believes that the forward-looking statements contained in this presentation are based upon reasonable assumptions, the
forward-looking events and circumstances discussed in this presentation may not occur and actual results could differ materially from those
anticipated or implied in the forward-looking statements.
Important factors that may affect Basic’s expectations, estimates or projections include:
a decline in or substantial volatility of oil and gas prices, and any related changes in expenditures by its customers;
the effects of future acquisitions on its business;
changes in customer requirements in markets or industries it serves;
competition within its industry;
general economic and market conditions;
its access to current or future financing arrangements;
its ability to replace or add workers at economic rates; and
environmental and other governmental regulations.
Additional important risk factors that could cause actual results to differ materially from expectations are disclosed in Item 1A of Basic’s Form
10-K for the year ended December 31, 2015 and subsequent Form 10-Q’s filed with the SEC. While Basic makes these statements and
projections in good faith, neither Basic nor its management can guarantee that the transactions will be consummated or that anticipated future
results will be achieved. Basic’s forward-looking statements speak only as of the date of this presentation. Unless otherwise required by law,
Basic undertakes no obligation to publicly update or revise any forward-looking statements, whether as a result of new information, future
events or otherwise.
2
Proven Growth Strategy
3
Basic Energy Services supports its customers’ well site
activities from cradle to grave
Diversified service offering poised for future growth
opportunities
The right fleet, the right people and operations in the
right basins to support financial returns for the Life of
the WellTM
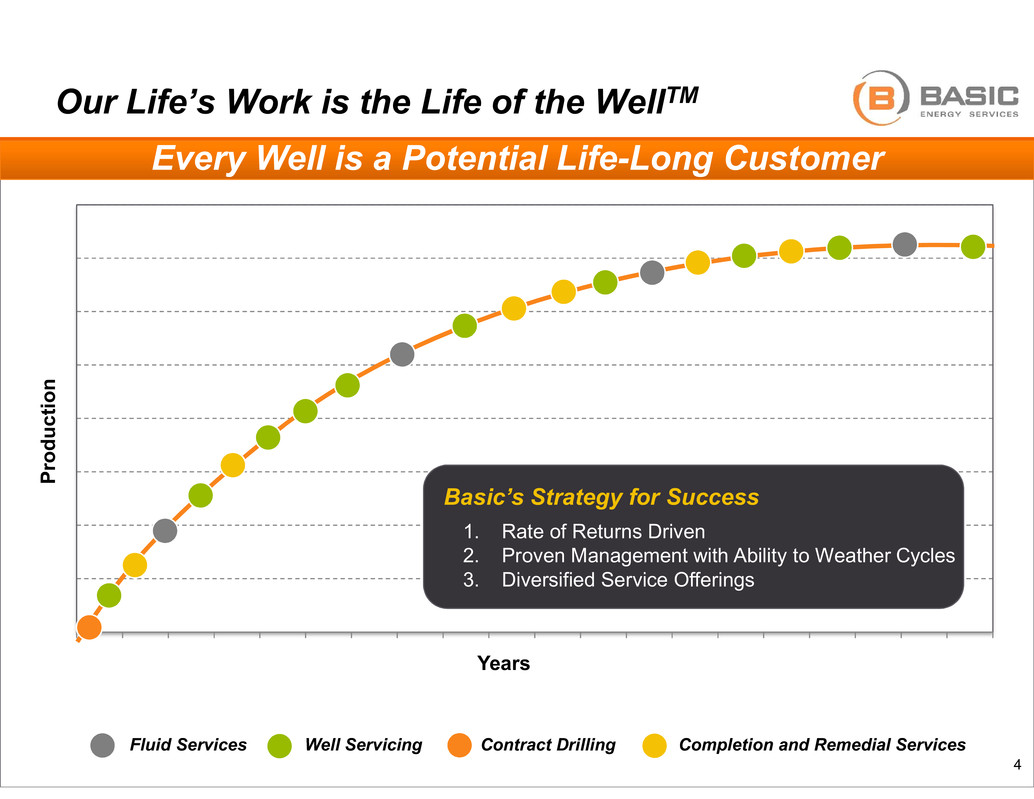
Our Life’s Work is the Life of the WellTM
Years
Pr
od
uc
tio
n
Our Life’s Work is the Life of the WellTM
4
Every Well is a Potential Life-Long Customer
Basic’s Strategy for Success
1. Rate of Returns Driven
2. Proven Management with Ability to Weather Cycles
3. Diversified Service Offerings
BAS Service Segments
Fluid Services Well Servicing Contract Drilling Completion and Remedial Services

Company Data:
NYSE Ticker: BAS
Share price (as of 01/24/17): $40.61
Market capitalization: $1.1 billion
Over 100 locations across 15 states
characterized by the most prolific basins
Website: www.basicenergyservices.com
5
Basic Energy Services Snapshot
YTD 3Q16 Revenue by Region
YTD 3Q16 Revenue by Activity
Permian Basin
46%
Mid-Continent/
Barnett/SCOOP
13%
Rocky Mountain/
Bakken/Niobrara
20%
Gulf Coast/
Eagle Ford
11%
Ark-La-
Tex/Haynesville
6%
Appalachian/
Marcellus
2%
California
2%
Fluid Services
37%
Well Servicing
30%
Contract
Drilling
1%
Cement
13%
Frac
20%
Other
62%
Acid
5%
Completion
and Remedial
Services
32%
Sizeable Footprint in the Resilient Permian Basin
Diversified Business with Majority of Revenues Tied to
Production Activities
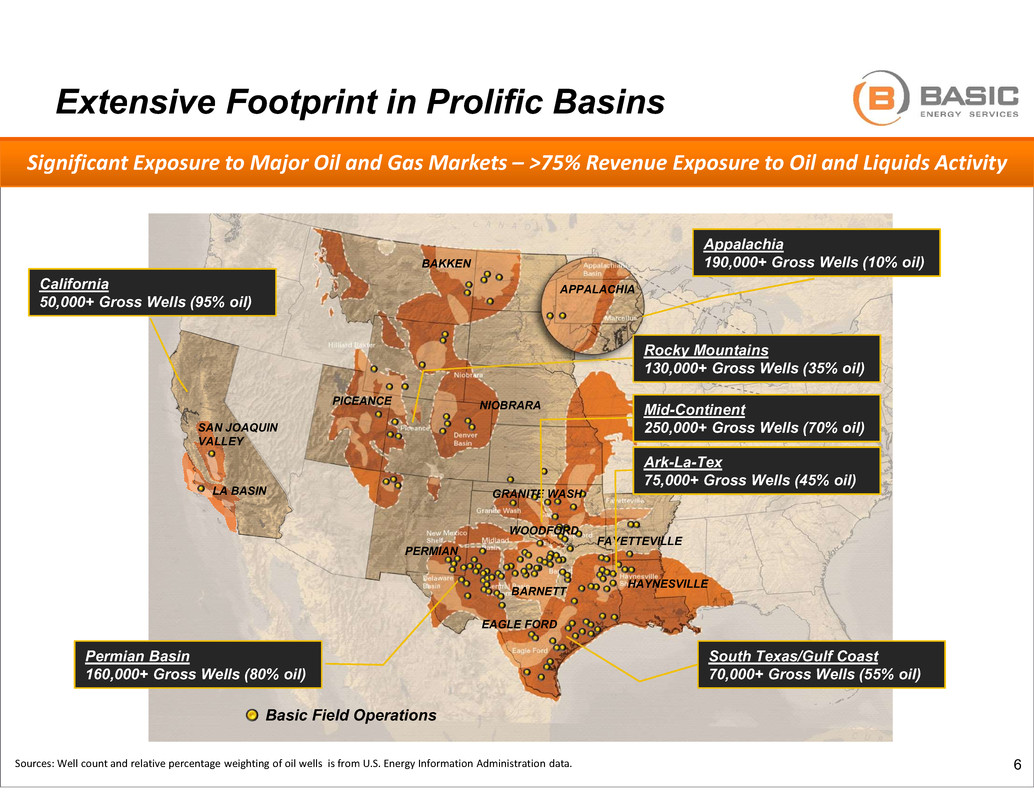
Sources: Well count and relative percentage weighting of oil wells is from U.S. Energy Information Administration data.
Significant Exposure to Major Oil and Gas Markets – >75% Revenue Exposure to Oil and Liquids Activity
Rocky Mountains
130,000+ Gross Wells (35% oil)
Appalachia
190,000+ Gross Wells (10% oil)
South Texas/Gulf Coast
70,000+ Gross Wells (55% oil)
Permian Basin
160,000+ Gross Wells (80% oil)
Extensive Footprint in Prolific Basins
6
BAKKEN
Basic Field Operations
NIOBRARAPICEANCE
PERMIAN
APPALACHIA
EAGLE FORD
BARNETT HAYNESVILLE
FAYETTEVILLE
GRANITE WASH
WOODFORD
Mid-Continent
250,000+ Gross Wells (70% oil)
Ark-La-Tex
75,000+ Gross Wells (45% oil)
LA BASIN
SAN JOAQUIN
VALLEY
California
50,000+ Gross Wells (95% oil)
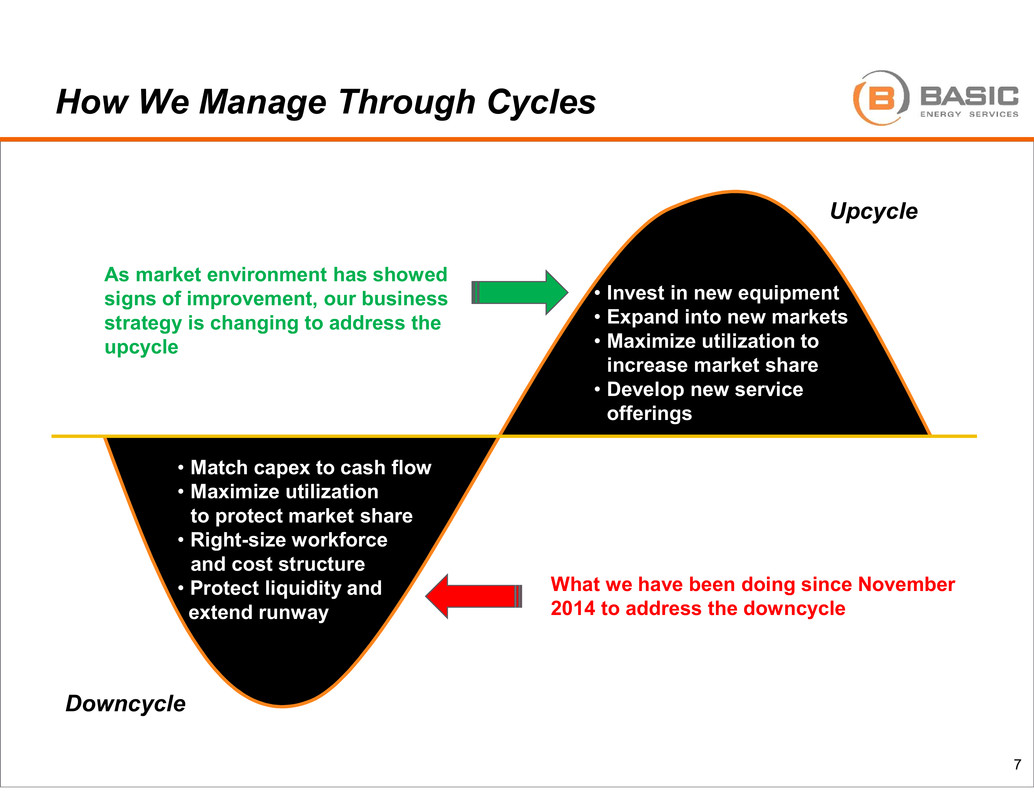
How We Manage Through Cycles
7
Upcycle
Downcycle
• Invest in new equipment
• Expand into new markets
• Maximize utilization to
increase market share
• Develop new service
offerings
• Match capex to cash flow
• Maximize utilization
to protect market share
• Right-size workforce
and cost structure
• Protect liquidity and
extend runway
What we have been doing since November
2014 to address the downcycle
As market environment has showed
signs of improvement, our business
strategy is changing to address the
upcycle

Operational Update – Equipment Counts & Utilization
8
• Invest in new equipment
• Expand into new markets
• Maximize utilization to
increase market share
• Develop new service offerings
• Match Capex to cash flow
• Maximize utilization
to protect market share
• Right-size workforce
and cost structure
• Protect liquidity and extend
runway
4Q16 3Q16
Well servicing rig hours 146,200 136,600
Well servicing utilization rate 49% 45%
Number of well servicing rigs - end of period 421 421
Fluid services truck hours 489,000 499,900
Number of fluid service trucks - end of period 941 954
Total marketed pumping HHP 327,050 271,400
Total stacked pumping HHP 116,595 172,245
Total pumping HHP - end of period 443,645 443,645
Total marketed frac HHP 256,450 201,700
Total stacked frac HHP 101,200 155,950
Total frac HHP - end of period 357,650 357,650
Note: HHP is hydraulic horsepower

Operational Update – Market Environment
9
• Invest in new equipment
• Expand into new markets
• Maximize utilization to
increase market share
• Develop new service offerings
• Match Capex to cash flow
• Maximize utilization
to protect market share
• Right-size workforce
and cost structure
• Protect liquidity and extend
runway
• We expect 4Q16 revenues to be in the range of $155 to $157 million compared to
$141 million in 3Q16
• Sequential revenue increase led by the completion and remedial segment,
particularly stimulation services
• Production oriented well servicing and fluid services lines of business
maintained or exceeded 3Q16 activity levels despite the usual seasonal
factors in the fourth quarter
• Activity levels so far in 2017 continue to improve as stable oil prices are driving an
increased U.S. Land drilling rig count and expected higher spending levels by our
customers
• We have identified several areas where expansion of our fleets are warranted
• Ordered two 2 3/8” coil tubing units for our Niobrara operations with
expected delivery dates in late 2Q or 3Q 2017
• Manufacturing two new well servicing rigs for our California operations
with expected delivery dates by mid April 2017
• Evaluating our remaining 117,000 of stacked frac HHP for refurbishment
and/or deployment as completion activity continues to grow
• We expect to release 4Q16 and full year 2016 financial results in mid March
• This is somewhat later than normal due to our fresh start accounting process
that is underway

0%
10%
20%
30%
40%
50%
60%
$0
$10
$20
$30
$40
$50
$60
$70
$80
$90
1Q
04 3Q
1Q
05 3Q
1Q
06 3Q
1Q
07 3Q
1Q
08 3Q
1Q
09 3Q
1Q
10 3Q
1Q
11 3Q
1Q
12 3Q
1Q
13 3Q
1Q
14 3Q
1Q
15 3Q
1Q
16 3Q
Segment Profits
Gross Profit Gross Margin
Specialized Completion & Remedial Services
Support drilling, workover and production
processes
Pumping services for cementing, acidizing,
squeeze-cementing (workover), fracturing and
re-fracturing activities
Fishing tools and rental equipment for drilling
and workover processes
Coil tubing and nitrogen services for
completion, remedial and P&A applications
Snubbing services to allow “live-well”
completion and workover operations
Tubular services
$0
$50
$100
$150
$200
$250
1Q
04 3Q
1Q
05 3Q
1Q
06 3Q
1Q
07 3Q
1Q
08 3Q
1Q
09 3Q
1Q
10 3Q
1Q
11 3Q
1Q
12 3Q
1Q
13 3Q
1Q
14 3Q
1Q
15 3Q
1Q
16 3Q
Revenue
10
M
illi
on
s
M
illi
on
s
Focused on Markets Traditionally Underserved by Larger Competitors

0%
5%
10%
15%
20%
25%
30%
35%
40%
45%
$0
$5
$10
$15
$20
$25
$30
$35
$40
1Q
04 3Q
1Q
05 3Q
1Q
06 3Q
1Q
07 3Q
1Q
08 3Q
1Q
09 3Q
1Q
10 3Q
1Q
11 3Q
1Q
12 3Q
1Q
13 3Q
1Q
14 3Q
1Q
15 3Q
1Q
16 3Q
Segment Profits
Gross Profit Gross Margin
Fluid Services
Transportation and disposal of salt water
produced as a by-product of oil and gas
production
Sale, transportation, storage and disposal of
fluids used in fracturing, workover and drilling
activity
Rental of portable frac and test tanks used in
fracturing, workover, drilling and industrial
applications
Oilfield wastewater (state-regulated, non-
hazardous) disposal wellsazardous) disposal
wells
$0
$20
$40
$60
$80
$100
$120
1Q
04 3Q
1Q
05 3Q
1Q
06 3Q
1Q
07 3Q
1Q
08 3Q
1Q
09 3Q
1Q
10 3Q
1Q
11 3Q
1Q
12 3Q
1Q
13 3Q
1Q
14 3Q
1Q
15 3Q
1Q
16 3Q
Revenue
Basic’s Integrated Fluid Service Business Anchored by Expansive SWD Network
11
M
illi
on
s
M
illi
on
s
Permian
Basin
48%
Rocky
Mtns.
14%
Mid-
Continent
9%
Gulf Coast
16%
Ark-La-Tex
13%
940 Trucks by Market Area

Fluid Service Truck Hours & # of SWD Wells
115,000
135,000
155,000
175,000
195,000
215,000
235,000
255,000
Jan09 Jan10 Jan11 Jan12 Jan13 Jan14 Jan15 J16
55
60
65
70
75
80
85
90
Tr
uc
k
H
ou
rs
N
um
be
r o
f S
al
t W
at
er
D
is
po
sa
l W
el
ls
Truck Hours Number of Salt Water Disposal Wells
12
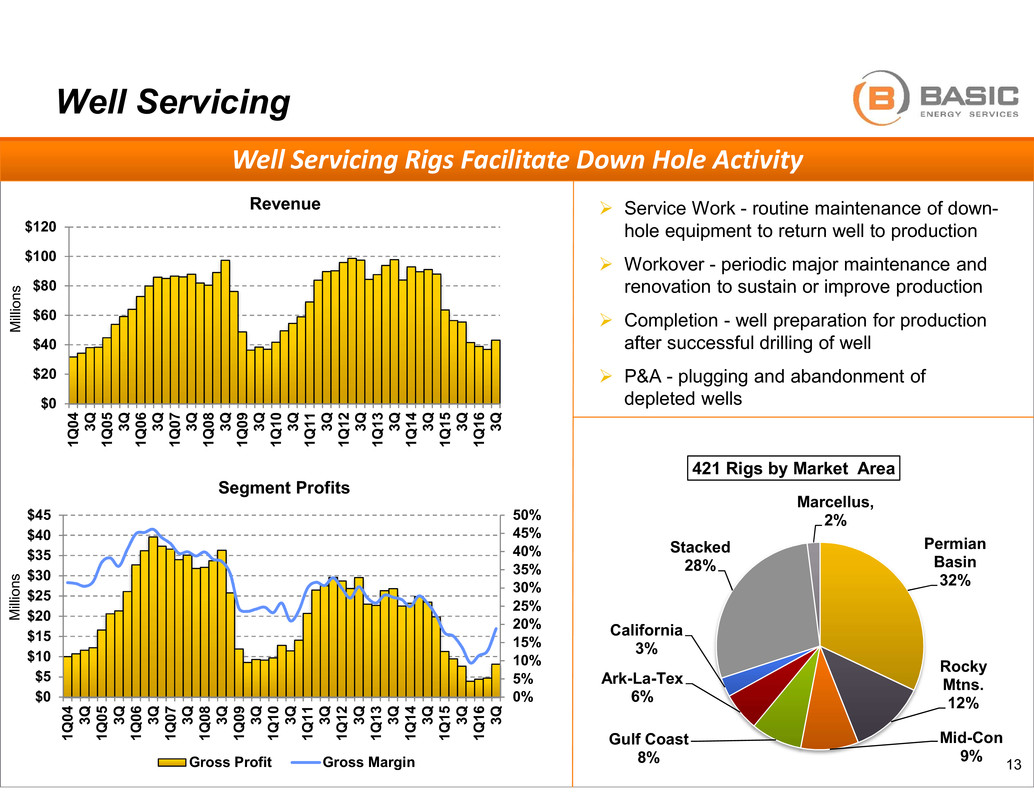
Permian
Basin
32%
Rocky
Mtns.
12%
Mid-Con
9%
Gulf Coast
8%
Ark-La-Tex
6%
California
3%
Stacked
28%
Marcellus,
2%
421 Rigs by Market Area
Well Servicing
Service Work - routine maintenance of down-
hole equipment to return well to production
Workover - periodic major maintenance and
renovation to sustain or improve production
Completion - well preparation for production
after successful drilling of well
P&A - plugging and abandonment of
depleted wells$0
$20
$40
$60
$80
$100
$120
1Q
04 3Q
1Q
05 3Q
1Q
06 3Q
1Q
07 3Q
1Q
08 3Q
1Q
09 3Q
1Q
10 3Q
1Q
11 3Q
1Q
12 3Q
1Q
13 3Q
1Q
14 3Q
1Q
15 3Q
1Q
16 3Q
Revenue
0%
5%
10%
15%
20%
25%
30%
35%
40%
45%
50%
$0
$5
$10
$15
$20
$25
$30
$35
$40
$45
1Q
04 3Q
1Q
05 3Q
1Q
06 3Q
1Q
07 3Q
1Q
08 3Q
1Q
09 3Q
1Q
10 3Q
1Q
11 3Q
1Q
12 3Q
1Q
13 3Q
1Q
14 3Q
1Q
15 3Q
1Q
16 3Q
Segment Profits
Gross Profit Gross Margin
Well Servicing Rigs Facilitate Down Hole Activity
13
M
illi
on
s
M
illi
on
s
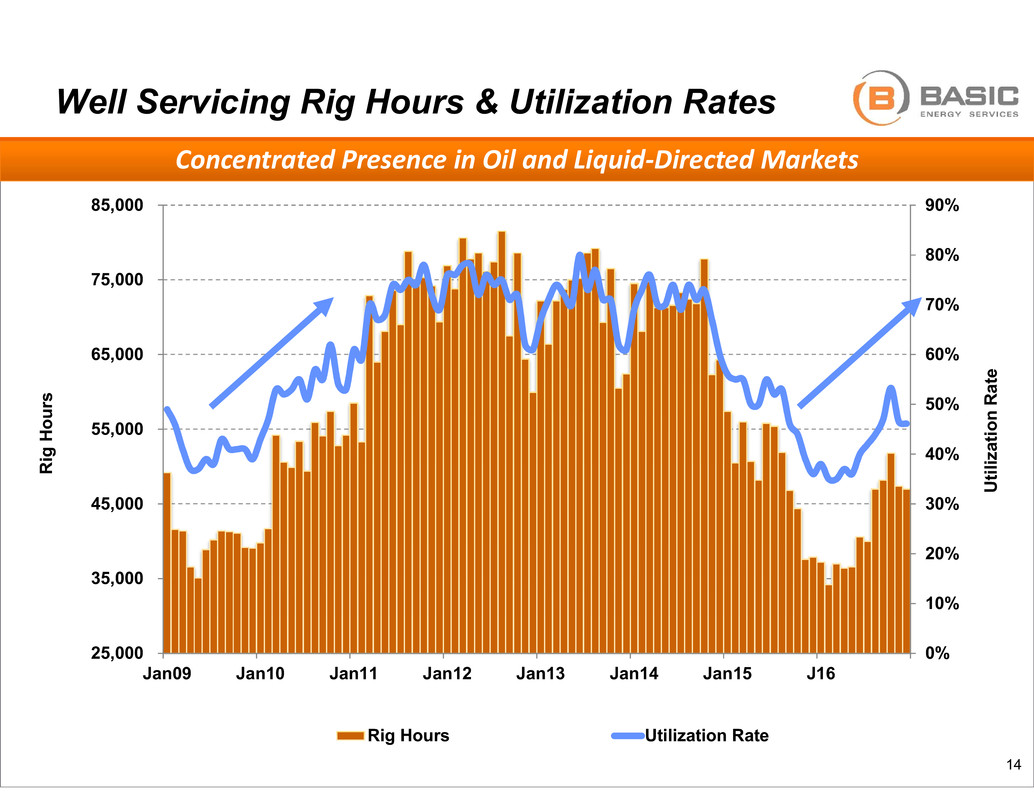
Well Servicing Rig Hours & Utilization Rates
Concentrated Presence in Oil and Liquid-Directed Markets
25,000
35,000
45,000
55,000
65,000
75,000
85,000
Jan09 Jan10 Jan11 Jan12 Jan13 Jan14 Jan15 J16
0%
10%
20%
30%
40%
50%
60%
70%
80%
90%
R
ig
H
ou
rs
U
til
iz
at
io
n
R
at
e
Rig Hours Utilization Rate
14

Pro Forma Balance Sheet
Emergence from Chapter 11 Enhances Financial Position
15
At Pro Forma
Description 9/30/2016 9/30/2016
Liquidity
ABL Credit Facility Borrowing Base 51$ 75$
Less: Letters of Credit (51) (51)
Cash 34 127
Total Liquidity 34$ 151$
Debt
Senior Notes due 2019 475,000$ -$
Senior Notes due 2022 300,000 -
Term Loan due 2021 164,588 164,588
Capital Leases 78,664 78,664
1,018,252$ 243,252$
Senior Notes due 2019 & 2022 issuance costs (7,243) -
Term Loan due 2021 discount (15,642) (15,642)
Total Debt 995,367$ 227,610$
$000s
Pro forma amounts reflect Basic's successfully emerging from pre-packaged Chapter 11 plan on December 23, 2016 where the senior
noteholders exchanged their bonds for common stock. In addition, certain bondholders participated in a rights offering of $125 million to
pay off the DIP financing and other transactions costs with the remainder added to the cash balance.
The Company’s $100 million ABL Credit Facility was amended and restated to a $75 million facility with a $25 million accordion.
