Attached files
| file | filename |
|---|---|
| EX-99.3 - PREPARED REMARKS - ASHLAND GLOBAL HOLDINGS INC | ex993.htm |
| EX-99.1 - ASHLAND GLOBAL HOLDINGS INC | ex991.htm |
| 8-K - ASHLAND GLOBAL HOLDINGS INC | form8k.htm |
EXHIBIT 99.2


First-Quarter Fiscal 2017 Earnings January 26, 2017 / efficacy usability allure integrity profitability
Forward-Looking StatementsThis presentation contains forward-looking statements within the meaning of Section 27A of the Securities Act of 1933, as amended and Section 21E of the Securities Exchange Act of 1934, as amended. Ashland has identified some of these forward-looking statements with words such as “anticipates,” “believes,” “expects,” “estimates,” “is likely,” “predicts,” “projects,” “forecasts,” “objectives,” “may,” “will,” “should,” “plans” and “intends” and the negative of these words or other comparable terminology. These forward-looking statements include statements relating to the status of the separation process and the expected completion of the separation through the subsequent distribution of Valvoline common stock. In addition, Ashland may from time to time make forward-looking statements in its annual reports, quarterly reports and other filings with the SEC, news releases and other written and oral communications. These forward-looking statements are based on Ashland’s expectations and assumptions, as of the date such statements are made, regarding Ashland’s future operating performance and financial condition, the separation of Ashland’s specialty chemicals business and Valvoline Inc. (“Valvoline”), the initial public offering of 34,500,000 shares of Valvoline common stock (the “IPO”), the expected timetable for completing the separation, the strategic and competitive advantages of each company, and future opportunities for each company, as well as the economy and other future events or circumstances. Ashland’s expectations and assumptions include, without limitation, internal forecasts and analyses of current and future market conditions and trends, management plans and strategies, operating efficiencies and economic conditions (such as prices, supply and demand, cost of raw materials, and the ability to recover raw-material cost increases through price increases), and risks and uncertainties associated with the following: the possibility that the separation will not be consummated within the anticipated time period or at all, including as the result of regulatory, market or other factors; regulatory, market or other factors and conditions affecting the distribution of Ashland’s remaining interests in Valvoline; the potential for disruption to Ashland’s business in connection with the separation; the potential that Ashland does not realize all of the expected benefits of the IPO, new holding company reorganization or separation; Ashland’s substantial indebtedness (including the possibility that such indebtedness and related restrictive covenants may adversely affect Ashland’s future cash flows, results of operations, financial condition and its ability to repay debt); the impact of acquisitions and/or divestitures Ashland has made or may make (including the possibility that Ashland may not realize the anticipated benefits from such transactions); and severe weather, natural disasters, and legal proceedings and claims (including environmental and asbestos matters). Various risks and uncertainties may cause actual results to differ materially from those stated, projected or implied by any forward-looking statements, including, without limitation, risks and uncertainties affecting Ashland that are described in Ashland’s most recent Form 10-K (including Item 1A Risk Factors) filed with the SEC, which is available on Ashland’s website at http://investor.ashland.com or on the SEC’s website at http://www.sec.gov, as well as risks related to the separation that are described in the Form S-4 filed with the SEC, which is available on Ashland’s website or on the SEC’s website, and Valvoline’s Form S-1 filed with the SEC, available on the SEC’s website. Ashland believes its expectations and assumptions are reasonable, but there can be no assurance that the expectations reflected herein will be achieved. Unless legally required, Ashland undertakes no obligation to update any forward-looking statements made in this presentation whether as a result of new information, future events or otherwise.Regulation G: Adjusted ResultsThe information presented herein regarding certain unaudited adjusted results does not conform to generally accepted accounting principles in the United States (U.S. GAAP) and should not be construed as an alternative to the reported results determined in accordance with U.S. GAAP. Ashland has included this non-GAAP information to assist in understanding the operating performance of the company and its reportable segments. The non-GAAP information provided may not be consistent with the methodologies used by other companies. All non-GAAP information related to previous Ashland filings with the SEC has been reconciled with reported U.S. GAAP results. *
Fiscal First Quarter 2017Highlights1 Reported GAAP loss from continuing operations of $0.01 per diluted shareAdjusted earnings of $1.16 vs. $1.41 per diluted share in prior yearTotal sales growth of 3 percent to $1.193 billionASI delivered sales, volume and earnings growth led by wins in key end marketsAshland, excluding Valvoline, reduced debt by $309 million Adj. EPS $1.41 $1.52 $1.16 Q1 2016 Vol /Mix Acq/Div Other2 Margin SG&A (28) 17 215 247 (2) Q1 2017 3 ($, Millions) ($, Millions) Factors affecting year-over-year EBITDA (21) FX 293 Ashland‘s earnings releases dated January 26, 2017, and November 8, 2016, available on Ashland's website at http://investor.ashland.com, reconcile adjusted amounts to amounts reported under GAAP. Acquisitions include OCH International, Inc.The three months ended December 31, 2016 excludes adjusted EBITDA attributable to non-controlling interest of Valvoline Inc. of $21 million. * (1) Minority Interest3 Margin by Segment:ASI (6)APM (17)VVV (4)Corp (1)
Consolidated Income Statement Ashland will report consolidated results for each quarter that Ashland maintains a controlling interest in Valvoline as of the last day of the quarterFor more information on Valvoline results, refer to the Valvoline Inc. first-quarter earnings release dated January 26, 2017 and earnings conference call Line items include Valvoline segment amounts consistent with Ashland’s historical reporting practice EBITDA and net income exclude the 17% of Valvoline net income attributable to Ashland’s non-controlling interest *
Fiscal First Quarter – Continuing OperationsKey Items Affecting Income Excluding intangible amortization, adjusted EPS would have been 22 cents higher, or $1.38 per diluted share *
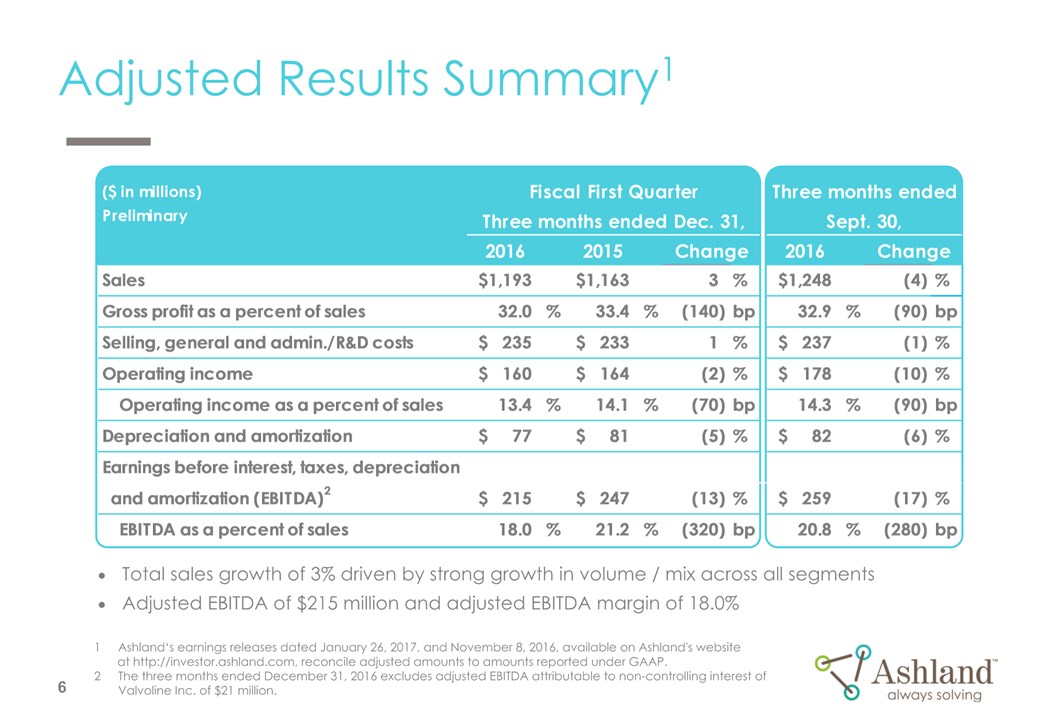
Adjusted Results Summary1 Ashland‘s earnings releases dated January 26, 2017, and November 8, 2016, available on Ashland's website at http://investor.ashland.com, reconcile adjusted amounts to amounts reported under GAAP. The three months ended December 31, 2016 excludes adjusted EBITDA attributable to non-controlling interest of Valvoline Inc. of $21 million. Total sales growth of 3% driven by strong growth in volume / mix across all segmentsAdjusted EBITDA of $215 million and adjusted EBITDA margin of 18.0% *
Ashland Specialty IngredientsAdjusted Results Summary1 Strong Industrial results leading to total sales and volume growth of 1% and 6%, respectivelyAdjusted EBITDA of $95 million represents 1% year-over-year growth Ashland‘s earnings releases dated January 26, 2017, and November 8, 2016, available on Ashland's website at http://investor.ashland.com, reconcile adjusted amounts to amounts reported under GAAP. *
Ashland Performance MaterialsAdjusted Results Summary1 Composites volume growth of 7% with solid results across all regionsPlanned Lima I&S catalyst change resulted in $9 million of incremental cost Ashland‘s earnings releases dated January 26, 2017, and November 8, 2016, available on Ashland's website at http://investor.ashland.com, reconcile adjusted amounts to amounts reported under GAAP. *
Fiscal First Quarter 2017Corporate Items Adjusted corporate operating income of $13 millionExcluding Valvoline, Ashland FY 2017 expectation of $30-$35 million expenseExcluding financing charges, net interest expense of $40 millionExcluding Valvoline, Ashland FY 2017 expectation lowered to $120-$130 million due to lower debt balancesEffective tax rate of 30 percentExcluding Valvoline, Ashland FY 2017 expectation 10%-15%Trade Working Capital1 for the quarter was 22.2% of salesCapital expenditures totaled $43 millionExcluding Valvoline, Ashland FY 2017 expectation of $205-$215 millionOperating cash flow of $12 million; free cash flow2 of -$31 millionExcluding Valvoline, Ashland FY 2017 expectation for free cash flow2 of $110-$120 million which includes $60-$70 million of one-time separation and severance-related payments 1 Trade Working Capital defined as trade accounts receivables plus inventories minus trade accounts payables.2 Definition of free cash flow: operating cash less capital expenditures and other items Ashland has deemed non-operational. *
Appendix A: Bridges
Ashland Q1 FY 2016 vs. Q1 FY 2017Revenue and Adjusted EBITDA Bridges 4% Q1 2016 Volume / Mix 1,163 1,193 ($ millions)Preliminary Total revenue growth of 3% driven by strong growth in volume / mix across all segmentsAdjusted EBITDA of $215 million includes $9 million of Lima BDO catalyst change costs and excludes $21 million attributable to non-controlling interest of Valvoline Inc. Acquisitions include OCH International, Inc.The three months ended December 31, 2016 excludes adjusted EBITDA attributable to non-controlling interest of Valvoline Inc. of $21 million. (2%) (0%) 1% Revenue Price FX Acq/Div/Other1 Q1 2017 17 Q1 2016 Volume/ Mix 247 215 (28) (2) 3 (21) Adjusted EBITDA Margin SG&A FX Acq/Div/Other1 Q1 2017 * (1) Minority Interest2 Margin by Segment:ASI (6)APM (17)VVV (4)Corp (1)
Ashland Specialty IngredientsRevenue and Adjusted EBITDA Bridges 3% Q1 2016 Volume / Mix 476 482 ($ millions)Preliminary Sales revenue growth of 1% vs. prior year, led by strong Industrial Specialties resultsVolume growth of 6% vs. prior yearAdjusted EBITDA of $95 million represents 1% year-over-year growth (1%) (1%) (0)% Revenue Price FX Acq/Div/Other Q1 2017 6 Q1 2016 Volume/ Mix 94 95 (6) 3 (1) (1) Adjusted EBITDA Margin SG&A FX Q1 2017 Acq/Div/Other *
Ashland Performance MaterialsRevenue and Adjusted EBITDA Bridges 3% Q1 2016 Volume / Mix 231 222 ($ millions)Preliminary Composites volume growth of 7% with solid results across all regionsBDO and derivatives prices down versus prior yearPlanned Lima I&S catalyst change resulted in $9 million of incremental cost (6%) (1%) 0% Revenue Price FX Acq/Div/Other Q1 2017 1 Q1 2016 Volume/ Mix 37 21 (17) 0 0 0 Adjusted EBITDA Margin SG&A FX Q1 2017 Acq/Div/Other *
Appendix B: Volume Trends and Liquidity and Net Debt
Period Ended 1 Excludes volumes associated with divestitures of elastomers and biocides and exited redispersible powders (RDP) product line for all periods. Rolling Four Quarters Normalized Volume Trends1 *
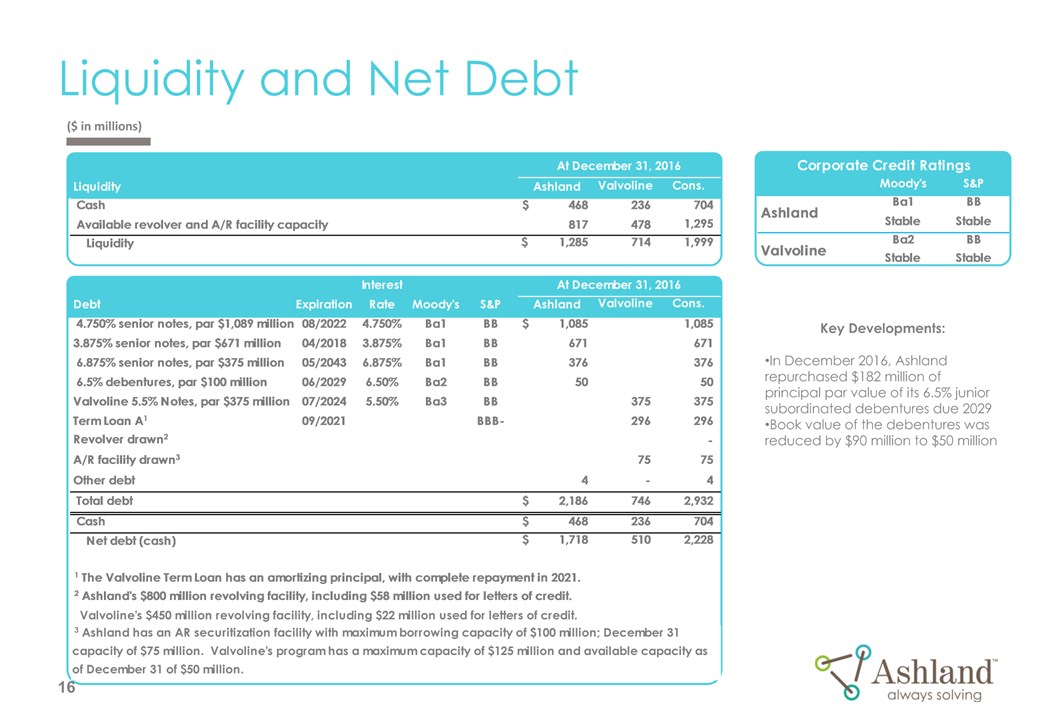
Liquidity and Net Debt ($ in millions) Key Developments:In December 2016, Ashland repurchased $182 million of principal par value of its 6.5% junior subordinated debentures due 2029Book value of the debentures was reduced by $90 million to $50 million *
Scheduled Debt Payments Valvoline Ashland ($ in millions) *
Appendix C: Business Profiles 12 Months Ended December 31, 2016
Corporate Profile By business unit By geography 1 For 12 months ended December 31, 2016.2 Ashland includes only U.S. and Canada in its North America designation. North America254% Asia Pacific16% LatinAmerica/Other - 7% Europe 23% AshlandSpecialtyIngredients42% AshlandPerformanceMaterials19% Valvoline39% Sales1 - $5.0 Billion *
Corporate Profile For 12 months ended December 31, 2016 including Valvoline. See Appendix D for reconciliation to amounts reported under GAAP.Excludes Valvoline. NYSE Ticker Symbol: ASH Total Employees2: ~6,000 Outside North America ~50% Number of Countries in Which Ashland Has Sales: More than 100 AshlandSpecialtyIngredients46% Valvoline44% Adjusted EBITDA1 - $1.0 Billion *
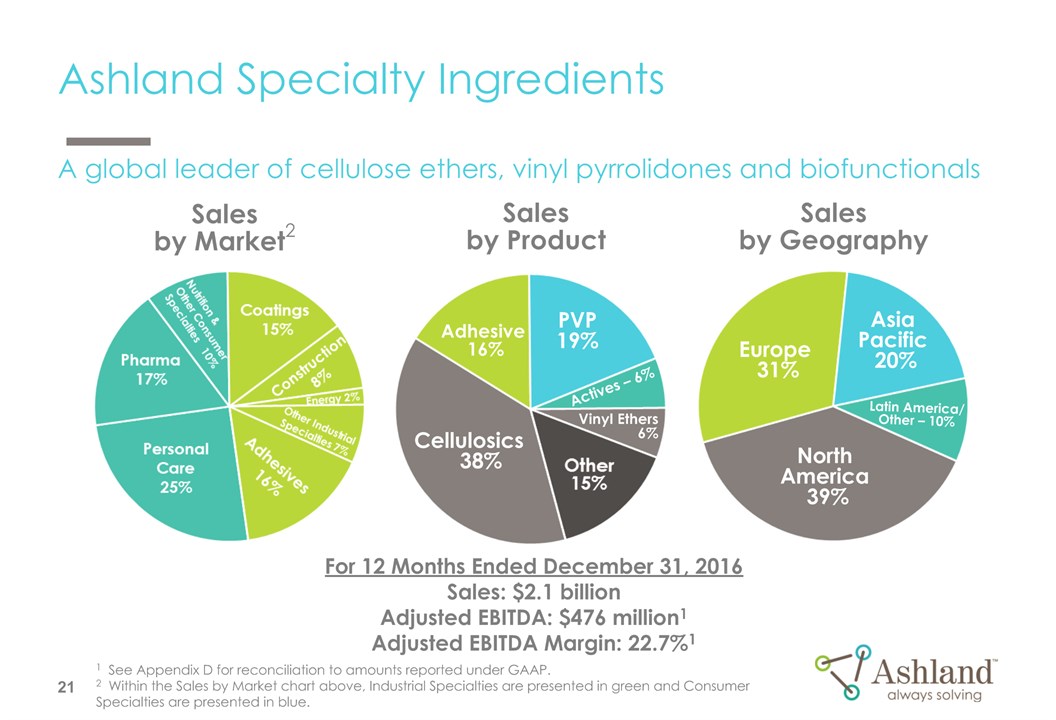
Ashland Specialty Ingredients Salesby Market2 For 12 Months Ended December 31, 2016Sales: $2.1 billionAdjusted EBITDA: $476 million1Adjusted EBITDA Margin: 22.7%1 Salesby Product Cellulosics 38% PVP19% Adhesive 16% North America 39% AsiaPacific 20% Europe 31% Latin America/Other – 10% Actives – 6% Vinyl Ethers6% Salesby Geography 1 See Appendix D for reconciliation to amounts reported under GAAP.2 Within the Sales by Market chart above, Industrial Specialties are presented in green and Consumer Specialties are presented in blue. * A global leader of cellulose ethers, vinyl pyrrolidones and biofunctionals
Ashland Performance Materials Salesby Geography For 12 Months Ended December 31, 2016Sales: $921 millionAdjusted EBITDA: $101 million1Adjusted EBITDA Margin: 11.0%1 Salesby Product Composites73% Intermediates/Solvents 27% Construction: Residential13% Marine 17% Other Process Industries15% Construction:Industrial29% Salesby Market North America 43% Asia Pacific – 15% Europe 37% Latin America/Other 5% Transportation 12% Construction: Infrastructure 6% 1 See Appendix D for reconciliation to amounts reported under GAAP.2 PU/TPU stands for Polyurethane and Thermoplastic Polyurethane. * A global leader in unsaturated polyester resins and vinyl ester resins
Appendix D: Non-GAAP Reconciliation1 Although Ashland provides forward looking guidance for adjusted EBITDA in this presentation, Ashland is not reaffirming or providing forward-looking guidance for U.S. GAAP reported financial measures or a reconciliation of forward-looking non-GAAP financial measures to the most directly comparable U.S. GAAP measure because it is unable to predict with reasonable certainty the ultimate outcome of certain significant items without unreasonable effort.
Ashland Global Holdings Inc. and Consolidated SubsidiariesReconciliation of Non-GAAP Data for 12 Months Ended December 31, 2016 North America2__% Asia Pacific__% LatinAmerica/Other - _% Europe __% AshlandSpecialtyIngredients__% AshlandPerformanceMaterials__% Valvoline__% 1 Quarterly totals may not sum to actual results due to quarterly rounding conventions. Calculation of adjusted EBITDA for each quarter has been reconciled within certain financial filings with the SEC and posted on Ashland's website for each reportable segment. *
® Registered trademark, Ashland or its subsidiaries, registered in various countries™ Trademark, Ashland or its subsidiaries, registered in various countries