Attached files
| file | filename |
|---|---|
| EX-99.1 - EXHIBIT 99.1 - ALLIANCE DATA SYSTEMS CORP | exhibit_99-1.htm |
| 8-K - FORM 8-K - ALLIANCE DATA SYSTEMS CORP | form_8k.htm |
Exhibit 99.2

Alliance Data NYSE: ADS Full Year 2016 ResultsJanuary 26, 2017

Forward-Looking StatementsThis presentation contains forward-looking statements within the meaning of Section 27A of the Securities Act of 1933 and Section 21E of the Securities Exchange Act of 1934. Forward-looking statements give our expectations or forecasts of future events and can generally be identified by the use of words such as “believe,” “expect,” “anticipate,” “estimate,” “intend,” “project,” “plan,” “likely,” “may,” “should” or other words or phrases of similar import. Similarly, statements that describe our business strategy, outlook, objectives, plans, intentions or goals also are forward-looking statements. Examples of forward-looking statements include, but are not limited to, statements we make regarding our expected operating results, future economic conditions including currency exchange rates, future dividend declarations and the guidance we give with respect to our anticipated financial performance. We believe that our expectations are based on reasonable assumptions. Forward-looking statements, however, are subject to a number of risks and uncertainties that could cause actual results to differ materially from the projections, anticipated results or other expectations expressed in this presentation, and no assurances can be given that our expectations will prove to have been correct. These risks and uncertainties include, but are not limited to, factors set forth in the Risk Factors section in our Annual Report on Form 10-K for the most recently ended fiscal year, which may be updated in Item 1A of, or elsewhere in, our Quarterly Reports on Form 10-Q filed for periods subsequent to such Form 10-K. Our forward-looking statements speak only as of the date made, and we undertake no obligation, other than as required by applicable law, to update or revise any forward-looking statements, whether as a result of new information, subsequent events, anticipated or unanticipated circumstances or otherwise. 11 2

Agenda Speakers: Ed Heffernan President and CEO Charles Horn EVP and CFO Fourth Quarter and Full Year Consolidated ResultsSegment Results2016 Wrap-Up2017 Outlook 1 3

Fourth Quarter and 2016 Consolidated Results(MM, except per share) 2 1 Before $242 million or $3.13 from cancellation of time-based expiry. 2 Before $0.65 in regulatory settlement charges. 4
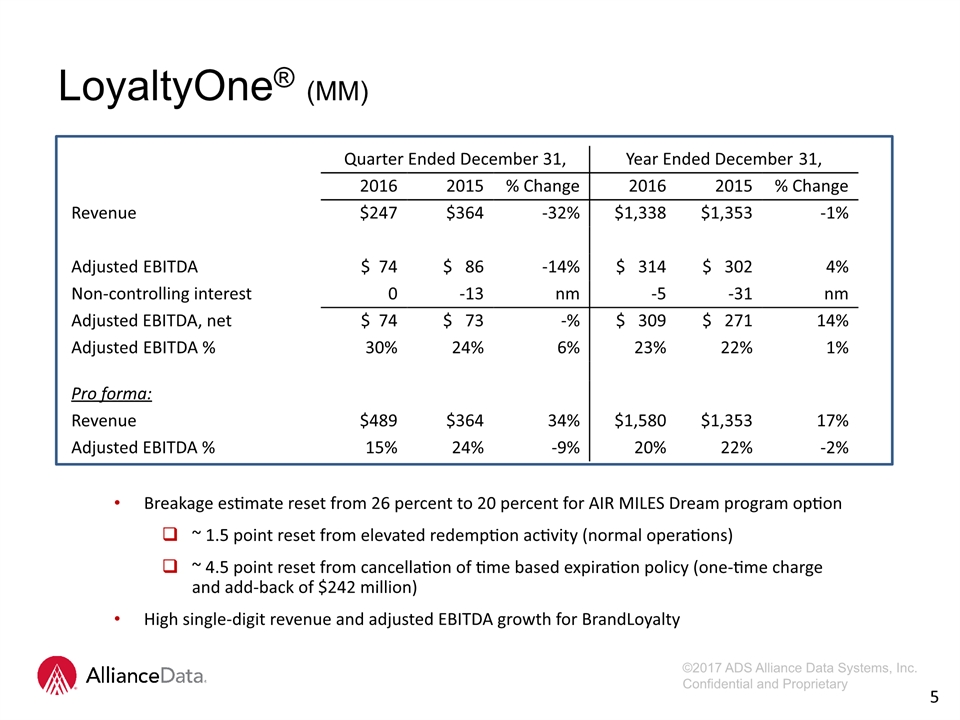
LoyaltyOne® (MM) Quarter Ended December 31, Year Ended December 31, 2016 2015 % Change 2016 2015 % Change Revenue $247 $364 -32% $1,338 $1,353 -1% Adjusted EBITDA $ 74 $ 86 -14% $ 314 $ 302 4% Non-controlling interest 0 -13 nm -5 -31 nm Adjusted EBITDA, net $ 74 $ 73 -% $ 309 $ 271 14% Adjusted EBITDA % 30% 24% 6% 23% 22% 1% Pro forma: Revenue $489 $364 34% $1,580 $1,353 17% Adjusted EBITDA % 15% 24% -9% 20% 22% -2% 3 5 Breakage estimate reset from 26 percent to 20 percent for AIR MILES Dream program option~ 1.5 point reset from elevated redemption activity (normal operations)~ 4.5 point reset from cancellation of time based expiration policy (one-time charge and add-back of $242 million)High single-digit revenue and adjusted EBITDA growth for BrandLoyalty

Epsilon® (MM) Core revenue increased 4 percent for 2016, offset by a 3 point drag from non-core businesses Drag from non-core should abate in 2017Adjusted EBITDA returned to growth during the fourth quarter due to cost initiatives Quarter Ended December 31, Year Ended December 31, 2016 2015 % Change 2016 2015 % Change Revenue $600 $608 -1% $2,155 $2,141 1% Adjusted EBITDA $162 $157 3% $ 480 $ 508 -6% Adjusted EBITDA % 27% 26% 1% 22% 24% -2% 4 6

Card Services (MM) Quarter Ended December 31, Year Ended December 31, 2016 2015 % Change 2016 2015 % Change Revenue $988 $785 26% $3,675 $2,974 24% Operating expenses 341 291 17% 1,311 1,0861 21% Provision for loan losses 290 206 40% 941 668 41% Funding costs 59 42 40% 210 151 40% Adjusted EBITDA, net $299 $246 21% $1,213 $1,069 14% Adjusted EBITDA, net % 30% 31% -1% 33% 36% -3% 5 Core credit sales growth increased 4 percent for the year, but were flat for the fourth quarterRetailer comp sales -3 percent in Q4; primarily due to weakness in apparelTender share increased ~ 110 bps for Q4 and 150 bps for full yearAllowance for loan loss reserve is 5.9 percent of reservable card receivables at 12/31Equivalent to 12 months forward coverage 1 Excludes $65 million in regulatory settlement charges. 7

Card Services (MM) Gross yields increased 10 bps in Q4Operating expenses improved 60 bps expressed as a percentage of average card receivables in Q4Delinquency rate trends tracking to the “wedge” Key Metrics: Quarter Ended December 31, Year Ended December 31, 2016 2015 Change 2016 2015 Change Credit sales $9,009 $ 7,767 16% $29,271 $24,736 18% Average card receivables $15,306 $12,545 22% 14,086 $11,365 24% Total gross yield 25.1% 25.0% 0.1% 25.5% 26.2% -0.7% Operating expenses as % of average card receivables 8.7% 9.3% -0.6% 9.1% 9.6%1 -0.5% Principal loss rates 5.5% 4.7% 0.8% 5.1% 4.5% 0.6% Delinquency rate 4.8% 4.2% 0.6% 4.8% 4.2% 0.6% 6 8 1 Excludes $65 million in regulatory settlement charges.

2016 Wrap-up 7 9 Revenue +7.14 bn ↑11 percent, core EPS +16.92 ↑12 percent Revenue +7.38 bn ↑15 percent excluding expiry resetApproximately $175 mm of AIR MILES revenue pull-forward from 2017 to 2016 due to ‘run on the bank’ in Q3 and Q4Run-rate revenue: +7.2 bn ↑12 percentDouble-digit revenue and core EPS growth despite absorbing 12 point drag from increase in Card Services’ loss rateBalanced use of cash:~ $800 mm for share repurchases~ $350 mm for M&A (final 30 percent of BrandLoyalty)~500 mm for $2.7 bn card receivables growthEstablished 1 percent dividendLeverage < 3X Consolidated

8 10 Revenue ↑17 percent (before $242 mm reduction for expiry breakage reset), adjusted EBITDA ↑4 percentRevenue included ~ $175 mm in pull-forward from 2017 into 2016 due to elevated redemption activity in advance of now cancelled 12/31 expiration dateAdjusted numbers: revenue ↑4 percent, adjusted EBITDA ↑4 percentBrandLoyalty: strong growth from existing and new marketsCanada: firmly established; US: first client rolloutAIR MILES:Ontario’s Parliament enacted new law prohibiting the time-based expiration of points in December 2016One-time charge to reflect lost breakage revenue LoyaltyOne 2016 Wrap-up

Revenue ↑1 percent, adjusted EBITDA ↓6 percentCore (92 percent of total revenue >100 percent of profit)Revenue ↑4 percent including -4 percent drag from Technology Platform businessIndia office ended year at full scale run-rate: ~ 1,000 associatesCompleted Part 1 of 2 for Platform turnaround: expense sideNon-core revenue decreased from 11 percent to 8 percent of total revenue in 2016, but was still a 3 point drag on total revenue growth Epsilon 2016 Wrap-up 11
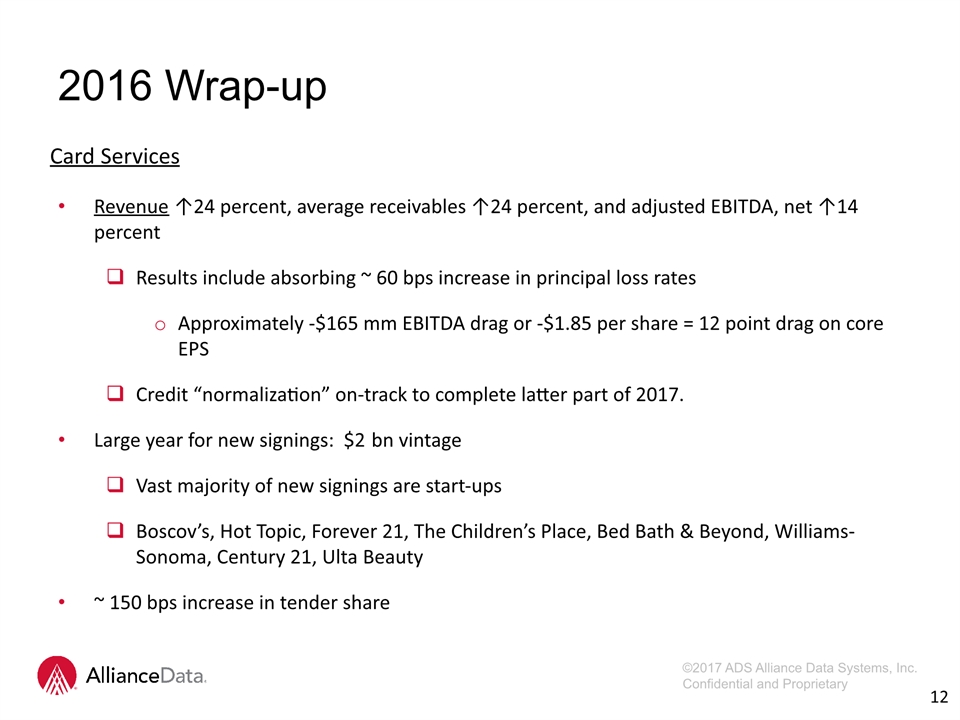
Revenue ↑24 percent, average receivables ↑24 percent, and adjusted EBITDA, net ↑14 percentResults include absorbing ~ 60 bps increase in principal loss ratesApproximately -$165 mm EBITDA drag or -$1.85 per share = 12 point drag on core EPSCredit “normalization” on-track to complete latter part of 2017.Large year for new signings: $2 bn vintageVast majority of new signings are start-upsBoscov’s, Hot Topic, Forever 21, The Children’s Place, Bed Bath & Beyond, Williams-Sonoma, Century 21, Ulta Beauty~ 150 bps increase in tender share Card Services 2016 Wrap-up 12

2017 Outlook Consolidated 2016 2017 Revenue Prior Guidance $7.2 bn, +12% $7.9 bn, +10% LoyaltyOne pull-forward 0.2 -0.2 New Guidance $7.4 bn, +15% $7.7 bn, +5% Core EPS $16.92 $18.50, ~10 percent 13 2017 growth rates Q1 Q2 Q3 Q4 Reported revenue High-single Mid-single Mid-single Low-teens Core EPS Flat Flat Mid-teens Mid-teens CAGR10 Year History: Revenue + 13% Adjusted EBITDA + 12% Core EPS + 17%

2017 Outlook 14 LoyaltyOne 2017: - All segments contributing - Solid growth while absorbing final credit normalization2018: - “Slingshot” (stable principal loss rates = higher growth rates) Consolidated
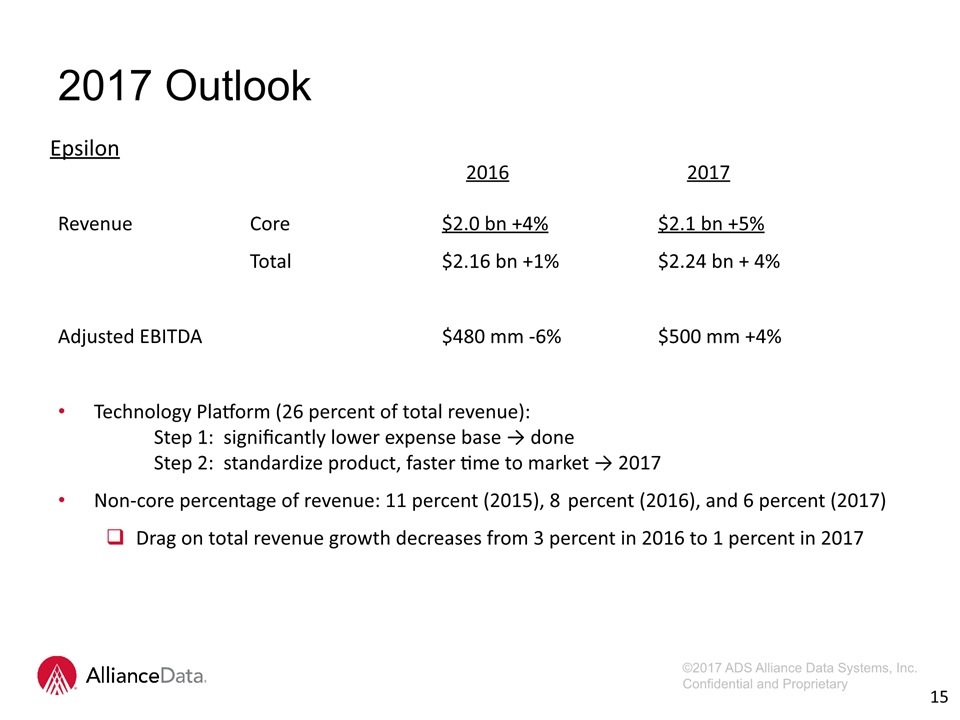
15 2017 Outlook 2016 2017Revenue Core $2.0 bn +4% $2.1 bn +5% Total $2.16 bn +1% $2.24 bn + 4%Adjusted EBITDA $480 mm -6% $500 mm +4%Technology Platform (26 percent of total revenue): Step 1: significantly lower expense base → done Step 2: standardize product, faster time to market → 2017Non-core percentage of revenue: 11 percent (2015), 8 percent (2016), and 6 percent (2017)Drag on total revenue growth decreases from 3 percent in 2016 to 1 percent in 2017 Epsilon

Card receivables growth: $2.4 bn, +15 percent in 2017 compared to $2.7 bn, +20% in 2016Pipeline: remains robust; expect another $2 bn vintage yearGross yields: stableOperating expenses (excludes loan loss provision and funding costs): ~20 bps of leverageCredit normalization on-track - delinquenciesQ1: 50 bps over last yearQ2 - Q3: gap narrowsQ4: flat to prior year loss rate to follow shortlyPrincipal loss rates in the mid-5 percent rangeApproximately 6 percent in 1st half, below 5.5 percent by Q31st half negatively impacted by slowing card receivable growth rates (denominator effect) and soft recovery market (timing)Overall, still expect 8 – 10 percent adjusted EBITDA, net growth Card Services 2017 Outlook 16

Delinquency rates have strong seasonality (Sep-Oct peak), but are very predictable.Delinquency rates are 90% correlated with net loss rates that come 3-6 months later (an account becomes a p&l loss after 180 days delinquent).2017 delinquency rates should narrow and become flat by the third quarter. Loss rates expected to follow and be flat to prior year.Long-term steady state loss rates should then settle in and remain stable.Earnings acceleration begins. 17 2017 Outlook – Closing The ‘Wedge’

Financial MeasuresIn addition to the results presented in accordance with generally accepted accounting principles, or GAAP, the Company may present financial measures that are non-GAAP measures, such as constant currency financial measures, adjusted EBITDA, adjusted EBITDA margin, adjusted EBITDA, net of funding costs and non-controlling interest, core earnings and core earnings per diluted share (core EPS). Constant currency excludes the impact of fluctuations in foreign exchange rates. The Company calculates constant currency by converting our current period local currency financial results using the prior period exchange rates. The Company uses adjusted EBITDA and adjusted EBITDA, net as an integral part of internal reporting to measure the performance and operational strength of reportable segments and to evaluate the performance of senior management. Adjusted EBITDA eliminates the uneven effect across all reportable segments of non-cash depreciation of tangible assets and amortization of intangible assets, including certain intangible assets that were recognized in business combinations, and the non-cash effect of stock compensation expense. Similarly, core earnings and core EPS eliminate non-cash or non-operating items, including, but not limited to, stock compensation expense, amortization of purchased intangibles, amortization of debt issuance costs, mark-to-market gains or losses on interest rate derivatives, changes to the expiry policy and regulatory settlements. The Company believes that these non-GAAP financial measures, viewed in addition to and not in lieu of the Company’s reported GAAP results, provide useful information to investors regarding the Company’s performance and overall results of operations. Reconciliations to comparable GAAP financial measures are available in the Company’s earnings release, which is posted in both the News and Investors sections on the Company’s website (www.alliancedata.com). The financial measures presented are consistent with the Company’s historical financial reporting practices. Core earnings and core EPS represent performance measures and are not intended to represent liquidity measures. The non-GAAP financial measures presented herein may not be comparable to similarly titled measures presented by other companies, and are not identical to corresponding measures used in other various agreements or public filings. 12 18

Q & A 19