Attached files
| file | filename |
|---|---|
| EX-99.1 - EX-99.1 - LINEAR TECHNOLOGY CORP /CA/ | lltc-20170117xex99_1.htm |
| 8-K - 8-K - LINEAR TECHNOLOGY CORP /CA/ | lltc-20170117x8k.htm |
BOOKINGS BY END MARKET, REVENUE BY GEOGRAPHIC REGION, AND SUPPLEMENTAL FINANCIAL INFORMATION
(unaudited)
Linear Technology Corporation has been designing, manufacturing and marketing a broad line of analog integrated circuits for major companies worldwide for over three decades. The Company’s products provide an essential bridge between our analog world and the digital electronics in communications, networking, industrial, automotive, computer, medical, instrumentation, consumer, and military and aerospace systems. We generate bookings and revenue from thousands of customers worldwide and our bookings and revenues are diversified by end-market and geographical region.
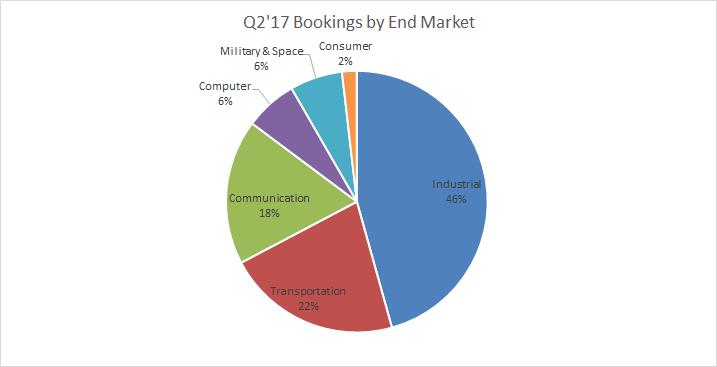
For the three months ended January 1, 2017 the categorization of bookings by end markets are as follows:
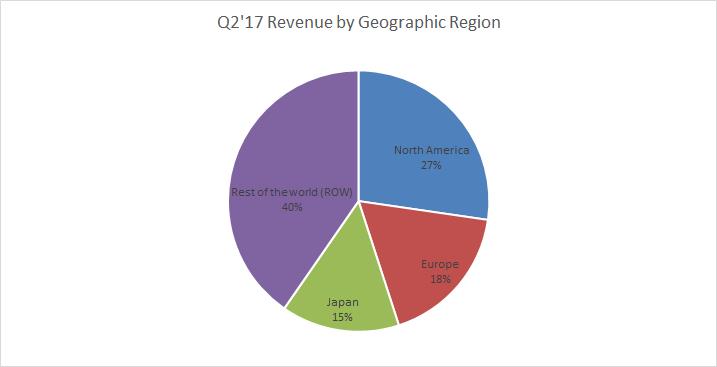
For the three months ended January 1, 2017 the categorization of revenue by geographic region are as follows:
|
(1) |
Based upon shipments made into the respective region. Demand created bookings during the period were approximately 38% in North America and 62% internationally. |
For the three months ended January 1, 2017 the supplemental financial information is as follows:
REVENUES
•Revenues were up slightly compared to the first quarter of fiscal 2017. Fiscal Q2 revenues were led by an increase in shipments into the Communication and Industrial markets.
|
· |
Geographically, sales to Japan and Rest of World (“ROW”) increased 6% and 2%, respectively over the first quarter. Sales to Europe and North America decreased 5% and 1%, respectively. |
|
· |
For Fiscal Q2, North American sales were 27% of total sales, ROW was 40%, Europe was 18% and Japan was 15%. |
|
· |
Average Selling Price (“ASP”) of our products was $2.03 for the quarter, versus $2.00 in the prior quarter. |
|
· |
Battery Management Systems (“BMS”) and Micro-Module sales continued to be strong year-over-year, however, both were down slightly from the previous quarter. |
|
· |
For the quarter we had a book to bill ratio that was slightly greater than 1. |
GROSS MARGIN
•Adjusted Gross Margin, on a Non-GAAP basis excluding acquisition related expenses, increased by 3 tenths to 76.3% over the first quarter, primarily due to improved sales mix.
•Average Selling Price increased to $2.03, up over $2.00 in Q1.
OPERATING EXPENSES
•Research and development expenses increased $0.7 million over Q1 primarily due to a $1.7 million increase in stock compensation charges offset by a $1.0 million decrease in labor and other costs due to the holiday week shutdown.
•Selling, general and administrative expenses decreased $8.9 million primarily due to a $9.0 million decrease in merger related charges and a $0.8 million decrease in other selling, general and administrative expenses due to the holiday week shutdown offset by a $0.9 million increase in stock compensation charges
EFFECTIVE INCOME TAX RATE
•The Company’s effective income tax rate decreased to 23.75%, down from 24.00% in the previous quarter. The Company’s annual effective income tax rate for fiscal 2017 excluding quarterly discrete items is 23.75%.
DILUTED SHARES
•Weighted average and dilutive shares used in the calculation of diluted earnings per share increased by 571 thousand shares. During the quarter the Company made no open market stock repurchases. The Company is prohibited from repurchasing stock on the open market as a result of the ADI merger agreement.
BALANCE SHEET ITEMS
CASH AND INVESTMENTS
•Cash, cash equivalents and investments increased by $88.7 million to $1.6 billion, net of spending $12.1 million for capital expenditures, $78.7 million for dividends and $9.2 million for stock purchases (employee tax withholding on vested stock shares) totaling 153 thousand shares.
ACCOUNTS RECEIVABLE
•Accounts Receivable decreased by $17.3 million on flat revenues. Days sales outstanding decreased to 35 days from 40 days due to the timing of collections.
INVENTORIES
•Inventory increased by $500 thousand primarily due to a $2.0 million increase in finished goods as the Company prepares for the Chinese New Year holiday in Asia, while work in process and raw material inventories decreased $1.5 million.
•Average inventory turns remained stable at 3.7 times for the quarter on an annual basis.
BOOKINGS BY REGION
|
· |
The Company’s book to bill ratio for Fiscal Q2 was slightly greater than 1 for the quarter. |
|
o |
Bookings decreased in North American and increased Internationally. |
|
o |
Within International, bookings increased in Japan and Europe, while Rest of World (“ROW” Asia, excluding Japan) was down. |
|
o |
On a demand created basis, bookings were 62% in International and 38% in North America, the same as last period. |
BOOKINGS BY MARKET SECTOR
|
· |
On a sequential basis, bookings increased in Industrial and Military/Space while bookings decreased in Communication, Transportation, Computer, and Consumer. |
|
o |
Industrial bookings as a percentage of total bookings were 46%, up from 43% in Q1 primarily from increases in Europe, Japan, and North America. |
|
o |
Transportation bookings as a percentage of total bookings were 22%, down from 24% in Q1. Transportation was down from decreases in Japan and ROW, primarily due to Battery Management Systems (“BMS”) in China. |
|
o |
Communication bookings as a percentage of total bookings were 18%, and relatively unchanged from 18% in Q1. |
|
o |
Computer bookings as a percentage of total bookings were 6%, down slightly from 7% in Q1 due to weakness in Notebook Computers. |
|
o |
Military and Space bookings as a percentage of total bookings were 6%, and relatively unchanged from 6% in Q1. |
|
o |
Consumer bookings as a percentage of total bookings were 2%, and relatively unchanged from 2% in Q1. |