Attached files
| file | filename |
|---|---|
| EX-23.1 - EX-23.1 - REV Group, Inc. | d251368dex231.htm |
| EX-10.17 - EX-10.17 - REV Group, Inc. | d251368dex1017.htm |
| EX-5.1 - EX-5.1 - REV Group, Inc. | d251368dex51.htm |
Table of Contents
As filed with the Securities and Exchange Commission on January 17, 2017
Registration No. 333-214209
UNITED STATES
SECURITIES AND EXCHANGE COMMISSION
Washington, D.C. 20549
AMENDMENT NO. 4
TO
FORM S-1
REGISTRATION STATEMENT
UNDER
THE SECURITIES ACT OF 1933
REV Group, Inc.
(Exact Name of Registrant as Specified in Its Charter)
| Delaware | 3711 | 26-3013415 | ||
| (State or Other Jurisdiction of Incorporation or Organization) |
(Primary Standard Industrial Classification Code Number) |
(I.R.S. Employer Identification Number) |
111 East Kilbourn Avenue, Suite 2600
Milwaukee, WI 53202
(414) 290-0190
(Address, Including Zip Code, and Telephone Number, Including Area Code, of Registrant’s Principal Executive Offices)
| Tim Sullivan | Dean Nolden | |
| Chief Executive Officer | Chief Financial Officer |
111 East Kilbourn Avenue, Suite 2600
Milwaukee, WI 53202
(414) 290-0190
(Name, Address, Including Zip Code, and Telephone Number, Including Area Code, of Agent For Service)
Copies to:
| Richard D. Truesdell, Jr. Derek J. Dostal Davis Polk & Wardwell LLP 450 Lexington Avenue New York, NY 10017 (212) 450-4000 |
Pamela S. Krop General Counsel 1441 Brickell Avenue, Suite 1007 Miami, FL 33131 (786) 279-7022 |
Marc D. Jaffe Wesley C. Holmes Latham & Watkins LLP 885 Third Avenue New York, NY 10022 (212) 906-1200 |
Approximate date of commencement of proposed sale to the public: As soon as practicable after the effective date of this Registration Statement.
If any of the securities being registered on this Form are to be offered on a delayed or continuous basis pursuant to Rule 415 under the Securities Act of 1933, check the following box. ☐
If this Form is filed to register additional securities for an offering pursuant to Rule 462(b) under the Securities Act, check the following box and list the Securities Act registration statement number of the earlier effective registration statement for the same offering. ☐
If this Form is a post-effective amendment filed pursuant to Rule 462(c) under the Securities Act, check the following box and list the Securities Act registration statement number of the earlier effective registration statement for the same offering. ☐
If this Form is a post-effective amendment filed pursuant to Rule 462(d) under the Securities Act, check the following box and list the Securities Act registration statement number of the earlier effective registration statement for the same offering. ☐
Indicate by check mark whether the registrant is a large accelerated filer, an accelerated filer, a non-accelerated filer, or a smaller reporting company. See the definitions of “large accelerated filer,” “accelerated filer” and “smaller reporting company” in Rule 12b-2 of the Exchange Act.
| Large accelerated filer | ☐ | Accelerated filer | ☐ | |||
| Non-accelerated filer | ☒ (Do not check if a smaller reporting company) | Smaller reporting company | ☐ |
|
| ||||||||
| Title of Each Class of Securities to be Registered |
Amount to Be Registered(1) |
Proposed Maximum |
Proposed Maximum |
Amount of Registration Fee(3) | ||||
| Common stock, $0.001 par value |
14,375,000 | $21.00 | $301,875,000 | $34,987.31 | ||||
|
| ||||||||
|
| ||||||||
| (1) | Includes the offering price of shares of common stock that may be sold if the option to purchase additional shares of common stock granted to the underwriters is exercised. |
| (2) | Estimated solely for the purpose of calculating the amount of registration fee in accordance with Rule 457(a) under the Securities Act of 1933, as amended. |
| (3) | Filing fees in the amount of $11,590 were previously paid. |
The Registrant hereby amends this Registration Statement on such date or dates as may be necessary to delay its effective date until the Registrant shall file a further amendment which specifically states that this Registration Statement shall thereafter become effective in accordance with Section 8(a) of the Securities Act of 1933 or until the Registration Statement shall become effective on such date as the Securities and Exchange Commission, acting pursuant to said Section 8(a), may determine.
Table of Contents
The information in this preliminary prospectus is not complete and may be changed. We may not sell these securities until the registration statement filed with the Securities and Exchange Commission is effective. This preliminary prospectus is not an offer to sell these securities and it is not soliciting an offer to buy these securities in any jurisdiction where the offer or sale is not permitted.
SUBJECT TO COMPLETION, DATED JANUARY 17, 2017
PRELIMINARY PROSPECTUS
12,500,000 Shares

REV Group, Inc.
Common Stock
$ per share
This is the initial public offering of our common stock. Prior to this offering, there has been no public market for our common stock. We are selling 12,500,000 shares of our common stock. We currently expect the initial public offering price to be between $19.00 and $21.00 per share of common stock.
Our shares of common stock have been approved for listing on the New York Stock Exchange (“NYSE”) under the symbol “REVG,” subject to notice of official issuance.
The selling stockholders have granted the underwriters an option to purchase up to 1,875,000 additional shares of common stock at the initial public offering price less the underwriting discount. We will not receive any proceeds from the sale of shares by the selling stockholders.
Investing in shares of our common stock involves risk. See “Risk Factors” beginning on page 25.
Neither the Securities and Exchange Commission nor any state securities commission has approved or disapproved of these securities or passed on the adequacy or accuracy of this prospectus. Any representation to the contrary is a criminal offense.
| Per Share | Total | |||||||
| Initial public offering price |
$ | $ | ||||||
| Underwriting discount(1) |
$ | $ | ||||||
| Proceeds to us before expenses |
$ | $ | ||||||
| (1) | See “Underwriting” for additional information regarding total underwriter compensation. |
The underwriters expect to deliver the shares of common stock to investors on or about , 2017.
| Goldman, Sachs & Co. | Morgan Stanley | Baird | ||
| BMO Capital Markets |
Credit Suisse |
Deutsche Bank Securities |
| Jefferies | Wells Fargo Securities | Stifel |
Prospectus dated , 2017
Table of Contents

Table of Contents

Table of Contents

Table of Contents
| Page | ||||
| ii | ||||
| ii | ||||
| ii | ||||
| ii | ||||
| 1 | ||||
| 25 | ||||
| 46 | ||||
| 47 | ||||
| 48 | ||||
| 49 | ||||
| 51 | ||||
| 52 | ||||
| Management’s Discussion and Analysis of Financial Condition and Results of Operations |
54 | |||
| 77 | ||||
| 102 | ||||
| 111 | ||||
| 128 | ||||
| 131 | ||||
| 134 | ||||
| 136 | ||||
| 141 | ||||
| 143 | ||||
| 146 | ||||
| 155 | ||||
| 155 | ||||
| 155 | ||||
| Index to the Consolidated Financial Statements | F-1 | |||
Neither we, the selling stockholders nor the underwriters have authorized anyone to provide any information other than that contained in this prospectus or to which we have referred you. We, the selling stockholders and the underwriters take no responsibility for, and can provide no assurance as to the reliability of, any other information that others may give you. We, the selling stockholders and the underwriters are offering to sell, and seeking offers to buy, these securities only in jurisdictions where offers and sales are permitted. You should assume that the information in this prospectus is accurate only as of the date on the cover page, regardless of the time of delivery of this prospectus or of any sale of our common stock. Our business, prospects, financial condition and results of operations may have changed since that date.
Through and including , 2017 (25 days after the date of this prospectus), all dealers that effect transactions in shares of our common stock, whether or not participating in this offering, may be required to deliver a prospectus. This delivery is in addition to a dealer’s obligation to deliver a prospectus when acting as an underwriter and with respect to their unsold allotments or subscriptions.
For investors outside the United States: We and the selling stockholders have not, and the underwriters have not, done anything that would permit this offering or possession or distribution of this prospectus or any free writing prospectus we may provide to you in connection with this offering in any jurisdiction where action for this purpose is required, other than in the United States. Persons outside the United States who come into possession of this prospectus must inform themselves about, and observe any restrictions relating to, the offering of the shares of common stock and the distribution of this prospectus outside the United States. See “Underwriting.”
i
Table of Contents
Prior to May 25, 2016, our fiscal year ended on October 31 of each year. Effective May 25, 2016, we changed our fiscal year to be the 52- or 53-week period ending on the last Saturday in October. References to a particular fiscal year refer to the year in which that fiscal year ends. For example, all references to “fiscal year 2016” relate to the 52-week period ending October 29, 2016, and all references to “fiscal year 2015” relate to the year ended October 31, 2015. Each of our fiscal years is divided into four 13-week fiscal quarters. Each fiscal quarter is grouped into two 4-week monthly reporting periods and one 5-week monthly reporting period, although quarters may occasionally consist of “4-5-5” or “4-4-6” monthly periods, depending on the calendar and the additional week in a 53-week fiscal year.
Certain numbers or percentages in this prospectus may not sum due to rounding.
We own or have rights to copyrights, trademarks, service marks or trade names that we use in connection with the operation of our business. Solely for convenience, some of the copyrights, trademarks, service marks and trade names referred to in this prospectus are listed without the ©, ® and ™ symbols, but we will assert, to the fullest extent under applicable law, our rights to our copyrights, trademarks, service marks, trade names and domain names. Some of the trademarks we own or have the right to use include, but are not limited to: E-ONE, KME, Kovatch Mobile Equipment, American Emergency Vehicles, Horton Emergency Vehicles, Leader Emergency Vehicles, Wheeled Coach, Collins Bus, Champion Bus, Goshen Coach, ENC, ElDorado National, McCoy Miller, Marque, Capacity of Texas, Capacity Trucks, Lay-Mor, Goldshield Fiberglass, Fleetwood RV, Monaco, American Coach, Road Rescue, Frontline, World Trans, Federal Coach, Krystal Coach and Holiday Rambler. The copyrights, trademarks, service marks and trade names of other companies appearing in this prospectus are, to our knowledge, the property of their respective owners.
This prospectus includes information with respect to market share and industry conditions obtained directly or indirectly from publicly available information, industry publications and surveys, reports from government agencies and our own estimates based on our management’s knowledge of and experience in the markets in which we compete. Unless otherwise indicated, industry information and information about our competitive position contained in this prospectus is based on our internal research and estimates. Our internal estimates are based upon our understanding of industry conditions, and such information has not been verified by any independent sources. While we believe that such information and estimates are reasonable and reliable, neither we, the selling stockholders nor the underwriters have independently verified market and industry data from third parties. In addition, projections, assumptions and estimates of the future performance of the industry in which we operate and our future performance are necessarily subject to uncertainty and risk due to a variety of factors, including those described in “Risk Factors” and “Cautionary Note Regarding Forward-Looking Statements.” These and other factors could cause results to differ materially from those expressed in the estimates made by the independent parties and by us.
NON-GAAP FINANCIAL INFORMATION
We report our financial results in accordance with U.S. generally accepted accounting principles (“GAAP”). However, management believes that the evaluation of our ongoing operating results may be enhanced by a presentation of Adjusted EBITDA and Adjusted Net Income, which are non-GAAP financial measures. Adjusted EBITDA represents net income before interest expense, income taxes, depreciation and amortization as adjusted for certain non-recurring, one-time and other adjustments which we believe are not indicative of our underlying operating performance and Adjusted Net Income represents net income as adjusted for certain after-tax, non-recurring, one-time and other adjustments which we believe are not indicative of our underlying
ii
Table of Contents
operating performance as well as for the add-back of certain non-cash intangible amortization, in each case as discussed more fully in “Prospectus Summary—Summary Consolidated Financial Data.”
We believe that the use of Adjusted EBITDA and Adjusted Net Income provide additional meaningful methods of evaluating certain aspects of our operating performance from period to period on a basis that may not be otherwise apparent under GAAP when used in addition to, and not in lieu of, GAAP measures. See “Prospectus Summary—Summary Consolidated Financial Data” for a discussion of our use of Adjusted EBITDA and Adjusted Net Income in this prospectus, including the reasons that we believe this information is useful to management and to investors and a reconciliation of Adjusted EBITDA and Adjusted Net Income to the most closely comparable financial measures calculated in accordance with GAAP.
iii
Table of Contents
This summary highlights information contained in other parts of this prospectus. Because it is only a summary, it does not contain all of the information that you should consider before investing in shares of our common stock and it is qualified in its entirety by, and should be read in conjunction with, the more detailed information appearing elsewhere in this prospectus. You should read the entire prospectus carefully, especially “Risk Factors,” “Management’s Discussion and Analysis of Financial Condition and Results of Operations” and our consolidated financial statements and the related notes, before deciding to buy shares of our common stock. Unless otherwise indicated or the context requires otherwise, references in this prospectus to the “Company,” “REV,” “we,” “us” and “our” refer to REV Group, Inc. and its consolidated subsidiaries.
Our Company
REV is a leading designer, manufacturer and distributor of specialty vehicles and related aftermarket parts and services. We serve a diversified customer base primarily in the United States through three segments: Fire & Emergency, Commercial and Recreation. We provide customized vehicle solutions for applications including: essential needs (ambulances, fire apparatus, school buses, mobility vans and municipal transit buses), industrial and commercial (terminal trucks, cut-away buses and street sweepers) and consumer leisure (recreational vehicles (“RVs”) and luxury buses). Our brand portfolio consists of 26 well-established principal vehicle brands including many of the most recognizable names within our served markets. Several of our brands pioneered their specialty vehicle product categories and date back more than 50 years. We believe that in most of our markets, we hold the first or second market share position and estimate that approximately 72% of our net sales during fiscal year 2016 came from products where we hold such share positions.
In fiscal year 2016, we sold approximately 17,300 units and we currently have an estimated installed base of approximately 240,000 vehicles in operation. We believe this provides us with a competitive advantage and recurring replacement vehicle sales as many customers are brand-loyal and fleet owners frequently seek to standardize their in-service fleets through repeat purchases of existing brands and product configurations. The specialty vehicle market is a complex and attractive market characterized by: (i) numerous niche markets with annual sales volumes generally between 3,000 and 25,000 units, (ii) highly customized vehicle configurations addressing unique customer applications and (iii) specialized customer bases and distribution channels (both dealer and direct). We believe the specialty vehicle market has historically been addressed primarily by smaller, less sophisticated companies, which has created an opportunity for market leadership by scaled and highly efficient producers such as REV. Under our current leadership, our focus on product innovation, life-cycle value leadership and operational improvement has strengthened our brands and market position while driving growth and expanding margins.
Our products are sold to municipalities, government agencies, private contractors, consumers and industrial and commercial end users. We have a diverse customer base with our top 10 customers representing approximately 25% of our net sales in fiscal year 2016, with no single customer representing more than 6% of our net sales over the same period. Our top 10 customers have maintained relationships with REV and its predecessor companies for an average of approximately 20 years. We believe our diverse end markets are favorably exposed to multiple secular growth drivers such as: rising municipal spending, a growing aged population, growing urbanization, growing student populations, the increasing popularity of outdoor and active lifestyles and the replacement of existing in-service vehicles including legislated replacements. In addition to these favorable underlying drivers of growth, we believe certain of our markets will benefit over the next several years from incremental demand created by the underinvestment in fleets following the 2008 recession. For example, as set forth in the charts below in “—Our Markets,” we estimate that the cumulative pent-up replacement demand in the fire and emergency market is approximately 15,000 units, which represents 144% of the total fire and emergency market unit sales volume in the United States and Canada in 2015. However, we
1
Table of Contents
cannot be certain as to the timing and extent to which the pent-up replacement demand may be released, as it is inherently uncertain and generally outside our control.
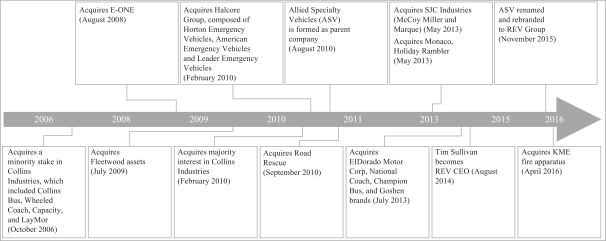
Our business model utilizes our unique scale to drive profitable organic and acquisitive growth. We seek to gain market share by delivering high-quality products with customized attributes tailored to our customers’ product specifications, while simultaneously reducing costs and shortening delivery lead times. We aim to achieve this by standardizing and optimizing certain processes across our segments in areas including: procurement, engineering and product development, lean manufacturing, dealer management, pricing and aftermarket parts sales. We believe our manufacturing and service network, consisting of 15 manufacturing facilities and 11 aftermarket service locations (called Regional Technical Centers or “RTCs”), provides us with a competitive advantage through the sharing of best practices, manufacturing flexibility based on relative facility utilization levels, delivery costs and lead times, economies of scale, customer service capabilities and a complementary distribution system. Our business consists primarily of design, engineering, integration and assembly activities, which require low levels of capital expenditures. Additionally, our business has a highly variable cost structure that results in operational flexibility which, we believe, when combined with low levels of capital expenditures, can produce high returns on invested capital. Furthermore, our broad presence across the specialty vehicle market and large manufacturing and distribution network are important differentiators in our ability to grow through acquisitions. We seek to make synergistic acquisitions that further enhance our existing market positions or enter REV into new, attractive product segments. In the past 10 years, we have successfully integrated nine acquisitions and have demonstrated the ability to grow and enhance the earnings profile of acquired businesses by either consolidating acquired businesses into our existing plant footprint or by introducing REV processes into the newly acquired businesses to drive profitable growth.
Our management team has an average of 28 years of experience in highly specialized industrial manufacturing and aftermarket parts and services businesses. Beginning in 2014, our new leadership team introduced several initiatives to accelerate growth and improve our profitability. These initiatives included: improving brand management, strengthening distribution, implementing a centralized enterprise-wide procurement strategy, growing adjacent and aftermarket products and services, improving production processes within our facilities, driving down total cost of quality, implementing value-based pricing strategies and reducing fixed costs.
We have delivered strong financial and operating results from fiscal year 2014 to fiscal year 2016, as set forth below:
| (1) | Net sales were $1,721 million, $1,735 million and $1,926 million for fiscal year 2014, fiscal year 2015 and fiscal year 2016, respectively, which represents a compound annual growth rate, or “CAGR,” of 3.8%; |
| (2) | We improved our operating performance, specifically: |
| • | Net income was $1.5 million, $23 million and $30 million for fiscal year 2014, fiscal year 2015 and fiscal year 2016, respectively, which represents a CAGR of 173%; |
| • | Adjusted Net Income was $14 million, $34 million and $55 million for fiscal year 2014, fiscal year 2015 and fiscal year 2016, respectively, which represents a CAGR of 56%; |
| • | Adjusted EBITDA was $62 million, $90 million and $127 million for fiscal year 2014, fiscal 2015 and fiscal year 2016, respectively, which represents a CAGR of 27%; and |
| (3) | We drove approximately 148 basis points and 280 basis points of expansion in our net income and Adjusted EBITDA margins, respectively. |
See “—Summary Consolidated Financial Data” below for additional information regarding our non-GAAP measures, including a reconciliation of these measures to their most directly comparable GAAP measure.
2
Table of Contents
Our Products and Markets
We primarily sell new specialty vehicles which we design, engineer and manufacture in our production facilities. We are also focused on growing our higher gross margin aftermarket business which consists of parts sales, service and other ancillary revenue opportunities generated by our installed base of approximately 240,000 vehicles. We believe the majority of our new vehicle sales represent the replacement of in-service vehicles which are past their useful life, with additional sales derived from fleet expansions, new customers and adjacent product introductions.
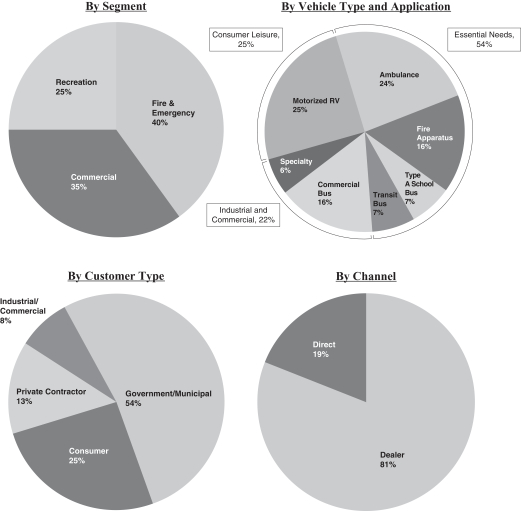
The following charts show a breakdown of our net sales for fiscal year 2016:
3
Table of Contents
The following chart sets forth summary information regarding our primary product line categories and end markets for our segments:
| Fire & Emergency |
Commercial |
Recreation | ||||
| Overview | The Fire & Emergency segment manufactures a wide range of fire apparatus and ambulance products. Fire & Emergency products are sold to municipal fire departments, EMS providers, and private fleets, typically purchasing through dealers. | The Commercial segment manufactures transit and shuttle buses, Type A school buses, mobility vans and other specialty vehicles including sweepers and terminal trucks distributed both through dealers and direct. Commercial products are sold to municipalities, schools, and commercial and industrial customers. | The Recreation segment manufactures motorized RV products sold to brand-loyal, repeat customers who purchase through dealers. | |||
| Selected Products |


|


|


| |||
| Principal Brands | Fire Apparatus
|


|


| |||


|


| |||||
| Ambulance |
||||||


|
|

| ||||


|
|
|||||


|
|
|||||


|


|
|||||
| Estimated Addressable Market Size(1) | ~$3 billion | ~$5 billion | ~$3 billion | |||
| Estimated Addressable Market Units(1) | Ambulance: ~6,200 Fire Apparatus: ~4,200 |
Type A School Bus: ~7,500 Cutaway Bus: ~15,000 Transit Bus: ~4,100 Mobility Vans: ~23,100 Terminal Trucks and Sweepers: ~7,400 |
Class A: ~21,900 Class C: ~22,100 | |||
| Estimated REV Market Share by Units(1) | ~41% | ~19% | Class A – ~13% Class C – ~1% | |||
| Fiscal Year 2016 Net Sales(2) | $768 million | $679 million | $489 million | |||
| Market Positions for Selected Products | #1 in Ambulance #2 in Fire Apparatus |
#1 in Type A School Bus #1 in Small & Medium Size Commercial Bus #2 in Terminal Trucks #1 in Light Broom Sweepers |
14% Class A market share as of October 2016 representing a 120 basis point increase from October 2015. We believe we are the industry’s fastest growing Class A participant. | |||
| Selected Customers and Dealers |

|
|
| |||


|
|

| ||||


| (1) | Based on 2015 market volumes in the United States and Canada. |
| (2) | Does not reflect the elimination of intersegment sales of approximately $10.6 million in fiscal year 2016. |
4
Table of Contents
Our Fire & Emergency segment sells fire apparatus equipment under the Emergency One (“E-ONE”) and Kovatch Mobile Equipment (“KME”) brands and ambulances under the American Emergency Vehicles (“AEV”), Horton Emergency Vehicles (“Horton”), Leader Emergency Vehicles (“Leader”), Marque, McCoy Miller, Road Rescue, Wheeled Coach and Frontline brands. We believe we are the largest manufacturer by unit volume of fire and emergency vehicles in the United States and have one of the industry’s broadest portfolios of products including Type I ambulances (aluminum body mounted on a heavy truck-style chassis), Type II ambulances (van conversion ambulance typically favored for non-emergency patient transportation), Type III ambulances (aluminum body mounted on a van-style chassis), pumpers (fire apparatus on a custom or commercial chassis with a water pump and small tank to extinguish fires), ladder trucks (fire apparatus with stainless steel or aluminum ladders), tanker trucks and rescue and other vehicles. Each of our brands is distinctly positioned and targets certain price and feature points in the market such that dealers often carry and customers often buy more than one REV Fire & Emergency product line.
Our Commercial segment serves the bus market through the following principal brands: Collins Bus, Goshen Coach, ENC, ElDorado National, Krystal Coach, Federal Coach, Champion and World Trans. We serve the terminal truck market through the Capacity brand, the sweeper market through the Lay-Mor brand and the mobility market through the ElDorado Mobility brand. We are a leading producer of small- and medium-sized buses, Type A school buses, transit buses, terminal trucks and street sweepers in the United States. Our products in the Commercial segment include cut-away buses (customized body built on various types and sizes of commercial chassis), transit buses (large municipal buses where we build our own chassis and body), luxury buses (bus-style limo or high-end luxury conversions), street sweepers (three- and four-wheel versions used in road construction activities), terminal trucks (specialized vehicle which moves freight in warehouses or intermodal yards and ports), Type A school buses (small school bus built on commercial chassis), and mobility vans (mini-van converted to be utilized by wheelchair passengers). Within each market segment, we produce a large number of customized configurations to address the diverse needs of our customers.
Our Recreation segment serves the RV market through four principal brands: American Coach, Fleetwood RV, Monaco Coach and Holiday Rambler. We believe these brands are among the longest standing, most recognized brands in the RV industry. Prior to the 2008 recession, as segments of larger public companies, they generated over $2 billion of annual sales in each of the calendar years 2004 and 2005 and represented approximately 36% of the motorized RV market in calendar year 2005 and an even higher percentage share of just the diesel portion of the Class A market. Under these four brands, REV provides a variety of highly recognized models such as: American Eagle, Dynasty, Discovery, Bounder and Pace Arrow, among others. Our products in the Recreation segment currently include only Class A motorized RVs (motorhomes built on a heavy duty chassis with either diesel or gas engine configurations) and Class C motorized RVs (motorhomes built on a commercial truck or van chassis). The Recreation segment also includes Goldshield Fiberglass, which produces a wide range of custom molded fiberglass products for the RV and broader industrial markets. Within our Recreation segment, we are one of the top producers of Class A diesel and gas motorized RVs with a 14% market share and a 7% market share of the motorized RV market as of October 2016 and we believe we are the fastest-growing participant in the market place based on market share, with our fiscal year 2016 unit sales growing 9% compared to fiscal year 2015. We are focused on recapturing the significant market share which our four principal brands enjoyed prior to 2008.
To enhance our market-leading positions, we continue to focus on new product development across our three segments. New product development is primarily designed to provide our customers with high-quality products that have varied and unique feature sets and product capabilities at attractive price points. We introduced eight new products in fiscal year 2016. We currently have 11 new products in development that we anticipate will be released in fiscal year 2017. In addition to new product development, our businesses are continuously customizing and designing our vehicles to meet individual customers’ needs and applications. In our RV business specifically, our new model design cycle follows similar timelines as the automotive industry, whereby new models and configurations are introduced or upgraded annually.
5
Table of Contents
Upon request, we facilitate financing for our dealers and end customers by providing them with access to our third-party bank partners. All such financing transactions are recorded on our bank partners’ balance sheets. We support these transactions under both non-recourse and recourse agreements with the banks, and in return, we earn a fee for arranging these transactions. We believe that offering customers finance options to purchase vehicles from us will help REV form a more complete relationship with our customers, help drive incremental vehicle sales and allow us to participate in finance revenue streams from third parties through arrangement fees.
Our Markets
We operate primarily in the United States in the fire and emergency, commercial and recreation markets. For fiscal year 2016 our net sales to international markets (including Canada) amounted to $66 million, representing approximately 3% of our overall net sales for the period. We sell internationally through dealers and agents to end markets that utilize U.S.-style chassis and product configurations.
Fire and Emergency Markets
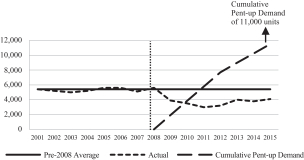
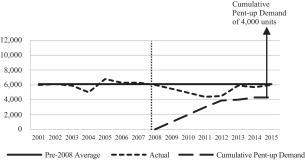
According to industry sources, there were approximately 10,400 fire apparatus and ambulance units shipped in 2015 in the United States and Canada, representing a 10% and 30% increase over the annual industry volumes for 2014 and 2011, respectively. Fire and emergency products are used by municipalities and private contractors to provide essential services such as emergency response, patient transport and fire suppression, among other activities. Nearly all fire apparatus and ambulances are customized in some form; however, they share many common production, sales and component attributes such as similar manufacturing and engineering processes, raw materials (aluminum, lights, wire harnesses, paint and coatings, among others), and dealer-based distribution channels. The sales prices for our fire and emergency products can vary considerably given their highly customized nature, but generally range from $160,000 to $650,000 for pumper trucks, $475,000 to $1,200,000 for aerial fire trucks and $65,000 to $350,000 for ambulances. Demand is driven primarily by the replacement of in-service fleets, as well as by factors such as a growing aged population and a growing overall population (driving increased patient transportation and emergency response needs), new real estate developments, taller buildings (requiring more aerial vehicles), international airport growth (requiring Federal Aviation Administration-specified ARFF vehicles), and higher municipal funding levels. Local tax revenues are an important source of funding for fire and emergency response departments in addition to Federal grant money and locally raised funding. We estimate that ambulances have useful lives of five to seven years and generally operate on a 24/7 schedule, driving significant annual mileage which ultimately creates a replacement or remount sale as their underlying chassis wears out. We estimate that pumper trucks and aerial fire trucks have useful lives of 10-12 years and 20-30 years, respectively, and that these fire apparatus vehicles become obsolete before they wear out due to the fact that they generally operate at lower levels of annual miles driven and, outside of major metropolitan areas. We estimate that ambulances have useful lives of 5-7 years. We believe there is significant pent-up replacement demand for fire apparatus and ambulances as annual unit shipment levels since the 2008 recession have remained well below pre-recession averages. As set forth in the charts below, we estimate the cumulative pent-up replacement demand at approximately 15,000 units, which we believe is incremental to ongoing normalized levels of demand. However, we cannot be certain as to the timing and extent to which the pent-up replacement demand may be released, as it is inherently uncertain and generally outside our control.
6
Table of Contents
| Fire Apparatus | Ambulance | |
| Unit Sales | Unit Sales | |
|
|
| |
|
Source: Fire Apparatus Manufacturers’ Association, Management estimates |
Source: National Truck Equipment Association — Ambulance Manufacturers Division, Management estimates |
We believe that a growing aged population, longer life expectancy, urbanization and the increasing use of emergency vehicles for non-critical care transport are all positive trends for the ambulance market. Further, the Patient Protection and Affordable Care Act and the resulting creation of federal and state healthcare exchanges have resulted in broader healthcare insurance coverage nationally, allowing ambulance service providers to realize higher reimbursement rates and increased ambulance utilization levels, as ambulance service providers historically provided care and transport for a significant number of individuals who had limited or no insurance.
Commercial Markets
REV’s Commercial segment addresses a broad variety of products and end markets. The transit and shuttle bus market includes applications such as airport car rental and hotel/motel shuttles, paramedical transit vehicles for hospitals and nursing homes, tour and charter operations, daycare and student transportation, mobility vans for wheelchair users, and numerous other applications. According to industry sources, shipments of cutaway buses (those buses that are up to 35 feet in length) were approximately 15,000 units in 2015. We believe the commercial bus markets we serve will sustain positive long-term growth supported by growing levels of urbanization which will require increasing commercial bus usage, increased government transportation spending as shown in the chart below, an aging and growing U.S. population driving demand for shuttle buses and mobility vans, a necessary replacement cycle for public and private customers and the introduction of new bus products.
7
Table of Contents
The demand for school buses is driven by the need for student transportation primarily in the United States and Canada. Within this market, we believe important demand drivers are the increasing number of students, the replacement cycle of in-service vehicles, substitution by private contract companies as the provider of student transportation from school districts (thus requiring the purchase of new buses) and legislated replacements. Insurance providers and state legislatures are increasingly requiring replacement of non-conforming vans which often drives a substitution purchase of our Type A product because of its numerous legislated safety features and benefits versus traditional van products. There are more than 14,000 school districts in the United States responsible for operating approximately 500,000 school buses. Approximately 19% of the school buses sold in 2015 were Type A buses, which we produce, and the remainder were Type B and C buses which we do not currently produce. The following chart shows the shuttle bus unit sales and U.S. school bus unit sales during the time periods shown below.
| Shuttle Bus Unit Sales | U.S. School Bus Unit Sales | |
| (in thousands) | (in thousands) | |
|
|
| |
|
Source: Management estimates and School Bus Fleet, School Bus Sales Report (2015) | ||
Terminal truck demand is driven by replacement of in-service fleets, growth in trade and the increased use of intermodal freight services and warehouses. We anticipate ongoing growth in global trade will result in higher future intermodal freight traffic growth. Sweeper demand is also driven by replacement of in-service fleets by contractors and rental companies as well as growth in infrastructure and construction spending. Sweepers are used in various applications within the construction and road and highway infrastructure markets.
The sales prices for our bus and specialty vehicles can vary considerably, but generally range from $35,000 to $55,000 for Type A school buses, $40,000 to $190,000 for shuttle buses, $100,000 to $500,000 for transit buses and $25,000 to $165,000 for other specialty vehicles. We estimate that Type A school buses have useful lives of 8-10 years, that shuttle buses have useful lives of 5-10 years, that transit buses have useful lives of approximately 12 years and other specialty vehicles have useful lives of 5-7 years.
8
Table of Contents
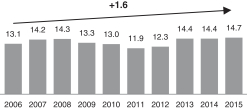
The following chart shows the estimated amount spent in 2011 by U.S. state and local governments and municipalities for transportation and the amount projected to be spent in 2016 and 2021, together with CAGRs calculated for the time periods shown below. The trends shown in these charts, however, are not a guarantee that similar growth in U.S. state and local transportation spending will continue.
U.S. State and Local Transportation Spending
(in billions)
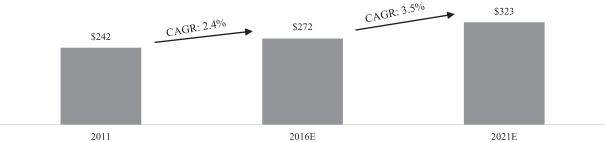
| Source: | USGovernmentspending.com |
Recreation Markets
The RV industry includes various types and configurations of both motorized and towable RVs of which we currently manufacture and sell Class A (diesel and gas) and Class C motorized RVs. Motorized RVs are self-contained units built on motor vehicle chassis with their own lighting, plumbing, heating, cooking, refrigeration, sewage holding and water storage facilities. Class A RVs are generally constructed on medium-duty chassis which are supplied complete with engine and drivetrain components by major motor vehicle manufacturers. We then design, fabricate and install the living area and driver’s compartment of these motorized RVs. Class C RVs are built on consumer truck or van chassis which include an engine, drivetrain and a finished cab section. We design, fabricate and install the living area to connect to the driver’s compartment and the cab section.
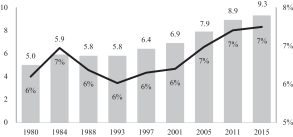
According to the RV Consumer Report from 2011, an industry report published by the University of Michigan, approximately nine million households in the United States own an RV. Motorized RVs are a consumer leisure purchase and therefore factors that drive demand include: consumer wealth (including the value of primary housing residences and the stock market level), consumer confidence, availability of financing and levels of disposable income. We believe end customers tend to be brand-loyal and repeat buyers who make decisions based on brand, quality, product configuration (primarily floorplan design, features and product styling), service availability and experience and price. Lifestyle trends are expected to support the growth of the RV market. We believe RVs are becoming more popular through increased interest in nature-based tourism and a growing preference for adventure travel among the growing urban populations. According to the Recreation Vehicle Industry Association, or RVIA, RV sales will continue to benefit from the aging “baby boomers” as more people enter the primary RV ownership age group of 55 to 70 years old. RVIA estimates that the number of consumers between the ages of 55 and 70 will total 56 million by 2020, 27% higher than in 2010. In addition to the growth tied to aging demographics, there are approximately 45 million active U.S. campers, many of which are outside the aforementioned demographic, representing an opportunity to expand the RV customer base.
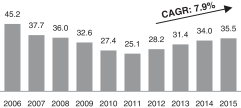
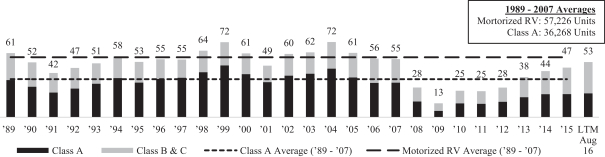
We believe the near-term RV industry outlook is positive. Year-over-year sales have increased for four years (2011 to 2015 and continuing through 2016) and participation rates continue to grow, which demonstrates a long-term trend toward RV ownership. In 2015, shipments of motorized RVs exceeded 47,000 units and approximately $3 billion of net sales, which is an increase of approximately 8% and 14%, respectively, compared to 2014 according to RVIA. In particular, approximately 21,900 Class A RVs were shipped in 2015, which represents a volume level that is approximately 40% below the pre-2008 recession historical average of shipped
9
Table of Contents
units from 1989 to 2007. Further, this volume level is approximately 53% below the industry’s peak volume in 2004 when approximately 46,000 Class A RV units were shipped. We believe industry volumes of Class A RVs, where REV’s market position is strongest, can recover to be in line with, or in excess of, pre-2008 recession historical averages.
The sales prices for our RVs can vary considerably, but generally range from $65,000 to $600,000. We estimate that RVs have useful lives of 8-15 years.
Motorized RV North American Market Size
Unit 000s
| Source: | RVIA |
| RV Participation |
| |||
| U.S. Households that Own RVs (in millions) |
|
RV Ownership % of U.S. Households |
| |
|
|
| |||
| Source: University of Michigan Study (The RV Consumer in 2011), RVdailyreport.com and U.S. Census Bureau |
| |||
Our Strengths
We believe we have the following competitive strengths:
Market Leader Across All Segments with a Large Installed Base—We believe we are a market leader in each of the fire and emergency, commercial and recreation vehicle markets. Approximately 72% of our net sales in fiscal year 2016 are in markets in which we believe we hold the first or second market share positions. We believe we are the largest manufacturer by unit volume of fire and emergency vehicles in the United States. We
10
Table of Contents
also believe our Commercial segment is the #1 producer of small- and medium-sized commercial buses as well as Type A school buses in the United States. We believe we are also a leading producer of transit buses, terminal trucks, mobility vans and street sweepers. Within our Recreation segment, we are one of the top producers of Class A diesel and gas motorized RVs with a 14% market share as of October 2016 and we believe we are the fastest growing manufacturer, growing our Class A RV market share by approximately 120 basis points since October 2015.
We estimate that the replacement value of our installed base of approximately 240,000 vehicles across our segments is approximately $32 billion, which we believe is a significant competitive advantage for both new unit sales and aftermarket parts and service sales, as brand awareness drives customer loyalty and fleet owners frequently seek to standardize their in-service fleets through repeat purchases of existing brands and product configurations. For example, one of the largest municipal fire departments in the United States has its fleet of ambulances standardized on REV branded product configuration and feature sets that satisfy this customer’s unique specifications and standards.
Broad Product Portfolio and Well-Recognized Brands—Our product portfolio is comprised of high-quality vehicles sold under 26 well-established principal vehicle brands that in many instances pioneered their market segments. For example, the first Type A yellow school bus was developed and sold by Collins Bus and the first Type I ambulance was developed and sold by Horton. We believe our product portfolio represents the broadest product offering in our markets and enables us to attract and retain top dealers who in many instances sell multiple REV brands in their territories. Our vehicle platforms are highly customizable and can meet nearly all product specifications demanded by our customers. In each of the markets that we serve, we believe our brands are among the most recognized in the industry, representing performance, quality, reliability, durability, technological leadership and superior customer service.
Selling into Attractive, Growing End Markets—Each of our segments serves end markets that are supported by what we believe to be favorable, long-term demographic, economic and secular trends. We believe that the growing aged population in the United States will increase demand for products across all of our segments, as older demographics are a key demand driver for products such as emergency vehicles, mobility vans and RVs. In the Fire & Emergency segment, increasing legislated changes requiring shorter replacement cycles will create a source of recurring demand for our products as in-service vehicles achieve mileage or age limits. Additionally, fire and emergency vehicle purchases fell below historical replacement rates following the 2008 recession, and we estimate the cumulative pent-up replacement demand is approximately 15,000 units, which represents 144% of the total unit sale volume in the United States and Canada in 2015. Our Commercial segment is poised to grow as a result of increasing urbanization within the United States which will require greater use of commercial buses. We believe demand for our school buses and our fire and emergency vehicles will grow with increasing state and local government spending. In addition, we believe our RV segment is poised for long-term growth driven by increased RV participation rates and market unit recoveries to historical average levels. Additionally, we believe the current U.S. camper base of 45 million people represents an opportunity to expand the RV customer base. Though our net sales are primarily derived from sales in the United States, similar positive market dynamics exist in other parts of the world providing an opportunity for future global growth in each of our segments. Only approximately 3% of our net sales in fiscal year 2016 were from sales to customers outside the United States.
Unique Scale and Business Model—As the only manufacturer of specialty vehicles across all three of our product segments and one of the largest participants in our markets by net sales, we enjoy a unique position relative to many of our competitors that we believe provides a competitive advantage and an enhanced growth profile. Many of our products contain similar purchased components, such as chassis, engines, lighting, wiring and other commodities which increase our leverage with and relevance to key suppliers. The operational processes across our different products are based on common elements, such as chassis preparation and
11
Table of Contents
production, body fabrication, product assembly and painting which allow us to develop best practices across our manufacturing system and implement those processes to drive operational efficiency. Our platform also allows us to leverage the combined engineering resources and product development resources from our broad network to bring new products, features and customer specific customization to market faster. Our business model makes us more desirable to our distribution channel partners as we are able to provide them with a full line of products to address their customers’ needs across a wider variety of price and product feature elements which gives them the opportunity to sell to a larger customer base and grow their sales and earnings. Additionally, our scale allows us to more efficiently amortize investments in service locations, parts sales infrastructure and information technology tools, among others.
Business Model Produces Highly Attractive Financial Characteristics—Our core production processes are primarily design, engineering, component integration and assembly in nature, creating a business model that produces attractive financial characteristics such as a highly variable cost structure, low levels of maintenance capital expenditures as a percentage of net sales, attractive levels of return on invested capital and strong revenue visibility. Based on our historical results of operations, we estimate that across all three of our segments, approximately 85% of our cost of goods sold are comprised of direct materials (including chassis) and direct labor which are variable in nature because these costs are associated with the specific production of our vehicles in each period and therefore are adjusted within a given period based on production levels in that period. Our remaining cost of goods sold are comprised of certain indirect labor and overhead costs which are fixed or semi-variable in nature because these costs are not linked to specific vehicle volumes in a given period and the time required to adjust these levels of spending is longer and management decisions regarding these costs are made based on longer term trends and forecasts. In addition, our selling, general and administrative expenses are primarily comprised of salaried payroll expenses which we structure efficiently around the level of demand in our markets. Over the last three completed fiscal years, our capital expenditures, as a percentage of net sales, has totaled less than 2%. As a result of low levels of capital investments required and efficient use of working capital (including the taking of deposits in certain of our markets), we believe that our business produces attractive returns on invested capital. Finally, our business carries a high-quality backlog which enables strong visibility into future net sales which ranges from two to nine months depending on the product and market. This visibility into future production needs and net sales enables us to more effectively plan and predict our business.
Experienced Consolidator with Proven Ability to Integrate Acquisitions and Drive Business Improvement—Throughout our history, we have complemented organic growth with strategic acquisitions, resulting in meaningful cost and commercial synergies and accelerated growth. Over the last ten years, we have completed nine acquisitions across our Fire & Emergency, Commercial and Recreation segments and continue to actively consider future potential acquisitions that complement and expand our current product portfolio. Our scale and plant network, strong end market positions, access to low cost capital and reputation as an active and effective strategic acquirer, position us favorably to continue to grow and enhance value through strategic acquisitions. The specialty vehicle market is highly fragmented with a large number of smaller producers within our existing markets as well as in new markets where we believe there would be synergies with REV. Our management team is highly experienced in integrating and improving the businesses we acquire, as evidenced by the improved financial performance of many of our acquisitions under our ownership. We believe all of these attributes position REV as an acquirer of choice in the specialty vehicles market.
12
Table of Contents
The Evolution of REV
Experienced Management Team with Proven Track Record—Our management team has an average of 28 years of industry experience, and a demonstrated track record of managing and growing publicly-traded industrial businesses. From fiscal year 2014 to fiscal year 2016, our management team has increased net income from $1.5 million to $30 million and Adjusted EBITDA from $62 million to $127 million, respectively, while expanding net income and Adjusted EBITDA margins approximately 148 basis points and 280 basis points, respectively, over the same period. In addition to accomplishments at REV, key members of our leadership team have also had success in other public industrial companies such as Bucyrus International, Inc. and The Manitowoc Company Inc., among others.
Our Growth Strategies
We plan to pursue several strategies to grow our earnings, expand our market share and further diversify our revenue stream, including:
Drive Margin Expansion Through Controllable Operational Initiatives—Our focus on driving operational improvement initiatives across the organization has enabled the increase of our net income and Adjusted EBITDA margins by 148 basis points and 280 basis points, respectively, from fiscal year 2014 to fiscal year 2016. Our initiatives have also resulted in improved safety results, as measured by the 36% decrease in our total recordable incident rate in fiscal year 2016 versus the prior fiscal year. We have achieved these improvements as a result of successfully implementing lean manufacturing initiatives across the organization, consolidating procurement functions, centralizing certain commercial decision making, reducing cost of quality, improving operational and safety performance and improving the total life-cycle value proposition for our customers. We believe we have established an enterprise-wide culture focused on continuous improvement, implementing measurable performance targets and sharing of best practices across the entire organization. Our Fire & Emergency segment had Adjusted EBITDA of $85 million in fiscal year 2016, which represents an Adjusted EBITDA margin of 11%, and we are targeting to further enhance Adjusted EBITDA margins in our Fire & Emergency, Commercial and Recreation segments over time. We continuously strive to identify and act on additional profitability improvement initiatives in many of our business units.
Develop Innovative New Customer Offerings—Due to the specific customer requirements for our products, we are continually enhancing and customizing our product offerings by introducing new features to enhance customer utility across a variety of price points. We seek to expand our addressable market by developing innovative products and services that extend our market leading combination of features, performance, quality
13
Table of Contents
and price to new customer bases, new markets or new segments of existing markets. We introduced eight new products in fiscal year 2016. We currently have 11 new products in development that are expected to be released in fiscal year 2017. We believe our process of constant innovation will not only help us increase net sales but also achieve lower costs and generate higher margins as our new products are frequently designed to leverage existing procurement relationships and for ease of manufacturability. In addition, there are multiple natural product adjacencies where REV has valuable brand equity, leading technology and cost positions where we believe we can generate strong demand for new products. For example, we introduced a new M1 Ambulance under the Frontline brand in fiscal year 2016 to address a lower specification segment of the ambulance market. We introduced the Sabre terminal truck in fiscal year 2015, which provided a new cab design and feature set while improving manufacturability for REV as a result of improved design features such as a weldless frame. By delivering innovative new customer offerings and customizations, we believe we can grow our net sales and market share.
Enhance Sales and Distribution Model—We believe that we are an attractive specialty vehicle OEM partner for dealers due to the breadth and quality of our product offerings, our brand recognition, our ability to produce products at varied price and feature points, as well as our aftermarket support capabilities. We intend to continue to leverage this strength to enhance our distribution network through selectively adding dealers in new territories, strengthening dealers in our existing network and expanding our direct sales and service capabilities in targeted markets. Our goal is to partner with the leading dealers in each market and to provide the necessary resources to ensure our partner dealers can best position REV products to compete successfully within their regions. We will also continue to optimize our go-to-market channel strategy (e.g., distribution or direct sale) based on the specific market dynamics and customer composition by region. We have historically focused on customers within the United States; however, we believe there is demand internationally for our products and we also seek to expand our distribution globally.
Accelerate Aftermarket Growth—Our end users’ large in-service fleets create strong demand for aftermarket parts in order to keep vehicles running and to support their residual value. We estimate the size of our installed base’s aftermarket parts market opportunity to be approximately $800 million annually, with significant importance placed on timely parts availability given the high cost of vehicle downtime, and our total aftermarket net sales in fiscal years 2016, 2015 and 2014 were $73.8 million, $68.9 million and $64.5 million, respectively. We have formalized an aftermarket strategy and are investing in building out capabilities to take advantage of this significant, high margin opportunity across our segments. We have created a dedicated management team to oversee our aftermarket business, and are centralizing our aftermarket parts and services business to broaden market coverage and ensure parts availability while reducing lead time. We are establishing a web-based technology platform to provide our customers with real time data on parts availability and pricing. We also made substantial investments in our services network infrastructure including over $27 million in fiscal years 2015 and 2016, in the aggregate, for the establishment of new RTCs across the United States, development of our parts system infrastructure and the expansion of capacity across several existing service locations. We believe we are well positioned to provide the most extensive and integrated service support network to our end customers and dealer partners.
Pursue Value Enhancing Acquisitions—We seek to pursue acquisitions which enhance our existing market positions, gain us entry to new products or markets and achieve our targeted financial returns. We have a long history of acquisitions with nine transactions completed over the past 10 years. Given our leadership positions within our markets and our existing facility, service and distribution network, we believe we have many inherent advantages in making acquisitions and have demonstrated the ability to successfully identify, execute and integrate acquisitions while realizing synergies. We believe that we have a clear acquisition strategy in place, targeting acquisitions with significant synergies to drive long-term value creation for shareholders. We will seek acquisitions of companies with strong brands and complementary products and distribution networks that align well with our aftermarket strategies and provide strong synergies with our existing business. In addition, we will
14
Table of Contents
target acquisitions which further diversify or broaden our product offerings and geographic reach, and simultaneously produce attractive financial returns.
Summary Risk Factors
An investment in shares of our common stock involves a high degree of risk. Any of the factors set forth under “Risk Factors” may limit our ability to successfully execute our strategy. You should carefully consider all of the information set forth in this prospectus and, in particular, you should evaluate the specific factors set forth under “Risk Factors” in deciding whether to invest in the shares of common stock. Among these important risks are the following:
| • | The impact of economic factors and adverse developments in economic conditions; |
| • | The seasonal nature of the markets in which we operate; |
| • | Disruptions in the supply of vehicle chassis or other critical materials; |
| • | Our ability to compete with other participants in the end markets we serve; |
| • | Our ability to successfully identify and integrate acquisitions; |
| • | Our business has certain working capital requirements, and a decline in operating results may have an adverse impact on our liquidity position; |
| • | The realization of contingent obligations; |
| • | Increases in the price of commodities or impact of currency value fluctuations on the cost or price of our products; |
| • | Our inability to successfully manage the implementation of a Company-wide enterprise resource planning system; |
| • | Our reliance on the performance of dealers; |
| • | The availability and terms of financing available to dealers and retail purchasers; |
| • | Our ability to retain and attract senior management and key employees; |
| • | Vehicle defects, delays in new model launches, recall campaigns, or increased warranty costs; |
| • | Cancellations, reductions or delays in customer orders; |
| • | The impact of federal, state and local regulations governing our products; |
| • | Unforeseen or recurring operational problems at any of our facilities; |
| • | Federal and local government spending levels; |
| • | Our operations and the industries in which we operate are subject to governmental laws and regulations, including relating to environmental, health and safety matters; |
| • | The influence of AIP over us after this offering, including its contractual right to nominate a majority of our directors and other contractual rights; |
| • | Changes to tax laws or exposure to additional tax liabilities; |
| • | Failure to maintain the strength and value of our brands; and |
| • | Our being a “controlled company” within the meaning of the NYSE rules and, as a result, qualifying for, and intending to rely on, exemptions from certain corporate governance requirements. |
15
Table of Contents
Our Equity Sponsor
Our primary equity holders are funds and an investment vehicle associated with AIP CF IV, LLC, which we collectively refer to as “American Industrial Partners,” “AIP” or “our Sponsor” and which indirectly own approximately 90% of our voting equity prior to giving effect to this offering. AIP is an operations and engineering-focused private equity firm headquartered in New York, New York, that has been investing in the industrial middle market for over 27 years. AIP invests when it believes it can significantly improve the underlying business’ performance through the implementation of an operating agenda to grow earnings and value—a “business building” investment strategy. As of October 29, 2016, AIP’s assets under management were $3.8 billion from three current funds on behalf of leading pension, endowment and financial institutions.
Corporate Information
REV Group, Inc. is a privately-owned corporation organized under the laws of the state of Delaware. Prior to November 1, 2015, the Company was known as Allied Specialty Vehicles, Inc. Our principal executive offices are located at 111 East Kilbourn Avenue, Suite 2600, Milwaukee, Wisconsin 53202. Our telephone number at that address is (414) 290-0190. Our website address is www.revgroup.com. The information on, or that can be accessed through, our website is not part of this prospectus, and you should not rely on any such information in making the decision whether to purchase shares of our common stock.
16
Table of Contents
THE OFFERING
| Common stock offered by us |
12,500,000 shares. |
| Common stock to be outstanding after this offering |
63,697,200 shares. |
| Option to purchase additional shares |
The underwriters have an option for a period of 30 days to purchase from the selling stockholders up to 1,875,000 additional shares of our common stock at the initial offering price less the underwriting discount. |
| Use of proceeds |
We estimate that the net proceeds from this offering of our common stock will be approximately $231.4 million at an assumed initial public offering price of $20.00 per share, the midpoint of the price range set forth on the cover of this prospectus, after deducting the underwriting discount and estimated offering expenses payable by us. We intend to use the net proceeds of this offering as follows: (i) first, to redeem in full our outstanding 8.500% senior secured notes due 2019 (the “Senior Secured Notes”) and (ii) second, to use the remaining proceeds, if any, to repay up to $39.3 million aggregate principal amount of loans under our senior secured asset-based lending revolving credit and guaranty agreement (the “ABL Facility”). |
| We will not receive any proceeds from the sale of shares by the selling stockholders if the underwriters exercise their option to purchase additional shares of common stock. See “Use of Proceeds.” |
| Dividend policy |
Following the completion of this offering and subject to legally available funds, we intend to pay a quarterly cash dividend at a rate initially equal to $0.05 per share on our common stock. We expect to pay a quarterly dividend on or about the last day of the first month following each fiscal quarter to shareholders of record on the last day of such fiscal quarter. We expect our first quarterly dividend to be payable in respect of our second quarter of fiscal year 2017 on May 31, 2017 to holders of record on April 30, 2017, based on the initial dividend rate specified above. Based on this initial dividend rate of $0.05 per share, and assuming we have 63,697,200 shares of our common stock outstanding, this would result in an aggregate annual cash dividend amount of approximately $12.7 million. However, the declaration, amount and payment of any future dividends will be at the sole discretion of our Board of Directors and we may reduce or discontinue entirely the payment of such dividends at any time. See “Dividend Policy.” |
| Risk factors |
You should read the “Risk Factors” section of this prospectus for a discussion of factors to consider carefully before deciding to invest in shares of our common stock. |
| NYSE symbol |
“REVG” |
17
Table of Contents
Unless we specifically state otherwise or the context otherwise requires, the number of shares of common stock to be outstanding after this offering is based on 51,197,200 shares of common stock outstanding as of October 29, 2016 and does not give effect to or reflect the issuance of:
| • | 3,746,560 shares of common stock issuable upon exercise of stock options outstanding as of October 29, 2016 at a weighted average exercise price of $5.69 per share, including 1,955,240 stock options that will vest upon completion of this offering as described under “Management’s Discussion and Analysis—Factors Affecting Our Performance—Stock Compensation Expense”; |
| • | 2,653,440 shares of common stock reserved for future issuance under our equity incentive plan as of October 29, 2016; |
| • | the redemption by us of stock options for 245,714 shares of our common stock from October 30, 2016 to the date of this prospectus; or |
| • | our issuance of 4,500 restricted stock units to independent directors in connection with this offering as described under “Executive Compensation—Description of Incentive Plans—Omnibus Incentive Plan” based on the midpoint of the price range set forth on the cover of this prospectus. |
Unless we specifically state otherwise or the context otherwise requires, this prospectus reflects or assumes the following:
| • | the 80-for-one stock split of our common stock pursuant to which each share of common stock held by a holder prior to this offering will be reclassified into 80 shares effective concurrently with the closing of this offering (with us paying cash in lieu of any fractional share) has been completed (except in our historical financial statements included in this prospectus); |
| • | the adoption of our amended and restated certificate of incorporation and our amended and restated bylaws, to be effective upon the closing of this offering; |
| • | the reclassification of our outstanding Class A common stock and Class B common stock into one class of common stock that we will complete concurrently with the completion of the offering as described under “Description of Capital Stock—Reclassification of Class A and Class B Common Stock”; |
| • | the reclassification of contingently redeemable common stock to stockholders’ equity resulting from the expiration of the employee shareholders’ put options upon the completion of this offering; and |
| • | no exercise by the underwriters of their option to purchase from the selling stockholders up to 1,875,000 additional shares of our common stock in this offering. |
18
Table of Contents
SUMMARY CONSOLIDATED FINANCIAL DATA
The following table summarizes our consolidated financial data. The summary consolidated financial data for fiscal years 2016, 2015 and 2014 are derived from our audited consolidated financial statements appearing elsewhere in this prospectus. The following table also includes summary unaudited pro forma financial information that gives effect to this offering and the use of proceeds from this offering to redeem in full all $180.0 million aggregate principal amount of our outstanding senior secured notes (the “Senior Secured Notes”) and pay the related call premium and repay approximately $39.3 million aggregate principal amount of loans under our ABL Facility, as if such transactions had occurred on October 29, 2016 with respect to our consolidated balance sheet data and as if such transactions had occurred on November 1, 2015 with respect to our consolidated statements of operations data.
Our historical results are not necessarily indicative of the results to be expected for future periods. Our historical share information gives effect to the reclassification that we will complete concurrently with the completion of the offering as described in “Description of Capital Stock—Reclassification of Class A and Class B Common Stock.” The summary historical consolidated data presented below should be read in conjunction with the sections entitled “Risk Factors,” “Selected Historical Consolidated Financial and Other Data,” “Management’s Discussion and Analysis of Financial Condition and Results of Operations” and the consolidated financial statements and the related notes and other financial data appearing elsewhere in this prospectus.
| Pro Forma Fiscal Year Ended October 29, 2016(1) |
Fiscal Year Ended | |||||||||||||||
| October 29, 2016 |
October 31, 2015 |
October 31, 2014 |
||||||||||||||
| (in thousands except per share data) | ||||||||||||||||
| Net sales |
$ | 1,925,999 | $ | 1,925,999 | $ | 1,735,081 | $ | 1,721,116 | ||||||||
| Cost of sales |
1,696,068 | 1,696,068 | 1,553,127 | 1,557,877 | ||||||||||||
|
|
|
|
|
|
|
|
|
|||||||||
| Gross profit |
229,931 | 229,931 | 181,954 | 163,239 | ||||||||||||
| Operating expenses: |
||||||||||||||||
| Selling, general and administrative |
139,771 | 139,771 | 102,309 | 111,820 | ||||||||||||
| Research and development costs |
4,815 | 4,815 | 5,106 | 8,275 | ||||||||||||
| Restructuring costs(2) |
3,521 | 3,521 | 3,869 | 3,376 | ||||||||||||
| Amortization of intangibles |
9,423 | 9,423 | 8,586 | 8,790 | ||||||||||||
|
|
|
|
|
|
|
|
|
|||||||||
| Total operating expenses |
157,530 | 157,530 | 119,870 | 132,261 | ||||||||||||
|
|
|
|
|
|
|
|
|
|||||||||
| Operating income |
72,401 | 72,401 | 62,084 | 30,978 | ||||||||||||
| Interest expense |
9,238 | 29,158 | 27,272 | 26,195 | ||||||||||||
|
|
|
|
|
|
|
|
|
|||||||||
| Income before provision for income taxes |
63,163 | 43,243 | 34,812 | 4,783 | ||||||||||||
| Provision for income taxes |
20,161 | 13,050 | 11,935 | 3,295 | ||||||||||||
|
|
|
|
|
|
|
|
|
|||||||||
| Net income |
$ | 43,002 | $ | 30,193 | $ | 22,877 | $ | 1,488 | ||||||||
|
|
|
|
|
|
|
|
|
|||||||||
| Basic Earnings Per Share: |
||||||||||||||||
| Weighted-average shares of common stock outstanding(3) |
||||||||||||||||
| Basic |
— | 51,587,164 | 52,761,380 | 52,789,250 | ||||||||||||
| Diluted |
— | 51,773,685 | 52,818,969 | 52,797,431 | ||||||||||||
| Earnings per share of common stock(3) |
||||||||||||||||
| Basic |
— | $ | 0.59 | $ | 0.43 | $ | 0.03 | |||||||||
| Diluted |
— | $ | 0.58 | $ | 0.43 | $ | 0.03 | |||||||||
| Pro Forma Earnings Per Share: |
||||||||||||||||
| Pro forma weighted-average shares of common stock outstanding(4) |
||||||||||||||||
| Basic |
64,087,164 | — | — | — | ||||||||||||
| Diluted |
64,273,685 | — | — | — | ||||||||||||
| Pro forma earnings per share of common stock(4) |
||||||||||||||||
| Basic |
0.67 | — | — | — | ||||||||||||
| Diluted |
0.67 | — | — | — | ||||||||||||
19
Table of Contents
| Fiscal Year Ended |
||||||||||||
| October 29, 2016 |
October 31, 2015 |
October 31, 2014 |
||||||||||
| ($ in thousands except percentages) | ||||||||||||
| Other Financial Data: |
||||||||||||
| Capital expenditures |
$ | 48,542 | $ | 15,430 | $ | 12,067 | ||||||
| Net income |
30,193 | 22,877 | 1,488 | |||||||||
| Net income margin(5) |
1.6 | % | 1.3 | % | 0.1 | % | ||||||
| Adjusted EBITDA(6) |
127,203 | 90,126 | 61,513 | |||||||||
| Adjusted EBITDA Margin(6) |
6.4 | % | 5.2 | % | 3.6 | % | ||||||
| Adjusted Net Income(6) |
55,049 | 34,017 | 14,457 | |||||||||
| Backlog(7) |
857,256 | 702,839 | 701,176 | |||||||||
| As of October 29, 2016 |
||||||||
| Pro Forma(1) |
Actual | |||||||
| (in thousands) | ||||||||
| Balance Sheet Data: |
||||||||
| Cash and cash equivalents |
$ | 10,821 | $ | 10,821 | ||||
| Property, plant and equipment, net |
|
146,422 |
|
146,422 | ||||
| Total assets |
889,019 | 889,019 | ||||||
| Total liabilities |
404,830 | 628,803 | ||||||
| Contingently redeemable common stock |
— | 22,293 | ||||||
| Total shareholders’ equity |
484,189 | 237,923 | ||||||
| (1) | Pro forma results give effect to the sale by us of 12,500,000 shares of common stock in this offering, assuming an initial public offering price of $20.00 per share, the midpoint of the price range set forth on the cover page of this prospectus, after deducting the underwriting discount and estimated offering expenses payable by us and the application of the net proceeds to be received by us from this offering as described in “Use of Proceeds,” as if such transactions had occurred on October 29, 2016 with respect to our consolidated balance sheet data and as if such transactions had occurred on November 1, 2015 with respect to our consolidated statements of operations data. The pro forma adjustments to our consolidated statements of operations data represent a decrease of $19.9 million of interest expense for fiscal year 2016. The pro forma interest expense adjustment represents $19.1 million of interest expense related to our Senior Secured Notes (defined below, based on a rate of 8.5% and including amortization of capitalized debt issuance costs and original issue discount) and $0.9 million of interest expense related to our ABL Facility (defined below, based on a weighted-average interest rate of 2.2%) for fiscal year 2016. Pro forma results also give effect to the reclassification of contingently redeemable common stock to stockholders’ equity resulting from the expiration of the employee shareholders’ put options upon the completion of this offering. Pro forma adjustments to our consolidated statements of operations data exclude: (i) a loss on debt extinguishment that we expect to incur after using the net proceeds from this offering which includes the write off of previously capitalized debt issuance costs of $3.5 million, the write off of the remaining unamortized original issue discount of $0.5 million and call premium of $7.7 million related to the Senior Secured Notes, (ii) additional non-recurring stock compensation expense of $3.9 million resulting from the vesting of 1,109,240 stock options which will vest upon the completion of this offering and (iii) additional non-recurring stock compensation expense of $15.2 million resulting from the re-valuation of outstanding liability option awards based on the midpoint price of $20.00 per share and the accelerated vesting of 846,000 of those liability option awards. Pro forma balance sheet data excludes the reclassification of the fair value of liability option awards to shareholders’ equity. |
| (2) | Restructuring costs incurred in fiscal years 2016 and 2015 are related to the Company’s restructuring of its management functions (including the move of its corporate headquarters from Orlando, Florida to Milwaukee, Wisconsin) and various product lines including, but not limited to, severance and discontinued product costs. Restructuring costs in fiscal year 2015 include $3.9 million of personnel costs including severance, stay bonuses, vacation and other benefits, and $0.8 million of inventory obsolescence reserves for discontinued product lines, which are recognized as a component of cost of sales in the Company’s consolidated statements of operations. In addition, during the fourth quarter of fiscal year 2016, the Company implemented a plan to relocate production of Goshen Coach buses from its Elkhart, Indiana facility to its facilities in Salina, Kansas and Imlay City, Michigan. In connection with this plan, the Company incurred $0.7 million of costs related to severance and relocation costs during fiscal year 2016. The Company expects to recognize additional restructuring costs related to the completion of this plan in fiscal year 2017. |
Restructuring costs incurred in fiscal year 2014 represent costs related to the Monaco RV (“MRV”) and SJC Industries, Inc. (“SJC”) acquisitions and include $3.4 million of personnel costs, including severance, bonuses, vacation and dealer and distributor reassignment and a charge of $4.1 million of costs related to the disposition of inventory for discontinued products through discounted sales and returning material to vendors at a discount. Restructuring costs related to inventory are recognized as a component of cost of sales in the Company’s consolidated statements of operations.
20
Table of Contents
| (3) | A reconciliation of the denominator used in the calculation of basic and diluted earnings per share of common stock is as follows: |
| Fiscal Year Ended | ||||||||||||
| October 29, 2016 |
October 31, 2015 |
October 31, 2014 |
||||||||||
| Basic weighted-average shares of common stock outstanding |
51,587,164 | 52,761,380 | 52,789,250 | |||||||||
| Dilutive stock options |
186,521 | 57,589 | 8,181 | |||||||||
|
|
|
|
|
|
|
|||||||
| Diluted weighted-average shares of common stock outstanding |
51,773,685 | 52,818,969 | 52,797,431 | |||||||||
|
|
|
|
|
|
|
|||||||
| (4) | The denominator used in the calculation of the pro forma basic and diluted earnings per share of common stock gives effect to the sale by us of 12,500,000 shares of common stock in this offering. A reconciliation of the denominator used in the calculation of the pro forma basic and diluted earnings per share of common stock is as follows: |
| Pro Forma Fiscal Year Ended October 29, 2016 |
||||
| Basic weighted-average shares of common stock outstanding |
51,587,164 | |||
| Shares of common stock sold in this offering |
12,500,000 | |||
|
|
|
|||
| Pro forma basic weighted-average shares of common stock outstanding |
64,087,164 | |||
| Dilutive stock options |
186,521 | |||
|
|
|
|||
| Pro forma diluted weighted-average shares of common stock outstanding |
64,273,685 | |||
|
|
|
|||
| (5) | Net income margin is defined as net income divided by total net sales. |
| (6) | In considering the financial performance of the business, management analyzes the primary financial performance measures of Adjusted EBITDA and Adjusted Net Income. Adjusted EBITDA is defined as net income for the relevant period before depreciation and amortization, interest expense and provision (benefit) for income taxes, as adjusted for certain items described below that we believe are not indicative of our ongoing operating performance. Adjusted Net Income is defined as net income, as adjusted for certain items described below that we believe are not indicative of our ongoing operating performance. Neither Adjusted EBITDA nor Adjusted Net Income is a measure defined by GAAP. The most directly comparable GAAP measure to EBITDA, Adjusted EBITDA and Adjusted Net Income is net income for the relevant period. |
Adjusted EBITDA Margin is defined as Adjusted EBITDA, without giving effect to the impact of the acquisition of KME as described in footnote (f) below, divided by total net sales.
We believe Adjusted EBITDA and Adjusted Net Income are useful to investors and are used by our management for measuring profitability because these measures exclude the impact of certain items which we believe have less bearing on our core operating performance because they are items that are not needed or available to the Company’s managers in the daily activities of their businesses. We believe that the core operations of our business are those which can be affected by the Company’s management in a particular period through their resource allocation decisions that affect the underlying performance of our specialty vehicle operations conducted during that period. We also believe that decisions utilizing Adjusted EBITDA and Adjusted Net Income allow for a more meaningful comparison of operating fundamentals between companies within our markets by eliminating the impact of capital structure and taxation differences between the companies. To determine Adjusted EBITDA, we further adjust net income for the following items: non-cash depreciation and amortization, stock-based compensation expense and non-cash purchase accounting. Stock-based compensation expense is excluded because it is an expense that is measured based upon external inputs such as the Company’s current share price and the movement of share price of peer companies, which cannot be impacted by the Company’s business managers. Stock-based compensation expense also reflects a cost which may obscure trends in our underlying vehicle businesses for a given period, due to the timing and nature of the equity awards.
We also adjust for exceptional items which are determined to be those that in management’s judgment need to be disclosed by virtue of their size, nature or incidence, which include non-cash items and items settled in cash. In determining whether an event or transaction is exceptional, management considers quantitative as well as qualitative factors such as the frequency or predictability of occurrence. This is consistent with the way that financial performance is measured by management and reported to our Board of Directors, assists in providing a meaningful analysis of our operating performance and used as a measurement in incentive compensation for management. Based on the foregoing factors, management considers the adjustments for loss on early extinguishment of debt, non-cash purchase accounting, bargain purchase gain and the impact of the KME acquisition to be exceptional items.
21
Table of Contents
Adjusted EBITDA and Adjusted Net Income have limitations as analytical tools. These are not presentations made in accordance with GAAP, nor are they measures of financial condition and they should not be considered as an alternative to net income or net loss for the period determined in accordance with GAAP. Adjusted EBITDA and Adjusted Net Income are not necessarily comparable to similarly titled measures used by other companies. As a result, you should not consider this performance measure in isolation from, or as a substitute analysis for, our results of operations as determined in accordance with GAAP. Moreover, such measures do not reflect:
| • | our cash expenditures, or future requirements for capital expenditures or contractual commitments; |
| • | changes in, or cash requirements for, our working capital needs; |
| • | the cash requirements necessary to service interest or principal payments on our debt and, in the case of Adjusted EBITDA, excluding interest expense; and |
| • | the cash requirements to pay our taxes and, in the case of Adjusted EBITDA, excluding income tax expense. |
The following table reconciles net income to Adjusted EBITDA for the periods presented:
| Fiscal Year Ended | ||||||||||||
| (in thousands) | October 29, 2016 |
October 31, 2015 |
October 31, 2014 |
|||||||||
| Net income |
$ | 30,193 | $ | 22,877 | $ | 1,488 | ||||||
| Depreciation and amortization |
24,593 | 19,084 | 18,901 | |||||||||
| Interest expense |
29,158 | 27,272 | 26,195 | |||||||||
| Provision for income taxes |
13,050 | 11,935 | 3,295 | |||||||||
|
|
|
|
|
|
|
|||||||
| EBITDA |
96,994 | 81,168 | 49,879 | |||||||||
| Transaction expenses(a) |
1,629 | — | 1,166 | |||||||||
| Sponsor expenses(b) |
219 | 1,069 | 2,093 | |||||||||
| Restructuring costs(c) |
3,521 | 4,652 | 7,516 | |||||||||
| Stock-based compensation expense(d) |
19,692 | 3,237 | 859 | |||||||||
| Non-cash purchase accounting(e) |
770 | — | — | |||||||||
| Impact of KME acquisition(f) |
4,378 | N/A | N/A | |||||||||
|
|
|
|
|
|
|
|||||||
| Adjusted EBITDA |
$ | 127,203 | $ | 90,126 | $ | 61,513 | ||||||
|
|
|
|
|
|
|
|||||||
| (a) | Reflects costs incurred in connection with business acquisitions. |
| (b) | Reflects the reimbursement of expenses to AIP, the Company’s primary equity holder. |
| (c) | Restructuring costs incurred in fiscal years 2016 and 2015 are related to the Company’s restructuring of its management functions (including the move of its corporate headquarters from Orlando, Florida to Milwaukee, Wisconsin) and various product lines including, but not limited to, severance and discontinued product costs. Restructuring costs in fiscal year 2015 include $3.9 million of personnel costs including severance, stay bonuses, vacation and other benefits, and $0.8 million of inventory obsolescence reserves for discontinued product lines, which are recognized as a component of cost of sales in the Company’s consolidated statements of operations. In addition, during the fourth quarter of fiscal year 2016, the Company implemented a plan to relocate production of Goshen Coach buses from its Elkhart, Indiana facility to its facilities in Salina, Kansas and Imlay City, Michigan. |
Restructuring costs incurred in fiscal year 2014 represent costs related to the MRV and SJC acquisitions and include $3.4 million of personnel costs, including severance, bonuses, vacation and dealer and distributor reassignment and a charge of $4.1 million of costs related to the disposition of inventory for discontinued products through discounted sales and returning material to vendors at a discount. Restructuring costs related to inventory are recognized as a component of cost of sales in the Company’s consolidated statements of operations.
The nature and amount of such restructuring costs vary significantly based on the number of completed acquisitions and the size and timing of related and other restructuring programs. By excluding the referenced expenses from the Company’s non-GAAP financial measures, management is able to further evaluate the Company’s ability to utilize existing assets and estimate their long-term value. Furthermore, management believes that the adjustment of these items are useful to investors by supplementing the GAAP information with an additional measure that can be used to assess the Company’s operating performance.
| (d) | Reflects expenses associated with stock-based compensation. For fiscal year 2016, stock-based compensation expense included $10.3 million for the accelerated vesting of stock options held by former employees, which were subsequently redeemed for cash. Approximately $6.5 million of stock-based compensation for fiscal year 2016 related to the non-cash remeasurement of outstanding liability awards to fair value. The remeasurement of the liability awards was required as a result of the Company becoming a public entity after the filing of this prospectus with the Securities and Exchange Commission (the “SEC”). The remaining stock-based compensation expense of $2.9 million for fiscal year 2016 was a non-cash charge for stock options vesting on their normal vesting |
22
Table of Contents
| schedule that were not repurchased by us as described above. Except for the additional non-cash stock compensation expense which will be recognized concurrently with the immediate vesting of stock options as a result of this offering (as described in “Management’s Discussion and Analysis of Financial Condition and Results of Operations—Factors Affecting Our Performance—Stock Compensation Expense”), we do not expect that such accelerated vesting, the remeasurement of outstanding liability awards and repurchase of outstanding stock options will be an ongoing cost following completion of this offering. For this reason, following the completion of this offering, we expect substantially all of our stock-based compensation expense to be a non-cash expense that follows a normal vesting schedule. |
| (e) | For fiscal year 2016, reflects the amortization of the difference between the book value and fair market value of certain acquired inventory which was sold. |
| (f) | Reflects management’s estimate of Adjusted EBITDA of KME for the period of time from the beginning of the Company’s fiscal year 2016 through the date of acquisition in April 2016. |
The following table reconciles net income to Adjusted Net Income for the periods presented:
| Fiscal Year Ended | ||||||||||||
| (in thousands) | October 29, 2016 |
October 31, 2015 |
October 31, 2014 |
|||||||||
| Net income |
$ | 30,193 | $ | 22,877 | $ | 1,488 | ||||||
| Amortization of intangibles |
9,423 | 8,586 | 8,790 | |||||||||
| Transaction expenses(a) |
1,629 | — | 1,166 | |||||||||
| Sponsor expenses(b) |
219 | 1,069 | 2,093 | |||||||||
| Restructuring costs(c) |
3,521 | 4,652 | 7,516 | |||||||||
| Stock-based compensation expense(d) |
19,692 | 3,237 | 859 | |||||||||
| Non-cash purchase accounting(e) |
770 | — | — | |||||||||
| Impact of KME acquisition(f) |
2,953 | N/A | N/A | |||||||||
| Income tax effect of adjustments(g) |
(13,351 | ) | (6,404 | ) | (7,455 | ) | ||||||
|
|
|
|
|
|
|
|||||||
| Adjusted Net Income |
$ | 55,049 | $ | 34,017 | $ | 14,457 | ||||||
|
|
|
|
|
|
|
|||||||
| (a) | Reflects costs incurred in connection with business acquisitions. |
| (b) | Reflects the reimbursement of expenses to AIP, the Company’s primary equity holder. |
| (c) | Restructuring costs incurred in fiscal years 2016 and 2015 are related to the Company’s restructuring of its management functions (including the move of its corporate headquarters from Orlando, Florida to Milwaukee, Wisconsin) and various product lines including, but not limited to, severance and discontinued product costs. Restructuring costs in fiscal year 2015 include $3.9 million of personnel costs including severance, stay bonuses, vacation and other benefits, and $0.8 million of inventory obsolescence reserves for discontinued product lines, which are recognized as a component of cost of sales in the Company’s consolidated statements of operations. In addition, during the fourth quarter of fiscal year 2016, the Company implemented a plan to relocate production of Goshen Coach buses from its Elkhart, Indiana facility to its facilities in Salina, Kansas and Imlay City, Michigan. |
Restructuring costs incurred in fiscal year 2014 represent costs related to the MRV and SJC acquisitions and include $3.4 million of personnel costs, including severance, bonuses, vacation and dealer and distributor reassignment and a charge of $4.1 million of costs related to the disposition of inventory for discontinued products through discounted sales and returning material to vendors at a discount. Restructuring costs related to inventory are recognized as a component of cost of sales in the Company’s consolidated statements of operations.
The nature and amount of such restructuring costs vary significantly based on the number of completed acquisitions and the size and timing of related and other restructuring programs. By excluding the referenced expenses from the Company’s non-GAAP financial measures, management is able to further evaluate the Company’s ability to utilize existing assets and estimate their long-term value. Furthermore, management believes that the adjustment of these items are useful to investors by supplementing the GAAP information with an additional measure that can be used to assess the Company’s operating performance.
| (d) | Reflects expenses associated with stock-based compensation. For fiscal year 2016, stock-based compensation expense included $10.3 million for the accelerated vesting of stock options held by former employees, which were subsequently redeemed for cash. Approximately $6.5 million of stock-based compensation for fiscal year 2016 related to the non-cash remeasurement of outstanding liability awards to fair value. The remeasurement of the liability awards was required as a result of the Company becoming a public entity after the filing of this prospectus with the SEC. The remaining stock-based compensation expense of $2.9 million for fiscal year 2016 was a non-cash charge for stock options vesting on their normal vesting schedule that were not repurchased by us as described above. Except for the additional non-cash stock compensation expense which will be recognized concurrently with the immediate vesting of stock options as a result of this offering (as described in “Management’s Discussion and Analysis of Financial Condition |
23
Table of Contents
| and Results of Operations—Factors Affecting Our Performance—Stock Compensation Expense”), we do not expect that such accelerated vesting, the remeasurement of outstanding liability awards and repurchase of outstanding stock options will be an ongoing cost following completion of this offering. For this reason, following the completion of this offering, we expect substantially all of our stock-based compensation expense to be a non-cash expense that follows a normal vesting schedule. |
| (e) | For fiscal year 2016, reflects the amortization of the difference between the book value and fair market value of certain acquired inventory which was sold. |
| (f) | Reflects management’s estimate of pre-tax income of KME for the period of time from the beginning of the Company’s fiscal year 2016 through the date of acquisition in April 2016, as offset by $0.4 million in additional interest expense assuming the acquisition had occurred on November 1, 2015. |
| (g) | Tax effect of adjustments using a 36.5% effective tax rate except for certain transaction expenses. |
| (7) | “Backlog” represents orders received from dealers or directly from end customers. Backlog does not include purchase options or verbal orders. |
24
Table of Contents
Investing in shares of our common stock involves a high degree of risk. You should carefully consider the risks and uncertainties described below together with all of the other information contained in this prospectus, including our consolidated financial statements and the related notes appearing elsewhere in this prospectus, before deciding to invest in shares of our common stock. If any of the following risks actually occurs, our business, prospects, operating results and financial condition could suffer materially, the trading price of shares of our common stock could decline and you could lose all or part of your investment. The risks and uncertainties described below are not the only ones we face. Additional risks and uncertainties not presently known to us or that we currently believe to be immaterial may also adversely affect our business.
Risks Relating to Our Business
Our business is affected by economic factors and adverse developments in economic conditions could have an adverse effect on the demand for our products and the results of our operations.
Our business is impacted by the U.S. economic environment, employment levels, consumer confidence, changes in interest rates and instability in securities markets around the world, among other factors. In particular, changes in the U.S. economic climate could result in reduced demand in key end markets.
Motorized recreational vehicle (“RV”) purchases are discretionary in nature and therefore sensitive to wholesale and retail financing, consumer confidence, unemployment levels, disposable income and changing levels of consumer home equity. These factors result in RVs being discretionary purchases. The 2008 recession caused consumers to reduce their discretionary spending, which negatively affected our sales volumes for RVs. Terminal truck sales volumes are also impacted by economic conditions and industrial output, as these factors impact our end-market customers for these products, which include shipping ports, trucking/distribution hubs and rail terminal operators. Although RV and terminal truck sales have increased in recent years, these markets are affected by U.S. and global general economic conditions, which create risks that future economic downturns will further reduce consumer demand and negatively impact our sales.
While less economically sensitive than the Recreation segment, our Fire & Emergency and Commercial segments are also impacted by the overall economic environment. Local tax revenues are an important source of funding for fire and emergency response departments. Reduced municipal tax revenues resulting from the 2008 recession led to a decline in these markets. As fire and emergency apparatus and school buses are typically a larger cost item for municipalities and their service life is very long, their purchase is more deferrable. This can result in cyclicality in certain of our end markets, which in turn may result in fluctuations in our sales and results of operations.
In addition, while we estimate that there is significant pent-up replacement demand in certain of our end markets, that estimate has not been independently verified and is based on certain assumptions that may not prove to be accurate. As a result, these estimates could differ materially from actual demand and, to the extent the increase in demand is attributable to pent-up replacement demand rather than overall economic growth, future sales may lag behind improvements in general economic conditions. Furthermore, we cannot be certain as to the timing and extent to which the pent-up replacement demand may be released, as it is inherently uncertain and generally outside our control.
A decrease in employment levels, consumer confidence or the availability of financing, other adverse economic events, or the failure of actual demand for our products to meet our estimates, could negatively affect the demand for our products. Any decline in overall customer demand in markets in which we operate could have a material adverse effect on our operating performance.
Some of the markets in which we compete are seasonal, which results in fluctuations in sales and results of operations.
We have experienced, and expect to continue to experience, significant variability in sales, production and net income as a result of seasonality in our Recreation segment. Since RVs are used primarily by vacationers and
25
Table of Contents
campers, demand in the RV industry generally declines during the fall and winter months, while sales and profits are generally highest during the spring and summer months. Dealer demand and buying patterns may impact the timing of shipments from one quarter to another. In addition, severe weather conditions in some geographic areas may delay the timing of shipments from one quarter to another. Consequently, the results for any annual or quarterly prior period may not be indicative of results for any future annual or quarterly period.
Certain of our other products, such as school buses, have also historically been, and are expected to continue to be, seasonal. This seasonality has an impact on the comparability of our quarterly results. Moreover, weak macroeconomic conditions can adversely affect demand for certain of our products and lead to an overall aging of product fleets beyond a typical replacement cycle. During economic downturns that would result in lower demand of our vehicles, we may find it necessary to reduce production line rates and employee headcount. An economic downturn may reduce, and in the past has reduced, demand in all of our segments, resulting in lower sales volumes, lower prices and decreased operating profits or losses. Additionally, our business is subject to seasonal and other fluctuations. In particular, we have historically experienced higher sales during the third quarter and fourth quarter versus the first quarter and second quarter during each fiscal year. This seasonality is caused primarily by school districts ordering more school buses prior to the beginning of a school year, the consumer buying habits for RVs, municipal spending and budget cycles, the impact of travel and construction in the summer months, as well as how certain seasonal months aggregate into our fiscal quarters which are different than calendar quarters. Our ability to meet customer delivery schedules is dependent on a number of factors including, but not limited to, access to components and raw materials, an adequate and capable workforce, assembling/engineering expertise for certain projects and sufficient manufacturing capacity. The availability of these factors may in some cases be subject to conditions outside of our control. A failure to deliver in accordance with our performance obligations may result in financial penalties under certain of our contracts and damage to existing customer relationships, damage to our reputation and a loss of future bidding opportunities, which could cause the loss of future business and could negatively impact our financial performance.
A disruption, termination or alteration of the supply of vehicle chassis or other critical components from third-party suppliers could materially adversely affect the sales of our products.
Our sales and our manufacturing processes depend on the supply of manufactured vehicle chassis and other critical components such as engines, transmissions and axles from major auto manufacturers and other original equipment manufacturers (“OEMs”), including Allison Transmission, Chrysler, Cummins, Ford, Freightliner, General Motors, Navistar and Volvo, among others. For the standardized, mass-produced chassis models, we convert the chassis for our customers under approved “authorized converter” agreements with the OEMs. We have tailored our products and processes to the specifications of these OEM agreements, and have built customer expectations and planning around these designs. We are therefore reliant on a consistent supply of chassis and the maintenance of our status as “approved converters” in order to maintain our sales. If these manufacturers experience production delays, we may receive a lower allocation of chassis than anticipated, or if the quality or design of their chassis changes, we could incur significant costs or disruptions to our business, which could have a material adverse effect on our net sales, financial condition, profitability and/or cash flows. We may also carry increased inventory to protect against these concerns, which may negatively impact our results of operations. Additionally, certain important components that we use in our vehicles, such as engines and transmissions, are produced by a limited number of qualified suppliers and any disruption in their supply of such components to us would have a negative impact on our business.
Volatility in the financial markets generally, and in the truck and automotive sectors in particular, could impact the financial viability of certain of our key third-party suppliers, or could cause them to exit certain business lines, or change the terms on which they are willing to provide products. During the 2008-2010 automotive industry crisis, many vehicle manufacturers, including Ford and General Motors, idled factories and reduced their output of vehicle chassis. A recurrence of that crisis or another similar development could lead to difficulties in meeting our customers’ demands and reduce our overall sales volume. Further, any changes in quality or design, capacity limitations, shortages of raw materials or other problems could result in shortages or
26
Table of Contents
delays in the supply of vehicle chassis or components to us. Our business, operating results and financial condition could suffer if our suppliers reduce output or introduce new chassis models that are unpopular with our customers or are incompatible with our current product designs or production process.
We face intense competition in our markets, which may harm our financial performance and growth prospects.
We operate in a highly competitive environment in each of the markets we serve and we face competition in each of our product segments from numerous competitors. We compete principally on the basis of client-specific customization, product quality and reliability, breadth of product offering, manufacturing capability and flexibility, technical capability, product innovation, customer service, after-sales support, delivery times and price. Certain of our competitors are smaller companies which may have lower operating costs and greater operational flexibility, and may have focus on regional markets where they have competitive advantages of proximity and relationships with local municipalities or other regional customers. Other of our competitors are large, well-established companies with capacity, financial and other resources that may be in excess of ours. Additionally, companies that are not currently competitors but that are involved in the specialty vehicle market (such as a supplier) or that operate in an adjacent market (such as a producer of mainstream cars and trucks) could choose to enter the specialty vehicle market.
Our profitability is sensitive to changes in the balance between supply and demand in the specialty vehicle market. Competitors having lower operating costs than we do will have a competitive advantage over us with respect to products that are particularly price-sensitive. New manufacturing facilities may be built or idle production lines may be activated. Additionally, imbalances in the regional supply and demand for our products could result in increased competition in the markets in which we compete.
As a result of the foregoing factors, we may lose customers or be forced to reduce prices, which could have a material adverse effect on our business, financial condition and operating results.
If we are unable to successfully identify and integrate acquisitions, our results of operations could be adversely affected.
Acquisitions have been and are likely to continue to be a significant component of our growth strategy. From time to time we seek to identify and complete acquisitions. Our historical acquisitions include MRV and certain assets of SJC in early 2013, the Thor Bus Acquisition in late 2013 and KME in April 2016. We may continue making strategic acquisitions in the future. We cannot assure you that our previous or future acquisitions will be successful or will generate the financial benefits that we expected we would achieve at the time of acquisition.
In addition, there can be no assurance that we will be able to locate suitable acquisition candidates in the future or acquire them on acceptable terms or, because of limitations imposed by the agreements governing our indebtedness or the availability of capital, that we will be able to finance future acquisitions. Acquisitions involve special risks, including, without limitation, the potential assumption of unanticipated liabilities and contingencies, difficulty in assimilating the operations and personnel of the acquired businesses, disruption of our existing business, dissipation of our limited management resources and impairment of relationships with employees and customers of the acquired business as a result of changes in ownership. While we believe that strategic acquisitions can improve our competitiveness and profitability, these activities could have a material adverse effect on our business, financial condition and operating results.
We may incur significant costs such as transaction fees, professional service fees and other costs related to future acquisitions. We may also incur integration costs following the completion of any such acquisitions as we integrate the acquired business with the rest of our Company. Although we expect that the realization of efficiencies related to the integration of any acquired businesses will offset the incremental transaction and acquisition-related costs over time, this net financial benefit may not be achieved in the near term, or at all.
27
Table of Contents
If we are required to write down goodwill or other intangible assets, our financial condition and operating results would be negatively affected.
We have a substantial amount of goodwill and other finite and indefinite-lived intangible assets on our balance sheet as a result of acquisitions we have completed. If we determine goodwill and other intangible assets are impaired, we will be required to write down all or a portion of these assets. Any write-downs would have a negative effect on our results of operations.
The method to compute the amount of impairment incorporates quantitative data and qualitative criteria including new information and highly subjective judgments that can dramatically change the determination of the valuation of an intangible asset in a very short period of time. These determinations are sensitive to minor changes in underlying assumptions as management’s assumptions change with more information becoming available. The timing and amount of realized losses reported in earnings could vary if management’s conclusions were different. Any resulting impairment loss could have a material adverse effect on our results of operations for any particular quarterly or annual period.
Our business has meaningful working capital requirements and a decline in access to financing or operating results may have an adverse impact on our liquidity position.
Our business has meaningful working capital requirements. We had $260 million of long-term debt outstanding as of October 29, 2016. Our ability to make required payments of principal and interest on our debt will depend on our future performance, which, to a certain extent, is subject to general economic, financial, competitive, political and other factors, some of which are beyond our control. Accordingly, conditions could arise that could limit our ability to generate sufficient cash flows or access borrowings to enable us to fund our liquidity needs, which could further limit our financial flexibility or impair our ability to obtain alternative financing sufficient to repay our debt at maturity.
Our access to debt financing at competitive risk-based interest rates is partly a function of our credit ratings. A downgrade to our credit ratings could increase our interest rates, could limit our access to public debt markets, could limit the institutions willing to provide us credit facilities, and could make any future credit facilities or credit facility amendments more costly and/or difficult to obtain.
We believe that our cash on hand, together with funds generated by our operations, proceeds from this offering and borrowings under our ABL Facility, will provide us with sufficient liquidity and capital resources to meet our working capital, capital expenditures and other operating needs for the foreseeable future. Significant assumptions underlie this belief however, including, among other things, assumptions relating to future sales volumes, the successful implementation of our business strategies, the continuing availability of trade credit from certain key suppliers and that there will be no material adverse developments in our competitive market position, business, liquidity or capital requirements. Any failure to achieve earnings expectations may have an adverse impact on our available liquidity. As a result, we cannot assure you that we will continue to have sufficient liquidity to meet our operating needs. In the event that we do not have sufficient liquidity, we may be required to seek additional capital, reduce or cut back our operating activities, capital expenditures or otherwise alter our business strategy. If we obtain additional capital by issuing equity, the interests of our existing stockholders will be diluted. If we incur additional debt, the agreements governing that debt may contain significant financial and other covenants that may materially restrict our operations. We cannot assure you that we could obtain refinancing or additional financing on favorable terms or at all.
We have meaningful contingent obligations, which could negatively impact our results of operations.
We have meaningful contingent liabilities with respect to certain items that, if realized, could have a material adverse effect on our business, financial condition and operating results. In particular, we obtain certain vehicle chassis from automobile manufacturers under converter pool agreements. Upon being put into production, we become obligated to pay the manufacturer for the chassis. Chassis are typically converted and
28
Table of Contents
delivered to customers within 90 to 120 days of receipt. If the chassis are not converted within this timeframe of delivery, we generally purchase the chassis and record it as inventory or we are obligated to begin paying an interest charge on this inventory until purchased. Additionally, we have entered into repurchase agreements with certain lending institutions and are party to multiple agreements whereby we guarantee indebtedness of others, including losses under loss pool agreements. While we do not expect to experience material losses under these agreements, we cannot provide any assurance that these contingent liabilities will not be realized. See Note 18 to our audited consolidated financial statements appearing elsewhere in this prospectus for additional discussion of these contingent liabilities.
Our ABL Facility contains, and agreements governing future indebtedness may contain, restrictive covenants that may impair our ability to access sufficient capital and operate our business.
Our ABL Facility contains various provisions that limit our ability to, among other things:
| • | incur additional indebtedness; |
| • | incur certain liens; |
| • | consolidate or merge with other parties; |
| • | alter the business conducted by us and our subsidiaries; |
| • | make investments, loans, advances, guarantees and acquisitions; |
| • | sell assets, including capital stock of our subsidiaries; |
| • | enter into certain sale and leaseback transactions; |
| • | pay dividends on capital stock or issue, redeem, repurchase or retire capital stock or certain other indebtedness; |
| • | engage in transactions with affiliates; and |
| • | enter into agreements restricting our subsidiaries’ ability to pay dividends. |
In addition, the restrictive covenants in our ABL Facility require us to maintain specified financial ratios and other business or financial conditions. See “Management’s Discussion and Analysis of Financial Condition and Results of Operations—Liquidity and Capital Resources—ABL Facility” and “Description of Certain Indebtedness.” Our ability to comply with those financial ratios or other covenants may be affected by events beyond our control, and our failure to comply with these ratios or other covenants could result in an event of default. These covenants may affect our ability to operate and finance our business as we deem appropriate. Our inability to meet obligations as they become due or to comply with various financial covenants contained in the instruments governing our current or future indebtedness could constitute an event of default under the instruments governing our indebtedness.
If there were an event of default under our ABL Facility or any future instruments governing our indebtedness, the holders of the affected indebtedness could declare all of the affected indebtedness immediately due and payable, which, in turn, could cause the acceleration of the maturity of all of our other indebtedness. We may not have sufficient funds available, or we may not have access to sufficient capital from other sources, to repay any accelerated debt. Even if we could obtain additional financing, the terms of the financing may not be favorable to us. In addition, substantially all of our assets are subject to liens securing our ABL Facility. If amounts outstanding under our ABL Facility were accelerated, our lenders could foreclose on these liens and we could lose substantially all of our assets. Any event of default under the instruments governing our indebtedness could have a material adverse effect on our business, financial condition and results of operations.
29
Table of Contents
Increases in the price of commodities or impact of currency value fluctuations on the cost or price of our products could impact our ability to sustain and grow earnings.
Our manufacturing processes consume significant amounts of raw materials, the costs of which are subject to worldwide supply and demand factors, as well as other factors beyond our control. Raw material price fluctuations may adversely affect our results. We purchase, directly and indirectly through component purchases, significant amounts of aluminum, steel, plastics and other resins, brass and fiberglass products as well as other commodity-sensitive raw materials annually. In particular, in past years, steel and aluminum prices have experienced volatility which has been unforeseen and unexpected.
Although we at times purchase steel, aluminum and other raw materials up to 24 months in advance in order to provide certainty regarding portions of our pricing and supply, for the majority of our raw material purchases we do not typically enter into any fixed-price contracts and may not be able to accurately anticipate future raw material prices for those inputs.
Although the amount of our sales and costs denominated in foreign currencies is not currently significant, we may increase our international operations in the future, which would increase our exposure to risks of doing business internationally, including fluctuations in foreign currencies, changes in the economic strength of the countries in which we do business, difficulties in enforcing contractual obligations and intellectual property rights, burdens of complying with a wide variety of international and U.S. export and import laws and social, political and economic instability. In particular, changes in currency values could also impact the level of foreign competition in our domestic market as international products become more or less costly due to the relationship of the U.S. Dollar to other currencies. Commodity pricing and currency exchange rates have fluctuated significantly over the recent years and may continue to do so in the future. Such fluctuations could have a material effect on our results of operations, financial position and cash flows and impact the comparability of our results between financial periods.
Our inability to successfully manage the implementation of a company-wide enterprise resource planning (“ERP”) system could adversely affect our operating results.
We are in the process of implementing a new Company-wide ERP system. This ERP system will replace many of our existing operating and financial systems, which is a major undertaking from a financial management and personnel perspective. Should the new ERP system not be implemented successfully throughout all our business units and within budget and on time, or if the system does not perform in a satisfactory manner, it could be disruptive and adversely affect our operations, including our potential ability to report accurate, timely and consistent financial results; our ability to purchase raw material from and pay our suppliers; and deliver products to customers on a timely basis and to collect our receivables from them. Furthermore, this new ERP system is intended to be implemented in all locations during fiscal year 2017. The implementation will also impact our parts and service business and our ability to perform warranty and thus if the implementation is not successful or on time, these operations will be negatively affected.
In addition, we have put teams together who are leading the implementation of the ERP system at all of our locations. To the extent that this team or key individuals are not retained through the implementation period, the success of our implementation could be compromised and the expected benefits would not be realized. If the new ERP system is not successfully implemented, it could negatively affect our future sales, profitability and financial condition.
Our business depends on the performance of dealers and disruptions within our dealer network could have a negative effect on our business.
We rely to a significant extent on our independent dealer networks to sell our products to end customers. We estimate that we distribute approximately 80% of our products through a system of independent, authorized dealers, many of whom sell products from competing manufacturers. Our business is therefore affected by our
30
Table of Contents
ability to establish new relationships and maintain relationships with existing dealers. The geographic coverage of our dealers and their individual business conditions can affect the ability of our dealers to sell our products to customers. In a number of markets, there is a lack of exclusivity with dealers, which may decrease our bargaining leverage. In addition, recent consolidation of dealers, as well as the growth of larger, multi-location dealers, may result in increased bargaining power on the part of dealers, which could have a material adverse effect on our business.
Our dealer agreements are typically for a multi-year term; however, the dealer can typically cancel the agreement for convenience without penalty upon 90 days’ notice. We can provide no assurance that we will be able to renew our dealer agreements on favorable terms, or at all, at their scheduled expiration dates. Some of our dealer agreements include guarantees, which could have a negative impact on the financial performance of our Company if we are required to fulfill them. In addition, laws in many of the states in which we operate make it difficult for us to terminate dealer agreements, which may make it difficult for us to optimize our dealer network. No dealer or customer represented more than 6% of our annual revenue for fiscal year 2016, but there may continue to be consolidation and changes in the dealership landscape over time. If we are unable to renew a contract with one or more of our significant dealers or re-negotiate an agreement under more advantageous terms, our sales and results of operations could be adversely affected.
Our business is affected by the availability and terms of financing to dealers and retail purchasers.
Our business is affected by the availability and terms of financing to dealers and retail purchasers. Many of our dealers finance their purchases of inventory with financing provided by lending institutions. A decrease in the availability of financing, more restrictive lending practices or an increase in the cost of such wholesale financing can prevent dealers from carrying adequate levels of inventory, which limits product offerings and could lead to reduced sales of our products.
A small number of financial institutions provide the majority of our dealers’ total financed vehicles outstanding in a floor plan financing program at any point in time. Substantial increases in interest rates and decreases in the general availability of credit have in the past had an adverse impact upon our business and results of operations and may do so again in the future. Further, a decrease in availability of consumer credit resulting from unfavorable economic conditions, or an increase in the cost of consumer credit, may cause consumers to reduce discretionary spending which could, in turn, reduce demand for our products and negatively affect our sales and profitability.
In addition, early in fiscal year 2016 we began assisting customers with arranging their financing with third parties for purchases of our products. Although we currently neither assume any balance sheet financing risk nor receive any direct economic benefit from these arrangements other than a minimal arrangement fee, we could be materially adversely affected in the future if third-party financiers were unable to provide this financing to our customers and our dealers were unable to obtain alternate financing, at least until our customers were able to find a replacement financing source. Third-party financiers face a number of business, economic and financial risks that could impair their access to capital and negatively affect their ability to provide financing solutions for our dealers and customers. Because third-party financiers serve as an additional source of financing options for dealers and customers, an impairment of their ability to provide such financial services could negatively affect our future sales and therefore our profitability and financial condition.
Our ability to execute our strategy is dependent upon our ability to attract, train and retain qualified personnel including our ability to retain and attract senior management and key employees.
Our continued success depends, in part, on our ability to identify, attract, motivate, train and retain qualified personnel in key functions and geographic areas, including the members of our senior management team. In particular, we are dependent on our ability to identify, attract, motivate, train and retain qualified engineers and skilled labor with the requisite education, background and industry experience to assist in the development, enhancement, introduction and manufacture of our products and technology solutions.
31
Table of Contents
Failure to attract, train and retain qualified personnel, whether as a result of an insufficient number of qualified local residents or the allocation of inadequate resources to training, integration and retention, could impair our ability to execute our business strategy and could have an adverse effect on our business prospects.
Our success also depends to a large extent upon our ability to attract and retain key executives. These employees have extensive experience in our markets and are familiar with our business, systems and processes. The loss of the services of one or more of these key employees could have an adverse effect, at least in the short to medium term, on significant aspects of our business, including the ability to manage our business effectively and the successful execution of our strategies. If certain of these employees decide to leave us, we could incur disruptions to the completion of certain initiatives and we could incur significant costs in hiring, training, developing and retaining their replacements.
We may discover defects in our vehicles potentially resulting in delaying new model launches, recall campaigns or increased warranty costs.
Meeting or exceeding many government-mandated safety standards is costly and often technologically challenging, especially where one or more government-mandated standards may conflict. Government safety standards require manufacturers to remedy defects related to motor vehicle safety through safety recall campaigns, and a manufacturer is obligated to recall vehicles if it determines that they do not comply with relevant safety standards. Should we or government safety regulators determine that a safety or other defect or noncompliance exists with respect to certain of our vehicles, there could be a delay in the launch of a new model, recalls of existing models or a significant increase in warranty claims, the costs of which could be substantial.
Additionally, the vehicles we manufacture for sale are subject to strict contractually established specifications using complex manufacturing processes. If we fail to meet the contractual requirements for a vehicle or a part, we may be subject to warranty costs to repair or replace the part itself and additional costs related to the investigation and inspection of non-complying parts. These potential warranty and repair and replacement costs are generally not covered by our insurance. We establish warranty reserves that represent our estimate of the costs we expect to incur to fulfill our warranty obligations. We base our estimate for warranty reserves on our historical experience and other related assumptions. If actual results materially differ from these estimates, our results of operations could be materially affected.
In addition, we may not be able to enforce warranties and extended warranties received or purchased from our suppliers if such suppliers refuse to honor such warranties or go out of business. Also, a customer may choose to pursue remedies directly under its contract with us over enforcing such supplier warranties. In such a case, we may not be able to recover our losses from the supplier.
Cancellations, reductions or delays in customer orders, customer breaches of purchase agreements, or reduction in expected backlog may adversely affect our results of operations.
We provide products to our customers for which we are customarily not paid in advance. We rely on the creditworthiness of our customers to collect on our receivables from them in a timely manner after we have billed for products previously provided. While we generally provide products pursuant to a written contract which determines the terms and conditions of payment to us by our customers, occasionally customers may dispute an invoice and delay, contest or not pay our receivable. Further, in connection with dealers’ wholesale floor-plan vehicle financing programs, we enter into repurchase agreements with certain lending institutions, customary in the industries in which we operate, which may require us to repurchase previously sold vehicles. Although our exposure under these agreements is limited by the resale value of the inventory we may repurchase, we may receive less than anticipated on such resale and would collect payment on such resale later than originally expected. Our failure to collect our receivables or to resell and collect on repurchased vehicles on a timely basis could adversely affect our cash flows and results of operations and, in certain cases, could cause us to fail to comply with the financial covenants under our ABL Facility or other outstanding debt.
32
Table of Contents
We typically have backlog due to the nature of our production and sales process, and our financial results are affected if any backlog is deferred or canceled. Backlog represents the amount of sales that we expect to derive from signed contracts, including oral contracts that have been subsequently memorialized in writing. When a binding sale contract has been signed with a customer, the purchase price of the vehicle is included in backlog until it is completed, shipped and the revenue is recognized. When we sign a contract giving a potential purchaser an option to purchase a vehicle which only becomes binding on a non-refundable payment or a subsequent firm purchase order, we do not include the purchase price of the vehicle in backlog until the non-refundable payment has been made or the subsequent purchase order is formalized and the contract is a binding purchase contract. A customer may default on a purchase contract that has become binding, and we may not be able to convert sales contract backlog into sales. As a result, our estimates of backlog for some of our contracts could be affected by variables beyond our control and may not be entirely realized, if at all. In addition, given the nature of our customers and our markets, there is a risk that some amount of our backlog may not be fully realized in the future. Failure to realize sales from our existing or future backlog would negatively impact our financial results.
In addition, as a result of firm purchase orders from our customers, we enter into agreements to produce and sell vehicles at a specified price with certain adjustments for changes and options based upon our estimation of the cost to produce and the timing of delivery. Due to the nature of these product cost estimates and the fluctuations in input costs and availability, we may underestimate the costs of production and therefore overestimate the profitability in our backlog. As a result, the actual profitability on those sales in the future may differ materially from our initial estimates when we recorded the firm purchase order in backlog.
Our business is subject to numerous laws and regulations.
We are subject to numerous federal, state and local regulations governing the manufacture and sale of our products, including the provisions of the National Traffic and Motor Vehicle Safety Act (“NTMVSA”) and the safety standards for vehicles and components which have been promulgated under the NTMVSA by the Department of Transportation. The NTMVSA authorizes the National Highway Traffic Safety Administration to require a manufacturer to recall and repair vehicles which contain certain hazards or defects. Sales into foreign countries may be subject to similar regulations. School buses are also subject to heightened safety standards in many jurisdictions. Any recalls of our vehicles, voluntary or involuntary, could have a material adverse effect on our reputation and our business and operating results.
In addition, we face an inherent risk of exposure to product liability claims if the use of our products results, or is alleged to result, in personal injury and/or property damage. If we manufacture, or are alleged to have manufactured, a defective product or if component failures result in damages, we may experience material product liability losses in the future. In addition, we may incur significant costs to defend product liability claims.
We are also subject to potential recalls of our products to cure manufacturing defects or in the event of a failure to comply with customers’ order specifications or applicable regulatory standards, and may have to conduct recalls of our products due to defects in components or parts manufactured by suppliers which we purchase and incorporate into our products. We may also be required to remedy or retrofit vehicles in the event that an order is not built to a customer’s specifications or where a design error has been made. The cost and impact to our reputation of significant retrofit and remediation events or product recalls could have a material adverse effect on our business and operating results.
Lastly, we are subject to federal and numerous state consumer protection and unfair trade practice laws and regulations relating to the sale, transportation and marketing of motor vehicles, including so-called “lemon laws.” In addition, certain laws and regulations affect other areas of our operations, including, labor, advertising, consumer protection, real estate, promotions, quality of services, intellectual property, tax, import and export duties, tariffs, anti-corruption and anti-competitive conduct. Compliance with these laws and others may be onerous and costly, at times, and may vary from jurisdiction to jurisdiction which further complicates compliance
33
Table of Contents
efforts. Violations of these laws and regulations could lead to significant penalties, including restraints on our export or import privileges, monetary fines, criminal proceedings and regulatory or other actions that could materially adversely affect our results of operations. We have instituted various and comprehensive policies and procedures designed to ensure compliance. However, we cannot assure you that employees, contractors, vendors or our agents will not violate such laws and regulations or our policies and procedures.
Unforeseen or recurring operational problems at any of our facilities, or a catastrophic loss of one of our key manufacturing facilities, may cause significant lost production and adversely affect our results of operations.
Our manufacturing process could be affected by operational problems that could impair our production capability. Many of our 15 manufacturing facilities contain high cost and sophisticated machines that are used in our manufacturing process. Disruptions or shut downs at any of our facilities could be caused by:
| • | maintenance outages to conduct maintenance activities that cannot be performed safely during operations; |
| • | prolonged power failures or reductions; |
| • | breakdown, failure or substandard performance of any of our machines or other equipment; |
| • | noncompliance with, and liabilities related to, environmental requirements or permits; |
| • | disruptions in the transportation infrastructure, including railroad tracks, bridges, tunnels or roads; |
| • | fires, floods, earthquakes, tornadoes, hurricanes, microbursts or other catastrophic disasters; national emergencies, political unrest, war or terrorist activities; or |
| • | other operational problems. |
If some of our facilities are shut down, they may experience prolonged startup periods, regardless of the reason for the shutdown. Those startup periods could range from several days to several weeks or longer, depending on the reason for the shutdown and other factors. Any prolonged disruption in operations at any of our facilities could cause a significant loss of production and adversely affect our results of operations and negatively impact our customers and dealers. Our production of RVs is centralized in our Decatur, Indiana facility. Any disruptions to this facility would significantly impact our ability to produce these vehicles. Further, a catastrophic event could result in the loss of the use of all or a portion of one of our manufacturing facilities. Although we carry property and business interruption insurance, our coverage may not be adequate to compensate us for all losses that may occur. Any of these events individually or in the aggregate could have a material adverse effect on our business, financial condition and operating results.
Federal and local government spending and priorities may change in a manner that materially and adversely affects our future sales and limits our growth prospects.
Our business depends upon continued federal and local government expenditures on certain of our Commercial and Fire & Emergency products. These expenditures have not remained constant over time. Current government spending levels on programs that we support may not be sustainable as a result of changes in government leadership, policies or priorities. A significant portion of our sales are subject to risks specific to doing business with the U.S. government and municipalities, including, but not limited to:
| • | budgetary constraints or fluctuations affecting government spending generally, or specific departments or agencies in particular, and changes in fiscal policies or a reduction of available funding; |
| • | changes in government programs or requirements; |
| • | realignment of funds to government priorities that we do not serve; |
34
Table of Contents
| • | government shutdowns (such as those which occurred in 1995-1996 and in 2013) and other potential delays in government appropriations processes; |
| • | delays in the payment of our invoices by government authorities; |
| • | adoption of new laws or regulations and our ability to meet specified performance thresholds; and |
| • | general economic conditions. |
These or other factors could cause government agencies and departments to reduce their purchases under contracts, exercise their right to terminate contracts, or not exercise options to renew contracts, any of which could cause us to lose sales. A significant decline in overall government spending or a shift in expenditures away from agencies or programs that we support could cause a material decline in our sales and harm our financial results.
Fuel shortages, or high prices for fuel, could have a negative effect on sales of our products.
Gasoline or diesel fuel is required for the operation of most of our vehicles and we cannot assure you that the supply of these petroleum products will continue uninterrupted or that the price of or tax on these petroleum products will not significantly increase. High fuel costs generally drive greater demand for better fuel economy and substantial increases in the price of fuel have had a material adverse effect on the specialty vehicle industry as a whole in the past and could have a material adverse effect on our business in the future. Fluctuations in fuel prices have also historically negatively impacted consumer confidence and increased customer preferences for alternative fuel vehicles, only some of which we produce.
We are exposed to, and may be adversely affected by, interruptions to our computer and information technology systems and sophisticated cyber-attacks.
We rely on our information technology systems and networks in connection with many of our business activities. Some of these networks and systems are managed by third-party service providers and are not under our direct control. Our operations routinely involve receiving, storing, processing and transmitting sensitive information pertaining to our business, customers, dealers, suppliers, employees and other sensitive matters (including wire transfer instructions). As with most companies, we have experienced cyber-attacks, attempts to breach our systems and other similar incidents, none of which have been material. Any future cyber incidents could, however, materially disrupt operational systems; result in loss of trade secrets or other proprietary or competitively sensitive information or money; compromise personally identifiable information regarding customers or employees; and jeopardize the security of our facilities. A cyber incident could be caused by malicious outsiders using sophisticated methods to circumvent firewalls, encryption and other security defenses. Because techniques used to obtain unauthorized access or to sabotage systems change frequently and generally are not recognized until they are launched against a target, we may be unable to anticipate these techniques or to implement adequate preventative measures. Information technology security threats, including security breaches, computer malware and other cyber-attacks are increasing in both frequency and sophistication and could create financial liability, subject us to legal or regulatory sanctions or damage our reputation with customers, dealers, suppliers and other stakeholders. We continuously seek to maintain a robust program of information security and controls, but the impact of a material information technology event could have a material adverse effect on our competitive position, reputation, results of operations, financial condition and cash flows.
Our operations and the industries in which we operate are subject to environmental, health and safety laws and regulations, and we may face significant costs or liabilities associated with environmental, health and safety matters.
We are subject to a variety of federal, state, local and foreign environmental, health and safety laws and regulations concerning, among other things, water discharges, air emissions, noise pollution, the generation,
35
Table of Contents
storage, handling, use, release, disposal and transportation of hazardous materials and wastes, environmental cleanup, the health and safety of our employees and the fuel economy and emissions of the vehicles we manufacture. Environmental, health and safety laws and regulations continue to evolve, and we may become subject to increasingly stringent environmental standards in the future, particularly related to air quality and water quality and the emission of greenhouse gas and other pollutants from the vehicles we manufacture, which could require us to make changes to our operations or incur significant costs relating to compliance. We are also required to obtain and maintain environmental, health and safety permits and approvals for our facilities and operations. Our failure to comply with such laws, regulations, permits and approvals could subject us to increased employee healthcare and workers’ compensation costs, liabilities, fines and other penalties or compliance costs, and could have a material adverse effect on our business, financial condition and operating results.
Environmental remediation laws such as the Comprehensive Environmental Response, Compensation and Liability Act (“CERCLA”) and state analogues impose liability, without regard to fault or to the legality of a party’s conduct, on certain categories of persons (known as “potentially responsible parties” or “PRPs”) who are considered to have contributed to the release of “hazardous substances” into the environment. Although we are not currently incurring material liabilities pursuant to CERCLA or state analogues, in the future we may incur such material liabilities with regard to our (or our predecessors’) current or former facilities, adjacent or nearby third-party facilities, or off-site disposal locations. In particular, in 2012 we received a request from the United States EPA for information regarding the San Fernando Valley Area 2 Superfund Site (the “San Fernando Site”). The EPA has questioned whether a prior owner and operator of a facility located within the boundary of the San Fernando Site (which is regional in scale and encompasses large portions of the Los Angeles area) is a predecessor to our Company, and whether the operations of the predecessor entity may have caused releases of certain hazardous substances to soil or groundwater. At this stage, the EPA has not asserted any claims against us and has not notified us that we are a PRP at the San Fernando Site. Our ability to collect on insurance policies or remediation costs or damages in connection with any claims relating to the San Fernando Site is unclear at this time. Although we intend to vigorously defend against any such claims, in the event we are found to be a PRP at the San Fernando Site or other sites, the remediation costs and any potential damages (including Natural Resource Damage claims) could have a material adverse effect on our business, financial condition and operating results. See “Business—Environmental, Health and Safety Laws and Regulations.”
Certain of these laws and regulations impose a variety environmental requirements, including emissions and performance standards, on the vehicles we manufacture. These laws and regulations govern vehicle fuel efficiency, emissions (including greenhouse gas emissions), noise and safety, and are expected to continue to add to the cost of our products and increase the engineering and product development programs of our business. For example, the U.S. Environmental Protection Agency (“EPA”) began to enforce limits on diesel exhaust emissions from nonroad diesel engines in 1996 and stationary diesel-engine generator sets in 2006. Implemented in a series of steps called Tier levels, these regulations, over time, have introduced successively more stringent limitations on nitrogen oxides (NOx), carbon monoxide (CO), particulate matter (PM) and non-methane hydrocarbons (NMHC). Currently, “Tier 4” regulations promulgated under the Clean Air Act imposed increasingly stringent motor vehicle emissions standards on our diesel exhaust emissions beginning with the 2011 model year. The EPA’s Transition Program for Equipment Manufacturers (“TPEM”) allows a transitional allotment of Tier 3 engines that are exempt from the more stringent Tier 4 regulations through 2017. Specifically, the TPEM program allows manufacturers to delay installing a certain amount of Tier 4-compliant engines as long as manufacturers comply with certain notice, recordkeeping and annual reporting requirements. More stringent emissions standards have been issued by California and certain other states as well. In addition, in August 2011, the EPA and the National Highway Traffic Safety Administration (“NHTSA”) issued rules on GHG emissions and fuel economy for medium and heavy duty vehicles and engines. The emissions standards establish required minimum fuel economy and GHG emissions levels for both engines and vehicles primarily through the increased use of existing technology. The rules, which apply to our engines and vehicles, initially required EPA certification for vehicles and engines to GHG emissions standards in calendar year 2014 and will be fully implemented in model year 2017. In August 2016, the EPA and the National Highway Traffic Safety
36
Table of Contents
Administration (“NHTSA”) finalized a second phase of GHG emissions reductions to be implemented over time beginning in model year 2021 through model year 2027. These standards, as well as other federal and state emissions standards applicable to the vehicles we manufacture, have and will increase costs of development for engines and vehicles and administrative costs arising from implementation of the standards. These regulatory proposals under consideration or those that are proposed in the future may set standards that are difficult to achieve or adversely affect our results of operations due to increased research, development, and warranty costs. See “Business—Environmental, Health and Safety Laws and Regulations.”
We are subject to litigation in the ordinary course of business, and uninsured judgments or a rise in insurance premiums may adversely impact our results of operations.
In the ordinary course of business, we are subject to various claims and litigation. Any such claims, whether with or without merit, could be time consuming and expensive to defend and could divert management’s attention and resources. Some of our businesses have in the past and may in the future face claims and litigation regarding accidents involving their products, including accidents involving passenger injuries and deaths, and the increasing amount of our vehicles on the road may increase our exposure to such matters. In accordance with customary practice, we maintain insurance against some, but not all, of these potential claims. We may elect not to obtain insurance if we believe that the cost of available insurance is excessive relative to the risks presented. The levels of insurance we maintain may not be adequate to fully cover any and all losses or liabilities. Further, we may not be able to maintain insurance at commercially acceptable premium levels or at all.
For product liability claims, we have a self-insured retention (“SIR”) for product liability matters ranging from $0.5 million to $1.0 million depending on the nature of the occurrence. Amounts above the SIR, up to a certain dollar amount, are covered by our excess insurance policy. Currently, we maintain excess liability insurance aggregating $100.0 million with outside insurance carriers to minimize our risks related to catastrophic claims in excess of our self-insured positions for product liability and personal injury matters. Any material change in the aforementioned factors could have an adverse impact on our operating results. Any increase in the frequency and size of these claims, as compared to our experience in prior years, may cause the premium that we are required to pay for insurance to increase significantly and may negatively impact future SIR levels. It may also increase the amounts we pay in punitive damages, not all of which are covered by our self-insurance.
If any significant accident, judgment, claim or other event is not fully insured or indemnified against, it could have a material adverse impact on our business, financial condition and results of operations. We cannot assure that the outcome of all current or future litigation will not have a material adverse impact on our business and results of operations.
Intellectual property risks may adversely affect our business and may dilute our competitive advantage.
Our brands are important assets of our business, and we rely on proprietary intellectual property, including numerous registered trademarks, as well as licensed intellectual property for the manufacture and competitiveness of our products. We monitor and protect against activities that might infringe, dilute or otherwise harm our patents, trademarks and other intellectual property and rely on the enforceability of the patent, trademark and other laws of the United States and other countries. However, we may be unable to prevent third parties from using our intellectual property without our authorization. To the extent we cannot protect our intellectual property, unauthorized use and misuse of our intellectual property could cause significant damage to our brand name and reputation, interfere with our ability to effectively represent our Company to our customers, contractors, suppliers and/or licensees and increase litigation costs, which could harm our competitive position and have a material adverse effect on our business, financial condition and results of operations.
37
Table of Contents
We may be exposed to liabilities under applicable anti-corruption laws and export controls and economic sanctions laws and any determination that we violated these laws could have a material adverse effect on our business.
We are subject to various anti-corruption laws that prohibit improper payments or offers of payments to foreign governments and their officials for the purpose of obtaining or retaining business. We have business in countries and regions which are less developed and are generally recognized as having potentially more corrupt business environments. Our activities in these countries create the risk of unauthorized payments or offers of payments by one of our employees or agents that could be in violation of various anti-corruption laws including the Foreign Corrupt Practices Act (“FCPA”) and the U.K. Bribery Act. We have implemented safeguards and policies to discourage these practices by our employees and agents.
However, our existing safeguards and any future improvements may prove to be less than effective and our employees or agents may engage in conduct for which we might be held responsible. If employees violate our policies or we fail to maintain adequate record-keeping and internal accounting practices to accurately record our transactions, we may be subject to regulatory sanctions. In addition, we are subject to export controls and economic sanctions laws and embargoes imposed by the U.S. government. Changes in export control or trade sanctions laws may restrict our business practices, and may result in modifications to compliance programs. Violations of the FCPA, U.K. Bribery Act, other anti-corruption laws, export controls or economic sanctions laws may result in severe criminal or civil sanctions and penalties, and we may be subject to other liabilities which could have a material adverse effect on our business, results of operations and financial condition.
Our expansion plans in markets outside of the United States could entail significant risks.
Our strategies potentially include establishing a greater presence in markets outside of the United States. In addition, we are growing our use of component suppliers in these foreign markets. As we progress with this, these strategies may involve a significant investment of capital and other resources and entail various risks. These include risks attendant to obtaining necessary governmental approvals, identifying foreign agents, dealers and distributors, the construction of facilities in a timely manner and within cost estimates, the establishment of viable supply channels, the commencement of efficient manufacturing operations and, ultimately, the acceptance of the products by our current or prospective customers. We cannot be assured that our expansion plans will be implemented or, if implemented, be successful.
Our risk management policies and procedures may not be fully effective in achieving their purposes.
Our policies, procedures, controls and oversight to monitor and manage our enterprise risks may not be fully effective in achieving their purpose and may leave us exposed to identified or unidentified risks. Past or future misconduct by our employees or vendors could result in our violations of law, regulatory sanctions and/or serious reputational harm or financial harm. The Company monitors its policies, procedures and controls; however, we cannot assure you that our policies, procedures and controls will be sufficient to prevent all forms of misconduct. We review our compensation policies and practices as part of our risk management program, but it is possible that our compensation policies could incentivize management and other employees to subject the Company to inappropriate risk or to engage in misconduct. If such inappropriate risks or misconduct occurs, it is possible that it could have a material adverse effect on our results of operations and/or our financial condition.
AIP is party to the Shareholders Agreement (as defined below) and will continue to have significant influence over us after this offering, including control over decisions that require the approval of stockholders, which could limit your ability to influence the outcome of matters submitted to stockholders for a vote.
Upon completion of this offering, AIP owned 45,834,841 shares of our common stock, which represented 72.0% of our total outstanding shares of common stock. If the underwriters exercise their option to purchase additional shares in full, AIP will own 44,586,963 shares of our common stock, which will represent 70.0% of
38
Table of Contents
our total outstanding shares of common stock. AIP is also party to an amended and restated shareholders agreement (the “Shareholders Agreement”) that, among other things, imposes certain transfer restrictions on the shares held by such stockholders and requires such stockholders to vote in favor of certain nominees to our Board of Directors. For a discussion of the Shareholders Agreement, see “Certain Relationships and Related Person Transactions.” As long as these stockholders own or control at least a majority of our outstanding common stock, they will have the ability to exercise substantial control over all corporate actions requiring stockholder approval, irrespective of how our other stockholders may vote, including:
| • | the election and removal of directors and the size of our Board of Directors; |
| • | any amendment of our amended and restated certificate of incorporation or amended and restated bylaws; or |
| • | the approval of mergers and other significant corporate transactions, including a sale of substantially all of our assets. |
In addition, pursuant to the Shareholders Agreement, AIP will have the following rights so long as it holds at least 15% of the then outstanding common stock:
| • | to nominate the greater of five members of our Board of Directors or a majority of directors; |
| • | to designate the Chairman of our Board of Directors and one member to each of the audit committee, the compensation committee and the nominating and corporate governance committee; |
| • | to approve the commencement of any proceeding for the voluntary dissolution, winding up or bankruptcy of the Company or any material subsidiary; |
| • | to approve any non-pro rata reduction to the share capital of the Company or any material subsidiary, except as required by law; |
| • | to approve amendments to the amended and restated certificate of incorporation and amended and restated bylaws that would change the name of the Company, its jurisdiction of incorporation, the location of its principal executive offices, the purpose or purposes for which the Company is incorporated or the approval requirements as provided in the Shareholders Agreement; |
| • | to approve special dividends greater than $10 million; |
| • | to approve any merger, amalgamation or consolidation of the Company or the spinoff of a business of the Company with assets in excess of 15% of the consolidated assets or revenues of the Company and its subsidiaries; |
| • | the sale, conveyance, transfer or other disposition of all or more than 15% of the consolidated assets or revenues of the Company and its subsidiaries; and |
| • | any designation to the Board of Directors contrary to the Shareholders Agreement or the amended and restated certificate of incorporation and amended and restated bylaws. |
See “Certain Relationships and Related Party Transactions—Amended and Restated Shareholders Agreement” for more detail.
Lastly, AIP’s interests as an equity holder may not be aligned in all cases with those of other equity investors, or of our lenders as creditors. In addition, AIP may have an interest in pursuing or not pursuing acquisitions, divestitures, financings or other transactions that, in their judgment, could enhance their equity investments, even though such transactions might be contrary to the wishes of other equity investors or involve risks to our lenders. Furthermore, AIP may in the future own businesses that directly or indirectly compete with us. AIP may also pursue acquisition opportunities that may be complementary to our business separately from us and, as a result, those acquisition opportunities may not be available to us.
39
Table of Contents
Changes to tax laws or exposure to additional tax liabilities may have a negative impact on our operating results.
Tax policy reform continues to be a topic of discussion in the United States. Significant changes to the U.S. corporate tax system could have a material adverse effect upon our results of operations and cash flows. In addition, we regularly undergo tax audits in various jurisdictions in which we operate. Although we believe that our income tax provisions and accruals are reasonable and in accordance with GAAP, and that we prepare our tax filings in accordance with all applicable tax laws, the final determination with respect to any tax audits and any related litigation, could be materially different from our historical income tax provisions and accruals. The results of a tax audit or litigation could materially affect our operating results and cash flows in the periods for which that determination is made. In addition, future period net income may be adversely impacted by litigation costs, settlements, penalties and interest assessments.
Changes in customer preferences for our products or our failure to gauge those preferences could lead to reduced sales and additional costs.
Our ability to remain competitive depends heavily on our ability to provide a continuing and timely introduction of innovative product offerings. We cannot be certain that historical customer preferences for our products will remain unchanged. We believe that the introduction of new product features, designs and models will be critical to the future success of our operations as technological advancements are made and alternative fuels are developed, and it will be essential for our product lines to adapt accordingly. Managing frequent product introductions and transitions poses inherent risks and additional costs. Delays in the introduction or market acceptance of new product features, designs or models could have a material adverse effect on our business. Products may not be accepted for a number of reasons, including changes in customer preferences or our failure to properly gauge customer preferences. Further, we cannot be certain that new product introductions will not reduce sales from existing models and adversely affect our results of operations. In addition, we cannot assure you that any of these new product features, designs or models will be introduced to the market in a timely manner or that they will be successful when introduced.
Failure to maintain the strength and value of our brands could have a material adverse effect on our business, financial condition and results of operations.
Our success depends, in part, on the value and strength of our brands. Our brand names are integral to our business as well as to the implementation of our strategies for expanding our business. Maintaining, enhancing, promoting and positioning our brands, particularly in new markets where we have limited brand recognition, will depend largely on the success of our marketing and merchandising efforts and our ability to provide high-quality services, warranty plans, products and resources and a consistent, high-quality customer experience. Our brands could be adversely affected if we fail to achieve these objectives, if we fail to comply with laws and regulations, if we are subject to publicized litigation or if our public image or reputation were to be tarnished by negative publicity. Some of these risks may be beyond our ability to control, such as the effects of negative publicity regarding our suppliers or third party providers of services or negative publicity related to members of management. Any of these events could hurt the Company’s image, resulting in reduced demand for our products and a decrease in net sales. Further, maintaining, enhancing, promoting and positioning our brands’ images may require us to make substantial investments in marketing and employee training, which could adversely affect our cash flow and which may ultimately be unsuccessful. These factors could have a material adverse effect on our business, financial condition and results of operations.
Failure to establish and maintain effective internal controls in accordance with Section 404 of the Sarbanes-Oxley Act could have a material adverse effect on our business and stock price.
We are not currently required to comply with the rules of the SEC implementing Section 404 of the Sarbanes-Oxley Act and are therefore not required to make a formal assessment of the effectiveness of our internal control over financial reporting for that purpose. Upon becoming a public company, we will be required
40
Table of Contents
to comply with the SEC’s rules implementing Section 302 and 404 of the Sarbanes-Oxley Act, which will require management to certify financial and other information in our quarterly and annual reports and provide an annual management report on the effectiveness of controls over financial reporting. Though we will be required to disclose changes made in our internal controls and procedures on a quarterly basis, we will not be required to make our first annual assessment of our internal control over financial reporting pursuant to Section 404 until the year following our first annual report required to be filed with the SEC. To comply with the requirements of being a public company, we may need to undertake various actions, such as implementing new internal controls and procedures and hiring accounting or internal audit staff. Testing and maintaining internal controls can divert our management’s attention from other matters that are important to the operation of our business.
Our independent registered public accounting firm is not required to formally attest to the effectiveness of our internal controls over financial reporting until the year following our first annual report required to be filed with the SEC. At such time, our independent registered public accounting firm may issue a report that is adverse, in the event it is not satisfied with the level at which our controls are documented, designed or operating. If we are unable to conclude that we have effective internal control over financial reporting, our independent registered public accounting firm is unable to provide us with an unqualified report as required by Section 404, or we are required to restate our financial statements, we may fail to meet our public reporting obligations and investors could lose confidence in our reported financial information, which could have a negative effect on the trading price of our stock.
Our amended and restated certificate of incorporation will provide, subject to certain exceptions, that the Court of Chancery of the State of Delaware will be the sole and exclusive forum for certain stockholder litigation matters, which could limit our stockholders’ ability to obtain a favorable judicial forum for disputes with us or our directors, officers, employees or stockholders.
Our amended and restated certificate of incorporation will provide, subject to limited exceptions, that the Court of Chancery of the State of Delaware will, to the fullest extent permitted by law, be the sole and exclusive forum for (i) any derivative action or proceeding brought on our behalf; (ii) any action asserting a claim of breach of a fiduciary duty owed by any of our directors, officers or other employees to us or our stockholders; (iii) any action asserting a claim against us, any director or our officers or employees arising pursuant to any provision of the DGCL, our amended and restated certificate of incorporation or our amended and restated bylaws; or (iv) any action asserting a claim against us, any director or our officers or employees that is governed by the internal affairs doctrine. Any person or entity purchasing or otherwise acquiring any interest in shares of our capital stock shall be deemed to have notice of and to have consented to the provisions of our amended and restated certificate of incorporation described above. This choice of forum provision may limit a stockholder’s ability to bring a claim in a judicial forum that it finds favorable for disputes with us or any of our directors, officers, other employees or stockholders which may discourage lawsuits with respect to such claims. Alternatively, if a court were to find the choice of forum provision that will be contained in our amended and restated certificate of incorporation to be inapplicable or unenforceable in an action, we may incur additional costs associated with resolving such action in other jurisdictions, which could materially adversely affect our business, financial condition and results of operations.
Risks Relating to Our Common Stock and This Offering
Provisions of our corporate governance documents could make an acquisition of our Company more difficult and may prevent attempts by our stockholders to replace or remove our current management or directors, even if beneficial to our stockholders.
Provisions of our amended and restated certificate of incorporation and our amended and restated bylaws following this offering may discourage, delay or prevent a merger, acquisition or other change in control of our Company that stockholders may consider favorable, including transactions in which you might otherwise receive a premium for your shares. These provisions could also limit the price that investors might be willing to pay in the future for shares of our common stock, thereby depressing the market price of our common stock. In addition,
41
Table of Contents
these provisions may frustrate or prevent any attempts by our stockholders to replace or remove our current management or directors by making it more difficult for stockholders to replace members of our Board of Directors. Because our Board of Directors is responsible for appointing the members of our management team, these provisions could in turn affect any attempt to replace current members of our management team.
We will be a “controlled company” within the meaning of the NYSE rules and, as a result, will qualify for, and intend to rely on, exemptions from certain corporate governance requirements. You will not have the same protections afforded to stockholders of companies that are subject to such requirements.
After completion of this offering, the parties to the Shareholders Agreement will continue to control a majority of the voting power of our outstanding common stock. As a result, we will be a “controlled company” within the meaning of the corporate governance standards of the NYSE. Under these rules, a company of which more than 50% of the voting power for the election of directors is held by an individual, group or another company is a “controlled company” and may elect not to comply with certain corporate governance requirements, including the requirements that, within one year of the date of the listing of our common stock:
| • | we have a board that is composed of a majority of “independent directors,” as defined under the rules of such exchange; |
| • | we have a compensation committee that is composed entirely of independent directors; and |
| • | we have a nominating and corporate governance committee that is composed entirely of independent directors. |
Following this offering, we intend to utilize these exemptions. As a result, we will not have a majority of independent directors on our Board of Directors. In addition, our compensation committee and our nominating and corporate governance committee will not consist entirely of independent directors or be subject to annual performance evaluations. Accordingly, you will not have the same protections afforded to stockholders of companies that are subject to all of the corporate governance requirements of the NYSE.
If you purchase shares of common stock in this offering, you will suffer immediate and substantial dilution of your investment.
The initial public offering price of our common stock is substantially higher than the adjusted net tangible book value per share of our common stock. Therefore, if you purchase shares of our common stock in this offering, you will pay a price per share that substantially exceeds our net tangible book value per share after this offering. Based on the assumed initial public offering price of $20.00 per share, which is the midpoint of the price range set forth on the cover of this prospectus, you will experience immediate dilution of $15.68 per share, representing the difference between our adjusted net tangible book value per share after giving effect to this offering and the initial public offering price. In addition, purchasers of common stock in this offering will have contributed 62.3% of the aggregate price paid by all purchasers of our stock but will own only approximately 19.6% of our common stock outstanding after this offering. We also have a large number of outstanding stock options to purchase common stock with exercise prices that are below the estimated initial public offering price of our common stock. To the extent that these options are exercised, you will experience further dilution. See “Dilution” for more detail.
An active, liquid trading market for our common stock may not develop, which may limit your ability to sell your shares.
Prior to this offering, there was no public market for our common stock. Although our common stock has been approved for listing on the NYSE under the symbol “REVG,” subject to notice of official issuance, an active trading market for our shares may never develop or be sustained following this offering. The initial public offering price will be determined by negotiations between us and the underwriters and may not be indicative of market prices of our common stock that will prevail in the open market after the offering. A public trading
42
Table of Contents
market having the desirable characteristics of depth, liquidity and orderliness depends upon the existence of willing buyers and sellers at any given time, such existence being dependent upon the individual decisions of buyers and sellers over which neither we nor any market maker has control. The failure of an active and liquid trading market to develop and continue would likely have a material adverse effect on the value of our common stock. The market price of our common stock may decline below the initial public offering price, and you may not be able to sell your shares of our common stock at or above the price you paid in this offering, or at all. An inactive market may also impair our ability to raise capital to continue to fund operations by selling shares and may impair our ability to acquire other companies or technologies by using our shares as consideration.
We cannot assure you that our stock price will not decline or not be subject to significant volatility after this offering.
The market price of our common stock could be subject to significant fluctuations after this offering. The price of our stock may change in response to fluctuations in our operating results in future periods and may also change in response to other factors, many of which are beyond our control. As a result, our share price may experience significant volatility and may not necessarily reflect the value of our expected performance. Among other factors that could affect our stock price are:
| • | market conditions in the broader stock market; |
| • | actual or anticipated fluctuations in our quarterly financial and operating results; |
| • | introduction of new products or services by us or our competitors; |
| • | issuance of new or changed securities analysts’ reports or recommendations; |
| • | sales, or anticipated sales, of large blocks of our stock; |
| • | additions or departures of key personnel; |
| • | legal, regulatory or political developments; |
| • | litigation and governmental investigations; |
| • | the size of our public float; |
| • | market and industry perception of our success, or lack thereof, in pursuing our growth strategy; |
| • | changing economic conditions; and |
| • | exchange rate fluctuations. |
In particular, we cannot assure you that you will be able to resell any of your shares of our common stock at or above the initial public offering price, or at all. The initial public offering price will be determined by negotiations between us and the representatives of the underwriters and may not be indicative of prices that will prevail in the trading market, if a trading market develops, after this offering.
In addition, in the past, when the market price of a stock has been volatile, holders of that stock have sometimes instituted securities class action litigation against the company that issued the stock. If any of our stockholders brought a lawsuit against us, we could incur substantial costs defending the lawsuit. Such a lawsuit could also divert the time and attention of our management from our business, which could significantly harm our profitability and reputation.
A significant portion of our total outstanding shares are restricted from immediate resale but may be sold into the market in the near future. This could cause the market price of our common stock to drop significantly, even if our business is doing well.
Sales of a substantial number of shares of our common stock in the public market could occur at any time. These sales, or the perception in the market that the holders of a large number of shares intend to sell shares,
43
Table of Contents
could reduce the market price of our common stock. After this offering, we will have 63,697,200 shares of common stock outstanding based on the number of shares outstanding as of October 29, 2016. This includes 12,500,000 shares that we are selling in this offering which may be resold in the public market immediately (other than shares of our common stock that may be held or acquired by our directors, executive officers or affiliates, as that term is defined in the Securities Act), and assumes no exercises of outstanding options. Substantially all of the shares that are not being sold in this offering will be subject to a 180-day lock-up period provided under agreements executed in connection with this offering. These shares will, however, be able to be resold after the expiration of the lock-up agreements or with the prior written consent of the Requisite Number of Representatives (as defined under “Underwriting”) of the underwriters, as described in the “Shares Eligible for Future Sale” and “Underwriting” sections of this prospectus. We also intend to register all shares of common stock that we may issue under our equity compensation plans. Once we register the issuance of these shares, they can be freely sold in the public market upon issuance, subject to the lock-up agreements. As restrictions on resale end, the market price of our stock could decline if the holders of currently restricted shares sell them or are perceived by the market as intending to sell them.
We cannot assure you that we will declare dividends or have sufficient funds to pay dividends on our common stock.
Although we intend to pay a quarterly dividend on shares of our common stock, to the extent that we have sufficient funds available for such purpose, the declaration, amount and payment of any future dividends on shares of common stock will be at the sole discretion of our Board of Directors and we may reduce or discontinue entirely the payment of such dividends at any time. Our Board of Directors may take into account general and economic conditions, our financial condition and operating results, our available cash and current and anticipated cash needs, capital requirements, contractual, legal, tax and regulatory restrictions and implications on the payment of dividends by us to our stockholders or by our subsidiaries to us, and such other factors as our Board of Directors may deem relevant. In addition, our ability to pay dividends is, and may be, limited by covenants of existing and any future outstanding indebtedness we or our subsidiaries incur, including under the ABL Facility. Moreover, because we are a holding company, our ability to pay dividends is dependent upon the financial results and cash flow of our operating subsidiaries and the distribution or other payment of cash to us in the form of dividends or otherwise, which may further restrict our ability to pay dividends as a result of the laws of their jurisdiction of organization, agreements of our subsidiaries or covenants under any existing and future outstanding indebtedness we or our subsidiaries incur. Furthermore, Delaware law requires that our Board of Directors determine that we have adequate surplus prior to the declaration of dividends. While we do not currently believe that these restrictions will impair our ability to pay regular quarterly cash dividends, there can be no assurance that we will not need to reduce or eliminate the payment of dividends on our common stock in the future. Therefore, any return on investment in our common stock may be solely dependent upon the appreciation of the price of our common stock on the open market, which may not occur. See “Dividend Policy” for more detail.
If securities or industry analysts do not publish research or reports about our business, if they adversely change their recommendations regarding our shares or if our results of operations do not meet their expectations, our share price and trading volume could decline. In addition, if securities or industry analysts publish inaccurate or unfavorable research about our business, our stock price and trading volume could decline.
The trading market for our shares will be influenced by the research and reports that industry or securities analysts publish about us or our business. We do not have any control over these analysts. If one or more of these analysts cease coverage of our Company or fail to publish reports on us regularly, we could lose visibility in the financial markets and demand for our stock could decrease, which could cause our stock price and trading volume to decline. Moreover, if one or more of the analysts who cover us downgrade our stock or make sell recommendations, or if our results of operations do not meet their expectations, our share price could decline.
44
Table of Contents
We will incur significant increased costs as a result of operating as a public company, and our management will be required to divert attention from operational and other business matters to devote substantial time to public company requirements.
As a public company, we will incur significant legal, accounting and other expenses that we did not incur as a private company. For example, we will be required to comply with the requirements of the Sarbanes-Oxley Act, as well as rules and regulations subsequently implemented by the SEC and the NYSE, including the establishment and maintenance of effective disclosure and financial controls and changes in corporate governance practices. We expect that compliance with these requirements will increase our legal and financial compliance costs and will make some activities more time-consuming and costly. For example, the Exchange Act will require us, among other things, to file annual, quarterly and current reports with respect to our business and operating results. In addition, we expect that our management and other personnel will need to divert attention from operational and other business matters to devote substantial time to these public company requirements. In particular, we expect to incur significant expenses and devote substantial management effort toward ensuring compliance with the requirements of Section 404 of the Sarbanes-Oxley Act. In that regard, we currently have no internal audit function, and we will need to hire additional accounting and financial staff with appropriate public company experience and technical accounting knowledge. We also expect that operating as a public company will make it more difficult and more expensive for us to obtain director and officer liability insurance, and we may be required to accept reduced policy limits and coverage or incur substantially higher costs to obtain the same or similar coverage. As a result, it may be more difficult for us to attract and retain qualified people to serve on our Board of Directors, our Board committees or as executive officers.
45
Table of Contents
CAUTIONARY NOTE REGARDING FORWARD-LOOKING STATEMENTS
This prospectus contains forward-looking statements. Forward-looking statements are neither historical facts nor assurances of future performance. Instead, they are based on our current beliefs, expectations and assumptions regarding the future of our business, future plans and strategies and other future conditions. Forward-looking statements can be identified by words such as “anticipate,” “believe,” “estimate,” “expect,” “intend,” “may,” “plan,” “predict,” “project,” “target,” “potential,” “will,” “would,” “could,” “should,” “continue,” “contemplate,” “aim” and other similar expressions, although not all forward-looking statements contain these identifying words. Examples of forward-looking statements include, among others, statements we make regarding:
| • | plans for future growth and other business development activities; |
| • | plans for capital expenditures; |
| • | financing sources; |
| • | market demand; |
| • | industry conditions; |
| • | dividends; |
| • | the effects of regulation and competition; |
| • | foreign currency conversion; and |
| • | all other statements regarding our intent, plans, beliefs or expectations or those of our directors or officers. |
The forward looking statements in this prospectus are only predictions. We have based these forward-looking statements largely on our current expectations and projections about future events and financial trends that we believe may affect our business, financial condition and results of operations. Actual results or events could differ materially from the plans, intentions and expectations disclosed in the forward-looking statements we make. Important factors that could cause actual results and events to differ materially from those indicated in the forward-looking statements, including those described under “Risk Factors.”
The forward-looking statements in this prospectus represent our views as of the date of this prospectus. We undertake no obligation to publicly update any forward-looking statements whether as a result of new information, future developments or otherwise.
46
Table of Contents
We estimate that the net proceeds to us from our issuance and sale of 12,500,000 shares of common stock in this offering will be approximately $231.4 million, after deducting the underwriting discount and estimated offering expenses payable by us. This estimate assumes an initial public offering price of $20.00 per share, the midpoint of the price range set forth on the cover page of this prospectus.
A $1.00 increase (decrease) in the assumed public offering price of $20.00, based upon the midpoint of the estimated price range set forth on the cover of this prospectus, would increase (decrease) the net proceeds to us from this offering by $11.7 million, assuming the number of shares we offer, as set forth on the cover page of this prospectus, remains the same and after deducting the underwriting discount and estimated offering expenses payable by us. We may also increase or decrease the number of shares we are offering. Each increase (decrease) of 1,000,000 shares in the number of shares of common stock offered by us would increase (decrease) the net proceeds to us from this offering by $18.7 million, based upon the midpoint of the estimated price range set forth on the cover of this prospectus, and after deducting the underwriting discount and estimated offering expenses payable by us.
We will not receive any proceeds from the sale of shares by the selling stockholders if the underwriters exercise their option to purchase additional shares of common stock.
We intend to use the net proceeds of this offering as follows:
| • | first, to redeem in full our outstanding Senior Secured Notes and pay the related call premium, which would have matured on November 1, 2019 and bore interest at a fixed rate of 8.500% per annum, and to pay accrued and unpaid interest thereon from the most recent interest payment date to the redemption date, for a total redemption price of approximately $192.1 million; and |
| • | second, to use the remaining proceeds, if any, to repay approximately up to $39.3 million aggregate principal amount of loans under the ABL Facility, which matures on October 21, 2018 and bears interest at a base or LIBOR rate, as defined in the ABL Facility, plus a spread of 175 basis points (a weighted average rate of 2.24% on borrowings outstanding as of October 29, 2016), and to pay accrued and unpaid interest thereon from the most recent interest payment date to the repayment date. |
Pending the use of proceeds described above, we may invest the net proceeds in short-term, investment-grade, interest-bearing securities such as money market accounts, certificates of deposit, commercial paper, or guaranteed obligations of the U.S. government.
47
Table of Contents
Following the completion of this offering and subject to legally available funds, we intend to pay a quarterly cash dividend at a rate initially equal to $0.05 per share on our common stock. We expect to pay a quarterly dividend on or about the last day of the first month following each fiscal quarter to shareholders of record on the last day of such fiscal quarter. We expect our first quarterly dividend to be payable in respect of our second quarter of fiscal year 2017 on May 31, 2017 to holders of record on April 30, 2017, based on the initial dividend rate specified above. Based on this initial dividend rate of $0.05 per share, and assuming we have 63,697,200 shares of our common stock outstanding, this would result in an aggregate annual cash dividend amount of approximately $12.7 million. However, the declaration, amount and payment of any future dividends will be at the sole discretion of our Board of Directors and we may reduce or discontinue entirely the payment of such dividends at any time. Our Board of Directors may take into account general and economic conditions, our financial condition and operating results, our available cash and current and anticipated cash needs, capital requirements, contractual, legal, tax and regulatory restrictions and implications on the payment of dividends by us to our stockholders or by our subsidiaries to us, and such other factors as our Board of Directors may deem relevant. Moreover, because we are a holding company, our ability to pay dividends is dependent upon the financial results and cash flow of our operating subsidiaries and the distribution or other payment of cash to us in the form of dividends or otherwise, which may further restrict our ability to pay dividends as a result of the laws of their jurisdiction of organization, agreements of our subsidiaries or covenants under any existing and future outstanding indebtedness we or our subsidiaries incur. Based on the status of the factors listed above, the anticipated size of our intended quarterly dividend, the current relationships with our operating subsidiaries and the status of our various operating and debt agreements, we believe that we have sufficient liquidity and authorization to be able to pay our intended dividend. See “Risk Factors—Risks Relating to Our Common Stock and this Offering—We cannot assure you that we will declare dividends or have sufficient funds to pay dividends on our common stock,” “Management’s Discussion and Analysis of Financial Condition and Results of Operations—Liquidity and Capital Resources” and “Description of Indebtedness,” appearing elsewhere in this prospectus, for descriptions of restrictions on our ability to pay dividends. We have neither paid nor declared any dividends on our common stock during fiscal years 2016, 2015 or 2014.
48
Table of Contents
The following table sets forth our cash, cash equivalents and capitalization as of October 29, 2016:
| • | on an actual basis; and |
| • | on an as adjusted basis to reflect (i) our receipt of the estimated net proceeds from the sale of 12,500,000 shares of our common stock in this offering, after deducting the underwriting discount and estimated offering expenses payable by us, at an assumed initial public offering price of $20.00 per share, the midpoint of the price range set forth on the cover of this prospectus and (ii) the use of such proceeds as described in “Use of Proceeds.” |
The as adjusted information below is illustrative only and will be adjusted based on the actual initial public offering price and other terms of our initial public offering determined at pricing. You should read this information together with our audited consolidated financial statements and related notes appearing elsewhere in this prospectus and the information set forth under the headings “Selected Consolidated Financial Data” and “Management’s Discussion and Analysis of Financial Condition and Results of Operations.”
| As of October 29, 2016 | ||||||||
| Actual | As Adjusted(1) | |||||||
| ($ in thousands except par value and share amounts) | ||||||||
| Cash and cash equivalents |
$ | 10,821 | $ | 10,821 | ||||
|
|
|
|
|
|||||
| Long-term debt: |
||||||||
| ABL Facility(2) |
80,000 | 40,718 | ||||||
| Senior Secured Notes(3) |
176,040 | — | ||||||
| Capital leases |
— | — | ||||||
|
|
|
|
|
|||||
| Total long-term indebtedness (including current maturities) |
256,040 | 40,718 | ||||||
| Contingently redeemable common stock, 1,607,760 shares outstanding, actual; no shares outstanding, as adjusted(4) |
22,293 | — | ||||||
| Stockholders’ equity(5)(6): |
||||||||
| Preferred stock, $0.001 par value per share, 400,000 shares authorized and no shares outstanding, actual; 95,000,000 shares authorized and no shares outstanding, as adjusted |
— | — | ||||||
| Class A common stock, $0.001 par value per share, 46,000,000 shares authorized and 6,905,120 shares outstanding (excluding contingently redeemable common stock), actual; no shares authorized or outstanding, as adjusted |
— | — | ||||||
| Class B common stock, $0.001 par value per share, 43,200,000 shares authorized and 42,684,320 shares outstanding, actual; no shares authorized or outstanding, as adjusted |
— | — | ||||||
| Common stock, $0.001 par value per share, no shares authorized or outstanding, actual; 605,000,000 shares authorized and 63,697,200 shares outstanding, as adjusted |
— | 64 | ||||||
| Additional paid-in capital(7) |
206,229 | 459,896 | ||||||
| Retained earnings(8) |
31,655 | 24,190 | ||||||
| Accumulated other comprehensive income |
39 | 39 | ||||||
| Total stockholders’ equity |
237,923 | 484,189 | ||||||
|
|
|
|
|
|||||
| Total capitalization |
$ | 516,256 | 524,907 | |||||
|
|
|
|
|
|||||
| (1) | A $1.00 per share increase (decrease) in the assumed initial public offering price of $20.00 per share, the midpoint of the range set forth on the cover of this prospectus, of our common stock would increase (decrease) our net proceeds by $11.7 million, after deducting the underwriting discount and estimated |
49
Table of Contents
| expenses payable by us. Each increase (decrease) of 1 million shares in the number of shares of common stock offered by us would increase (decrease) our net proceeds by $18.7 million, based upon the midpoint of the estimated price range set forth on the cover of this prospectus, and after deducting the underwriting discount and estimated offering expenses payable by us. |
| (2) | The $300.0 million ABL Facility will mature on October 21, 2018 and is guaranteed on a senior secured basis by certain of our subsidiaries. As of October 29, 2016, there were $80 million outstanding borrowings and $6.2 million of outstanding letters of credit thereunder. Subsequent to October 29, 2016 and through January 12, 2017, consistent with our normal pattern of working capital fluctuations and to fund a small acquisition, we have drawn an additional amount under the ABL Facility of approximately $77.8 million. We intend to repay approximately $39.3 million aggregate principal amount of loans under the ABL Facility, plus accrued and unpaid interest thereon, with a portion of the net proceeds from this offering. There is no penalty for the repayment. |
| (3) | Net of unamortized capitalized debt issuance costs of $3.5 million and unamortized original issue discount of $0.5 million. |
| (4) | As adjusted for the reclassification of contingently redeemable common stock to stockholders’ equity resulting from the expiration of the employee shareholders’ put options upon the completion of this offering. See Note 14 to our audited consolidated financial statements for further discussion. |
| (5) | Prior to this offering, we expect to complete an 80-for-one stock split of our Class A common stock and Class B common stock and reclassify the Class A common stock and Class B common stock into a single class of common stock, which is the same class as the shares being sold in this offering. All share amounts have been retroactively adjusted to give effect to this stock split at the time of its effectiveness. |
| (6) | Does not include 1,109,240 stock options and 846,000 liability option awards outstanding as of October 29, 2016 that will vest upon the completion of this offering, as described under “Management’s Discussion and Analysis of Financial Condition—Factors Affecting Our Performance.” |
| (7) | As adjusted for reclassification of contingently redeemable common stock to additional paid-in capital resulting from the expiration of the employee shareholders’ put options upon the completion of this offering, as described in Note 14 to our audited consolidated financial statements. |
| (8) | As adjusted for the redemption in full of the Senior Secured Notes and reflects the write-off of debt issuance costs of $3.5 million ($2.3 million, net of tax), the write-off of original issue discount of $0.5 million ($0.3 million, net of tax) and call premium of $7.7 million ($4.9 million, net of tax). |
50
Table of Contents
If you invest in our common stock in this offering, you will incur immediate and substantial dilution to the extent of the difference between the initial public offering price per share of common stock and the adjusted net tangible book value per share of common stock after this offering.
Our net tangible book value as of October 29, 2016 was approximately $51.7 million, or $1.01 per share of common stock. Adjusted net tangible book value represents the amount of total assets, less goodwill, intangible assets and liabilities, and the adjusted net tangible book value per share represents the amount of total assets, less goodwill, intangible assets and liabilities, divided by the number of shares of common stock outstanding, after the sale of 12,500,000 shares of common stock in this offering, after deducting the underwriting discount and estimated offering expenses payable by us, at an assumed initial public offering price of $20.00 per share, the midpoint of the estimated price range on the cover of this prospectus. This represents an immediate increase in net tangible book value of $3.32 per share to our existing stockholders and an immediate dilution of $15.68 per share to investors.
The following table illustrates the per share dilution:
| Assumed initial public offering price per share |
$ | 20.00 | ||||||
| Net tangible book value per share as of October 29, 2016(1) |
$ | 1.01 | ||||||
| Increase in net tangible book value per share attributable to new investors |
3.32 | |||||||
|
|
|
|||||||
| Adjusted net tangible book value per share after this offering |
4.32 | |||||||
|
|
|
|||||||
| Dilution per share to new investors |
$ | 15.68 | ||||||
|
|
|
| (1) | Reflects 51,197,200 outstanding shares of common stock. |
Each $1.00 increase or decrease in the assumed initial public offering price of $20.00 per share would increase or decrease our adjusted net tangible book value by approximately $11.7 million, the adjusted net tangible book value per share by approximately $0.19 per share and the dilution to investors purchasing shares in this offering by approximately $0.81 per share, assuming the number of shares offered by us, as set forth on the cover of this prospectus, remains the same and after deducting the underwriting discount and estimated offering expenses payable by us.
The following table summarizes, on an as adjusted basis as of October 29, 2016, the differences between the number of shares of common stock purchased from us, the total consideration and the average price per share paid by existing stockholders and by investors participating in this offering, after deducting the underwriting discount and estimated offering expenses, at an assumed initial public offering price of $20.00 per share, the midpoint of the price range set forth on the cover of this prospectus.
| Shares Purchased | Total Consideration | Average price per share |
||||||||||||||||||
| Number | Percent | Amount | Percent | |||||||||||||||||
| Existing stockholders |
51,197,200 | 80.4 | % | $ | 151,300,098 | 37.7 | % | $ | 2.96 | |||||||||||
| New investors |
12,500,000 | 19.6 | % | 250,000,000 | 62.3 | % | $ | 20.00 | ||||||||||||
|
|
|
|
|
|
|
|
|
|
|
|||||||||||
| Total |
63,697,200 | 100 | % | $ | 401,300,098 | 100 | % | $ | 6.30 | |||||||||||
Each $1.00 increase or decrease in the assumed initial public offering price of $20.00 per share would increase or decrease the total consideration paid to us by new investors and total consideration paid to us by all shareholders by $11.7 million, assuming that the number of shares offered by us, as set forth on the cover of this prospectus, remains the same and after deducting the underwriting discount and estimated offering expenses payable by us. An increase or decrease of 1,000,000 shares in the number of shares offered by us would increase or decrease the total consideration paid to us by new investors and total consideration paid to us by all shareholders by approximately $18.7 million, assuming an initial public offering price of $20.00 per share, after deducting the underwriting discount and estimated offering expenses payable by us.
51
Table of Contents
SELECTED CONSOLIDATED FINANCIAL DATA
The following table sets forth summary historical consolidated financial data for the periods presented and at the dates indicated below. We have derived the selected consolidated financial data for fiscal years 2016, 2015 and 2014 from our audited consolidated financial statements, appearing elsewhere in this prospectus. We have derived the selected consolidated financial data for fiscal years 2013 and 2012 from our audited consolidated financial statements, which are not included in this prospectus.
Historical results are not necessarily indicative of the results to be expected for future periods. The summary historical consolidated data presented below should be read in conjunction with the sections entitled “Risk Factors,” “Selected Historical Consolidated Financial and Other Data,” “Management’s Discussion and Analysis of Financial Condition and Results of Operations” and the financial statements and the related notes and other financial data appearing elsewhere in the prospectus.
| Fiscal Year Ended | ||||||||||||||||||||
| (in thousands except per share data) | October 29, 2016 |
October 31, 2015 |
October 31, 2014 |
October 31, 2013 |
October 31, 2012 |
|||||||||||||||
| Net sales |
$ | 1,925,999 | $ | 1,735,081 | $ | 1,721,116 | $ | 1,173,051 | $ | 1,013,871 | ||||||||||
| Cost of sales |
1,696,068 | 1,553,127 | 1,557,877 | 1,055,743 | 912,740 | |||||||||||||||
|
|
|
|
|
|
|
|
|
|
|
|||||||||||
| Gross profit |
229,931 | 181,954 | 163,239 | 117,308 | 101,131 | |||||||||||||||
| Operating expenses: |
||||||||||||||||||||
| Selling, general and administrative |
139,771 | 102,309 | 111,820 | 88,618 | 70,409 | |||||||||||||||
| Research and development costs |
4,815 | 5,106 | 8,275 | 1,863 | 6,325 | |||||||||||||||
| Restructuring costs(1) |
3,521 | 3,869 | 3,376 | 11,178 | — | |||||||||||||||
| Amortization of intangibles |
9,423 | 8,586 | 8,790 | 6,159 | 5,804 | |||||||||||||||
|
|
|
|
|
|
|
|
|
|
|
|||||||||||
| Total operating expenses |
157,530 | 119,870 | 132,261 | 107,818 | 82,538 | |||||||||||||||
|
|
|
|
|
|
|
|
|
|
|
|||||||||||
| Operating income |
72,401 | 62,084 | 30,978 | 9,490 | 18,593 | |||||||||||||||
| Interest expense |
29,158 | 27,272 | 26,195 | 23,222 | 22,948 | |||||||||||||||
| Gain on bargain purchase(2) |
— | — | — | (36,495 | ) | — | ||||||||||||||
| Loss on debt extinguishment(3) |
— | — | — | 9,220 | 1,478 | |||||||||||||||
|
|
|
|
|
|
|
|
|
|
|
|||||||||||
| Income (loss) before provision (benefit) for income taxes |
43,243 | 34,812 | 4,783 | 13,543 | (5,833 | ) | ||||||||||||||
| Provision (benefit) for income taxes |
13,050 | 11,935 | 3,295 | (11,483 | ) | (769 | ) | |||||||||||||
|
|
|
|
|
|
|
|
|
|
|
|||||||||||
| Net income (loss) |
$ | 30,193 | $ | 22,877 | $ | 1,488 | $ | 25,026 | $ | (5,064 | ) | |||||||||
|
|
|
|
|
|
|
|
|
|
|
|||||||||||
| Weighted-average shares of common stock outstanding(4) |
||||||||||||||||||||
| Basic |
51,587,164 | 52,761,380 | 52,789,250 | 47,456,240 | 42,153,760 | |||||||||||||||
| Diluted |
51,773,685 | 52,818,969 | 52,797,431 | 47,457,440 | 42,153,760 | |||||||||||||||
| Earnings per share of common stock |
||||||||||||||||||||
| Basic |
0.59 | 0.43 | 0.03 | 0.53 | (0.12 | ) | ||||||||||||||
| Diluted |
0.58 | 0.43 | 0.03 | 0.53 | (0.12 | ) | ||||||||||||||
| |
As of |
| ||||||||||||||||||
| (in thousands) | October 29, 2016 |
October 31, 2015 |
October 31, 2014 |
October 31, 2013 |
October 31, 2012 |
|||||||||||||||
| Balance Sheet Data: |
||||||||||||||||||||
| Cash and cash equivalents |
$ | 10,821 | $ | 4,968 | $ | 12,519 | $ | 18,025 | $ | 5,101 | ||||||||||
| Property, plant and equipment, net |
146,422 | 89,145 | 84,241 | 84,756 | 48,710 | |||||||||||||||
| Total assets |
889,019 | 695,821 | 705,687 | 707,238 | 501,228 | |||||||||||||||
| Total liabilities |
628,803 | 455,907 | 487,170 | 490,741 | 353,454 | |||||||||||||||
| Contingently redeemable common stock |
22,293 | 15,350 | 15,418 | 13,894 | 10,531 | |||||||||||||||
| Total shareholders’ equity |
237,923 | 224,564 | 203,099 | 202,603 | 137,243 | |||||||||||||||
| (1) | Restructuring costs incurred in fiscal years 2016 and 2015 are related to the Company’s restructuring of its management functions (including the move of its corporate headquarters from Orlando, Florida to Milwaukee, |
52
Table of Contents
| Wisconsin) and various product lines including, but not limited to, severance and discontinued product costs. Restructuring costs in fiscal year 2015 include $3.9 million of personnel costs including severance, stay bonuses, vacation and other benefits, and $0.8 million of inventory obsolescence reserves for discontinued product lines, which are recognized as a component of cost of sales in the Company’s consolidated statements of operations. In addition, during the fourth quarter of fiscal year 2016, the Company implemented a plan to relocate production of Goshen Coach buses from its Elkhart, Indiana facility to its facilities in Salina, Kansas and Imlay City, Michigan. In connection with this plan, the Company incurred $0.7 million of costs related to severance and relocation costs during fiscal year 2016. The Company expects to recognize additional restructuring costs related to the completion of this plan in fiscal year 2017. |
| Restructuring costs incurred in fiscal year 2014 represent costs related to the MRV and SJC acquisitions and include $3.4 million of personnel costs, including severance, bonuses, vacation and dealer and distributor reassignment and a charge of $4.1 million of costs related to the disposition of inventory for discontinued products through discounted sales and returning material to vendors at a discount. Restructuring costs related to inventory are recognized as a component of cost of sales in the Company’s consolidated statements of operations. |
| Restructuring costs incurred in fiscal year 2013 include severance and relocation costs, related to the relocation of MRV manufacturing to Decatur, Indiana, and the relocation of manufacturing of the assets of SJC to Winter Park, Florida. |
| (2) | Bargain purchase gains related to the acquisitions of MRV, the assets of SJC and the commercial bus businesses of Thor Industries, Inc. (the “Thor Bus Acquisition” and, together with the acquisition of MRV and SJC, the “2013 Acquisitions”). |
| (3) | On October 21, 2013, the Company issued $200 million of Senior Secured Notes maturing on November 1, 2019 and entered into the ABL Facility for $150 million to pay off existing indebtedness and pay a portion of the purchase price for the Thor Bus Acquisition. In connection with this refinancing, the Company recognized a loss on debt extinguishment of $9.2 million, which was comprised of prepayment fees and the write-off of previously capitalized debt issuance costs. |
In fiscal year 2012, the Company paid one of the tranches under its previous debt agreement. In connection with this refinance, the Company recognized a loss on debt extinguishment of $1.5 million, which was comprised of prepayment fees and the write-off of previously capitalized debt issuance costs.
| (4) | A reconciliation of the calculation of basic and diluted weighted-average shares of common stock is as follows: |
| Fiscal Year Ended | ||||||||||||||||||||
| October 29, 2016 |
October 31, 2015 |
October 31, 2014 |
October 31, 2013 |
October 31, 2012 |
||||||||||||||||
| Basic weighted-average shares of common stock outstanding |
51,587,164 | 52,761,380 | 52,789,250 | 47,456,240 | 42,153,760 | |||||||||||||||
| Dilutive stock options |
186,521 | 57,589 | 8,181 | 1,200 | 0 | |||||||||||||||
|
|
|
|
|
|
|
|
|
|
|
|||||||||||
| Diluted weighted-average shares of common stock outstanding |
51,773,685 | 52,818,969 | 52,797,431 | 47,457,440 | 42,153,760 | |||||||||||||||
|
|
|
|
|
|
|
|
|
|
|
|||||||||||
53
Table of Contents
MANAGEMENT’S DISCUSSION AND ANALYSIS OF
FINANCIAL CONDITION AND RESULTS OF OPERATIONS
You should read the following discussion and analysis of our financial condition and results of operations together with our consolidated financial statements and the related notes appearing elsewhere in this prospectus. Some of the information contained in this discussion and analysis or set forth elsewhere in this prospectus, including information with respect to our plans and strategy for our business and related financing, includes forward-looking statements that involve risks and uncertainties. You should read the “Risk Factors” and “Cautionary Note Regarding Forward-Looking Statements” sections of this prospectus for a discussion of important factors that could cause actual results to differ materially from the results described in or implied by the forward-looking statements contained in the following discussion and analysis.
This discussion and analysis should be read in conjunction with the accompanying audited consolidated financial statements and related notes appearing elsewhere in this prospectus.
Overview
REV is a leading designer, manufacturer and distributor of specialty vehicles and related aftermarket parts and services. We serve a diversified customer base primarily in the United States through three segments: Fire & Emergency, Commercial and Recreation. We provide customized vehicle solutions for applications including: essential needs (ambulances, fire apparatus, school buses, mobility vans and municipal transit buses), industrial and commercial (terminal trucks, cut-away buses and street sweepers) and consumer leisure (RVs and luxury buses). Our brand portfolio consists of 26 well-established principal vehicle brands including many of the most recognizable names within our served markets. Several of our brands pioneered their specialty vehicle product categories and date back more than 50 years. We believe that in most of our markets, we hold the first or second market share position and estimate that approximately 72% of our net sales during fiscal year 2016 came from products where we hold such share positions.
In fiscal year 2016, we sold approximately 17,300 units and we currently have an estimated installed base of approximately 240,000 vehicles in operation. We believe this provides us with a competitive advantage and recurring replacement vehicle sales as many customers are brand-loyal and fleet owners frequently seek to standardize their in-service fleets through repeat purchases of existing brands and product configurations. The specialty vehicle market is a complex and attractive market characterized by: (i) numerous niche markets with annual sales volumes generally between 3,000 and 25,000 units, (ii) highly customized vehicle configurations addressing unique customer applications and (iii) specialized customer bases and distribution channels (both dealer and direct). We believe the specialty vehicle market has historically been addressed primarily by smaller, less sophisticated companies, which has created an opportunity for market leadership by scaled and highly efficient producers such as REV. Under our current leadership, our focus on product innovation, life-cycle value leadership and operational improvement has strengthened our brands and market position while driving growth and expanding margins.
Our products are sold to municipalities, government agencies, private contractors, consumers and industrial and commercial end users. We have a diverse customer base with our top 10 customers representing approximately 25% of our net sales in fiscal year 2016, with no single customer representing more than 6% of our net sales over the same period. Our top 10 customers have maintained relationships with REV and its predecessor companies for an average of approximately 20 years. We believe our diverse end markets are favorably exposed to multiple secular growth drivers such as: rising municipal spending, a growing aged population, growing urbanization, growing student populations, the increasing popularity of outdoor and active lifestyles and the replacement of existing in-service vehicles including legislated replacements. In addition to these favorable underlying drivers of growth, we believe certain of our markets will benefit over the next several years from incremental demand created by the underinvestment in fleets following the 2008 recession. For example, we estimate that the cumulative pent-up replacement demand in the fire and emergency market is
54
Table of Contents
approximately 15,000 units, which represents 144% of the total fire and emergency market unit sales volume in the United States and Canada in 2015. However, we cannot be certain as to the timing and extent to which the pent-up replacement demand may be released, as it is inherently uncertain and generally outside our control.
Our business model utilizes our unique scale to drive profitable organic and acquisitive growth. We seek to gain market share by delivering high-quality products with customized attributes tailored to our customers’ product specifications, while simultaneously reducing costs and shortening delivery lead times. We aim to achieve this by standardizing and optimizing certain processes across our segments in areas including: procurement, engineering and product development, lean manufacturing, dealer management, pricing, and aftermarket parts sales. We believe our manufacturing and service network, consisting of 15 manufacturing facilities and 11 aftermarket service locations (called Regional Technical Centers or “RTCs”), provides us with a competitive advantage through the sharing of best practices, manufacturing flexibility based on relative facility utilization levels, delivery costs and lead times, economies of scale, customer service capabilities and a complementary distribution system. Our business consists primarily of design, engineering, integration and assembly activities, which require low levels of capital expenditures. Additionally, our business has a highly variable cost structure that results in operational flexibility, which, we believe, when combined with low levels of capital expenditures, can produce high returns on invested capital. Furthermore, our broad presence across the specialty vehicle market and large manufacturing and distribution network are important differentiators in our ability to grow through acquisitions. We seek to make synergistic acquisitions that further enhance our existing market positions or enter REV into new, attractive product segments. In the past 10 years, we have successfully integrated nine acquisitions and have demonstrated the ability to grow and enhance the earnings profile of acquired businesses by either consolidating acquired businesses into our existing plant footprint or by introducing REV processes into the newly acquired businesses to drive profitable growth.
Segments
The Company has three business segments:
Our Fire & Emergency segment sells fire apparatus equipment under the Emergency One (“E-ONE”) and Kovatch Mobile Equipment (“KME”) brands and ambulances under the American Emergency Vehicles (“AEV”), Horton Emergency Vehicles (“Horton”), Leader Emergency Vehicles (“Leader”), Marque, McCoy Miller, Road Rescue, Wheeled Coach and Frontline brands. We believe we are the largest manufacturer by unit volume of fire and emergency vehicles in the United States and have one of the industry’s broadest portfolios of products including Type I ambulances (aluminum body mounted on a heavy truck-style chassis), Type II ambulances (van conversion ambulance typically favored for non-emergency patient transportation), Type III ambulances (aluminum body mounted on a van-style chassis), pumpers (fire apparatus on a custom or commercial chassis with a water pump and small tank to extinguish fires), ladder trucks (fire apparatus with stainless steel or aluminum ladders), tanker trucks and rescue and other vehicles. Each of our individual brands is distinctly positioned and targets certain price and feature points in the market such that dealers often carry and customers often buy more than one REV Fire & Emergency product line.
Our Commercial segment serves the bus market through the following principal brands: Collins Bus, Goshen Coach, ENC, ElDorado National, Krystal Coach, Federal Coach, Champion and World Trans. We serve the terminal truck market through the Capacity brand, the sweeper market through the Lay-Mor brand and the mobility market through the ElDorado Mobility brand. We are a leading producer of small- and medium-sized buses, Type A school buses, transit buses, terminal trucks and street sweepers in the United States. Our products in the Commercial segment include cut-away buses (customized body built on various types and sizes of commercial chassis), transit buses (large municipal buses where we build our own chassis and body), luxury buses (bus-style limo or high-end luxury conversions), street sweepers (three- and four-wheel versions used in road construction activities), terminal trucks (specialized vehicle which moves freight in warehouses or intermodal yards and ports), Type A school buses (small school bus built on commercial chassis), and mobility vans (mini-van converted to be utilized by wheelchair passengers). Within each market segment, we produce a large number of customized configurations to address the diverse needs of our customers.
55
Table of Contents
Our Recreation segment serves the RV market through four principal brands: American Coach, Fleetwood RV, Monaco Coach and Holiday Rambler. We believe these brands are among the longest standing, most recognized brands in the RV industry. Prior to the 2008 recession, as segments of larger public companies, they generated over $2 billion of annual sales in each of the calendar years 2004 and 2005 and represented approximately 36% of the Class A market in calendar year 2005 and an even higher percentage share of just the diesel portion of the Class A market. Under these four brands, REV provides a variety of highly recognized models such as: American Eagle, Dynasty, Discovery, Bounder and Pace Arrow, among others. Our products in the Recreation segment currently include only Class A motorized RVs (motorhomes built on a heavy duty chassis with either diesel or gas engine configurations) and Class C motorized RVs (motorhomes built on a commercial truck or van chassis). The Recreation segment also includes Goldshield Fiberglass, which produces a wide range of custom molded fiberglass products for the RV and broader industrial markets. Within our Recreation segment, we are one of the top producers of Class A diesel and gas motorized RVs with a 14% market share as of October 2016 and we believe we are the fastest-growing participant in the market place based on market share, with our fiscal year 2016 unit sales growing 9% compared to fiscal year 2015. We are focused on recapturing the significant market share which our four principal brands enjoyed prior to 2008.
Factors Affecting Our Performance
The primary factors affecting our results of operations include:
General Economic Conditions
Our business is impacted by the U.S. economic environment, employment levels, consumer confidence, municipal spending, changes in interest rates and instability in securities markets around the world, among other factors. In particular, changes in the U.S. economic climate can impact demand in key end markets.
RV purchases are discretionary in nature and therefore sensitive to the availability of financing, consumer confidence, unemployment levels, levels of disposable income and changing levels of consumer home equity, among other factors. The 2008 recession caused consumers to reduce their discretionary spending, which negatively affected sales volumes for RVs. Terminal truck sales volumes are also impacted by economic conditions and industrial output, as these factors impact our end-market customers for these products, which include shipping ports, trucking/distribution hubs and rail terminal operators. Although RV and terminal truck sales have increased in recent years, these markets are affected by general U.S. and global economic conditions, which create risks that future economic downturns will further reduce consumer demand and negatively impact our sales.
While less economically sensitive than the Recreation segment, our Fire & Emergency and Commercial segments are also impacted by the overall economic environment. Local tax revenues are an important source of funding for fire and emergency response departments. Reduced municipal tax revenues resulting from the 2008 recession led to a decline in these markets. As fire and emergency products and school buses are typically a larger cost item for municipalities and their service life is relatively long, their purchase is more deferrable, which can result in reduced demand for our products.
A decrease in employment levels, consumer confidence or the availability of financing, or other adverse economic events, or the failure of actual demand for our products to meet our estimates, could negatively affect the demand for our products. Any decline in overall customer demand in markets in which we operate could have a material adverse effect on our operating performance.
Cost Management Initiatives
Our recent operating results reflect the impact of our ongoing initiatives to lower our operating costs to expand our margins. Purchased materials, including chassis, represent our largest component of costs of sales. We operate a centralized strategic procurement organization dedicated to reducing our overall level of materials spend across our three segments, while simplifying and standardizing suppliers and parts.
56
Table of Contents
Impact of Acquisitions
For the past several years, a significant component of our growth has been the addition of businesses or business units through acquisitions. We typically incur upfront costs as we integrate acquired businesses and implement our operating philosophy at newly acquired companies, including consolidation of supplies and materials, changes to production processes at acquired facilities to implement manufacturing improvements and other restructuring initiatives. The benefits of these integration efforts may not positively impact our financial results until subsequent periods. Operational and financial integration of our recently acquired businesses could be ongoing.
In accordance with GAAP, we recognize acquired assets and liabilities at fair value. This includes the recognition of identified intangible assets and goodwill which, in the case of definite-life intangible assets, are then amortized over their expected useful lives, which typically results in an increase in amortization expense. In addition, assets acquired and liabilities assumed generally includes tangible assets, as well as contingent assets and liabilities.
Our Fire & Emergency segment results for fiscal year 2016 include the results of KME since the date of its acquisition on April 22, 2016. Net sales and operating loss attributed to KME were $97.2 million and ($0.5) million, respectively, from April 22, 2016 through October 29, 2016. The operating loss is principally attributable to one-time integration costs and additional expenses resulting from purchase accounting adjustments required by GAAP.
Impact of Initial Public Offering
Prior to this offering, our stockholders were party to a shareholders agreement that will be amended and restated in its entirety. That shareholders agreement provided for, among other things, an employee stockholder to sell their stock back to the Company when he or she is terminated by the Company without cause or for good reason, death, disability, retirement or dissolution. This provision required us to recognize the value of these outstanding shares as temporary equity in our consolidated statement of operations, with changes in the fair value recorded as an adjustment to retained earnings. As of October 29, 2016, the fair value of our common stock held by employees subject to the shareholders agreement was $22.3 million. The aforementioned rights of the employee stockholder to sell his or her shares of common stock will lapse upon completion of an initial public offering and, as such, subsequent to this offering, those shares which are held by an employee and remain outstanding will be reclassified to shareholders’ equity on our consolidated statements of operations. The amended and restated shareholders agreement will not contain a similar right. See “Certain Relationships and Related Party Transactions—Amended and Restated Shareholders Agreement.”
Stock Compensation Expense
As of October 29, 2016, the Company had 1,955,240 stock options outstanding which will vest upon the completion of this offering. Of that total, 1,109,240 stock options have total unrecognized stock compensation expense of $3.9 million. The total stock compensation expense for these stock options is based upon the fair value on the date of grant and is amortized over the vesting period, and it is not impacted by the offering price of the Company’s common stock in this offering. As a result of this offering, outstanding stock options which had previously been recorded as a liability on the Company’s balance sheet will be reclassified to permanent equity. Concurrent with the completion of this offering, 846,000 of outstanding liability option awards will immediately vest, and, the vested portion of these outstanding options will be re-measured at fair value based upon the share price on the offering date. Based on the assumed initial public offering price of $20.00 per share, which is the midpoint of the price range set forth on the cover of this prospectus, the Company will record $15.2 million of non-recurring additional stock compensation expense. Each $1.00 increase or decrease in the assumed initial public offering price of $20.00 per share would increase or decrease this additional stock compensation expenses by approximately $1.5 million.
57
Table of Contents
Key Performance Indicators
In assessing the performance of our business, we consider a variety of operational and financial measures. These measures include net sales and units sold, selling, general and administrative expenses, Adjusted EBITDA and Adjusted Net Income. In assessing segment performance, our chief executive officer, as the chief operating decision maker, analyzes the primary financial measure of Adjusted EBITDA.
Net Sales and Units Sold
We evaluate net sales and units sold because it helps us measure the impact of economic trends, the effectiveness of our marketing, the response of customers to new product launches and model changes, and the effect of competition over a given period. We recognize revenue for sales of completed vehicles upon shipment or delivery and acceptance by the dealer or customer as specified by the relevant dealer or customer purchase order.
Our units present a wide range of products at various price points, with higher value-added units at higher price points typically resulting in higher gross margins. Additionally, large orders of similar units typically provide operational efficiencies that contribute to higher gross margins. As such, our management also utilizes unit volume sales mix to analyze our business.
Selling, General and Administrative Expenses
We evaluate our selling, general and administrative expenses in order to identify areas where we can create savings, such as third-party services cost reduction and process improvements. These expenses consist primarily of personnel costs, sales and marketing expenses, as well as other expenses associated with facilities unrelated to our supply chain network, internal management expenses and expenses for finance, information systems, legal, business development, human resources, purchasing and other administrative departments.
The components of our selling, general and administrative expenses may not be identical to those of our competitors. As a result, data in this prospectus regarding our operating and administrative expenses may not be comparable to similar expenses of our competitors. We expect that our selling, general and administrative expenses will increase in future periods due to additional legal, accounting, insurance and other expenses we expect to incur as a result of being a public company.
Adjusted EBITDA and Adjusted Net Income
Adjusted EBITDA and Adjusted Net Income are the primary metrics we use to evaluate the financial performance of our business. Adjusted EBITDA and Adjusted Net Income are also frequently used by analysts, investors and other interested parties to evaluate companies in our markets. We believe that Adjusted EBITDA and Adjusted Net Income are useful performance measures and we use them to facilitate a comparison of our operating performance on a consistent basis from period to period and to provide for a more complete understanding of factors and trends affecting our business. In addition to Adjusted EBITDA and Adjusted Net Income, we also utilize the metric of Adjusted EBITDA as a percentage of net sales as a complimentary measurement of performance among our businesses and versus our competitors. We also use Adjusted EBITDA and Adjusted Net Income as primary methods for planning and forecasting overall expected performance and for evaluating on a quarterly and annual basis actual results against such expectations, and as a performance evaluation metric in determining achievement of certain compensation programs and plans for employees, including our senior executives.
Adjusted EBITDA and Adjusted Net Income are not presentations made in accordance with GAAP, nor are they measures of financial condition or liquidity and they should not be considered as an alternative to net cash provided by (used in) operating activities or net income (loss), respectively, for the period determined in accordance with GAAP. See “Prospectus Summary—Summary Consolidated Financial Data” for a discussion of our use of Adjusted EBITDA and Adjusted Net Income in this prospectus.
58
Table of Contents
Results of Operations
Fiscal Year 2016 Compared to Fiscal Year 2015
| Fiscal Year Ended | Increase (Decrease) | |||||||||||||||
| October 29, 2016 | October 31, 2015 | $ | % | |||||||||||||
| ($ in thousands) | ||||||||||||||||
| Net sales |
$ | 1,925,999 | $ | 1,735,081 | $ | 190,918 | 11.0 | % | ||||||||
| Cost of sales |
1,696,068 | 1,553,127 | 142,941 | 9.2 | % | |||||||||||
|
|
|
|
|
|
|
|||||||||||
| Gross profit |
229,931 | 181,954 | 47,977 | 26.4 | % | |||||||||||
| Operating Expenses: |
||||||||||||||||
| Selling, general and administrative |
139,771 | 102,309 | 37,462 | 36.6 | % | |||||||||||
| Research and development costs |
4,815 | 5,106 | (291 | ) | (5.7 | %) | ||||||||||
| Restructuring |
3,521 | 3,869 | (348 | ) | (9.0 | %) | ||||||||||
| Amortization of intangibles |
9,423 | 8,586 | 837 | 9.7 | % | |||||||||||
|
|
|
|
|
|
|
|||||||||||
| Total operating expenses |
157,530 | 119,870 | 37,660 | 31.4 | % | |||||||||||
|
|
|
|
|
|
|
|||||||||||
| Operating income |
72,401 | 62,084 | 10,317 | 16.6 | % | |||||||||||
| Interest expense |
29,158 | 27,272 | 1,886 | 6.9 | % | |||||||||||
|
|
|
|
|
|
|
|||||||||||
| Income before provision for income taxes |
43,243 | 34,812 | 8,431 | 24.2 | % | |||||||||||
| Provision for income taxes |
13,050 | 11,935 | 1,115 | 9.3 | % | |||||||||||
|
|
|
|
|
|
|
|||||||||||
| Net income |
$ | 30,193 | $ | 22,877 | $ | 7,316 | 32.0 | % | ||||||||
|
|
|
|
|
|
|
|||||||||||
| Adjusted EBITDA |
$ | 127,203 | $ | 90,126 | $ | 37,077 | 41.1 | % | ||||||||
| Adjusted Net Income |
$ | 55,049 | $ | 34,017 | $ | 21,032 | 61.8 | % | ||||||||
Net Sales. Consolidated net sales were $1,926.0 million for fiscal year 2016, an increase of $190.9 million, or 11.0%, from $1,735.1 million for fiscal year 2015. The increase in consolidated net sales was primarily due to an increase in net sales of $147.9 million and $65.1 million in the Fire & Emergency and Recreation segments, respectively, offset by a decrease in net sales of $22.9 million in the Commercial segment. Increases in Fire & Emergency segment net sales were due to higher fire apparatus volumes, $97.2 million of net sales from KME, which was acquired in April 2016, and higher average selling prices for both fire apparatus and ambulances. Higher net sales in the Recreation segment were due to higher unit sales volumes primarily in its Class A diesel products. Lower Commercial segment net sales were primarily due to lower shuttle bus units shipped during fiscal year 2016.
Cost of Sales. Consolidated cost of sales as a percentage of net sales was 88.1% for fiscal year 2016 as compared to 89.5% for fiscal year 2015. The decrease in consolidated cost of sales, as a percentage of net sales, was primarily due to a decrease in cost of sales in the Fire & Emergency and Commercial segments, offset by an increase in cost of sales in the Recreation segment. The aggregate reduction in cost of sales for the Company was due to the enterprise-wide implementation of strategic price increases, net reductions in the costs of materials resulting from specific sourcing initiatives, and the benefits of higher unit sales volumes.
Gross Profit. Consolidated gross profit was $229.9 million for fiscal year 2016, an increase of $48.0 million, or 26.4% from $182.0 million for fiscal year 2015. Consolidated gross profit, as a percentage of net sales, was 11.9% and 10.5% for fiscal year 2016 and fiscal year 2015, respectively. The increase in gross profit, as a percentage of net sales, was due to the combination of higher net sales and lower cost of sales described above.
Selling, General and Administrative. Consolidated selling, general and administrative expenses were $139.8 million for fiscal year 2016, an increase of $37.5 million, or 36.6%, from $102.3 million for fiscal year 2015. Selling, general and administrative expenses, as a percentage of sales, were 7.3% and 5.9% for fiscal year 2016 and fiscal year 2015, respectively. The increase in selling, general and administrative expenses was due primarily to increased corporate and marketing expenses. In addition, selling, general and administrative
59
Table of Contents
expenses for fiscal year 2016 included $19.7 million of stock-based compensation expense, of which $10.3 million pertains to the acceleration and repurchase of outstanding options from former employees and $6.5 million pertains to the remeasurement of outstanding liability awards to fair value, which were required to be recorded at fair value as a result of becoming a public entity after the filing of this prospectus with the SEC.
Research and Development. Consolidated research and development costs for fiscal year 2016 were $4.8 million, a decrease of $0.3 million, or 5.7% from $5.1 million for fiscal year 2015. The reduction was largely due to the timing and mix of product development programs and testing, with higher spending in fiscal year 2015 for a fully redesigned terminal truck that was introduced to the market in 2015 and for the development of new RV models introduced in 2015 and 2016.
Restructuring. Consolidated restructuring costs were $3.5 million for fiscal year 2016, compared to $3.9 million in fiscal 2015. In the first quarter of fiscal year 2016, the Company restructured some of its management functions in the Fire & Emergency segment and initiated the relocation of its Corporate office from Orlando, Florida to Milwaukee, Wisconsin. In the fourth quarter of fiscal year 2016, the Company implemented a plan to relocate production of Goshen Coach buses from its Elkhart, Indiana facility to its facilities in Salina, Kansas and Imlay City, Michigan.
Amortization of Intangibles. Consolidated amortization of intangibles was $9.4 million for fiscal year 2016, compared to $8.6 million for fiscal year 2015. The increase in amortization expenses was due primarily to the amortization of the additional intangible assets recorded as part of the acquisition of KME in April 2016.
Interest Expense. Consolidated interest expense was $29.2 million and $27.3 million for fiscal year 2016 and fiscal year 2015, respectively. The increase in consolidated interest expense was due primarily to additional interest expense from our ABL Facility, which was primarily due to higher borrowings for capital expenditures and business acquisitions compared to the prior year.
Income Taxes. Consolidated income tax expense was $13.1 million in fiscal year 2016, an increase of $1.1 million compared to $11.9 million in fiscal year 2015. The effective income tax rate was 30.2% and 34.3% for fiscal year 2016 and fiscal year 2015, respectively. The decrease in the Company’s effective income tax rate for fiscal year 2016, relative to the prior fiscal year, related primarily to a discrete adjustment to deferred income tax balances. The adjustment was not material to the Company’s current or previously issued financial statements.
Net Income. Consolidated net income was $30.2 million for fiscal year 2016, an increase of $7.3 million, or 32.0% from $22.9 million for fiscal year 2015.
Adjusted EBITDA. Consolidated Adjusted EBITDA was $127.2 million for fiscal year 2016, an increase of $37.1 million, or 41.1%, from $90.1 million for fiscal year 2015. The increase in Adjusted EBITDA was primarily due to an increase in gross profit, offset partially by an increase in selling, general and administrative expenses.
Adjusted Net Income. Consolidated Adjusted Net Income was $55.0 million for fiscal year 2016, an increase of $21.0 million, or 61.8% from $34.0 million for fiscal year 2015. The increase in Adjusted Net Income was primarily due to an increase in gross profit, offset partially by an increase in selling, general and administrative expenses.
Fire & Emergency Segment
| Fiscal Years Ended | Increase (Decrease) | |||||||||||||||
| October 29, 2016 | October 31, 2015 | $ | % | |||||||||||||
| ($ in thousands) | ||||||||||||||||
| Net sales |
$ | 768,053 | $ | 620,161 | $ | 147,892 | 23.8 | % | ||||||||
| Adjusted EBITDA |
85,170 | 63,306 | 21,864 | 34.5 | % | |||||||||||
60
Table of Contents
Net Sales. Fire & Emergency segment net sales were $768.1 million for fiscal year 2016, an increase of $147.9 million, or 23.8%, from $620.2 million for fiscal year 2015. Net sales of fire apparatus increased $134.1 million compared to the prior year, due primarily to net sales of $97.2 million from KME, which was acquired in April 2016, net sales of $38.3 million from the Hall-Mark RTC, which was acquired in November 2015, and a larger mix of higher content units from our legacy fire business. Net sales of ambulance units increased $13.8 million compared to the prior year due primarily to sales mix of higher content units, offset by lower unit volume. In addition, net sales across all Fire & Emergency products increased due to the implementation of strategic price increases for certain models and markets.
Adjusted EBITDA. Fire & Emergency segment Adjusted EBITDA was $85.2 million for fiscal year 2016, an increase of $21.9 million, or 34.5%, from $63.3 million for fiscal year 2015. The increase in Adjusted EBITDA was primarily due to increased average realized pricing, procurement initiatives and other operational improvements, as well as increased net sales from the acquired KME and the Hall-Mark RTC businesses, which was partially offset by (i) reduced units shipped compared to the prior year and (ii) an increase in selling, general and administrative expenses.
Commercial Segment
| Fiscal Years Ended | Increase (Decrease) | |||||||||||||||
| October 29, 2016 | October 31, 2015 | $ | % | |||||||||||||
| ($ in thousands) | ||||||||||||||||
| Net sales |
$ | 679,033 | $ | 701,980 | $ | (22,947 | ) | (3.3 | )% | |||||||
| Adjusted EBITDA |
53,414 | 39,095 | 14,319 | 36.6 | % | |||||||||||
Net Sales. Commercial segment net sales were $679.0 million for fiscal year 2016, a decrease of $22.9 million, or 3.3%, from $702.0 million for fiscal year 2015. The decrease in net sales was due primarily to a decrease in shuttle bus unit volume due to selective bid participation, partially offset by higher sales of Type A school buses and transit buses compared to the prior year. This was also partially offset by higher average realized pricing compared to the prior year.
Adjusted EBITDA. Commercial segment Adjusted EBITDA was $53.4 million for fiscal 2016, an increase of $14.3 million, or 36.6%, from $39.1 million for fiscal 2015. The increase in Adjusted EBITDA was primarily due to increased average realized pricing and lower material costs, as well as lower selling, general and administrative expenses, which was partially offset by reduced unit volume compared to the prior year.
Recreation Segment
| Fiscal Years Ended | Increase (Decrease) | |||||||||||||||
| October 29, 2016 | October 31, 2015 | $ | % | |||||||||||||
| ($ in thousands) | ||||||||||||||||
| Net sales |
$ | 478,071 | $ | 412,940 | $ | 65,131 | 15.8 | % | ||||||||
| Adjusted EBITDA |
11,005 | 1,507 | 9,498 | 630.3 | % | |||||||||||
Net Sales. Recreation segment net sales were $478.1 million for fiscal year 2016, an increase of $65.1 million, or 15.8%, from $412.9 million for fiscal year 2015. The increase in net sales was due primarily to an increase in Class A diesel and Class C units sold compared to the prior year due to greater end market demand and lower net sales from the intentional slowdown in production in the prior year. This was partially offset by fewer units sold of Class A gas models compared to the prior year.
Adjusted EBITDA. Recreation segment Adjusted EBITDA was $11.0 million for fiscal year 2016, an increase of $9.5 million, or 630.3%, from $1.5 million for fiscal year 2015. The increase in Adjusted EBITDA was primarily due to an increase in unit volume, benefits from procurement initiatives and lower sales discounting, partially offset by (i) the increase in cost of sales as a percentage of net sales due to product mix and (ii) an increase in selling, general and administrative expenses.
61
Table of Contents
Fiscal Year 2015 Compared to Fiscal Year 2014
| Fiscal Year Ended October 31, |
Increase (Decrease) | |||||||||||||||
| 2015 | 2014 | $ | % | |||||||||||||
| ($ in thousands) | ||||||||||||||||
| Net sales |
$ | 1,735,081 | $ | 1,721,116 | $ | 13,965 | 0.8 | % | ||||||||
| Cost of sales |
1,553,127 | 1,557,877 | (4,750 | ) | (0.3 | )% | ||||||||||
|
|
|
|
|
|
|
|||||||||||
| Gross profit |
181,954 | 163,239 | 18,715 | 11.5 | % | |||||||||||
| Operating Expenses: |
||||||||||||||||
| Selling, general and administrative |
102,309 | 111,820 | (9,511 | ) | (8.5 | )% | ||||||||||
| Research and development costs |
5,106 | 8,275 | (3,169 | ) | (38.3 | )% | ||||||||||
| Restructuring |
3,869 | 3,376 | 493 | 14.6 | % | |||||||||||
| Amortization of intangibles |
8,586 | 8,790 | (204 | ) | (2.3 | )% | ||||||||||
|
|
|
|
|
|
|
|||||||||||
| Total operating expenses |
119,870 | 132,261 | (12,391 | ) | (9.4 | )% | ||||||||||
|
|
|
|
|
|
|
|||||||||||
| Operating income |
62,084 | 30,978 | 31,106 | 100.4 | % | |||||||||||
| Interest expense |
27,272 | 26,195 | 1,077 | 4.1 | % | |||||||||||
|
|
|
|
|
|
|
|||||||||||
| Income before provision for income taxes |
34,812 | 4,783 | 30,029 | 627.8 | % | |||||||||||
| Provision for income taxes |
11,935 | 3,295 | 8,640 | 262.2 | % | |||||||||||
|
|
|
|
|
|
|
|||||||||||
| Net income |
$ | 22,877 | $ | 1,488 | $ | 21,389 | 1437.4 | % | ||||||||
|
|
|
|
|
|
|
|||||||||||
| Adjusted EBITDA |
$ | 90,126 | $ | 61,513 | $ | 28,613 | 46.5 | % | ||||||||
| Adjusted Net Income |
$ | 34,017 | $ | 14,457 | $ | 19,560 | 135.3 | % | ||||||||
Net Sales. Consolidated net sales in fiscal year 2015 were $1,735.1 million, an increase of $14.0 million, or 0.8%, compared to $1,721.1 million in fiscal year 2014. The increase in consolidated net sales was due to an increase in net sales in the Fire & Emergency and Commercial segments, offset by a decrease in net sales in the Recreation segment. Higher Fire & Emergency net sales were due to higher fire apparatus volumes and higher average selling prices of ambulance units. Higher Commercial net sales were due to higher unit volumes and lower Recreation segment net sales were due to lower unit volumes. Both the Fire & Emergency segment and the Commercial segment net sales were also higher in fiscal year 2015 due to the impact of targeted price increases for certain models and in certain markets.
Cost of Sales. Consolidated cost of sales as a percentage of net sales was 89.5% in fiscal year 2015 as compared to 90.5% in fiscal year 2014. Cost of sales includes inventory obsolescence reserves of $0.8 million and $4.1 million in fiscal year 2015 and fiscal year 2014, respectively, which were due to restructuring of product lines in the Recreation segment. The decrease in consolidated cost of sales, as a percentage of net sales, was primarily due to a reduction of cost of sales, as a percentage of net sales in the Fire & Emergency and Commercial segments, offset by an increase in the Recreation segment. Overall the lower cost of sales as a percentage of net sales in fiscal year 2015 compared to fiscal year 2014 was due to the impact of higher selling prices, product sales mix shift toward higher value added content vehicles and lower cost of materials.
Gross Profit. Consolidated gross profit in fiscal year 2015 was $182.0 million, an increase of $18.7 million, or 11.5%, compared to $163.2 million in fiscal year 2014. The increase in consolidated gross profit was due to an increase in gross profit in the Fire & Emergency and Commercial segments, offset by a decrease in gross profit in the Recreation segment. The increase in gross profit was the result of the decreases in cost of sales as a percentage of net sales described above.
Selling, General and Administrative. Consolidated selling, general and administrative expenses were $102.3 million in fiscal year 2015, a decrease of $9.5 million, or 8.5%, compared to $111.8 million in fiscal year 2014. The decrease in selling, general and administrative expenses was mainly due to reduced costs associated
62
Table of Contents
with the acquired RV brands as compared to fiscal year 2014, and due to lower incentive compensation expense. Selling, general and administrative expenses, as a percentage of net sales, were 5.9% and 6.5% in fiscal year 2015 and fiscal year 2014, respectively.
Research and Development. Consolidated research and development costs were $5.1 million in fiscal year 2015, a decrease of $3.2 million, or 38.3%, compared to $8.3 million in fiscal year 2014. The decrease was primarily due to fewer research and development costs in fiscal year 2015 associated with the redesign of acquired RV brands and new products which were launched during fiscal year 2015.
Restructuring. Consolidated restructuring costs were $3.9 million in fiscal year 2015 related to a Company-wide restructuring of management functions and product lines within the Commercial and Recreation segments as well as Corporate. Restructuring costs were $3.4 million in fiscal year 2014 related to the Company’s exit from the non-motorized towable RV market associated with the relocation of the remaining MRV operations from Elkhart, Indiana to our Decatur, Indiana facilities.
Amortization of Intangibles. Consolidated amortization of intangible assets expense was $8.6 million in fiscal year 2015, compared to $8.8 million in fiscal year 2014.
Operating Income. Consolidated operating income was $62.1 million in fiscal year 2015, an increase of $31.1 million, or 100.4%, compared to $31.0 million in fiscal year 2014. The growth in operating income was the result of the increase in gross profits and reduction in operating expenses described above.
Interest Expense. Consolidated interest expense was $27.3 million in fiscal year 2015, an increase of $1.1 million, or 4.1%, compared to $26.2 million in fiscal year 2014. The increase in interest expense was due primarily to increased interest on vehicle chassis purchases and interest paid on customer deposits in the Fire & Emergency segment.
Income Taxes. Consolidated income tax expense was $11.9 million in fiscal year 2015, an increase of $8.6 million compared to $3.3 million in fiscal year 2014. The effective income tax rate was 34.3% and 68.9% for fiscal year 2015 and fiscal year 2014, respectively. The decrease in the Company’s effective income tax rate for fiscal year 2015, relative to the prior fiscal year, related primarily to non-deductible transaction costs associated with business acquisitions.
Net Income. Consolidated net income for fiscal year 2015 was $22.9 million, an increase of $21.4 million, or 1437.4% from $1.5 million in fiscal year 2014.
Adjusted EBITDA. Consolidated Adjusted EBITDA was $90.1 million in fiscal year 2015, an increase of $28.6 million, or 46.5%, from $61.5 million in fiscal year 2014. The increase in Adjusted EBITDA was due primarily to an increase in gross profit.
Adjusted Net Income. Consolidated Adjusted Net Income was $34.0 million for fiscal year 2015, an increase of $19.6 million, or 135.3%, from $14.5 million in fiscal year 2014. The increase in Adjusted Net Income was due primarily to an increase in gross profit.
Fire & Emergency Segment
| Fiscal Year Ended October 31, | Increase (Decrease) | |||||||||||||||
| 2015 | 2014 | $ | % | |||||||||||||
| ($ in thousands) | ||||||||||||||||
| Net sales |
$ | 620,161 | $ | 567,714 | $ | 52,447 | 9.2 | % | ||||||||
| Adjusted EBITDA |
63,306 | 37,544 | 25,762 | 68.6 | % | |||||||||||
63
Table of Contents
Net Sales. Fire & Emergency segment net sales for fiscal year 2015 were $620.2 million, an increase of $52.4 million, or 9.2%, compared to $567.7 million in fiscal year 2014. Net sales of ambulances increased 15.5% as a result of stronger sales volume and higher average selling prices. Net sales of fire apparatus decreased 2.8% compared to fiscal year 2014, due to lower unit volume, offset by an increase in sales mix of units shipped in fiscal year 2015 with higher value-added content and higher average selling prices.
Adjusted EBITDA. Fire & Emergency segment Adjusted EBITDA was $63.3 million in fiscal year 2015, an increase of $25.8 million, or 68.6%, from $37.5 million in fiscal year 2014. The increase in Adjusted EBITDA was due primarily to higher unit volumes, higher prices and improved production efficiency in our ambulance operations as well as benefits from cost reduction initiatives and reduction in selling, general and administrative expenses.
Commercial Segment
| Fiscal Year Ended October 31, | Increase (Decrease) | |||||||||||||||
| 2015 | 2014 | $ | % | |||||||||||||
| ($ in thousands) | ||||||||||||||||
| Net sales |
$ | 701,980 | $ | 654,432 | $ | 47,548 | 7.3 | % | ||||||||
| Adjusted EBITDA |
39,095 | 34,273 | 4,822 | 14.1 | % | |||||||||||
Net Sales. Commercial segment net sales were $702.0 million in fiscal year 2015, an increase of $47.5 million, or 7.3%, compared to $654.4 million in fiscal year 2014. The increase compared to the prior year was due to an increase in unit volume and an increase in average selling prices across the product portfolio.
Adjusted EBITDA. Commercial segment Adjusted EBITDA was $39.1 million in fiscal year 2015, an increase of $4.8 million, or 14.1%, from $34.3 million in fiscal year 2014. The increase in Adjusted EBITDA was due primarily to the combination of increased unit volumes, higher average selling prices and lower production costs due to the results of cost reduction initiatives, partially offset by an increase in selling, general and administrative expenses.
Recreation Segment
| Fiscal Year Ended October 31, | Increase (Decrease) | |||||||||||||||
| 2015 | 2014 | $ | % | |||||||||||||
| ($ in thousands) | ||||||||||||||||
| Net sales |
$ | 412,940 | $ | 498,970 | $ | (86,030 | ) | (17.2 | )% | |||||||
| Adjusted EBITDA |
1,507 | 2,001 | (494 | ) | (24.7 | )% | ||||||||||
Net Sales. Recreation segment net sales were $412.9 million in fiscal year 2015, a decrease of $86.0 million, or 17.2%, compared to $499.0 million in fiscal year 2014. The decrease was primarily due to the discontinuation of certain non-motorized towable RVs, which represented a sales decrease of $15.1 million, and the slowdown of production in the second and third quarters of fiscal year 2015, which was partially offset by an increase in average selling prices resulting from the change in product mix to motorized RVs only, compared to a mix of motorized and towables in fiscal year 2014.
Adjusted EBITDA. Recreation segment Adjusted EBITDA was $1.5 million in fiscal year 2015, a decrease of $0.5 million, or 24.7%, from $2.0 million in fiscal year 2014. The decrease in Adjusted EBITDA was due primarily to a decrease in unit volume and an increase in selling, general and administrative expenses, as a result of higher costs related to new product introductions and $4.1 million of product discontinuation costs related to our exit from the towable RV business.
64
Table of Contents
Backlog
Backlog represents orders received from dealers or directly from end customers. Backlog does not include purchase options or verbal orders. The following table presents a summary of our backlog by segment:
| Increase (Decrease) | ||||||||||||||||
| ($ in thousands) | October 29, 2016 | October 31, 2015 | $ | % | ||||||||||||
| Fire & Emergency |
$ | 550,769 | $ | 339,773 | $ | 210,996 | 62.1 | % | ||||||||
| Commercial |
226,067 | 242,161 | (16,094 | ) | (6.6 | )% | ||||||||||
| Recreation |
80,420 | 120,905 | (40,485 | ) | (33.5 | )% | ||||||||||
|
|
|
|
|
|
|
|||||||||||
| Total Backlog |
$ | 857,256 | $ | 702,839 | $ | 154,417 | 22.0 | % | ||||||||
|
|
|
|
|
|
|
|||||||||||
Each of our three segments has a backlog of new vehicle orders that generally extends out from two to nine months in duration. Our businesses take orders from our dealers and end customers that are evidenced by a firm purchase order for delivery of one or many specialty vehicles with a given specification over a period of time. These firm orders are placed in our backlog and reported at the aggregate selling prices, net of discounts or allowances, at the time the purchase order is received. We do not include verbal commitments or promised orders in our reported backlog. As of October 29, 2016, our backlog was $857.3 million compared to $702.8 million as of October 31, 2015. The increase in backlog was partially due to the backlog acquired with KME. We expect that our current backlog will be produced and sold within the 12 months following October 29, 2016, which was the end of our most recent fiscal year.
65
Table of Contents
Quarterly Results of Operations
The following table sets forth selected unaudited quarterly statement of operations data for each of the quarters in the fiscal years 2016 and 2015. The information for each of these quarters has been prepared on the same basis as our audited financial statements included elsewhere in this prospectus and, in the opinion of management, includes all adjustments, which include only normal recurring adjustments, necessary for the fair presentation of the results of operations for these periods in accordance with GAAP. This data should be read in conjunction with our audited and unaudited financial statements and related notes included elsewhere in this prospectus. This quarterly operating results are not necessarily indicative of our operating results for a full year or any future period.
| Quarter Ended | ||||||||||||||||||||||||||||||||
| (in thousands) | October 29, 2016 |
July 30, 2016 |
April 30, 2016 |
January 30, 2016 |
October 31, 2015 |
August 1, 2015 |
May 2, 2015 |
January 31, 2015 |
||||||||||||||||||||||||
| Net sales |
$ | 544,752 | $ | 528,238 | $ | 480,229 | $ | 372,780 | $ | 463,028 | $ | 450,343 | $ | 438,158 | $ | 383,552 | ||||||||||||||||
| Cost of sales |
472,433 | 464,285 | 421,509 | 337,841 | 407,345 | 401,935 | 394,147 | 349,700 | ||||||||||||||||||||||||
|
|
|
|
|
|
|
|
|
|
|
|
|
|
|
|
|
|||||||||||||||||
| Gross profit |
72,319 | 63,953 | 58,720 | 34,939 | 55,683 | 48,408 | 44,011 | 33,852 | ||||||||||||||||||||||||
|
|
|
|
|
|
|
|
|
|
|
|
|
|
|
|
|
|||||||||||||||||
| Operating expense |
||||||||||||||||||||||||||||||||
| Selling, general and administrative |
41,870 | 35,481 | 35,314 | 27,106 | 26,868 | 24,584 | 27,833 | 23,024 | ||||||||||||||||||||||||
| Research and development costs |
1,052 | 1,330 | 1,294 | 1,139 | 362 | 1,485 | 1,678 | 1,581 | ||||||||||||||||||||||||
| Restructuring costs |
714 | 57 | (215 | ) | 2,965 | 601 | 909 | 2,359 | — | |||||||||||||||||||||||
| Amortization of intangible assets |
2,475 | 2,505 | 2,200 | 2,243 | 2,160 | 2,148 | 2,148 | 2,130 | ||||||||||||||||||||||||
|
|
|
|
|
|
|
|
|
|
|
|
|
|
|
|
|
|||||||||||||||||
| Total operating expenses |
46,111 | 39,373 | 38,593 | 33,453 | 29,991 | 29,126 | 34,018 | 26,735 | ||||||||||||||||||||||||
|
|
|
|
|
|
|
|
|
|
|
|
|
|
|
|
|
|||||||||||||||||
| Interest expense |
8,331 | 7,364 | 6,776 | 6,687 | 6,416 | 6,722 | 7,114 | 7,020 | ||||||||||||||||||||||||
|
|
|
|
|
|
|
|
|
|
|
|
|
|
|
|
|
|||||||||||||||||
| Income (loss) before provision for income taxes |
17,877 | 17,216 | 13,351 | (5,201 | ) | 19,276 | 12,560 | 2,879 | 97 | |||||||||||||||||||||||
| Provision (benefit) for income taxes |
5,796 | 4,136 | 5,309 | (2,191 | ) | 6,766 | 4,286 | 1,067 | (184 | ) | ||||||||||||||||||||||
|
|
|
|
|
|
|
|
|
|
|
|
|
|
|
|
|
|||||||||||||||||
| Net income (loss) |
12,081 | 13,080 | 8,042 | (3,010 | ) | 12,510 | 8,274 | 1,812 | 281 | |||||||||||||||||||||||
| Depreciation and amortization |
7,478 | 6,856 | 5,387 | 4,872 | 4,853 | 4,723 | 4,762 | 4,746 | ||||||||||||||||||||||||
| Interest expense |
8,331 | 7,364 | 6,776 | 6,687 | 6,416 | 6,722 | 7,114 | 7,020 | ||||||||||||||||||||||||
| Provision (benefit) for income taxes |
5,796 | 4,136 | 5,309 | (2,191 | ) | 6,766 | 4,286 | 1,067 | (184 | ) | ||||||||||||||||||||||
|
|
|
|
|
|
|
|
|
|
|
|
|
|
|
|
|
|||||||||||||||||
| EBITDA |
33,686 | 31,436 | 25,514 | 6,358 | 30,545 | 24,005 | 14,755 | 11,863 | ||||||||||||||||||||||||
| Transaction expenses(a) |
48 | 196 | 1,385 | — | — | — | — | — | ||||||||||||||||||||||||
| Sponsor expenses(b) |
69 | 25 | 100 | 25 | 504 | 40 | 200 | 325 | ||||||||||||||||||||||||
| Restructuring costs(c) |
714 | 57 | (215 | ) | 2,965 | 602 | 909 | 3,141 | — | |||||||||||||||||||||||
| Stock-based compensation expense(d) |
7,394 | 1,052 | 5,563 | 5,683 | 475 | 1,464 | 897 | 401 | ||||||||||||||||||||||||
| Non-cash purchase accounting(e) |
73 | 697 | — | — | — | — | — | — | ||||||||||||||||||||||||
| Impact of KME acquisition(f) |
— | — | 2,426 | 1,952 | N/A | N/A | N/A | N/A | ||||||||||||||||||||||||
|
|
|
|
|
|
|
|
|
|
|
|
|
|
|
|
|
|||||||||||||||||
| Adjusted EBITDA |
$ | 41,984 | $ | 33,463 | $ | 34,773 | $ | 16,983 | $ | 32,126 | $ | 26,418 | $ | 18,993 | $ | 12,589 | ||||||||||||||||
|
|
|
|
|
|
|
|
|
|
|
|
|
|
|
|
|
|||||||||||||||||
| (a) | Reflects costs incurred in connection with business acquisitions. |
| (b) | Reflects the reimbursement of expenses to AIP, the Company’s primary equity holder. |
| (c) | Restructuring costs are related to the Company’s restructuring of its management functions (including the move of its corporate headquarters from Orlando, Florida to Milwaukee, Wisconsin) and various product lines including, but not |
66
Table of Contents
| limited to, severance and discontinued product costs. Restructuring costs also include personnel costs including severance, stay bonuses, vacation and other benefits, and inventory obsolescence reserves for discontinued product lines, which are recognized as a component of cost of sales in the Company’s consolidated statements of operations. In addition, during the fourth quarter of fiscal year 2016, the Company implemented a plan to relocate production of Goshen Coach buses from its Elkhart, Indiana facility to its facilities in Salina, Kansas and Imlay City, Michigan. In connection with this plan, the Company incurred $0.7 million of costs related to severance and relocation costs during fiscal year 2016. The Company expects to recognize additional restructuring costs related to the completion of this plan in fiscal year 2017. |
| The nature and amount of such restructuring costs vary significantly based on the number of completed acquisitions and the size and timing of related and other restructuring programs. By excluding the referenced expenses from the Company’s non-GAAP financial measures, management is able to further evaluate the Company’s ability to utilize existing assets and estimate their long-term value. Furthermore, management believes that the adjustment of these items are useful to investors by supplementing the GAAP information with an additional measure that can be used to assess the Company’s operating performance. |
| (d) | Reflects expenses associated with stock-based compensation. For fiscal year 2016, stock-based compensation expense included $10.3 million for the accelerated vesting of stock options held by former employees, which were subsequently redeemed for cash. Approximately $6.5 million of stock-based compensation for fiscal year 2016 related to the non-cash remeasurement of outstanding liability awards to fair value. The remeasurement of the liability awards was required as a result of the Company becoming a public entity after the filing of this prospectus with the SEC. The remaining stock-based compensation expense of $2.9 million for fiscal year 2016 was a non-cash charge for stock options vesting on their normal vesting schedule that were not repurchased by us as described above. Except for the additional non-cash stock compensation expense which will be recognized concurrently with the immediate vesting of stock options as a result of this offering, we do not expect that such accelerated vesting, the remeasurement of outstanding liability awards and repurchase of outstanding stock options will be an ongoing cost following completion of this offering. For this reason, following the completion of this offering, we expect substantially all of our stock-based compensation expense to be a non-cash expense that follows a normal vesting schedule. |
| (e) | For fiscal year 2016, reflects the amortization of the difference between the book value and fair market value of certain acquired inventory which was sold. |
| (f) | Reflects management’s estimate of the Adjusted EBITDA of KME for the period of time from the beginning of the Company’s fiscal year 2016 through the date of acquisition in April 2016. |
Liquidity and Capital Resources
General
Our primary requirements for liquidity and capital are working capital, inventory management, acquiring machinery and equipment, acquiring and building manufacturing facilities, the improvement and expansion of existing manufacturing facilities, debt service and general corporate needs. Historically, these cash requirements have been met through cash provided by operating activities, cash and cash equivalents and borrowings under our ABL Facility.
Additional future liquidity needs will include public company costs and the payment of cash dividends on our common stock. After completion of this offering, we intend to make a regular quarterly cash distribution to holders of our common stock, subject to the discretion of our Board of Directors. Our dividend policy has certain risks and limitations, particularly with respect to liquidity, and we may not pay dividends according to our policy, or at all. See “Dividend Policy” and “Risk Factors—Risks Relating to Our Common Stock and This Offering—We cannot assure you that we will declare dividends or have sufficient funds to pay dividends on our common stock.”
We believe that our sources of liquidity and capital will be sufficient to finance our continued operations, growth strategy, cash dividends (as described under “Dividend Policy”) and additional expenses we expect to incur as a public company in both the near term and on a long-term basis. However, we cannot assure you that our cash provided by operating activities, cash and cash equivalents or cash available under our ABL Facility will be sufficient to meet our future needs. If we are unable to generate sufficient cash flows from operations in the future, and if availability under our ABL Facility is not sufficient due to the size of our borrowing base or other external factors, we may have to obtain additional financing. If we obtain additional capital by issuing equity, the interests of our existing stockholders will be diluted. If we incur additional indebtedness, that indebtedness may contain significant financial and other covenants that may significantly restrict our operations.
67
Table of Contents
We cannot assure you that we will be able to obtain refinancing or additional financing on favorable terms or at all. See “Risk Factors—Risks Relating to Our Business—Our business has meaningful working capital requirements, and a decline in access to financing or operating results may have an adverse impact on our liquidity position.”
Working capital at October 29, 2016 was $198.1 million compared to $218.8 million at October 31, 2015. The decrease in working capital was primarily driven by higher accounts payable due to the timing of payments and the reclassification of deferred tax assets resulting from a current year accounting policy adoption, offset by the seasonal increase in accounts receivable and the impact of the KME acquisition.
Long-term debt, excluding current maturities, at October 29, 2016 was $256.0 million compared to $212.4 million at October 31, 2015. Long-term debt increased primarily due to borrowings under the ABL Facility for cash used in business acquisitions as well as higher capital expenditures in fiscal year 2016.
Cash Flow
The following table shows summary cash flows for fiscal years 2016, 2015 and 2014:
| Fiscal Year Ended, | ||||||||||||
| (in thousands) | October 29, 2016 |
October 31, 2015 |
October 31, 2014 |
|||||||||
| Net cash provided by operating activities |
$ | 75,570 | $ | 25,639 | $ | 5,929 | ||||||
| Net cash used in investing activities |
(84,430 | ) | (15,617 | ) | (12,820 | ) | ||||||
| Net cash provided by (used in) financing activities |
14,713 | (17,573 | ) | 1,385 | ||||||||
| Net increase (decrease) in cash and cash equivalents |
$ | 5,853 | $ | (7,551 | ) | $ | (5,506 | ) | ||||
|
|
|
|
|
|
|
|||||||
Net Cash Provided by Operating Activities
Net cash provided by operating activities for fiscal year 2016 was $75.6 million compared to $25.6 million in fiscal year 2015. The increase in cash provided by activities was due to an increase in operating income in fiscal year 2016 as well as increase cash flows for accounts payable and other liabilities, partially offset by reduced cash flows for accounts receivable and inventories. Operating income increased $10.3 million, which was due to higher gross margin offset by increased corporate and marketing expenses. The increase in cash flows for accounts payable was due to timing of vendor payments. The increase in other liabilities was due to the timing of payments for payroll and related benefits and incentive compensation and income tax payments, as the Company’s accruals for these expenses at the end of fiscal year 2016 were $20.5 million higher than the prior year. The reduced cash flows for accounts receivable was primarily due to increased sales in the fourth quarter of fiscal year 2016, which were $81.7 million higher than the comparable prior year period, and timing of customer payments. The increase in inventory was due primarily to a higher backlog, which increased $154.4 million compared to the prior year.
Net cash provided by operating activities for fiscal year 2015 was $25.6 million, compared to $5.9 million in fiscal year 2014. The increase in cash provided by operating activities was primarily due to a significant increase in operating income, higher accounts receivable and the timing impact of the very late fiscal year 2013 acquisition of Thor Bus. These factors were offset partially by timing of payments for accounts payable and the semi-annual interest payment on our Senior Secured Notes due November 1 each year.
Net Cash Used in Investing Activities
Net cash used in investing activities in fiscal year 2016 was $84.4 million, compared to $15.6 million for fiscal year 2015. The increase was primarily due to payments for business acquisitions and higher capital expenditures during fiscal year 2016.
68
Table of Contents
Net cash used in investing activities for fiscal year 2015 was $15.6 million, which consisted primarily of capital expenditures of $15.4 million.
Net cash used in investing activities for fiscal year 2014 was $12.8 million, which consisted of $12.1 million of capital expenditures and $5.0 million of payments for consideration for the Thor Bus Acquisition, offset by proceeds of $4.3 million from the sale of property, plant and equipment.
Net Cash Provided by (Used in) Financing Activities
Net cash provided by financing activities for fiscal year 2016 was $14.7 million, which primarily consisted of net borrowings from our ABL Facility, offset partially by $21.7 million of payments to redeem common stock.
Net cash used in financing activities for fiscal year 2015 was $17.6 million, which primarily consisted of net repayments of our ABL Facility and payments to redeem common stock, offset partially by the net proceeds of sales of our common stock.
Net cash provided by financing activities for fiscal year 2014 was $1.4 million, which primarily consisted of net proceeds from the issuance of our common stock and net borrowings under our ABL Facility, offset partially by payments to redeem common stock.
Senior Secured Notes
We intend to redeem in full the outstanding aggregate principal amount of Senior Secured Notes with a portion of the proceeds from this offering. See “Use of Proceeds.”
ABL Facility
On October 21, 2013, we entered into a $150.0 million senior secured asset based lending revolving credit and guaranty agreement (the “ABL Facility”) with a syndicate of lenders. The ABL Facility consists of: (i) revolving loans, (ii) swing line loans and (iii) letters of credit, aggregating up to a combined maximum of $150.0 million. The total amount borrowed is subject to a $15.0 million sublimit for swing line loans and a $25.0 million sublimit for letters of credit, along with certain borrowing base and other customary restrictions as defined in the agreement. On April 22, 2016, the Company exercised its $50.0 million incremental commitment option under the ABL Facility in conjunction with the acquisition of KME. On August 19, 2016, the Company amended the ABL Facility to increase the commitment from $200.0 million to $300.0 million to provide flexibility and access to the suppressed borrowing base. All other terms and conditions of the ABL Facility remained unchanged.
The ABL Facility contains certain financial covenants. The Company was in compliance with all financial covenants under the ABL Facility as of October 29, 2016.
We intend to repay up to $39.3 million aggregate principal amount of loans under ABL Facility, plus accrued and unpaid interest thereon, with a portion of the proceeds from this offering. See “Use of Proceeds” and “Description of Indebtedness.”
69
Table of Contents
Contractual Obligations
The following table of material debt and lease commitments at October 29, 2016 summarizes the effect these obligations are expected to have on our cash flows in the future periods as set forth in the table below:
| (in thousands) | 2017 | 2018 | 2019 | 2020 | 2021 | Thereafter | Total | |||||||||||||||||||||
| Long-term debt(1) |
$ | — | $ | 80,000 | $ | 180,000 | $ | — | $ | — | $ | — | $ | 260,000 | ||||||||||||||
| Interest(2) |
15,962 | 15,300 | 15,300 | — | — | — | 46,562 | |||||||||||||||||||||
| Operating leases |
2,471 | 2,164 | 1,834 | 1,370 | 1,090 | 836 | 9,765 | |||||||||||||||||||||
| Purchasing obligations |
1,687 | — | — | — | — | — | 1,687 | |||||||||||||||||||||
| Other |
1,044 | 1,096 | 592 | 507 | 472 | — | 3,712 | |||||||||||||||||||||
|
|
|
|
|
|
|
|
|
|
|
|
|
|
|
|||||||||||||||
| Total commitments(3) |
$ | 21,164 | $ | 98,560 | $ | 197,726 | $ | 1,877 | $ | 1,562 | $ | 836 | $ | 321,726 | ||||||||||||||
|
|
|
|
|
|
|
|
|
|
|
|
|
|
|
|||||||||||||||
| (1) | Includes estimated principal payments due under our ABL Facility and our Senior Secured Notes. We intend to (i) redeem in full the outstanding Senior Secured Notes and (ii) repay up to $39.3 million aggregate principal amount of loans under the ABL Facility, in each case, with a portion of the proceeds from this offering. See “Use of Proceeds.” |
| (2) | Based on interest rates in effect as of October 29, 2016. |
| (3) | Unrecognized tax benefits totaling $2.7 million as of October 29, 2016, excluding related interests and penalties, are not included in the table because the timing of their resolution cannot be estimated. See Note 17 to our audited consolidated financial statements appearing elsewhere in this prospectus for disclosures regarding uncertain income tax positions under ASC Topic 740. |
Off-Balance Sheet Arrangements
We have not created, and are not party to, any special-purpose or off-balance sheet entities for the purpose of raising capital, incurring debt or operating our business. With the exception of operating lease obligations, we do not have any off-balance sheet arrangements or relationships with entities that are not consolidated into or disclosed in our consolidated financial statements that have, or are reasonably likely to have, a material current or future effect on our financial condition, revenues, expenses, results of operations, liquidity, capital expenditures and capital resources. In addition, we do not engage in trading activities involving non-exchange traded contracts.
Seasonality
In a typical year, our operating results are impacted by seasonality. Historically the slowest quarters have been the first and second fiscal quarters when the purchasing seasons for vehicles such as school buses, RVs and sweepers are the lowest due to the colder weather and the relatively long time until summer vacation season, and the school year is underway with municipalities and school bus contractors utilizing their existing fleets to transport student populations. Sales of our products have typically been higher in the third and fourth fiscal quarters due to better weather, the vacation season, buying habits of RV dealers and end-users and the beginning of a new school year. Sales and earnings for other vehicles that we produce, such as essential emergency vehicles and commercial bus fleets, are less seasonal, but fluctuations in sales of these vehicles can also be impacted by timing surrounding the fiscal years of municipalities and commercial customers, as well as the timing and amounts of multi-unit larger orders. See “Risk Factors—Risks Relating to Our Business—Some of the markets in which we compete are seasonal, which results in fluctuations in sales and results of operations.”
Quantitative and Qualitative Disclosures About Market Risk
Market risk represents the risk of changes in the value of market risk sensitive instruments caused by fluctuations in interest rates and foreign exchange rates. We are also exposed to market risk based on fluctuations in commodity market prices for key raw material inputs. Changes in these factors could cause fluctuations in the results of our operations and cash flows.
70
Table of Contents
Interest Rate Risk
We are exposed to market risk based on fluctuations in market interest rates. Our exposure to fluctuating interest rate risk consists of floating rate debt instruments that are indexed to short-term benchmark interest rates. As of October 29, 2016, we had $80.0 million of principal outstanding under our ABL Facility at an average rate of 2.24% per annum. For fiscal year 2016, a 100 basis point increase (decrease) in our effective interest rate under the ABL Facility would have increased (decreased) interest expense by $0.8 million. See “Description of Indebtedness—ABL Facility.”
Foreign Exchange Risk
We are exposed to foreign currency exchange rate risk, primarily in Canadian dollars. We have entered into forward contracts on various foreign currencies to manage the foreign currency exchange rate risk on the collection of receivables denominated in foreign currencies. These derivatives typically require the exchange of a foreign currency, primarily Canadian dollars, for U.S. dollars at a fixed rate at a future date. See Note 12 to our audited consolidated financial statements appearing elsewhere in this prospectus.
Commodity Price Risk
We are a purchaser of certain commodities, including raw steel and aluminum. In addition, we are a purchaser of components and parts containing various commodities, including aluminum, fiberglass, copper and steel, which are integrated into our end products. We generally buy these commodities and components based on fixed market prices that are established with the vendor as part of the purchase process. Purchase contracts generally do not have an indexed price escalation formula to account for economic fluctuations between the contract date and the delivery date. As a result, we are typically unable to pass along increased costs due to economic fluctuations to our customers. We rarely use commodity financial instruments to hedge commodity prices. We will alternatively fix our prices for certain materials over an agreed upon amount of time between three months to 24 months through contracts with our vendors.
Critical Accounting Policies and Estimates
The preparation of consolidated financial statements in conformity with GAAP requires us to make estimates, assumptions and judgments that affect amounts of assets and liabilities reported in the consolidated financial statements, the disclosure of contingent assets and liabilities as of the date of the consolidated financial statements and reported amounts of revenues and expenses during the year. We believe our estimates and assumptions are reasonable; however, future results could differ from those estimates. We consider the following policies to be the most critical in understanding the judgments that are involved in preparing our consolidated financial statements.
Revenue Recognition
We recognize revenue for sales of vehicles, parts and other finished products when contract terms are met, collectability is reasonably assured and a product is shipped or risk of ownership has been transferred to and accepted by the customer. In certain instances, risk of ownership and title passes when the product has been completed in accordance with purchase order specifications and has been tendered for delivery to the customer. Periodically, certain customers request bill and hold transactions. In those cases, revenue recognition for vehicles occurs after the customer has been notified that the products have been completed according to the customer specifications, have passed all of our quality control inspections, and are ready for delivery.
Revenue from service agreements is recognized as earned when services are rendered. Intercompany sales are eliminated upon consolidation. Provisions are made for discounts, returns and sales allowances based on management’s best estimate and the historical experience of each business unit. Sales are recorded net of amounts invoiced for taxes imposed on the customer, such as excise or value-added taxes.
71
Table of Contents
Customer advances include amounts received in advance of the completion of vehicles or in advance of services being rendered. Such customer advances are recorded as current liabilities in our consolidated statements of operations until the vehicle is shipped or the service rendered.
Income Taxes
We account for income taxes under the guidance of Accounting Standard Codification 740, “Income Taxes.” Deferred tax assets and liabilities are recognized for the future tax consequences attributable to differences between financial statement carrying amounts of existing assets and liabilities and their respective tax basis and operating loss and tax credit carryforwards. Deferred tax assets and liabilities are measured using enacted tax rates expected to apply to taxable income in the years in which those temporary differences are expected to be recovered or settled. We record a valuation allowance on deferred tax assets for which utilization is not more likely than not. Management judgment is required in determining our provision for income taxes, deferred tax assets and liabilities, and the valuation allowance recorded against our net deferred tax assets.
We recognize liabilities for uncertain income tax positions based on a two-step process. The first step is to evaluate the tax position for recognition by determining if the weight of available evidence indicates that it is more likely than not that the position will be sustained on audit, including resolution of related appeals or litigation processes, if any. The second step requires us to estimate and measure the tax benefit as the largest amount that is more than 50% likely to be realized upon ultimate settlement. It is inherently difficult and subjective to estimate such amounts, as we must determine the probability of various possible outcomes. We reevaluate these uncertain tax positions on a quarterly basis or when new information becomes available to management. These reevaluations are based on factors including, but not limited to, changes in facts or circumstances, changes in tax law, successfully settled issues under audit, expirations due to statutes, and new audit activity. Such a change in recognition or measurement could result in the recognition of a tax benefit or an increase to the tax accrual.
Stock Compensation Expense
Stock compensation expense is recorded over the term of the associated stock option grants, which is generally up to 10 years from the grant date, and is measured based upon the estimation of the fair value of all stock option awards on the grant date by applying the Black-Scholes option-pricing valuation model (the “Black-Scholes Model”). The application of the Black-Scholes Model requires us to make certain assumptions such as the fair value of our common stock on the grant date, forfeitures of option grants and the rate of dividend payments on our common stock. Other assumptions utilized in the Black-Scholes Model include volatility of the share price of select peer public companies and the risk free rate.
The fair value of our common stock is calculated by determining our enterprise value by applying an earnings multiple to our Adjusted EBITDA over the previous 12 months, and deducting outstanding debt, then dividing by the number of shares of common stock outstanding. The assumption for forfeitures is based upon historical experience. As we have not historically paid dividends on our common stock, we have assumed a 0% dividend rate for all outstanding stock options.
Prior to this offering, our stockholders were party to a shareholders agreement that will be amended and restated in its entirety. Due to provisions in that shareholders agreement, a shareholder is allowed to put his or her shares to us under certain circumstances. As such, certain outstanding stock options are considered liability awards and are recorded at intrinsic value, which is the difference between the estimated fair value of the Company’s common stock and the option strike price and recognized as a liability on our consolidated balance sheet. Upon becoming a public entity, we will record the liability awards at fair value. As a result of this offering, the aforementioned put rights will expire and the outstanding options will no longer be considered liability awards and the fair value of the options will be reclassified to shareholders’ equity.
72
Table of Contents
Business Combinations
Acquisitions are accounted for using purchase accounting. The purchase price of an acquired company is allocated between tangible and intangible assets acquired and liabilities assumed from the acquired business, in each case based on their estimated fair values. Any excess consideration transferred is recorded as goodwill. A bargain purchase gain is recognized to the extent the estimated fair value of the net assets acquired exceeds the purchase price. The results of operations of the acquired businesses are included in our operating results from the date of acquisition.
Assets acquired and liabilities assumed generally include tangible and intangible assets, as well as contingent assets and liabilities. When available, the estimated fair values of these assets and liabilities are determined based on observable inputs, such as quoted market prices, information from comparable transactions, offers made by other prospective acquirers (in such cases where we may have certain rights to acquire additional interests in existing investments) and the replacement cost of assets in the same condition or stage of usefulness (Level 1 and 2). Unobservable inputs, such as expected future cash flows or internally developed estimates of value (Level 3), are used if observable inputs are not available.
Accounts Receivable
Accounts receivable consist of amounts billed and currently due from customers. We extend credit to customers in the normal course of business and maintain an allowance for doubtful accounts resulting from the inability or unwillingness of customers to make required payments. Management determines the allowance for doubtful accounts by evaluating individual customer receivables and considering a customer’s financial condition, credit history and current economic conditions. Each fiscal quarter, we prepare an analysis of our ability to collect outstanding receivables that provides a basis for an allowance estimate for doubtful accounts. In connection with this analysis, we evaluate the age of accounts receivable, past collection history, current financial conditions of key customers and economic conditions.
Based on this evaluation, we establish a reserve for specific accounts receivable that are believed to be uncollectible, as well as an estimate of uncollectible receivables not specifically known. Historical trends and our current knowledge of potential collection problems provide us with sufficient information to establish a reasonable estimate for an allowance for doubtful accounts. Receivables are written off when management determines collection is highly unlikely and collection efforts have ceased. Recoveries of receivables previously written off are recorded when received.
Goodwill
Goodwill reflects the cost of an acquisition in excess of the fair values assigned to identifiable net assets acquired. We account for business combinations by estimating the fair value of consideration paid for acquired businesses, including contingent consideration, and assigning that amount to the fair values of assets acquired and liabilities assumed, with the remainder assigned to goodwill or gain on bargain purchase. The estimates of fair values are determined utilizing customary valuation procedures and techniques, which require us, among other things, to estimate future cash flows and discount rates. Such analyses involve significant judgments and estimations on our part.
Goodwill is not amortized. However, we review goodwill for impairment at least annually or more often if an event occurs or circumstances change which indicates that their carrying amount may not exceed their fair value. The annual impairment review is performed as of the first day of the fourth quarter of each fiscal year based upon information and estimates available at that time.
To perform the impairment testing, we first assess qualitative factors to determine whether it is more likely than not that the fair values of our reporting units are less than their carrying amounts as a basis for determining whether or not to perform the quantitative impairment test. We then estimate the fair value of each reporting unit and each indefinite-lived intangible asset not meeting the qualitative criteria and compare their fair values to their carrying values.
73
Table of Contents
The fair value of each reporting unit of the Company is determined by using both the income approach and market approach. The income approach involves discounting management’s projections of future cash flows and a terminal value discounted at a discount rate which approximates the Company’s weighted-average cost of capital (“WACC”). Key assumptions used in the income approach include future sales growth and same-store sales, gross margin and operating expenses trends, depreciation expense, taxes, capital expenditures, changes in working capital and discount rate. Projected future cash flows are based on management’s knowledge of the current operating environment and expectations for the future. The WACC incorporates equity and debt return rates observed in the market for a group of comparable public companies and is determined using an average debt-to-equity ratio of selected comparable public companies. The terminal value is based upon the projected cash flow for the final projected year, and is calculated using estimates of growth of the net cash flows based on our estimate of stable growth for each financial reporting unit. The market approach is based upon observed transactions in the marketplace, evidenced by trading multiples based upon estimated and actual sales and EBITDA. The sales and earnings multiples selected by the Company are based upon the average multiples of comparable public companies and then adjusted for factors including forecast risk, growth and profitability.
Determining the fair value of a reporting unit involves the use of significant estimates and assumptions. Determining fair value using an income approach requires that we make significant estimates and assumptions, including management’s long-term projections of cash flows, market conditions and appropriate discount rates. Our judgments are based on historical experience, current market trends and other information. In estimating future cash flows, we rely on internally generated forecasts for operating profits and cash flows, including capital expenditures. The rates used to discount projected future cash flows reflect a WACC based on our industry, capital structure and risk premiums including those reflected in the current market capitalization, and could change and therefore impact the fair value of our reporting units. The inputs and assumptions used in the determination of fair value are considered Level 3 inputs within the fair value hierarchy.
If the fair value of any reporting unit is less than its carrying value, the fair value of the implied goodwill is calculated as the difference between the fair value of the reporting unit and the fair value of the underlying assets and liabilities, excluding goodwill. An impairment charge is recorded for any excess of the carrying value of goodwill over the implied fair value for each reporting unit.
Impairment of Long-Lived Assets Other Than Goodwill
Long-lived assets are reviewed for potential impairment when events or changes in circumstances indicate that the carrying amount of the assets may not be recoverable. Recoverability of assets to be held and used is measured by comparison of the carrying value of such assets to the undiscounted future cash flows expected to be generated by such assets. If the carrying value of an asset exceeds its estimated undiscounted future cash flows, an impairment provision is recognized to the extent that the carrying amount of the asset exceeds its fair value. We consider factors such as historic or forecasted operating results, trends and future prospects, current market value, significant industry trends and other economic and regulatory factors in performing these analyses. Using different assumptions and definitions could result in a change in our estimates of cash flows and those differences could produce materially different results.
When determining the fair value of trade names, we use the relief from royalty method which requires the determination of fair value based on if the Company was licensing the right to the trade name in exchange for a royalty fee. We utilize the income approach to determine future revenues to which to apply a royalty rate. The royalty rate is based on market approach concepts. In considering the value of trade names, we look to relative age, consistent use, quality, expansion possibilities, relative profitability and relative market potential.
Long-Lived Assets, Including Definite-Lived Intangibles
Property, plant and equipment and definite-lived intangible assets are reviewed for impairment whenever events or changes in circumstances indicate that the carrying amount may not be recoverable. If an analysis is necessitated by the occurrence of a triggering event, we compare the carrying amount of the asset group with the
74
Table of Contents
estimated undiscounted future cash flows expected to result from the use of the asset group. If the carrying amount of the asset group exceeds the estimated expected undiscounted future cash flows, we measure the amount of the impairment by comparing the carrying amount of the asset group with its estimated fair value. Such analyses necessarily involve significant judgments and estimations on our part.
Warranty
Provisions for estimated warranty and other related costs are recorded in cost of sales and are periodically adjusted to reflect actual experience. The amount of accrued warranty liability reflects management’s best estimate of the expected future cost of honoring our obligations under our limited warranty plans. The costs of fulfilling our warranty obligations principally involve replacement parts, labor and sometimes travel for any field retrofit or recall campaigns. Our estimates are based on historical experience, the number of units involved and the cost per claim. Also, each quarter we review actual warranty claims to determine if there are systemic effects that would require a field retrofit or recall campaign.
Segment Reporting
For purposes of business segment performance measurement, we do not allocate to individual business segments costs or items that are of a non-operating nature or organizational or functional expenses of a corporate nature. The caption “corporate and other” includes corporate office expenses, including stock-based compensation, results of insignificant operations, intersegment eliminations and income and expenses not allocated to reportable segments. Identifiable assets of the business segments exclude general corporate assets, which principally consist of cash and cash equivalents, certain property, plant and equipment and certain other assets pertaining to corporate activities.
Recent Accounting Pronouncements
In May 2014, the FASB issued Accounting Standards Update (“ASU”) 2014-09, “Revenue from Contracts with Customers” (Topic 606) (“ASU 2014-09”), which outlines a single comprehensive model for entities to use in accounting for revenue arising from contracts with customers. This standard will supersede most current revenue recognition guidance. Under the new standard, entities are required to identify the contract with a customer, identify the separate performance obligations in the contract, determine the transaction price, allocate the transaction price to the separate performance obligations in the contract and recognize the appropriate amount of revenue when (or as) the entity satisfies each performance obligation. ASU 2014-09 will become effective for fiscal years beginning after December 15, 2018 (the Company’s fiscal year 2020). The Company is currently evaluating the impact of ASU 2014-09 on its consolidated financial statements.
In July 2015, the FASB issued ASU No. 2015-11, “Simplifying the Measurement of Inventory” (“ASU 2015-11”). Under ASU 2015-11, entities should measure inventory that is not measured using last-in, first-out or the retail inventory method, including inventory that is measured using first-in, first-out or average cost, at the lower of cost or net realizable value. Net realizable value is the estimated selling price in the ordinary course of business, less reasonably predictable costs of completion, disposal and transportation. ASU 2015-11 is effective for reporting periods beginning after December 15, 2016 and is to be applied prospectively. The adoption of ASU 2015-11 is not expected to have a material effect on our consolidated financial statements.
In August 2015, the FASB issued ASU No. 2015-15, “Presentation and Subsequent Measurement of Debt Issuance Costs Associated with Line-of-Credit Arrangements” (“ASU 2015-15”), which clarifies the guidance set forth in ASU No. 2015-03, “Simplifying the Presentation of Debt Issuance Costs” (“ASU 2015-03”), issued in April 2015. ASU 2015-03 requires that debt issuance costs related to a recognized liability be presented on the statements of operations as a direct reduction from the carrying amount of that debt liability, consistent with debt discounts. The recognition and measurement guidance for debt issuance costs are not affected. ASU 2015-15 provides additional guidance regarding debt issuance costs associated with line-of-credit arrangements, stating
75
Table of Contents
that the SEC staff would not object to an entity deferring and presenting debt issuance costs as an asset and subsequently amortizing the deferred issuance costs ratably over the term of the line-of-credit arrangement. ASU 2015-03 is effective for reporting periods beginning after December 15, 2015, and early adoption is permitted. We early adopted ASU 2015-03 and ASU 2015-15 and debt issuance costs are presented as a direct deduction from the carrying amount of that debt liability for all periods presented. The adoption of ASU 2015-03 and ASU 2015-15 did not have a material effect our consolidated financial statements.
In September 2015, the FASB issued ASU No. 2015-16, “Business Combinations (Topic 805)—Simplifying the Accounting for Measurement-Period Adjustments” (“ASU 2015-16”). ASU 2015-16 requires that an acquirer in a business combination recognize adjustments to provisional amounts that are identified during the measurement period in the reporting period in which the adjustment amounts are determined, rather than as retrospective adjustments. ASU 2015-16 is effective for fiscal years beginning after December 15, 2015, including interim periods within those fiscal years. ASU 2015-16 should be applied prospectively to adjustments to provisional amounts that occur after the effective date of ASU 2015-16 with earlier application permitted for financial statements that have not been issued. We believe the adoption of ASU 2015-16 will not have a material impact on our consolidated financial statements.
In November 2015, the FASB issued ASU 2015-17, “Income Taxes, Balance Sheet Classification of Deferred Taxes” (“ASU 2015-17”), which simplifies the balance sheet classification of deferred taxes. ASU 2015-17 requires that all deferred tax assets and liabilities be classified as noncurrent in the classified balance sheet, rather than separating such deferred taxes into current and noncurrent amounts, as is required under current guidance. ASU 2015-17 is effective for fiscal years, and for interim periods within those fiscal years, beginning after December 15, 2016 with early adoption permitted, and may be applied either prospectively or retrospectively. We prospectively adopted ASU 2015-17 in the fourth quarter of fiscal year 2016 and therefore prior periods were not retrospectively adjusted. The adoption of ASU 2015-17 did not have a material impact on our consolidated financial statements.
In February 2016, the FASB issued ASU 2016-02, “Leases (Topic 842)” (“ASU 2016-02”). The amendments in this update require, among other things, that lessees recognize the following for all leases (with the exception of leases with a duration of less than 12 months) at the commencement date: (1) a lease liability, which is a lessee’s obligation to make lease payments arising from a lease, measured on a discounted basis; and (2) a right-to-use asset, which is an asset that represents the lessee’s right to use, or control the use of, a specified asset for the lease term. Lessees and lessors must apply a modified retrospective transition approach for leases existing at, or entered into after, the beginning of the earliest comparative period presented in the financial statements. We expect to adopt ASU 2016-02 in the first quarter of 2019 and are currently evaluating the impact of ASU 2016-02 to our consolidated financial statements.
76
Table of Contents
Our Company
REV is a leading designer, manufacturer and distributor of specialty vehicles and related aftermarket parts and services. We serve a diversified customer base primarily in the United States through three segments: Fire & Emergency, Commercial and Recreation. We provide customized vehicle solutions for applications including: essential needs (ambulances, fire apparatus, school buses, mobility vans and municipal transit buses), industrial and commercial (terminal trucks, cut-away buses and street sweepers) and consumer leisure (RVs and luxury buses). Our brand portfolio consists of 26 well-established principal vehicle brands including many of the most recognizable names within our served markets. Several of our brands pioneered their specialty vehicle product categories and date back more than 50 years. We believe that in most of our markets, we hold the first or second market share position and estimate that approximately 72% of our net sales during fiscal year 2016 came from products where we hold such share positions.
In fiscal year 2016, we sold approximately 17,300 units and we currently have an estimated installed base of approximately 240,000 vehicles in operation. We believe this provides us with a competitive advantage and recurring replacement vehicle sales as many customers are brand-loyal and fleet owners frequently seek to standardize their in-service fleets through repeat purchases of existing brands and product configurations. The specialty vehicle market is a complex and attractive market characterized by: (i) numerous niche markets with annual sales volumes generally between 3,000 and 25,000 units, (ii) highly customized vehicle configurations addressing unique customer applications and (iii) specialized customer bases and distribution channels (both dealer and direct). We believe the specialty vehicle market has historically been addressed primarily by smaller, less sophisticated companies, which has created an opportunity for market leadership by scaled and highly efficient producers such as REV. Under our current leadership, our focus on product innovation, life-cycle value leadership and operational improvement has strengthened our brands and market position while driving growth and expanding margins.
Our products are sold to municipalities, government agencies, private contractors, consumers and industrial and commercial end users. We have a diverse customer base with our top 10 customers representing approximately 25% of our net sales in fiscal year 2016, with no single customer representing more than 6% of our net sales over the same period. Our top 10 customers have maintained relationships with REV and its predecessor companies for an average of approximately 20 years. We believe our diverse end markets are favorably exposed to multiple secular growth drivers such as: rising municipal spending, a growing aged population, growing urbanization, growing student populations, the increasing popularity of outdoor and active lifestyles and the replacement of existing in-service vehicles including legislated replacements. In addition to these favorable underlying drivers of growth, we believe certain of our markets will benefit over the next several years from incremental demand created by the underinvestment in fleets following the 2008 recession. For example, as set forth in the charts below in “—Our Markets,” we estimate that the cumulative pent-up replacement demand in the fire and emergency market is approximately 15,000 units, which represents 144% of the total fire and emergency market unit sales volume in the United States and Canada in 2015. However, we cannot be certain as to the timing and extent to which the pent-up replacement demand may be released, as it is inherently uncertain and generally outside our control.
Our business model utilizes our unique scale to drive profitable organic and acquisitive growth. We seek to gain market share by delivering high-quality products with customized attributes tailored to our customers’ product specifications, while simultaneously reducing costs and shortening delivery lead times. We aim to achieve this by standardizing and optimizing certain processes across our segments in areas including: procurement, engineering and product development, lean manufacturing, dealer management, pricing, and aftermarket parts sales. We believe our manufacturing and service network, consisting of 15 manufacturing facilities and 11 aftermarket service locations (called Regional Technical Centers or “RTCs”), provides us with a competitive advantage through the sharing of best practices, manufacturing flexibility based on relative facility utilization levels, delivery costs and lead times, economies of scale, customer service capabilities, and a
77
Table of Contents
complementary distribution system. Our business consists primarily of design, engineering, integration, and assembly activities, which require low levels of capital expenditures. Additionally, our business has a highly variable cost structure that results in operational flexibility, which when combined with low levels of capital expenditures, we believe can produce high returns on invested capital. Furthermore, our broad presence across the specialty vehicle market and large manufacturing and distribution network are important differentiators in our ability to grow through acquisitions. We seek to make synergistic acquisitions that further enhance our existing market positions or enter REV into new, attractive product segments. In the past 10 years, we have successfully integrated nine acquisitions and have demonstrated the ability to grow and enhance the earnings profile of acquired businesses by either consolidating acquired businesses into our existing plant footprint or by introducing REV processes into the newly acquired businesses to drive profitable growth.
Our management team has an average of 28 years of experience in highly specialized industrial manufacturing and aftermarket parts and services businesses. Beginning in 2014, our new leadership team introduced several initiatives to accelerate growth and improve our profitability. These initiatives included: improving brand management, strengthening distribution, implementing a centralized enterprise-wide procurement strategy, growing adjacent and aftermarket products and services, improving production processes within our facilities, driving down total cost of quality, implementing value-based pricing strategies and reducing fixed costs.
We have delivered strong financial and operating results from fiscal year 2014 to fiscal year 2016, as set forth below:
| (1) | Net sales were $1,721 million, $1,735 million and $1,926 million for fiscal year 2014, fiscal year 2015 and fiscal year 2016, respectively, which represents a compound annual growth rate, or “CAGR,” of 3.8%; |
| (2) | We improved our operating performance, specifically: |
| • | Net income was $1.5 million, $23 million and $30 million for fiscal year 2014, fiscal year 2015 and fiscal year 2016, respectively, which represents a CAGR of 173%; |
| • | Adjusted Net Income was $14 million, $34 million and $55 million for fiscal year 2014, fiscal year 2015 and fiscal year 2016, respectively, which represents a CAGR of 56%; |
| • | Adjusted EBITDA was $62 million, $90 million and $127 million for fiscal year 2014, fiscal 2015 and fiscal year 2016, respectively, which represents a CAGR of 27%; and |
| (3) | We drove approximately 148 basis points and 280 basis points of expansion in our net income and Adjusted EBITDA margins, respectively. |
See “Prospectus Summary—Summary Consolidated Financial Data” for additional information regarding our non-GAAP measures, including a reconciliation of these measures to their most directly comparable GAAP measure.
Our Markets
We operate primarily in the United States in the fire and emergency, commercial and recreation markets. For fiscal year 2016 our net sales to international markets (including Canada) amounted to $66 million, representing approximately 3% of our overall net sales for the period. We sell internationally through dealers and agents to end markets that utilize U.S.-style chassis and product configurations.
Fire and Emergency Markets
According to industry sources, there were approximately 10,400 fire apparatus and ambulance units shipped in 2015 in the United States and Canada, representing a 10% and 30% increase over the annual industry volumes for 2014 and 2011, respectively. Fire and emergency products are used by municipalities and private contractors
78
Table of Contents
to provide essential services such as emergency response, patient transport and fire suppression, among other activities. Nearly all fire apparatus and ambulances are customized in some form; however, they share many common production, sales and component attributes such as similar manufacturing and engineering processes, raw materials (aluminum, lights, wire harnesses, paint and coatings, among others), and dealer-based distribution channels. The sales prices for our fire and emergency products can vary considerably given their highly customized nature, but generally range from $160,000 to $650,000 for pumper trucks, $475,000 to $1,200,000 for aerial fire trucks and $65,000 to $350,000 for ambulances. Demand is driven primarily by the replacement of in-service fleets, as well as by factors such as a growing aged population and a growing overall population (driving increased patient transportation and emergency response needs), new real estate developments, taller buildings (requiring more aerial vehicles), international airport growth (requiring Federal Aviation Administration-specified ARFF vehicles), and higher municipal funding levels. Local tax revenues are an important source of funding for fire and emergency response departments in addition to Federal grant money and locally raised funding. We estimate that ambulances have useful lives of five to seven years and generally operate on a 24/7 schedule, driving significant annual mileage which ultimately creates a replacement or remount sale as their underlying chassis wears out. We estimate that pumper trucks and aerial fire trucks have useful lives of 10-12 years and 20-30 years, respectively, and that these fire apparatus vehicles become obsolete before they wear out due to the fact that they generally operate at lower levels of annual miles driven and, outside of major metropolitan areas. We estimate that ambulances have useful lives of 5-7 years. We believe there is significant pent-up replacement demand for fire apparatus and ambulances as annual unit shipment levels since the 2008 recession have remained well below pre-recession averages. As set forth in the charts below, we estimate the cumulative pent-up replacement demand at approximately 15,000 units, which we believe is incremental to ongoing normalized levels of demand. However, we cannot be certain as to the timing and extent to which the pent-up replacement demand may be released, as it is inherently uncertain and generally outside our control.
| Fire Apparatus | Ambulance | |
| Unit Sales | Unit Sales | |
|
|
| |
| Source: FireApparatus Manufacturers’
Association, |
Source: National Truck Equipment Association — Ambulance Manufacturers Division, Management estimates |
We believe that a growing aged population, longer life expectancy, urbanization and the increasing use of emergency vehicles for non-critical care transport are all positive trends for the ambulance market. Further, the Patient Protection and Affordable Care Act and the resulting creation of federal and state healthcare exchanges have resulted in broader healthcare insurance coverage nationally, allowing ambulance service providers to realize higher reimbursement rates and increased ambulance utilization levels, as ambulance service providers historically provided care and transport for a significant number of individuals who had limited or no insurance.
Commercial Markets
REV’s Commercial segment addresses a broad variety of products and end markets. The transit and shuttle bus market includes applications such as airport car rental and hotel/motel shuttles, paramedical transit vehicles for hospitals and nursing homes, tour and charter operations, daycare and student transportation, mobility vans
79
Table of Contents
for wheelchair users, and numerous other applications. According to industry sources, shipments of cutaway buses (those buses that are up to 35 feet in length) were approximately 15,000 units in 2015. We believe the commercial bus markets we serve will sustain positive long-term growth supported by growing levels of urbanization which will require increasing commercial bus usage, increased government transportation spending as shown in the chart below, an aging and growing U.S. population driving demand for shuttle buses and mobility vans, a necessary replacement cycle of public and private bus customers and the introduction of new bus products.
The demand for school buses is driven by the need for student transportation primarily in the United States and Canada. Within this market, we believe important demand drivers are the increasing number of students, the replacement cycle of in-service vehicles, substitution by private contract companies as the provider of student transportation from school districts (thus requiring the purchase of new buses) and legislated replacements. Insurance providers and state legislatures are increasingly requiring replacement of non-conforming vans which often drives a substitution purchase of our Type A product because of its numerous legislated safety features and benefits versus traditional van products. There are more than 14,000 school districts in the United States responsible for operating approximately 500,000 school buses. Approximately 19% of the school buses sold in 2015 were Type A buses, which we produce, and the remainder were Type B and C buses which we do not currently produce.
The following chart shows the shuttle bus unit sales and U.S. school bus unit sales during the time periods shown below.
| Shuttle Bus Unit Sales | U.S. School Bus Unit Sales | |
| (in thousands) | (in thousands) | |
|
|
| |
| Source: Management estimates and School Bus Fleet, School Bus Sales Report (2015) | ||
Terminal truck demand is driven by replacement of in-service fleets, growth in trade and the increased use of intermodal freight services and warehouses. We anticipate ongoing growth in global trade will result in higher future intermodal freight traffic growth. Sweeper demand is also driven by replacement of in-service fleets by contractors and rental companies as well as growth in infrastructure and construction spending. Sweepers are used in various applications within the construction and road and highway infrastructure markets.
The sales prices for our bus and specialty vehicles can vary considerably, but generally range from $35,000 to $55,000 for Type A school buses, $40,000 to $190,000 for shuttle buses, $100,000 to $500,000 for transit buses and $25,000 to $165,000 for other specialty vehicles. We estimate that Type A school buses have useful lives of 8-10 years, that shuttle buses have useful lives of 5-10 years, that transit buses have useful lives of approximately 12 years and other specialty vehicles have useful lives of 5-7 years.
The following chart shows the estimated amount spent in 2011 by U.S. state and local governments and municipalities for transportation and the amount projected to be spent in 2016 and 2021, together with CAGRs calculated for the time periods shown below, as well as shuttle bus unit sales and U.S. school bus unit sales during the time periods shown below. The trends shown in these charts, however, are not a guarantee that similar growth in U.S. state and local transportation spending will continue.
80
Table of Contents
U.S. State and Local Transportation Spending
(in billions)
Source: USGovernmentspending.com
Recreation Markets
The RV industry includes various types and configurations of both motorized and towable RVs of which we currently manufacture and sell Class A (diesel and gas) and Class C motorized RVs. Motorized RVs are self-contained units built on motor vehicle chassis with their own lighting, plumbing, heating, cooking, refrigeration, sewage holding and water storage facilities. Class A RVs are generally constructed on medium-duty chassis which are supplied complete with engine and drivetrain components by major motor vehicle manufacturers. We then design, fabricate and install the living area and driver’s compartment of these motorized RVs. Class C RVs are built on consumer truck or van chassis which include an engine, drivetrain and a finished cab section. We design, fabricate and install the living area to connect to the driver’s compartment and the cab section.
According to the RV Consumer Report from 2011, an industry report published by the University of Michigan, approximately nine million households in the United States own an RV. Motorized RVs are a consumer leisure purchase and therefore factors that drive demand include: consumer wealth (including the value of primary housing residences and the stock market level), consumer confidence, availability of financing, and levels of disposable income. We believe end customers tend to be brand-loyal and repeat buyers who make decisions based on brand, quality, product configuration (primarily floorplan design, features and product styling), service availability and experience and price. Lifestyle trends are expected to support the growth of the RV market. We believe RVs are becoming more popular through increased interest in nature-based tourism and a growing preference for adventure travel among the growing urban populations. According to the Recreation Vehicle Industry Association, or RVIA, RV sales will continue to benefit from the aging “baby boomers” as more people enter the primary RV ownership age group of 55 to 70 years old. RVIA estimates that the number of consumers between the ages of 55 and 70 will total 56 million by 2020, 27% higher than in 2010. In addition to the growth tied to aging demographics, there are approximately 45 million active U.S. campers, many of which are outside the aforementioned demographic, representing an opportunity to expand the RV customer base.
We believe the near-term RV industry outlook is positive. Year-over-year sales have increased for four years (2011 to 2015 and continuing through 2016) and participation rates continue to grow, which demonstrates a long-term trend toward RV ownership. In 2015, shipments of motorized RVs exceeded 47,000 units and approximately $3 billion of net sales, which is an increase of approximately 8% and 14%, respectively, compared to 2014 according to RVIA. In particular, approximately 21,900 Class A RVs were shipped in 2015, which represents a volume level that is approximately 40% below the pre-2008 recession historical average of shipped units from 1989 to 2007. Further, this volume level is approximately 53% below the industry’s peak volume in 2004 when approximately 46,000 Class A RV units were shipped. Accordingly, we believe industry volumes of Class A RVs, where REV’s market position is strongest, can recover to be in line with, or in excess of, pre-2008 recession historical averages.
81
Table of Contents
The sales prices for our RVs can vary considerably, but generally range from $65,000 to $600,000. We estimate that RVs have useful lives of 8-15 years.
Motorized RV North American Market Size
Unit 000s
Source: RVIA
| RV Participation |
| |||
| U.S. Households that Own RVs (in millions) |
|
RV Ownership % of U.S. Households |
| |
|
|
| |||
| Source: University of Michigan Study (The RV Consumer in 2011), RVdailyreport.com and U.S. Census Bureau |
| |||
Our Strengths
We believe we have the following competitive strengths:
Market Leader Across All Segments with a Large Installed Base—We believe we are a market leader in each of the fire and emergency, commercial and recreation vehicle markets. Approximately 72% of our net sales in fiscal year 2016 are in markets in which we believe we hold the first or second market share positions. We believe we are the largest manufacturer by unit volume of fire and emergency vehicles in the United States. We also believe our Commercial segment is the #1 producer of small- and medium-sized commercial buses as well as Type A school buses in the United States. We believe we are also a leading producer of transit buses, terminal trucks, mobility vans and street sweepers. Within our Recreation segment, we are one of the top producers of Class A diesel and gas motorized RVs with a 14% market share as of October 2016 and we believe we are the fastest growing manufacturer, growing our Class A RV market share by approximately 120 basis points since October 2015.
82
Table of Contents
We estimate that the replacement value of our installed base of approximately 240,000 vehicles across our segments is approximately $32 billion, which we believe is a significant competitive advantage for both new unit sales and aftermarket parts and service sales, as brand awareness drives customer loyalty and fleet owners frequently seek to standardize their in-service fleets through repeat purchases of existing brands and product configurations. For example, one of the largest municipal fire departments in the United States has its fleet of ambulances standardized on REV branded product configuration and feature sets that satisfy this customer’s unique specifications and standards.
Broad Product Portfolio and Well-Recognized Brands—Our product portfolio is comprised of high-quality vehicles sold under 26 well-established principal vehicle brands that in many instances pioneered their market segments. For example, the first Type A yellow school bus was developed and sold by Collins Bus and the first Type I ambulance was developed and sold by Horton. We believe our product portfolio represents the broadest product offering in our markets and enables us to attract and retain top dealers who in many instances sell multiple REV brands in their territories. Our vehicle platforms are highly customizable and can meet nearly all product specifications demanded by our customers. In each of the markets that we serve, we believe our brands are among the most recognized in the industry, representing performance, quality, reliability, durability, technological leadership and superior customer service.
Selling into Attractive, Growing End Markets—Each of our segments serves end markets that are supported by what we believe to be favorable, long-term demographic, economic and secular trends. We believe that the growing aged population in the United States will increase demand for products across all of our segments, as older demographics are a key demand driver for products such as emergency vehicles, mobility vans and RVs. In the Fire & Emergency segment, increasing legislated changes requiring shorter replacement cycles will create a source of recurring demand for our products as in-service vehicles achieve mileage or age limits. Additionally, fire and emergency vehicle purchases fell below historical replacement rates following the 2008 recession, and we estimate the cumulative pent-up replacement demand is approximately 15,000 units, which represents 144% of the total unit sale volume in the United States and Canada in 2015. Our Commercial segment is poised to grow as a result of increasing urbanization within the United States which will require greater use of commercial buses. We believe demand for our school buses and our fire and emergency vehicles will grow with increasing state and local government spending. In addition, we believe our RV segment is poised for long-term growth driven by increased RV participation rates and market unit recoveries to historical average levels. Additionally, we believe the current U.S. camper base of 45 million people represents an opportunity to expand the RV customer base. Though our net sales are primarily derived from sales in the United States, similar positive market dynamics exist in other parts of the world providing an opportunity for future global growth in each of our segments. Only approximately 3% of our net sales in fiscal year 2016 were from sales to customers outside the United States.
Unique Scale and Business Model—As the only manufacturer of specialty vehicles across all three of our product segments and one of the largest participants in our markets by net sales, we enjoy a unique position relative to many of our competitors that we believe provides a competitive advantage and an enhanced growth profile. Many of our products contain similar purchased components, such as chassis, engines, lighting, wiring and other commodities which increase our leverage with and relevance to key suppliers. The operational processes across our different products are based on common elements, such as chassis preparation and production, body fabrication, product assembly and painting which allow us to develop best practices across our manufacturing system and implement those processes to drive operational efficiency. Our platform also allows us to leverage the combined engineering resources and product development resources from our broad network to bring new products, features and customer specific customization to market faster. Our business model makes us more desirable to our distribution channel partners as we are able to provide them with a full line of products to address their customers’ needs across a wider variety of price and product feature elements which gives them the opportunity to sell to a larger customer base and grow their sales and earnings. Additionally, our scale allows us to more efficiently amortize investments in service locations, parts sales infrastructure and information technology tools, among others.
83
Table of Contents
Business Model Produces Highly Attractive Financial Characteristics—Our core production processes are primarily design, engineering, component integration and assembly in nature, creating a business model that produces attractive financial characteristics such as a highly variable cost structure, low levels of maintenance capital expenditures as a percentage of net sales, attractive levels of return on invested capital and strong revenue visibility. Based on our historical results of operations, we estimate that across all three of our segments, approximately 85% of our cost of goods sold are comprised of direct materials (including chassis) and direct labor which are variable in nature because these costs are associated with the specific production of our vehicles in each period and therefore are adjusted within a given period based on production levels in that period. Our remaining cost of goods sold are comprised of certain indirect labor and overhead costs which are fixed or semi-variable in nature because these costs are not linked to specific vehicle volumes in a given period and the time required to adjust these levels of spending is longer and management decisions regarding these costs are made based on longer term trends and forecasts. In addition, our selling, general and administrative expenses are primarily comprised of salaried payroll expenses which we structure efficiently around the level of demand in our markets. Over the last three completed fiscal years, our capital expenditures, as a percentage of net sales, has totaled less than 2%. As a result of low levels of capital investments required and efficient use of working capital (including the taking of deposits in certain of our markets), we believe that our business produces attractive returns on invested capital. Finally, our business carries a high-quality backlog which enables strong visibility into future net sales which ranges from two to nine months depending on the product and market. This visibility into future production needs and net sales enables us to more effectively plan and predict our business.
Experienced Consolidator with Proven Ability to Integrate Acquisitions and Drive Business Improvement—Throughout our history, we have complemented organic growth with strategic acquisitions, resulting in meaningful cost and commercial synergies and accelerated growth. Over the last ten years, we have completed nine acquisitions across our Fire & Emergency, Commercial and Recreation segments and continue to actively consider future potential acquisitions that complement and expand our current product portfolio. Our scale and plant network, strong end market positions, access to low cost capital and reputation as an active and effective strategic acquirer, position us favorably to continue to grow and enhance value through strategic acquisitions. The specialty vehicle market is highly fragmented with a large number of smaller producers within our existing markets as well as in new markets where we believe there would be synergies with REV. Our management team is highly experienced in integrating and improving the businesses we acquire, as evidenced by the improved financial performance of many of our acquisitions under our ownership. We believe all of these attributes position REV as an acquirer of choice in the specialty vehicles market.
The Evolution of REV
84
Table of Contents
Experienced Management Team with Proven Track Record—Our management team has an average of 28 years of industry experience, and a demonstrated track record of managing and growing publicly-traded industrial businesses. From fiscal year 2014 to fiscal year 2016, our management team has increased net income from $1.5 million to $30 million and Adjusted EBITDA from $62 million to $127 million, respectively, while expanding net income and Adjusted EBITDA margins approximately 148 basis points and 280 basis points, respectively, over the same period. In addition to accomplishments at REV, key members of our leadership team have also had success in other public industrial companies such as Bucyrus International, Inc. and The Manitowoc Company Inc., among others.
Our Growth Strategies
We plan to pursue several strategies to grow our earnings, expand our market share and further diversify our revenue stream, including:
Drive Margin Expansion Through Controllable Operational Initiatives—Our focus on driving operational improvement initiatives across the organization has enabled the increase of our net income and Adjusted EBITDA margins by 148 basis points and 280 basis points, respectively, from fiscal year 2014 to fiscal year 2016. Our initiatives have also resulted in improved safety results, as measured by the 36% decrease in our total recordable incident rate in fiscal year 2016 versus the prior fiscal year. We have achieved these improvements as a result of successfully implementing lean manufacturing initiatives across the organization, consolidating procurement functions, centralizing certain commercial decision making, reducing cost of quality, improving operational and safety performance and improving the total life-cycle value proposition for our customers. We believe we have established an enterprise-wide culture focused on continuous improvement, implementing measurable performance targets and sharing of best practices across the entire organization. Our Fire & Emergency segment had Adjusted EBITDA of $85 million in fiscal year 2016, which represents an Adjusted EBITDA margin of 11%, and we are targeting to further enhance Adjusted EBITDA margins in our Fire & Emergency, Commercial and Recreation segments over time. We continuously strive to identify and act on additional profitability improvement initiatives in many of our business units.
Develop Innovative New Customer Offerings—Due to the specific customer requirements for our products, we are continually enhancing and customizing our product offerings by introducing new features to enhance customer utility across a variety of price points. We seek to expand our addressable market by developing innovative products and services that extend our market leading combination of features, performance, quality and price to new customer bases, new markets or new segments of existing markets. We introduced eight new products in fiscal year 2016. We currently have 11 new products in development that are expected to be released in fiscal year 2017. We believe our process of constant innovation will not only help us increase net sales but also achieve lower costs and generate higher margins as our new products are frequently designed to leverage existing procurement relationships and for ease of manufacturability. In addition, there are multiple natural product adjacencies where REV has valuable brand equity, leading technology and cost positions where we believe we can generate strong demand for new products. For example, we introduced a new M1 Ambulance under the Frontline brand in fiscal year 2016 to address a lower specification segment of the ambulance market. We introduced the Sabre terminal truck in fiscal year 2015, which provided a new cab design and feature set while improving manufacturability for REV as a result of improved design features such as a weldless frame. By delivering innovative new customer offerings and customizations, we believe we can grow our net sales and market share.
Enhance Sales and Distribution Model—We believe that we are an attractive specialty vehicle OEM partner for dealers due to the breadth and quality of our product offerings, our brand recognition, our ability to produce products at varied price and feature points, as well as our aftermarket support capabilities. We intend to continue to leverage this strength to enhance our distribution network through selectively adding dealers in new territories, strengthening dealers in our existing network and expanding our direct sales and service capabilities in targeted markets. Our goal is to partner with the leading dealers in each market and to provide the necessary resources to ensure our partner dealers can best position REV products to compete successfully within their regions. We will
85
Table of Contents
also continue to optimize our go-to-market channel strategy (e.g., distribution or direct sale) based on the specific market dynamics and customer composition by region. We have historically focused on customers within the United States; however, we believe there is demand internationally for our products and we also seek to expand our distribution globally.
Accelerate Aftermarket Growth—Our end users’ large in-service fleets create strong demand for aftermarket parts in order to keep vehicles running and to support their residual value. We estimate the size of our installed base’s aftermarket parts market opportunity to be approximately $800 million annually, with significant importance placed on timely parts availability given the high cost of vehicle downtime, and our total aftermarket net sales in fiscal years 2016, 2015 and 2014 were $73.8 million, $68.9 million and $64.5 million, respectively. We have formalized an aftermarket strategy and are investing in building out capabilities to take advantage of this significant, high margin opportunity across our segments. We have created a dedicated management team to oversee our aftermarket business, and are centralizing our aftermarket parts and services business to broaden market coverage and ensure parts availability while reducing lead time. We are establishing a web-based technology platform to provide our customers with real time data on parts availability and pricing. We also made substantial investments in our services network infrastructure including over $27 million in fiscal years 2015 and 2016, in the aggregate, for the establishment of new RTCs across the United States, development of our parts system infrastructure and the expansion of capacity across several existing service locations. We believe we are well positioned to provide the most extensive and integrated service support network to our end customers and dealer partners.
Pursue Value Enhancing Acquisitions—We seek to pursue acquisitions which enhance our existing market positions, gain us entry to new products or markets and achieve our targeted financial returns. We have a long history of acquisitions with nine transactions completed over the past 10 years. Given our leadership positions within our markets and our existing facility, service and distribution network, we believe we have many inherent advantages in making acquisitions and have demonstrated the ability to successfully identify, execute and integrate acquisitions while realizing synergies. We believe that we have a clear acquisition strategy in place, targeting acquisitions with significant synergies to drive long-term value creation for shareholders. We will seek acquisitions of companies with strong brands and complementary products and distribution networks that align well with our aftermarket strategies and provide strong synergies with our existing business. In addition, we will target acquisitions which further diversify or broaden our product offerings and geographic reach, and simultaneously produce attractive financial returns.
86
Table of Contents
Our Products and Markets
We primarily sell new specialty vehicles which we design, engineer and manufacture in our production facilities. We are also focused on growing our higher gross margin aftermarket business which consists of parts sales, service and other ancillary revenue opportunities generated by our installed base of approximately 240,000 vehicles. We believe the majority of our new vehicle sales represent the replacement of in-service vehicles which are past their useful life, with additional sales derived from fleet expansions, new customers and adjacent product introductions.
The following charts show a breakdown of our net sales for fiscal year 2016:
87
Table of Contents
The following chart sets forth summary information regarding our primary product line categories and end markets for our segments:
| Fire & Emergency |
Commercial |
Recreation | ||||
| Overview | The Fire & Emergency segment manufactures a wide range of fire apparatus and ambulance products. Fire & Emergency products are sold to municipal fire departments, EMS providers, and private fleets, typically purchasing through dealers. | The Commercial segment manufactures transit and shuttle buses, Type A school buses, mobility vans and other specialty vehicles including sweepers and terminal trucks distributed both through dealers and direct. Commercial products are sold to municipalities, schools, and commercial and industrial customers. | The Recreation segment manufactures motorized RV products sold to brand-loyal, repeat customers who purchase through dealers. | |||
| Selected Products |
|
|
| |||
| Principal Brands | Fire Apparatus |
|
| |||


|
|
| ||||
| Ambulance |
| |||||
|
|
|
|||||
|
|
|
|||||
|
|
|
|||||
|
|
|
|||||
| Estimated Addressable Market Size in the United States and Canada(1) | ~$3 billion | ~$5 billion | ~$3 billion | |||
| Estimated Addressable Market Units(1) | Ambulance: ~6,200 Fire Apparatus: ~4,200 |
Type A School Bus: ~7,500 Cutaway Bus: ~15,000 Transit Bus: ~4,100 Mobility Vans: ~23,100 Terminal Trucks and Sweepers: ~7,400 |
Class A: ~21,900 Class C: ~22,100 | |||
| Estimated REV Market Share by Units(1) | ~41% | ~19% | Class A – ~13% Class C – ~1% | |||
| Fiscal Year 2016 Net Sales(2) | $768 million | $679 million | $489 million | |||
| Market Positions for Selected Products | #1 in Ambulance #2 in Fire Apparatus |
#1 in Type A School Bus #1 in Small & Medium Size Commercial Bus #2 in Terminal Trucks #1 in Light Broom Sweepers |
14% Class A market share as of October 2016 representing a 120 basis point increase from October 2015. We believe we are the industry’s fastest growing Class A participant. | |||
| Selected Customers and Dealers |
|
|
| |||
|
|
|
| ||||
| (1) | Based on 2015 market volumes in the United States and Canada. |
| (2) | Does not reflect the elimination of intersegment sales of approximately $10.6 million in fiscal year 2016. |
88
Table of Contents
To enhance our market-leading positions, we continue to focus on new product development across our three segments. New product development is primarily designed to provide our customers with high-quality products that have varied and unique feature sets and product capabilities at attractive price points. We introduced eight new products in fiscal year 2016. We currently have 11 new products in development that we anticipate will be released in fiscal year 2017. In addition to new product development, our businesses are continuously customizing and designing our vehicles to meet individual customers’ needs and applications. In our RV business specifically, our new model design cycle follows similar timelines as the automotive industry, whereby new models and configurations are introduced or upgraded annually.
Upon request, we facilitate financing for our dealers and end customers by providing them with access to our third-party bank partners. All such financing transactions are recorded on our bank partners’ balance sheets. We support these transactions under both non-recourse and recourse agreements with the banks, and in return, we earn a fee for arranging these transactions. For further information, see Note 18 to our audited consolidated financial statements appearing elsewhere in this prospectus. We believe that offering customers finance options to purchase vehicles from us will help REV form a more complete relationship with our customers, help drive incremental vehicle sales and allow us to participate in finance revenue streams from third parties through arrangement fees.
Our Fire & Emergency segment sells fire apparatus equipment under the Emergency One (“E-ONE”) and Kovatch Mobile Equipment (“KME”) brands and ambulances under the American Emergency Vehicles (“AEV”), Horton Emergency Vehicles (“Horton”), Leader Emergency Vehicles (“Leader”), Marque, McCoy Miller, Road Rescue, Wheeled Coach and Frontline brands. We believe we are the largest manufacturer by unit volume of fire and emergency vehicles in the United States and have one of the industry’s broadest portfolios of products including Type I ambulances (aluminum body mounted on a heavy truck-style chassis), Type II ambulances (van conversion ambulance typically favored for non-emergency patient transportation), Type III ambulances (aluminum body mounted on a van-style chassis), pumpers (fire apparatus on a custom or commercial chassis with a water pump and small tank to extinguish fires), ladder trucks (fire apparatus with stainless steel or aluminum ladders), tanker trucks and rescue and other vehicles. Each of our brands is distinctly positioned and targets certain price and feature points in the market such that dealers often carry and customers often buy more than one REV Fire & Emergency product line.
In our Fire & Emergency segment, we introduced the Hush Pumper fire truck in August 2015 and the M1 ambulance model under our Frontline brand in April 2016. The Hush Pumper features an innovative design that enables the engine to be mounted in the rear of the truck to create additional cab space and to reduce the considerable engine noise from front mounted engines. The M1 models include Type I and Type III ambulances that enable us to enter the low to mid-priced market, a market in which we did not previously compete.
| Fire & Emergency Product |
Description/Application | |
| Pumper / Tanker
|
• Most standard fire apparatus found in fire department fleets • Transports firefighters to the scene of an emergency • Onboard pump and water tank for immediate water supply upon arrival on scene to fight fires • Connects to more permanent water sources such as fire hydrants or water tenders for continuous firefighting capability | |
| Aerial
|
• Transports firefighters to the scene of an emergency and supports fire suppression • Facilitates access or egress of firefighters and fire victims at height using a large telescopic ladder • Ladder is mounted on a turntable on a truck chassis allowing it to pivot around a stable base to transport firefighters and fire suppression to the scene • Typically contains a pump, provides a high-level water point for firefighting via elevated master water stream • Provides a platform from which tasks such as ventilation or overhaul can be executed | |


89
Table of Contents
| Fire & Emergency Product |
Description/Application | |
| ARFF
|
• Transports firefighters to the scene of an airport emergency • Highly specified (by the F.A.A.) fire engine designed for use at global airfields where FAA regulated commercial planes land to assist with potential aircraft accidents • Has the ability to move on rough terrain outside the runway and airport area and provides large water capacity and a foam tank • Able to deliver a fire suppression chemical foam stream to the scene, which “flattens” the fire faster • Capability to reach an airplane quickly and rapidly extinguish large fires involving jet fuel | |
| Ambulance Type I
|
• Transports paramedics and other emergency support technicians as well as a “mobile hospital” to the scene of an emergency • Patient compartment structural aluminum “box” mounted on a heavy truck chassis and used primarily for advanced life support and rescue work • Provides out of hospital medical care to the patient at the scene or while in transit | |
| Ambulance Type II
|
• Transports paramedics and other emergency support technicians to the scene of an emergency • Van-based ambulance with relatively fewer ambulance modifications and containing relatively less medical equipment than Type I or Type III ambulances • Used for basic life support and to transfer of patients that require only basic life support services to a hospital or between places of medical treatment | |
| Ambulance Type III
|
• Transports paramedics and other emergency support technicians as well as a “mobile hospital” to the scene of an emergency • Patient compartment structural aluminum “box” mounted on a cut-away van chassis and has the same use and application as a Type I ambulance | |


Our Commercial segment serves the bus market through the following principal brands: the Collins Bus, Goshen Coach, ENC, ElDorado National, Krystal Coach, Federal Coach, Champion and World Trans. We serve the terminal truck market through the Capacity brand, the sweeper market through the Lay-Mor brand and the mobility market through the ElDorado Mobility brand. We are a leading producer of small- and medium-sized buses, Type A school buses, transit buses, terminal trucks and street sweepers in the United States. Our products in the Commercial segment include cut-away buses (customized body built on various types and sizes of commercial chassis), transit buses (large municipal buses where we build our own chassis and body), luxury buses (bus-style limo or high-end luxury conversions), street sweepers (three- and four-wheel versions used in road construction activities), terminal trucks (specialized vehicle which moves freight in warehouses or intermodal yards and ports), Type A school buses (small school bus built on commercial chassis), and mobility vans (mini-van converted to be utilized by wheelchair passengers). Within each market segment, we produce a large number of customized configurations to address the diverse needs of our customers.
In our Commercial segment, we launched the World Trans commercial bus in September 2016. The World Trans is a low specification, fuel efficient, narrow-body bus with an innovative structural design. We anticipate that its unique design, coupled with its low cost of production, will drive margin improvement in the Commercial segment and will serve customer needs in many different end use applications.
90
Table of Contents
Fire & Emergency
An additional four new vehicles were launched in our Commercial segment in fiscal year 2016. The Federal / Krystal Bus, an updated luxury bus with new features built on a Ford or Freightliner chassis was launched in April 2016. The Champion Low Floor vehicle was launched in August 2016 to further our product offerings in mobility vans. It is an easy entry handicapped accessible bus with a lower slope ADA ramp, as well as a new air-ride suspension. In September 2016, the Collins Ford Transit was introduced with a new Ford chassis and an updated design and passenger compartment. We also expect to launch a new Laymor 4-wheel Sweeper in January 2017. We are committed to continued product innovation to provide better driver visibility, easier service access and more user friendly controls. These new products further differentiate our products and facilitate our entrance into previously underserved end markets.
| Commercial Product |
Description/Application | |||
| Transit Bus
|
• Type of bus used on shorter-distance public transport routes to move passengers from place to place. Distinct from all-seated coaches used for longer-distance journeys and smaller minibuses • Operated by publicly-run transit authorities or municipal bus companies, as well as private transport companies on a public contract or on a fully independent basis • Often built to operator specifications for specific transport applications • First type of bus to benefit from low-floor technology in response to demand for equal access public service | |||
| Shuttle Bus
|
• Transports passengers between two fixed points • Facilitates short- or medium-distance journeys, such as airport shuttle buses • Commonly used in towns or cities with multiple terminal train stations or bus stations, for passenger interconnections • Passenger compartment mounted on a van or truck-style chassis typically with short-term luggage storage capability | |||
| Type A School Bus
|
• Transports students, typically children, to and from school, home and school events • Typically transports smaller numbers of passengers compared to the larger “Type C” or “Type D” school buses and is more economical in certain types of applications • Purpose-built vehicle distinguished from other types of buses by significant safety and design features mandated by federal and state regulations • Passenger compartment mounted on a van or truck-style chassis | |||
| Mobility Van
|
• Minivan that is modified to increase the interior size and floor space of the vehicle and provide a means of wheelchair entry such as a ramp or a powered lift • Some include platform lifts that can be raised and lowered from inside the vehicle down to the ground outside to accommodate driver or passenger access • Provides access for a wheelchair user via side-entry or rear-entry configurations | |||
| Sweeper
|
• Used in a variety of cleaning and preparation applications in road construction and paving industries • Typically used in street, highway or interstate construction projects • Applications use broom or push technology, as well as water cleaning capabilities • Some applications also include snow removal • Significant aftermarket wear parts such as sweeper brushes | |||


91
Table of Contents
| Commercial Product |
Description/Application | |||
| Terminal Truck
|
• Custom built tractor used to move trailers and containers within a cargo yard, warehouse facility or intermodal facility • Includes a single person cab offset to the side of the engine with a short wheelbase and rear cab exit • A fifth wheel with an integrated lifting mechanism allows the semi-trailer landing legs to remain in the down position during movement enabling efficient movement • Steel side wall cab and floor construction for protection in harsh and dangerous work environments | |||

Our Recreation segment serves the RV market through four principal brands: American Coach, Fleetwood RV, Monaco Coach and Holiday Rambler. We believe these brands are among the longest-standing, most recognized brands in the RV industry. Prior to the 2008 recession, as segments of larger public companies, they generated over $2 billion of annual sales in each of the calendar years 2004 and 2005 and represented approximately 36% of the motorized RV market in calendar year 2005 and an even higher percentage shares of just the diesel portion of the Class A market. Under these four brands, REV provides a variety of highly recognized models such as: American Eagle, Dynasty, Discovery, Bounder and Pace Arrow, among others. Our products in the Recreation segment currently include only Class A motorized RVs (motorhomes built on a heavy duty chassis with either diesel or gas engine configurations) and Class C motorized RVs (motorhomes built on a commercial truck or van chassis). The Recreation segment also includes Goldshield Fiberglass, which produces a wide range of custom molded fiberglass products for the RV and broader industrial markets. Within our Recreation segment, we are one of the top producers of Class A diesel and gas motorized RVs with a 14% market share and a 7% market share of the motorized RV market as of October 2016 and we believe we are the fastest-growing share participant in the Class A market place based on market share, with our fiscal year 2016 unit sales growing 9% compared to fiscal year 2015. We are focused on recapturing the significant market share which our four principal brands enjoyed prior to 2008.
We re-entered the Class C motorized RV market under Fleetwood RV and Holiday Rambler in fiscal year 2016.
| Recreation Product |
Description/Application | |||
| Class A Motorized RVs (Gas, Diesel)
|
• Class A motorized RVs can be as long as 45 feet and are usually equipped with a rear master suite including a full bathroom and shower and many include a washer/dryer unit on board • Today’s Class A motorized RVs tend to have multiple slide outs (some can expand to a width of over 14 feet), large flat screen TV’s, surround sound systems and even dishwashers and ice machines • Basement storage can carry enough supplies to keep users comfortably on the road for long periods of time including comfortable sleeping accommodations • Constructed on a commercial truck chassis, a specially designed motor vehicle chassis or a commercial bus chassis, a Class A motorized RV resembles a bus in design and has a flat or vertical front end with large forward windows | |||


92
Table of Contents
Commercial
| Recreation Product |
Description/Application | |||
| Class C Motorized RVs
|
• Class C motorized RVs make use of a standard van or truck chassis as the driving portion of the RV, allowing better access to the cab portion from the outside, since there are entry doors on both sides • The house (or camper) portion of the RV extends over the cab area and which commonly has a sleeping compartment or other uses such as storage or entertainment • Fewer amenities and living space compared to Class A motorized RVs while meeting requirements for comfortable living • A Class C motorized RV is equipped with a kitchen/dining area featuring a refrigerator/freezer, a propane range (sometimes with an oven), a microwave oven and a table with seating. It also has a lavatory with a bath/shower, one or more sleeping areas and additional seating towards the front. An air conditioner, water heater, furnace and outside canopy are also typically included • Class C motorized RVs often feature a towing hitch enabling the pulling of a light weight trailer for boats or a small car or truck | |||

Distribution
We distribute either through our direct sales force or our well-established dealer network, consisting of approximately 575 dealers. Substantially all of our dealers are independently owned. Whether we sell directly to the customer or through a dealer depends largely on the product line and the customer base. We provide our direct sales force representatives and dealers with training on the operation and specifications of our products. We strive to keep our direct sales force representatives and dealers up to date on our product offerings and new features as well as market trends. We believe our scale enables us to dedicate certain sales and marketing efforts to particular products, customers or geographic regions, which we believe enables us to develop expertise valued by our customers.
As one of the leaders in each of our markets, we believe our distribution network consists of many of the leading dealers within each segment. We believe our extensive dealer network has the ability to meet the needs of end customers with high to low value added products, such as vehicles, equipment, components and parts and services, at a variety of price points and order sizes. As a result, most of our dealers have sold our products for over a decade and are serving a well-established installed base of end customers, creating cost advantages and entrenched positions due to customer loyalty. We believe we are a key supplier to many of the leading customers in our markets, such as FDNY (ambulances and fire apparatus), AMR (ambulances), First Student (school buses), PACE (transit buses), Hutchinson Ports (terminal trucks) and Lazydays (RVs), among others. We also periodically assist our dealers in composing bid packages for larger opportunities that involve our product lines. We continue to grow and enhance our distribution network into underserved areas. In addition, we evaluate export opportunities from time to time in select international markets through our direct sales force and our established international dealerships and agents.
Fire & Emergency Segment
We sell our ambulances through internal direct sales personnel and a national independent dealer network. The direct sales force is responsible for establishing new accounts and servicing existing customers in California, Florida, Ohio and other selected markets across the United States. Approximately 50 dealers cover our domestic market sales and we believe most hold a leading position in ambulance sales in their respective regions, providing us with a significant competitive advantage. In addition, we export to most of the international markets that utilize a United States style chassis such as certain countries in the Middle East and Latin America.
93
Table of Contents
Our fire apparatus business uses its direct sales force and its dealer network comprised of approximately 66 dealers in the United States and Canada and approximately 25 international dealers to sell its products. We have continued to grow our distribution network into underserved areas. For example, historically our fire apparatus business did not serve the stainless steel component of the industry, but we have recently invested in a new facility to service that market. As such, we believe there are significant opportunities to grow our dealer footprint to serve this market. We believe that with our new product and dealer network in this area, we will begin to capture additional market share going forward.
Commercial Segment
We utilize dealer distribution in markets where a well-managed and experienced dealer is available. Selling through a dealer can be more cost effective than utilizing direct sales personnel in some cases. As a result, we continually evaluate potential dealer relationships to determine if the addition of a dealer in a given region would be advantageous to net sales and our market share. In addition to our dealer network, we also utilize direct national accounts, such as school transportation contractors, national child care providers, hotels, rental car and parking lot operators, nursing and retirement homes and church organizations.
The Capacity brand utilizes a combination of a direct sales force, international agents and dealers to market its products worldwide. Capacity also utilizes an extensive network of dealers in the United States and Canada.
The Lay-Mor brand is principally marketed in both commercial and rental markets through the manufacturer’s representatives who are supported by our internal sales efforts with key customers, such as national equipment rental companies. Our direct sales personnel work directly with national customers to ensure that Lay-Mor equipment meets customers’ specifications and is qualified for sale throughout their national network.
Recreation Segment
We sell our RV products through a national independent dealer network with internal sales personnel responsible for working directly with these dealers. RV purchases are sensitive to wholesale and retail financing, consumer confidence and disposable income, making them discretionary products. Due to these industry dynamics, the RV market was negatively affected by the most recent economic downturn and has been improving toward historical annual volume levels. The largest RV buying group is people between the ages of 35 and 54, with an average age of all RV owners of 48, according to the RVIA. Buyers of RVs are brand loyal, repeat buyers who make decisions based on brand, product configuration (primarily floor plan design, features and product styling), service and price. This buying group is expected to grow as the baby boom generation continues to age. For many of these buyers, a motor home purchase is the second biggest purchase in their lifetime; therefore, the shopping timeline is longer than other consumer purchases. The buying process normally starts with online searches, followed by show visits and eventually a dealership visit for the purchase.
Customers and End Markets
Our end markets include the municipal market (vehicles for essential services such as emergency response, patient transportation and student transportation), the private contractor market (privately owned fleets that provide transportation services), the consumer market (vehicles for transportation, leisure and mobility needs) and the industrial/commercial markets (vehicles for transportation, construction projects and global port and intermodal transportation applications). Based on aggregated available industry data, we estimate that the combined size of our annual addressable markets is approximately 112,000 vehicles with $800 million of potential aftermarket parts sales at current market volume levels.
Our top 10 customers combined accounted for approximately 25% of our net sales for fiscal year 2016, with no customer representing more than 6% of our net sales in the same period. We and our predecessor and acquired
94
Table of Contents
companies have operated in our businesses for many years, and many of our brands have been trusted names in the marketplace for decades. As a result, we are able to take advantage of many long-term customer relationships.
Approximately 54% of our net sales for fiscal year 2016 were made directly or indirectly to governmental bodies, including municipalities, such as fire departments, school districts, hospitals and the U.S. federal government. For fiscal year 2016, our approximate direct or indirect net sales by end market was as follows: 54% government, 25% consumer, 13% private contractor and 8% industrial/commercial.
For fiscal years 2016 and 2015, approximately 99% and 97%, respectively, of our net sales were to customers located in the United States and Canada.
Growth in our end markets are driven by various macro-economic and demographic factors including:
| • | Population demographics—Overall population growth and the aging population creates greater needs for essential services such as emergency care, healthcare services, transportation and interest in retirement activities including travel and leisure. |
| • | Increasing state and local government investment—Improving housing prices, improving economies and new housing starts all create an increasing tax base and greater demand for essential services provided by governmental agencies. |
| • | Pent-up replacement demand for essential vehicles—Since the 2008 recession, the replacement volumes of fire apparatus and ambulances in the United States has lagged behind historical averages that we believe create a necessarily higher replacement demand in the future for the vehicles we produce. |
| • | Urbanization of the U.S. population—Growing urban population characterized by higher populations and the movement of people to the cities within the United States drives additional construction and housing demand that results in greater need for transportation and emergency services to maintain service and response levels by our end customers. |
| • | Increasing popularity for outdoor lifestyles—There is a growth of interest in outdoor recreational activities and the opportunity to better access large areas through the use of RVs. The RV lifestyle and demand for our vehicles is supported by the continued positive growth in the consumer base which includes the increased industry penetration of the baby boomer generation as well as the fastest growing RV owner group which includes Generation X consumers, as estimated by RVIA. |
Manufacturing and Service Capabilities
We currently operate 15 manufacturing plants and 11 aftermarket service centers (called Regional Technical Centers or “RTCs”) across the United States with approximately 4.9 million square feet of manufacturing and service space. We believe that our factories are among some of the most efficient and lowest cost production facilities in each of our markets due to the production processes that we employ, our purchasing scale and the high unit volume throughput relative to most of our competitors. Our design and assembly processes are characterized by low capital expenditure requirements such that our three-year average capital expenditures are less than 2% of net sales and are primarily attributable to facility and equipment upgrades and maintenance. In addition, approximately 85% of our cost of goods sold are comprised of direct materials (including chassis) and direct labor, which are variable in nature because these costs are associated with the specific production of our vehicles in each period and therefore are adjusted within a given period based on production levels in that period. Our products within each of our segments and across the enterprise share a centralized sourcing model and engineering and manufacturing processes. Through our manufacturing infrastructure, we leverage our capabilities and scale in procurement, new product development, design, assembly and painting processes. We also leverage best practices in quality control and worker safety across our segments.
95
Table of Contents
We strive to instill a manufacturing culture of continuous improvement. Each of our direct labor employees is taught lean manufacturing principles and other operational best practices to improve the efficiency of their production processes and enhance their employment experience. The commonality and scale of production processes across all of our factories in the areas of chassis production/preparation, product assembly and flow processes and “body” and apparatus design and manufacturing allow us to share efficiency and operational best practices across our segments.
Our growing RTC footprint is strategically placed throughout the United States and our locations are staffed with technicians and customer service representatives to support our approximately 240,000 installed base of vehicles. Our RTCs complement our dealer network to provide our end users with the parts and service that they need to keep their fleets operating and to meet the demand of their customers. The services that we provide at our RTC locations include normal maintenance and service activities, damage repair and rebuilding services. Rebuilding services include manufacturer certified repair and apparatus remounting processes that can extend the life of a vehicle and reduce the total cost of ownership for our end users.
Engineering, Research and Development
We believe our engineering, research and development capabilities are essential to ensure we remain competitive in the markets in which we operate. With approximately 135 employees with engineering degrees, we engage in new product development, enhancement and testing to improve both existing products and the development of new vehicles and components.
Virtually all of our vehicle sales require some level of custom engineering to meet customer specifications and evolving industry standards. In the Fire & Emergency segment, engineering and development activities include the design and production of customized equipment to meet the specific needs and applications of our customers. In the Commercial segment, the design and functionality of our buses and specialty equipment is constantly updated to improve passenger safety, functionality, access and comfort. In the Recreation segment, overall design, floorplan layout, functionality and amenities require frequent updating to address changes in consumer preferences and to enhance our existing product offerings.
Research and development (“R&D”) costs are expensed as incurred and included as part of operating expenses in the Company’s consolidated statements of operations. The Company’s R&D costs include only those incurred for the design of a new vehicle platform that is made commercially available to a broad portion of our end markets. Our R&D expenses do not include the costs to design and develop specific customized products to individual customers or end users. These costs are included as normal production costs associated with the sale of the specific product for which they were incurred. R&D costs totaled $4.8 million, $5.1 million and $8.3 million for fiscal years 2016, 2015 and 2014, respectively.
Suppliers and Materials
During fiscal year 2016, we purchased $1.3 billion of chassis, direct materials and other components from outside suppliers. The largest component of these purchases was for vehicle chassis, representing 34% of the total purchase amount. These chassis are sourced from major automotive manufacturers, including Ford, Freightliner and General Motors, and other original equipment manufacturers (“OEMs”). These OEMs provide us with standardized, mass-produced chassis models, which we then convert for our customers under approved “authorized converter” agreements with the OEMs. We have tailored our products and processes to the specifications of these OEM agreements, and have built customer expectations and planning around these designs. Therefore, we are reliant on a consistent supply of chassis and the maintenance of our status as “approved converters” in order to maintain our sales.
We also purchase and utilize other materials in our production processes including: steel and aluminum in our apparatus and passenger compartment manufacturing, engines and drivetrain (transmissions, axles) components for our manufactured chassis in the transit bus, RV, fire apparatus and terminal truck businesses,
96
Table of Contents
lighting packages for our emergency and school bus products and HVAC systems and parts, seats and seatbelts, doors, lifts, electrical switches and components, hydraulic components and miscellaneous hardware. We also purchase materials that contain or are composed of certain raw or base materials such as paint, fiberglass parts and chassis body components, wood and wood parts, brass and certain other petroleum-based resins such as plastic. Our top 10 purchased items, other than chassis, represented 34% of our total cost of materials for fiscal year 2016.
We utilize a centralized sourcing model that includes a dedicated team of procurement professionals to complement our segment sourcing teams so that we can coordinate and leverage our purchases across a diverse supplier base. Our centralized sourcing model leverages our growing scale within our markets to achieve competitive pricing and ensure availability. Furthermore, we have historically integrated our acquired companies into our centralized sourcing model to lower their costs. We do not typically enter into sourcing arrangements that are more than 12 to 18 months in duration and we do not undertake defined purchase agreements requiring fixed commitments or “take or pay” requirements with our vendors.
We strive to maintain strong and collaborative relationships with our suppliers and believe that the sources for these inputs are well-established, generally available on world markets and are in sufficient quantity, other than chassis, such that we would expect to avoid disruption to our businesses if we encountered an interruption from one of our key suppliers.
Intellectual Property
Patents and other proprietary rights are important to our business and can provide us with a competitive advantage. We also rely on trade secrets, design and manufacturing know-how, continuing technological innovations and licensing opportunities to maintain and improve our competitive position. We periodically review third-party proprietary rights, including patents and patent applications, in an effort to avoid infringement on third-party proprietary rights and protect our own, identify licensing or partnership opportunities and monitor the intellectual property claims of others.
We own a portfolio of intellectual property, including approximately 50 patents, confidential technical information and technological expertise in manufacturing specialty vehicles. We also own approximately 330 registered trademarks in the United States for certain trade names and important products. Due to the markets in which we operate, we believe that our trade names are the most valuable component of our intellectual property. We believe that our intellectual property rights, confidentiality procedures and contractual provisions are adequate for our business and have an active program to maintain these rights. Our well-respected and widely recognized proprietary trade names include: E-ONE, KME, Wheeled Coach, American Emergency Vehicles (“AEV”), Horton Emergency Vehicles (“HEV”), Leader Emergency Vehicles (“LEV”), Marque, McCoy Miller, Eldorado, Champion, Collins, Goshen Coach, ENC, World Trans, Capacity, Lay-Mor, Fleetwood RV, Monaco, American Coach and Holiday Rambler.
While we consider our patents and trademarks to be valued assets, we do not believe that our competitive position is dependent primarily on our patents or trademarks or that our operations are dependent upon any single patent or group of related patents to manufacture our products. We nevertheless face intellectual property-related risks. For more information on these risks, see “Risk Factors—Risks Relating to Our Business—Intellectual property risks may adversely affect our business and may dilute our competitive advantage.”
Environmental, Health and Safety Laws and Regulations
We are subject to a wide range of federal, state, local and foreign general and industry-specific environmental, health and safety laws and regulations, including those relating to water discharges, air emissions, the generation, storage, handling, use, release, disposal and transportation of hazardous materials and wastes, environmental cleanup, the health and safety of our employees and the fuel economy and emissions of the vehicles we manufacture. Certain of our operations require environmental, health and safety permits or other
97
Table of Contents
approvals from governmental authorities, and certain of these permits and approvals are subject to expiration, denial, revocation or modification under various circumstances. Compliance with these laws, regulations, permits and approvals is a significant factor in our business. From time to time, we incur significant capital and operating expenditures to achieve and maintain compliance with applicable environmental, health and safety laws, regulations, permits and approvals. Our failure to comply with applicable environmental, health and safety laws and regulations or permit or approval requirements could result in substantial liabilities or civil or criminal fines or penalties or enforcement actions, including regulatory or judicial orders enjoining or curtailing operations or requiring remedial or corrective measures, installation of pollution control equipment or other actions, as well as business disruptions, which could have a material adverse effect on our business, financial condition and operating results.
In addition, we may be responsible under environmental laws and regulations for the investigation, remediation and monitoring, as well as associated costs, expenses and third-party damages, including tort liability and natural resource damages, relating to past or present releases of hazardous substances on or from our properties or the properties of our predecessor companies, or third-party sites to which we or our predecessor companies have sent hazardous waste for disposal or treatment. Liability under these laws may be imposed without regard to fault and may be joint and several. For example, in April 2012, we received a request for information from the EPA regarding the contamination of soil and groundwater at the San Fernando Valley Area 2 Superfund Site (the “San Fernando Site”). This site is regional in scale, encompasses large portions of the Los Angeles area, and potentially involves many persons (known as “potentially responsible parties” or “PRPs”). The EPA has overseen investigative and remedial activities at the San Fernando Site for many years. Historically, the agency has focused on volatile organic compound (“VOC”) contamination. More recently, the EPA identified chromium as a contaminant of concern at the San Fernando Site, and we believe that it was in that connection that the EPA sent us a request for information regarding whether a prior owner or operator of a facility located within the boundary of the San Fernando Site is a predecessor company to us (although we do not currently operate a facility in such area). The precise nature and extent of VOC and chromium contamination at the San Fernando Site, the nature and cost of any remedial actions that the EPA may require in connection with such contamination, the number and identity of PRPs that might share in responsibility for the VOC and chromium contamination, and whether the Company will become involved as a PRP are not known at this time. If we were to become involved as a PRP at the San Fernando Site, we could be compelled to contribute to the cost of investigations and remediation at the site. We are unable to estimate the potential impact of this liability at this time, and our ability to collect on our insurance policies for remediation costs or damages in connection with any claims relating to the San Fernando Site is unknown at this time. This liability would be allocated among us and other PRPs that are solvent. See “Risk Factors—Risks Related to Our Business—Our operations and the industries in which we operate are subject to environmental, health and safety laws and regulations, and we may face significant costs or liabilities associated with environmental, health and safety matters.”
Product Safety Regulation
We aim to build our products to the highest safety standards within the industry. As we are a specialty vehicle manufacturer, we build our products to a multitude of vehicle safety standards. As noted below, we build our products to adhere to the following standards in our markets.
Bus Market
Our bus products follow design, construction, performance, and durability requirements defined in the Federal Motor Vehicle Safety Standards (“FMVSS”). Where applicable, bus products also comply with the vehicle requirements of the Americans with Disabilities Act (“ADA”), which help ensure safety and accessibility for transporting passengers with disabilities. For school buses, most states have established additional construction and performance requirements for state-funded school buses.
98
Table of Contents
Fire Market
Our fire products adhere to the highest safety standards within the industry. These standards include the following: ISO 9001—2008 / NFPA 1901 for Automotive Fire Apparatus, where specified / NFPA 1906 for Wildland Fire Apparatus, where specified / NFPA 414 and NFPA 412 for Aircraft Rescue Fire Fighting vehicles / UL Inspection Program (VIP) for NFPA 1901 and ULC S515 for Fire Apparatus sold in Canada (where specified) / FMVSS—Federal Motor Vehicle Safety Standards / CMVSS—Canadian Motor Vehicle Safety Standards / Economic Commission for Europe (ECE) R-29 / Society of Automotive Engineers (SAE) Standards where specified / Underwriters Laboratories (UL & ULC) / Federal Aviation Administration (FAA) AC 150/5220-10E / International Civil Aviation Organization (ICAO) / China Compulsory Certification (CCC).
Ambulance Market
We build and certify our ambulance vehicles as “STAR of LIFE compliant” in accordance with KKK-A-1822F rev 9 guidelines. KKK-A-1822F rev 9 is the most common specification and requires compliance to all FMVSS standards as well as selected SAE standards. KKK-A-1822F rev 9 utilizes National Truck Equipment Association (“NTEA”) Ambulance Manufacturers Division (“AMD”) required testing standards.
The ambulances we manufacture receive the STAR of LIFE compliance sticker. When we ship a vehicle to a state that does not require full compliance to KKK-1822-F rev 9, we include on the compliance label any exceptions and deviations from that standard. Today 24 states enforce a strict adherence to the KKK-A-1822F rev 9 standard. The remaining 26 states use elements of this General Services Administration document plus their own additions to comprise their individual state requirements.
Recreation Market
Our Recreation segment products adhere to the following standards: FMVSS / RVIA (RV Industry Association) / CMVSS (Canadian Motor Vehicle Safety Standards) / CSA (Canadian Standards Association).
Terminal Trucks Market
Our terminal trucks meet or exceed FMVSS standards and include the appropriate EPA tier certified engines in all of their vehicles. Capacity also follows all SAE recommendations as well as Technology Maintenance Council recommended practices.
Competition
The markets in which we participate are highly competitive. We compete with both divisions of large, diversified companies as well as private and public companies which are pure play participants in one of our product markets. Several of our competitors may have more financial resources than us but we have also been increasing the scope and scale of the products we produce and the markets we serve. We believe that through this growth we are developing a relatively scaled business across all three of our segments, which creates a competitive advantage against a large portion of our competition and makes us more relevant compared to our larger competitors. We believe that we have been able to effectively compete on the basis of product quality and reliability, total cost of ownership, breadth of product offerings, manufacturing capability and flexibility, client-specific customization, price, technical capability, product innovation, customer service and delivery times. We also believe that we are improving our competitive position by expanding our parts and service business model through our development of our aftermarket service centers, which we refer to as Regional Technical Centers. The combination of our products, aftermarket support and large installed base of vehicles provides us with a competitive advantage across our end markets.
In the Fire & Emergency segment, our competition includes Pierce Manufacturing (Oshkosh Corp.), Rosenbauer International, Spartan Motors, Inc., Braun Industries, Inc., Demers Ambulance, Ferrara Fire Apparatus, FWD Seagrave and Life Line Emergency Vehicles, among others. In the Commercial segment, our
99
Table of Contents
competition includes Starcraft Bus (Forest River), Thomas Bus (Daimler), Blue Bird Corporation, Gillig, Nova Bus (Volvo), Navistar International, Inc., BraunAbility, Vantage Mobility International (VMI), TICO, Kalmar (Cargotec) and New Flyer Industries, Inc., among others. In the Recreation segment, our competition includes Thor Industries, Inc., Winnebago Industries, Inc., Forest River, Tiffin Motorhomes, Inc. and Newmar Corporation, among others.
Employees
As of October 29, 2016, we had approximately 6,000 employees. Our employees are not currently represented by a labor union or collective bargaining agreement. We believe that our relationship with our employees is good.
Facilities
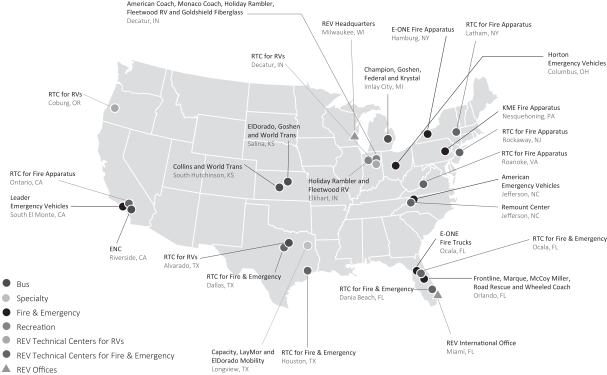
100
Table of Contents
We maintain corporate office space in Milwaukee, Wisconsin and Miami, Florida. The locations of the RTCs and manufacturing properties that we currently own or lease are listed below. We believe that our facilities are suitable and adequate for the purposes for which they are used and are adequately maintained.
| RTCs |
Approximate Square Feet |
Segment |
Owned or | |||||
| Coburg, Oregon |
36,000 | Recreation | Leased | |||||
| Ontario, California |
18,000 | Fire & Emergency | Owned | |||||
| Decatur, Indiana |
90,000 | Recreation | Owned | |||||
| Dallas, Texas |
50,000 | Fire & Emergency and Commercial | Leased | |||||
| Alvarado, Texas |
35,000 | Recreation | Owned | |||||
| Dania Beach, Florida |
4,000 | Fire & Emergency | Leased | |||||
| Ocala, Florida |
63,000 | Fire & Emergency | Owned | |||||
| Rockaway, New Jersey |
5,000 | Fire & Emergency | Leased | |||||
| Roanoke, Virginia |
60,000 | Fire & Emergency | Owned | |||||
| Latham, New York |
14,000 | Fire & Emergency | Leased | |||||
| Houston, Texas |
4,000 | Fire & Emergency | Leased | |||||
|
|
|
|||||||
| Total |
379,420 | |||||||
| Manufacturing Facility Locations |
Approximate Square Feet |
Brand(s) Produced |
Owned or | |||||
| Columbus, Ohio |
173,000 | Horton Emergency Vehicles | Owned/Leased | |||||
| Decatur, Indiana |
1,155,000 | Fleetwood RV, American Coach, Monaco, Holiday Rambler | Owned | |||||
| Decatur, Indiana |
260,000 | Goldshield | Owned | |||||
| Elkhart, Indiana |
161,000 | Fleetwood RV, Holiday Rambler | Owned | |||||
| Hamburg, New York |
87,000 | E-ONE | Leased | |||||
| Imlay City, Michigan |
186,000 | Champion Bus, Federal, Goshen Coach | Owned | |||||
| Jefferson, North Carolina |
336,000 | American Emergency Vehicles | Owned | |||||
| Longview, Texas |
154,000 | Capacity of Texas, Lay-Mor, ElDorado Mobility | Owned | |||||
| Los Angeles, California |
33,000 | Leader Emergency Vehicles | Leased | |||||
| Nesquihoning, Pennsylvania |
577,000 | KME | Owned | |||||
| Ocala, Florida |
390,000 | E-ONE | Owned | |||||
| Riverside, California |
227,000 | ENC | Owned | |||||
| Salina, Kansas |
252,000 | ElDorado National, Krystal, Goshen Coach | Owned | |||||
| South Hutchinson, Kansas |
267,000 | Collins Bus, World Trans | Owned | |||||
| Winter Park, Florida |
222,000 | Wheeled Coach, Road Rescue, McCoy Miller, Frontline, Marque | Owned | |||||
|
|
|
|||||||
| Total |
4,480,000 | |||||||
Legal Proceedings
We are, from time to time, party to various legal proceedings arising out of our ordinary course of business. The amount of alleged liability, if any, from these proceedings cannot be determined with certainty; however, we believe that our ultimate liability, if any, arising from pending legal proceedings, as well as from asserted legal claims and known potential legal claims, which are probable of assertion, taking into account established accruals for estimated liabilities, should not be material to our business, financial condition or results of operations.
101
Table of Contents
Executive Officers and Directors
Below is a list of the names, ages as of the date of this prospectus and positions, and a brief account of the business experience of the individuals who serve as our executive officers and directors as of the date of this prospectus.
| Name |
Age | Position | ||
| Tim Sullivan |
63 | Chief Executive Officer and Director | ||
| Dean Nolden |
48 | Chief Financial Officer | ||
| Pamela Krop |
58 | General Counsel | ||
| Barbara Stephens |
57 | Chief Human Resources Officer | ||
| Marcus Berto |
46 | Executive Vice President | ||
| Thomas Phillips |
71 | Chief Operating Officer | ||
| Stephan Engler |
37 | Chief Information Officer | ||
| Paul Bamatter |
60 | Director | ||
| Jean Marie “John” Canan |
60 | Director | ||
| Dino Cusumano |
42 | Director | ||
| Charles Dutil |
50 | Director | ||
| Justin Fish |
34 | Director | ||
| Kim Marvin |
55 | Director | ||
| Joel Rotroff |
34 | Director | ||
| Donn Viola |
71 | Director |
Tim Sullivan, Chief Executive Officer
Mr. Sullivan currently serves as Chief Executive Officer and Director of REV, positions that he has held since August 2014. Previously, Mr. Sullivan was Chairman and Chief Executive Officer of Gardner Denver, Inc., a manufacturer of oil and gas, medical and industrial pumps and compressors, from 2013 to 2014 and the Chairman and Chief Executive Officer of Bucyrus International, Inc., a manufacturer of mining equipment, from 2000 to 2011. In 2012, he served as a special consultant to Wisconsin’s Governor and he chaired the Wisconsin Governor’s Council on Workforce Investment and the Wisconsin Governor’s College and Workforce Readiness Council. He is a current director of Aurora Healthcare, Carroll University and the Metropolitan Milwaukee Association of Commerce. He is a former director of Big Brothers Big Sisters of Greater Milwaukee, Boys and Girls Clubs of Greater Milwaukee, Bucyrus International, Inc., Children’s Hospital of Wisconsin, Cliffs Natural Resources, Inc., Crosby, Inc., Generac, Inc., the Greater Milwaukee Committee, Medical College of Wisconsin, Milacron, Inc., Milwaukee School of Engineering, National Mining Association in Washington, D.C., Northwestern Mutual Life Insurance Company, Southeast Wisconsin Business Health Coalition, St. Ann Center for Intergenerational Care, United Way of Greater Milwaukee and the University of Wisconsin Milwaukee Business Advisory Council. Mr. Sullivan holds a bachelor of science degree in business administration from Carroll University and a master of business administration degree from Arizona State University’s Thunderbird School of International Management. Because of his deep knowledge of REV and his extensive background in the industry, we believe Mr. Sullivan is well-qualified to serve on our Board of Directors.
Dean Nolden, Chief Financial Officer
Mr. Nolden currently serves as Chief Financial Officer of REV, a position he has held since January 2016. Prior to joining REV, Mr. Nolden worked at The Manitowoc Company, Inc. since 1998, where he held numerous positions within the finance department, including Vice President of Finance and Treasurer. Prior to his tenure at Manitowoc, Mr. Nolden spent eight years in public accounting in the audit practice of PriceWaterhouseCoopers LLP. Mr. Nolden is a graduate of the University of Wisconsin-Madison, where he earned a bachelor of business administration degree in accounting. Additionally, Mr. Nolden holds a master of business administration from Marquette University.
102
Table of Contents
Pamela Krop, General Counsel
Ms. Krop currently serves as General Counsel of REV, a position she has held since January 2016. Ms. Krop brings more than 30 years of legal experience to REV, 25 years of which were in corporate counsel positions, with over 15 years in General Counsel roles. Before joining REV, Ms. Krop was Senior Vice President and General Counsel of Intermedix Corporation from 2012 to 2015. Prior to that, she was Senior Vice President and General Counsel for St. Jude Medical, Inc. and spent 15 years at various General Electric businesses. Ms. Krop received a bachelor of arts degree in psychology from the University of Florida and her juris doctor degree from Stanford Law School.
Barbara Stephens, Chief Human Resources Officer
Ms. Stephens has served as Chief Human Resources Officer since February 2016. She has more than 20 years of human resources experience in the fields of mining and manufacturing, leading the functions of environmental health and safety, communications and human resources. Before joining REV, Ms. Stephens served as the Senior Vice President of Human Resources for Bucyrus International, Inc. from 2005 to 2011. Prior to 2005, she held roles in human resources for Snap-on Tools. Ms. Stephens currently serves as an independent director and chair of the compensation committee on the board of First Business Financial Services, Inc. based in Madison, Wisconsin. Mrs. Stephens earned a bachelor of liberal studies degree from the University of Evansville and a master of science degree in education, workforce education and development from Southern Illinois University.
Marcus Berto, Executive Vice President
Mr. Berto has served as Executive Vice President of REV since 2014 and has more than 20 years of commercial product and business development experience. Prior to joining REV, Mr. Berto served as Chief Executive Officer of Prumo Global Logistics SA in Brazil from 2012 to 2013. Mr. Berto held various leadership positions, including Senior Executive Vice President at Bucyrus International where he was responsible for the Southern Hemisphere region; Vice President Corporate Development at a Canadian mining company; and 12 years with PriceWaterhouseCoopers LLP and Arthur Andersen. Mr. Berto earned his accounting degree from the Pontafica Universidade Catolica (Belo Horizonte—Minas Gerais, Brazil) and earned a master of business administration degree with a focus in international general management and mergers and acquisitions from Fundacao Dom Cabral in Brazil. He also completed an Advanced Management Program (AMP—181) at Harvard University in 2011.
Thomas Phillips, Chief Operating Officer
Mr. Phillips has served as Chief Operating Officer of REV since February 2016. As Chief Operating Officer, Mr. Phillips is responsible for all corporate sourcing, quality, materials management and operations. Mr. Phillips served as a consultant to REV from July 2015 through January 2016, and prior to that, worked for Bucyrus International, Inc. for 35 years where he held numerous operational roles and retired as Chief Operating Officer in 2006. Mr. Phillips is a graduate of the University of Wisconsin-Milwaukee where he earned his bachelor of science degree in economics.
Stephan Engler, Chief Information Officer
Mr. Engler has served as Chief Information Officer of REV since January 2016. He has more than 15 years of global business operations and technology experience. Prior to joining REV, Mr. Engler served as Vice President of the Global Industrial Division of Gardner Denver from 2013 to 2016. Mr. Engler has also held various technology and operational leadership positions at Bucyrus International and DBT GmbH. Mr. Engler holds a master of administration degree from Bradley University.
103
Table of Contents
Paul Bamatter, Director
Mr. Bamatter has served as a member of our Board of Directors since 2016. Mr. Bamatter served as a Vice President and Secretary of REV and many of REV subsidiaries from 2008 until 2016. He is also a Partner and Chief Financial Officer at AIP, an organization he joined in 2005. Previously, he served as Chief Financial Officer and Chief Operating Officer of Consoltex Holdings, Inc. Mr. Bamatter also served as a Senior Manager at PriceWaterhouseCoopers, where he managed the worldwide audits for several banking and manufacturing multinational businesses. Mr. Bamatter graduated from Bishop’s University with bachelor of business administration degree in accounting and finance. Mr. Bamatter earned his Chartered Accountancy designation in Canada in 1981. Because of his significant academic training, current and previous financial experience and his deep knowledge of REV’s operating history, we believe Mr. Bamatter is well-qualified to serve on our Board of Directors.
Jean Marie “John” Canan, Director
Mr. Canan has served as a member of our Board of Directors since August 2016 and brings over 34 years of strategic, business development and financial leadership experience to REV. Mr. Canan recently retired from Merck & Co., Inc., where he held a number of positions, including Senior Vice President, Global Controller and Chief Accounting Officer. Mr. Canan is also a member of the Board of Directors of Acasti Pharma, where he chairs the Audit Committee. Mr. Canan serves on the Board of Trustees and is Chairman of the Audit & Risk Committee of the Angkor Hospital for Children based in Cambodia. Mr. Canan graduated from McGill University with a bachelor of commerce degree and is a Canadian Chartered Accountant. Because of his over 34 years of strategic, business development and financial expertise, we believe Mr. Canan is well-qualified to serve on our Board of Directors.
Dino Cusumano, Director
Mr. Cusumano has served as a member of our Board of Directors since 2008. Mr. Cusumano was a Vice President of REV from 2008 until February 2016. He is also a general partner at AIP, an organization he joined in 2000. Previously, he served in the Investment Banking Department of J.P. Morgan & Co. Inc., where he worked on merger and acquisition and capital raising transactions, primarily in the industrial sector. In addition, Mr. Cusumano served in the Investment Banking Department at Wedbush Morgan Securities. Mr. Cusumano graduated from the University of Notre Dame, where he received a bachelor of business of administration degree in finance. He is a CFA charterholder. Because of his extensive financial and investing background and his deep knowledge of REV’s history and organization, we believe Mr. Cusumano is well-qualified to serve on our Board of Directors.
Charles Dutil, Director
Mr. Dutil has served as a member of our Board of Directors since 2016 and brings over 25 years of experience in commercial vehicle manufacturing to REV. Since 2002, he has served as President and Chief Executive Officer of Manac Inc. Before that, Mr. Dutil served in various senior positions at Manac Inc., including Executive Vice President and Vice President of Marketing. He also sits on the Boards of Directors of Fondation Nordiques and Béton Bolduc Inc. Previously, he was a Director of the Groupe Environnemental Labrie Inc., the Truck Trailer Manufacturers’ Association, FIER Entrepreneur, Fondation du Centre de Réadaptation Physique Chaudière-Appalaches and Groupe Harnois. Mr. Dutil is a graduate of HEC Montréal and Western Business School. Because of his extensive business experience, we believe Mr. Dutil is well-qualified to serve on our Board of Directors.
Justin Fish, Director
Mr. Fish has served as a member of our Board of Directors since 2016. He is a partner at AIP, an organization he joined in 2012. Previously, he served as an investment associate for Chilton Investment
104
Table of Contents
Company. In addition, Mr. Fish has held a variety of financial, supply chain and operational roles with Lear Corporation. Mr. Fish also serves on the Board of Directors of Carlstar Group LLC and Gerber Scientific LLC. Mr. Fish graduated from Michigan State University’s Eli Broad College of Business with a bachelor of arts degree in finance. He holds a master of business administration degree from the Stanford Graduate School of Business. Because of his financial, supply chain and operational expertise, we believe Mr. Fish is well-qualified to serve on our Board of Directors.
Kim Marvin, Director
Mr. Marvin has served as a member of our Board of Directors since 2008. He is a general partner at AIP, an organization he joined in 1997. Previously, he served in the Mergers and Acquisitions and Financial Institutions Groups of Goldman, Sachs & Co. Before that, he was Chief Operating Officer of the American Original Corporation. Mr. Marvin received a bachelor of science degree in ocean engineering from the Massachusetts Institute of Technology. He also holds a master of business administration degree from Harvard Business School. Because of his deep knowledge of REV, we believe Mr. Marvin is well-qualified to serve on our Board of Directors.
Joel Rotroff, Director
Mr. Rotroff has served as a member of our Board of Directors since 2016. Mr. Rotroff joined AIP in 2012. Mr. Rotroff previously served as an analyst and associate at Baird Private Equity from 2006 to 2010. Prior to his employment with Baird Private Equity, Mr. Rotroff worked in the Healthcare group in the Investment Banking Division of Piper Jaffray & Co. Prior to Piper Jaffray & Co., Mr. Rotroff worked as a member of the Business Planning team at Boston Scientific. Mr. Rotroff holds a bachelor of science degree in biomedical engineering from the University of Wisconsin, with honors and distinction, a master of engineering degree from Duke University and a master of business administration degree from the J.L. Kellogg School of Management at Northwestern University. Mr. Rotroff also serves on the Boards of Directors of AIP Aerospace LLC, Carlstar Group LLC and Optimas OE Solutions, LLC. Because of his extensive financial experience, we believe Mr. Rotroff is well-qualified to serve on our Board of Directors.
Donn Viola, Director
Mr. Viola has served as a member of our Board of Directors since 2008. He was the Chief Operating Officer of Donnelly Corporation from 1996 until his retirement in 2002. Prior to this, he served as Chief Operating Officer and as a director of Mack Trucks Inc. Mr. Viola is currently on the Boards of Directors of Unique Fabricating, Inc. and Defiance Metal Products, Inc. He previously served on the Boards of Directors of Manac Inc. and Williams Controls, Inc. Mr. Viola holds a bachelor of science in mechanical engineering from Lehigh University. Because of his extensive management background, we believe Mr. Viola is well-qualified to serve on our Board of Directors.
Other Key Employees
Below is a list of the names, ages as of the date of this prospectus and positions, and a brief account of the business experience of the individuals who serve as other key employees in our organization as of the date of this prospectus.
| Name |
Age | Position | ||||
| Robert Collins |
62 | President, REV Ambulance Group | ||||
| Greg Heichelbech |
51 | President, REV Specialty Products | ||||
| Jim Jacobs |
52 | President, REV RV Group | ||||
| Dan Peters |
56 | President, REV Fire Group | ||||
| John Walsh |
51 | President, REV Bus Group | ||||
105
Table of Contents
Robert Collins
Mr. Collins currently serves as President, REV Ambulance Group, a position he has held since January 2016. Prior to his current role, he was President of Wheeled Coach Industries, a position he held since 1995. Robert served in various other positions at Wheeled Coach since 1977, including Vice President of Operations and Vice President of Sales and Marketing. Robert graduated from the University of Central Florida in 1977 with a bachelor of science degree in business.
Greg Heichelbech
Mr. Heichelbech currently serves as President, REV Specialty Products, a position he has held since January 2016. Prior to joining REV, Mr. Heichelbech worked at Triumph Motorcycles of North America, where he was Chief Executive Officer. Prior to his tenure at Triumph Motorcycles, Mr. Heichelbech spent 20 years as Director of Sales, Director of Dealer Development and Retail Stores and Director of Strategy at Harley-Davidson Motor Company. Mr. Heichelbech is a graduate of the University of Wisconsin-Whitewater, where he earned a bachelor of arts degree in business in 1989. Additionally, Mr. Heichelbech holds a master of business administration degree from Loyola University of Chicago.
Jim Jacobs
Mr. Jacobs currently serves as President of REV RV Group, a position he has held since June 2015. Prior to joining REV, Mr. Jacobs served as President of Dynamax RV since 2014 where he led the introduction of several new and innovative products to the company portfolio. Prior to his tenure at Dynamax, Mr. Jacobs spent 12 years with Jayco, Inc. in various management roles, including as Vice President of Sales and Marketing Starcraft RV, Entegra Coach and Jayco Motorhome Group. His tenure at Jayco culminated with his appointment as Chief Operating Officer for that company. Mr. Jacobs holds a bachelor of arts degree in political science from Kansas State University.
Dan Peters
Mr. Peters currently serves as President, REV Fire Group, a position he has held since November 2013. Prior to joining REV, Mr. Peters worked at Pierce Manufacturing beginning in May 2008, where he worked as General Manager and Vice President of Sales. Prior to his tenure at Pierce Manufacturing, Mr. Peters spent 12 years as President of Akron Brass Company. Mr. Peters is a graduate of Wabash College, where he earned a bachelor of arts degree in economics.
John Walsh
Mr. Walsh currently serves as President, REV Bus Group, a position he has held since January 2016. Prior to joining REV, John worked at AM General LLC as the Executive Vice President of the MV-1 Division. Prior to his tenure at AM General, Mr. Walsh was the CEO of Vehicle Production Group LLC, an original equipment manufacturer of wheelchair-accessible cars. In addition, he spent 25 years at the bus dealership level with National Bus Sales and Leasing, Inc. Mr. Walsh is a graduate of Methodist University, where he earned a bachelor of arts degree in business administration and economics.
Board Composition and Director Independence
Our business and affairs are managed under the direction of our Board of Directors. Our Board of Directors is currently composed of nine directors. After the completion of this offering, the number of directors will be fixed by our Board of Directors, subject to the terms of our amended and restated certificate of incorporation and our amended and restated bylaws.
106
Table of Contents
Our amended and restated certificate of incorporation and our amended and restated bylaws will provide for a classified Board of Directors consisting of three classes of directors, each serving staggered three-year terms as follows:
(1) Our Class I directors will be Messrs. Canan, Dutil and Viola, and their terms will expire at the first annual meeting of stockholders to be held following the completion of this offering.
(2) Our Class II directors will be Messrs. Fish, Rotroff and Sullivan, and their terms will expire at the second annual meeting of stockholders to be held following the completion of this offering.
(3) Our Class III directors will be Messrs. Bamatter, Cusumano and Marvin, and their terms will expire at the third annual meeting of stockholders to be held following the completion of this offering.
At each annual meeting of stockholders, upon the expiration of the term of a class of directors, the successor to each such director in the class will be elected to serve from the time of election and qualification until the third annual meeting following his or her election and until his or her successor is duly elected and qualified, in accordance with our amended and restated certificate of incorporation and amended and restated bylaws. Any additional directorships resulting from an increase in the number of directors will be distributed among the three classes so that, as nearly as possible, each class will consist of one-third of our directors. This classification of our Board of Directors may have the effect of delaying or preventing changes in control of our Company. See “Description of Capital Stock—Anti-Takeover Effects of Certain Provisions of Delaware Law, Our Amended and Restated Certificate of Incorporation and Our Amended and Restated Bylaws.”
Controlled Company Exemption
After completion of this offering, certain funds affiliated with AIP will continue to control more than a majority of the voting power of our common stock eligible to vote in the election of directors. As a result, we will be a “controlled company” within the meaning of the corporate governance standards of the NYSE. Under the NYSE rules, a company of which more than 50% of the voting power for the election of directors is held by an individual, group or another company is a “controlled company” and may elect not to comply with certain corporate governance standards, including the requirements that the board be composed of a majority of independent directors and that we have a compensation committee and a nominating and corporate governance committee that are composed entirely of independent directors.
Following this offering, we intend to rely on these exemptions. As a result, we may not have a majority of independent directors on our Board of Directors. In addition, our compensation committee and our nominating and corporate governance committee may not consist entirely of independent directors. Accordingly, you may not have the same protections afforded to stockholders of companies that are subject to all of the corporate governance standards applicable to non-controlled companies.
The Board of Directors has affirmatively determined that Messrs. Canan, Dutil and Viola meet the definition of “independent director” under the applicable rules and regulations of the SEC and the applicable listing standards of the NYSE. As such, we believe that after completion of this offering and the listing of our shares on the NYSE, our audit committee will have independent directors.
Committees of the Board of Directors
Our Board of Directors has three standing committees: the audit committee, the compensation committee and the nominating and corporate governance committee. The charter of each committee will be available on our website.
107
Table of Contents
Audit Committee
Our audit committee is composed of Messrs. Canan, Dutil and Viola, with Mr. Canan serving as chairman of the committee. Our Board of Directors has determined that each member of the audit committee meets the independence requirements under the applicable rules and regulations of the SEC and the applicable listing standards of the NYSE and all members of the audit committee meet the financial literacy requirements under the applicable rules and regulations of the SEC and the applicable listing standards of the NYSE. Our Board of Directors has determined that all members qualify as “audit committee financial experts” as defined under SEC rules.
The audit committee’s responsibilities include, among other things:
| • | appointing, approving the compensation of, and assessing the qualifications, performance and independence of our independent registered public accounting firm; |
| • | pre-approving audit and permissible non-audit services, and the terms of such services, to be provided by our independent registered public accounting firm; |
| • | reviewing the internal audit plan with the independent registered public accounting firm and members of management responsible for preparing our consolidated financial statements; |
| • | reviewing and discussing with management and the independent registered public accounting firm our annual and quarterly consolidated financial statements and related disclosures, as well as critical accounting policies and practices used by us; |
| • | reviewing the adequacy and effectiveness of our internal control over financial reporting; |
| • | establishing policies and procedures for the receipt and retention of accounting-related complaints and concerns; |
| • | monitoring the effectiveness of our compliance policies and our compliance with legal and regulatory requirements particularly as they relate to our consolidated financial statements and accounting matters; |
| • | reviewing our policies on risk assessment and risk management; |
| • | preparing the audit committee report required by the rules of the SEC to be included in our annual proxy statement; |
| • | periodically reviewing matters relating to our finance, treasury and tax activities; and |
| • | reviewing all related party transactions for potential conflict of interest situations and approving any such transactions. |
Our audit committee operates under a written charter that satisfies the applicable rules and regulations of the SEC and the applicable listing standards of the NYSE.
Compensation Committee
Our compensation committee is composed of Messrs. Bamatter, Cusumano and Viola, with Mr. Cusumano serving as chairman of the committee. Our Board of Directors has determined that Mr. Viola meets the independence requirements under the applicable rules and regulations of the SEC and the applicable listing standards of the NYSE. The compensation committee’s responsibilities include, among other things:
| • | annually reviewing and approving corporate goals and objectives relevant to the compensation of our chief executive officer; |
| • | evaluating the performance of our chief executive officer in light of such corporate goals and objectives and determining and approving the compensation of our chief executive officer; |
108
Table of Contents
| • | reviewing the compensation of our other executive officers; |
| • | appointing, compensating and overseeing the work of any compensation consultant, legal counsel or other advisor retained by the compensation committee; |
| • | assessing the independence or the existence of any conflict of interest with respect to any compensation consultant, legal counsel or other advisor retained by the compensation committee in accordance with the applicable rules and regulations of the SEC and the applicable listing standards of the NYSE; |
| • | reviewing and establishing our overall management compensation philosophy and reviewing our executive compensation programs, including our retirement benefits, to determine that they are aligned with our philosophy; |
| • | overseeing and administering our share compensation arrangements and similar plans; |
| • | reviewing and approving our policies and procedures for the grant of equity-based awards; |
| • | reviewing and making recommendations to the Board of Directors with respect to director compensation; and |
| • | reviewing and discussing with management the compensation discussion and analysis, and preparing the compensation committee report, to be included in our annual proxy statement or Annual Report on Form 10-K. |
Our compensation committee operates under a written charter that satisfies the applicable rules and regulations of the SEC and the applicable listing standards of the NYSE.
Nominating and Corporate Governance Committee
Our nominating and corporate governance committee is composed of Messrs. Bamatter, Fish and Rotroff, with Mr. Bamatter serving as chairman of the committee. The nominating and corporate governance committee’s responsibilities include:
| • | identifying and evaluating Board of Director candidates, including nominees recommended by stockholders; |
| • | identifying individuals qualified to become members of the Board of Directors; |
| • | recommending to the Board of Directors the persons to be nominated for election as directors and to each of the Board’s committees; |
| • | developing, recommending approval of, and periodically reviewing a set of corporate governance principles that comply with the applicable listing standards of the NYSE; |
| • | articulating to each director what is expected, including reference to the corporate governance principles and directors’ duties and responsibilities; |
| • | reviewing and recommending to the Board of Directors practices and policies with respect to the evaluation of directors and the CEO, and overseeing the evaluation process; |
| • | considering and reporting to the Board of Directors any questions of possible conflicts of interest of board of directors members; |
| • | providing for new director orientation and continuing education for existing directors on a periodic basis; and |
| • | overseeing management’s practices, procedures and plans relating to succession planning. |
Our nominating and corporate governance committee operates under a written charter that satisfies the applicable rules and regulations of the SEC and the applicable listing standards of the NYSE.
109
Table of Contents
Compensation Committee Interlocks and Insider Participation
Mr. Bamatter served as our corporate secretary in fiscal year 2014 and as a vice president of certain of our subsidiaries from 2008 to August 2016, Mr. Cusumano served as a vice president of certain of our subsidiaries from 2008 until February 2016. No other members of our compensation committee has at any time during the prior three years been one of our officers or employees. None of our executive officers currently serves, or in the past fiscal year has served, as a member of the board of directors or compensation committee of any entity that has one or more executive officers serving on our Board of Directors or compensation committee.
Code of Business Conduct and Ethics
We have adopted a code of business conduct and ethics that applies to all of our employees, officers and directors, including those officers responsible for financial reporting. Upon the closing of this offering, our code of business conduct and ethics will be available on our website. We intend to disclose any amendments to the code, or any waivers of its requirements, on our website.
110
Table of Contents
EXECUTIVE AND DIRECTOR COMPENSATION
Compensation Discussion and Analysis
Compensation of our named executive officers is determined under our compensation program for senior executives. Following completion of this offering, this program will be overseen by the Board of Directors and its compensation committee (referred to as the “Compensation Committee”). We expect that generally the Board of Directors will determine the compensation of our executive officers in consultation with the recommendations of the Compensation Committee.
This compensation discussion and analysis focuses on our named executive officers listed in the Summary Compensation Table and the other compensation tables below (referred to as our “named executive officers”). Our named executive officers are executive officers who served in the roles of our principal executive officer and principal financial officer during fiscal year 2016, as well as our three next most highly compensated executive officers during fiscal year 2016. Our named executive officers for fiscal year 2016 were:
| • | Timothy W. Sullivan, Chief Executive Officer; |
| • | Dean J. Nolden, Chief Financial Officer; |
| • | Marcus Berto, Executive Vice President; |
| • | Thomas B. Phillips, Chief Operations Officer; and |
| • | Barbara H. Stephens, Chief Human Resources Officer. |
We have also identified James McGinn as a named executive officer for fiscal year 2016. Mr. McGinn served as our Chief Accounting Officer prior to his departure in June 2016 and, until Mr. Nolden’s commencement of employment as our Chief Financial Officer in January 2016, assumed various responsibilities traditionally fulfilled by a principal financial officer.
Principal Objectives of Our Compensation Program for Named Executive Officers
Our executive team is critical to our success and to building value for our stockholders. The principal objectives of our executive compensation program are to:
| • | attract, retain and motivate high-caliber executive officers by providing a total compensation program that takes into consideration competitive market requirements and strategic business needs; |
| • | clearly align the financial interests of executive officers with those of our stockholders; |
| • | encourage behavior consistent with our values and reinforce ethical business practices; and |
| • | appropriately reward executive officers for creating long-term stockholder value. |
Compensation Setting Process
Our Chief Executive Officer has discretion to recommend both the contractual and discretionary compensation of the named executive officers (other than himself) in consultation with our Board of Directors. Our Board of Directors has historically had overall responsibility for overseeing our executive compensation policies and compensation plans and programs. In consultation with our Chief Executive Officer, our Board of Directors reviews our achievements as a company and those of our executive officers when determining the specific type and level of compensation of our named executive officers.
We believe the levels of compensation we provide should be competitive, reasonable and appropriate to attract and retain talent to meet our business needs. In addition to the information provided by the consultant to the Company, Willis Towers Watson, PLC (referred to as Willis Towers Watson), with respect to executive
111
Table of Contents
officer and director compensation matters (discussed below), we have informally considered the competitive market for corresponding positions within comparable geographic areas and companies of similar size, industry and stage of development. Compensation was determined with the application of subjective discretion rather than by applying a specific formula or matrix to set total compensation in relation to compensation paid by other companies. Our historical approach has been to consider competitive compensation practices and other factors, such as how much compensation was necessary to recruit and retain an executive officer, as well as individual performance. As we gain experience as a public company, we expect that the specific direction, emphasis and components of our executive compensation program will continue to evolve. For example, over time, we may reduce our reliance upon subjective determinations in favor of a more empirically based approach that could involve, among other practices, benchmarking the compensation paid to our named executive officers against peer companies.
For the named executive officers (other than our Chief Executive Officer), our Chief Executive Officer has considered such named executive officer’s responsibilities and prior experience. Our Chief Executive Officer then consults with the Board of Directors on his recommendations to the Board of Directors regarding base salary increases, formula based and discretionary bonus amounts, and equity award amounts, and advises the Board of Directors regarding the compensation program’s ability to attract, retain and motivate executive talent. These recommendations reflect compensation levels that our Chief Executive Officer believes are commensurate with such named executive officer’s individual qualifications, experience, responsibility level, functional role, knowledge, skills, and individual performance, as well as our Company’s performance and competitive offerings.
In determining our Chief Executive Officer’s compensation, the Board of Directors takes into consideration our performance, our Chief Executive Officer’s contribution to that performance and the desire to retain and motivate the Chief Executive Officer.
Following completion of this offering, the Compensation Committee will administer our executive compensation program in accordance with its charter, including making recommendations to our Board of Directors for approval of various matters.
Role of Compensation Consultant
The Company retained Willis Towers Watson in June 2016 to provide guidance and advice going forward on compensation-related matters, including potential changes to our executive and director compensation structure following completion of this offering. We have purchased a proprietary job grading system, as well as broad-based salary survey data, from Willis Towers Watson. The aggregate cost to the Company of these additional products and services did not exceed $120,000 during fiscal year 2016. In connection with our engagement of Willis Towers Watson, our Board of Directors conducted an assessment of potential conflicts of interest of Willis Towers Watson, and no conflicts of interest relating to its services were identified.
Elements of Compensation
The following is a discussion of the primary elements of the compensation for each of our named executive officers.
Annual Base Salary
We believe that providing each of our named executive officers a competitive annual base salary is an important component of compensation. A competitive annual base salary provides a degree of financial stability to our named executive officers that enhances their performance on behalf of our stockholders and is critical to recruiting and retaining our named executive officers. We do not have formal written policies or guidelines for setting or adjusting the annual base salary of our named executive officers but instead make a subjective
112
Table of Contents
determination based on certain factors that we believe are relevant. Specifically, we will consider the executive’s experience, responsibilities and unique leadership skills as well as any changes in the competitive market environment. Our named executive officers who began employment during fiscal year 2016, while we were a private company, received base salaries based on the factors described above and negotiations with them, as set forth in their offer letters described below.
In fiscal year 2016, Mr. Berto received a merit increase of 3% in his annual base salary due to his past and continuing contributions to the Company. Mr. Berto was the only named executive officer to receive an increase in his annual base salary in fiscal year 2016.
Annual Cash Incentive Program
For fiscal year 2016, our named executive officers participated in the discretionary REV Group Management Incentive Plan, which we refer to as the MIP. Under the MIP, bonus payments are based on each named executive officer’s bonus target and the Company’s achievement of Adjusted EBITDA. For fiscal year 2016, the bonus targets for our named executive officers, as a percentage of base salary, were as follows:
| • | Timothy W. Sullivan—100% |
| • | Dean J. Nolden—60% |
| • | Marcus Berto—100% |
| • | Thomas B. Phillips—80% |
| • | Barbara H. Stephens—50% |
| • | James McGinn—50% |
Whether participants of the MIP will be eligible to receive bonus payments is determined based on the Company’s Adjusted EBITDA. Adjusted EBITDA is a non-GAAP metric that represents net income before interest expense, income taxes, depreciation and amortization, adjusted for other onetime and noncash expense items. The target for fiscal year 2016 was established at $120 million in Adjusted EBITDA. A threshold performance level of 90% of this target (i.e., $108 million in Adjusted EBITDA) must be met before any bonus payments are made to our named executive officers. The size of the Company’s accrual for bonus payments can increase by 1% for every 1% increase above the Adjusted EBITDA target, with the maximum set at 200% of the target Adjusted EBITDA (i.e., $240 million in Adjusted EBITDA).
Based on the Company’s Adjusted EBITDA for fiscal year 2016 of $121.1 million (prior to the impact of the KME acquisition), bonus payouts for fiscal year 2016 were as follows:
| • | Timothy W. Sullivan—$807,369 |
| • | Dean J. Nolden—$176,612 |
| • | Marcus Berto—$519,744 |
| • | Thomas B. Phillips—$336,404 |
| • | Barbara H. Stephens—$136,664 |
The amounts paid to Messrs. Nolden and Phillips and Ms. Stephens were prorated based on the date on which they commenced providing services during fiscal year 2016. In connection with his separation from the Company, Mr. McGinn received a guaranteed prorated bonus for fiscal year 2016 of eight months at 100% of target equal to $70,717.
113
Table of Contents
Long-Term Equity Compensation
We have granted equity awards in the form of stock options to our named executive officers under the Allied Specialty Vehicles, Inc. 2010 Long-Term Incentive Plan (the “2010 Long-Term Incentive Plan”). Each of our named executive officers received an award of stock options upon commencing employment with the Company. When determining each named executive officer’s award of stock options, we considered the executive’s experience, responsibilities and unique leadership skills, as well as the retentive effect of the stock option award. Other than such awards, our named executive officers have not received any additional awards of stock options. The following amounts represent the number of shares (as adjusted based on the stock split described in this prospectus) underlying each of the stock option awards granted to our named executive officers upon their commencement of employment:
| • | Timothy W. Sullivan—1,240,000 |
| • | Dean J. Nolden—180,000 |
| • | Marcus Berto—400,000 |
| • | Thomas B. Phillips—160,000 |
| • | Barbara H. Stephens—56,000 |
| • | James McGinn—40,000 |
Our stock options provide long-term incentives to our named executive officers while aligning their interests with our stockholders. Stock options have been granted in the form of nonqualified stock options. These stock options generally vest in equal, annual installments over a three- or four-year period. A certain percentage of these stock options fully vest upon the occurrence of fundamental corporate events (e.g., a change in control or the occurrence of an initial public offering).
As a result, the following amounts represent the shares (as adjusted based on the stock split described in this prospectus) underlying outstanding stock options that will become fully vested in connection with completion of this offering, based on the number of unvested options at October 29, 2016:
| • | Timothy W. Sullivan—620,000 |
| • | Dean J. Nolden—100,000 |
| • | Marcus Berto—200,000 |
| • | Thomas B. Phillips—80,000 |
| • | Barbara H. Stephens—28,000 |
Following completion of this offering, we anticipate that we will continue to use equity awards as an integral part of our executive compensation program.
Allocation Among Forms of Compensation
Historically, we have not adopted any policies with respect to current compensation versus long-term compensation, with respect to cash versus noncash compensation, or among different forms of noncash compensation. We consider all elements as necessary for achieving our compensation objectives. Our practices as a public company following completion of this offering may vary over time.
Employment and Consulting Arrangements with Named Executive Officers
Each of our named executive officers received an offer letter from the Company.
114
Table of Contents
CEO Offer Letter
Under the terms of his offer letter, dated July 9, 2014, Mr. Sullivan is entitled to receive an annual base salary of $800,000 and is eligible to receive a cash bonus payment equal to 100% of his base salary upon the Company’s full attainment of its annual goals. The amount ultimately paid to Mr. Sullivan may exceed 100% of his base salary if the Company outperforms its annual goals. The offer letter also provided for an initial grant of a stock option with respect to 15,500 shares (this amount does not reflect the stock split described in this prospectus). Mr. Sullivan was also permitted to purchase up to $5 million in common stock of the Company. Mr. Sullivan’s offer letter does not provide for severance or other similar payments upon his termination of employment.
CFO Offer Letter
Under the terms of his offer letter, dated December 21, 2015, Mr. Nolden is entitled to receive an annual base salary of $350,000 and is eligible to receive a cash bonus payment equal to a target level of 60% of his base salary based upon the Company’s achievement of its annual Adjusted EBITDA target. The amount ultimately paid to Mr. Nolden may exceed such 60% target. The offer letter also provided for an initial grant of 2,250 stock options (this amount does not reflect the stock split described in this prospectus). The offer letter further provides that Mr. Nolden will be eligible to participate in the Deferred Compensation Plan and participate in the Company’s health and welfare benefit plans and retirement plan. Mr. Nolden’s offer letter does not provide for severance or other similar payments or benefits upon his termination of employment.
Other Named Executive Officers’ Offer Letters
Under the terms of his offer letter, dated October 9, 2014, Mr. Berto serves as our Chief Commercial Officer and is entitled to receive a base salary of $500,000 and is eligible to receive a cash bonus payment equal to a target level of 100% of his base salary with 80% of such award based upon the Company’s achievement of its annual Adjusted EBITDA target and 20% based on the achievement of Mr. Berto’s personal objectives. The amount ultimately paid to Mr. Berto may exceed the 100% target. The offer letter also provides for the initial grant of 5,000 stock options (this amount does not reflect the stock split described in this prospectus). Mr. Berto was also permitted to purchase up to $1.5 million of common stock of the Company. Mr. Berto’s offer letter also provides that he is eligible to participate in the Deferred Compensation Plan. Mr. Berto currently participates in the health and welfare benefit plans generally available to the Company’s employees. Mr. Berto’s offer letter does not provide for severance or other similar payments or benefits upon his termination of employment.
Mr. Phillips and Ms. Stephens have also received offer letters, each dated February 5, 2016, from the Company. Under the terms of their respective offer letters, Mr. Phillips serves as our Chief Operations Officer, and Ms. Stephens serves as our Chief Human Resources Officer. These offer letters provide for an annual base salary ($500,000 in the case of Mr. Phillips and $325,000 in the case of Ms. Stephens). These offer letters also provide for an annual cash bonus payment equal to a target level of 80% of base salary (in the case of Mr. Phillips) or 50% (in the case of Ms. Stephens) based upon the Company’s achievement of its annual Adjusted EBITDA target. The bonus amount ultimately paid may exceed such target percentages. Mr. Phillips and Ms. Stephens each also received a signing bonus of $22,500 under their respective offer letters. The offer letters also provided for the initial grant of a stock option with respect to 2,000 and 700 shares, respectively (these amounts do not reflect the stock split described in this prospectus). These offer letters further provide that Mr. Phillips and Ms. Stephens will be eligible to participate in the Deferred Compensation Plan and participate in the Company’s health and welfare benefit plans and retirement plan. The offer letters do not provide for severance or other similar payments or benefits upon a named executive officer’s termination of employment.
Severance and Change in Control Agreements
Our named executive officers are eligible to participate in the REV Group Salaried Severance Policy, which we refer to as the Severance Policy. The purpose of the Severance Policy is to provide reasonable and consistent
115
Table of Contents
severance benefits to our executive officers upon qualifying termination events. The severance payments consist of one year of base salary, as further described under “Potential Payments Upon Termination or Change in Control” below.
In January 26, 2016, we entered into a Transition and Consultancy Agreement (the “Transition and Consultancy Agreement”) with Mr. McGinn in order to provide for an orderly transition of his responsibilities to our new principal financial officer. Under this arrangement, as further described under “Potential Payments Upon Termination or Change in Control” below, he was eligible to receive a bonus for remaining until June 2016, as well as consulting payments and COBRA reimbursements following his separation from employment.
Restrictive Covenant Agreements
Each of our named executive officers is a party to the REV Restrictive Covenant Agreement. The restrictive covenant agreement provides that during the employment period and for one year following a termination of employment, the named executive officer will not, directly or indirectly, solicit our employees or customers. The restrictive covenant agreement also prevents each named executive officer from directly or indirectly competing with the Company during the employment period and for one year following a termination of employment. The restrictive covenant agreements contain a perpetual nondisclosure covenant.
The Transition and Consultancy Agreement that Mr. McGinn entered into with the Company also contains restrictive covenants. During the twelve-month period commencing on June 17, 2016, Mr. McGinn may not, directly or indirectly, compete with the Company or solicit our employees, independent contractors or customers. The Transition and Consultancy Agreement also contains perpetual nondisclosure and non-disparagement covenants.
Deferred Compensation Plan
Our named executive officers and all of our highly compensated employees are eligible to participate in the REV Group, Inc. Nonqualified Deferred Compensation Plan (the “Deferred Compensation Plan”). Eligibility to participate in the deferred compensation plan is limited to a select group of management or highly compensated employees. Participants are permitted to defer between 1% and 100% of their base salary and annual cash bonus. Participants select the allocation of their accounts among investment indices selected by the Company. The Company does not provide matching contributions to participants of the deferred compensation plan. Our Board of Directors may amend the plan at any time, as long as such amendment does not have any retroactive effect to reduce any amounts allocated to a participant’s accounts. None of our named executive officers currently participate in the deferred compensation plan.
Other Benefits
Retirement Plan
We maintain a qualified defined contribution 401(k) plan for all of our employees. Our named executive officers participate in this plan on the same basis as our employees generally. Under the plan, employees may elect to defer eligible pay up to the annual maximum allowed under the Internal Revenue Code. The Company makes a safe harbor matching contribution equal to 100% of the first 1% of salary contributed by a participating employee, and a 50% matching contribution of the next 5% of salary contributed by a participating employee. Company matching contributions begin after enrollment, and participating employees are 100% vested in such contributions after two years of service.
Health, Welfare and Other Benefit Plans
Our named executive officers are entitled to the same health and welfare benefits as our employees generally, including medical, dental and vision insurance, as well as flex and health savings accounts, life insurance, short-term disability insurance (fully paid by the Company), long-term disability insurance, accident insurance and critical illness insurance.
116
Table of Contents
We offer relocation benefits to newly hired named executive officers as necessary.
In addition, the Company reimbursed Mr. Nolden for COBRA payments that he incurred in connection with continuation of his medical health benefits under his prior employer’s health plan.
Our named executive officers did not receive other perquisites in fiscal year 2016.
Compensation Risk Assessment
Our Compensation Committee has performed a review of compensation policies and practices for all of our employees and has concluded that our compensation policies and practices are not reasonably likely to have a material adverse effect on us.
Stock Ownership Guidelines
Our named executive officers have not been subject to mandated stock ownership guidelines. However, we believe it is important for our named executive officers to be owners in the Company to ensure the alignment of their goals with the interests of our stockholders. In connection with this offering, we have established guidelines of equity ownership for our Chief Executive Officer equivalent to five times his base salary and for our other executive officers equivalent to three times their respective base salaries. Each has a transition period of five years to meet the requirements set forth in the guidelines to the extent they are not currently in compliance with this guideline.
Accounting and Tax Considerations
Section 280G of the Internal Revenue Code provides that executive officers, certain stockholders and certain other service providers could be subject to significant additional taxes if they receive payments or benefits in connection with a change in control of our Company that exceed certain limits. Section 409A of the Internal Revenue Code also imposes additional significant taxes on the individual for deferred compensation that does not meet the requirements of Section 409A. We have not provided any named executive officer with a gross-up or other reimbursement for tax amounts the executive officer might pay pursuant to Section 280G or Section 409A of the Internal Revenue Code.
Section 162(m) of the Internal Revenue Code imposes a $1 million cap on federal income tax deduction for compensation paid to our Chief Executive Officer and to certain other highly compensated officers during any fiscal year unless the compensation is “performance-based” under Section 162(m). Under a special Section 162(m) exception, subject to certain conditions, compensation paid pursuant to a compensation plan in existence before the effective date of this offering will not be subject to the $1 million limitation until the earliest of: (i) the expiration of the compensation plan, (ii) a material modification of the compensation plan (as determined under Section 162(m)), (iii) the issuance of all the employer stock and other compensation allocated under the compensation plan, or (iv) the first meeting of stockholders at which directors are elected after the close of the third calendar year following the year in which this offering occurs.
When approving the amount and form of compensation for our named executive officers in the future, our Compensation Committee will consider all elements of the cost to our Company of providing such compensation, including the potential impact of Section 162(m). However, the Board of Directors or our Compensation Committee, as applicable, may, in its judgment, authorize compensation payments that do not comply with the exemptions in Section 162(m) when it believes that such payments are appropriate to attract and retain executive talent. Many other Internal Revenue Code provisions, SEC regulations and accounting rules affect the payment of executive compensation and are generally taken into consideration as programs are developed. Our goal is to create and maintain plans that are efficient, effective and in full compliance with these requirements.
117
Table of Contents
Any equity awards that may be granted to our employees, including our executive officers, pursuant to the long-term incentive plan we intend to adopt in connection with the offering, will be reflected in our consolidated financial statements, based upon the applicable accounting guidance, at fair market value on the grant date in accordance with FASB Accounting Standards Codification, Topic 718, “Compensation—Stock Compensation.”
Summary Compensation Table
The following table sets forth information regarding the compensation awarded to, earned by or paid to each of our named executive officers during fiscal year 2016.
| Name and principal position |
Fiscal year |
Salary ($) |
Bonus ($)(3) |
Option Awards ($)(4) |
Non-equity incentive plan compensation ($)(5) |
All other compensation ($)(6) |
Total ($) |
|||||||||||||||||||||
| Timothy W. Sullivan Chief Executive Officer |
2016 | 800,000 | — | — | 807,369 | 9,275 | 1,616,644 | |||||||||||||||||||||
| Dean J. Nolden Chief Financial Officer(1) |
2016 | 282,692 | — | 932,169 | 176,612 | 7,489 | 1,398,962 | |||||||||||||||||||||
| Marcus Berto Executive Vice President |
2016 | 506,231 | — | — | 519,744 | 9,275 | 1,035,250 | |||||||||||||||||||||
| Thomas B. Phillips Chief Operations Officer(1) |
2016 | 367,308 | 22,500 | 821,344 | 336,404 | 56,142 | 1,603,698 | |||||||||||||||||||||
| Barbara H. Stephens Chief Human Resources |
2016 | 238,750 | 22,500 | 287,471 | 136,664 | 22,839 | 708,224 | |||||||||||||||||||||
| James McGinn Former Chief Accounting Officer and Principal Financial Officer(2) |
2016 | 133,818 | 148,233 | — | — | 120,429 | 402,480 | |||||||||||||||||||||
| (1) | Messrs. Nolden and Phillips and Ms. Stephens commenced their employment with the Company in fiscal year 2016. As such, their annual base salary amounts will reflect partial amounts for fiscal year 2016. |
| (2) | Mr. McGinn ceased to serve as the Company’s principal financial officer on January 11, 2016 and his separation from the Company became effective on June 17, 2016. |
| (3) | Reflects the following: (i) signing bonus for each of Mr. Phillips and Ms. Stephens of $22,500; and (ii) the stay bonus and guaranteed fiscal year 2016 bonus paid to Mr. McGinn under his Transition and Consultancy Agreement. |
| (4) | Represents the aggregate grant date fair value of stock option awards calculated in accordance with FASB ASC Topic 718. The assumptions we used in valuing stock option awards are described in Note 15 to our consolidated audited financial statements appearing elsewhere in this prospectus. |
| (5) | The amounts reported in this column represent the bonus amounts earned under the MIP for fiscal year 2016 and paid in fiscal year 2017. |
| (6) | Reflects the following: |
| (i) | Payment of $3,451 to Mr. Nolden for COBRA benefits under his prior employer’s plan. |
| (ii) | Relocation benefits of $18,089 paid to Ms. Stephens. |
| (iii) | Company matching contributions under the 401(k) plan in the amounts of $9,275 to each of Messrs. Sullivan and Berto, $4,038 to Mr. Nolden, $5,000 to Mr. Phillips, $4,750 to Ms. Stephens and $9,906 to Mr. McGinn. |
| (iv) | Payment of $51,142 to Mr. Phillips for his services to the Company during fiscal year 2016 as a consultant prior to becoming an employee. |
| (v) | A total of $110,523 paid to Mr. McGinn under his Transition and Consultancy Agreement, consisting of $88,396 for consulting fees, $7,440 for COBRA reimbursement and $14,687 for accrued but unused vacation pay. |
118
Table of Contents
Grants of Plan-Based Awards
The following table sets forth information regarding plan-based awards made to each of our named executive officers during fiscal year 2016.
| Grant date |
Potential future payouts under non- |
Option awards: Number of shares underlying options (#) |
Exercise price of option awards ($/sh) |
Grant date fair value of option awards ($) |
||||||||||||||||||||||||
| Name |
Threshold ($) |
Target ($) |
Maximum ($) |
|||||||||||||||||||||||||
| Timothy W. Sullivan |
— | 720,000 | 800,000 | 1,600,000 | — | — | — | |||||||||||||||||||||
| Dean J. Nolden |
1/11/2016 | 2,250 | 648.96 | 932,169 | ||||||||||||||||||||||||
| — | 157,500 | 175,000 | 350,000 | |||||||||||||||||||||||||
| Marcus Berto |
— | 463,500 | 515,000 | 1,030,000 | — | — | — | |||||||||||||||||||||
| Thomas B. Phillips |
2/12/2016 | 2,000 | 648.96 | 821,344 | ||||||||||||||||||||||||
| — | 270,000 | 300,000 | 600,000 | |||||||||||||||||||||||||
| Barbara H. Stephens |
2/12/2016 | 700 | 648.96 | 287,471 | ||||||||||||||||||||||||
| — | 109,688 | 121,875 | 243,750 | |||||||||||||||||||||||||
| James McGinn |
— | 92,250 | 102,500 | 205,000 | — | — | — | |||||||||||||||||||||
| (1) | Represents amounts payable under the MIP, as described in the Compensation Discussion and Analysis above. Messrs. Nolden and Phillips and Ms. Stephens commenced providing services to the Company in fiscal year 2016. As such, their target bonus amounts are pro-rated for fiscal year 2016. |
| (2) | Options were granted under the 2010 Long-Term Incentive Plan. |
The outstanding awards set forth in the table above do not reflect the stock split described in this prospectus.
Description of Incentive Plans
Cash Incentive Plan
Our Board of Directors has adopted a cash incentive plan, or the Cash Bonus Plan. The MIP will become a subset of the Cash Bonus Plan. The following is a summary of the material terms of the Cash Bonus Plan.
The Cash Bonus Plan was adopted to enable the Company to recognize the contributions, and reward the performance, of key employees of the Company and its affiliates. The Board of Directors or its Compensation Committee will administer the Cash Bonus Plan. Awards may be discretionary or earned based on factors, criteria or objectives, which may include the performance measures provided in the Omnibus Plan. Cash Bonus Plan payments, if any, will be made in cash following the end of the applicable performance period.
Omnibus Incentive Plan
Our Board of Directors has adopted, subject to stockholder approval, a new equity compensation plan in the form of an omnibus incentive plan, or Omnibus Plan. In connection with the Company’s initial public offering, each independent director will receive an award of restricted stock units with a value of $30,000 (based on the initial public offering price), which will cliff-vest upon the first anniversary of grant. The following is a summary of the material terms of the Omnibus Plan.
Purpose
The purpose of the Omnibus Plan is to motivate and reward those employees and other individuals who are expected to contribute significantly to our long term success and to further align employee interests to those of our stockholders.
119
Table of Contents
Plan Term
The Omnibus Plan is scheduled to expire after ten years. The term will expire sooner if, prior to the end of the ten-year term or any extension period, the maximum number of shares available for issuance under the Omnibus Plan has been issued or our Board of Directors terminates the Omnibus Plan.
Authorized Shares and Award Limits
Subject to adjustment, 8,000,000 shares of our common stock will be available for awards to be granted under the Omnibus Plan (other than substitute awards; that is, awards that are granted in assumption of, or in substitution for, an outstanding award previously granted by a company or other business acquired by us or with which we combine). An individual who is a non-employee director may not receive an award under the Omnibus Plan that relates to more than $1,000,000 for any calendar year.
Subject to adjustment, the maximum number of shares of our common stock that may be granted to any single individual during any calendar year is as follows: (i) stock options and SARs that relate to no more than 800,000 shares of our common stock; (ii) restricted stock and RSUs that relate to no more than 800,000 shares of our common stock; (iii) performance awards denominated in shares and other share-based awards that relate to no more than 800,000 shares of our common stock; (iv) deferred awards denominated in shares that relate to no more than 800,000 shares of our common stock; (v) deferred awards denominated in cash that relate to no more than $10,000,000; and (vi) performance awards denominated in cash and other cash-based awards that relate to no more than $10,000,000.
If an award is forfeited, expires, terminates or otherwise lapses or is settled for cash, the shares covered by such award will again be available for issuance under the Omnibus Plan. Shares withheld to pay taxes or shares tendered or withheld in payment of an exercise price will not again become available for issuance under the Omnibus Plan.
Administration
The Board of Directors or, to the extent authority is delegated by the Board of Directors, its Compensation Committee or other committee (in either event, the “Administrator”) will administer the Omnibus Plan and determine the following items:
| • | designate participants; |
| • | determine the types of awards (including substitute awards) to grant, the number of shares to be covered by awards, the terms and conditions of awards, whether awards may be settled or exercised in cash, shares, other awards, other property or net settlement, the circumstances under which awards may be canceled, repurchased, forfeited or suspended, and whether awards may be deferred automatically or at the election of the holder or the Administrator; |
| • | interpret and administer the Omnibus Plan and any instrument or agreement relating to, or award made under, the Omnibus Plan; |
| • | amend the terms or conditions of outstanding awards, including to accelerate the time or times at which an award becomes vested, unrestricted or may be exercised; |
| • | correct any defect, supply any omission and reconcile any inconsistency in the Omnibus Plan or any award to carry the Omnibus Plan into effect; |
| • | establish, amend, suspend or waive rules and regulations and appoint agents, trustees, brokers, depositories and advisors and determine such terms of their engagement as it shall deem appropriate; and |
| • | make any other determination and take any other action that it deems necessary or desirable to administer the Omnibus Plan. |
120
Table of Contents
To the extent not inconsistent with applicable law, the Administrator may delegate to one or more of our officers the authority to grant stock options or SARs or other awards in the form of share rights under the Omnibus Plan.
Types of Awards
The Omnibus Plan provides for grants of incentive and non-qualified stock options, SARs, restricted stock, RSUs, performance awards, deferred awards, other share-based awards and other cash-based awards:
| • | Stock Options. A stock option is a contractual right to purchase shares at a future date at a specified exercise price. The per share exercise price of a stock option (except in the case of substitute awards) will be determined by the Administrator at the time of grant but may not be less than the closing price of a share of our common stock on the day prior to the grant date. The Administrator will determine the date on which each stock option becomes vested and exercisable and the expiration date of each option. No stock option will be exercisable more than ten years from the grant date, except that the Administrator may generally provide for an extension of such ten-year term in the event the exercise of the option would be prohibited by law on the expiration date. Stock options that are intended to qualify as incentive stock options must meet the requirements of Section 422 of the Internal Revenue Code. |
| • | SARs. A SAR represents a contractual right to receive, in cash or shares, an amount equal to the appreciation of one share of our common stock from the grant date over the exercise or hurdle price of such SAR. The per share exercise price of a SAR (except in the case of substitute awards) will be determined by the Administrator but may not be less than the closing price of a share of our common stock on the day prior to the grant date. The Administrator will determine the date on which each SAR may be exercised or settled and the expiration date of each SAR. However, no SAR will be exercisable more than ten years from the grant date. |
| • | Restricted Stock. Restricted stock is an award of shares of our common stock that are subject to restrictions on transfer and a substantial risk of forfeiture. |
| • | RSUs. An RSU represents a contractual right to receive the value of a share of our common stock at a future date, subject to specified vesting and other restrictions. |
| • | Performance Awards. Performance awards, which may be denominated in cash or shares, will be earned upon the satisfaction of performance conditions specified by the Administrator. The performance conditions for awards that are intended to qualify as “performance-based compensation” for purposes of Section 162(m) of the Internal Revenue Code may include, but not be limited to, the following: return measures (including total shareholder return; return on equity; return on assets or net assets; return on risk-weighted assets; and return on capital (including return on total capital or return on invested capital)); revenues (including total revenue; gross revenue; net revenue; and net sales); income/earnings measures (including earnings per share; earnings or loss (including earnings before or after interest, taxes, depreciation and amortization); gross income; net income; operating income (before or after taxes); pre-or after-tax income or loss (before or after allocation of corporate overhead and bonus); pre- or after-tax operating income; net earnings; net income or loss (before or after taxes); operating margin; gross margin; and adjusted net income); expense measures (including expenses; operating efficiencies; and improvement in or attainment of expense levels or working capital levels (including cash and accounts receivable)); cash flow measures (including cash flow or cash flow per share (before or after dividends); and cash flow return on investment); share price measures (including share price; appreciation in and/or maintenance of share price; and market capitalization); strategic objectives (including market share; debt reduction; customer growth; employee satisfaction; research and development achievements; mergers and acquisitions; management retention; dynamic market response; expense reduction initiatives; reductions in costs; risk management; regulatory compliance and achievements; and recruiting and maintaining personnel); and other measures (including economic value-added models or equivalent metrics; economic profit added; gross profits; economic profit; |
121
Table of Contents
| comparisons with various stock market indices; financial ratios (including those measuring liquidity, activity, profitability or leverage); cost of capital or assets under management; and financing and other capital raising transactions (including sales of the Company’s equity or debt securities; factoring transactions; sales or licenses of the Company’s assets, including its intellectual property, whether in a particular jurisdiction or territory or globally; or through partnering transactions)). These performance criteria may be measured on an absolute (e.g., plan or budget) or relative basis, may be established on a corporate-wide basis or with respect to one or more business units, divisions, subsidiaries or business segments, may be based on a ratio or separate calculation of any performance criteria and may be made relative to an index or one or more of the performance goals themselves. |
| • | Deferred Awards. The Administrator is authorized to grant awards denominated in a right to receive shares of our common stock or cash on a deferred basis. |
| • | Other Share-Based Awards. The Administrator is authorized to grant other share-based awards, which may be denominated in shares of our common stock or factors that may influence the value of our shares. |
| • | Other Cash-Based Awards. The Administrator is authorized to grant other cash-based awards either independently or as an element of or supplement to any other award under the Omnibus Plan. |
Adjustments
In the event that the Administrator determines that, as result of any dividend or other distribution, recapitalization, stock split, reverse stock split, reorganization, merger, consolidation, separation, rights offering, split-up, spin-off, combination, repurchase or exchange of our shares or other securities, issuance of warrants or other rights to purchase our shares or other securities of the Company, issuance of our shares pursuant to the anti-dilution provisions of our securities, or other similar corporate transaction or event affecting our shares, or of changes in applicable laws, regulations or accounting principles, an adjustment is appropriate to prevent dilution or enlargement of the benefits or potential benefits intended to be made available under the Omnibus Plan, the Administrator will, subject to compliance with Section 409A of the Internal Revenue Code, adjust equitably any or all of:
| • | the number and type of shares or other securities that thereafter may be made the subject of awards, including the aggregate and individual limits under the Omnibus Plan; |
| • | the number and type of shares or other securities subject to outstanding awards; and |
| • | the grant, purchase, exercise or hurdle price for any award or, if deemed appropriate, make provision for a cash payment to the holder of an outstanding award. |
In addition, the Administrator may adjust the terms and conditions of, and the criteria included in, outstanding awards in recognition of events affecting the Company or the financial statements of the Company, or changes in applicable laws, regulations or accounting principles, whenever the Administrator determines that such adjustments are appropriate in order to prevent dilution or enlargement of the benefits or potential benefits intended to be made available under the Omnibus Plan, subject, in all such instances, to compliance with Section 162(m) of the Internal Revenue Code.
No Repricing
Except as provided the Omnibus Plan’s adjustment provisions, no action shall directly or indirectly, through cancellation and regrant or any other method, reduce, or have the effect of reducing, the exercise or hurdle price of any award established at the time of grant thereof without approval of our stockholders.
Termination of Service and Change of Control
The Administrator will determine the effect of a termination of employment or service on outstanding awards, including whether the awards will vest, become exercisable, settle or be forfeited. In the event of a
122
Table of Contents
change of control, except as otherwise provided in the applicable award agreement, the Administrator may provide for:
| • | continuation or assumption of outstanding awards under the Omnibus Plan by us (if we are the surviving corporation) or by the surviving corporation or its parent; |
| • | substitution by the surviving corporation or its parent of awards with substantially the same terms and value as such outstanding awards under the Omnibus Plan; |
| • | acceleration of the vesting (including the lapse of any restrictions, with any performance criteria or conditions deemed met at target) or the right to exercise outstanding awards immediately prior to the date of the change of control and the expiration of awards not timely exercised by the date determined by the Administrator; or |
| • | in the case of outstanding stock options and SARs, cancelation in consideration of a payment in cash or other consideration equal to the intrinsic value of the award. The Administrator may, in its sole discretion, terminate without the payment of any consideration, any stock options or SARs for which the exercise or hurdle price is equal to or exceeds the per share value of the consideration to be paid in the change of control transaction. |
Amendment and Termination
Our Board of Directors may amend, alter, suspend, discontinue or terminate the Omnibus Plan, subject to approval of our stockholders if required by the rules of the stock exchange on which our shares are principally traded. The Administrator may also amend, alter, suspend, discontinue or terminate, or waive any conditions or rights under, any outstanding award. However, subject to the adjustment provision and change of control provision, any such action by the Administrator that would materially adversely affect the rights of a holder of an outstanding award may not be taken without the holder’s consent, except to the extent that such action is taken to cause the Omnibus Plan to comply with applicable law, stock market or exchange rules and regulations, or accounting or tax rules and regulations, or to impose any “clawback” or recoupment provisions on any awards in accordance with the Omnibus Plan.
2010 Long-Term Incentive Plan
Historically, we have had one long-term incentive plan pursuant to which we have only granted stock options, the 2010 Long-Term Incentive Plan. Outstanding stock options currently provide the option holder the right to purchase our common stock at the strike price per share agreed to under an individual award following satisfaction of time-based vesting conditions. Following completion of this offering, we will no longer grant new awards under the 2010 Long-Term Incentive Plan.
Purpose
The purpose of the 2010 Long-Term Incentive Plan is to attract and retain the services of key employees, key contractors, key consultants and outside directors while aligning their interests with the interests of our stockholders.
Shares Available under the 2010 Long-Term Incentive Plan
As of October 29, 2016, we had 46,832 stock options outstanding under the 2010 Long-Term Incentive Plan (this amount does not reflect the stock split described in this prospectus), subject to adjustment in the event of any recapitalization, stock-split, reverse stock split, rights offering, reorganization, merger, consolidation, split-up, spin-off, split-off, combination, subdivision, repurchase or exchange of common stock or other securities of the Company, issuance of warrants or other rights to purchase common stock or other securities of the Company, or other similar corporate transaction or event that affects the common stock of the Company such that an
123
Table of Contents
adjustment is determined by the Board of Directors to be appropriate to prevent the dilution or enlargement of the benefits or potential benefits intended to be made under the 2010 Long-Term Incentive Plan. Shares issued under the 2010 Long-Term Incentive Plan may be made available from authorized but unissued common stock, common stock held by the Company in its treasury or common stock purchased by the Company on the open market or otherwise. If any award is forfeited, expires or terminates without having been exercised, the shares that are not acquired may again be issued under the 2010 Long-Term Incentive Plan. No new awards will be made under the 2010 Long-Term Incentive Plan after the effective date of the registration statement of which this prospectus is a part.
Eligibility
All of our employees, contractors, consultants and outside directors may receive awards under the 2010 Long-Term Incentive Plan. As of October 29, 2016, 46 participants held outstanding awards under the 2010 Long-Term Incentive Plan.
Administration
The 2010 Long-Term Incentive Plan is administered by the Board of Directors. The Board of Directors has discretion to:
| • | interpret the 2010 Long-Term Incentive Plan; |
| • | prescribe, amend, and rescind any rules and regulations necessary or appropriate for the administration of the 2010 Long-Term Incentive Plan; |
| • | establish performance goals for an award and certify the extent of their achievement; |
| • | designate from time to time eligible persons to whom awards will be granted; and |
| • | make such other determinations or certifications and take such other action as it deems necessary or advisable in the administration of the 2010 Long-Term Incentive Plan. |
The Board of Directors may delegate to officers of the Company, pursuant to a written delegation, the authority to perform specified functions under the 2010 Long-Term Incentive Plan.
Amendment and Termination
In general, the Board of Directors may, without the consent of the participants, alter, amend, revise, suspend, or discontinue the Plan in whole or in part. However, no amendment for which stockholder approval is required (either by any securities exchange or inter-dealer quotation system on which the common stock of the Company is listed or traded or in order for the 2010 Long-Term Incentive Plan and awards made under the 2010 Long-Term Incentive Plan to continue to comply with Sections 162(m), 409A, 421 and 422 of the Internal Revenue Code) will be effective unless such amendment is approved by the requisite vote of the stockholders of the Company entitled to vote. Unless required by law, the Board of Directors may not take any action that adversely affects any rights of participants or obligations of the Company to participants with respect to an award without the consent of the affected participant.
Form of Awards
Awards under the 2010 Long-Term Incentive Plan are in the form of stock options not intended to qualify as “incentive stock options” under Section 422 of the Internal Revenue Code, with the following terms:
| • | options must have an exercise price at least equal to the fair market value of our common stock on the date of grant; |
124
Table of Contents
| • | a certain percentage of the shares subject to the stock option are subject to immediate vesting upon the occurrence of certain, fundamental corporate events (e.g., change in control or upon the occurrence of an initial public offering); |
| • | generally, stock options under the 2010 Long-Term Incentive Plan provide for vesting in equal annual installments over three or four years from the date of grant; and |
| • | stock options expire upon the earlier of ten years after the date of grant or 90 days after termination of service (other than termination of service due to death or disability, in which case the options may be exercised within one year thereafter, or a termination for cause, in which case the Company may immediately terminate unexercised stock options). |
Outstanding Equity Awards at Fiscal Year-End
The following table sets forth information regarding equity awards held by our named executive officers as of October 29, 2016.
| OPTION AWARDS | STOCK AWARDS | |||||||||||||||||||||||||||||||||||
| Name |
Number of Securities Underlying Unexercised Options (#) Exercisable |
Number of Securities Underlying Unexercised Options (#) Unexercisable |
Equity Incentive Plan Awards: Number of Securities Underlying Unexercised Unearned Options (#) |
Option Exercise Price ($) |
Option Expiration Date |
Number of Shares or Units of Stock that Have Not Vested (#) |
Market Value of Shares or Units of Stock that Have Not Vested ($) |
Equity Incentive Plan Awards: Number of Unearned Shares, Units or Other Rights that Have Not Vested (#) |
Equity Incentive Plan Awards: Market or Payout Value of Unearned Shares, Units or Other Rights that Have Not Vested ($) |
|||||||||||||||||||||||||||
| (a) | (b) | (c) | (d) | (e) | (f) | (g) | (h) | (i) | (j) | |||||||||||||||||||||||||||
| Timothy W. Sullivan(1) |
7,750 | 7,750 | — | 402.23 | 8/15/2024 | — | — | — | — | |||||||||||||||||||||||||||
| Dean Nolden(2) |
— | 2,250 | — | 648.96 | 1/10/2026 | — | — | — | — | |||||||||||||||||||||||||||
| Marcus Berto(3) |
2,500 | 2,500 | — | 402.23 | 10/19/2024 | — | — | — | — | |||||||||||||||||||||||||||
| Thomas B. Phillips(3) |
— | 2,000 | — | 648.96 | 2/11/2026 | — | — | — | — | |||||||||||||||||||||||||||
| Barbara H. Stephens(3) |
— | 700 | — | 648.96 | 2/11/2026 | — | — | — | — | |||||||||||||||||||||||||||
| James McGinn |
— | — | — | — | — | — | — | — | — | |||||||||||||||||||||||||||
| (1) | Options vest in four equal installments over four years from the grant date, which is ten years prior to the expiration date. See “Potential Payments Upon Termination or Change in Control” for a description of accelerated vesting upon certain events. |
| (2) | Options vest in three equal installments over three years from the employee’s employment start date. The options expire ten years from the date of grant. See “Potential Payments Upon Termination or Change in Control” for a description of accelerated vesting upon certain events. |
| (3) | Options vest in four equal installments over four years from the employee’s employment start date. The options expire ten years from the date of grant. See “Potential Payments Upon Termination or Change in Control” for a description of accelerated vesting upon certain events. |
The outstanding awards set forth in the table above do not reflect the stock split described in this prospectus.
125
Table of Contents
Option Exercises
The following table sets forth information regarding stock options exercised by our named executive officers during fiscal year 2016.
| Option Awards | ||||||||
| Name(a) |
Number of Shares Acquired on Exercise (#) |
Value Realized on Exercise ($) |
||||||
| James McGinn |
500 | (1) | $ | 186,957 | (2) | |||
| (1) | This number does not reflect the stock split described in this prospectus. |
| (2) | Represents the fair market value of our stock as of June 17, 2016, less the exercise price of the stock option award. This amount was paid by the Company to Mr. McGinn upon the Company’s exercise of its call right under the Shareholders Agreement in connection with Mr. McGinn’s separation from the Company. |
Potential Payments Upon Termination or Change in Control
Severance Policy. The Severance Policy provides severance payments to participants upon an “involuntary separation from service,” which includes an elimination for lack of work, cost containment, a general reduction in force, or other reasons unrelated to job performance. An “involuntary separation from service” specifically excludes a termination of employment for cause or otherwise due to job performance or other job-related matters. In order to receive severance payments, a participant must have been employed by the Company for a minimum of twelve months. Receipt of severance payments is contingent on a participant’s execution and non-revocation of a release of claims. Pursuant to the Severance Policy, Messrs. Sullivan and Berto would be eligible to receive a severance payment equal to one year of his annual base salary. Given the date on which they commenced employment with the Company, Messrs. Nolden and Phillips and Ms. Stephens are not eligible to receive severance payments as of the date of this prospectus.
The following amounts reflect the severance payments our named executive officers would have been eligible to receive upon experiencing an “involuntary separation from service” on October 29, 2016:
| • | Timothy W. Sullivan—$800,000 |
| • | Marcus Berto—$515,000 |
Accelerated Vesting Upon Change in Control or IPO. Each of our named executive officers (other than Mr. McGinn) hold stock options that would partially vest in connection with fundamental corporate events, including a change in control or initial public offering. The following amounts represent the value associated with the partial acceleration of each named executive officer’s unvested stock options if this offering or a change in control had occurred on October 29, 2016 (based on $13.87, or the share value as of such applicable date after the stock split described in this prospectus):
| • | Timothy W. Sullivan—$5,479,483 |
| • | Dean J. Nolden—$575,375 |
| • | Marcus Berto—$1,767,575 |
| • | Thomas B. Phillips—$460,300 |
| • | Barbara H. Stephens—$161,165 |
Transition Agreement. Pursuant to the Transition and Consultancy Agreement with Mr. McGinn, which will terminate in June 2017, he was entitled to receive the following:
| • | A stay bonus equal to $77,516 and guaranteed prorated bonus for fiscal year 2016 equal to $70,717, in each case subject to Mr. McGinn’s continued employment through June 17, 2016; |
126
Table of Contents
| • | Consulting payments equal to $212,150 paid in monthly installments through May 31, 2017, plus a consulting fee at a rate of $175 per hour for services requested beyond an agreed monthly limit; and |
| • | Full reimbursement for COBRA payments that Mr. McGinn incurs in connection with continuation of his health benefits for the 12-month period following June 17, 2016 (or, if earlier, the date when Mr. McGinn and his dependents cease to be eligible for such coverage). |
Director Compensation
Neither Mr. Sullivan nor our non-employee directors who are employees of AIP receive compensation for their board service. Our non-employee directors will be eligible to receive an annual retainer fee of $80,000 for their board service. Non-employee directors who serve on a committee of the board will receive an additional $7,500 for their service. A chairperson of a committee of our board will also receive $15,000 for such service. These fees are payable the first month of each fiscal quarter.
Non-employee directors may also receive one or more grants of equity compensation from the Company in respect of his or her service on the Board of Directors of the Company. In connection with the Company’s initial public offering, each independent director will receive an award of restricted stock units with a value of $30,000 (based on the initial public offering price), which will cliff-vest upon the first anniversary of grant.
Fiscal Year 2016 Director Compensation. The following table sets forth information concerning the compensation earned by our non-employee directors during fiscal year 2016. Mr. Sullivan does not receive separate compensation for his service on the Board of Directors.
| Name |
Fees Earned or Paid in Cash ($) |
All Other Compensation ($) |
Total ($) |
|||||||||
| Paul Bamatter |
$ | — | $ | — | $ | — | ||||||
| Jean Marie “John” Canan |
23,750 | — | 23,750 | |||||||||
| Dino Cusumano |
— | — | — | |||||||||
| Charles Dutil |
21,875 | — | 21,875 | |||||||||
| Justin Fish |
— | — | — | |||||||||
| Gene Goodson(1) |
50,000 | 15,000 | 65,000 | |||||||||
| Kim Marvin |
— | — | — | |||||||||
| Joel Rotroff |
— | — | — | |||||||||
| Donn Viola |
61,250 | — | 61,250 | |||||||||
| (1) | Mr. Goodson ceased to be a director in October 2016. Pursuant to a consulting agreement, he received $15,000 for separately providing consulting services during fiscal year 2016. |
127
Table of Contents
CERTAIN RELATIONSHIPS AND RELATED PARTY TRANSACTIONS
We describe below transactions and series of similar transactions, during our last three fiscal years or currently proposed, to which we were a party or will be a party, in which:
| • | the amounts involved exceeded or will exceed $120,000; and |
| • | any of our directors, executive officers or beneficial holders of more than 5% of any class of our capital stock had or will have a direct or indirect material interest. |
Other than as described below, there have not been, nor are there any currently proposed, transactions or series of similar transactions meeting this criteria to which we have been or will be a party other than compensation arrangements, which are described where required under “Executive and Director Compensation.”
Amended and Restated Shareholders Agreement
In connection with this offering, we will enter into an amended and restated shareholders agreement with AIP, entities affiliated with J.P. Morgan Securities LLC (the “JPM Holders”) and certain of our existing stockholders (the “Shareholders Agreement”). The Shareholders Agreement will become effective upon completion of this offering and replace the shareholders agreement that was in effect immediately prior to this offering. Pursuant to the Shareholders Agreement, AIP will have the following rights so long as it beneficially owns at least 15% of the then outstanding shares of our common stock:
| • | to nominate the greater of five members of the Board of Directors or a majority of directors; |
| • | to designate the Chairman of our board of directors and one member to each of the audit committee, the compensation committee and the nominating and corporate governance committee; |
| • | to approve the commencement of any proceeding for the voluntary dissolution, winding up or bankruptcy of the Company or any material subsidiary; |
| • | to approve any non-pro rata reduction to the share capital of the Company or any material subsidiary, except as required by law; |
| • | to approve amendments to the amended and restated certificate of incorporate and amended and restated bylaws that would change the name of the Company, its jurisdiction of incorporation, the location of its principal executive offices, the purpose or purposes for which the Company is incorporated or the approval requirements as provided in the Shareholders Agreement; |
| • | to approve special dividends greater than $10 million; |
| • | to approve any merger, amalgamation or consolidation of the Company or the spin-off of a business of the Company with assets in excess of 15% of the consolidated assets or revenues of the Company and its subsidiaries; |
| • | the sale, conveyance, transfer or other disposition of all or more than 15% of the consolidated assets or revenues of the Company and its subsidiaries; and |
| • | any designation to the Board of Directors contrary to the Shareholders Agreement or the amended and restated certificate of incorporation and amended and restated bylaws. |
In addition, for so long as AIP beneficially owns at least 15% of the then outstanding shares of our common stock, AIP will be entitled to certain information rights, including the right to consult with and advise senior management, to receive quarterly and annual financial statements and to review our books and records. We will also be required to cooperate with AIP in connection with certain pledges of our shares or grants of security interests in respect thereof, including in connection with margin loans.
128
Table of Contents
The Shareholders Agreement will also provide for the reimbursement of certain expenses that AIP incurs in connection with providing management services to us. During fiscal years 2016, 2015 and 2014, reimbursements of expenses to AIP for management services totaled $0.2 million, $1.1 million and $2.1 million, respectively.
The Shareholders Agreement will automatically terminate when AIP ceases to beneficially own, directly or indirectly, at least 15% of the then outstanding shares of our common stock.
Registration Rights Agreement
In connection with this offering, we will enter into a registration rights agreement that will provide AIP and certain of our current shareholders with registration rights, as described under “Description of Capital Stock—Registration Rights.”
Other Transactions with our Executive Officers, Directors and 5% Stockholders
In December 2014, we engaged an information technology, software and consulting company to provide services to us including software development and installation. Mr. Sullivan, our CEO, has a material equity interest in that company. During fiscal years 2016 and 2015, we incurred $1.6 million and $0.3 million, respectively, of net costs relating to such services. Mr. Sullivan has not received any payments or other direct monetary gains from his equity interest in the company. Our Board of Directors has determined that the transactions with the related software and consulting company were on commercially reasonable terms that are no less favorable than we would be able to obtain on an arm’s length basis.
Indemnification Agreements
Our amended and restated certificate of incorporation and our amended and restated bylaws will provide that we will indemnify our directors and officers to the fullest extent permitted under Delaware law. In addition, prior to the completion of this offering, we expect to enter into customary indemnification agreements with each of our directors and executive officers. These agreements will require us to indemnify these individuals and, in certain cases, affiliates of such individuals, to the fullest extent permissible under Delaware law against liabilities that may arise by reason of their service to us or at our direction, and to advance expenses incurred as a result of any proceeding against them as to which they could be indemnified.
There is currently no pending litigation or proceeding involving any of our directors, officers or employees for which indemnification is being sought.
Related Person Transactions Policy
Upon the consummation of this offering, we will adopt a formal, written policy with respect to the review, approval, ratification and disclosure of related person transactions. The policy requires that a “related person” (as defined in Item 404 of the SEC’s Regulation S-K) or the business leader responsible for entering into the “related person transaction” (as defined in Item 404 of the SEC’s regulation S-K) on our behalf, must, prior to entering into the related party transaction, notify our General Counsel and the chairman of our audit committee of the facts and circumstances of the proposed transaction. Under the policy, our audit committee, and, in limited circumstances, the chairman of our audit committee, is responsible for reviewing the facts and circumstances and determining whether to approve the related person transaction. In particular, our policy requires our audit committee to consider, among other factors it deems appropriate:
| • | the related person’s relationship to us and interest in the transaction; |
| • | the material facts of the proposed transaction, including the proposed aggregate value of the transaction; |
129
Table of Contents
| • | the impact on a director’s independence in the event the related person is a director or an immediate family member of the director; |
| • | the benefits to us of the proposed transaction; |
| • | if applicable, the availability of other sources of comparable products or services; and |
| • | an assessment of whether the proposed transaction is on terms that are comparable to the terms available to an unrelated third party or to employees generally. |
The audit committee (or chairman) may only approve those transactions that it determines, in good faith, are in, or are not inconsistent with, our best interests and those of our stockholders.
130
Table of Contents
PRINCIPAL AND SELLING STOCKHOLDERS
The following table sets forth information relating to the beneficial ownership of our common stock as of October 29, 2016, by:
| • | each person, or group of affiliated persons, known by us to beneficially own more than 5% of our outstanding shares of common stock; |
| • | each of our other selling stockholders; |
| • | each of our directors and named executive officers; and |
| • | all directors and named executive officers as a group. |
A person is a “beneficial owner” of a security if that person has or shares voting or investment power over the security or if that person has the right to acquire sole or shared voting or investment power over the security within 60 days. Unless otherwise noted, these persons, to our knowledge, have sole voting and investment power over the shares listed. In computing the number of shares of common stock beneficially owned by a person and the percentage ownership of that person, we deemed outstanding shares of common stock subject to options held by that person that are currently exercisable or exercisable within 60 days of October 29, 2016. We did not deem these shares outstanding, however, for the purpose of computing the percentage ownership of any other person.
The percentage of shares beneficially owned is computed on the basis of 51,197,200 shares of our common stock outstanding as of October 29, 2016. Unless otherwise indicated below, the address for each beneficial owner listed is c/o REV Group, Inc., 111 E. Kilbourn Avenue, Suite 2600, Milwaukee, Wisconsin 53202. The following table assumes that the underwriters’ option to purchase additional shares is exercised in full. The selling stockholders listed in the table below are not selling any shares other than in connection with the underwriters’ option to purchase additional shares.
| Name and address of beneficial owner: |
Common Stock Beneficially Owned Before this Offering |
Common Stock Beneficially Owned After this Offering |
Number of Shares Being Offered in the Option to Purchase Additional Shares |
Percentage of Shares Owned Assuming Underwriters’ Exercise of the Option to Purchase Additional Shares in Full |
||||||||||||||||||||
| Shares | % | Shares | % | |||||||||||||||||||||
| Selling stockholders: |
||||||||||||||||||||||||
| Funds associated with American Industrial Partners(1) |
45,834,841 | 89.5 | % | 45,834,841 | 72.0 | % | 1,247,879 | 70.0 | % | |||||||||||||||
| Funds associated with J.P. Morgan Securities LLC(2) |
2,078,439 | 4.1 | % | 2,078,439 | 3.3 | % | 56,586 | 3.2 | % | |||||||||||||||
| Ally Commercial Finance, LLC(3) |
547,795 | 1.1 | % | 547,795 | * | 547,795 | — | |||||||||||||||||
| Jorge Amador(4) |
16,704 | * | 16,704 | * | 455 | * | ||||||||||||||||||
| Eric Baroyan(5) |
52,619 | * | 52,619 | * | 1,433 | * | ||||||||||||||||||
| The Eric Baroyan 2010 Long-Term Trust(6) |
5,846 | * | 5,846 | * | 159 | * | ||||||||||||||||||
| John Becker(7) |
92,250 | * | 92,250 | * | 2,512 | * | ||||||||||||||||||
| The John Becker 2010 Long-Term Trust(8) |
104,027 | * | 104,027 | * | 2,832 | * | ||||||||||||||||||
| Estate of Sparsh Bhargava(9) |
4,176 | * | 4,176 | * | 114 | * | ||||||||||||||||||
| Daniel Davis(10) |
15,034 | * | 15,034 | * | 409 | * | ||||||||||||||||||
| The Main Trust under the Daniel Davis 2012 Long-Term Trust(11) |
1,670 | * | 1,670 | * | 45 | * | ||||||||||||||||||
| Ben DeRosa(12) |
58,465 | * | 58,465 | * | 1,592 | * | ||||||||||||||||||
| Ryan Hodgson(13) |
8,352 | * | 8,352 | * | 227 | * | ||||||||||||||||||
| Richard Hoffman(14) |
16,704 | * | 16,704 | * | 455 | * | ||||||||||||||||||
| Graham Sullivan(15) |
43,849 | * | 43,849 | * | 1,194 | * | ||||||||||||||||||
| The Graham Grosvenor Sullivan 2012 Long-Term Trust(16) |
14,616 | * | 14,616 | * | 398 | * | ||||||||||||||||||
131
Table of Contents
| Name and address of beneficial owner: |
Common Stock Beneficially Owned Before this Offering |
Common Stock Beneficially Owned After this Offering |
Number of Shares Being Offered in the Option to Purchase Additional Shares |
Percentage of Shares Owned Assuming Underwriters’ Exercise of the Option to Purchase Additional Shares in Full |
||||||||||||||||||||
| Shares | % | Shares | % | |||||||||||||||||||||
| Directors and executive officers: |
||||||||||||||||||||||||
| Tim Sullivan(17) |
1,117,200 | 2.2 | % | 1,117,200 | 1.8 | % | — | 1.8 | % | |||||||||||||||
| Dean Nolden |
— | * | — | * | — | * | ||||||||||||||||||
| Barbara Stephens |
— | * | — | * | — | * | ||||||||||||||||||
| Marcus Berto(18) |
498,320 | 1.0% | 498,320 | * | — | * | ||||||||||||||||||
| Tom Phillips |
— | * | — | * | — | * | ||||||||||||||||||
| Paul Bamatter(19) |
— | — | — | — | — | — | ||||||||||||||||||
| Jean Marie “John” Canan(20) |
— | — | — | — | — | — | ||||||||||||||||||
| Dino Cusumano(21) |
196,278 | * | 196,278 | * | 5,344 | * | ||||||||||||||||||
| Charles Dutil(22) |
— | — | — | — | — | — | ||||||||||||||||||
| Justin Fish(23) |
4,176 | * | 4,176 | * | 114 | * | ||||||||||||||||||
| Kim Marvin(24) |
196,278 | * | 196,278 | |
* |
|
5,344 | * | ||||||||||||||||
| Joel Rotroff(25) |
4,176 | * | 4,176 | * | 114 | * | ||||||||||||||||||
| Donn Viola(26) |
40,811 | * | 40,811 | * | — | * | ||||||||||||||||||
|
|
|
|
|
|
|
|
|
|
|
|||||||||||||||
| All executive officers and directors as a group (13 persons) |
2,057,239 | 4.0 | % | 2,057,239 | 3.2 | % | 10,916 | 3.2 | % | |||||||||||||||
| * | Represents beneficial ownership of less than one percent of our outstanding shares of common stock. |
| (1) | Represents (i) 42,684,344 shares of common stock held by American Industrial Partners Capital Fund IV, LP. (“Fund IV”), (ii) 211,556 shares of common stock held by American Industrial Partners Capital Fund IV (Parallel), LP (“Parallel Fund”) and (iii) 2,938,941 shares of common stock held by AIP/CHC Holdings, LLC (“AIP Holdings” and, together with Fund IV and Parallel Fund, the “AIP Funds”). AIP CF IV, LLC (“AIP GP”) is the general partner of Fund IV and the Parallel Fund. Mssrs. Becker, Cusumano and Marvin are the senior managing members of AIP GP. They are also the managing members of AIP/CHC Investors, LLC, which is the managing member of AIP Holdings. Messrs. Cusumano and Marvin serve as members of the Board of Directors of REV. See “Management.” As a result of the above, Messrs. Becker, Cusumano and Marvin may be deemed to share voting and dispositive power with respect to the shares held by the AIP Funds. Each of Messrs. Becker, Cusumano and Marvin disclaim beneficial ownership of the shares of common stock held by the AIP Funds except to the extent of any pecuniary interest therein. The AIP Funds may be deemed to be a “group” within the meaning of Rule 13d-5 of the Securities Exchange Act of 1934, as amended. The address of the AIP Funds is c/o American Industrial Partners, 330 Madison Avenue, 28th Floor, New York, New York 10017. |
| (2) | Represents (i) 1,954,644 shares of common stock held by PEG U.S. Direct Corporate Finance Institutional Investors III LLC (“PEG Institutional”), (ii) 102,529 shares of common stock held by PEG Corporate Finance Private Investors III LLC (“PEG Private”) and (iii) 21,266 shares of common stock held by 522 Fifth Avenue Fund, L.P. (“Fund 522” and, together with PEG Institutional and PEG Private, the “JPM Holders”). The JPM Holders may be deemed to be a “group” within the meaning of Rule 13d-5 of the Securities Exchange Act of 1934, as amended. The address of the JPM Holders is c/o J.P. Morgan Investment Management Inc., 320 Park Avenue, New York, New York 10022. Certain affiliates of the investment adviser or sub-adviser, as applicable, to the JPM Holders are (a) the Company’s primary treasury management bank, (b) a lender under the ABL Facility and (c) the beneficiary of a guaranty issued by the Company. Such affiliates receive fees and other compensation for providing such services to the Company and the ABL Facility, and in acting in such capacities, may have interests that could become adverse to the interests of the JPM Holders. Such affiliates, however, do not hold any shares of the Company, and the JPM Holders beneficially own less than 5% of the outstanding common stock of the Company. |
| (3) | The address of Ally Commercial Finance, LLC is 300 Park Avenue, 4th Floor, New York, New York 10022. |
| (4) | The address of this person is c/o AIP, 330 Madison Avenue, 28th Floor, New York, New York 10017. |
| (5) | The address of this person is c/o AIP, 330 Madison Avenue, 28th Floor, New York, New York 10017. |
132
Table of Contents
| (6) | Eric Baroyan, as Trustee of the Eric Baroyan 2010 Long-Term Trust, may be deemed to share voting power and dispositive power over the shares held by the Eric Baroyan 2010 Long-Term Trust. The address of this person is c/o AIP, 330 Madison Avenue, 28th Floor, New York, New York 10017. |
| (7) | The address of this person is c/o AIP, 330 Madison Avenue, 28th Floor, New York, New York 10017. |
| (8) | John Becker, as Trustee of the John Becker 2010 Long-Term Trust, may be deemed to share voting power and dispositive power over the shares held by the John Becker 2010 Long-Term Trust. The address of this person is c/o AIP, 330 Madison Avenue, 28th Floor, New York, New York 10017. |
| (9) | The address of this person is c/o AIP, 330 Madison Avenue, 28th Floor, New York, New York 10017. |
| (10 | The address of this person is c/o AIP, 330 Madison Avenue, 28th Floor, New York, New York 10017. |
| (11) | Daniel Davis, as Trustee of the Main Trust under the Daniel Davis 2012 Long-Term Trust, may be deemed to share voting power and dispositive power over the shares held by the Main Trust under the Daniel Davis 2012 Long-Term Trust. The address of this person is c/o AIP, 330 Madison Avenue, 28th Floor, New York, New York 10017. |
| (12) | The address of this person is c/o AIP, 330 Madison Avenue, 28th Floor, New York, New York 10017. |
| (13) | The address of this person is c/o AIP, 330 Madison Avenue, 28th Floor, New York, New York 10017. |
| (14) | The address of this person is c/o AIP, 330 Madison Avenue, 28th Floor, New York, New York 10017. |
| (15) | The address of this person is c/o AIP, 330 Madison Avenue, 28th Floor, New York, New York 10017. |
| (16) | Graham Sullivan, as Trustee of the Graham Grosvenor Sullivan 2012 Long-Term Trust, may be deemed to share voting power and dispositive power over the shares held by the Graham Grosvenor Sullivan 2012 Long-Term Trust. The address of this person is c/o AIP, 330 Madison Avenue, 28th Floor, New York, New York 10017. |
| (17) | Includes 497,200 shares of common stock and (b) 620,000 shares of common stock issuable upon the exercise of options exercisable within 60 days after October 29, 2016. |
| (18) | Includes (a) 298,320 shares of common stock and (b) 200,000 shares of common stock issuable upon the exercise of options exercisable within 60 days after October 29, 2016. |
| (19) | The address of this person is c/o AIP, 330 Madison Avenue, 28th Floor, New York, New York 10017. |
| (20) | The address of this person is c/o AIP, 330 Madison Avenue, 28th Floor, New York, New York 10017. |
| (21) | The address of this person is c/o AIP, 330 Madison Avenue, 28th Floor, New York, New York 10017. |
| (22) | The address of this person is c/o AIP, 330 Madison Avenue, 28th Floor, New York, New York 10017. |
| (23) | The address of this person is c/o AIP, 330 Madison Avenue, 28th Floor, New York, New York 10017. |
| (24) | The address of this person is c/o AIP, 330 Madison Avenue, 28th Floor, New York, New York 10017. |
| (25) | The address of this person is c/o AIP, 330 Madison Avenue, 28th Floor, New York, New York 10017. |
| (26) | The address of this person is c/o AIP, 330 Madison Avenue, 28th Floor, New York, New York 10017 |
133
Table of Contents
We summarize below the principal terms of the agreements that govern our material indebtedness. We refer you to the exhibits to the registration statement of which this prospectus forms a part for copies of the agreements governing the indebtedness described below.
ABL Facility
On October 21, 2013, the Company entered into a $150.0 million senior secured ABL revolving credit and guaranty agreement (the “ABL Facility”) with a syndicate of lenders. The ABL Facility consists of: (i) revolving loans, (ii) swing line loans and (iii) letters of credit, aggregating up to a combined maximum of $150.0 million. The total amount borrowed is subject to a $15.0 million sublimit for swing line loans and a $25.0 million sublimit for letters of credit, along with certain borrowing base and other customary restrictions as defined in the agreement. On April 22, 2016, the Company exercised its $50.0 million incremental commitment option under the ABL Facility in conjunction with the acquisition of KME. On August 19, 2016, the Company amended the ABL Facility to increase the commitment from $200.0 million to $300.0 million to provide flexibility and access to the suppressed borrowing base. All other terms and conditions of the ABL Facility remained unchanged.
Maturity. All outstanding principal on the ABL Facility is due and payable on the maturity date of October 21, 2018, unless as otherwise amended per the terms of the agreement.
Interest and Fees. All revolving loans under the ABL Facility bear interest at rates equal to, at the Company’s option, either a base rate plus an applicable margin, or a Eurodollar rate plus an applicable margin. All swing line loans under the ABL Facility bear interest at a rate equal to a base rate plus an applicable margin. Applicable margins were initially set at 0.75% for revolving loans and swing line loans, and 1.75% for Eurodollar loans, and are subject to subsequent adjustment as defined in the agreement. Interest is payable quarterly for all loans in which a base rate is applied, and is payable either monthly, quarterly or semiannually for all loans in which a Eurodollar rate is applied.
Guarantees and Security. The lenders hold a first priority security interest in substantially all accounts receivable and inventory of the Company, and a second priority security interest in all other assets of the Company. All obligations under the ABL Facility are effectively subordinate to other debt to the extent of the value of collateral other than accounts receivable and inventory.
Voluntary Repayments. Principal may be repaid at any time during the term of the ABL Facility without penalty. We intend to repay $39.3 million aggregate principal amount of loans under ABL Facility, plus accrued and unpaid interest thereon, with a portion of the proceeds from this offering. See “Use of Proceeds.”
Covenants. The ABL Facility requires the Company to comply with certain financial covenants, including maintaining a consolidated fixed charge coverage ratio of at least 1:1. The ABL Facility contains a number of negative covenants that will, subject to certain exceptions, limit our ability and the ability of our restricted subsidiaries to, among other things:
| • | incur additional indebtedness and issue preferred stock; |
| • | pay dividends or make other distributions or repurchase or redeem our capital stock; |
| • | make certain loans and investments; |
| • | transfer or sell assets; |
| • | incur certain liens; |
| • | enter into transactions with affiliates; |
| • | alter the businesses we conduct; |
134
Table of Contents
| • | enter into agreements restricting our subsidiaries’ ability to pay dividends; |
| • | consolidate, merge or sell all or substantially all of our assets; |
| • | enter into certain sale and leaseback transactions; and |
| • | prepay certain other indebtedness and amend certain material documents. |
Senior Secured Notes
On October 21, 2013 the Company issued $200.0 million aggregate principal amount of Senior Secured Notes due November 1, 2019 (the “Senior Secured Notes”) under an indenture dated as of October 21, 2013. The net proceeds from the Senior Secured Notes, together with net proceeds from the ABL Facility (defined below), were primarily used to finance the Thor Industries acquisition and to repay all outstanding debt existing at that time. The Senior Secured Notes were issued with original issue discount of $1.2 million.
On October 17, 2016, the Company completed an open market purchase of $20.0 million of its outstanding Senior Secured Notes, which were subsequently cancelled. The Company paid a premium of $0.4 million and $0.8 million of accrued interest as of the date of the purchase.
Interest and Fees. Interest on the Senior Secured Notes accrues at the rate of 8.5% per annum, payable semi-annually in arrears on May 1 and November 1.
Guarantees and Security. The Senior Secured Notes are guaranteed by all our direct and indirect wholly owned domestic subsidiaries that guarantee debt under the ABL Facility described below. The Senior Secured Notes are secured by a first priority lien on substantially all of the guarantors’ assets other than accounts receivable and inventory, and related assets pledged in the ABL Facility. The Senior Secured Notes are also secured by a second priority lien on substantially all of the collateral under our ABL Facility. The Senior Secured Notes are effectively subordinated to debt incurred under our ABL Facility, or other permitted debt facilities and obligations, as defined, to the extent of the value of the assets securing our ABL Facility.
Optional Redemption. We may redeem all or a part of the Senior Secured Notes, plus accrued and unpaid interest on the Senior Secured Notes redeemed, to the applicable redemption date. The redemption price is 104.250% of the principal amount of the Senior Secured Notes from November 1, 2016 to November 1, 2017, after which it decreases to 102.125% and 100.000% on November 1, 2017 and 2018, respectively.
We intend to redeem the Senior Secured Notes in full with a portion of the proceeds from this offering. See “Use of Proceeds.”
Covenants. The Senior Secured Notes contain a number of covenants that, among other things and subject to certain exceptions, restrict the Company’s ability to:
| • | incur additional indebtedness; |
| • | make loans or advances to the Company or its subsidiaries; |
| • | pay dividends; |
| • | sell, lease or transfer properties or assets to the Company or its subsidiaries; |
| • | create or assume liens; |
| • | enter into transactions with affiliates; |
| • | enter into sale or leaseback transactions; and |
| • | dispose of collateral guaranteeing the Senior Secured Notes. |
135
Table of Contents
The following is a summary of our capital stock and certain terms of our certificate of incorporation and bylaws as they will be in effect upon the completion of this offering. This discussion summarizes some of the important rights of our stockholders but does not purport to be a complete description of these rights and may not contain all of the information regarding our capital stock that is important to you. These rights can only be determined in full, and the descriptions herein are qualified in their entirety, by reference to our proposed amended and restated certificate of incorporation and amended and restated bylaws, copies of which are filed with the SEC as exhibits to the registration statement of which this prospectus forms a part.
Reclassification of Class A and Class B Common Stock
Concurrently with the completion of this offering, we will amend our certificate of incorporation to (i) provide for the automatic reclassification of our Class A common stock and Class B common stock into a single class of common stock, which will be issued in this offering, and (ii) to effect an 80-for-1 stock split pursuant to which each share of common stock held by a holder will be reclassified into 80 shares effective concurrently with the closing of this offering (with us paying cash in lieu of any fractional share). In addition, we will further amend our certificate of incorporation and bylaws to include the provisions described below.
General
Upon the completion of this offering, our authorized capital stock will consist of 700,000,000 shares of capital stock, $0.001 par value per share, of which:
| • | 605,000,000 shares are designated as common stock; and |
| • | 95,000,000 shares are designated as preferred stock. |
As of October 29, 2016, there were 51,197,200 shares of our common stock outstanding held by 72 stockholders of record. No shares of our preferred stock are currently outstanding.
The following description summarizes the material terms of our securities. Because it is only a summary, it may not contain all the information that is important to you.
Common Stock
All issued and outstanding shares of our common stock will be duly authorized, validly issued, fully paid, and non-assessable. All authorized but unissued shares of our common stock will be available for issuance by our Board of Directors without any further stockholder action, except as required by the listing standards of the NYSE.
Voting Rights. Each holder of our common stock will be entitled to one vote per share on all matters to be voted upon by the stockholders. The holders of common stock will not have cumulative voting rights in the election of directors.
Dividend Rights. Each holder of our common stock will be entitled to ratably receive dividends if, as, and when declared from time to time by our Board of Directors at its own discretion out of funds legally available for that purpose, after payment of dividends required to be paid on outstanding preferred stock, if any. Under Delaware law, we can only pay dividends either out of “surplus” or out of the current or the immediately preceding year’s net profits. Surplus is defined as the excess, if any, at any given time, of the total assets of a corporation over its total liabilities and statutory capital. The value of a corporation’s assets can be measured in a number of ways and may not necessarily equal their book value.
Right to Receive Liquidation Distributions. Upon our dissolution, liquidation, or winding-up, the assets legally available for distribution to our stockholders are distributable ratably among the holders of our common stock, subject to prior satisfaction of all outstanding debt and liabilities and the preferential rights and payment of liquidation preferences, if any, on any outstanding shares of preferred stock.
136
Table of Contents
Shareholders Agreement. In connection with this offering, we will enter into an amended and restated shareholders agreement with AIP, the JPM Holders and certain of our existing stockholders (the “Shareholders Agreement”). Pursuant to the Shareholders Agreement, AIP will have certain rights so long as it beneficially owns at least 15% of the then outstanding shares of our common stock, as described in “Certain Relationships and Related Party Transactions—Amended and Restated Shareholders Agreement.”
Other Matters. The common stock will have no preemptive rights pursuant to the terms of our amended and restated certificate of incorporation and our amended and restated bylaws. There will be no redemption or sinking fund provisions applicable to the common stock. All outstanding shares of our common stock will be fully paid and non-assessable, and the shares of our common stock offered in this offering, upon payment and delivery in accordance with the underwriting agreement, will be fully paid and non-assessable.
Preferred Stock
Pursuant to our amended and restated certificate of incorporation, 95,000,000 shares of preferred stock will be issuable from time to time, in one or more series, with the designations of the series, the voting rights of the shares of the series (if any), the powers, preferences, or relative, participation, optional, or other special rights (if any), and any qualifications, limitations or restrictions thereof as our Board of Directors from time to time may adopt by resolution (and without further stockholder approval), subject to certain limitations. Each series will consist of that number of shares as will be stated and expressed in the certificate of designations providing for the issuance of the stock of the series.
Options
As of October 29, 2016, we had outstanding options to purchase an aggregate of 3,746,560 shares of our common stock, with a weighted-average exercise price of approximately $5.69 per share, under our 2010 Long-Term Incentive Plan.
Registration Rights
In connection with this offering, we will enter into a registration rights agreement with AIP, Ally Commercial Finance, LLC, the JPM Funds and certain other existing stockholders (each, a “Stockholder” and together, the “Stockholders”), each of which will be entitled to certain demand and piggyback registration rights. The Stockholders will hold an aggregate of 52,569,334 shares of our common stock, or approximately 83.0% of the voting power of our common stock outstanding upon the completion of this offering (assuming no exercise of the underwriters’ option to purchase additional shares). The registration rights described below will expire on the date on which the securities subject to the registration rights agreement may be sold by the holder in a single transaction pursuant to Rule 144 promulgated under the Securities Act.
Demand Registration Rights. At any time beginning 180 days after the effective date of the registration statement of which this prospectus forms a part, AIP and any other Stockholder or group of Stockholders holding at least 50% of the outstanding shares of our common stock may request that we register all or a portion of their shares. Any such request must cover a quantity of shares with an anticipated aggregate offering price of at least $50.0 million. To the extent we are a well-known seasoned issuer, the Stockholders making a demand registration may also request that we file an automatic shelf registration statement on Form S-3 that covers the registrable securities requested to be registered. Depending on certain conditions, we may defer a demand registration for up to 90 days in any twelve-month period. The Stockholders will agree pursuant to contractual lock-ups not to exercise any of their rights under the registration rights agreement during the 180-day restricted period described under “Underwriting.”
Piggyback Registration Rights. In the event that we propose to register any of our securities under the Securities Act, either for our account or for the account of our other security holders, the Stockholders will be
137
Table of Contents
entitled to certain piggyback registration rights allowing each to include its shares in the registration, subject to certain marketing and other limitations. As a result, whenever we propose to file a registration statement under the Securities Act, the holders of these shares are entitled to notice of the registration.
Transfer Restrictions. The registration rights agreement will contain certain transfer restrictions applicable to the parties thereto. Without the consent of AIP, and subject to certain exceptions, no party to the registration rights agreement will be permitted to transfer their shares of our common stock except in a registered offering being conducted pursuant to, and in accordance with the terms of, the registration rights agreement.
Expenses; Indemnification. The registration rights agreement will provide that we must pay all registration expenses (other than the underwriting discounts and commissions) in connection with effecting any demand registration or shelf registration. The registration rights agreement will contain customary indemnification and contribution provisions.
Anti-Takeover Effects of Certain Provisions of Delaware Law, Our Amended and Restated Certificate of Incorporation and Our Amended and Restated Bylaws
Certain provisions of Delaware law and certain provisions that will be included in our amended and restated certificate of incorporation and amended and restated bylaws summarized below may be deemed to have an anti-takeover effect and may delay, deter, or prevent a tender offer or takeover attempt that a stockholder might consider to be in its best interests, including attempts that might result in a premium being paid over the market price for the shares held by stockholders.
Preferred Stock
Our amended and restated certificate of incorporation contains provisions that permit our Board of Directors to issue, without any further vote or action by the stockholders, shares of preferred stock in one or more series and, with respect to each such series, to fix the number of shares constituting the series and the designation of the series, the voting rights (if any) of the shares of the series, and the powers, preferences, or relative, participation, optional, and other special rights, if any, and any qualifications, limitations, or restrictions, of the shares of such series.
Classified Board
Our Board of Directors will be divided into three classes of directors, with each class as nearly equal in number as possible, serving staggered three year terms, other than directors which may be elected by holders of preferred stock, if any.
Removal of Directors
At any time after AIP beneficially owns less than 50% of our then outstanding common stock, our amended and restated certificate of incorporation provides that directors may be removed only for cause and only by the affirmative vote of holders of a majority of our then outstanding stock. Prior to such time, directors may be removed with or without cause.
Director Vacancies
Our amended and restated certificate of incorporation authorizes only our Board of Directors to fill vacant directorships.
No Cumulative Voting
Our amended and restated certificate of incorporation provides that stockholders do not have the right to cumulate votes in the election of directors.
138
Table of Contents
Special Meetings of Stockholders
At any time after AIP beneficially owns less than 50% of our then outstanding common stock, our amended and restated bylaws and amended and restated certificate of incorporation provide that special meetings of our stockholders may only be called by the Board of Directors. Prior to such time, a special meeting may also be called by the secretary of the Company at the request of stockholders holding a majority of the outstanding shares entitled to vote.
Advance Notice Procedures for Director Nominations
Our amended and restated bylaws establish advance notice procedures for stockholders seeking to nominate candidates for election as directors at an annual or special meeting of stockholders. Although our amended and restated bylaws do not give the board of directors the power to approve or disapprove stockholder nominations of candidates to be elected at an annual meeting, our amended and restated bylaws may have the effect of precluding the conduct of certain business at a meeting if the proper procedures are not followed or may discourage or deter a potential acquirer from conducting a solicitation of proxies to elect its own slate of directors or otherwise attempting to obtain control of our Company.
Action by Written Consent
At any time after AIP beneficially owns less than 50% of our then outstanding common stock, our amended and restated bylaws and amended and restated certificate of incorporation provide that any action required or permitted to be taken by the shareholders must be effected at a duly called annual or special meeting of shareholders and may not be effected by any consent in writing in lieu of a meeting of such shareholders, subject to the rights of the holders of any series of preferred stock. Prior to such time, such actions may be taken without a meeting by written consent.
Amending Our Certificate of Incorporation and Bylaws
At any time after AIP beneficially owns less than 50% of our then outstanding common stock, our amended and restated certificate of incorporation and amended and restated bylaws may be amended by the affirmative vote of the holders of at least two-thirds of our common stock. Prior to such time, our amended and restated certificate of incorporation and amended and restated bylaws may be amended by the affirmative vote of the holders of a majority of the voting power of our common stock.
Authorized But Unissued Shares
Our authorized but unissued shares of our common stock and preferred stock will be available for future issuances without stockholder approval, except as required by the listing standards of the NYSE, and could be utilized for a variety of corporate purposes, including future offerings to raise additional capital, acquisitions, and employee benefit plans. The existence of authorized but unissued and unreserved common stock and preferred stock could render more difficult or discourage an attempt to obtain control of our Company by means of a proxy contest, tender offer, merger or otherwise.
Exclusive Jurisdiction
Our amended and restated certificate of incorporation provides that, unless we consent to the selection of an alternative forum, the Court of Chancery of the State of Delaware shall be the sole and exclusive forum for any derivative action or proceeding brought on our behalf, any action asserting a claim of breach of fiduciary duty owed by any of our directors, officers, or other employees to us or to our stockholders, any action asserting a claim arising pursuant to the DGCL, or any action asserting a claim governed by the internal affairs doctrine.
Business Combinations with Interested Stockholders
Subject to certain exceptions, Section 203 of the DGCL prohibits a public Delaware corporation from engaging in a business combination (as defined in such section) with an “interested stockholder” (defined
139
Table of Contents
generally as any person who beneficially owns 15% or more of the outstanding voting stock of such corporation or any person affiliated with such person) for a period of three years following the time that such stockholder became an interested stockholder, unless (i) prior to such time the Board of Directors of such corporation approved either the business combination or the transaction that resulted in the stockholder becoming an interested stockholder; (ii) upon consummation of the transaction that resulted in the stockholder becoming an interested stockholder, the interested stockholder owned at least 85% of the voting stock of such corporation at the time the transaction commenced (excluding for purposes of determining the voting stock of such corporation outstanding (but not the outstanding voting stock owned by the interested stockholder) those shares owned (A) by persons who are directors and also officers of such corporation and (B) by employee stock plans in which employee participants do not have the right to determine confidentially whether shares held subject to the plan will be tendered in a tender or exchange offer); or (iii) at or subsequent to such time the business combination is approved by the Board of Directors of such corporation and authorized at a meeting of stockholders (and not by written consent) by the affirmative vote of at least 66 2/3% of the outstanding voting stock of such corporation not owned by the interested stockholder.
A Delaware corporation may “opt out” of these provisions with an express provision in its original certificate of incorporation or an express provision in its certificate of incorporation or bylaws resulting from a stockholders’ amendment approved by at least a majority of the outstanding voting shares. We have expressly elected not to be governed by the “business combination” provisions of Section 203 of the DGCL, until after such time as AIP no longer beneficially owns at least 50% of our common stock. At that time, such election shall be automatically withdrawn and we will thereafter be governed by the “business combination” provisions of Section 203 of the DGCL.
Transfer Agent and Registrar
Upon the completion of the offering, the transfer agent and registrar for our common stock will be Computershare Inc. The transfer agent and registrar’s address is 250 Royall Street, Canton, Massachusetts 02021.
Listing
Our common stock is not currently on any securities exchange. However, subject to notice of official issuance, our shares of common stock have been approved for listing on the NYSE under the symbol “REVG.”
140
Table of Contents
SHARES ELIGIBLE FOR FUTURE SALE
Prior to completion of this offering, there has been no public market for our common stock, and we cannot predict the effect, if any, that market sales of shares of our common stock or the availability of shares of our common stock for sale will have on the market price of our common stock prevailing from time to time. Future sales of our common stock in the public market, or the availability of such shares for sale in the public market, could adversely affect market prices prevailing from time to time. As described below, only a limited number of shares of our common stock will be available for sale shortly after this offering due to contractual and legal restrictions on resale. Nevertheless, sales of our common stock in the public market after such restrictions lapse, or the perception that those sales may occur, could adversely affect the prevailing market price at such time and our ability to raise equity capital in the future.
Following the completion of this offering, based on the number of shares of our common stock outstanding as of October 29, 2016, a total of 63,697,200 shares of our common stock. Of these shares, 12,500,000 (or 14,375,000 if the underwriters exercise in full their option to purchase additional shares) shares of our common stock sold in this offering will be eligible for sale in the public market without restriction under the Securities Act, except that any shares of our common stock purchased in this offering by our “affiliates,” as that term is defined in Rule 144 under the Securities Act, would only be able to be sold in compliance with the conditions of Rule 144 described below.
Our other shares of common stock outstanding after this offering, and shares subject to stock options, will be deemed “restricted securities,” as that term is defined in Rule 144 under the Securities Act. These restricted securities will be eligible for sale in the public market only if they are registered or if they qualify for an exemption from registration under Rule 144 or Rule 701 under the Securities Act, which rules are summarized below.
Lock-up Agreements
We and each of our directors and executive officers and substantially all of our other stockholders and optionholders have agreed, subject to certain exceptions, that, without the prior written consent of the Requisite Number of Representatives (as defined under “Underwriting”) of the underwriters, we and they will not, subject to limited exceptions, directly or indirectly sell or dispose of any shares of common stock or any securities convertible into or exchangeable or exercisable for shares of common stock for a period of 180 days after the date of this prospectus, unless extended pursuant to its terms. The lock-up restrictions and specified exceptions are described in more detail under “Underwriting.”
Rule 144
Rule 144, as currently in effect, generally provides that, once we have been subject to the public company reporting requirements of Section 13 or Section 15(d) of the Exchange Act for at least 90 days, a stockholder who is not deemed to have been one of our affiliates at any time during the preceding 90 days and who has beneficially owned the shares of common stock proposed to be sold for at least six months is entitled to sell such shares in reliance upon Rule 144 without complying with the volume limitation, manner of sale or notice conditions of Rule 144. If such stockholder has beneficially owned the shares of common stock proposed to be sold for at least one year, then such person is entitled to sell such shares in reliance upon Rule 144 without complying with any of the conditions of Rule 144.
Rule 144 also provides that a stockholder who is deemed to have been one of our affiliates at any time during the preceding 90 days and who has beneficially owned the shares of common stock proposed to be sold for at least six months is entitled to sell within any three-month period beginning 90 days after the date of this prospectus a number of shares of common stock that does not exceed the greater of the following:
| • | 1% of the number of shares of common stock then outstanding; or |
| • | The average weekly trading volume of our common stock during the four calendar weeks preceding the filing of a notice on Form 144 with respect to such sale |
141
Table of Contents
Sales of our common stock made in reliance upon Rule 144 by a stockholder who is deemed to have been one of our affiliates at any time during the preceding 90 days are also subject to the current public information, manner of sale and notice conditions of Rule 144.
Rule 701
In general, under Rule 701 under the Securities Act, beginning 90 days after we become subject to the public company reporting requirements of the Exchange Act, a stockholder who acquired shares of common stock from us in connection with a written compensatory benefit plan or agreement in compliance with Rule 701 and who is not deemed to be one of our affiliates at any time during the preceding 90 days may sell such shares in reliance on Rule 144 without complying with the current public information or minimum holding period conditions of Rule 144. Rule 701 also provides that, beginning 90 days after we become subject to the public company reporting requirements of the Exchange Act, a stockholder who acquired shares of common stock from us in connection with a written compensatory benefit plan or agreement in compliance with Rule 701 and who is deemed to be one of our affiliates at any time during the preceding 90 days may sell such shares in reliance on Rule 144 without complying with the holding period condition of Rule 144.
Long-Term Incentive Plan
Following this offering, we intend to file with the SEC a registration statement on Form S-8 under the Securities Act covering the shares of common stock that are subject to outstanding options and other awards issuable pursuant to our 2010 Long-Term Incentive Plan. Shares covered by this registration statement will be available for sale in the open market following its effective date, subject to certain Rule 144 limitations applicable to affiliates and the terms of lock-up agreements applicable to those shares.
Registration Rights
Subject to the lock-up agreements described above, certain holders of our common stock may demand that we register the sale of their shares under the Securities Act or, if we file another registration statement under the Securities Act other than a Form S-8 covering securities issuable under our equity plans or on Form S-4, may elect to include their shares of common stock in such registration. Following such registered sales, the shares will be freely tradable without restriction under the Securities Act, unless held by our affiliates. See “Description of Capital Stock—Registration Rights.”
142
Table of Contents
U.S. FEDERAL TAX CONSIDERATIONS FOR NON-U.S. HOLDERS
The following is a discussion of the material U.S. federal income and estate tax consequences of the ownership and disposition of our common stock by a “non-U.S. holder.” A “non-U.S. holder” is a beneficial owner of a share of our common stock that is, for U.S. federal income tax purposes:
| • | a non-resident alien individual, other than a former citizen or resident of the United States subject to U.S. tax as an expatriate; |
| • | a foreign corporation; or |
| • | a foreign estate or trust. |
If a partnership or other pass-through entity (including an entity or arrangement treated as a partnership or other type of pass-through entity for U.S. federal income tax purposes) owns our common stock, the tax treatment of a partner or beneficial owner of the entity may depend upon the status of the owner, the activities of the entity and certain determinations made at the partner or beneficial owner level. Partners and beneficial owners in partnerships or other pass-through entities that own our common stock should consult their own tax advisors as to the particular U.S. federal income and estate tax consequences applicable to them.
This discussion is based on the Internal Revenue Code of 1986, as amended, or the “Code,” and administrative pronouncements, judicial decisions and final, temporary and proposed Treasury Regulations, changes to any of which subsequent to the date of this prospectus may affect the tax consequences described herein (possibly with retroactive effect). This discussion does not address all aspects of U.S. federal income and estate taxation that may be relevant to non-U.S. holders in light of their particular circumstances and does not address any tax consequences arising under the laws of any state, local or foreign jurisdiction. Prospective holders are urged to consult their tax advisors with respect to the particular tax consequences to them of owning and disposing of our common stock, including the consequences under the laws of any state, local or foreign jurisdiction.
Dividends
Distributions of cash or other property on our common stock will constitute dividends for U.S. federal income tax purposes to the extent paid out of our current and accumulated earnings and profits (as determined under U.S. federal income tax principles), and generally will be subject to U.S. federal withholding tax at a 30% rate, or a reduced rate specified by an applicable income tax treaty. In order to obtain a reduced rate of withholding under an applicable income tax treaty, a non-U.S. holder generally will be required to provide an Internal Revenue Service (“IRS”) Form W-8BEN or IRS Form W-8BEN-E, as applicable, certifying its entitlement to benefits under the treaty. To the extent such distributions exceed our current and accumulated earnings and profits, they will constitute a return of capital, which will first reduce your basis in our common stock, but not below zero, and then will be treated as gain from the sale of our common stock, as described below under “—Gain on Disposition of Our Common Stock.”
No amounts in respect of U.S. federal withholding tax will be withheld from dividends paid to a non-U.S. holder if the non-U.S. holder provides an IRS Form W-8ECI certifying that the dividends are effectively connected with the non-U.S. holder’s conduct of a trade or business within the United States. Instead, the effectively connected dividends will be subject to regular U.S. income tax as if the non-U.S. holder were a U.S. resident, subject to an applicable income tax treaty providing otherwise. A non-U.S. holder that is a corporation receiving effectively connected dividends may also be subject to an additional “branch profits tax” imposed at a rate of 30% (or a lower treaty rate) on its effectively connected earnings and profits (subject to certain adjustments).
143
Table of Contents
Gain on Disposition of Our Common Stock
Subject to the discussions below under “—Information Reporting and Backup Withholding” and “—FATCA,” a non-U.S. holder generally will not be subject to U.S. federal income and withholding tax on gain realized on a sale or other disposition of our common stock unless:
| • | the gain is effectively connected with a trade or business of the non-U.S. holder in the United States, subject to an applicable income tax treaty providing otherwise, in which case the gain will be subject to U.S. federal income tax generally in the same manner as effectively connected dividend income, as described above; |
| • | the non-U.S. holder is an individual present in the United States for 183 days or more in the taxable year of disposition and certain other conditions are met, in which case the gain (net of certain U.S.-source losses) generally will be subject to U.S. federal income tax at a rate of 30% (or a lower treaty rate); or |
| • | we are or have been a United States real property holding corporation (as described below), at any time within the five-year period preceding the disposition or the non-U.S. holder’s holding period, whichever period is shorter, and either (i) our common stock is not regularly traded on an established securities market prior to the beginning of the calendar year in which the sale or disposition occurs or (ii) the non-U.S. holder has owned or is deemed to have owned, at any time within the five-year period preceding the disposition or the non-U.S. holder’s holding period, whichever period is shorter, more than 5% of our common stock. |
We will be a United States real property holding corporation at any time that the fair market value of our “United States real property interests,” as defined in the Code and applicable Treasury regulations, equals or exceeds 50% of the aggregate fair market value of our worldwide real property interests and our other assets used or held for use in a trade or business. We believe that we are not, and do not anticipate becoming in the foreseeable future, a United States real property holding corporation.
Information Reporting Requirements and Backup Withholding
Information returns will be filed with the IRS in connection with payments of dividends. Information returns may also be filed with the IRS in connection with the payment of proceeds from a sale or other disposition of our common stock, unless a non-U.S. holder complies with certification procedures to establish that it is not a United States person. Copies of information returns that are filed with the IRS may also be made available under the provisions of an applicable treaty or agreement to the tax authorities of the country in which the non-U.S. holder resides or is established. A non-U.S. holder may be subject to backup withholding on payments on our common stock or on the proceeds from a sale or other disposition of our common stock unless it complies with certifications procedures to establish that it is not a United States person or otherwise establishes an exemption. These certification procedures will be satisfied by the certification procedures required to claim a reduced rate of withholding under a treaty. The amount of any backup withholding from a payment to a non-U.S. holder will be allowed as a credit against the non-U.S. holder’s U.S. federal income tax liability and may entitle the non-U.S. holder to a refund, provided that the required information is furnished to the IRS in a timely manner.
FATCA Withholding Taxes
Provisions of the Code commonly referred to as “FATCA” require withholding of 30% on payments of dividends on our common stock, as well as of gross proceeds of dispositions occurring after December 31, 2018 of our common stock, to “foreign financial institutions” (which is broadly defined for this purpose and in general includes investment vehicles) and certain other non-U.S. entities unless various U.S. information reporting and due diligence requirements (generally relating to ownership by U.S. persons of interests in or accounts with those entities) have been satisfied, or an exemption applies. An intergovernmental agreement between the United States and an applicable foreign country may modify these requirements. If FATCA withholding is imposed, a
144
Table of Contents
beneficial owner that is not a foreign financial institution generally may obtain a refund of any amounts withheld by filing a U.S. federal income tax return (which may entail significant administrative burden). A non-U.S. holder should consult its tax advisor regarding the effects of FATCA on its investment in our common stock.
Federal Estate Tax
Individual non-U.S. holders (as specifically defined for U.S. federal estate tax purposes) and entities the property of which is potentially includible in such an individual’s gross estate for U.S. federal estate tax purposes (for example, a trust funded by such an individual and with respect to which the individual has retained certain interests or powers) should note that the common stock will be treated as U.S.-situs property subject to U.S. federal estate tax, unless an applicable estate tax treaty provides otherwise.
THE PRECEDING DISCUSSION OF UNITED STATES FEDERAL TAX CONSIDERATIONS IS FOR GENERAL INFORMATION ONLY. THIS DISCUSSION IS NOT TAX ADVICE. EACH PROSPECTIVE INVESTOR SHOULD CONSULT ITS OWN TAX ADVISOR REGARDING THE PARTICULAR U.S. FEDERAL, STATE, LOCAL AND NON-U.S. TAX CONSEQUENCES OF PURCHASING, HOLDING AND DISPOSING OF OUR COMMON STOCK, INCLUDING THE CONSEQUENCES OF ANY PROPOSED CHANGE IN APPLICABLE LAWS.
145
Table of Contents
Goldman, Sachs & Co., Morgan Stanley & Co. LLC and Robert W. Baird & Co. Incorporated are acting as joint book-running managers of the offering and as representatives of the underwriters named below. Subject to the terms and conditions stated in the underwriting agreement dated the date of this prospectus, each underwriter named below has severally agreed to purchase, and we have agreed to sell to that underwriter, the number of shares set forth opposite the underwriter’s name.
| Underwriter |
Number of Shares |
|||
| Goldman, Sachs & Co. |
||||
| Morgan Stanley & Co. LLC |
||||
| Robert W. Baird & Co. Incorporated |
||||
| BMO Capital Markets Corp. |
||||
| Credit Suisse Securities (USA) LLC |
||||
| Deutsche Bank Securities Inc. |
||||
| Jefferies LLC |
||||
| Wells Fargo Securities, LLC |
||||
| Stifel, Nicolaus & Company, Incorporated |
||||
|
|
|
|||
| Total |
12,500,000 | |||
|
|
|
|||
The underwriting agreement provides that the obligations of the underwriters to purchase the shares included in this offering are subject to approval of legal matters by counsel and to other conditions. The underwriters are obligated to purchase all the shares (other than those covered by the option to purchase additional shares described below) if they purchase any of the shares.
Shares sold by the underwriters to the public will initially be offered at the initial public offering price set forth on the cover of this prospectus. Any shares sold by the underwriters to securities dealers may be sold at a discount from the initial public offering price not to exceed $ per share. If all the shares are not sold at the initial offering price, the underwriters may change the offering price and the other selling terms. The representatives have advised us that the underwriters do not intend to make sales to discretionary accounts. The offering of the shares by the underwriters is subject to receipt and acceptance and subject to the underwriters’ right to reject any order in whole or in part.
The selling stockholders have granted to the underwriters an option, exercisable for 30 days from the date of this prospectus, to purchase up to 1,875,000 additional shares at the public offering price less the underwriting discount. To the extent that the option is exercised, each underwriter must purchase a number of additional shares approximately proportionate to that underwriter’s initial purchase commitment. Any shares issued or sold under the option will be issued and sold on the same terms and conditions as the other shares that are the subject of this offering.
We have agreed that, for a period of 180 days after the date of this prospectus, we will not, without the prior written consent of the Requisite Number of Representatives (as defined below) of the underwriters, (i) offer, pledge, sell, contract to sell, sell any option or contract to purchase, purchase any option or contract to sell, grant any option, right or warrant to purchase, lend, or otherwise transfer or dispose of, directly or indirectly, any shares of our common stock or any securities convertible into or exercisable or exchangeable for our common stock or (ii) enter into any swap or other arrangement that transfers to another, in whole or in part, any of the economic consequences of ownership of our common stock, whether any such transaction described in clause (i) or (ii) above is to be settled by delivery of our common stock or such other securities, in cash or otherwise or (ii) file any registration statement with the SEC relating to the offering of any shares of our common stock or any securities convertible into or exercisable or exchangeable for our common stock, provided that we must give each of the representatives notice substantially at the same time of any request to release or waive the restrictions
146
Table of Contents
set forth in this paragraph. “Requisite Number of Representatives” means (i) all of the representatives during the 10-day period starting on, and including, the date such notice is given by us (in the case of us making such a request) or one of the persons referred to in the immediately succeeding paragraph (in the case of any such person making a request) and (ii) two of the three representatives after completion of such 10-day period. These restrictions will not apply to:
| • | the shares to be sold in this offering; |
| • | the issuance by us of shares of our common stock upon the exercise of an option or warrant or the conversion of a security outstanding on the date of this prospectus pursuant to an employee benefit plan in effect on the date of this prospectus and described in this prospectus; |
| • | the grant of options or the issuance of restricted shares of our common stock or any other securities by us to our employees, officers, directors, advisors or consultants pursuant to employee benefit plans in effect on the date of this prospectus and described in this prospectus, provided that each recipient of shares of our common stock or securities convertible into or exercisable or exchangeable for shares of our common stock pursuant to this third bullet shall execute a lock-up agreement substantially in the form provided by the underwriting agreement if he or she has not already delivered such a lock-up agreement; |
| • | the filing by us of one or more registration statements with the SEC on Form S-8 in respect of any shares issued under, or the grant of any award pursuant to, an employee benefit plan described in this prospectus; |
| • | the sale or issuance of or entry into an agreement to sell or issue shares of our common stock or securities convertible into or exercisable or exchangeable for shares of our common stock in connection with any mergers, acquisition of securities, businesses, property or other assets, joint ventures, strategic alliances, or partnerships with experts or other talent to develop or provide products or services, provided that the aggregate number of shares of our common stock or securities convertible into or exercisable or exchangeable for shares of our common stock (on an as-converted or as-exercised basis, as the case may be) that we may sell or issue pursuant to this fifth bullet shall not exceed 7.5% of the total number of shares of our common stock issued and outstanding immediately following the completion of this offering, and provided further that each recipient of shares of our common stock or securities convertible into or exercisable or exchangeable for shares of our common stock pursuant to this fifth bullet shall execute a lock-up agreement substantially in the form provided by the underwriting agreement; and |
| • | the establishment of a trading plan pursuant to Rule 10b5-1 under the Exchange Act for the transfer of shares of our common stock, provided that (i) such plan does not provide for the transfer of our common stock during the 180-day lock-up period described above and (ii) to the extent a public announcement or filing under the Exchange Act, if any, is required of or voluntarily made by us regarding the establishment of such plan, such announcement or filing shall include a statement to the effect that no transfer of our common stock may be made under such plan during the 180-day lock-up period described above. |
The selling stockholders, our officers and directors and substantially all of our other stockholders have agreed that, for a period of 180 days after the date of this prospectus, they will not, without the prior written consent of the Requisite Number of Representatives of the underwriters, (i) offer, pledge, sell, contract to sell, sell any option or contract to purchase, purchase any option or contract to sell, grant any option, right or warrant to purchase, lend, or otherwise transfer or dispose of, directly or indirectly, any shares of our common stock beneficially owned (as such term is used in Rule 13d-3 of the Exchange Act), by such person or any other securities so owned convertible into or exercisable or exchangeable for our common stock or (ii) enter into any swap or other arrangement that transfers to another, in whole or in part, any of the economic consequences of ownership of our common stock, whether any such transaction described in clause (i) or (ii) above is to be settled by delivery of our common stock or such other securities, in cash or otherwise; provided that such person must
147
Table of Contents
give each of the representatives notice substantially at the same time of any request to release or waive the restrictions set forth in this paragraph. Notwithstanding the foregoing, the restrictions described in the lock-up agreement will not apply in certain circumstances, including:
| • | sales or transfers relating to shares of our common stock in this offering; |
| • | transactions relating to shares of our common stock or other securities acquired in open market transactions after the completion of this offering, provided that no filing under Section 16(a) of the Exchange Act shall be required or shall be voluntarily made in connection with subsequent sales of our common stock or other securities acquired in such open market transactions; |
| • | transfers of shares of our common stock or any security convertible into or exercisable or exchangeable for our common stock: |
| • | as a bona fide gift or gifts, including as a result of the operation of law or estate or intestate succession, or pursuant to a will or other testamentary document; |
| • | if such person is a natural person, to a member of the immediate family of such person; |
| • | if such person is a natural person, to any trust or other like entity for the direct or indirect benefit of such person or the immediate family of such person; |
| • | if such person is a natural person, to a corporation, partnership, limited liability company or other entity of which such person and the immediate family of such person are the direct or indirect legal and beneficial owners of all the outstanding equity securities or similar interests of such corporation, partnership, limited liability company or other entity; |
| • | if such person is a corporation, partnership, limited liability company or other entity, to any trust or other like entity for the direct or indirect benefit of such person or any affiliate, wholly-owned subsidiary, limited partner, member or stockholder of such person; |
| • | if such person is a corporation, partnership, limited liability company or other entity, to any investment fund or other entity controlled or managed by such person; |
| • | as a distribution to any affiliate, wholly-owned subsidiary, limited partner, member or stockholder of such person; or |
| • | to a nominee or custodian of a person or entity to whom a disposition or transfer would be permissible under the seven sub-bullets above; |
provided that in the case of any transfer or distribution pursuant to the sub-bullets above of this third bullet, each donee, distributee or transferee agrees to be bound in writing by the terms of the lock-up agreement prior to such transfer and no filing by any party (donor, donee, transferor or transferee) under Section 16(a) of the Exchange Act (other than a filing on Form 5 after the expiration of the 180-day lock-up period) shall be required or shall be voluntarily made in connection with such transfer;
| • | the exercise of stock options or other similar awards granted pursuant to our equity incentive plans, provided that the foregoing restrictions shall apply to any of such person’s common stock issued upon such exercise; |
| • | the transfer of shares of our common stock or any securities convertible into or exercisable or exchangeable for shares of our common stock from such person to us (or the purchase and cancellation of same by us) upon a vesting event of our securities or upon the exercise of options to purchase shares of common stock by such person, in each case on a “cashless” or “net exercise” basis, or to cover income or withholding and other tax obligations of such person in connection with such vesting or exercise, whether by means of a “net settlement” or otherwise, provided that the no filling be made under Section 16(a) of the Exchange Act (other than a filing on Form 5 after the expiration of the 180-day lock-up period) shall be required or shall be voluntarily made in connection with such transfer; |
148
Table of Contents
| • | the establishment of a trading plan pursuant to Rule 10b5-1 under the Exchange Act for the transfer of our common stock, provided that (i) such plan does not provide for the transfer of our common stock during the 180-day lock-up period and (ii) to the extent a public announcement or filing under the Exchange Act, if any, is required of or voluntarily made by or on behalf of such person or us regarding the establishment or modification of such plan, such announcement or filing shall include a statement to the effect that no transfer of our common stock may be made under such plan during the 180-day lock-up period; |
| • | if such person is a corporation, partnership, limited liability company or other entity, the transfer of shares of our common stock or any security convertible into or exercisable or exchangeable for shares of our common stock in connection with the sale or other bona fide transfer in a single transaction of all or substantially all of such person’s capital stock, partnership interests, membership interests or other similar equity interests, as the case may be, or all or substantially all of such person’s assets, in any such case not undertaken for the purpose of avoiding the restrictions described herein, provided, that, each transferee shall execute a lock-up agreement substantially in the form provided by the underwriting agreement; |
| • | the transfer of shares of our common stock or any securities convertible into or exercisable or exchangeable for shares of our common stock that occurs by any order or settlement resulting from any legal proceeding pursuant to a qualified domestic order or in connection with a divorce settlement; provided that in the case of any transfer or distribution pursuant this clause, any filing under Section 16(a) of the Exchange Act reporting a reduction in beneficial ownership of shares of our common stock shall state that such transfer is pursuant to an order of a court or a settlement resulting from a legal proceeding unless such a statement would be prohibited by any applicable law or order of a court; or |
| • | the transfer of shares of our common stock or any security convertible into or exercisable or exchangeable for shares of our common stock pursuant to a bona fide third-party tender offer, merger, amalgamation, consolidation or other similar transaction made to all holders of the shares of our common stock involving a change of control of us; provided that in the event that the tender offer, merger, amalgamation, consolidation or other such transaction is not completed, the shares of common stock owned by such person shall remain subject to the restrictions contained in the lock-up agreement; and provided further that in the event that the tender offer, merger, consolidation or other such transaction is not completed, the shares of our common stock owned by such person shall remain subject to the restrictions contained in the lock-up agreement (for this purpose, “change of control” shall mean the transfer (whether by tender offer, merger, consolidation or other similar transaction), in one transaction or a series of related transactions, to a person or group of affiliated persons, of shares of capital stock if, after such transfer, such person or group of affiliated persons would hold more than 50% of our outstanding voting securities (or the surviving entity)). |
In addition, each such person has agreed that, without the prior written consent of the Requisite Number of Representatives of the underwriters, she or it will not, during the 180-day lock-up period, make any demand for or exercise any right with respect to, the registration of any shares of our common stock or any security convertible into or exercisable or exchangeable for our common stock, unless any such demand or exercise of such right shall not result in any public announcement regarding the demand or exercise of such registration right, or the filing of any registration statement in connection therewith, prior to the expiration of the 180-day lock-up period.
In the event that the Requisite Number of Representatives consent to a release relating to a prohibition on transfer under a lock-up agreement entered into by funds associated with AIP or funds associated with J.P. Morgan Securities LLC (each a “Major Holder”), the same percentage of the total number of outstanding shares of common stock held by the other Major Holder (the “Pro-Rata Release”) as the percentage of the total number of outstanding shares of common stock held by such Major Holder that are the subject of such release shall be immediately and fully released on the same terms from any remaining prohibition on transfer set forth herein.
149
Table of Contents
The provisions of this paragraph will not apply: (1) if the release or waiver is effected solely to permit a transfer not involving a disposition for value, (2) the transferee has agreed in writing to be bound by the same terms described in this lock-up letter to the extent and for the duration that such terms remain in effect at the time of the transfer, (3) releases granted from such lockup restrictions to any individual party by the Requisite Number of Representatives in an amount less than or equal to 5% of our total outstanding stock or (4) in the case of any primary or secondary public offering or sale that is underwritten of our common stock during the 180-day lock-up period, provided, however, that the Major Holder is offered the opportunity to participate on a pro rata basis with and otherwise on the same terms as the other Major Holder in such underwritten sale. Prior to the expiration of the 180-day lock-up period, in the event that, as a result of this paragraph, any Major Holder becomes entitled to offer, pledge, sell, contract to sell, or otherwise dispose of any common stock (or any securities convertible into common stock), the representatives shall use commercially reasonable efforts to provide notification of such to the relevant Major Holder within three business days thereof. The failure to give any such notice to us or such Major Holder shall not give rise to any claim or liability against us or the underwriters, including the representatives. Notwithstanding any other provisions described herein, if the Requisite Number of Representatives in their sole judgment determine that a Major Holder should be granted an early release from a lock-up agreement due to circumstances of an emergency or hardship, then the other Major Holder shall not have any right to be granted an early release pursuant to the terms of this paragraph.
Prior to this offering, there has been no public market for our shares. Consequently, the initial public offering price for the shares was determined by negotiations between us and the representatives. Among the factors considered in determining the initial public offering price were our results of operations, our current financial condition, our future prospects, our markets, the economic conditions in and future prospects for the industry in which we compete, our management, and currently prevailing general conditions in the equity securities markets, including current market valuations of publicly traded companies considered comparable to our Company. We cannot assure you, however, that the price at which the shares will sell in the public market after this offering will not be lower than the initial public offering price or that an active trading market in our shares will develop and continue after this offering.
Our shares of common stock have been approved for listing on the NYSE under the symbol “REVG,” subject to notice of official issuance.
The following table shows the underwriting discount that we are to pay to the underwriters in connection with this offering. These amounts are shown assuming both no exercise and full exercise of the underwriters’ option to purchase additional shares of common stock.
| Paid by the Company | ||||||||
| No Exercise | Full Exercise | |||||||
| Per share |
$ | $ | ||||||
| Total |
$ | $ | ||||||
We estimate that our portion of the total expenses of this offering, other than the underwriting discounts referred to above, will be $2.1 million. We have also agreed to reimburse the underwriters for certain expenses, including up to an aggregate of $25,000 in connection with the clearance of this offering with the Financial Industry Regulatory Authority, as set forth in the underwriting agreement. The underwriters have agreed to reimburse us for certain expenses incurred by us in connection with this offering upon closing of this offering.
Until the distribution of the shares is completed, SEC rules may limit underwriters and selling group members from bidding for and purchasing our common stock. However, the representatives may engage in transactions that stabilize the price of the common stock, such as bids or purchases to peg, fix or maintain that price.
In connection with the offering, the underwriters may purchase and sell our common stock in the open market. These transactions may include short sales, purchases on the open market to cover positions created by
150
Table of Contents
short sales and stabilizing transactions. Short sales involve the sale by the underwriters of a greater number of shares than they are required to purchase in the offering. “Covered” short sales are sales made in an amount not greater than the underwriters’ option to purchase additional shares described above. The underwriters may close out any covered short position by either exercising their option to purchase additional shares or purchasing shares in the open market. In determining the source of shares to close out the covered short position, the underwriters will consider, among other things, the price of shares available for purchase in the open market as compared to the price at which they may purchase shares through the option granted to them. “Naked” short sales are sales in excess of such option. The underwriters must close out any naked short position by purchasing shares in the open market. A naked short position is more likely to be created if the underwriters are concerned that there may be downward pressure on the price of our common stock in the open market after pricing that could adversely affect investors who purchase in the offering. Stabilizing transactions consist of various bids for or purchases of shares of common stock made by the underwriters in the open market prior to the completion of the offering.
The underwriters may also impose a penalty bid. This occurs when a particular underwriter repays to the underwriters a portion of the underwriting discount received by it because the representatives have repurchased shares sold by or for the account of such underwriter in stabilizing or short covering transactions.
Similar to other purchase transactions, the underwriters’ purchases to cover the syndicate short sales may have the effect of raising or maintaining the market price of our common stock or preventing or retarding a decline in the market price of our common stock. As a result, the price of our common stock may be higher than the price that might otherwise exist in the open market. The underwriters may conduct these transactions on the NYSE, in the over-the-counter market or otherwise.
Neither we nor any of the underwriters make any representation or prediction as to the direction or magnitude of any effect that the transactions described above may have on the price of our common stock. In addition, neither we nor any of the underwriters make any representation that the representatives will engage in these transactions or that these transactions, once commenced, will not be discontinued without notice.
Electronic Distribution
In connection with the offering, certain of the underwriters or securities dealers may distribute prospectuses by electronic means, such as e-mail.
Conflicts of Interest
The underwriters are full service financial institutions engaged in various activities, which may include securities trading, commercial and investment banking, financial advisory, investment management, principal investment, hedging, financing and brokerage activities. The underwriters and their respective affiliates have in the past performed commercial banking, investment banking and advisory services for us from time to time for which they have received customary fees and reimbursement of expenses and may, from time to time, engage in transactions with and perform services for us in the ordinary course of their business for which they may receive customary fees and reimbursement of expenses. In the ordinary course of their various business activities, the underwriters and their respective affiliates may make or hold a broad array of investments and actively trade debt and equity securities (or related derivative securities) and financial instruments (which may include bank loans and/or credit default swaps) for their own account and for the accounts of their customers and may at any time hold long and short positions in such securities and instruments. Such investments and securities activities may involve securities and/or instruments of ours or our affiliates. The underwriters and their affiliates may also make investment recommendations and/or publish or express independent research views in respect of such securities or financial instruments and may hold, or recommend to clients that they acquire, long and/or short positions in such securities and instruments.
Affiliates of Deutsche Bank Securities Inc. act as administrative agent, collateral agent, a joint book-running manage, and a joint lead arranger under our ABL facility and affiliates of Deutsche Bank Securities Inc. and
151
Table of Contents
BMO Capital Markets Corp. are lenders under our ABL Facility. Because a portion of the net proceeds from this offering will be used to repay a portion of loans outstanding under our ABL Facility as described under “Use of Proceeds,” affiliates of Deutsche Bank Securities Inc. and BMO Capital Markets Corp. will receive their respective pro rata portions of such net proceeds from this offering as lenders under our ABL Facility.
We have agreed to indemnify the underwriters against certain liabilities, including liabilities under the Securities Act, or to contribute to payments the underwriters may be required to make because of any of those liabilities.
Canada
The shares of our common stock may be sold in Canada only to purchasers purchasing, or deemed to be purchasing, as principal that are accredited investors, as defined in National Instrument 45-106 Prospectus Exemptions or subsection 73.3(1) of the Securities Act (Ontario), and are permitted clients, as defined in National Instrument 31-103 Registration Requirements, Exemptions and Ongoing Registrant Obligations. Any resale of the shares of our common stock must be made in accordance with an exemption from, or in a transaction not subject to, the prospectus requirements of applicable securities laws.
Securities legislation in certain provinces or territories of Canada may provide a purchaser with remedies for rescission or damages if this prospectus (including any amendment thereto) contains a misrepresentation, provided that the remedies for rescission or damages are exercised by the purchaser within the time limit prescribed by the securities legislation of the purchaser’s province or territory. The purchaser should refer to any applicable provisions of the securities legislation of the purchaser’s province or territory for particulars of these rights or consult with a legal advisor.
Pursuant to section 3A.3 of National Instrument 33-105 Underwriting Conflicts (NI 33-105), the underwriters are not required to comply with the disclosure requirements of NI 33-105 regarding underwriter conflicts of interest in connection with this offering.
European Economic Area
In relation to each Member State of the European Economic Area which has implemented the Prospectus Directive (each, a Relevant Member State), each underwriter has represented and agreed that with effect from and including the date on which the Prospectus Directive is implemented in that Relevant Member State (the Relevant Implementation Date) it has not made and will not make an offer of shares to the public in that Relevant Member State prior to the publication of a prospectus in relation to the shares which has been approved by the competent authority in that Relevant Member State or, where appropriate, approved in another Relevant Member State and notified to the competent authority in that Relevant Member State, all in accordance with the Prospectus Directive, except that it may, with effect from and including the Relevant Implementation Date, make an offer of shares to the public in that Relevant Member State at any time:
(a) to legal entities which are authorized or regulated to operate in the financial markets or, if not so authorized or regulated, whose corporate purpose is solely to invest in securities;
(b) to any legal entity which has two or more of (1) an average of at least 250 employees during the last financial year; (2) a total balance sheet of more than €43,000,000 and (3) an annual net turnover of more than €50,000,000, as shown in its last annual or consolidated accounts;
(c) to fewer than 100 natural or legal persons (other than qualified investors as defined in the Prospectus Directive) subject to obtaining the prior consent of the representatives for any such offer; or
(d) in any other circumstances which do not require the publication by the Company of a prospectus pursuant to Article 3 of the Prospectus Directive.
152
Table of Contents
For the purposes of this provision, the expression an “offer of shares to the public” in relation to any shares in any Relevant Member State means the communication in any form and by any means of sufficient information on the terms of the offer and the shares to be offered so as to enable an investor to decide to purchase or subscribe the shares, as the same may be varied in that Relevant Member State by any measure implementing the Prospectus Directive in that Relevant Member State and the expression Prospectus Directive means Directive 2003/71/EC and includes any relevant implementing measure in each Relevant Member State.
United Kingdom
Each underwriter has represented and agreed that:
(a) it has only communicated or caused to be communicated and will only communicate or cause to be communicated an invitation or inducement to engage in investment activity (within the meaning of Section 21 of the FSMA) received by it in connection with the issue or sale of the shares in circumstances in which Section 21(1) of the FSMA does not apply to the Company; and
(b) it has complied and will comply with all applicable provisions of the FSMA with respect to anything done by it in relation to the shares in, from or otherwise involving the United Kingdom.
Hong Kong
The shares may not be offered or sold by means of any document other than (i) in circumstances which do not constitute an offer to the public within the meaning of the Companies Ordinance (Cap.32, Laws of Hong Kong), or (ii) to “professional investors” within the meaning of the Securities and Futures Ordinance (Cap.571, Laws of Hong Kong) and any rules made thereunder, or (iii) in other circumstances which do not result in the document being a “prospectus” within the meaning of the Companies Ordinance (Cap.32, Laws of Hong Kong), and no advertisement, invitation or document relating to the shares may be issued or may be in the possession of any person for the purpose of issue (in each case whether in Hong Kong or elsewhere), which is directed at, or the contents of which are likely to be accessed or read by, the public in Hong Kong (except if permitted to do so under the laws of Hong Kong) other than with respect to shares which are or are intended to be disposed of only to persons outside Hong Kong or only to “professional investors” within the meaning of the Securities and Futures Ordinance (Cap. 571, Laws of Hong Kong) and any rules made thereunder.
Singapore
This prospectus has not been registered as a prospectus with the Monetary Authority of Singapore. Accordingly, this prospectus and any other document or material in connection with the offer or sale, or invitation for subscription or purchase, of the shares may not be circulated or distributed, nor may the shares be offered or sold, or be made the subject of an invitation for subscription or purchase, whether directly or indirectly, to persons in Singapore other than (i) to an institutional investor under Section 274 of the Securities and Futures Act, Chapter 289 of Singapore (the “SFA”), (ii) to a relevant person, or any person pursuant to Section 275(1A), and in accordance with the conditions, specified in Section 275 of the SFA or (iii) otherwise pursuant to, and in accordance with the conditions of, any other applicable provision of the SFA.
Where the shares are subscribed or purchased under Section 275 by a relevant person which is: (a) a corporation (which is not an accredited investor) the sole business of which is to hold investments and the entire share capital of which is owned by one or more individuals, each of whom is an accredited investor; or (b) a trust (where the trustee is not an accredited investor) whose sole purpose is to hold investments and each beneficiary is an accredited investor, shares, debentures and units of shares and debentures of that corporation or the beneficiaries’ rights and interest in that trust shall not be transferable for 6 months after that corporation or that trust has acquired the shares under Section 275 except: (1) to an institutional investor under Section 274 of the SFA or to a relevant person, or any person pursuant to Section 275(1A), and in accordance with the conditions, specified in Section 275 of the SFA; (2) where no consideration is given for the transfer; or (3) by operation of law.
153
Table of Contents
Japan
The securities have not been and will not be registered under the Financial Instruments and Exchange Law of Japan (the Financial Instruments and Exchange Law) and each underwriter has agreed that it will not offer or sell any securities, directly or indirectly, in Japan or to, or for the benefit of, any resident of Japan (which term as used herein means any person resident in Japan, including any corporation or other entity organized under the laws of Japan), or to others for re-offering or resale, directly or indirectly, in Japan or to a resident of Japan, except pursuant to an exemption from the registration requirements of, and otherwise in compliance with, the Financial Instruments and Exchange Law and any other applicable laws, regulations and ministerial guidelines of Japan.
154
Table of Contents
The validity of the issuance of our common stock offered in this prospectus will be passed upon for us by Davis Polk & Wardwell LLP. The underwriters are being represented by Latham & Watkins LLP.
The consolidated financial statements as of October 29, 2016 and October 31, 2015 and for each of the fiscal years ended October 29, 2016, October 31, 2015 and October 31, 2014, respectively, included in this prospectus have been so included in reliance on the reports of RSM US LLP, an independent registered public accounting firm, given on the authority of said firm as experts in auditing and accounting.
WHERE YOU CAN FIND MORE INFORMATION
We have filed with the SEC a registration statement on Form S-1 under the Securities Act with respect to the shares of common stock offered hereby. This prospectus, which constitutes a part of the registration statement, does not contain all of the information set forth in the registration statement or the exhibits and schedules filed therewith. For further information with respect to us and the common stock offered hereby, please refer to the registration statement and the exhibits and schedules filed therewith. Statements contained in this prospectus regarding the contents of any contract or any other document that is filed as an exhibit to the registration statement are not necessarily complete, and each such statement is qualified in all respects by reference to the full text of such contract or other document filed as an exhibit to the registration statement. A copy of the registration statement and the exhibits and schedules filed therewith may be inspected without charge at the public reference room maintained by the SEC, located at 100 F Street N.E., Washington, D.C. 20549, and copies of all or any part of the registration statement may be obtained from such offices upon the payment of the fees prescribed by the SEC. Please call the SEC at 1-800-SEC-0330 for further information about the public reference room. The SEC also maintains a website that contains reports, proxy and information statements and other information regarding registrants that file electronically with the SEC. The address is www.sec.gov.
Upon completion of this offering, we will become subject to the information and periodic reporting requirements of the Securities Exchange Act of 1934 and, in accordance therewith, we will file periodic reports, proxy statements and other information with the SEC. Such periodic reports, proxy statements and other information will be available for inspection and copying at the public reference room and website of the SEC referred to above.
155
Table of Contents
INDEX TO CONSOLIDATED FINANCIAL STATEMENTS
| PAGE | ||||
| F-2 | ||||
| Consolidated Financial Statements: |
||||
| Consolidated Balance Sheets as of October 29, 2016 and October 31, 2015 |
F-3 | |||
| F-4 | ||||
| F-5 | ||||
| F-6 | ||||
| F-7 | ||||
| F-8 | ||||
| F-39 | ||||
F-1
Table of Contents
Report of Independent Registered Public Accounting Firm
To the Board of Directors and Shareholders
REV Group, Inc. and Subsidiaries
Milwaukee, Wisconsin
We have audited the accompanying consolidated balance sheets of REV Group, Inc. and Subsidiaries as of October 29, 2016 and October 31, 2015, and the related consolidated statements of operations, comprehensive income, cash flows, and shareholders’ equity and contingently redeemable common stock for each of the three years ended October 29, 2016, October 31, 2015, and October 31, 2014. Our audits also included the financial statement schedule of REV Group, Inc. and Subsidiaries listed in the Index to Consolidated Financial Statements. These financial statements and financial statement schedule are the responsibility of the Company’s management. Our responsibility is to express an opinion on these financial statements and schedule based on our audits.
We conducted our audits in accordance with the standards of the Public Company Accounting Oversight Board (United States). Those standards require that we plan and perform the audit to obtain reasonable assurance about whether the financial statements are free of material misstatement. The Company is not required to have, nor were we engaged to perform, an audit of its internal control over financial reporting. Our audits included consideration of internal control over financial reporting as a basis for designing audit procedures that are appropriate in the circumstances, but not for the purpose of expressing an opinion on the effectiveness of the Company’s internal control over financial reporting. Accordingly, we express no such opinion. An audit also includes examining, on a test basis, evidence supporting the amounts and disclosures in the financial statements, assessing the accounting principles used and significant estimates made by management, as well as evaluating the overall financial statement presentation. We believe that our audits provide a reasonable basis for our opinion.
In our opinion, the consolidated financial statements referred to above present fairly, in all material respects, the financial position of REV Group, Inc. and Subsidiaries as of October 29, 2016 and October 31, 2015, and the results of their operations and their cash flows for each of the three years ended October 29, 2016, October 31, 2015, and October 31, 2014, in conformity with U.S. generally accepted accounting principles. Also, in our opinion, the related financial statement schedule, when considered in relation to the basic consolidated financial statements taken as a whole, presents fairly, in all material respects, the information set forth therein.
/s/ RSM US LLP
New York, New York
December 23, 2016
F-2
Table of Contents
REV Group, Inc. and Subsidiaries
(Dollars in thousands, except per share amounts)
| October 29, 2016 |
October 31, 2015 |
|||||||
| ASSETS |
||||||||
| Current assets: |
||||||||
| Cash and cash equivalents |
$ | 10,821 | $ | 4,968 | ||||
| Accounts receivable, net |
181,239 | 113,059 | ||||||
| Inventories, net |
325,633 | 246,962 | ||||||
| Deferred income taxes |
— | 23,599 | ||||||
| Other current assets |
12,037 | 10,152 | ||||||
|
|
|
|
|
|||||
| Total current assets |
529,730 | 398,740 | ||||||
| Property, plant and equipment, net |
146,422 | 89,145 | ||||||
| Goodwill |
84,507 | 82,825 | ||||||
| Intangibles assets, net |
124,040 | 118,903 | ||||||
| Other long-term assets |
4,320 | 6,208 | ||||||
|
|
|
|
|
|||||
| Total assets |
$ | 889,019 | $ | 695,821 | ||||
|
|
|
|
|
|||||
| LIABILITIES AND SHAREHOLDERS’ EQUITY |
||||||||
| Current liabilities: |
||||||||
| Current maturities of notes payable, bank and other long-term debt |
$ | — | $ | 236 | ||||
| Accounts payable |
129,481 | 69,950 | ||||||
| Customer advances |
87,627 | 36,489 | ||||||
| Accrued warranty |
22,693 | 18,153 | ||||||
| Other current liabilities |
91,803 | 55,073 | ||||||
|
|
|
|
|
|||||
| Total current liabilities |
331,604 | 179,901 | ||||||
| Notes payable, bank and other long-term debt, less current maturities |
256,040 | 212,394 | ||||||
| Deferred income taxes |
17,449 | 45,604 | ||||||
| Other long-term liabilities |
23,710 | 18,008 | ||||||
|
|
|
|
|
|||||
| Total liabilities |
628,803 | 455,907 | ||||||
| Contingently redeemable common stock (20,097 and 25,803 shares outstanding, respectively) |
22,293 | 15,350 | ||||||
| Commitments and contingencies |
||||||||
| Shareholders’ Equity: |
||||||||
| Preferred stock ($.001 par value, 5,000 shares authorized, none issued or outstanding) |
— | — | ||||||
| Common stock—Class A ($.001 par value, 575,000 shares authorized; 86,314 and 106,965 shares issued (excluding contingently redeemable common stock), 86,314 and 97,337 shares outstanding, respectively) |
— | — | ||||||
| Common stock—Class B ($.001 par value, 540,000 shares authorized; 533,554 shares issued and outstanding) |
— | — | ||||||
| Additional paid-in capital |
206,229 | 204,624 | ||||||
| Retained earnings |
31,655 | 24,607 | ||||||
| Accumulated other comprehensive income (loss) |
39 | (26 | ) | |||||
| Common stock in treasury, at cost (0 and 9,628 shares, respectively) |
— | (4,641 | ) | |||||
|
|
|
|
|
|||||
| Total shareholders’ equity |
237,923 | 224,564 | ||||||
|
|
|
|
|
|||||
| Total liabilities and shareholders’ equity |
$ | 889,019 | $ | 695,821 | ||||
|
|
|
|
|
|||||
See Notes to Consolidated Financial Statements.
F-3
Table of Contents
REV Group, Inc. and Subsidiaries
Consolidated Statements of Operations
(Dollars in thousands, except per share amounts)
| Fiscal Year Ended | ||||||||||||
| October 29, 2016 |
October 31, 2015 |
October 31, 2014 |
||||||||||
| Net sales |
$ | 1,925,999 | $ | 1,735,081 | $ | 1,721,116 | ||||||
| Cost of sales |
1,696,068 | 1,553,127 | 1,557,877 | |||||||||
|
|
|
|
|
|
|
|||||||
| Gross profit |
229,931 | 181,954 | 163,239 | |||||||||
| Operating expenses: |
||||||||||||
| Selling, general and administrative |
139,771 | 102,309 | 111,820 | |||||||||
| Research and development costs |
4,815 | 5,106 | 8,275 | |||||||||
| Restructuring |
3,521 | 3,869 | 3,376 | |||||||||
| Amortization of intangible assets |
9,423 | 8,586 | 8,790 | |||||||||
|
|
|
|
|
|
|
|||||||
| Total operating expenses |
157,530 | 119,870 | 132,261 | |||||||||
|
|
|
|
|
|
|
|||||||
| Operating income |
72,401 | 62,084 | 30,978 | |||||||||
| Interest expense |
29,158 | 27,272 | 26,195 | |||||||||
|
|
|
|
|
|
|
|||||||
| Income before provision for income taxes |
43,243 | 34,812 | 4,783 | |||||||||
| Provision for income taxes |
13,050 | 11,935 | 3,295 | |||||||||
|
|
|
|
|
|
|
|||||||
| Net income |
$ | 30,193 | $ | 22,877 | $ | 1,488 | ||||||
|
|
|
|
|
|
|
|||||||
| Earnings per common share: |
||||||||||||
| Basic |
$ | 46.82 | $ | 34.69 | $ | 2.26 | ||||||
| Diluted |
$ | 46.65 | $ | 34.65 | $ | 2.25 | ||||||
| Pro Forma earnings per common share (unaudited)–See Note 23: |
||||||||||||
| Basic |
$ | 0.59 | $ | 0.43 | $ | 0.03 | ||||||
| Diluted |
$ | 0.58 | $ | 0.43 | $ | 0.03 | ||||||
See Notes to Consolidated Financial Statements.
F-4
Table of Contents
REV Group, Inc. and Subsidiaries
Consolidated Statements of Comprehensive Income
(Dollars in thousands)
| Fiscal Year Ended | ||||||||||||
| October 29, 2016 |
October 31, 2015 |
October 31, 2014 |
||||||||||
| Net income |
$ | 30,193 | $ | 22,877 | $ | 1,488 | ||||||
| Other comprehensive income (loss), net of tax |
65 | (120 | ) | 80 | ||||||||
|
|
|
|
|
|
|
|||||||
| Comprehensive income |
$ | 30,258 | $ | 22,757 | $ | 1,568 | ||||||
|
|
|
|
|
|
|
|||||||
See Notes to Consolidated Financial Statements.
F-5
Table of Contents
REV Group, Inc. and Subsidiaries
Consolidated Statements of Cash Flows
(Dollars in thousands)
| Fiscal Year Ended | ||||||||||||
| October 29, 2016 |
October 31, 2015 |
October 31, 2014 |
||||||||||
| Cash flows from operating activities: |
||||||||||||
| Net income |
$ | 30,193 | $ | 22,877 | $ | 1,488 | ||||||
| Adjustments to reconcile net income to net cash provided by operating activities: |
||||||||||||
| Depreciation and amortization |
24,593 | 19,084 | 18,901 | |||||||||
| Amortization of debt issuance costs |
2,713 | 2,330 | 2,540 | |||||||||
| Amortization of senior note discount |
249 | 217 | 235 | |||||||||
| Stock-based compensation expense |
19,692 | 3,237 | 859 | |||||||||
| Deferred income taxes |
(3,661 | ) | (5,325 | ) | (325 | ) | ||||||
| (Gain) loss on disposal of property, plant and equipment |
(342 | ) | 28 | (1,819 | ) | |||||||
| Changes in operating assets and liabilities: |
||||||||||||
| Accounts receivable, net |
(52,428 | ) | 7,518 | (38,190 | ) | |||||||
| Inventories, net |
(8,054 | ) | (2,795 | ) | 18,754 | |||||||
| Other current assets |
(691 | ) | (3,553 | ) | 4,742 | |||||||
| Accounts payable |
44,805 | (15,831 | ) | 284 | ||||||||
| Accrued warranty |
(4,001 | ) | (5,863 | ) | (691 | ) | ||||||
| Customer advances |
2,855 | 5,218 | (366 | ) | ||||||||
| Other liabilities |
18,667 | (1,395 | ) | (1,167 | ) | |||||||
| Long-term assets |
980 | (108 | ) | 684 | ||||||||
|
|
|
|
|
|
|
|||||||
| Net cash provided by operating activities |
75,570 | 25,639 | 5,929 | |||||||||
|
|
|
|
|
|
|
|||||||
| Cash flows from investing activities: |
||||||||||||
| Purchase of property, plant and equipment |
(48,542 | ) | (15,430 | ) | (12,067 | ) | ||||||
| Proceeds from sale of property, plant and equipment |
2,274 | — | 4,290 | |||||||||
| Acquisition of businesses, net of cash acquired |
(31,727 | ) | — | (5,043 | ) | |||||||
| Acquisition of Ancira assets |
(6,435 | ) | — | — | ||||||||
| Other |
— | (187 | ) | — | ||||||||
|
|
|
|
|
|
|
|||||||
| Net cash used in investing activities |
(84,430 | ) | (15,617 | ) | (12,820 | ) | ||||||
|
|
|
|
|
|
|
|||||||
| Cash flows from financing activities: |
||||||||||||
| Net proceeds (payments) from borrowings under revolving credit facility |
61,777 | (13,705 | ) | 1,929 | ||||||||
| Repayment of debt assumed from acquisition |
(3,698 | ) | — | — | ||||||||
| Payment of debt issuance costs |
(1,085 | ) | — | — | ||||||||
| Dividends paid on subsidiary preferred shares upon cancellation |
— | (186 | ) | — | ||||||||
| Repayment of long-term debt and capital leases |
(20,536 | ) | (269 | ) | (353 | ) | ||||||
| Net proceeds from the issuance of common stock |
— | 2,000 | 2,855 | |||||||||
| Redemption of common stock and stock options |
(21,745 | ) | (5,461 | ) | (3,125 | ) | ||||||
| Payments received on stock subscription receivable |
— | 48 | 79 | |||||||||
|
|
|
|
|
|
|
|||||||
| Net cash (used in) provided by financing activities |
14,713 | (17,573 | ) | 1,385 | ||||||||
|
|
|
|
|
|
|
|||||||
| Net increase (decrease) in cash and cash equivalents |
5,853 | (7,551 | ) | (5,506 | ) | |||||||
| Cash and cash equivalents, beginning of year |
4,968 | 12,519 | 18,025 | |||||||||
|
|
|
|
|
|
|
|||||||
| Cash and cash equivalents, end of year |
$ | 10,821 | $ | 4,968 | $ | 12,519 | ||||||
|
|
|
|
|
|
|
|||||||
| Supplemental disclosures of cash flow information: |
||||||||||||
| Cash paid for: |
||||||||||||
| Interest |
$ | 25,789 | $ | 24,638 | $ | 15,636 | ||||||
|
|
|
|
|
|
|
|||||||
| Income taxes, net of refunds |
$ | 5,845 | $ | 18,390 | $ | (906 | ) | |||||
|
|
|
|
|
|
|
|||||||
See Notes to Consolidated Financial Statements.
F-6
Table of Contents
REV Group, Inc. and Subsidiaries
Consolidated Statement of Shareholders’ Equity and Contingently Redeemable Common Stock
(Dollars in thousands)
Fiscal Years Ended October 29, 2016, October 31, 2015 and 2014
| Common Stock - Class A | Common Stock - Class B | Contingently Redeemable Common Stock |
||||||||||||||||||||||||||||||||||||||||||||||||||
| Amount | Number of Shares Outstanding |
Amount | Number of Shares Outstanding |
Additional Paid-in Capital |
Retained Earnings |
Accumulated Other Comprehensive income (loss) |
Common Share Subscription Receivable |
Common Stock in Treasury |
Total Equity |
Number of Shares Outstanding |
Amount | |||||||||||||||||||||||||||||||||||||||||
| Balance, October 31, 2013 |
$ | — | 86,937 | $ | — | 533,554 | $ | 194,563 | $ | 8,878 | $ | 14 | $ | (127 | ) | $ | (725 | ) | $ | 202,603 | 39,811 | $ | 13,894 | |||||||||||||||||||||||||||||
|
|
|
|
|
|
|
|
|
|
|
|
|
|
|
|
|
|
|
|
|
|
|
|
|
|||||||||||||||||||||||||||||
| Net income |
— | — | — | — | — | 1,488 | — | — | — | 1,488 | — | — | ||||||||||||||||||||||||||||||||||||||||
| Other comprehensive income |
— | — | — | — | — | — | 80 | — | — | 80 | — | — | ||||||||||||||||||||||||||||||||||||||||
| Stock-based compensation expense |
— | — | — | — | 643 | — | — | — | — | 643 | — | — | ||||||||||||||||||||||||||||||||||||||||
| Redemption of common shares |
— | (8,213 | ) | — | — | — | — | — | — | (3,125 | ) | (3,125 | ) | — | — | |||||||||||||||||||||||||||||||||||||
| Payments received on share subscription receivable |
— | — | — | — | — | — | — | 79 | — | 79 | — | — | ||||||||||||||||||||||||||||||||||||||||
| Change in value of contingently redeemable common stock |
— | — | — | — | — | (2,024 | ) | — | — | — | (2,024 | ) | — | 2,024 | ||||||||||||||||||||||||||||||||||||||
| Reclassification of contingently redeemable common stock to permanent equity |
— | 8,694 | — | — | 3,355 | — | — | — | — | 3,355 | (8,694 | ) | (3,355 | ) | ||||||||||||||||||||||||||||||||||||||
| Issuance of contingently redeemable common stock |
— | — | — | — | (1,093 | ) | — | — | — | 1,093 | — | 7,215 | 2,855 | |||||||||||||||||||||||||||||||||||||||
|
|
|
|
|
|
|
|
|
|
|
|
|
|
|
|
|
|
|
|
|
|
|
|
|
|||||||||||||||||||||||||||||
| Balance, October 31, 2014 |
$ | — | 87,418 | $ | — | 533,554 | $ | 197,468 | $ | 8,342 | $ | 94 | $ | (48 | ) | $ | (2,757 | ) | $ | 203,099 | 38,332 | $ | 15,418 | |||||||||||||||||||||||||||||
|
|
|
|
|
|
|
|
|
|
|
|
|
|
|
|
|
|
|
|
|
|
|
|
|
|||||||||||||||||||||||||||||
| Net income |
— | — | — | — | — | 22,877 | — | — | — | 22,877 | — | — | ||||||||||||||||||||||||||||||||||||||||
| Other comprehensive loss |
— | — | — | — | — | — | (120 | ) | — | — | (120 | ) | — | — | ||||||||||||||||||||||||||||||||||||||
| Stock-based compensation expense |
— | — | — | — | 828 | — | — | — | — | 828 | — | — | ||||||||||||||||||||||||||||||||||||||||
| Redemption of common shares |
— | (7,489 | ) | — | — | (269 | ) | — | — | — | (3,781 | ) | (4,050 | ) | — | — | ||||||||||||||||||||||||||||||||||||
| Dividends paid on subsidiary preferred shares upon cancellation |
— | — | — | — | — | (186 | ) | — | — | — | (186 | ) | — | — | ||||||||||||||||||||||||||||||||||||||
| Payments received on share subscription receivable |
— | — | — | — | — | — | — | 48 | — | 48 | — | — | ||||||||||||||||||||||||||||||||||||||||
| Change in value of contingently redeemable common stock |
— | — | — | — | — | (6,426 | ) | — | — | — | (6,426 | ) | — | 6,426 | ||||||||||||||||||||||||||||||||||||||
| Reclassification of contingently redeemable common stock to permanent equity |
— | 17,408 | — | — | 8,494 | — | — | — | — | 8,494 | (17,408 | ) | (8,494 | ) | ||||||||||||||||||||||||||||||||||||||
| Issuance of contingently redeemable common stock |
— | — | — | — | (1,897 | ) | — | — | — | 1,897 | — | 4,879 | 2,000 | |||||||||||||||||||||||||||||||||||||||
|
|
|
|
|
|
|
|
|
|
|
|
|
|
|
|
|
|
|
|
|
|
|
|
|
|||||||||||||||||||||||||||||
| Balance, October 31, 2015 |
$ | — | 97,337 | $ | — | 533,554 | $ | 204,624 | $ | 24,607 | $ | (26 | ) | $ | — | $ | (4,641 | ) | $ | 224,564 | 25,803 | $ | 15,350 | |||||||||||||||||||||||||||||
|
|
|
|
|
|
|
|
|
|
|
|
|
|
|
|
|
|
|
|
|
|
|
|
|
|||||||||||||||||||||||||||||
| Net income |
— | — | — | — | — | 30,193 | — | — | — | 30,193 | — | — | ||||||||||||||||||||||||||||||||||||||||
| Other comprehensive income |
— | — | — | — | — | — | 65 | — | — | 65 | — | — | ||||||||||||||||||||||||||||||||||||||||
| Stock-based compensation expense |
— | — | — | — | 1,445 | — | — | — | — | 1,445 | — | — | ||||||||||||||||||||||||||||||||||||||||
| Redemption of common shares |
— | (16,729 | ) | — | — | (717 | ) | — | — | — | (10,684 | ) | (11,401 | ) | — | — | ||||||||||||||||||||||||||||||||||||
| Retirement of treasury stock |
— | — | — | — | (2,896 | ) | (12,429 | ) | — | — | 15,325 | — | — | — | ||||||||||||||||||||||||||||||||||||||
| Change in value of contingently redeemable common stock |
— | — | — | — | — | (10,716 | ) | — | — | — | (10,716 | ) | — | 10,716 | ||||||||||||||||||||||||||||||||||||||
| Reclassification of contingently redeemable common stock to permanent equity |
— | 5,706 | — | — | 3,773 | — | — | — | — | 3,773 | (5,706 | ) | (3,773 | ) | ||||||||||||||||||||||||||||||||||||||
|
|
|
|
|
|
|
|
|
|
|
|
|
|
|
|
|
|
|
|
|
|
|
|
|
|||||||||||||||||||||||||||||
| Balance, October 29, 2016 |
$ | — | 86,314 | $ | — | 533,554 | $ | 206,229 | $ | 31,655 | $ | 39 | $ | — | $ | — | $ | 237,923 | 20,097 | $ | 22,293 | |||||||||||||||||||||||||||||||
|
|
|
|
|
|
|
|
|
|
|
|
|
|
|
|
|
|
|
|
|
|
|
|
|
|||||||||||||||||||||||||||||
See Notes to Consolidated Financial Statements.
F-7
Table of Contents
Note 1. Nature of Operations and Basis of Presentation
REV Group, Inc. (formerly Allied Specialty Vehicles, Inc.) is one of North America’s leading manufacturers of specialty vehicles serving three market segments: Fire & Emergency, Commercial, and Recreation. The Company’s Fire & Emergency business is conducted through its wholly owned subsidiaries Halcore Group, Inc., Wheeled Coach Industries, Inc., E-ONE, Inc. and Kovatch Mobile Equipment Corp. The Company’s Commercial business is conducted through its wholly owned subsidiaries Collins Bus Corporation, Capacity of Texas Inc., Mobile Products, Inc., Champion Bus, Inc., General Coach America, Inc., Goshen Coach, Inc., ElDorado National (California), Inc. and ElDorado National Kansas, Inc. The Company’s Recreation vehicle business is conducted through its wholly owned subsidiaries REV Recreation Group, Inc. and Goldshield Fiberglass, Inc. Effective November 1, 2015, Allied Specialty Vehicles, Inc. changed its name to REV Group, Inc. (collectively, the “Company” or “REV”).
Note 2. Summary of Significant Accounting Policies
Principles of Consolidation: The consolidated financial statements include the accounts of REV and all of its subsidiaries and are prepared in conformity with generally accepted accounting principles in the United States of America (“U.S. GAAP”). All significant intercompany accounts and transactions have been eliminated in consolidation.
Fiscal Year: All references to “fiscal year 2016” relate to the year ended October 29, 2016. All references to “fiscal year 2015” relate to the year ended October 31, 2015. All references to “fiscal year 2014” relate to the year ended October 31, 2014. Each fiscal year is divided into four 13-week fiscal quarters. Each fiscal quarter is grouped into two 4-week monthly reporting periods and one 5-week monthly reporting period, although quarters may occasionally consist of “4-5-5” or “4-4-6” monthly periods, depending on the calendar and the additional week in a 53-week fiscal year. During fiscal year 2016 the Company changed the day of its fiscal year end from October 31 of each year to the last Saturday in October of each year going forward.
Reclassifications: The Company has reclassified certain prior year amounts to conform to the current period for reporting purposes. The Company reclassified $3,772 of tax indemnification assets from other current assets to other long-term assets as of October 31, 2015.
Use of Estimates: The preparation of financial statements in conformity with U.S. GAAP requires management to make estimates and assumptions that affect the reported amounts of assets and liabilities and disclosure of contingent assets and liabilities at the date of the consolidated financial statements and the reported amounts of revenues and expenses during the reporting period. Actual results could differ from these estimates. Management reviews its estimates on an ongoing basis, including those related to allowances for doubtful accounts, valuation of inventories, self-insurance reserves, purchase accounting estimates, useful lives for depreciation and amortization of property and equipment, warranty accrual, valuation allowances for deferred income tax assets, valuation of contingently redeemable common stock and litigation based on currently available information.
Business Combinations: The purchase price of an acquired company is allocated between assets acquired and liabilities assumed from the acquired business based on their estimated fair values. Any excess of consideration transferred is recorded as goodwill. To the extent the estimated fair value of the net assets acquired exceeds the purchase price, a gain on bargain purchase is recorded in current operations. The results of operations of the acquired businesses are included in the Company’s operating results from the dates of acquisition.
Assets acquired and liabilities assumed generally include tangible and intangible assets, and contingent assets and liabilities. When available, the estimated fair values of these assets and liabilities are determined based on observable inputs such as quoted market prices, information from comparable transactions, and the replacement cost of assets in the same condition or stage of usefulness (Level 1 and 2). If observable inputs are not available, unobservable inputs are used such as expected future cash flows or internally developed estimates of value (Level 3).
F-8
Table of Contents
Cash and Cash Equivalents: The Company considers all highly liquid investments with a maturity of three months or less when purchased to be cash equivalents. Cash equivalents consisted principally of bank deposits and overnight sweep accounts. The Company performs periodic evaluations of the relative credit standing of these financial institutions and limits the amount of credit exposure with any one institution.
Deposits held with financial institutions may exceed the amount of insurance provided on such deposits. These deposits may be redeemed upon demand, and are maintained with major financial institutions within the United States. Credit ratings of these financial institutions are monitored by management to mitigate risk of loss. At October 29, 2016, the Company had $9,763 of uninsured cash balances in excess of Federal Depository Insurance Company limits.
Accounts Receivable: Accounts Receivable consist of amounts billed and due from customers. The Company extends credit to customers in the normal course of business and maintains an allowance for doubtful accounts resulting from the inability or unwillingness of customers to make required payments. Management determines the allowance for doubtful accounts by evaluating individual customer receivables and considering a customer’s financial condition, credit history, the age of accounts receivable and current economic conditions.
The Company establishes a reserve for specific accounts receivable that are believed to be uncollectible, as well as an estimate of uncollectible receivables not specifically known. Historical trends and the Company’s current knowledge of potential collection problems provide the Company with sufficient information to establish a reasonable estimate for an allowance for doubtful accounts. Accounts Receivable in the Company’s consolidated balance sheets at October 29, 2016 and October 31, 2015 are stated net of an allowance for doubtful accounts of $1,623 and $768, respectively. Receivables are written off when management determines collection is highly unlikely and collection efforts have ceased. The change in the allowance for doubtful accounts is as follows:
| Fiscal Year Ended | ||||||||||||
| October 29, 2016 |
October 31, 2015 |
October 31, 2014 |
||||||||||
| Beginning balance |
$ | 768 | $ | 795 | $ | 564 | ||||||
| Net recorded expense |
1,075 | 620 | 850 | |||||||||
| Write-offs, net of recoveries/payments |
(220 | ) | (647 | ) | (619 | ) | ||||||
|
|
|
|
|
|
|
|||||||
| Ending balance |
$ | 1,623 | $ | 768 | $ | 795 | ||||||
|
|
|
|
|
|
|
|||||||
Concentrations of Credit Risk: Financial instruments that potentially subject the Company to concentrations of credit risk consist principally of accounts receivable. Concentration of credit risk with respect to accounts receivable is limited due to the large number of customers and their dispersion within North America. However, a majority amount of receivables is with dealers and municipalities in the United States. The Company continuously monitors credit risk associated with its receivables. The Company’s top five customers combined accounted for approximately 15%, 14% and 15% of its net sales for fiscal years 2016, 2015 and 2014, respectively.
Inventories: Inventories are stated at the lower of aggregate cost or market. Cost is determined using the first-in, first-out (“FIFO”) method. If inventory costs exceed expected market value due to obsolescence or quantities on hand are in excess of expected demand, the Company records reserves for the difference between the cost and the expected market value. These reserves are recorded based on various factors, including recent sales history and sales forecasts, industry market conditions, vehicle model changes and general economic conditions.
F-9
Table of Contents
Property, Plant and Equipment: Property, plant and equipment are recorded at cost, except when acquired in a business combination where property, plant and equipment are recorded at fair value. Depreciation of property, plant and equipment is recognized over the estimated useful lives of the respective assets using the straight-line method. The estimated useful lives are as follows:
| Years | ||||
| Buildings, related improvements and land improvements |
5-39 | |||
| Machinery and equipment |
3-15 | |||
| Office, furniture and other |
3-15 | |||
Expenditures that extend the useful life of existing property, plant and equipment are capitalized and depreciated over the remaining useful life of the related asset. Expenditures for repairs and maintenance are expensed as incurred. When property, plant and equipment are retired or sold, the cost and related accumulated depreciation is removed from the Company’s balance sheet, with any gain or loss reflected in operations. Accumulated depreciation on capitalized lease assets is included in property, plant and equipment.
Goodwill and Indefinite-Lived Intangible Assets: The Company accounts for business combinations by estimating the fair value of consideration paid for acquired businesses, including contingent consideration, and assigning that amount to the fair values of assets acquired and liabilities assumed, with the remainder assigned to goodwill. If the fair value of assets acquired and liabilities assumed exceeds the fair value of consideration paid, a gain on bargain purchase is recognized. The estimates of fair values are determined utilizing customary valuation procedures and techniques, which require us, among other things, to estimate future cash flows and discount rates. Such analyses involve significant judgments and estimations.
Goodwill and indefinite-lived intangible assets, consisting of trade names, are not amortized, however, the Company reviews goodwill and indefinite-lived intangible assets for impairment at least annually or more often if an event occurs or circumstances change which indicates that its carrying amount may not exceed its fair value. The annual impairment review is performed as of the first day of the fourth quarter of each fiscal year based upon information and estimates available at that time. To perform the impairment testing, the Company first assesses qualitative factors to determine whether it is more likely than not that the fair values of the Company’s reporting units or indefinite-lived intangible assets are less than their carrying amounts as a basis for determining whether or not to perform the quantitative impairment test. The Company then estimates the fair value of each reporting unit and each indefinite-lived intangible asset not meeting the qualitative criteria and compares their fair values to their carrying values.
The fair value of each reporting unit of the Company is determined by using the income approach and involves the use of significant estimates and assumptions. The income approach involves discounting management’s projections of future cash flows and a terminal value discounted at a discount rate which approximates the Company’s weighted-average cost of capital (“WACC”). Key assumptions used in the income approach include future sales growth, gross margin and operating expenses trends, depreciation expense, taxes, capital expenditures and changes in working capital. Projected future cash flows are based on income forecasts and management’s knowledge of the current operating environment and expectations for the future. The WACC incorporates equity and debt return rates observed in the market for a group of comparable public companies in the industry, and is determined using an average debt to equity ratio of selected comparable public companies, and is also adjusted for risk premiums and the Company’s capital structure. The terminal value is based upon the projected cash flow for the final projected year, and is calculated using estimates of growth of the net cash flows based on the Company’s estimate of stable growth for each financial reporting unit. The inputs and assumptions used in the determination of fair value are considered Level 3 inputs within the fair value hierarchy.
If the fair value of any reporting unit, as calculated using the income approach, is less than its carrying value, the fair value of the implied goodwill is calculated as the difference between the fair value of the reporting unit and the fair value of the underlying assets and liabilities, excluding goodwill. An impairment charge is recorded for any excess of the carrying value of goodwill over the implied fair value for each reporting unit.
F-10
Table of Contents
When determining the fair value of indefinite-lived trade names, the Company uses the relief from royalty method which requires the determination of fair value based on if the Company was licensing the right to the trade name in exchange for a royalty fee. The Company utilizes the income approach to determine future revenues to which to apply a royalty rate. The royalty rate is based on research of industry and market data related to transactions involving the licensing of comparable intangible assets. In considering the value of trade names, the Company looks to relative age, consistent use, quality, expansion possibilities, relative profitability and relative market potential.
As a result of the annual Company’s impairment test on goodwill and indefinite-lived intangible assets, it was concluded that there is no impairment of such assets for fiscal years 2016, 2015 and 2014.
Long-Lived Assets Including Definite-Lived Intangible Assets: Property, plant and equipment and intangible assets with definite lives are reviewed for potential impairment when events or changes in circumstances indicate that the carrying amount of the assets may not be recoverable. Recoverability of assets to be held and used is measured by comparison of the carrying value of such assets to the undiscounted future cash flows expected to be generated by such assets. If the carrying value of an asset exceeds its estimated undiscounted future cash flows, an impairment provision is recognized to the extent that the undiscounted future cash flows exceed the carrying amount of the asset. The Company considers factors such as historic or forecasted operating results, trends and future prospects, current market value, significant industry trends and other economic and regulatory factors in performing these analyses. Using different assumptions could result in a change in the Company’s estimates of cash flows and those differences could produce materially different results.
Debt Issuance Costs: Debt issuance costs are amortized as a component of interest expense over the term of the underlying debt using the effective interest method. These costs include bank commitment fees, legal and consulting costs, appraisals, title surveys, etc. Debt issuance costs of $3,505 and $5,426 at October 29, 2016 and October 31, 2015, respectively, related to the Company’s senior secured notes are reported as a direct reduction of the related debt instrument in the Company’s consolidated balance sheet. Debt issuance costs of $2,422 and $2,130 at October 29, 2016 and October 31, 2015, respectively, related to the Company’s ABL are reported in other long-term assets in the Company’s consolidated balance sheets.
Self-Insurance: Generally, the Company self-insures for a portion of product liability claims, workers’ compensation and employee medical coverage. Under these plans, liabilities are recognized for claims incurred, including an estimate for those incurred but not reported. The Company determines the liability for claims with the assistance of a third party administrator and actuary using various state statutes and historical claims experience. The Company has a self-insured retention (“SIR”) for product liability which varies annually based on market conditions. As of October 29, 2016 the SIR was at $500 per occurrence including defense expenses. The Company maintains liability insurance in excess of the SIR with outside insurance carriers to manage its risks related to catastrophic claims in excess of its self-insured positions for product liability and personal injury matters.
For employee medical coverage, annual claims of up to $275 per member are the risk of the company. Paid claims during the calendar year greater than $275 for any member are covered under a stop-loss policy with a commercial insurance carrier. Health expenses were $27,807, $23,744 and $21,669 during fiscal years 2016, 2015 and 2014, respectively. Accrued health benefit liability was $4,739 and $3,899 at October 29, 2016 and October 31, 2015, respectively, and is included as a component of payroll and related benefits and taxes in other current liabilities in the Company’s consolidated balance sheets. The Company is insured for workers’ compensation claims under both state and private insurance plans. The Company’s product liability and workers’ compensation accruals including residual claims under previous years SIR programs are also included within other current liabilities in the Company’s consolidated balance sheets. Accrued workers’ compensation claims totaled $962 and $970 at October 29, 2016 and October 31, 2015, respectively.
Income Taxes: Deferred income tax assets and liabilities are based on the temporary differences between the financial reporting basis and the income tax basis of the Company’s assets and liabilities using currently enacted
F-11
Table of Contents
tax rates and laws. Valuation allowances are established to reduce deferred tax assets to the amount ultimately expected to be realized. In assessing the realizability of deferred tax assets, management considers whether it is more likely than not that some portion or all of the deferred tax assets will not be realized. The realization of deferred tax assets is dependent upon the generation of taxable income during the periods in which those temporary differences become deductible for income tax purposes. Management considers the scheduled reversal of deferred tax liabilities, projected future taxable income, and tax-planning strategies in making this assessment.
The Company recognizes liabilities for uncertain income tax positions based on a two-step process. The first step is to evaluate the tax position for recognition by determining if the weight of available evidence indicates that it is more likely than not that the position will be sustained on audit, including resolution of related appeals or litigation processes, if any. The second step requires the Company to estimate and measure the tax benefit as the largest amount that is more than 50% likely to be realized upon ultimate settlement. It is inherently difficult and subjective to estimate such amounts, as the Company must determine the probability of various possible outcomes. The Company evaluates these uncertain tax positions on a quarterly basis or when new information becomes available to management. The evaluations are based on factors including, but not limited to, changes in facts or circumstances, changes in tax law, successfully settled issues under audit and new audit activity. Such a change in recognition or measurement could result in the recognition of a tax benefit or an increase to the related provision. The amount of unrecognized tax benefits, including interest and penalties, was $2,895 and $4,202 as of October 29, 2016 and October 31, 2015, respectively.
The Company classifies accrued interest and penalties related to income tax liabilities in the provision for income taxes in the Company’s consolidated statements of operations. Liabilities for income taxes payable, accrued interest and penalties that are due within one year of the balance sheet date are included in other current liabilities.
Earnings (Loss) Per Common Share: Basic earnings per share represents net income divided by basic weighted-average number of common shares, including contingently redeemable shares outstanding during the period. Diluted earnings per share represents net income divided by diluted weighted average number of common shares outstanding. Diluted weighted average common shares outstanding also include the dilutive effect of additional potential common shares issuable from stock options and are determined using the treasury stock method.
Comprehensive Income: Comprehensive income includes all changes in equity during a period except those that resulted from investments by or distributions to the Company’s shareholders. Other comprehensive income or loss refers to revenues, expenses, gains and losses that are included in comprehensive income, but excluded from net income as these amounts are recorded directly as an adjustment to shareholders’ equity.
The components of accumulated other comprehensive income (loss) are as follows:
| Fiscal Year Ended October 31, 2014 | ||||||||||||
| Increase / (Decrease) in Fair Value of Derivatives |
Other | Accumulated Other Comprehensive Income/(Loss) |
||||||||||
| Balance at October 31, 2013 |
$ | (41 | ) | $ | 55 | $ | 14 | |||||
| Changes |
56 | 24 | 80 | |||||||||
|
|
|
|
|
|
|
|||||||
| Balance at October 31, 2014 |
$ | 15 | $ | 79 | $ | 94 | ||||||
|
|
|
|
|
|
|
|||||||
F-12
Table of Contents
| Fiscal Year Ended October 31, 2015 | ||||||||||||
| Increase / (Decrease) in Fair Value of Derivatives |
Other | Accumulated Other Comprehensive Income/(Loss) |
||||||||||
| Balance at October 31, 2014 |
$ | 15 | $ | 79 | $ | 94 | ||||||
| Changes |
43 | (163 | ) | (120 | ) | |||||||
|
|
|
|
|
|
|
|||||||
| Balance at October 31, 2015 |
$ | 58 | $ | (84 | ) | $ | (26 | ) | ||||
|
|
|
|
|
|
|
|||||||
| Fiscal Year Ended October 29, 2016 | ||||||||||||
| Increase / (Decrease) in Fair Value of Derivatives |
Other | Accumulated Other Comprehensive Income/(Loss) |
||||||||||
| Balance at October 31, 2015 |
$ | 58 | $ | (84 | ) | $ | (26 | ) | ||||
| Changes |
(78 | ) | 143 | 65 | ||||||||
|
|
|
|
|
|
|
|||||||
| Balance at October 29, 2016 |
$ | (20 | ) | $ | 59 | $ | 39 | |||||
|
|
|
|
|
|
|
|||||||
Revenue Recognition: The Company recognizes revenue for sales of vehicles when contract terms are met, collectability is reasonably assured and a product is shipped or risk of ownership has been transferred to and accepted by the customer. In certain instances, risk of ownership and title passes when the product has been completed in accordance with purchase order specifications and has been tendered for delivery to the customer. Periodically, certain customers request bill and hold transactions. In those cases, revenue recognition occurs after the customer has been notified that the products have been completed according to the customer specifications, have passed all of the Company’s quality control inspections, and are ready for delivery.
Revenues from the sale of parts and the Company’s Goldshield Fiberglass businesses are recognized when title to products and the risk of loss are transferred to the customer, which is generally upon shipment. Revenue from service agreements is recognized as earned when services are rendered.
Intercompany sales are eliminated upon consolidation.
Provisions are made for discounts, returns and sales allowances based on management’s best estimate and the historical experience of each business unit. Sales are recorded net of amounts invoiced for taxes imposed on the customer, such as excise or value-added taxes.
Customer advances include amounts received in advance of the completion of vehicles or in advance of services being rendered. Such customer advances are recorded as current liabilities in the consolidated balance sheets until the vehicle is shipped or the service rendered.
Warranty: Provisions for estimated warranty and other related costs are recorded in cost of sales and are periodically adjusted to reflect actual experience. The amount of accrued warranty liability reflects management’s estimate of the expected future cost of settling the Company’s obligations under its warranty programs. The costs of fulfilling the Company’s warranty obligations primarily consist of replacement parts, labor and sometimes travel for any field retrofit or recall campaigns. The Company’s estimates are based on historical warranty expenditures, length of the warranty obligations for units sold, and the number of units under warranty. If a warranty cost is incurred due to a defect in a purchased material, the Company will seek reimbursement from the vendor to the fullest extent possible. The Company reviews warranty claims experience to determine if there are defects affecting numerous vehicles that would require a field retrofit or recall campaign.
Advertising Costs: Advertising costs are expensed as incurred and included in selling, general and administrative expenses in the Company’s consolidated statements of operations. Advertising costs totaled $4,118, $3,623 and $3,133 for fiscal years 2016, 2015, and 2014, respectively.
F-13
Table of Contents
Research and Development Costs: Research and development costs are expensed as incurred and included as part of operating expenses in the Company’s consolidated statements of operations. Research and development costs totaled $4,815, $5,106 and $8,275 for fiscal years 2016, 2015 and 2014, respectively.
Fair Value Measurements: The Company’s financial instruments not required to be adjusted to fair value on a recurring basis consist principally of cash, receivables, long-term debt and accounts payable. The Company believes cash, accounts receivable, and accounts payable are recorded at amounts that approximate their current market values based on their short-term nature.
Foreign currency forward contracts held or issued by the Company for risk management purposes are traded in over-the counter markets where quoted market prices are not readily available. For these derivatives, the Company measures fair value using the foreign currency spot rate at the reporting period compared to the contractual rate.
The estimated carrying and fair values of the Company’s financial instruments recognized and measured at fair value, which consist of foreign currency forward contracts and considered Level 2 inputs, are $89 and $0 as of October 29, 2016 and October 31, 2015, respectively.
The Company determines fair value as the price that would be received to sell an asset or paid to transfer a liability in an orderly transaction between unrelated market participants at the measurement date. The Company utilizes valuation techniques that maximize the use of observable inputs (Levels 1 and 2) and minimize the use of unobservable inputs (Level 3) within the fair value hierarchy established by the Financial Accounting Standards Board (“FASB”). The Company applies a “market approach” or an “income approach” to determine fair value. The market approach method uses pricing and other information generated by market transactions for identical or comparable assets and liabilities. When determining the fair value measurements for assets and liabilities, which are required to be recorded or disclosed at fair value, the Company considers the principal or most advantageous market in which the Company would transact and the market-based risk measurements or assumptions that market participants would use in pricing the asset or liability, such as inherent risk, transfer restrictions and credit risk. In the absence of significant market based inputs, the Company will use an “income approach” to estimate the fair value of the asset. This approach is based on the principle that the present value of the expected income that can be generated from the ownership of the asset approximates its fair value. This approach generally includes management’s estimates of assumptions that market participants would use to price the asset or liability including, projected income, a time period over which that income can be earned and an estimate of risk-adjusted discount and capitalization rates. Assets and liabilities are classified within the fair value hierarchy based on the lowest level (least observable) input that is significant to the measurement in its entirety. At each reporting period, all assets and liabilities for which the fair value measurement is based on significant unobservable inputs are classified as Level 3.
Based on recent open market transactions of the Company’s Senior Secured Notes, the fair value is approximately $185,850 and $209,100 as of October 29, 2016 and October 31, 2015, respectively. The fair value of the Company’s outstanding borrowings on its ABL Facility approximates book value.
For illustrative purposes, the levels within the FASB fair value hierarchy are as follows:
| Level 1 | Quoted prices in active markets that are unadjusted and accessible at the measurement date for identical, unrestricted assets or liabilities; | |
| Level 2 | Quoted prices for identical assets and liabilities in markets that are not active, quoted prices for similar assets and liabilities in active markets or financial instruments for which significant inputs are observable, either directly or indirectly; | |
| Level 3 | Prices or valuations that require inputs that are both significant to the fair value measurement and unobservable, including the company’s own assumptions in determining fair value. | |
F-14
Table of Contents
The Company applies fair value accounting for all financial assets and liabilities that are recognized or disclosed at fair value in the consolidated financial statements, consisting of derivative financial instruments and contingently redeemable common stock (discussed in Note 14, Contingently Redeemable Common Stock), which are valued based upon Level 3 inputs. The Company applies fair value accounting to its non-financial assets and liabilities, which consists principally of indefinite lived intangible assets (for purposes of the Company’s annual impairment test).
Change in the fair value of recurring fair value measurements using significant unobservable inputs (Level 3) for the fiscal years 2016 and 2015 were as follows:
| Contingently Redeemable Common Stock |
||||
| Balance at October 31, 2014 |
$ | 15,418 | ||
| Change in fair value |
6,426 | |||
| Issuance of contingently redeemable common stock |
2,000 | |||
| Reclassification of contingently redeemable common stock to permanent equity |
(8,494 | ) | ||
|
|
|
|||
| Balance at October 31, 2015 |
15,350 | |||
| Change in fair value |
10,716 | |||
| Issuance of contingently redeemable common stock |
— | |||
| Reclassification of contingently redeemable common stock to permanent equity |
(3,773 | ) | ||
|
|
|
|||
| Balance at October 29, 2016 |
$ | 22,293 | ||
Derivative Financial Instruments: The Company recognizes all derivative financial instruments, such as foreign exchange contracts, in the consolidated financial statements at fair value regardless of the purpose or intent for holding the instrument. Changes in the fair value of derivative financial instruments are either recognized periodically in income or in shareholders’ equity as a component of other comprehensive income or loss depending on whether the derivative financial instrument qualifies for hedge accounting, and if so, whether it qualifies as a fair value hedge or cash flow hedge. Generally, changes in fair values of derivatives accounted for as fair value hedges are recorded in income along with the portions of the changes in the fair values of the hedged items that relate to the hedged risks. Changes in fair values of derivatives accounted for as cash flow hedges, to the extent they are effective as hedges, are recorded in other comprehensive income or loss, net of deferred income taxes. Changes in fair value of derivatives not qualifying as hedges are reported in the Company’s consolidated statements of operations. Cash flows from derivatives that are accounted for as cash flow or fair value hedges are included in the Company’s consolidated statements of cash flows in the same category as the item being hedged.
Derivative financial instruments qualifying for hedge accounting must maintain a specified level of effectiveness between the hedging instrument and the item being hedged, both at inception and throughout the hedged period, which management evaluates periodically. The effective portion of gains and losses is deferred as a component of accumulated other comprehensive income (loss). As a matter of policy, the Company only enters into transactions which it believes will be highly effective at offsetting the underlying risk, and it does not use derivatives for trading or speculative purposes.
Stock-Based Compensation: Stock compensation expense is recorded over the term of the associated stock option grants, which is generally up to 10 years from the grant date, and is measured based upon the estimation of the fair value of all stock option awards on the grant date by applying the Black-Scholes option-pricing valuation model (the “Black-Scholes Model”). The application of the Black-Scholes Model requires the Company to make certain assumptions such as the fair value of common stock on the grant date, forfeitures of option grants and the rate of dividend payments on common stock. Other assumptions utilized in the Black-Scholes Model include volatility of the share price of select peer public companies and the risk free rate.
F-15
Table of Contents
The fair value of the Company’s common stock is calculated by determining enterprise value by applying an earnings multiple to the Adjusted EBITDA over the previous 12 months, and deducting outstanding debt, then dividing by the number of shares of common stock outstanding. The assumption for forfeitures is based upon historical experience. As the Company has not historically paid dividends on its common stock, a 0% dividend rate has been assumed for all outstanding stock options.
As of October 29, 2016, as a result of the Company’s filing of a Form S-1 with the U.S. Securities and Exchange Commission, the Company was considered a public entity, and as such, recognized the liability share awards at fair value in the Company’s consolidated balance sheet. Changes in fair value of liability share awards are recorded as stock compensation expense.
Foreign Currency Translation and Transactions: All balance sheet amounts denominated in currencies other than the U.S. dollar have been translated into U.S. dollars using the exchange rates in effect at the balance sheet date. Income statement amounts have been translated using the average exchange rate during the period in which the transactions occurred. Resulting translation adjustments are included in accumulated other comprehensive income (loss). Foreign currency transaction gains or losses are included in selling, general and administrative expense in the Company’s consolidated statements of operations. The Company recorded net foreign currency transaction losses of $90, $18 and $283 during fiscal years 2016, 2015, and 2014, respectively.
Subsequent Events: Except for the unaudited pro forma earnings per share information described in Note 23, which has been evaluated through January 9, 2017, the Company evaluated subsequent events through December 23, 2016, the date on which the financial statements were available to be issued.
New Accounting Pronouncements: In May 2014, the FASB issued ASU 2014-09, Revenue from Contracts with Customers (Topic 606) (“ASU 2014-09”), which specifies how and when to recognize revenue as well as providing informative, relevant disclosures. ASU 2014-09 will become effective for fiscal years beginning after December 15, 2017 (the Company’s fiscal year 2019) and interim periods within that fiscal year. The Company is currently evaluating the impact on its consolidated financial statements.
In April 2015, the FASB issued ASU 2015-03, Simplifying the Presentation of Debt Issuance Costs (“ASU 2015-03”), which requires that debt issuance costs related to a recognized debt liability be presented in the balance sheet as a direct deduction from the carrying amount of the that debt liability, consistent with debt discounts. ASU 2015-03 will become effective for fiscal years beginning after December 15, 2015 (the Company’s fiscal year 2017). The Company adopted ASU 2015-03 effective October 31, 2015 on a retrospective basis. Accordingly, $3,505 and $5,426 of debt issuance costs, previously included within other long-term assets, have been reclassified as a reduction of long-term debt on the consolidated balance sheet as of October 29, 2016 and October 31, 2015, respectively.
In July 2015, the FASB issued ASU 2015-11, Simplifying the Measurement of Inventory (Topic 330) (“ASU 2015-11”), which requires inventory measured using any method other than last-in, first-out (“LIFO”) or the retail inventory method to be subsequently measured at the lower of cost or net realizable value, rather than at the lower of cost or market. ASU 2015-11 will become effective for fiscal years beginning after December 15, 2016 (the Company’s fiscal year 2018) and interim periods within that fiscal year. The Company believes the adoption of ASU 2015-11 will not have a material impact on its consolidated financial statements.
In September 2015, the FASB issued ASU No. 2015-16, Business Combinations (Topic 805)—Simplifying the Accounting for Measurement-Period Adjustments (“ASU 2015-16”). ASU 2015-16 requires that an acquirer in a business combination recognize adjustments to provisional amounts that are identified during the measurement period in the reporting period in which the adjustment amounts are determined, rather than as retrospective adjustments. ASU 2015-16 is effective for fiscal years beginning after December 15, 2015, including interim periods within those fiscal years. ASU 2015-16 should be applied prospectively to adjustments to provisional amounts that occur after the effective date of ASU 2015-16 with earlier application permitted for financial
F-16
Table of Contents
statements that have not been issued. The Company believes the adoption of ASU 2015-16 will not have a material impact on its consolidated financial statements.
In November 2015, the FASB issued ASU 2015-17, Income Taxes, Balance Sheet Classification of Deferred Taxes (“ASU 2015-17”), which simplifies the balance sheet classification of deferred taxes. ASU 2015-17 requires that all deferred tax assets and liabilities be classified as noncurrent in the classified balance sheet, rather than separating such deferred taxes into current and noncurrent amounts, as is required under current guidance. ASU 2015-17 is effective for fiscal years, and for interim periods within those fiscal years, beginning after December 15, 2016 with early adoption permitted, and may be applied either prospectively or retrospectively. The Company prospectively adopted ASU 2015-17 in the fourth quarter of fiscal year 2016 and therefore prior periods were not retrospectively adjusted. The adoption of ASU 2015-17 did not have a material impact on the Company’s consolidated financial statements.
In February 2016, the FASB issued ASU 2016-02, Leases (Topic 842) (“ASU 2016-02”). The amendments in this update require, among other things, that lessees recognize the following for all leases (with the exception of leases with a duration of less than 12 months) at the commencement date: (1) a lease liability, which is a lessee’s obligation to make lease payments arising from a lease, measured on a discounted basis; and (2) a right-to-use asset, which is an asset that represents the lessee’s right to use, or control the use of, a specified asset for the lease term. Lessees and lessors must apply a modified retrospective transition approach for leases existing at, or entered into after, the beginning of the earliest comparative period presented in the financial statements. The Company expects to adopt ASU 2016-02 in the first quarter of 2019 and is currently evaluating the impact of ASU 2016-02 to its consolidated financial statements.
Note 3. Acquisitions
Kovatch Mobile Equipment Acquisition
On April 22, 2016, the Company acquired certain real estate assets and 100% of the common shares of Kovatch Mobile Equipment Corp. (“KME” and the “KME Acquisition”). KME produces a broad portfolio of customized specialty fire apparatus vehicles, and markets them to fire-rescue, military, aviation, and industrial customers globally. The KME Acquisition strengthens the Company’s share in the emergency vehicle market by expanding the Company’s product portfolio into segments of the fire apparatus market, which have not been previously served by the Company’s existing businesses and compliments the Company’s existing product portfolio. The purchase price for KME was $39,602 ($30,112 net of $9,490 cash acquired) and a subsequent $511 adjustment paid to the Company based on the level of net working capital and debt at closing. The net cash consideration paid at closing was funded through the Company’s ABL Facility. KME is reported as part of the Fire & Emergency segment. The preliminary purchase price allocation resulted in goodwill of $1,314, which is not deductible for income tax purposes.
The acquisition of KME has been accounted for as a business combination using the acquisition method of accounting, whereby the purchase price was allocated to tangible and intangible assets acquired and liabilities assumed based on their estimated fair values on the acquisition date, with the remaining unallocated purchase price recorded as goodwill. Fair value measurements have been applied based on assumptions that market participants would use in pricing of the asset or liability. The accounting for this transaction is preliminary and subject to potential adjustments, no later than one year from the date of acquisition.
As of October 29, 2016, the Company had not completed its final assessment of the value of liabilities for environmental, workers compensation and warranty liabilities which existed as of the date of acquisition. Adjustments which may result from the completion of this assessment may result in a change in the value of deferred income tax assets and liabilities.
F-17
Table of Contents
The following table summarizes the preliminary fair values of the assets acquired and liabilities assumed for KME:
| Assets: |
||||
| Cash |
$ | 9,490 | ||
| Receivables, net |
12,617 | |||
| Inventories, net |
67,899 | |||
| Deferred income taxes |
6,233 | |||
| Other current assets |
1,580 | |||
| Property, plant and equipment |
15,332 | |||
| Intangible assets, net |
10,950 | |||
| Other long-term assets |
39 | |||
|
|
|
|||
| Total assets acquired |
124,140 | |||
| Liabilities: |
||||
| Accounts payable |
13,834 | |||
| Customer advances |
43,438 | |||
| Accrued warranty |
14,357 | |||
| Deferred income taxes |
5,977 | |||
| Other current liabilities |
8,246 | |||
|
|
|
|||
| Total liabilities assumed |
85,852 | |||
|
|
|
|||
| Net Assets Acquired |
38,288 | |||
| Consideration Paid |
39,602 | |||
|
|
|
|||
| Goodwill |
$ | 1,314 | ||
|
|
|
|||
Intangible assets acquired as a result of the KME Acquisition are as follows:
| Customer relationships (9 year life) |
$ | 8,550 | ||
| Trade names (indefinite life) |
2,400 | |||
|
|
|
|||
| Total intangible assets, net |
$ | 10,950 | ||
|
|
|
Net sales and operating loss for the fiscal 2016 attributable to the KME acquisition were $97,197 and ($475), respectively. The Company has not included pro forma financial information in this report as if the acquisition had occurred on November 1, 2014, since the KME Acquisition did not meet the materiality requirement for such disclosure.
Hall-Mark Fire Apparatus Acquisition
On November 20, 2015, the Company acquired certain assets and assumed certain liabilities of Hall-Mark Fire Apparatus Inc. (“Hall-Mark”, the “Hall-Mark Acquisition”). The Hall-Mark acquisition provides the Company with the opportunity to expand its parts and service offerings to its customers. The purchase price was $3,000 in cash with $2,000 paid at closing and $1,000 payable in quarterly installments over the next five years. Additionally, the Company assumed $3,698 of Hall-Mark’s debt, offset by $385 of cash acquired. The net cash consideration paid at closing was funded through the Company’s ABL Facility. Hall-Mark is reported as part of the Fire & Emergency segment. The purchase price allocation resulted in goodwill of $368, which is deductible for income tax purposes.
The Hall-Mark Acquisition has been accounted for as a business combination using the acquisition method of accounting, whereby the purchase price was allocated to tangible and intangible assets acquired and liabilities assumed based on their estimated fair values on the acquisition date, with the remaining unallocated purchase
F-18
Table of Contents
price recorded as goodwill. Fair value measurements have been applied based on assumptions that market participants would use in pricing of the asset or liability.
The following table summarizes the fair values of the assets acquired and liabilities assumed for Hall-Mark:
| Assets: |
||||
| Cash |
$ | 385 | ||
| Accounts receivable |
3,135 | |||
| Inventories |
2,718 | |||
| Prepaids & other assets |
3,493 | |||
| Property, plant and equipment |
191 | |||
| Trade names |
870 | |||
| Customer relationships |
750 | |||
| Order backlog |
220 | |||
| Non-compete Agreements |
530 | |||
|
|
|
|||
| Total assets acquired |
12,292 | |||
| Liabilities |
||||
| Accounts payable |
891 | |||
| Other current liabilities |
226 | |||
| Customer deposits |
4,845 | |||
| Debt |
3,698 | |||
|
|
|
|||
| Total liabilities assumed |
9,660 | |||
|
|
|
|||
| Net Assets Acquired |
2,632 | |||
| Consideration Paid |
3,000 | |||
|
|
|
|||
| Goodwill |
$ | 368 | ||
|
|
|
|||
The Hall-Mark trade names will be amortized over five years, customer lists will be amortized over nine years, non-compete agreements will be amortized over six years and the order backlog is being amortized over a one-year period.
Net sales and operating income for fiscal 2016 attributable to the Hall-Mark acquisition were $38,290 and $345, respectively. The Company has not included pro forma financial information as if the acquisition had occurred on November 1, 2014, since the Hall-Mark Acquisition did not meet the materiality requirement for such disclosure.
Ancira Acquisition
On December 14, 2015, the Company entered into an agreement to acquire the land, building, and inventory of a recreational vehicle dealer in Texas (“Ancira”, “Ancira Acquisition”). The purchase price for the Ancira Acquisition was $19,976.
As the Company did not acquire any business processes, namely the dealer license from this dealer, the Ancira Acquisition was accounted for as an asset acquisition, and accordingly, the total purchase price was allocated to the assets acquired based on their relative fair value. No intangible assets were acquired or recognized as a result of the Ancira Acquisition.
F-19
Table of Contents
The following table summarizes the allocated cost of the assets acquired in the Ancira Acquisition:
| Inventory |
$ | 13,541 | ||
| Land & land improvements |
1,400 | |||
| Building & improvements |
4,849 | |||
| Machinery & equipment |
186 | |||
|
|
|
|||
| Total purchase price |
$ | 19,976 | ||
|
|
|
Note 4. Inventories
Inventories, net of reserves, consisted of the following:
| October 29, 2016 | October 31, 2015 | |||||||
| Chassis |
$ | 35,227 | $ | 30,765 | ||||
| Raw materials |
112,423 | 86,533 | ||||||
| Work in process |
128,145 | 97,251 | ||||||
| Finished products |
59,179 | 40,454 | ||||||
|
|
|
|
|
|||||
| 334,974 | 255,003 | |||||||
| Less: reserves |
(9,341 | ) | (8,041 | ) | ||||
|
|
|
|
|
|||||
| Total inventories, net |
$ | 325,633 | $ | 246,962 | ||||
|
|
|
|
|
|||||
Note 5. Property, Plant and Equipment
Property, plant and equipment consisted of the following:
| October 29, 2016 | October 31, 2015 | |||||||
| Land & land improvements |
$ | 16,247 | $ | 11,579 | ||||
| Buildings & improvements |
85,779 | 60,546 | ||||||
| Machinery & equipment |
73,087 | 46,250 | ||||||
| Office furniture & fixtures |
9,009 | 7,377 | ||||||
| Construction in process |
23,445 | 10,196 | ||||||
|
|
|
|
|
|||||
| 207,567 | 135,948 | |||||||
| Less: accumulated depreciation |
(61,145 | ) | (46,803 | ) | ||||
|
|
|
|
|
|||||
| Total property, plant and equipment, net |
$ | 146,422 | $ | 89,145 | ||||
|
|
|
|
|
|||||
Depreciation expense for fiscal years 2016, 2015 and 2014 was $15,170, $10,498 and $10,111, respectively.
Note 6. Goodwill and Intangible Assets
As of October 29, 2016 and October 31, 2015, goodwill in the Fire & Emergency segment was $55,857 and $54,175, respectively. Goodwill in the Commercial segment was $28,650 as of October 29, 2016 and October 31, 2015. There is no goodwill in the Recreation segment.
F-20
Table of Contents
The change in the net carrying value amount of goodwill consisted of the following:
| October 29, 2016 | October 31, 2015 | |||||||
| Balance at beginning of period |
$ | 82,825 | $ | 82,825 | ||||
| Activity during the year: |
||||||||
| Acquisition activity |
1,682 | — | ||||||
|
|
|
|
|
|||||
| Balance at end of period |
$ | 84,507 | $ | 82,825 | ||||
|
|
|
|
|
|||||
Intangible assets (excluding goodwill) consisted of the following:
| Weighted-Average Life | October 29, 2016 | October 31, 2015 | ||||||||||
| Finite-lived intangible assets: |
||||||||||||
| Technology-related |
7.0 | $ | 724 | $ | 724 | |||||||
| Customer relationships |
8.6 | 79,172 | 69,872 | |||||||||
| Order backlog |
1.0 | 220 | — | |||||||||
| Non-compete agreements |
6.0 | 530 | — | |||||||||
| Trade names |
7.0 | 3,477 | 1,367 | |||||||||
|
|
|
|
|
|||||||||
| 84,123 | 71,963 | |||||||||||
| Less: accumulated amortization |
(47,846 | ) | (38,423 | ) | ||||||||
|
|
|
|
|
|||||||||
| 36,277 | 33,540 | |||||||||||
| Indefinite-lived trade names |
87,763 | 85,363 | ||||||||||
|
|
|
|
|
|||||||||
| Total intangible assets, net |
$ | 124,040 | $ | 118,903 | ||||||||
|
|
|
|
|
|||||||||
Amortization expense was $9,423, $8,586 and $8,790 for fiscal years 2016, 2015 and 2014, respectively. The estimated future amortization expense of intangible assets for the subsequent five fiscal years is as follows: 2017—$8,837, 2018—$8,340, 2019—$7,345, 2020—$4,766 and 2021—$2,085.
Note 7. Other Current Liabilities
Other current liabilities consisted of the following:
| October 29, 2016 | October 31, 2015 | |||||||
| Payroll and related benefits and taxes |
$ | 27,775 | $ | 20,629 | ||||
| Incentive compensation |
11,715 | 7,104 | ||||||
| Customer sales program |
3,549 | 3,292 | ||||||
| Restructuring costs |
359 | 1,776 | ||||||
| Interest payable |
9,444 | 9,036 | ||||||
| Income taxes payable |
8,716 | — | ||||||
| Stock options |
9,117 | 1,214 | ||||||
| Other |
21,128 | 12,022 | ||||||
|
|
|
|
|
|||||
| Total other current liabilities |
$ | 91,803 | $ | 55,073 | ||||
|
|
|
|
|
|||||
F-21
Table of Contents
Note 8. Notes Payable, Bank and Other Long-Term Debt
The Company was obligated under the following debt instruments:
| October 29, 2016 | October 31, 2015 | |||||||
| Senior secured facility: |
||||||||
| Senior secured notes, net of debt discount ($455 and $704) and debt issuance costs ($3,505 and $5,426) |
$ | 176,040 | $ | 193,870 | ||||
| ABL Facility |
80,000 | 18,224 | ||||||
| Capital leases |
— | 536 | ||||||
|
|
|
|
|
|||||
| 256,040 | 212,630 | |||||||
| Less: current maturities |
— | (236 | ) | |||||
|
|
|
|
|
|||||
| Long-term maturities of notes payable, bank and other long-term debt |
$ | 256,040 | $ | 212,394 | ||||
|
|
|
|
|
|||||
Senior Secured Notes
On October 21, 2013, the Company issued (“Offering”) $200,000 in aggregate principal amount of its 8.5% Senior Secured Notes (the “Notes”). The net proceeds from the Offering, together with net proceeds from the Company’s ABL Facility (defined below) were used to finance the acquisition of the commercial bus business of Thor Industries, Inc. in fiscal year 2013 and to repay all outstanding debt existing at the time of the Offering.
The Notes mature on November 1, 2019. All principal is due in full on the maturity date. Interest accrues on the Notes at the rate of 8.5% per annum, payable semi-annually in arrears on May 1 and November 1 each year.
The Notes are guaranteed by all direct and indirect wholly owned domestic subsidiaries of the Company that guarantee debt under the ABL Facility described below. The Notes are secured by a first priority lien on substantially all of the guarantors’ assets other than accounts receivable and inventory, and related assets, pledged under the ABL Facility. The Notes are also secured by a second priority lien on substantially all of the collateral under the ABL Facility. The Notes are effectively subordinated to debt incurred under the ABL Facility, or other permitted debt facilities and obligations, as defined in the indenture governing the Notes, to the extent of the value of the assets securing the ABL Facility.
On October 17, 2016, the Company completed an open market purchase of $20,000 of its outstanding bonds, which were subsequently cancelled. The Company paid a premium of $400 and $784 of accrued interest as of the date of the purchase.
On or after November 1, of the years below, the Company may redeem all or a part of the Notes at the redemption prices set forth below plus accrued and unpaid interest on the Notes redeemed, to the applicable redemption date:
104.250% (Year 2016)
102.125% (Year 2017)
100.000% (Year 2018 and thereafter)
Upon a change of control, as defined, each holder of the Notes will have the right to require the Company to repurchase all or any part of the holder’s Notes at 101%, so long as the Note is a minimum of $2,000.
The Notes were issued with an applicable original issue discount (“OID”) of $1,166. The Company also incurred $8,980 in associated debt issuance costs. The OID is being accreted and debt issuance costs are being amortized over the debt term using the effective interest method. The principal on the Notes is reported on the consolidated balance sheets net of the unamortized OID of $455 and $704 at October 29, 2016 and October 31, 2015,
F-22
Table of Contents
respectively. The unamortized debt issuance costs are being reported as a direct reduction of related debt instrument in the accompanying consolidated balance sheets and totaled $3,505 and $5,426 at October 29, 2016 and October 31, 2015, respectively. The Notes contain certain financial covenants. The Company was in compliance with all financial covenants under the Notes as of October 29, 2016.
At October 29, 2016, the Company had $180,000 in principal outstanding under the Notes.
ABL Facility
Effective October 21, 2013, the Company entered into a $150,000 senior secured revolving credit and guaranty agreement (the Asset Based Lending or “ABL Facility”) with a syndicate of lenders. The ABL Facility consists of: (i) Revolving Loans, (ii) Swing Line Loans, and (iii) Letters of Credit, aggregating up to a combined maximum of $150,000. The total amount borrowed was subject to a $15,000 sublimit for Swing Line Loans, and a $25,000 sublimit for Letters of Credit, along with certain borrowing base and other customary restrictions as defined in the agreement. The Company incurred $3,526 in debt issuance costs related to the ABL Facility.
On April 22, 2016, the Company exercised its $50,000 Incremental Commitment option under the ABL Facility in conjunction with the KME Acquisition, which increased the borrowing capacity under the ABL Facility to $200,000 at that time. All other terms and conditions remain unchanged. The Company incurred $721 in debt issuance costs related to the $50,000 Incremental Commitment.
On August 19, 2016, the Company amended the ABL Facility to add an Incremental Commitment option of $100,000 (the “August 2016 Amendment”), and on that date exercised the Incremental Commitment option. The August 2016 Amendment increased the borrowing capacity under the ABL Facility to $300,000. All other terms and conditions remain unchanged.
All outstanding principal on the ABL Facility is due and payable on the maturity date of October 21, 2018, unless as otherwise amended per the terms of the agreement. Principal may be repaid at any time during the term of the ABL Facility without penalty. The lenders hold a first priority security interest in essentially all accounts receivable and inventory of the Company, and a second priority security interest in all other assets of the Company. All obligations under the ABL Facility are effectively subordinate to other debt to the extent of the value of collateral other than accounts receivable and inventory.
All Revolving Loans under the ABL Facility bear interest at rates equal to, at the Company’s option, either a Base Rate plus an Applicable Margin, or a Eurodollar Rate plus an Applicable Margin. All Swing Line Loans under the ABL Facility bear interest at a rate equal to a Base Rate plus an Applicable Margin. Applicable Margins were initially set at 0.75% for Base Rate loans and Swing Line Loans, and 1.75% for Eurodollar loans, and are subject to subsequent adjustment as defined in the agreement. Interest is payable quarterly for all loans in which a Base Rate is applied, and is payable either monthly or quarterly for all loans in which a Eurodollar Rate is applied.
At October 29, 2016, the Company had $80,000 in principal outstanding under Revolving Loans, and had a net unused availability of $213,849. Borrowings under Revolving Loans bear interest at an average rate of 2.24% per annum. The Company had open Letters of Credit of $6,151 at October 29, 2016.
The ABL Facility contains certain financial covenants. The Company was in compliance with all financial covenants under the ABL Facility as of October 29, 2016.
Note 9. Warranties
The Company’s products generally carry explicit warranties that extend from several months to several years, based on terms that are generally accepted in their respective markets. Selected components (such as engines,
F-23
Table of Contents
transmissions, tires, etc.) included in the Company’s end products may include warranties from original equipment manufacturers (“OEM”). These OEM warranties are passed on to the end customer of the Company’s products, and in some cases the customer deals directly with the applicable OEM manufacturer for any issues encountered.
Changes in the Company’s warranty liability consisted of the following:
| Fiscal Year Ended | ||||||||
| October 29, 2016 |
October 31, 2015 |
|||||||
| Balance at beginning of period |
$ | 28,453 | $ | 34,316 | ||||
| Warranty provisions |
26,759 | 22,537 | ||||||
| Settlements made |
(31,232 | ) | (27,472 | ) | ||||
| Warranties for current year acquisitions |
14,357 | — | ||||||
| Changes in liability of pre-existing warranties |
471 | (928 | ) | |||||
|
|
|
|
|
|||||
| Balance at end of period |
$ | 38,808 | $ | 28,453 | ||||
|
|
|
|
|
|||||
Accrued warranty is classified in the Company’s consolidated balance sheets as follows:
| October 29, 2016 |
October 31, 2015 |
|||||||
| Current liabilities |
$ | 22,693 | $ | 18,153 | ||||
| Other long-term liabilities |
16,115 | 10,300 | ||||||
|
|
|
|
|
|||||
| Total warranty liability |
$ | 38,808 | $ | 28,453 | ||||
|
|
|
|
|
|||||
Provisions for estimated warranty and other related costs are recorded at the time of sale and are periodically adjusted to reflect actual experience. Certain warranty and other related claims involve matters of dispute that ultimately are resolved by negotiation, arbitration or litigation. Warranty issues may arise that are beyond the scope of the Company’s historical experience and the potential liability for these warranty issues is evaluated on a case by case basis.
Note 10. Leases
Certain administrative and production facilities and equipment are leased under long-term, non-cancelable operating lease agreements. Most leases contain renewal options for varying periods. Leases generally require the Company to pay for insurance, taxes and maintenance of the property. See Note 19 for related party disclosures relating to leases.
Total rental expenses for property, plant and equipment charged to operations under non-cancelable operating leases was $3,706, $2,612 and $2,941 during fiscal years 2016, 2015 and 2014, respectively.
Future minimum lease payments due under operating leases for the subsequent five fiscal years, are as follows:
| 2017 |
2,471 | |||
| 2018 |
2,164 | |||
| 2019 |
1,834 | |||
| 2020 |
1,370 | |||
| 2021 |
1,090 | |||
| Thereafter |
836 |
F-24
Table of Contents
Note 11. Employee Benefit Plan
The Company has a defined contribution 401(k) plan covering substantially all employees. The plan allows employees to defer up to 100% of their employment income (subject to annual contribution limits imposed by the I.R.S.) after all taxes and applicable benefit deductions. Each employee who elects to participate is eligible to receive Company matching contributions that are based on employee contributions to the plans, subject to certain limitations. Amounts expensed for the Company’s matching and discretionary contributions were $6,085, $5,398 and $4,615 during fiscal years 2016, 2015 and 2014, respectively
Note 12. Derivative Financial Instruments and Hedging Activities
Cash Flow Hedges: The Company is exposed to certain risks relating to its ongoing business operations. The primary risk related to cash flows, partially managed by using derivative instruments, is foreign currency exchange rate risk. Forward contracts on various foreign currencies are entered into to manage the foreign currency exchange rate risk on the collection of receivables denominated in foreign currencies. These derivatives typically require the exchange of a foreign currency for U.S. dollars at a fixed rate at a future date.
To protect against the reduction in value of forecasted foreign currency cash flows resulting from export sales, the Company has instituted a foreign currency cash flow hedging program. The Company hedges portions of its receivables denominated in foreign currencies with forward contracts. When the U.S. dollar weakens against foreign currencies, decreased foreign currency payments are offset by gains in the value of the forward contracts. Conversely, when the U.S. dollar strengthens against foreign currencies, increased foreign currency payments are offset by losses in the value of the forward contracts.
For derivative instruments that are designated and qualify as a cash flow hedge, the effective portion of the gain or loss on the derivative instrument is reported as a component of accumulated other comprehensive income (loss) and reclassified into earnings in the same line item associated with the forecasted transaction and in the same period or periods during which the hedged transaction affects earnings. The Company generally hedges its exposure to the variability in future cash flows for a maximum of 12 to 18 months.
The ineffective portion of cash flow hedges, which is the remaining gain or loss on the derivative instrument in excess of the cumulative change in the present value of future cash flows of the hedged item, if any, or hedge components excluded from the assessment of effectiveness, is recognized in earnings immediately during the current period as a component of selling, general and administrative expenses in the Company’s consolidated statements of operations.
A net amount of $39 currently reported in accumulated other comprehensive income is expected to be reclassified to earnings within the next 12 months. The Company had forward foreign exchange contracts with a gross notional value of $5,198 and $5,669 as of October 29, 2016 and October 31, 2015, respectively, designated as cash flow hedges.
Note 13. Shareholders’ Equity
The Company’s amended certificate of incorporation allow for the issuance of up to 575,000 Class A common shares and for the issuance of up to 540,000 Class B common shares.
Shareholder Rights: All current shareholders of the Company are a party to the Amended Shareholders Agreement (the “Shareholders Agreement”) which governs the shareholders’ voting rights, right to transfer securities, rights in the event of a sale of the Company or other liquidity event and other special approval rights. Under the terms of the Shareholders Agreement, the Company may be required (at the shareholder’s option) or have the option to purchase the shareholder’s common stock upon termination, disability, death or retirement if the shareholder is an employee. If an employee shareholder is terminated for cause or the employee
F-25
Table of Contents
shareholder departs for any reason other than death, disability or retirement, the purchase price of the common stock will be the lesser of termination book value or cost. In the case of termination for any other reason and in the case of death, disability or retirement, the purchase price shall be a price per share equal to the fair market value as determined by the Company’s board of directors. Holders of the Company’s Class A common stock have one vote per share and holders of the Company’s Class B common stock have two votes per share.
Note 14. Contingently Redeemable Common Stock
Shares of common stock which are held by employees are eligible to be put to the Company in accordance with the Shareholders Agreement if certain criteria (as defined in the Shareholders Agreement) are met and the former employee or his or her beneficiaries exercises the option to put the shares to the Company in accordance with the Shareholders Agreement. As these provisions are not certain of being met, the shares of common stock held by employees are considered contingently redeemable common stock and recorded as temporary equity on the Company’s consolidated balance sheet until the shares of common stock are either re-purchased by the Company or the put option expires. The put option expires 90 or 180 days after termination of employment, depending on the nature of the termination or upon the sale of the Company or an initial public offering of the Company’s common stock. The value of these shares of common stock are presented at fair value on the Company’s consolidated balance sheet. The fair value of the Company’s common stock is calculated by estimating the Company’s enterprise value by applying an earnings multiple to the Company’s Adjusted EBITDA over the previous 12 months, and deducting outstanding net debt.
When the put option is exercised or expires, the shares are re-measured at fair value on that date and reclassified from temporary equity to shareholders’ equity. Changes in the fair value of the contingently redeemable shares of common stock are recorded in retained earnings.
During fiscal year 2016, the Company reclassified 5,706 contingently redeemable Class A common shares to shareholders’ equity. During fiscal year 2015, the Company issued 4,879 contingently redeemable Class A common shares for proceeds of $2,000. During fiscal year 2014, the Company issued 7,215 contingently redeemable Class A common shares for proceeds of $2,855.
Note 15. Stock Compensation
In April 2010, the Company’s board of directors approved the Company’s 2010 Long-Term Incentive Plan (the “2010 Plan”). Under the 2010 Plan, key employees, including employees who may also be directors or officers of the Company, outside directors, key consultants and key contractors of the Company may be granted incentive stock options, nonqualified stock options, and other share-based awards. The 2010 Plan provides for the granting of options to purchase shares of the Company’s common stock at not less than the fair market value of such shares on the date of grant. Stock options terminate not more than ten years from the date of grant. The 2010 Plan allows acceleration of options upon certain events, as defined. The Company recognizes compensation expense for stock options, nonvested stock and performance share awards over the requisite service period for vesting of the award, or to an employee’s eligible retirement date, if earlier and applicable. The maximum number of shares of stock reserved for all awards under the 2010 Plan is 80,000. At October 29, 2016, the Company had 46,832 shares available for issuance under the 2010 Plan.
Stock Option Awards: Stock options granted have a term of up to 10 years from the grant date. The vesting of these options are either immediate, upon a triggering event or over a three or four-year period. Exercisability of the majority of the options is contingent upon the occurrence of a change in control of the Company, or in certain of the option grants, an initial public offering of the Company’s common stock. The Company estimates the fair value of all stock option awards on the grant date by applying the Black-Scholes option-pricing valuation model. The application of this option pricing valuation model involves assumptions that are subjective, judgmental and sensitive in the determination of stock compensation cost.
F-26
Table of Contents
As of October 29, 2016 and October 31 2015, there were 20,800 and 16,400 stock options outstanding, respectively, which were considered liability share awards as the underlying shares were eligible to be sold back to the Company as a result of put rights in the Shareholders Agreement, within a period of time which would not subject the shareholder to the risks and rewards of share ownership for a reasonable period of time. As of October 29, 2016, as a result of the Company’s filing of a Form S-1 with the U.S. Securities and Exchange Commission, the Company was considered a public entity, and as such, recognized the liability share awards at fair value in the Company’s consolidated balance sheet. The fair value of the vested portion of these stock options was $9,117 at October 29, 2016. The Company valued these liabilities share awards at intrinsic value as of October 31, 2015. The intrinsic value of the vested portion of these stock options was $1,214 as of October 31, 2015, and is recorded in other current liabilities on the Company’s consolidated balance sheets. The fair value of the liability awards was $2,256 at October 31, 2015. Changes in fair value of liability share awards are recorded as stock compensation expense.
As of October 29, 2016, the Company could potentially recognize $2,505 of stock-based compensation expense if certain performance targets are met. As of October 29, 2016, the Company had $7,399 of unrecognized stock-based compensation expense related to time based vesting stock options.
In connection with the termination of certain Company officers in fiscal year 2014, the Company as part of the separation agreements allowed these employees to retain their awards subsequent to termination. There are no current or future performance requirements to retain the modified awards. This change resulted in a modification of stock option awards per ASC 718. Since the awards were subject to the contingencies described above, the adjusted value of the awards were included in the total value of potential performance based stock-based compensation expense.
The key assumptions used in determining the fair value of options granted for fiscal years 2016, 2015, and 2014, are as follows:
| 2016 | 2015 | 2014 | ||||
| Weighted-average volatility |
52.75 - 52.98% | 52.59 - 52.73% | 52.75 - 53.05% | |||
| Weighted-average risk-free interest rate |
1.83 - 2.25% | 1.93 - 2.37% | 2.35 - 2.80% | |||
| Weighted-average expected life in years |
10.00 | 10.00 | 10.00 | |||
| Dividend yield |
— | — | — | |||
| Weighted-average grant date fair value per option |
$407.01 | $358.72 | $252.81 |
Peer group information is the basis for the selection of the expected weighted-average volatility. The estimated expected life is the option term. The risk-free interest rate is selected based upon yields of United States Treasury issues with a term equal to the expected life of the option being valued.
F-27
Table of Contents
Stock option activity for fiscal years 2016, 2015 and 2014, was as follows:
| Number of Shares |
Weighted- Average Exercise Price Per Share |
Weighted- Average Remaining Contractual Term (in years) |
Aggregate Intrinsic Value of In-the- Money Options |
|||||||||||||
| Outstanding at October 31, 2013 |
41,347 | $ | 287 | 6.1 | $ | 3,496 | ||||||||||
| Granted |
27,950 | 391 | — | — | ||||||||||||
| Exercised |
— | — | — | — | ||||||||||||
| Cancelled |
(2,290 | ) | 345 | — | — | |||||||||||
|
|
|
|
|
|
|
|
|
|||||||||
| Outstanding at October 31, 2014 |
67,007 | $ | 327 | 6.8 | $ | 4,773 | ||||||||||
| Granted |
4,600 | 560 | — | — | ||||||||||||
| Exercised |
— | — | — | — | ||||||||||||
| Cancelled |
(11,175 | ) | 368 | — | — | |||||||||||
|
|
|
|
|
|
|
|
|
|||||||||
| Outstanding at October 31, 2015 |
60,432 | $ | 344 | 6.0 | $ | 15,156 | ||||||||||
|
|
|
|
|
|
|
|
|
|||||||||
| Granted |
12,500 | 640 | — | — | ||||||||||||
| Exercised |
— | — | — | — | ||||||||||||
| Cancelled |
(26,100 | ) | 351 | — | — | |||||||||||
|
|
|
|
|
|
|
|
|
|||||||||
| Outstanding at October 29, 2016 |
46,832 | $ | 455 | 7.1 | $ | 27,735 | ||||||||||
|
|
|
|
|
|
|
|
|
|||||||||
| Exercisable at October 29, 2016 |
12,133 | $ | 415 | — | $ | 8,429 | ||||||||||
|
|
|
|
|
|
|
|
|
|||||||||
The aggregate intrinsic value in the previous table reflects the total pre-tax intrinsic value (the difference between the per share fair value of the Company’s stock and the exercise price of the stock options, multiplied by the number of in-the-money stock options) that would have been received by the option holders had all option holders exercised their options on October 29, 2016 and October 31, 2015. The intrinsic value of the Company’s stock options changes based on the changes in fair value of the Company’s common stock.
Note 16. Restructuring Charges
In October 2014 the Company implemented a strategic plan to relocate the remaining of Navistar RV (since renamed Monaco RV (“MRV”)) operations in Elkhart, Indiana to its Decatur, Indiana recreation facility. Accordingly, $918 of the costs associated with the relocation, including but not limited to personnel costs, including severance and bonuses were recorded during fiscal year 2014.
In February 2014 the Company recorded a restructuring charge of $2,458 associated with exiting the non-motorized towable market. The Company eliminated approximately 143 positions in connection with this initiative. Additionally, $4,140 of inventory related restructuring costs were recorded in the cost of sales. Details of exiting the non-motorized towable market included:
| • | exiting two manufacturing facilities in Indiana and Oregon; |
| • | disposing of manufacturing equipment; |
| • | disposing current inventory through discounted sales and return of raw materials to vendors at a discount; and |
| • | eliminating workforce associated with the exited business component. |
All of the restructuring charges associated with exiting the non-motorized towable market were paid during fiscal year 2014 and no liability remained as of October 29, 2016.
F-28
Table of Contents
In fiscal year 2015 the Company implemented a restructuring of its management functions and various product lines across the Company. Accordingly, $3,869 of the costs associated with the re-organization, including but not limited to severance, were recorded during fiscal year 2015. Additionally, $783 of inventory obsolescence reserves were recorded as a charge to the costs of sales during fiscal year 2015 for the discontinued product lines within the Recreation segment.
In the first quarter of fiscal year 2016, the Company restructured some of its management functions in the Fire & Emergency segment and initiated the relocation of its Corporate office from Orlando, Florida to Milwaukee, Wisconsin. The Company recognized $2,807 of costs associated with this re-organization and office relocation, which included severance, lease termination and other associated expenses. At October 29, 2016, $567 of the restructuring costs remain unpaid and are included in other current liabilities in the Company’s consolidated balance sheet.
In the fourth quarter of fiscal year 2016, the Company implemented a strategic plan to relocate production of Goshen buses to its Salina, KS and Imlay City, MI facilities. Accordingly, $714 of the costs associated with the relocation, including but not limited to personnel costs, including severance and bonuses were recorded during fiscal year 2016. At October 29, 2016, $314 of the restructuring costs remain unpaid and are included in other current liabilities in the Company’s consolidated balance sheet.
| MRV - Elkhart, IN |
2015 - Companywide |
2016 - Companywide |
Goshen Bus |
Total | ||||||||||||||||
| Balance at October 31, 2014 |
$ | 577 | $ | — | $ | — | $ | — | 577 | |||||||||||
| Expenses Incurred |
— | 3,869 | — | — | 3,869 | |||||||||||||||
| Amounts Paid |
(577 | ) | (2,093 | ) | — | — | (2,670 | ) | ||||||||||||
|
|
|
|
|
|
|
|
|
|
|
|||||||||||
| Balance at October 31, 2015 |
$ | — | $ | 1,776 | $ | — | $ | — | $ | 1,776 | ||||||||||
|
|
|
|
|
|
|
|
|
|
|
|||||||||||
| Expenses Incurred |
— | — | 2,807 | 714 | 3,521 | |||||||||||||||
| Amounts Paid |
— | (1,776 | ) | (2,240 | ) | (400 | ) | (4,416 | ) | |||||||||||
|
|
|
|
|
|
|
|
|
|
|
|||||||||||
| Balance at October 29, 2016 |
$ | — | $ | — | $ | 567 | $ | 314 | $ | 881 | ||||||||||
|
|
|
|
|
|
|
|
|
|
|
|||||||||||
Note 17. Income Taxes
Earnings from operations are taxed as domestic income.
Provision for income taxes is summarized as follows:
| Fiscal Year Ended | ||||||||||||
| October 29, 2016 |
October 31, 2015 |
October 31, 2014 |
||||||||||
| Current: |
||||||||||||
| Federal |
$ | 12,564 | $ | 13,970 | $ | 2,319 | ||||||
| State |
4,147 | 3,290 | 1,301 | |||||||||
|
|
|
|
|
|
|
|||||||
| Total Current |
16,711 | 17,260 | 3,620 | |||||||||
|
|
|
|
|
|
|
|||||||
| Deferred: |
||||||||||||
| Federal |
(2,250 | ) | (4,749 | ) | 152 | |||||||
| State |
(1,411 | ) | (576 | ) | (477 | ) | ||||||
|
|
|
|
|
|
|
|||||||
| Total Deferred |
(3,661 | ) | (5,325 | ) | (325 | ) | ||||||
|
|
|
|
|
|
|
|||||||
| Provision for income taxes |
$ | 13,050 | $ | 11,935 | $ | 3,295 | ||||||
|
|
|
|
|
|
|
|||||||
F-29
Table of Contents
Income tax expense at the federal statutory rate is reconciled to the Company’s provision for income taxes as follows:
| Fiscal Year Ended | ||||||||||||
| October 29, 2016 |
October 31, 2015 |
October 31, 2014 |
||||||||||
| Income tax expense at federal statutory rate |
$ | 15,135 | $ | 12,184 | $ | 1,626 | ||||||
| State expense |
1,590 | 1,558 | 460 | |||||||||
| Deferred Adjustments |
(1,531 | ) | — | — | ||||||||
| Manufacturing and research incentives |
(2,592 | ) | (1,475 | ) | (363 | ) | ||||||
| Nondeductible items |
988 | 219 | 1,520 | |||||||||
| Other items |
(540 | ) | (551 | ) | 52 | |||||||
|
|
|
|
|
|
|
|||||||
| Provision for income taxes |
$ | 13,050 | $ | 11,935 | $ | 3,295 | ||||||
|
|
|
|
|
|
|
|||||||
Tax expense for fiscal year 2016 was favorably impacted by incentives for U.S. manufacturing and research as well as adjustments to deferred income tax balances. The deferred income tax balance adjustments were not material to current or previously issued financial statements.
Tax expense for fiscal year 2015 was favorably impacted by incentives for U.S. manufacturing and research.
Tax expense for fiscal year 2014 tax provision was negatively impacted by non-deductible costs associated with acquisitions.
No items included in Other items in the income tax reconciliation above are individually, or when appropriately aggregated, significant.
Temporary differences and carryforwards that give rise to deferred tax assets and liabilities include the following items:
| Fiscal Year Ended | ||||||||
| October 29, 2016 |
October 31, 2015 |
|||||||
| Deferred tax assets: |
||||||||
| Product warranty |
$ | 14,201 | $ | 9,256 | ||||
| Inventory |
5,891 | 7,697 | ||||||
| Deferred employee benefits |
9,096 | 4,609 | ||||||
| Net operating loss and credits |
2,114 | 1,675 | ||||||
| Other reserves and allowances |
5,311 | 3,885 | ||||||
|
|
|
|
|
|||||
| Gross deferred tax assets |
36,613 | 27,122 | ||||||
| Less valuation allowance |
(154 | ) | (797 | ) | ||||
|
|
|
|
|
|||||
| Deferred tax assets |
36,459 | 26,325 | ||||||
|
|
|
|
|
|||||
| Deferred tax liabilities: |
||||||||
| Intangible assets |
(40,817 | ) | (41,403 | ) | ||||
| Property, plant and equipment |
(12,661 | ) | (6,542 | ) | ||||
| Other |
(430 | ) | (385 | ) | ||||
|
|
|
|
|
|||||
| Deferred tax liabilities |
(53,908 | ) | (48,330 | ) | ||||
|
|
|
|
|
|||||
| Net deferred tax liability |
$ | (17,449 | ) | $ | (22,005 | ) | ||
|
|
|
|
|
|||||
F-30
Table of Contents
The net deferred tax assets/(liabilities) reflected in the consolidated balance sheet are as follows:
| Fiscal Year Ended | ||||||||
| October 29, 2016 | October 31, 2015 | |||||||
| Current deferred tax asset |
$ | — | $ | 23,599 | ||||
| Noncurrent deferred tax liability |
(17,449 | ) | (45,604 | ) | ||||
|
|
|
|
|
|||||
| Net deferred tax liability |
$ | (17,449 | ) | $ | (22,005 | ) | ||
|
|
|
|
|
|||||
As of each balance sheet date, management assesses the available positive and negative evidence to estimate if sufficient future taxable income will be generated to use the existing deferred tax assets. The Company will continue to evaluate its valuation allowance requirements in light of changing facts and circumstances, and may adjust its deferred tax valuation allowances accordingly. It is reasonably possible that the company will either add to, or reverse a portion of its existing deferred tax asset valuation allowance in the future. Such changes in the deferred tax asset valuation allowances could have a material effect on operating results.
At October 29, 2016, the Company has net operating loss carryforwards for U.S. federal income tax purposes of $3,250, which begin to expire in 2029. The Company also has state net operating loss carryforwards of $4,540, which begin to expire in 2027. The Company has an AMT credit carryforward for federal income tax purposes of $114. In addition, the Company has net operating loss carryforwards generated in Canada of $573 which are offset by a valuation allowance because the losses are projected to expire prior to being utilized.
The Company or one of its subsidiaries files income tax returns in the U.S, Canada and various state jurisdictions. With few exceptions, fiscal years 2013, 2014 and 2015 remain open to tax examination by Canadian, U.S. federal and state tax authorities.
The Company regularly assesses the likelihood of an adverse outcome resulting from examinations to determine the adequacy of its tax reserves. As of October 29, 2016, the company believes that it is more likely than not that the tax positions it has taken will be sustained upon the resolution of its audits resulting in no material impact on its consolidated financial position and the results of operations and cash flows. However, the final determination with respect to any tax audits, and any related litigation, could be materially different from the company’s estimates and/or from its historical income tax provisions and accruals and could have a material effect on operating results and/or cash flows in the periods for which that determination is made. In addition, future period earnings may be adversely impacted by litigation costs, settlements, penalties, and/or interest assessments.
During fiscal years 2016, 2015 and 2014, the Company recognized in the Consolidated Statements of Operations $180, $(12), and $31, respectively, for interest and penalties related to uncertain tax liabilities, which the Company recognizes as a part of income tax expense. As of October 29, 2016 and October 31, 2015, the company has accrued interest and penalties of $216 and $36, respectively.
A reconciliation of the beginning and ending amount of unrecognized tax benefits are as follows:
| Fiscal Year Ended | ||||||||||||
| October 29, 2016 |
October 31, 2015 |
October 31, 2014 |
||||||||||
| Balance at beginning of year |
$ | 4,166 | $ | 4,612 | $ | 4,509 | ||||||
| Additions (reductions) for tax positions in prior year |
(1,501 | ) | 74 | 80 | ||||||||
| Additions for tax positions in current year |
192 | 16 | 23 | |||||||||
| Cash settlements with taxing authorities |
(34 | ) | (430 | ) | — | |||||||
| Statute of limitations |
(144 | ) | (106 | ) | — | |||||||
|
|
|
|
|
|
|
|||||||
| Balance at end of year |
$ | 2,679 | $ | 4,166 | $ | 4,612 | ||||||
|
|
|
|
|
|
|
|||||||
F-31
Table of Contents
If recognized, $1,640, $430, and $458 of the Company’s unrecognized tax benefits as of October 29, 2016, October 31, 2015 and October 31, 2014, respectively, would affect the effective income tax rate. The remaining unrecognized tax benefits relate to state tax issues of acquired companies for which the Company will be indemnified by the seller. As such, an offsetting asset in the amount of $1,255 is included in other long-term assets.
During the next twelve months, it is reasonably possible that federal and state tax resolutions could reduce unrecognized tax benefits and income tax expense by up to $1,116, either because the Company’s tax positions are sustained on audit or settled, or the applicable statute of limitations closes.
Note 18. Commitments and Contingencies
Personal Injury Actions and Other: Product and general liability claims arise against the Company from time to time in the ordinary course of business. These claims are generally covered by third-party insurance. There is inherent uncertainty as to the eventual resolution of unsettled claims. Management, however, believes that any losses will not have a material adverse effect on the Company’s consolidated financial condition, results of operations or cash flows.
Market Risks: The Company is contingently liable under bid, performance and specialty bonds and has open standby letters of credit issued by the Company’s banks in favor of third parties as follows:
| October 29, 2016 |
October 31, 2015 |
|||||||
| Performance, bid and specialty bonds |
$ | 156,972 | $ | 84,797 | ||||
| Open standby letters of credit |
6,151 | 4,376 | ||||||
|
|
|
|
|
|||||
| Total |
$ | 163,123 | $ | 89,173 | ||||
|
|
|
|
|
|||||
Chassis Contingent Liabilities: The Company obtains certain vehicle chassis from automobile manufacturers under converter pool agreements. These agreements generally provide that the manufacturer will supply chassis at the Company’s various production facilities under the terms and conditions set forth in the agreement. The manufacturer does not transfer the certificate of origin to the Company and, accordingly, the Company accounts for the vehicle chassis as consigned, unrecorded inventory. Upon being put into production, the Company becomes obligated to pay the manufacturer for the vehicle chassis. Chassis are typically converted and delivered to customers within 90—120 days of receipt. If the vehicle chassis is not converted within this timeframe of delivery, the Company generally purchases the vehicle chassis and records the inventory. The Company’s contingent liability under such agreements was $77,587 and $69,210 as of October 29, 2016 and October 31, 2015, respectively.
Repurchase Commitments: The Company has entered into repurchase agreements with certain lending institutions. The repurchase commitments are on an individual unit basis with a term from the date it is financed by the lending institution through payment date by the dealer or other customer, generally not exceeding two years. The Company’s outstanding obligations under such agreements were $213,657 and $218,611 as of October 29, 2016 and October 31, 2015, respectively. This value represents the gross value of all vehicles under repurchase agreements and does not take into consideration proceeds that would be received upon resale of repossessed vehicles, which would be used to reduce the Company’s ultimate net liability. Such agreements are customary in the industries in which the Company operates and the Company’s exposure to loss under such agreements is limited by the potential loss on the resale value of the inventory which is required to be repurchased. Losses incurred under such arrangements have not been significant and the Company expects this pattern to continue into the future. The reserve for losses included in other liabilities on contracts outstanding at October 29, 2016 and October 31, 2015 is immaterial.
Guarantee Arrangements: The Company is party to multiple agreements whereby it guarantees indebtedness of others, including losses under loss pool agreements. The Company estimated that its maximum loss exposure
F-32
Table of Contents
under these contracts were $626 and $656 at October 29, 2016 and October 31, 2015, respectively. Under the terms of these and various related agreements and upon the occurrence of certain events, the Company generally has the ability to, among other things, take possession of the underlying collateral. If the financial condition of the customers and/or dealers were to deteriorate and result in their inability to make payments, then additional accruals may be required. While the Company does not expect to experience losses under these agreements that are materially in excess of the amounts reserved, it cannot provide any assurance that the financial condition of the third parties will not deteriorate resulting in the third party’s inability to meet their obligations. In the event that this occurs, the Company cannot guarantee that the collateral underlying the agreements will be sufficient to avoid losses materially in excess of the amounts reserved. Any losses under these guarantees would generally be mitigated by the value of any underlying collateral, including financed equipment, and are generally subject to the finance company’s ability to provide the Company clear title to foreclosed equipment and other conditions. During periods of economic weakness, collateral values generally decline and can contribute to higher exposure to losses.
Environmental Remediation Costs: The Company accrues for losses associated with environmental remediation obligations when such losses are probable and reasonably estimable. The liabilities are developed based on currently available information and reflect the participation of other potentially responsible parties, depending on the parties’ financial condition and probable contribution. The accruals are recorded at undiscounted amounts and are reflected as liabilities on the Company’s consolidated balance sheets. Recoveries of environmental remediation costs from other parties are recorded as assets when their receipt is deemed probable. The accruals are adjusted as further information develops or circumstances change. As of October 29, 2016, the Company has recorded an accrual of $1,528 for environmental remediation costs at certain of its acquired KME manufacturing facilities. According to the Purchase Agreement, these costs are expected to be reimbursed by the seller of KME and accordingly, the Company has recorded a receivable for the same amount. Environmental remediation costs were nil for fiscal years 2015 and 2014. At October 29, 2016, there were escrow funds held for the benefit of the Company in excess of this liability.
Other Matters: The Company is subject to certain legal proceedings that arise in the ordinary course of business. Although the final results of all such matters and claims cannot be predicted with certainty, management believes that the ultimate resolution of all such matters and claims will not have a material adverse effect on the Company’s financial condition, results of operations or cash flows. Actual results could vary, among other things, due to the uncertainties involved in litigation.
Note 19. Related Party Transactions
During fiscal years 2016, 2015 and 2014, the Company reimbursed its primary equity holder for out of pocket expenses in the amount of $219, $1,069 and $2,093, respectively. These expenses are included in selling, general and administrative expenses in the Company’s consolidated statements of operations.
Certain production facilities and offices for two of the Company’s subsidiaries are leased from related parties owned by certain members of management. Rent expense paid under these arrangements during fiscal years 2016, 2015 and 2014 was $524, $513 and $567, respectively. Future minimum lease payments under these leases are $567 and $337 in fiscal years 2017 and 2018, respectively.
The Company engages with an information technology, software and consulting company in which the Company’s CEO has a material equity interest. Services being provided include software development and installation. The Company made payments of $3,012 and $1,885 in fiscal years 2016 and 2015, respectively, to this information technology, software and consulting company. These costs are recorded in property, plant and equipment on the Company’s consolidated balance sheets.
Note 20. Earnings Per Common Share
Basic earnings per common share (“EPS”) is computed by dividing net income by the weighted average number of common shares outstanding. Diluted EPS is computed by dividing net income by the weighted average
F-33
Table of Contents
number of common shares outstanding assuming dilution. The difference between basic EPS and diluted EPS is the result of the dilutive effect of outstanding stock options. The table below reconciles basic weighted-average common shares outstanding to diluted weighted-average shares outstanding for fiscal years 2016, 2015 and 2014:
| Fiscal Year Ended | ||||||||||||
| October 29, 2016 | October 31, 2015 | October 31, 2014 | ||||||||||
| Basic weighted-average common shares outstanding |
644,840 | 659,517 | 659,866 | |||||||||
| Dilutive stock options |
2,332 | 720 | 102 | |||||||||
|
|
|
|
|
|
|
|||||||
| Diluted weighted-average common shares |
647,172 | 660,237 | 659,968 | |||||||||
|
|
|
|
|
|
|
|||||||
The Company excludes stock options that have an anti-dilutive effect from its calculation of weighted-average shares outstanding assuming dilution. There were 28,900, 33,350 and 35,100 shares as of October 29, 2016, October 31, 2015 and 2014, respectively, which were excluded from the calculation of diluted weighted-average common shares outstanding as the impact would have been anti-dilutive on earnings per share.
Note 21. Business Segment Information
The Company is organized into three reportable segments based on management’s process for making operating decisions, allocating capital and measuring performance, and based on the similarity of products, customers served, common use of facilities, and economic characteristics. The Company’s segments are as follows:
Fire & Emergency: This segment includes KME, E-One, Inc., American Emergency Vehicles, Inc., Leader Emergency Vehicles, Inc., Horton Enterprises, Inc. and Wheeled Coach, Inc. These business units manufacture and market commercial and custom fire and emergency vehicles primarily for fire departments, airports, other governmental units, contractors, hospitals and other care providers in the United States and other countries.
Commercial: This segment includes Collins Bus, Champion Bus, Inc., Goshen Coach, Inc., ENC, ElDorado National (Kansas), Inc., Capacity and Lay-Mor. Collins Bus manufactures, markets and distributes Type A school buses, as well as shuttle buses used for churches, transit authorities, hotels and resorts, retirement centers and other similar uses. Champion Bus, Inc., Goshen Coach, Inc., ENC, and ElDorado National (Kansas), Inc. manufacture, market and distribute shuttle buses, transit buses and mobility vans for transit, airport car rental and hotel/motel shuttles, tour and charter operations and other similar uses. Capacity manufactures, markets and distributes trucks used in terminal type operations, i.e., rail yards, warehouses, rail terminals and shipping terminals/ports. Lay-Mor manufactures, markets and distributes industrial sweepers for both the commercial and rental markets.
Recreation: This segment includes REV Recreation Group, Inc. (“RRG”) and Goldshield Fiberglass, Inc. (“Goldshield”). RRG primarily manufactures, markets and distributes Class A and Class C mobile recreational vehicles in both gas and diesel models. Goldshield manufactures, markets and distributes fiberglass reinforced molded parts to a diverse cross section of OEM and other commercial and industrial customers, including various components for other REV companies including RRG, which is one of Goldshield’s primary customers.
In considering the financial performance of the business, the chief operating decision maker analyzes the primary financial performance measure of Adjusted EBITDA. Adjusted EBITDA is defined as net income for the relevant period before depreciation and amortization, interest expense and provision (benefit) for income taxes, as adjusted for sponsor expenses, restructuring costs, and stock-based compensation, that the Company believes are not indicative of the Company’s ongoing operating performance. Adjusted EBITDA is not a measure defined by U.S. GAAP, but is computed using amounts that are determined in accordance with U.S. GAAP. A reconciliation of this performance measure to income before provision for income taxes is included below.
The Company believes that Adjusted EBITDA is useful to investors and used by management for measuring profitability because the measure excludes the impact of certain items which management believes have less
F-34
Table of Contents
bearing on the Company’s core operating performance. The Company believes that the core operations of its business are those which can be affected by the Company’s management in a particular period through their resource allocation decisions that affect the underlying performance of its operations conducted during that period. The Company also believes that the decision to utilize Adjusted EBITDA allows for a meaningful comparison of operating fundamentals between companies within the Company’s industry by eliminating the impact of capital structure and taxation differences between the companies.
The Company also adjusts for exceptional items which are determined to be those that in management’s judgment need to be disclosed by virtue of their size, nature or incidence, which include non-cash items and items settled in cash. In determining whether an event or transaction is exceptional, management considers quantitative as well as qualitative factors such as the frequency or predictability of occurrence. This is consistent with the way that financial performance is measured by management and reported to the Company’s Board of Directors, assists in providing a meaningful analysis of the Company’s operating performance and used as a measurement in incentive compensation for management. Based on the foregoing factors, management considers the adjustment for non-cash purchase accounting to be an exceptional item.
For purposes of measuring performance of its business segments, the Company does not allocate to individual business segments costs or items that are of a corporate nature. The caption “corporate and other” includes corporate office expenses, results of insignificant operations, intersegment eliminations and income and expense not allocated to reportable segments.
Identifiable assets of the business segments exclude general corporate assets, which principally consist of cash and cash equivalents, certain property, plant and equipment and certain other assets pertaining to corporate activities.
Intersegment sales generally include amounts invoiced by a segment for work performed for another segment. Amounts are based on actual work performed and agreed-upon pricing which is intended to be reflective of the contribution made by the supplying business segment. All intersegment transactions have been eliminated in consolidation.
Selected financial information of the Company’s segments is as follows:
| Fiscal Year 2016 | ||||||||||||||||||||
| Fire & Emergency |
Commercial | Recreation | Corporate and Other |
Consolidated | ||||||||||||||||
| Sales: |
||||||||||||||||||||
| Net Sales—External Customers |
$ | 768,053 | $ | 679,033 | $ | 478,071 | $ | 842 | $ | 1,925,999 | ||||||||||
|
|
|
|
|
|
|
|
|
|
|
|||||||||||
| Net Sales—Intersegment |
$ | — | $ | — | $ | 10,556 | $ | (10,556 | ) | $ | — | |||||||||
|
|
|
|
|
|
|
|
|
|
|
|||||||||||
| Depreciation and amortization |
$ | 9,707 | $ | 8,095 | $ | 4,999 | $ | 1,792 | $ | 24,593 | ||||||||||
|
|
|
|
|
|
|
|
|
|
|
|||||||||||
| Capital expenditures |
$ | 9,598 | $ | 5,943 | $ | 14,672 | $ | 18,329 | $ | 48,542 | ||||||||||
|
|
|
|
|
|
|
|
|
|
|
|||||||||||
| Identifiable assets |
$ | 410,984 | $ | 268,980 | $ | 172,034 | $ | 37,021 | $ | 889,019 | ||||||||||
|
|
|
|
|
|
|
|
|
|
|
|||||||||||
| Adjusted EBITDA |
$ | 85,170 | $ | 53,414 | $ | 11,005 | $ | (26,764 | ) | |||||||||||
F-35
Table of Contents
| Fiscal Year 2015 | ||||||||||||||||||||
| Fire & Emergency |
Commercial | Recreation | Corporate and Other |
Consolidated | ||||||||||||||||
| Sales: |
||||||||||||||||||||
| Net Sales—External Customers |
$ | 620,161 | $ | 701,980 | $ | 412,940 | $ | — | $ | 1,735,081 | ||||||||||
|
|
|
|
|
|
|
|
|
|
|
|||||||||||
| Net Sales—Intersegment |
$ | — | $ | — | $ | 10,039 | $ | (10,039 | ) | $ | — | |||||||||
|
|
|
|
|
|
|
|
|
|
|
|||||||||||
| Depreciation and amortization |
$ | 7,315 | $ | 8,703 | $ | 2,634 | $ | 432 | $ | 19,084 | ||||||||||
|
|
|
|
|
|
|
|
|
|
|
|||||||||||
| Capital expenditures |
$ | 3,353 | $ | 3,301 | $ | 2,710 | $ | 6,066 | $ | 15,430 | ||||||||||
|
|
|
|
|
|
|
|
|
|
|
|||||||||||
| Identifiable assets |
$ | 276,244 | $ | 267,188 | $ | 129,706 | $ | 22,683 | $ | 695,821 | ||||||||||
|
|
|
|
|
|
|
|
|
|
|
|||||||||||
| Adjusted EBITDA |
$ | 63,306 | $ | 39,095 | $ | 1,507 | $ | (13,782 | ) | |||||||||||
| Fiscal Year 2014 | ||||||||||||||||||||
| Fire & Emergency |
Commercial | Recreation | Corporate and Other |
Consolidated | ||||||||||||||||
| Sales: |
||||||||||||||||||||
| Net Sales—External Customers |
$ | 567,714 | $ | 654,432 | $ | 498,970 | $ | — | $ | 1,721,116 | ||||||||||
|
|
|
|
|
|
|
|
|
|
|
|||||||||||
| Net Sales—Intersegment |
$ | — | $ | — | $ | 10,399 | $ | (10,399 | ) | $ | — | |||||||||
|
|
|
|
|
|
|
|
|
|
|
|||||||||||
| Depreciation and amortization |
$ | 7,586 | $ | 8,427 | $ | 2,423 | $ | 465 | $ | 18,901 | ||||||||||
|
|
|
|
|
|
|
|
|
|
|
|||||||||||
| Capital expenditures |
$ | 3,433 | $ | 3,116 | $ | 4,987 | $ | 531 | $ | 12,067 | ||||||||||
|
|
|
|
|
|
|
|
|
|
|
|||||||||||
| Identifiable assets |
$ | 287,476 | $ | 262,290 | $ | 144,483 | $ | 11,438 | $ | 705,687 | ||||||||||
|
|
|
|
|
|
|
|
|
|
|
|||||||||||
| Adjusted EBITDA |
$ | 37,544 | $ | 34,273 | $ | 2,001 | $ | (12,305 | ) | |||||||||||
Provided below is a reconciliation of segment Adjusted EBITDA to income before provision for income taxes:
| Fiscal Year Ended | ||||||||||||
| October 29, 2016 |
October 31, 2015 |
October 31, 2014 |
||||||||||
| Fire & Emergency Adjusted EBITDA |
$ | 85,170 | $ | 63,306 | $ | 37,544 | ||||||
| Commercial Adjusted EBITDA |
53,414 | 39,095 | 34,273 | |||||||||
| Recreation Adjusted EBITDA |
11,005 | 1,507 | 2,001 | |||||||||
| Corporate and Other Adjusted EBITDA |
(26,764 | ) | (13,782 | ) | (12,305 | ) | ||||||
| Depreciation and amortization |
(24,593 | ) | (19,084 | ) | (18,901 | ) | ||||||
| Interest expense |
(29,158 | ) | (27,272 | ) | (26,195 | ) | ||||||
| Transaction expenses |
(1,629 | ) | — | (1,166 | ) | |||||||
| Sponsor expenses |
(219 | ) | (1,069 | ) | (2,093 | ) | ||||||
| Restructuring costs |
(3,521 | ) | (4,652 | ) | (7,516 | ) | ||||||
| Stock-based compensation expense |
(19,692 | ) | (3,237 | ) | (859 | ) | ||||||
| Non-cash purchase accounting |
(770 | ) | — | — | ||||||||
|
|
|
|
|
|
|
|||||||
| Income before provision for income taxes |
$ | 43,243 | $ | 34,812 | $ | 4,783 | ||||||
|
|
|
|
|
|
|
|||||||
F-36
Table of Contents
The following tables present net sales by geographic region based on product shipment destination for fiscal years 2016, 2015 and 2014:
| Fiscal Year 2016 | ||||||||||||||||||||
| U.S. and Canada |
Europe/ Africa |
Middle East |
Rest of World |
Total | ||||||||||||||||
| Fire & Emergency |
$ | 758,549 | $ | 653 | $ | 3,416 | $ | 5,435 | $ | 768,053 | ||||||||||
| Commercial |
672,673 | 454 | — | 5,906 | 679,033 | |||||||||||||||
| Recreation |
475,021 | — | — | 3,050 | 478,071 | |||||||||||||||
| Corporate and other |
842 | — | — | — | 842 | |||||||||||||||
|
|
|
|
|
|
|
|
|
|
|
|||||||||||
| Total Net Sales—External Customers |
$ | 1,907,085 | $ | 1,107 | $ | 3,416 | $ | 14,391 | $ | 1,925,999 | ||||||||||
|
|
|
|
|
|
|
|
|
|
|
|||||||||||
| Intersegment Sales |
$ | 10,556 | — | — | — | — | ||||||||||||||
| Corporate Eliminations |
(10,556 | ) | — | — | — | — | ||||||||||||||
|
|
|
|
|
|
|
|
|
|
|
|||||||||||
| Fiscal Year 2015 | ||||||||||||||||||||
| U.S. and Canada |
Europe/ Africa |
Middle East |
Rest of World |
Total | ||||||||||||||||
| Fire & Emergency |
$ | 589,311 | $ | 720 | $ | 23,924 | $ | 6,206 | $ | 620,161 | ||||||||||
| Commercial |
685,382 | 1,024 | 188 | 15,386 | 701,980 | |||||||||||||||
| Recreation |
407,504 | — | — | 5,436 | 412,940 | |||||||||||||||
|
|
|
|
|
|
|
|
|
|
|
|||||||||||
| Total Net Sales—External Customers |
$ | 1,682,197 | $ | 1,744 | $ | 24,112 | $ | 27,028 | $ | 1,735,081 | ||||||||||
|
|
|
|
|
|
|
|
|
|
|
|||||||||||
| Intersegment Sales |
$ | 10,039 | — | — | — | — | ||||||||||||||
| Corporate Eliminations |
(10,039 | ) | — | — | — | — | ||||||||||||||
|
|
|
|
|
|
|
|
|
|
|
|||||||||||
| Fiscal Year 2014 | ||||||||||||||||||||
| U.S. and Canada |
Europe/ Africa |
Middle East |
Rest of World |
Total | ||||||||||||||||
| Fire & Emergency |
$ | 529,849 | $ | 2,433 | $ | 23,693 | $ | 11,739 | $ | 567,714 | ||||||||||
| Commercial |
642,701 | 960 | 370 | 10,401 | 654,432 | |||||||||||||||
| Recreation |
498,864 | — | — | 106 | 498,970 | |||||||||||||||
|
|
|
|
|
|
|
|
|
|
|
|||||||||||
| Total Net Sales—External Customers |
$ | 1,671,414 | $ | 3,393 | $ | 24,063 | $ | 22,246 | $ | 1,721,116 | ||||||||||
|
|
|
|
|
|
|
|
|
|
|
|||||||||||
| Intersegment Sales |
$ | 10,399 | — | — | — | — | ||||||||||||||
| Corporate Eliminations |
(10,399 | ) | — | — | — | — | ||||||||||||||
|
|
|
|
|
|
|
|
|
|
|
|||||||||||
Note 22. Quarterly Information (Unaudited)
The summarized quarterly financial data presented below reflect all adjustments, which in the opinion of management, are of a normal and recurring nature necessary to present fairly the results of operations for the periods presented. Annual amounts may not sum due to rounding. In thousands, except for per share amounts.
F-37
Table of Contents
Fiscal Year 2016
| First Quarter |
Second Quarter |
Third Quarter |
Fourth Quarter |
Total Year | ||||||||||||||||
| Net sales |
$ | 372,780 | $ | 480,229 | $ | 528,238 | $ | 544,752 | $ | 1,925,999 | ||||||||||
| Cost of sales |
337,841 | 421,509 | 464,285 | 472,433 | 1,696,068 | |||||||||||||||
|
|
|
|
|
|
|
|
|
|
|
|||||||||||
| Gross profit |
34,939 | 58,720 | 63,953 | 72,319 | 229,931 | |||||||||||||||
| Operating expense |
||||||||||||||||||||
| Selling, general and administrative |
27,106 | 35,314 | 35,481 | 41,870 | 139,771 | |||||||||||||||
| Research and development |
1,139 | 1,294 | 1,330 | 1,052 | 4,815 | |||||||||||||||
| Restructuring costs |
2,965 | (215 | ) | 57 | 714 | 3,521 | ||||||||||||||
| Amortization of intangible assets |
2,243 | 2,200 | 2,505 | 2,475 | 9,423 | |||||||||||||||
|
|
|
|
|
|
|
|
|
|
|
|||||||||||
| Total operating expenses |
33,453 | 38,593 | 39,373 | 46,111 | 157,530 | |||||||||||||||
|
|
|
|
|
|
|
|
|
|
|
|||||||||||
| Interest expense |
6,687 | 6,776 | 7,364 | 8,331 | 29,158 | |||||||||||||||
|
|
|
|
|
|
|
|
|
|
|
|||||||||||
| Income (loss) before provision for income taxes |
(5,201 | ) | 13,351 | 17,216 | 17,877 | 43,243 | ||||||||||||||
| Provision (benefit) for income taxes |
(2,191 | ) | 5,309 | 4,136 | 5,796 | 13,050 | ||||||||||||||
|
|
|
|
|
|
|
|
|
|
|
|||||||||||
| Net income (loss) |
$ | (3,010 | ) | $ | 8,042 | $ | 13,080 | $ | 12,081 | $ | 30,193 | |||||||||
|
|
|
|
|
|
|
|
|
|
|
|||||||||||
| Earnings per share |
||||||||||||||||||||
| Basic |
$ | (4.59 | ) | $ | 12.53 | $ | 20.41 | $ | 18.87 | $ | 46.82 | |||||||||
| Diluted |
$ | (4.59 | ) | $ | 12.52 | $ | 20.39 | $ | 18.84 | $ | 46.65 | |||||||||
Fiscal Year 2015
| First Quarter |
Second Quarter |
Third Quarter |
Fourth Quarter |
Total Year | ||||||||||||||||
| Net sales |
$ | 383,552 | $ | 438,158 | $ | 450,343 | $ | 463,028 | $ | 1,735,081 | ||||||||||
| Cost of sales |
349,700 | 394,147 | 401,935 | 407,345 | 1,553,127 | |||||||||||||||
|
|
|
|
|
|
|
|
|
|
|
|||||||||||
| Gross profit |
33,852 | 44,011 | 48,408 | 55,683 | 181,954 | |||||||||||||||
| Operating expense |
||||||||||||||||||||
| Selling, general and administrative |
23,024 | 27,833 | 24,584 | 26,868 | 102,309 | |||||||||||||||
| Research and development |
1,581 | 1,678 | 1,485 | 362 | 5,106 | |||||||||||||||
| Restructuring costs |
— | 2,359 | 909 | 601 | 3,869 | |||||||||||||||
| Amortization of intangible assets |
2,130 | 2,148 | 2,148 | 2,160 | 8,586 | |||||||||||||||
|
|
|
|
|
|
|
|
|
|
|
|||||||||||
| Total operating expenses |
26,735 | 34,018 | 29,126 | 29,991 | 119,870 | |||||||||||||||
|
|
|
|
|
|
|
|
|
|
|
|||||||||||
| Interest expense |
7,020 | 7,114 | 6,722 | 6,416 | 27,272 | |||||||||||||||
|
|
|
|
|
|
|
|
|
|
|
|||||||||||
| Income before provision for income taxes |
97 | 2,879 | 12,560 | 19,276 | 34,812 | |||||||||||||||
| Provision (benefit) for income taxes |
(184 | ) | 1,067 | 4,286 | 6,766 | 11,935 | ||||||||||||||
|
|
|
|
|
|
|
|
|
|
|
|||||||||||
| Net income |
$ | 281 | $ | 1,812 | $ | 8,274 | $ | 12,510 | $ | 22,877 | ||||||||||
|
|
|
|
|
|
|
|
|
|
|
|||||||||||
| Earnings per share |
||||||||||||||||||||
| Basic |
$ | 0.43 | $ | 2.74 | $ | 12.52 | $ | 19.05 | $ | 34.69 | ||||||||||
| Diluted |
$ | 0.43 | $ | 2.73 | $ | 12.51 | $ | 18.99 | $ | 34.65 | ||||||||||
F-38
Table of Contents
Note 23. Pro forma Earnings per Common Share (unaudited)
In connection with, and effective immediately prior to the closing of, an initial public offering of the Company’s common stock, the Company intends to effect an 80-for-one stock split pursuant to which each share of common stock then held by a holder will be reclassified into 80 shares. The unaudited pro forma earnings per share gives effect to this proposed stock split.
The table below reconcilies basic weighted-average common shares outstanding to diluted weighted average shares outstanding for fiscal years 2016, 2015 and 2014 as reported and on a pro forma basis after giving effect for the Company’s 80 for one split of its common shares as if the split occured on November 1, 2013:
| As reported | Pro forma | |||||||||||||||||||||||
| Fiscal Year Ended | Fiscal Year Ended | |||||||||||||||||||||||
| October 29, 2016 |
October 31, 2015 |
October 31, 2014 |
October 29, 2016 |
October 31, 2015 |
October 31, 2014 |
|||||||||||||||||||
| Basic weighted-average common shares outstanding |
644,840 | 659,517 | 659,866 | 51,587,164 | 52,761,380 | 52,789,250 | ||||||||||||||||||
| Dilutive stock options |
2,332 | 720 | 102 | 186,521 | 57,589 | 8,181 | ||||||||||||||||||
|
|
|
|
|
|
|
|
|
|
|
|
|
|||||||||||||
| Diluted weighted-average shares of common stock outstanding |
647,172 | 660,237 | 659,968 | 51,773,685 | 52,818,969 | 52,797,431 | ||||||||||||||||||
|
|
|
|
|
|
|
|
|
|
|
|
|
|||||||||||||
Schedule II—Valuation and Qualifying Accounts
The valuation and qualifying accounts for fiscal years 2016, 2015 and 2014 are as follows:
| Balance at Beginning of Year |
Charge to Costs and Expenses |
Utilization of Reserve |
Other, Such as Rate Changes or Foreign Currency Changes |
Balance at End of Year |
||||||||||||||||
| Year ended October 31, 2014 |
||||||||||||||||||||
| Deferred tax valuation allowance |
$ | 800 | $ | — | $ | — | $ | (4 | ) | $ | 796 | |||||||||
| Year End October 31, 2015 |
||||||||||||||||||||
| Deferred tax valuation allowance |
796 | — | — | 1 | 797 | |||||||||||||||
| Year End October 29, 2016 |
||||||||||||||||||||
| Deferred tax valuation allowance |
797 | (638 | ) | — | (5 | ) | 154 | |||||||||||||
F-39
Table of Contents

Table of Contents
12,500,000 Shares
REV Group, Inc.
Common Stock

PROSPECTUS
Goldman, Sachs & Co.
Morgan Stanley
Baird
BMO Capital Markets
Credit Suisse
Deutsche Bank Securities
Jefferies
Wells Fargo Securities
Stifel
, 2017
Table of Contents
PART II
INFORMATION NOT REQUIRED IN PROSPECTUS
| Item 13. | Other expenses of issuance and distribution |
The following table sets forth the costs and expenses, other than the underwriting discount, payable by the registrant in connection with the sale of common stock being registered. All amounts are estimates except for the Securities and Exchange Commission, or SEC, registration fee, the FINRA filing fee and the NYSE listing fee.
| Item |
Amount to be paid | |||
| SEC registration fee |
$ | 34,987 | ||
| FINRA filing fee |
45,781 | |||
| NYSE listing fee |
25,000 | |||
| Blue sky fees and expenses |
15,000 | |||
| Printing and engraving expenses |
300,000 | |||
| Legal fees and expenses |
1,250,000 | |||
| Accounting fees and expenses |
400,000 | |||
| Transfer Agent fees and expenses |
3,500 | |||
| Miscellaneous expenses |
50,000 | |||
|
|
|
|||
| Total |
2,124,268 | |||
|
|
|
|||
| Item 14. | Indemnification of directors and officers |
Section 102(b)(7) of the General Corporation Law of the State of Delaware, or the DGCL, enables a corporation to eliminate or limit the personal liability of a director for violations of the director’s fiduciary duty, except (i) for any breach of the director’s duty of loyalty to the corporation or its stockholders, (ii) for acts or omissions not in good faith or which involve intentional misconduct or a knowing violation of law, (iii) for liability of directors for unlawful payment of dividends or unlawful stock purchase or redemptions pursuant to Section 174 of the DGCL or (iv) for any transaction from which a director derived an improper personal benefit. Our certificate of incorporation includes a provision that eliminates the personal liability of directors for monetary damages for actions taken as a director to the fullest extent authorized by the DGCL.
Section 145(a) of the DGCL provides in relevant part that a corporation may indemnify any person who was or is a party or is threatened to be made a party to any threatened, pending or completed action, suit or proceeding, whether civil, criminal, administrative or investigative (other than an action by or in the right of the corporation), by reason of the fact that such person is or was a director or officer of the corporation, or is or was serving at the request of the corporation as a director or officer of another entity, against expenses (including attorneys’ fees), judgments, fines and amounts paid in settlement actually and reasonably incurred by such person in connection with such action, suit or proceeding if such person acted in good faith and in a manner such person reasonably believed to be in or not opposed to the best interests of the corporation, and, with respect to any criminal action or proceeding, had no reasonable cause to believe such person’s conduct was unlawful. The termination of any action, suit or proceeding by judgment, order, settlement, conviction or upon a plea of nolo contendere or its equivalent shall not, of itself, create a presumption that such person did not act in good faith and in a manner which such person reasonably believed to be in or not opposed to the best interests of the corporation, and, with respect to any criminal action or proceeding, had reasonable cause to believe that such person’s conduct was unlawful.
Section 145(b) of the DGCL provides in relevant part that a corporation may indemnify any person who was or is a party or is threatened to be made a party to any threatened, pending or completed action or suit by or in the right of the corporation to procure a judgment in its favor by reason of the fact that the person is or was a director or officer of the corporation, or is or was serving at the request of the corporation as a director or officer of
II-1
Table of Contents
another entity, against expenses (including attorneys’ fees) actually and reasonably incurred by such person in connection with the defense or settlement of such action or suit if the person acted in good faith and in a manner the person reasonably believed to be in or not opposed to the best interests of the corporation and except that no indemnification shall be made in respect of any claim, issue or matter as to which such person shall have been adjudged to be liable to the corporation unless and only to the extent that the Court of Chancery or the court in which such action or suit was brought shall determine upon application that, despite the adjudication of liability but in view of all the circumstances of the case, such person is fairly and reasonably entitled to indemnity for such expenses which the Court of Chancery or such other court shall deem proper.
Our certificate of incorporation provides that we will indemnify our directors and officers to the fullest extent permitted by law. Our certificate of incorporation also provides that the indemnification and advancement of expenses provided by, or granted pursuant to the certificate of incorporation, are not exclusive of any other rights to which those seeking indemnification or advancement of expenses may be entitled under any bylaw, agreement, vote of stockholders or otherwise. Section 145(f) of the DGCL further provides that a right to indemnification or to advancement of expenses arising under a provision of the certificate of incorporation shall not be eliminated or impaired by an amendment to such provision after the occurrence of the act or omission which is the subject of the civil, criminal, administrative or investigative action, suit or proceeding for which indemnification or advancement of expenses is sought.
We have also entered into indemnification agreements with certain of our directors and officers. Such agreements generally provide for indemnification by reason of being our director or officer, as the case may be. These agreements are in addition to the indemnification provided by our certificate of incorporation and bylaws.
The underwriting agreement provides that the underwriters are obligated, under certain circumstances, to indemnify our directors, officers and controlling persons against certain liabilities, including liabilities under the Securities Act. Please refer to the form of underwriting agreement filed as Exhibit 1.1 hereto.
We also maintain officers’ and directors’ liability insurance that insures against liabilities that our officers and directors may incur in such capacities. Section 145(g) of the DGCL provides that a corporation shall have power to purchase and maintain insurance on behalf of any person who is or was a director or officer of the corporation, or is or was serving at the request of the corporation as a director or officer of another entity, against any liability asserted against such person and incurred by such person in any such capacity, or arising out of such person’s status as such, whether or not the corporation would have the power to indemnify such person against such liability under that section.
| Item 15. | Recent sales of unregistered securities |
In the three years preceding the filing of this registration statement, the Registrant issued the following securities that were not registered under the Securities Act.
In fiscal year 2015, the Registrant sold 390,320 shares of common stock to certain of its directors and employees for aggregate consideration of approximately $2.0 million.
In fiscal year 2014, the Registrant sold 497,200 shares of common stock to one of its executive officers for aggregate consideration of $2.5 million.
In fiscal year 2016, the Registrant granted to its employees and consultants, an aggregate of 1,000,000 shares in connection with the exercise of options granted under its equity compensation plans, at exercise prices ranging from $7.44 to $8.11 per share.
In fiscal year 2015, the Registrant granted to its employees and consultants, an aggregate of 368,000 shares in connection with the exercise of options granted under its equity compensation plans, at exercise prices ranging from $5.43 to $7.44 per share.
II-2
Table of Contents
In fiscal year 2014, the Registrant granted to its employees and consultants options to purchase an aggregate of 2,236,000 shares under its equity compensation plans at exercise prices ranging from $4.43 to $5.03 per share.
Option grants and the issuances of common stock upon exercise of such options were exempt pursuant to Rule 701 and Section 4(a)(2) of the Securities Act.
| Item 16. | Exhibits and financial statement schedules |
| (a) | Exhibits |
See Exhibit Index following the signature page.
| (b) | Financial statement schedules |
See the Index to the Combined Financial Statements and the related notes thereto.
| Item 17. | Undertakings |
The undersigned Registrant hereby undertakes:
(1) That for purposes of determining any liability under the Securities Act of 1933, the information omitted from the form of prospectus filed as part of this registration statement in reliance upon Rule 430A and contained in a form of prospectus filed by the Registrant pursuant to Rule 424(b)(1) or (4) or 497(h) under the Securities Act of 1933 shall be deemed to be part of this registration statement as of the time it was declared effective.
(2) That for the purpose of determining any liability under the Securities Act of 1933, each post-effective amendment that contains a form of prospectus shall be deemed to be a new registration statement relating to the securities offered therein, and the offering of such securities at that time shall be deemed to be the initial bona fide offering thereof.
(3) To file, during any period in which offers or sales are being made, a post-effective amendment to this registration statement:
(i) to include any prospectus required by section 10(a)(3) of the Securities Act of 1933;
(ii) to reflect in the prospectus any facts or events arising after the effective date of this registration statement (or the most recent post-effective amendment thereof) which, individually or in the aggregate, represent a fundamental change in the information set forth in the registration statement. Notwithstanding the foregoing, any increase or decrease in volume of securities offered (if the total dollar value of securities offered would not exceed that which was registered) and any deviation from the low or high end of the estimated maximum offering range may be reflected in the form of prospectus filed with the Securities and Exchange Commission pursuant to Rule 424(b) if, in the aggregate, the changes in volume and price represent no more than a 20 percent change in the maximum aggregate offering price set forth in the “Calculation of Registration Fee” table in the effective registration statement; and
(iii) to include any material information with respect to the plan of distribution not previously disclosed in the registration statement or any material change to such information in the registration statement.
(4) For the purpose of determining liability under the Securities Act of 1933 to any purchaser, if the registrant is subject to Rule 430C, each prospectus filed pursuant to Rule 424(b) as part of a registration statement relating to an offering, other than registration statements relying on Rule 430B or other than prospectuses filed in reliance on Rule 430A, shall be deemed to be part of and included in the registration statement as of the date it is first used after effectiveness. Provided, however, that no statement made in a registration statement or prospectus that is part of the registration statement or made in a document incorporated
II-3
Table of Contents
or deemed incorporated by reference into the registration statement or prospectus that is part of the registration statement will, as to a purchaser with a time of contract of sale prior to such first use, supersede or modify any statement that was made in the registration statement or prospectus that was part of the registration statement or made in any such document immediately prior to such date of first use.
(5) The undersigned registrant undertakes that in a primary offering of securities of the undersigned registrant pursuant to this registration statement, regardless of the underwriting method used to sell the securities to the purchaser, if the securities are offered or sold to such purchaser by means of any of the following communications, the undersigned registrant will be a seller to the purchaser and will be considered to offer or sell such securities to such purchaser:
| (i) | Any preliminary prospectus or prospectus of the undersigned registrant relating to the offering required to be filed pursuant to Rule 424; |
| (ii) | Any free writing prospectus relating to the offering prepared by or on behalf of the undersigned registrant or used or referred to by the undersigned registrant; |
| (iii) | The portion of any other free writing prospectus relating to the offering containing material information about the undersigned registrant or its securities provided by or on behalf of the undersigned registrant; and |
| (iv) | Any other communication that is an offer in the offering made by the undersigned registrant to the purchaser. |
(6) Insofar as indemnification for liabilities arising under the Securities Act of 1933 may be permitted to directors, officers and controlling persons of the registrant pursuant to the foregoing provisions, or otherwise, the registrant has been advised that in the opinion of the Securities and Exchange Commission such indemnification is against public policy as expressed in the Act and is, therefore, unenforceable. In the event that a claim for indemnification against such liabilities (other than the payment by the registrant of expenses incurred or paid by a director, officer or controlling person of the registrant in the successful defense of any action, suit or proceeding) is asserted by such director, officer or controlling person in connection with the securities being registered, the registrant will, unless in the opinion of its counsel the matter has been settled by controlling precedent, submit to a court of appropriate jurisdiction the question whether such indemnification by it is against public policy as expressed in the Act and will be governed by the final adjudication of such issue.
II-4
Table of Contents
SIGNATURES
Pursuant to the requirements of the Securities Act of 1933, the registrant has duly caused this registration statement to be signed on its behalf by the undersigned, thereunto duly authorized, in the city of Milwaukee, Wisconsin on January 17, 2017.
| REV Group, Inc. | ||
| By: | /s/ Tim Sullivan | |
| Name: | Tim Sullivan | |
| Director and Chief Executive Officer | ||
***
Pursuant to the requirements of the Securities Act of 1933, this registration statement has been signed by the following persons in the capacities and on the dates indicated.
| Signature | Title | Date | ||
| /s/ Tim Sullivan Tim Sullivan |
Director and Chief Executive Officer (Principal Executive Officer) |
January 17, 2017 | ||
| * Dean Nolden |
Chief Financial Officer (Principal Financial Officer and Principal Accounting Officer) |
January 17, 2017 | ||
| * Paul Bamatter |
Director | January 17, 2017 | ||
| * Jean Marie “John” Canan |
Director | January 17, 2017 | ||
| * Dino Cusumano |
Director | January 17, 2017 | ||
| * Charles Dutil |
Director | January 17, 2017 | ||
| * Justin Fish |
Director | January 17, 2017 | ||
| * Kim Marvin |
Director | January 17, 2017 | ||
| * Joel Rotroff |
Director | January 17, 2017 | ||
II-5
Table of Contents
| Signature | Title | Date | ||
| * Donn Viola |
Director | January 17, 2017 | ||
| By: | /s/ Pamela S. Krop | |
| Pamela S. Krop Attorney-in-Fact |
II-6
Table of Contents
EXHIBIT INDEX
| Exhibit number |
Description of exhibit | |
| 1.1** | Form of Underwriting Agreement | |
| 3.1** | Form of Amended and Restated Certificate of Incorporation to be in effect prior to the consummation of the offering made under this Registration Statement | |
| 3.2** | Form of Amended and Restated Bylaws to be in effect prior to the consummation of the offering made under this Registration Statement | |
| 4.1** | Indenture dated October 21, 2013 among the Registrant, the guarantors party thereto and Wells Fargo Bank, National Association | |
| 5.1 | Opinion of Davis Polk & Wardwell LLP | |
| 10.1** | Form of Amended and Restated Shareholders Agreement | |
| 10.2** | Revolving Credit and Guaranty Agreement dated as of October 21, 2013 among the Registrant and the guarantors and lenders thereto | |
| 10.3** | Amendment No. 1 dated August 19, 2016 to the Revolving Credit and Guaranty Agreement dated as of October 21, 2013 among the Registrant and the guarantors and lenders thereto | |
| 10.4** | Allied Specialty Vehicles, Inc. 2010 Long-Term Incentive Plan | |
| 10.5** | Form of Directors and Executive Officer Indemnification Agreement | |
| 10.6** | Form of Registration Rights Agreement | |
| 10.7** | Form of Stock Option Award Agreement pursuant to the Allied Specialty Vehicles, Inc. 2010 Long-Term Incentive Plan | |
| 10.8** | Offer Letter, dated July 9, 2014, between American Industrial Partners and Timothy W. Sullivan | |
| 10.9** | Offer Letter, dated December 21, 2015, between the Registrant and Dean Nolden | |
| 10.10** | Offer Letter, dated October 9, 2014, between Allied Specialty Vehicles and Marcus Berto | |
| 10.11** | Offer Letter, dated February 5, 2016, between the Registrant and Thomas B. Phillips | |
| 10.12** | Offer Letter, dated February 5, 2016, between the Registrant and Barbara H. Stephens | |
| 10.13** | Offer Letter, dated April 25, 2014, between Allied Specialty Vehicles and James McGinn | |
| 10.14** | Transition and Consultancy Agreement, dated January 26, 2016, between the Registrant and James McGinn | |
| 10.15** | Professional Services Agreement, dated October 10, 2016, between the Registrant and R. Eugene Goodson | |
| 10.16** | REV Group, Inc. Cash Incentive Plan | |
| 10.17 | REV Group, Inc. 2016 Omnibus Incentive Plan | |
| 10.18** | Form of Restricted Stock Unit Award Agreement under REV Group, Inc. 2016 Omnibus Incentive Plan | |
| 10.19** | REV Group, Inc. Non-Employee Directors Compensation | |
| 23.1 | Consent of Independent Registered Public Accounting Firm | |
| 23.2 | Consent of Davis Polk & Wardwell LLP (included in Exhibit 5.1) | |
| 24.1** | Power of Attorney | |
| ** | Previously filed. |