Attached files
| file | filename |
|---|---|
| EX-99.2 - EXHIBIT 99.2 - MORGAN STANLEY | a51494060ex99_2.htm |
| EX-99.1 - EXHIBIT 99.1 - MORGAN STANLEY | a51494060ex99_1.htm |
| 8-K - MORGAN STANLEY 8-K - MORGAN STANLEY | a51494060.htm |
Exhibit 99.3

Strategic Update James P. Gorman, Chairman and Chief Executive Officer January 17, 2017

Notice The information provided herein may include certain non-GAAP financial measures. The reconciliation of such measures to the comparable GAAP figures are included in this presentation, or in Company’s Annual Report on Form 10-K, Definitive Proxy Statement, Quarterly Reports on Form 10-Q and the Company’s Current Reports on Form 8-K, as applicable, including any amendments thereto, which are available on www.morganstanley.com.This presentation may contain forward-looking statements including the attainment of certain financial and other targets and goals. You are cautioned not to place undue reliance on forward-looking statements, which speak only as of the date on which they are made, which reflect management’s current estimates, projections, expectations or beliefs and which are subject to risks and uncertainties that may cause actual results to differ materially. The Company does not undertake to update the forward-looking statements to reflect the impact of circumstances or events that may arise after the date of forward-looking statements. For a discussion of risks and uncertainties that may affect the future results of the Company, please see the Company’s most recent Annual Report on Form 10-K, Quarterly Reports on Form 10-Q and Current Reports on Form 8-K, as applicable, which are available on www.morganstanley.com. This presentation is not an offer to buy or sell any security.The End Notes are an integral part of this Presentation. See slides 16-18 for information related to the financial metrics in this presentation.Please note this presentation is available at www.morganstanley.com.

Mark to Market: 2017 Strategic Objectives(1) 1 Streamline: $1Bn Expense Reduction On Track for $1Bn in Expense Reduction by 2017 2 Complete Fixed Income Restructuring and Maintain Revenue Footprint Retained Revenue Footprint, with 25% Headcount Reduction and Reduced Resources 3 Wealth Mgmt. Pre-Tax Margin(2): 23 – 25% Achieved 22% Margin, Despite Transactional Revenue Headwinds 4 Increase Capital Return to Shareholders Received Non-Objection to Increase Dividend (+33%) and Buyback (+40%)(3) 5 ROE: 9 – 11% Ongoing 2016 Status Objective

2016 Performance: Progress Towards 9 – 11% ROE(1)(2) Earnings: $4.7Bn Avg. CE: $67Bn = 7.0% ROE(3) Earnings: $5.5Bn Avg. CE: $69Bn = 8.0% ROE(4) ROE: 9 11% 2017 Target
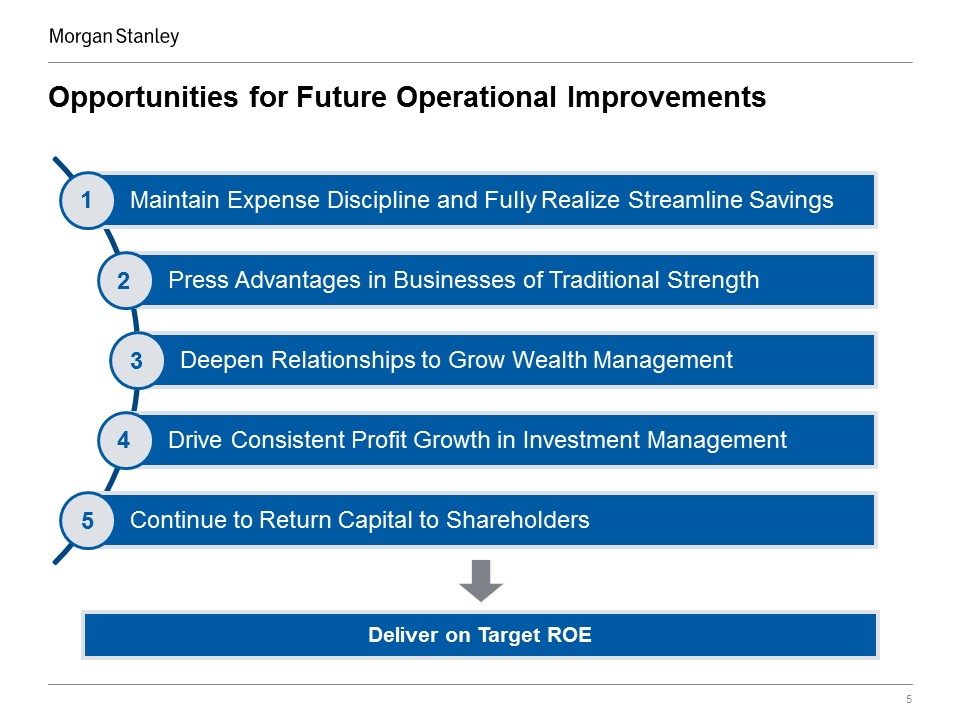
Opportunities for Future Operational Improvements 1 2 3 4 5 Deliver on Target ROE

1 2017 & Beyond Expect Continued Operating Leverage to Achieve 2017 Expense Efficiency Ratio Target of 74.0% Maintain Expense Discipline and Fully Realize Streamline Savings Focused on Operating Leverage Firm Revenues, ex-DVA ($Bn)(1) Reduced Non-Compensation Expenses by ~$700MM Maintained Compensation Discipline Grew PBT by 12% on Flat Revenues 77.2% 74.5% Expense Efficiency Ratio, ex-DVA(2): Pre-Tax Profit Compensation Expense Non-Compensation Expense

Leading Investment Banking Franchise Continued Strength in Advisory Upside from Normalization of Underwriting Industry Completed M&A Volumes ($Tn)(1) 2 IPOs Other Equity & Equity-Linked Industry Equity Underwriting Volumes ($Tn)(2) 19.4% 32.9% Morgan Stanley Increasing Market Share 8.8% 8.3% Morgan Stanley Retaining Market Share 2016: #2 In Global Announced & Completed M&A 2016: #2 in Global IPOs#2 in Global Equity & Equity Linked

One Management TeamLeveraging Best of Group Technology Across all Products and RegionsSharing and Optimizing Resources Sales & Trading Strategic Priorities SALES & TRADING Maintain #1 Global RevenueGrow Wallet ShareDeepen Prime Brokerage FootprintMonetize Relationships in Flow TradingFurther Build Asia FranchiseShifting Competitive Landscape Maintain Historical Revenue FootprintCapitalize on Client MomentumFocus on Strength of Team and Depth of BenchIncrease Trading VelocityShifting Competitive Landscape EQUITIES FIXED INCOME 2

2 ($78Bn) Monetizing Strength Across Equities Fixed Income Restructuring in Progress Equity Sales & Trading Total Wallet, ex-DVA ($Bn)(1)(2)(3) ($41Bn) Fixed Income and Commodities, ex-Lending ($Bn)(6)(7)(8) Fixed Income Sales & Trading Revenues, ex-DVA ($Bn)(5) Sales & Trading Positioned for Market Opportunities #1 Globally 3 Years RunningGained Share in 2014, 2015 and 2016 Opportunity to Deploy Balance Sheet Profitably Across the Franchise with Strong ReturnsClient Demand for Content, Liquidity, and Financing Solutions Restructuring Pro Forma Advanced RWA Pro Forma SLR Exposure 17% 20% Morgan Stanley Increasing Wallet Share (4)

3 Pre-Tax Margin (%) +13% (2) Expanded Margins Allow for Reinvestments into Profitable Growth Wealth Management Poised to Grow Wealth Management Has Achieved Several Critical Milestones Since the JV Franchise Growth 2017 Pre-Tax Margin(1) Target at 23-25%, Focus on Growing Pre-Tax Earnings Revenues ($Bn) 4% CAGR (2) Pre-Tax Earnings ($Bn) 22% CAGR (2)

3 Transactional Revenue ($Bn)(1) Wealth Management Revenue Headwinds Abating Upside From Increased Retail Engagement Continued Expense Leverage Additional Tailwind From Rising Rates Total Expenses ($Bn) Net Interest Income ($Bn) Compensation/Ratio(2) Non-Compensation 56.9% 56.5% 59.3% Low Rates Offset by Deployment Strategy Muted Investor Engagement Maintained Expense Base with Growing Revenues Operating Leverage Persists
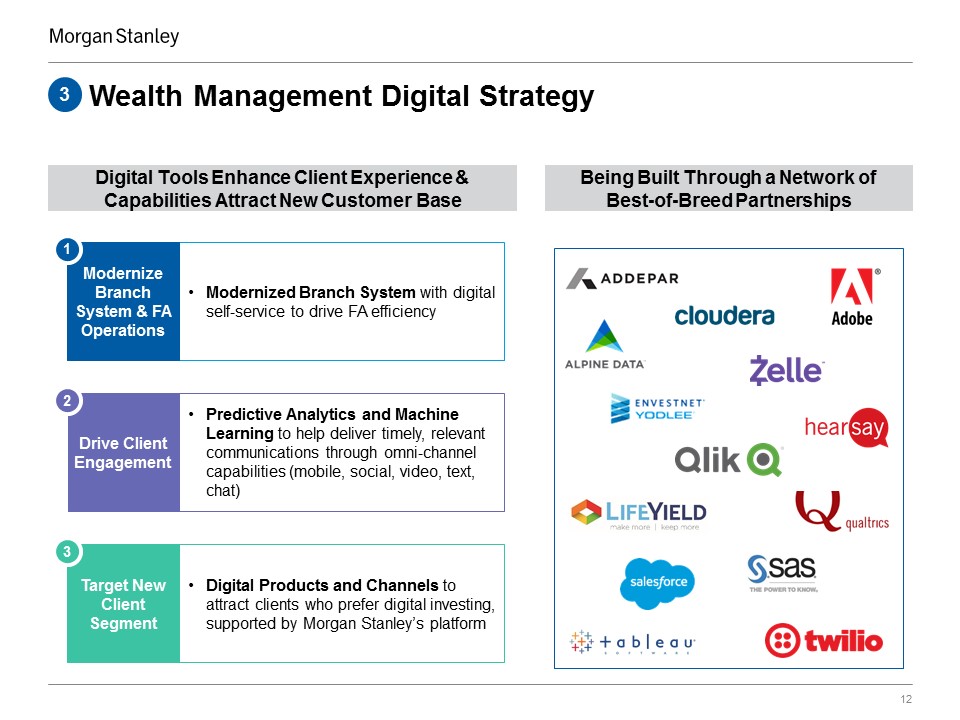
Wealth Management Digital Strategy Digital Tools Enhance Client Experience & Capabilities Attract New Customer Base Being Built Through a Network of Best-of-Breed Partnerships Modernized Branch System with digital self-service to drive FA efficiency Modernize Branch System & FA Operations 1 Predictive Analytics and Machine Learning to help deliver timely, relevant communications through omni-channel capabilities (mobile, social, video, text, chat) Drive Client Engagement 2 Digital Products and Channels to attract clients who prefer digital investing, supported by Morgan Stanley’s platform Target New Client Segment 3 3

Summary Margin Expansion and Growth Opportunities Consistent Margin Improvement Since the Acquisition of Smith Barney Key Drivers Additional Drivers Pre-Tax Margin (%)(1)(2) Merger Synergies Building the Bank Cost Discipline Annuitizing Revenues Retail Investor Engagement Rising Rates Lending Penetration Continued Cost Discipline Wallet Share Opportunities (3) 3

Investment Management Enters Period of Stability and Growth AUM$417Bn Organizational RealignmentRationalized Cost Base Legacy Third Party Fund LP Positions Enhance Distribution CapabilitiesU.S. Intermediary and AsiaSolutions & Partnerships FocusNew Product Launches Differentiated Alternative Origination PlatformLeverage Morgan Stanley ConnectivityGrowth with Limited Balance Sheet & Cost RequirementsSynergies and Efficiencies with Existing Platforms Balanced Business Mix Strategic Focus Growth Opportunities Traditional Public (Equity & Fixed Income) Solutions & Alternatives (Alternatives / Other Products) Liquidity 4

Capital Sufficiency… ...Supporting Growth in Capital Return Continue To Return Capital To Shareholders Total Capital Return ($Bn) Average Common Equity, ex-DVA ($Bn)(1) Common Dividends Buybacks 5

End Notes These notes refer to the financial metrics presented on Slide 3.Represents progress during the current calendar year against the 2017 Strategic Objectives established at the beginning of 2016.Pre-tax margin is a non-GAAP financial measure that the Company considers useful for investors to assess operating performance. Pre-tax margin represents income (loss) from continuing operations before taxes divided by Net Revenues.In June 2016, we received a conditional non-objection from the Federal Reserve to our 2016 capital plan. Pursuant to the conditional non-objection, we are able to execute the capital actions set forth in our 2016 capital plan, which include increasing our common stock dividend to $0.20 per share beginning in the third quarter of 2016 and executing share repurchases of $3.5 billion during the period July 1, 2016 through June 30, 2017. The Federal Reserve Board also asked us to submit an additional capital plan by December 29, 2016 addressing weaknesses identified in our capital planning process. Future capital distributions may be restricted if these identified weaknesses are not satisfactorily addressed when the Federal Reserve reviews our resubmitted capital plan. Our 2015 capital plan approved by the Federal Reserve was for share repurchases of $3,125 million for the periods 2Q15 through 2Q16 (for comparative purposes the percent change of buyback is based on 80% of the total 2015 approval representing 4 of the 5 approved quarters).These notes refer to the financial metrics presented on Slide 4.The calculation of return on equity (‘ROE’) uses net income applicable to Morgan Stanley less preferred dividends as a percentage of average common equity (‘Avg. CE’).ROE, and ROE, ex DVA and Discrete Tax Benefits are non-GAAP financial measures that the Firm considers useful for investors to assess operating performance.The 7% ROE for 2015 represents ROE excluding DVA and net discrete tax benefits (‘Discrete Tax Benefits’). To determine ROE, ex DVA and Discrete Tax Benefits both the numerator and denominator were adjusted to exclude these items.The 8% ROE for 2016 is unadjusted for DVA and net discrete tax benefits as those amounts had no impact on the ROE calculation. Effective January 1, 2016, pursuant to new accounting guidance that the Firm adopted, gains and losses from DVA are presented in other comprehensive income (i.e., a component of common equity) as opposed to net revenues and net income.These notes refer to the financial metrics presented on Slide 6.2015 Net Revenues were $34,537 million, excluding the positive impact of $618 million from DVA. Net Revenue, ex-DVA is a non-GAAP financial measure the Company considers useful for investors to allow better comparability of period to period operating performance.Firm Expense Efficiency ratio represents total non-interest expenses as a percentage of Net Revenues (or in 2015, Net Revenues, ex-DVA). For 2015, the Expense Efficiency ratio was calculated as non-interest expenses of $26,660 million, divided by Net Revenues of $34,537, which excludes the positive impact of $618 million from DVA for 2015. The Expense Efficiency ratio, ex-DVA is a non-GAAP financial measure the Company considers useful for investors to assess operating performance.These notes refer to the financial metrics presented on Slide 7.M&A Completed Industry volumes, M&A Completed Market Shares and M&A Completed and Announced League Table Rankings are from Thomson Reuters as of January 9, 2017. Market Share is calculated as the percentage of Morgan Stanley’s volume to the Industry volume. M&A Completed and Announced League Table Rankings are for the period of January 1, 2016 to December 31, 2016. Equity Underwriting Industry volumes, Equity Underwriting Market Shares and Equity Underwriting League Table Rankings are from Thomson Reuters. Each periods’ data is as of January of the following calendar year. Market Share is calculated as the percentage of Morgan Stanley’s volume to the Industry volume. Equity Underwriting League Table Rankings are for the period of January 1, 2016 to December 31, 2016.

End Notes These notes refer to the financial metrics presented on Slide 9.Total Wallet represents the aggregated reported net revenues for the following peers: Goldman Sachs, JP Morgan, Bank of America, Citigroup, UBS, Deutsche Bank, Credit Suisse, and Barclays. Morgan Stanley’s wallet share calculated as the percentage of Morgan Stanley’s Net Revenues, ex-DVA to Total Wallet. Equity Sales & Trading Net Revenues, ex DVA is a non-GAAP financial measure the Company considers useful for investors to allow better comparability of period to period operating performance.European peer results were translated to USD using average exchange rates for the appropriate period; sourced from S&P Capital IQ.Peer data has been adjusted for DVA, where it is reported and where applicable. Goldman Sachs results also exclude the Americas Reinsurance business in 2012 and 2013 and the gain on sale of a hedge fund administration business in 2012.Represents 2016 nine months Total Wallet annualized since not all peers have reported as of January 17, 2016.Fixed Income Sales & Trading Net Revenues, ex-DVA for the quarter ending December 31, 2015 were $550 million, excluding a $90 million negative impact from DVA in the quarter. Fixed Income Sales and Trading Net Revenues, ex-DVA is a non-GAAP financial measure the Company considers useful for investors to allow better comparability of period to period operating performance.All figures presented exclude RWAs and leverage exposure associated with lending activities.The Company estimates its pro forma fully phased-in Advanced risk-weighted assets (‘RWA’) and pro forma fully phased-in Supplementary Leverage Ratio (‘SLR’) exposure based on the Company’s current assessment of the Basel III final rules and other factors, including the Company’s expectations and interpretations of the proposed requirements, which may be subject to change as the Company receives additional clarification and guidance from the Federal Reserve. These pro forma computations are preliminary estimates as of January 17, 2016 and could be subject to revision in Morgan Stanley’s Annual Report on Form 10-K for the year ended December 31, 2016.Pro forma fully phased-in Advanced RWA and pro forma fully phased-in SLR Exposure, are non-GAAP financial measures that the Company considers to be useful measures to the Company and investors to evaluate compliance with future regulatory capital requirements.These notes refer to the financial metrics presented on Slide 10.Pre-tax margin represents income (loss) from continuing operations before taxes divided by Net Revenues. Pre-tax margin is a non-GAAP financial measure that the Company considers useful for investors to assess operating performance.Pro Forma 2010 data has been recast to exclude the Managed Futures and International Wealth Management businesses, which are now reported in the Investment Management and the Institutional Securities business segments, respectively.

End Notes These notes refer to the financial metrics presented on Slide 11.Transactional revenues include investment banking, trading, and commissions and fee revenues.Compensation ratio is calculated as compensation and benefits expense as a percentage of Net Revenues.These notes refer to the financial metrics presented on Slide 13.Pre-tax margin represents income (loss) from continuing operations before taxes divided by Net Revenues. Pre-tax margin is a non-GAAP financial measure that the Company considers useful for investors to assess operating performance. The attainment of margins in 2017 and beyond may be impacted by external factors that cannot be predicted at this time, including macroeconomic and market conditions and future regulations.All periods have been recast to exclude the Managed Futures business, which is now reported in the Investment Management business segment. Additionally, the periods 2010-2013 have been recast to exclude the International Wealth Management business, currently reported in the Institutional Securities business segment.Pre-tax margin for 2012 excludes $193 million of non-recurring costs in 3Q12 associated with the Morgan Stanley Wealth Management integration and the purchase of an additional 14% stake in the joint venture.These notes refer to the financial metrics presented on Slide 15.Represents the Firm’s average common equity excluding DVA for all periods prior to 2016. Average common equity excluding DVA is a non-GAAP financial measures that the Firm considers useful for investors to assess capital adequacy and capital returns.

Strategic Update James P. Gorman, Chairman and Chief Executive Officer January 17, 2017