Attached files
| file | filename |
|---|---|
| EX-99.1 - EX-99.1 - TENNECO INC | d325884dex991.htm |
| 8-K - 8-K - TENNECO INC | d325884d8k.htm |
| Exhibit 99.2
|
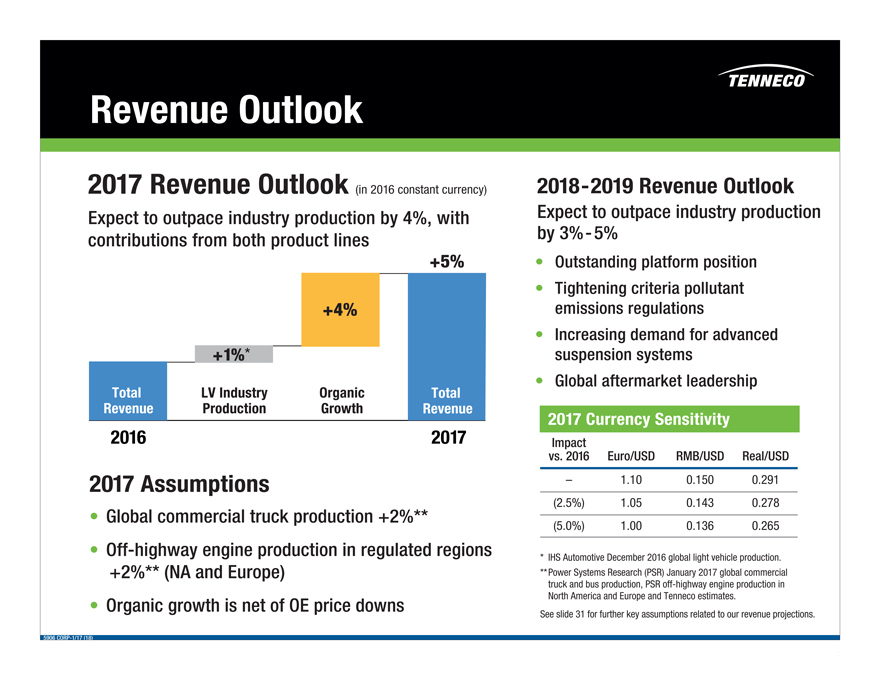
Exhibit 99.2 X Revenue Outlook
2017 Revenue Outlook (in 2016 constant currency) Expect to outpace industry production by 4%, with contributions from both product lines 2018-2019 Revenue Outlook Expect to outpace industry production by 3%-5%
Outstanding platform position Tightening criteria pollutant emissions regulations Increasing demand for advanced suspension systems Global aftermarket leadership +5% 2016 2017 Total Revenue Total Revenue +1%* +4% LV Industry Production Organic Growth 2017 Currency Sensitivity Impact vs. 2016 Euro/USD RMB/USD Real/USD – 1.10 0.150 0.291 (2.5%) 1.05 0.143 0.278 (5.0%) 1.00 0.136 0.265 * IHS Automotive December 2016 global light vehicle production. ** Power Systems Research (PSR) January 2017 global commercial truck and bus production, PSR off-highway engine production in North America and Europe and Tenneco estimates. See slide 31 for further key assumptions related to our revenue projections. 2017 Assumptions Global commercial truck production +2%** Off-highway engine production in regulated regions +2%** (NA and Europe) Organic growth is net of OE price downs 5906 CORP-1/17 (18)
|
|
X Tenneco’s Revenue Outlook Tenneco’s revenue outlook for 2017 is as of January 2017. Revenue assumptions are based on projected customer production schedules, IHS Automotive December 2016 forecasts, Power Systems Research January 2017 forecasts and Tenneco estimates. Tenneco’s revenue outlook for 2018 and 2019 is as of January 2017. Revenue assumptions are based on projected customer production schedules, IHS Automotive December 2016 forecasts, Power Systems Research January 2017 forecasts and Tenneco estimates. In addition to the information set forth on this slide and slide 18, Tenneco’s revenue outlook is based on the type of information set forth under “Outlook” in Item 7 – “Management’s Discussion and Analysis of Financial Condition and Results of Operations” as set forth in Tenneco’s Annual Report on Form 10-K for the year ended December 31, 2015. Please see that disclosure for further information. Key additional assumptions and limitations described in that disclosure include: • Revenue projections are based on original equipment manufacturers’ programs that have been formally awarded to the company; programs where the company is highly confident that it will be awarded business based on informal customer indications consistent with past practices; and Tenneco’s status as supplier for the existing program and its relationship with the customer. • Revenue projections are based on the anticipated pricing of each program over its life. • Revenue projections assume a fixed foreign currency value. This value is used to translate foreign business to the U.S. dollar. • Revenue projections are subject to increase or decrease due to changes in customer requirements, customer and consumer preferences, the number of vehicles actually produced by our customers and pricing. Tenneco’s revenue outlook constitutes a forward-looking statement. We also refer you to the cautionary language regarding our forward-looking statements set forth in the Safe Harbor statement on slide 2. 5906 CORP-1/17 (31)