Attached files
| file | filename |
|---|---|
| EX-23.8 - EX-23.8 - Extraction Oil & Gas, Inc. | a16-23479_1ex23d8.htm |
| EX-23.7 - EX-23.7 - Extraction Oil & Gas, Inc. | a16-23479_1ex23d7.htm |
| EX-23.6 - EX-23.6 - Extraction Oil & Gas, Inc. | a16-23479_1ex23d6.htm |
| EX-23.5 - EX-23.5 - Extraction Oil & Gas, Inc. | a16-23479_1ex23d5.htm |
| EX-23.4 - EX-23.4 - Extraction Oil & Gas, Inc. | a16-23479_1ex23d4.htm |
| EX-23.3 - EX-23.3 - Extraction Oil & Gas, Inc. | a16-23479_1ex23d3.htm |
| EX-23.2 - EX-23.2 - Extraction Oil & Gas, Inc. | a16-23479_1ex23d2.htm |
| EX-23.1 - EX-23.1 - Extraction Oil & Gas, Inc. | a16-23479_1ex23d1.htm |
| EX-15.1 - EX-15.1 - Extraction Oil & Gas, Inc. | a16-23479_1ex15d1.htm |
As filed with the Securities and Exchange Commission on January 6, 2017
Registration No. 333-215282
UNITED STATES
SECURITIES AND EXCHANGE COMMISSION
Washington, D.C. 20549
Amendment No. 1
to
Form S-1
REGISTRATION STATEMENT
UNDER
THE SECURITIES ACT OF 1933
Extraction Oil & Gas, Inc.
(Exact name of registrant as specified in its charter)
|
Delaware |
|
1311 |
|
46-1473923 |
370 17th Street, Suite 5300
Denver, Colorado 80202
(720) 557-8300
(Address, including zip code, and telephone number, including area code, of registrant’s principal executive offices)
Russell T. Kelley, Jr.
Chief Financial Officer
370 17th Street, Suite 5300
Denver, Colorado 80202
(720) 557-8300
(Name, address, including zip code, and telephone number, including area code, of agent for service)
Copies to:
Douglas E. McWilliams
Julian J. Seiguer
Vinson & Elkins L.L.P.
1001 Fannin, Suite 2500
Houston, Texas 77002
(713) 758-2222
Approximate date of commencement of proposed sale of the securities to the public:
As soon as practicable after the effective date of this Registration Statement.
If any of the securities being registered on this Form are to be offered on a delayed or continuous basis pursuant to Rule 415 under the Securities Act of 1933, check the following box: x
If this Form is filed to register additional securities for an offering pursuant to Rule 462(b) under the Securities Act, check the following box and list the Securities Act registration statement number of the earlier effective registration statement for the same offering. o
If this Form is a post-effective amendment filed pursuant to Rule 462(c) under the Securities Act, check the following box and list the Securities Act registration statement number of the earlier effective registration statement for the same offering. o
If this Form is a post-effective amendment filed pursuant to Rule 462(d) under the Securities Act, check the following box and list the Securities Act registration statement number of the earlier effective registration statement for the same offering. o
Indicate by check mark whether the registrant is a large accelerated filer, an accelerated filer, a non-accelerated filer, or a smaller reporting company. See the definitions of “large accelerated filer,” “accelerated filer” and “smaller reporting company” in Rule 12b-2 of the Exchange Act.
|
Large accelerated filer o |
Accelerated filer o |
Non-accelerated filer x |
Smaller reporting company o |
|
|
|
(Do not check if a |
|
The registrant hereby amends this registration statement on such date or dates as may be necessary to delay its effective date until the registrant shall file a further amendment which specifically states that this registration statement shall thereafter become effective in accordance with Section 8(a) of the Securities Act of 1933, as amended, or until this registration statement shall become effective on such date as the Securities and Exchange Commission, acting pursuant to said Section 8(a), may determine.
The information in this prospectus is not complete and may be changed. The selling stockholders may not sell these securities until the registration statement filed with the Securities and Exchange Commission is effective. This prospectus is not an offer to sell these securities and it is not soliciting an offer to buy these securities in any state where the offer or sale is not permitted.
SUBJECT TO COMPLETION DATED JANUARY 6, 2017
18,798,932 Shares

Extraction Oil & Gas, Inc.
Common Stock
This prospectus relates to the resale or other disposition of up to 18,798,932 shares of the common stock, par value $0.01, of Extraction Oil & Gas, Inc., a Delaware corporation, which may be offered for sale from time to time by the selling stockholders named in this prospectus. The shares of our common stock covered by this prospectus are to be issued by us to the selling stockholders upon conversion of our Series A Convertible Preferred Stock (the “Series A Preferred Stock”), including any shares of Series A Preferred Stock that may be issued pursuant to our option to pay dividends on the Series A Preferred Stock in kind pursuant to the terms of the Certificate of Designations setting forth the terms of the Series A Preferred Stock. We are not selling any shares of our common stock under this prospectus and will not receive any proceeds from the sale of any shares of common stock by the selling stockholders.
Our common stock trades on the NASDAQ Global Select Market under the symbol “XOG.” The last reported sales price of our common stock on January 5, 2017 was $19.90 per share. You are urged to obtain current market quotations for the common stock.
The selling stockholders may from time to time sell, transfer or otherwise dispose of any or all of their shares of common stock in a number of different ways and at varying prices. See “Plan of Distribution” for more information.
We may amend or supplement this prospectus from time to time by filing amendments or supplements as required. You should read this entire prospectus and any amendments or supplements carefully before you make your investment decision.
We are an “emerging growth company” as defined in the Jumpstart Our Business Startups Act of 2012.
Investing in our common stock involves risks. Please see “Risk Factors” beginning on page 18 of this prospectus.
Neither the Securities and Exchange Commission nor any state securities commission has approved or disapproved of these securities or passed on the adequacy or accuracy of this prospectus. Any representation to the contrary is a criminal offense.
The date of this prospectus is , 2017.
|
|
Page |
|
|
|
|
1 | |
|
18 | |
|
44 | |
|
46 | |
|
47 | |
|
48 | |
|
MANAGEMENT’S DISCUSSION AND ANALYSIS OF FINANCIAL CONDITION AND RESULTS OF OPERATIONS |
50 |
|
83 | |
|
108 | |
|
114 | |
|
126 | |
|
130 | |
|
133 | |
|
137 | |
|
MATERIAL U.S. FEDERAL INCOME TAX CONSIDERATIONS FOR NON-U.S. HOLDERS |
140 |
|
144 | |
|
146 | |
|
146 | |
|
147 | |
|
F-1 | |
|
A-1 |
This prospectus is part of a registration statement that we have filed with the Securities and Exchange Commission (the “SEC”) pursuant to which the selling stockholders named herein may, from time to time, offer and sell or otherwise dispose of the shares of our common stock covered by this prospectus. You should not assume that the information contained in this prospectus is accurate on any date subsequent to the date set forth on the front cover of this prospectus or that any information we have incorporated by reference is correct on any date subsequent to the date of the document incorporated by reference, even though this prospectus is delivered or shares of common stock are sold or otherwise disposed of on a later date. It is important for you to read and consider all information contained in this prospectus, including the documents incorporated by reference therein, in making your investment decision. You should also read and consider the information in the documents to which we have referred you under the caption “Where You Can Find Additional Information” in this prospectus.
Neither we nor the selling stockholders have authorized any dealer, salesman or other person to give any information or to make any representation other than those contained or incorporated by reference in this prospectus. You must not rely upon any information or representation not contained or incorporated by reference in this prospectus. This prospectus does not constitute an offer to sell or the solicitation of an offer to buy any of our shares of common stock other than the shares of our common stock covered hereby, nor does this prospectus constitute an offer to sell or the solicitation of an offer to buy any securities in any jurisdiction to any person to whom it is unlawful to make such offer or solicitation in such jurisdiction.
This prospectus contains forward-looking statements that are subject to a number of risks and uncertainties, many of which are beyond our control. Please see “Risk Factors” and “Cautionary Note Regarding Forward-Looking Statements.”
BASIS OF PRESENTATION
The financial information and certain other information presented in this prospectus have been rounded to the nearest whole number or the nearest decimal. Therefore, the sum of the numbers in a column may not conform
exactly to the total figure given for that column in certain tables in this prospectus. In addition, certain percentages presented in this prospectus reflect calculations based upon the underlying information prior to rounding and, accordingly, may not conform exactly to the percentages that would be derived if the relevant calculations were based upon the rounded numbers or may not sum due to rounding.
PRESENTATION OF FINANCIAL AND OPERATING DATA
Extraction Oil & Gas Holdings, LLC, a Delaware limited liability company and our accounting predecessor, was formed on May 29, 2014 by PRE Resources, LLC (“PRL”) as a holding company with no independent operations. Extraction Oil & Gas, LLC, formerly a wholly owned subsidiary of PRL, was a wholly owned subsidiary of Extraction Oil & Gas Holdings, LLC. Extraction Oil & Gas, LLC was formed on November 14, 2012 as a Delaware limited liability company. Concurrent with the formation of Extraction Oil & Gas Holdings, LLC, PRL contributed all of its membership interests in Extraction Oil & Gas, LLC, to Extraction Oil & Gas Holdings, LLC and distributed all of its interests in Extraction Oil & Gas Holdings, LLC to its members in a pro rata distribution (the “Reorganization”). The Reorganization was accounted for as a reorganization of entities under common control and the assets and liabilities of Extraction Oil & Gas, LLC were recorded at Extraction Oil & Gas, LLC’s historical costs. The historical consolidated financial statements presented in this prospectus have been retrospectively recast for all periods prior to May 29, 2014 to reflect the Reorganization as if the transfer of net assets occurred at the beginning of the period. Results of operations for the 2014 period presented in this prospectus include the results of operations from Extraction Oil & Gas, LLC, the previously separate entity, from January 1, 2014 to May 29, 2014, the date the transfer was completed. In connection with the consummation of the initial public offering of Extraction Oil & Gas, Inc. (the “IPO”), Extraction Oil & Gas Holdings, LLC was merged with and into Extraction Oil & Gas, LLC, with such merger being treated as a reorganization of entities under common control, and Extraction Oil & Gas, LLC converted from a Delaware limited liability company into a Delaware corporation, Extraction Oil & Gas, Inc.
Locations in this document presented at 1-mile (approximately 4,200 feet), 1.5-mile (approximately 6,800 feet) and 2-mile (approximately 9,400 feet) equivalents are shown to present the actual length of such lateral lengths after accounting for the setback distance on each side of the lease line.
WATTENBERG FIELD
References herein to the “Wattenberg Field” or the “Wattenberg” refer to the Greater Wattenberg Area within the Denver-Julesburg Basin of Colorado as defined by the Colorado Oil and Gas Conservation Commission (the “COGCC”). The COGCC defines the Greater Wattenberg Area as those lands from and including Townships 2 South to 7 North and Ranges 61 West to 69 West, Sixth Principal Meridian.
INDUSTRY AND MARKET DATA
The market data and certain other statistical information used throughout this prospectus are based on independent industry publications, government publications and other published independent sources. Although we believe these third-party sources are reliable as of their respective dates, neither we nor the selling stockholders have independently verified the accuracy or completeness of this information. The industry in which we operate is subject to a high degree of uncertainty and risk due to a variety of factors, including those described in the section entitled “Risk Factors.” These and other factors could cause results to differ materially from those expressed in these publications.
TRADEMARKS AND TRADE NAMES
We own or have rights to various trademarks, service marks and trade names that we use in connection with the operation of our business. This prospectus may also contain trademarks, service marks and trade names of third parties, which are the property of their respective owners. Our use or display of third parties’ trademarks, service marks, trade names or products in this prospectus is not intended to, and does not imply a relationship with, or endorsement or sponsorship by us. Solely for convenience, the trademarks, service marks and trade names referred to in this prospectus may appear without the ®, TM or SM symbols, but such references are not intended to indicate, in any way, that we will not assert, to the fullest extent under applicable law, our rights or the rights of the applicable licensor to these trademarks, service marks and trade names.
This summary highlights information contained elsewhere in this prospectus or incorporated by reference into this prospectus. You should read the entire prospectus carefully before making an investment decision, including the information under the headings “Risk Factors,” “Cautionary Note Regarding Forward-Looking Statements,” “Information Incorporated by Reference” and “Management’s Discussion and Analysis of Financial Condition and Results of Operations” and the historical and pro forma financial statements and the related notes thereto appearing elsewhere in this prospectus. References to our estimated proved reserves as of June 30, 2016 and as of December 31, 2015 and 2014 are derived from our proved reserve reports prepared by Ryder Scott Company, L.P. (“Ryder Scott”) for Extraction Oil & Gas Holdings, LLC.
Unless indicated otherwise or the context otherwise requires, references in this prospectus to “Extraction,” the “Company,” “us,” “we,” “our,” or “ours” or like terms refer to Extraction Oil & Gas, Inc. following the completion of our corporate reorganization as described in “—Corporate Reorganization.” When used in the historical context, “Extraction,” the “Company,” “us,” “we,” “our” and “ours” or like terms refer to Extraction Oil & Gas Holdings, LLC and its subsidiaries for periods after May 29, 2014 but prior to the corporate reorganization as described in “—Corporate Reorganization.” and to Extraction Oil & Gas, LLC and its subsidiaries prior to May 29, 2014. References in this prospectus to “Holdings” refer to Extraction Oil & Gas Holdings, LLC, our accounting predecessor, which before the completion of our corporate reorganization owned 100% of the equity interests of Extraction Oil & Gas, LLC. Unless indicated otherwise or the context otherwise requires, references to our net acreage, drilling locations, well count, working interest and our estimated average net daily production as of September 30, 2016 and our proved reserves as of June 30, 2016 in this prospectus are adjusted to give pro forma effect to the transactions described in “—Recent Developments—Bayswater Acquisition—Bayswater Assets.” Unless indicated otherwise or the context otherwise requires, references to the ownership of our common stock following the completion of the IPO are not adjusted to give effect to the conversion of the Series A Preferred Stock as described under “—Recent Developments—Convertible Preferred Securities.”
Overview
We are an independent oil and gas company focused on the acquisition, development and production of oil, natural gas and natural gas liquid (“NGL”) reserves in the Rocky Mountains, primarily in the Wattenberg Field of the Denver-Julesburg Basin (the “DJ Basin”) of Colorado. The Wattenberg Field has been producing since the 1970s and is a premier North American oil and natural gas basin characterized by high recoveries relative to drilling and completion costs, high initial production rates, long reserve life and multiple stacked producing horizons. We have assembled, as of September 30, 2016, approximately 100,000 net acres of large, contiguous acreage blocks in some of the most productive areas of the Wattenberg Field as indicated by the results of our horizontal drilling program and the results of offset operators. These properties have extensive production histories, high drilling success rates, and significant horizontal development potential. We believe our acreage in the Wattenberg Field has been significantly delineated by our own drilling success and by the success of offset operators, providing confidence that our inventory is relatively low-risk, repeatable and will continue to generate economic returns. We are primarily focused on growing our proved reserves and production primarily through the development of our large inventory of identified liquids-rich horizontal drilling locations in the Wattenberg Field.
We were founded in November 2012 with the objective of becoming a Wattenberg-focused company with acreage that has (i) low development risk as a result of being within the vicinity of other successful wells drilled by other oil and gas companies, (ii) limited vertical well drainage relative to offset operators in a field with significant historical vertical activity, and (iii) higher oil content than was traditionally targeted when many operators first established their position in the field seeking natural gas production. We believe these characteristics enhance our horizontal production capabilities, recoveries and economic results. Our drilling economics are further enhanced by our ability to drill longer laterals due to our large contiguous acreage position, which our management team built through organic leasing and a series of strategic acquisitions. We operated 96% of our horizontal production for the nine months ended September 30, 2016 and maintain control of a large majority of our drilling inventory. In addition, we proactively seek to secure the necessary midstream and operational infrastructure to keep pace with our production growth.
As of September 30, 2016, we have drilled 293 gross one-mile equivalent horizontal wells and have completed 245 gross one-mile equivalent horizontal wells. We are currently running an effective three-rig program and retain the flexibility to adjust our rig count based on the commodity price environment. We have demonstrated our ability to manage a drilling program of larger size, operating four rigs from time to time on a spot basis. Due to significant improvements in our drilling efficiency since late 2014, each of our rigs is currently able to drill over twice as many wells per year as we were previously able to drill. Our estimated average net daily production during the three months ended September 30, 2016 was approximately 37,600 BOE/d. The charts below demonstrate the substantial growth in our average net daily production and well count since the second quarter of 2014.
|
Average Net |
|
Wells Drilled and Completed(1) |
|
|
|
|
|
|
|
|
(1) Reflects one-mile equivalent wells drilled or completed by us.
(2) Reflects 28,948 BOE/d attributable to our historically owned properties and approximately 8,600 BOE/d attributable to the Bayswater Assets (as defined below).
The following table provides summary information regarding our proved reserves as of June 30, 2016, and our estimated average net daily production during the three months ended September 30, 2016.
|
Estimated Total Proved Reserves |
|
Average |
|
|
| ||||||||||||
|
Oil |
|
Natural |
|
NGL |
|
Total |
|
% |
|
% |
|
% |
|
Production |
|
R/P Ratio |
|
|
79,111 |
|
365,702 |
|
47,227 |
|
187,288 |
|
42 |
% |
67 |
% |
23 |
% |
37,600 |
|
14.1 |
|
(1) Includes de minimis reserves and production attributable to properties in our Northern Extension Area. Please see “—Other Properties.”
(2) Includes both oil and NGL.
(3) Estimated average net daily production. Consisted of approximately 48% oil, 30% natural gas and 22% NGL.
(4) Represents the number of years proved reserves would last assuming production continued at the average rate for the three months ended September 30, 2016. Because production rates naturally decline over time, the reserve-to-production ratio (the “R/P Ratio”) is not a useful estimate of how long properties should economically produce.
Our management team has significant experience in the Wattenberg Field. Our management team members were key participants in the shift from vertical to horizontal drilling that recently occurred during their tenures at key Wattenberg operators, such as Anadarko Petroleum Corporation (“Anadarko Petroleum”), Noble Energy, Inc. (“Noble Energy”), PDC Energy, Inc. (“PDC Energy”) and others. Our management and technical teams have collectively participated in the drilling of over 500 horizontal wells in the Niobrara and Codell formations in the Wattenberg Field. To date, we have focused our horizontal drilling program primarily in the Niobrara and Codell formations; however, based on results from our horizontal drilling program and those of offset operators such as Anadarko Petroleum and Noble Energy, we believe significant development opportunities exist in the J-Sand, Greenhorn and Sussex formations. In addition, based on our current permitting activities, we believe that, via additional downspacing in the Niobrara formation, we could have up to approximately 600 additional drilling locations, which are not captured in the inventory numbers below. As of September 30, 2016, we had a drilling
inventory consisting of 3,929 gross (2,575 net) identified locations within the Wattenberg Field, as adjusted to one-mile equivalents. The table below sets forth a summary of our identified gross horizontal drilling locations in the Wattenberg Field by target zone as of September 30, 2016.
|
|
|
Identified Gross Horizontal Drilling Locations(1)(2) |
|
Horizontal Drilling |
| ||||
|
Net Acreage(3) |
|
Niobrara |
|
Codell |
|
Total(4)(5) |
|
Inventory (Years)(6) |
|
|
100,000 |
|
2,532 |
|
1,397 |
|
3,929 |
|
14.3 |
|
(1) As adjusted for lateral length to present one-mile equivalents (approximately 4,200 feet). Please see “Business—Drilling Locations” for more information regarding the process and criteria through which these drilling locations were identified. The drilling locations on which we actually drill will depend on the availability of capital, regulatory approvals, takeaway capacity, commodity prices, costs, actual drilling results and other factors. Any drilling activities we are able to conduct on these identified locations may not be successful and may not result in the addition of proved reserves to our existing proved reserves base. See “Risk Factors—Risks Related to the Oil, Natural Gas and NGL Industry and Our Business—Our identified drilling locations are scheduled over many years, making them susceptible to uncertainties that could materially alter the occurrence or timing of their drilling. In addition, we may not be able to raise the substantial amount of capital that would be necessary to drill such locations.”
(2) Includes 159 drilled but uncompleted one-mile equivalent wells.
(3) As of September 30, 2016. Approximate net acreage represents only our oil and gas properties in the Wattenberg Field and does not include the approximately 120,000 net acres associated with our Northern Extension Area. We have not identified any drilling locations at this time on our Northern Extension Area. Please see “—Other Properties.”
(4) Includes 918 identified drilling locations associated with proved undeveloped reserves as of September 30, 2016, as adjusted for lateral length to present one-mile equivalents (approximately 4,200 feet).
(5) If converted to 1.5-mile equivalent locations (approximately 6,800 feet), we would have an estimated 2,619 identified gross horizontal drilling locations. If converted to 2.0-mile equivalent locations (approximately 9,400 feet), we would have an estimated 1,965 identified gross horizontal drilling locations.
(6) Based on a continuous three rig drilling program and a four day spud-to-spud drilling time.
Other Properties
We hold approximately 120,000 net acres in the DJ Basin outside of the Wattenberg, which we refer to as our “Northern Extension Area,” that we believe is prospective for many of the same formations as our properties in the Wattenberg Field. As of September 30, 2016, there were de minimis proved reserves associated with this acreage. Average daily production associated with these properties for the quarter ended September 30, 2016 was approximately 663 BOE/d. We have not identified any drilling locations at this time on our Northern Extension Area.
Historical Capital Expenditures and Capital Budget
For the year ended December 31, 2015 and the nine months ended September 30, 2016, our aggregate drilling, completion and leasehold capital expenditures were approximately $398.4 million and $203.1 million, respectively, excluding acquisitions. We intend to allocate approximately $335.0 million of our 2016 capital budget to the drilling of 100 gross (90 net) wells and the completion of 92 gross (82 net) wells, approximately $5.0 million to midstream, and approximately $25.0 million to leaseholds. As of September 30, 2016, 69 gross (60 net) of the 100 gross (90 net) budgeted have been drilled, and 55 gross (44 net) of the 92 gross (82 net) wells have been completed. Our capital budget excludes any amounts that were or may be paid for potential acquisitions, including the Bayswater Acquisition.
Our 2017 capital budget is approximately $795-935 million, substantially all of which we intend to allocate to the DJ Basin. We intend to allocate approximately $675-775 million of our 2017 capital budget to the drilling of 185-190 gross operated wells and the completion of 190-195 gross operated wells, approximately $60-80 million to land, midstream and other uses, and approximately $60-80 million to non-operated drilling and completion. We are currently running an effective three-rig program.
The amount and timing of these capital expenditures is within our control and subject to our management’s discretion. We retain the flexibility to defer a portion of these planned capital expenditures depending on a variety of factors, including but not limited to the success of our drilling activities, prevailing and anticipated prices for oil, natural gas and NGL, the availability of necessary equipment, infrastructure and capital, the receipt and timing of
required regulatory permits and approvals, seasonal conditions, drilling and acquisition costs and the level of participation by other interest owners. Any postponement or elimination of our development drilling program could result in a reduction of proved reserve volumes and related standardized measure. These risks could materially affect our business, financial condition and results of operations.
Our Business Strategies
Our business strategy is to increase stockholder value through the following:
· Grow proved reserves and production by developing our extensive horizontal drilling inventory. As of September 30, 2016, we identified a horizontal drilling inventory of 3,929 gross locations targeting the Niobrara and Codell zones, as adjusted to one-mile equivalents. While horizontal development of the Wattenberg Field is a relatively recent development, we consider our large inventory of horizontal drilling locations in the Wattenberg Field to be relatively low-risk based on information gained from the large number of existing wells in the area, industry activity surrounding our acreage, and the consistent and predictable geology surrounding our positions. We believe the combination of our large inventory of relatively low-risk drilling locations with long-lived reserves leads to a predictable production profile. We are able to enhance our drilling economics and generate higher EURs per well drilled by taking advantage of our large contiguous acreage position to drill longer laterals. Based on results from our horizontal drilling program and those of offset operators such as Anadarko Petroleum and Noble Energy, we believe significant development opportunities exist in the J-Sand, Greenhorn and Sussex formations as well as via additional downspacing in the Niobrara formation, thus potentially increasing our horizontal drilling inventory significantly.
· Maintain a high degree of operational control in order to continuously improve operating and cost efficiencies. We operated approximately 96% of our horizontal production for the nine months ended September 30, 2016 and intend to maintain operational control of substantially all of our producing properties. We believe that retaining control of our production enables us to increase recovery rates, lower well costs, improve drilling performance and increase ultimate hydrocarbon recovery through optimization of our drilling and completion techniques. Additionally, operating our production allows us to more efficiently manage the pace of our horizontal development program and the gathering and marketing of our production. We continually monitor and adjust our drilling program with the objective of achieving the highest total returns on our portfolio of drilling opportunities.
· Leverage our experience operating in the Wattenberg Field to maximize returns. Members of our management and technical teams have spent the majority of their careers focused on operations in the Wattenberg Field. These team members were key participants in the shift from vertical to horizontal drilling that recently occurred during their tenures at key Wattenberg operators, including Anadarko Petroleum, Noble Energy, PDC Energy and others. As a result, we believe our management and technical teams are among the best operators in the Wattenberg Field today. Our team regularly benchmarks our operating data in order to evaluate our performance and identify opportunities to optimize our drilling and completion techniques and make informed decisions about our capital program and drilling activity levels. We intend to leverage our management and technical teams’ experiences in applying unconventional drilling and completion techniques in the Wattenberg Field to maximize our returns. As an example, our management team initially designed and utilized new and improved drilling and completion techniques, which were different than the industry standard, to avoid having to compete with larger operators on prices for services and products.
· Continue expanding our access to midstream infrastructure to keep pace with our production growth. We proactively seek to secure the necessary midstream and operational infrastructure necessary to support our drilling schedule and keep pace with our expected production growth. We are an anchor tenant on the Grand Mesa pipeline, which transports oil and gas out of the Wattenberg Field to Cushing, Oklahoma. We are committed to meet delivery commitments of 40,000 Bbls/d out of the basin, increasing to 58,000 Bbls/d by November 2018 and through 2026. Upon closing the Bayswater Acquisition, we became subject to two additional long-term crude oil delivery commitments, one for a term of seven years and one for a term of
five years. We have total delivery commitment obligations of 5,000 Bpd in year one and 3,800 Bpd in year two through seven.
· Strategically augment acreage position through opportunistic acquisitions. Since inception, we have consummated six significant acquisitions in the Wattenberg Field, acquiring approximately 76,100 net acres, as of September 30, 2016. We intend to continue to strategically make opportunistic acquisitions as well as pursue additional leasing opportunities to further supplement our oil and natural gas properties, but expect such expenditures to represent a smaller proportion of our total capital budget.
· Maintain financial flexibility and apply a disciplined approach to capital allocation. We intend to maintain a conservative financial profile that will afford us flexibility through commodity price cycles. As of September 30, 2016, after giving effect to the Bayswater Acquisition, the issuance of the Convertible Preferred Securities, the IPO, the Private Placement and our recent increase to the borrowing base of our revolving credit facility, each as described below, we have approximately $1,267.7 million of liquidity, with $792.7 million of cash and cash equivalents and $475.0 million of available borrowing capacity under our revolving credit facility. Consistent with our disciplined approach to financial management, we have an active commodity hedging program that seeks to reduce our exposure to downside commodity price fluctuations, enabling us to protect cash flows and maintain liquidity to fund our capital program and investment opportunities.
Our Competitive Strengths
We believe that the following strengths will allow us to successfully execute our business strategies:
· Large, contiguous acreage blocks concentrated in the Wattenberg Field. We own extensive and contiguous acreage blocks in the Wattenberg Field, which we believe to be one of the most prolific and economic fields in the nation. Based on the results of our horizontal drilling program, and as evidenced by our 30-day, 90-day and 180-day production rates, we believe our wells are among the most productive in the Wattenberg Field. Our large, contiguous acreage blocks and focus on maintaining operational control allow us the flexibility to adjust our drilling and completion techniques, primarily through the length of our laterals, in order to optimize our well results and drilling economics. Additionally, our contiguous acreage allows us to leverage existing infrastructure for more cost efficient development and transportation as compared to non-contiguous acreage. We believe our approximately 100,000 net acres in the Wattenberg Field as of September 30, 2016 position us to continue growing our proved reserves and production in the current commodity price environment.
· Low-risk Wattenberg acreage position with multi-year inventory of liquids-rich drilling locations. We view our large identified horizontal drilling inventory targeting liquids-rich drilling opportunities to be relatively low-risk based on information gained from the large number of existing wells in the area, industry activity surrounding our acreage, and the consistent and predictable geology underlying our positions. We have used the subsurface and 3-D seismic data from our development programs, as well as vertical well penetration, to demonstrate the subsurface consistency of our inventory. We currently have 3-D seismic data on all locations in our drilling plan, which we believe reduces the risk associated with our development plan. As of September 30, 2016, our horizontal drilling inventory consisted of 3,929 gross (2,575 net) identified locations targeting the Niobrara and Codell formations, as adjusted to one-mile equivalents. Based on the results from our horizontal drilling program and those of offset operators such as Anadarko Petroleum and Noble Energy, we believe significant development opportunities exist in the J-Sand, Greenhorn and Sussex formations as well as via additional downspacing in the Niobrara formation. Based on a four day spud-to-spud and a three-rig drilling program, we have a drilling inventory of approximately 14.3 years, prior to considering locations other than those in the Niobrara and Codell formations.
· Significant operational control with low development costs. We operated 96% of our horizontal production for the nine months ended September 30, 2016. We intend to maintain operational control of a substantial majority of our drilling inventory. We believe that maintaining operating control enables us to increase our reserves while lowering our development costs. Our control over operations also allows us to
utilize cost-effective operating practices, including the selection of drilling locations, timing of development and associated capital expenditures and continuous improvement of drilling, completion and stimulation techniques. We have been successful in achieving significant reductions in our drilling, completion and facilities costs. In addition, our drilling contract structure allows us to proactively adjust our rig count based on the commodity price environment. These factors contribute to our ability to grow production and reserves in lower commodity price environments.
· High caliber management team with substantial technical expertise and demonstrated record navigating through commodity price volatility. Our management and technical teams have extensive experience and a history of working together on the cost-efficient management of large scale drilling programs in the Wattenberg Field. Our management and technical teams are also experienced in the disciplined allocation of capital focused on growing reserves and production and identifying, executing and integrating acquisitions. Members of our management team have significant experience in the Wattenberg Field and were key participants in the shift from vertical to horizontal drilling that recently occurred during their tenures at industry leaders, including Anadarko Petroleum, Noble Energy, PDC Energy and others. Our management and technical teams have collectively participated in the drilling of over 500 horizontal wells in the Niobrara and Codell formations in the field. Through the significant decrease and volatility in commodity prices in late 2014, we have demonstrated our ability to responsibly grow our production and proved reserves while maintaining a conservative balance sheet.
· Financial strength and flexibility. We have a strong financial position and a prudent financial management strategy, which will allow us to actively allocate capital in order to grow our proved reserves and production, both organically and through strategic acquisitions. As of September 30, 2016, after giving effect to the Bayswater Acquisition, the issuance of the Convertible Preferred Securities, the IPO, the Private Placement and our recent increase to the borrowing base of our revolving credit facility, we have approximately $1,267.7 million of liquidity, with $792.7 million of cash and cash equivalents and $475.0 million of available borrowing capacity under our revolving credit facility. We believe this borrowing capacity, along with our cash flow from operations and existing cash on the balance sheet, will provide us with sufficient liquidity to execute on our 2017 capital program. We have an established hedging program to protect our future cash flows and provide some certainty for the budgeting of our capital plan.
Recent Developments
Initial Public Offering
On October 17, 2016, we completed an initial public offering of 33,333,333 shares of our common stock at a price to the public of $19.00 per share and we became a publicly traded company listed on NASDAQ under the ticker symbol “XOG”. After deducting underwriting discounts and commissions and estimated offering expenses payable by us, we received approximately $683.7 million of aggregate net proceeds from our initial public offering after the underwriters exercised their option on October 24, 2016 to purchase 5,000,000 additional shares in full.
Bayswater Acquisition
Bayswater Assets
On July 29, 2016, we entered into a definitive agreement with Bayswater Exploration & Production, LLC and certain of its affiliates to acquire additional oil and gas properties primarily located in the Wattenberg Field (the “Bayswater Assets”) for total consideration of approximately $419 million in cash after customary purchase price adjustments (the “Bayswater Acquisition”). Upon completion of the Bayswater Acquisition, we acquired producing and non-producing assets primarily located in the central and northwest portions of the Wattenberg Field from an existing working interest partner, primarily around our existing Greeley and Windsor areas.
The Bayswater Assets consist of working interests in approximately 6,100 net acres and produced approximately 8,600 net BOE/d for the three months ended September 30, 2016. As of July 29, 2016, the Bayswater Assets included 36 gross (20 net) drilled but uncompleted wells, representing 53 gross (32 net) wells on a 1-mile equivalent basis. We expect the majority of these drilled but uncompleted wells to be brought online in the first half of 2017. In addition, the Bayswater Assets will result in an additional 1,119 gross drilling locations (or 119 net
locations on a 1-mile equivalent basis). A majority of these locations are located on acreage in which we already own a majority working interest and operate, resulting in an additional 90 unique gross drilling locations and 30 drilled but uncompleted wells. Upon closing the Bayswater Acquisition, we became subject to two additional long-term crude oil delivery commitments, one for a term of seven years and one for a term of five years. We have total delivery commitment obligations of 5,000 Bpd in year one and 3,800 Bpd in year two through seven.
Based on a reserve report from Ryder Scott, there are approximately 25,992 MBoe of proved reserves associated with the Bayswater Assets as of June 30, 2016, of which 57% were undeveloped.
We closed the Bayswater Acquisition on October 3, 2016. We funded the purchase price through the issuance of $260.3 million in convertible preferred securities and borrowings under our revolving credit facility.
Option to Acquire Additional Assets from Bayswater
In connection with the consummation of the Bayswater Acquisition, we paid $10.0 million for an option to purchase additional assets from Bayswater (the “Additional Bayswater Assets”) for an additional $190.0 million, for a total purchase price for the Additional Bayswater Assets of $200.0 million. The option may be exercised at any time until March 31, 2017. If we do not exercise our option to acquire the Additional Bayswater Assets, Bayswater will have the right until April 30, 2017 to elect to sell those assets to us for an additional $120.0 million, for a total purchase price for the Additional Bayswater Assets of $130.0 million. The Additional Bayswater Assets include working interests in approximately 9,100 net acres primarily in the Wattenberg Field.
Convertible Preferred Securities
We previously issued to affiliates of Apollo Capital Management (“Apollo”) $75.0 million in convertible preferred securities (the “Series A Preferred Units”) to fund a portion of the purchase price for the Bayswater Acquisition. The Series A Preferred Units were entitled to receive a cash dividend of 10% per year, payable quarterly in arrears. In connection with the consummation of the IPO, we used $90.0 million of the net proceeds to redeem the Series A Preferred Units in full, which included a premium of $15.0 million.
In addition, we have issued to, among others, investment funds affiliated with OZ Management LP and Yorktown Partners LLC (“Yorktown”) $185.3 million in convertible preferred securities (the “Series B Preferred Units”) to fund a portion of the purchase price for the Bayswater Acquisition. The Series B Preferred Units were entitled to receive a cash dividend of 10% per year, payable quarterly in arrears, and we had the ability to pay up to 50% of the quarterly dividend in kind. The Series B Preferred Units were converted in connection with the closing of the IPO into shares of our Series A Convertible Preferred Stock (the “Series A Preferred Stock”) that are entitled to receive a cash dividend of 5.875% per year, payable quarterly in arrears, and we have the ability to pay such quarterly dividends in kind at a dividend rate of 10% per year (decreased proportionately to the extent such quarterly dividends are paid in cash). Beginning on or after the later of (a) 90 days after the closing of the IPO and (b) the earlier of 120 days after the closing of the IPO and the expiration of the lock-up period contained in the underwriting agreement entered into in connection with the IPO (the “Lock-Up Period End Date”), the Series A Preferred Stock will be convertible into shares of our common stock at the election of the holders of the Series A Preferred Stock (the “Series A Preferred Holders”) at a conversion ratio per share of Series A Preferred Stock of 61.9195. Beginning on or after the Lock-Up Period End Date until the three year anniversary of the closing of the IPO, we may elect to convert the Series A Preferred Stock at a conversion ratio per share of Series A Preferred Stock of 61.9195, but only if the closing price of our common stock trades at or above a certain premium to our initial offering price, such premium to decrease with time. In certain situations, including a change of control, the Series A Preferred Stock may be redeemed for cash in an amount equal to the greater of (i) 135% of the liquidation preference of the Series A Preferred Stock and (ii) a 17.5% annualized internal rate of return on the liquidation preference of the Series A Preferred Stock. The Series A Preferred Stock matures on October 15, 2021, at which time they are mandatorily redeemable for cash at the liquidation preference. See “Description of Capital Stock—Preferred Stock—Series A Preferred Stock.”
We refer to the private offering, on July 18, 2016 (the “2016 Notes Offering”) of $550 million principal amount of 7.875% senior secured notes due 2021 (the “2021 Notes” or the “Senior Notes”) and the issuance of the Series A Preferred Units and Series B Preferred Units as the “Financing Transactions.”
Amendment to Revolving Credit Facility
On September 14, 2016, we entered into an amendment to our revolving credit facility that, among other things, increased the borrowing base to $450 million upon the consummation of the Bayswater Acquisition. On December 7, 2016, the borrowing base was increased to $475 million. See “Management’s Discussion and Analysis of Financial Condition and Results of Operations—Liquidity and Capital Resources—Revolving Credit Facility.”
Private Placement of Common Stock
On December 15, 2016, we issued 25,041,041 shares of common stock, at a price of $18.25 per share, in connection with the Private Placement (the “Private Placement”). The Private Placement resulted in approximately $457.0 million of gross proceeds and approximately $441.8 million of net proceeds (after deducting placement agent commissions and our expenses).
Recent Acquisitions
We recently closed on two separate transactions from unrelated sellers to acquire approximately 16,800 net acres in the DJ Basin for aggregate cash consideration of approximately $177 million. The acquisitions include de minimis oil and gas production and approximately 425 net 1-mile equivalent drilling locations. Net proceeds from the Private Placement were used, in part, to replenish cash used to pay the cash consideration of the acquisitions.
Corporate Reorganization
In connection with the IPO:
· Extraction Oil & Gas, LLC was converted from a Delaware limited liability company into a Delaware corporation;
· We redeemed the Series A Preferred Units in full with a portion of the net proceeds from the IPO; and
· Holdings merged with and into us, and we were the surviving entity to such merger, with the equity holders in Holdings, other than the holders of the Series B Preferred Units (which were converted in connection with the closing of the IPO into shares of Series A Preferred Stock), but including the holders of restricted units and incentive units, receiving 108,460,231 shares of our common stock, with the allocation of such shares among our existing equity holders determined, pursuant to the terms of the limited liability company agreement of Holdings, by reference to an implied valuation for us based on the 10-day volume weighted average price of our common stock following the closing of the IPO.
As part of Holdings’ merger with and into us, Holdings’ other subsidiaries became our direct or indirect subsidiaries.
The following diagram indicates our simplified ownership structure:
(1) Includes funds managed by Yorktown Partners LLC, investment funds affiliated with OZ Management LP, BlackRock, Inc. and management, among others.
For more information, please see “—Corporate Reorganization.”
Risk Factors
An investment in our common stock involves a number of risks that include the speculative nature of oil and natural gas exploration, competition, volatile commodity prices and other material factors. Importantly, due to an abundance of supply in the global crude oil market and the domestic natural gas market, oil and natural gas prices have decreased significantly. While we continue to believe our inventory of drilling opportunities is repeatable and
relatively low-risk, should oil and natural gas prices materially decrease even further, we may reevaluate our development drilling program. Any postponement or elimination of our development drilling program could result in a reduction of proved reserve volumes and related standardized measure. You should carefully consider, in addition to the other information contained in this prospectus, the risks described in “Risk Factors” before investing in our common stock. These risks could materially affect our business, financial condition and results of operations and cause the trading price of our common stock to decline. You could lose part or all of your investment. You should bear in mind, in reviewing this prospectus, that past experience is no indication of future performance. You should read “Cautionary Note Regarding Forward-Looking Statements” for a discussion of what types of statements are forward-looking statements, as well as the significance of such statements in the context of this prospectus.
Corporate Sponsorship and Structure Information
We were formed as a Delaware limited liability company in November 2012 and converted into a Delaware corporation in connection with the IPO. Our principal executive offices are located at 370 17th Street, Suite 5300, Denver, CO 80202 and our telephone number at that address is (720) 557-8300. We have a valuable relationship with funds managed by Yorktown, a private investment manager founded in 1991 that invests exclusively in the energy industry with an emphasis on North American oil and gas production and midstream businesses. After accounting for the Private Placement,Yorktown currently owns an approximate 29% equity interest in us and a 26% equity interest in us assuming all of the shares of Series A Preferred Stock are converted into shares of our common stock including any shares of Series A Preferred Stock that may be issued pursuant to our option to pay dividends on the Series A Preferred Stock in kind pursuant to the terms of the Certificate of Designations setting forth the terms of the Series A Preferred Stock. Please see “Security Ownership of Certain Beneficial Owners and Management.”
Yorktown has raised 11 private equity funds totaling over $8 billion. The investors of Yorktown’s funds include university endowments, foundations, families, insurance companies and other institutional investors. Yorktown’s investment professionals review a large number of potential energy investments and are actively involved in decisions relating to the acquisition and disposition of oil and natural gas assets by the various portfolio companies in which Yorktown’s funds own interests. With their extensive investment experience in the oil and natural gas industry and their extensive network of industry relationships, we believe that Yorktown’s funds are well positioned to assist us in identifying and evaluating acquisition opportunities and in making strategic decisions. Yorktown’s funds are not obligated to sell any properties to us and they are not prohibited from competing with us to acquire oil and natural gas properties. Investment funds managed by Yorktown manage numerous other portfolio companies that are engaged in the oil and natural gas industry and, as a result, Yorktown and its funds may present acquisition opportunities to other Yorktown portfolio companies that compete with us.
Emerging Growth Company Status
We are an “emerging growth company” as defined in the Jumpstart Our Business Startups Act (the “JOBS Act”). For as long as we are an emerging growth company, unlike other public companies that are not emerging growth companies under the JOBS Act, we are not required to:
· provide an auditor’s attestation report on management’s assessment of the effectiveness of our system of internal control over financial reporting pursuant to Section 404(b) of the Sarbanes-Oxley Act of 2002 (the “Sarbanes-Oxley Act”);
· provide more than two years of audited financial statements and related management’s discussion and analysis of financial condition and results of operations nor more than two years of selected financial data;
· comply with any new requirements adopted by the Public Company Accounting Oversight Board (the “PCAOB”) requiring mandatory audit firm rotation or a supplement to the auditor’s report in which the auditor would be required to provide additional information about the audit and the financial statements of the issuer;
· provide certain disclosure regarding executive compensation required of larger public companies or hold shareholder advisory votes on executive compensation required by the Dodd-Frank Wall Street Reform and Consumer Protection Act (the “Dodd-Frank Act”); or
· obtain shareholder approval of any golden parachute payments not previously approved.
We will cease to be an emerging growth company upon the earliest of:
· the last day of the fiscal year in which we have $1.0 billion or more in annual revenues;
· the date on which we become a “large accelerated filer” (the fiscal year-end on which the total market value of our common equity securities held by non-affiliates is $700 million or more as of June 30);
· the date on which we issue more than $1.0 billion of non-convertible debt over a three-year period; or
· the last day of the fiscal year following the fifth anniversary of our initial public offering.
In addition, Section 107 of the JOBS Act provides that an emerging growth company can take advantage of the extended transition period provided in Section 7(a)(2)(B) of the Securities Act of 1933, as amended (the “Securities Act”), for complying with new or revised accounting standards, but we have irrevocably opted out of the extended transition period and, as a result, we will adopt new or revised accounting standards on the relevant dates in which adoption of such standards is required for other public companies.
Corporate Information
Our principal executive offices are located at 370 17th Street, Suite 5300, Denver, Colorado 80202, and our telephone number at that address is (720) 557-8300. Our website is located at www.extractionog.com. We make our periodic reports and other information filed with or furnished to the SEC available free of charge through our website as soon as reasonably practicable after those reports and other information are electronically filed with or furnished to the SEC. Information on, or otherwise accessible through, our website or any other website is not incorporated by reference herein and does not constitute a part of this prospectus.
The Offering
|
Common stock offered by the selling stockholders |
18,798,932 shares. |
|
|
|
|
Common stock to be outstanding after the offering |
190,633,537 shares.(1) |
|
|
|
|
Use of proceeds |
We will not receive any proceeds from the sale of shares by the selling stockholders. |
|
|
|
|
Dividend policy |
We do not anticipate paying any cash dividends on our common stock. In addition, our revolving credit facility and our 2021 Notes (collectively, our “debt arrangements”) and the Series A Preferred Stock place certain restrictions on our ability to pay cash dividends. |
|
|
|
|
Risk factors |
You should carefully read and consider the information set forth under the heading “Risk Factors” and all other information set forth in this prospectus before deciding to invest in our common stock. |
|
|
|
|
Listing and trading symbol |
“XOG” |
(1) The number of outstanding shares as of December 19, 2016 includes the 18,798,932 shares of common stock issuable upon the conversion of our Series A Preferred Stock including any shares of Series A Preferred Stock that may be issued pursuant to our option to pay dividends on the Series A Preferred Stock in kind pursuant to the terms of the Certificate of Designations setting forth the terms of the Series A Preferred Stock, and excludes (i) 4,500,000 shares of common stock issuable upon exercise of options currently outstanding, of which none are currently are exercisable and (ii) an aggregate of approximately 9,998,132 shares of common stock reserved and available for future issuance under our long-term incentive plan (our “LTIP”).
SUMMARY HISTORICAL AND PRO FORMA FINANCIAL AND OPERATING DATA
The summary historical financial data as of and for the nine months ended September 30, 2016 and 2015 and the years ended December 31, 2015 and 2014 were derived from the unaudited and audited historical financial statements, respectively, of Holdings, our accounting predecessor (our “Predecessor”), included elsewhere in this prospectus. The summary unaudited pro forma statement of operations data of our Predecessor for the nine months ended September 30, 2016 and the year ended December 31, 2015 have been prepared to give pro forma effect to (i) the Financing Transactions, (ii) the Bayswater Acquisition and the March 2015 Acquisition as described under “Management’s Discussion and Analysis of Financial Condition and Results of Operations—Recent Developments,” (iii) the transactions described under “—Corporate Reorganization,” (iv) the IPO and the application of the net proceeds from the IPO, and (v) the Private Placement, as if each such transaction had been completed as of January 1, 2015. The pro forma balance sheet data of our Predecessor as of September 30, 2016 have been prepared to give pro forma effect to (i) the Bayswater Acquisition, (ii) the transactions described under “—Corporate Reorganization”, (iii) the IPO and the application of the net proceeds from the IPO, and (iv) the Private Placement, as if each such transaction had been completed on September 30, 2016. The summary unaudited pro forma financial data of our Predecessor is presented for informational purposes only and should not be considered indicative of actual results of operations that would have been achieved had these transactions been consummated on the dates indicated and do not purport to be indicative of statements of financial position or results of operations as of any future date or for any future periods.
You should read the following summary data in conjunction with “Use of Proceeds,” “Management’s Discussion and Analysis of Financial Condition and Results of Operations” and the historical and pro forma financial statements included elsewhere in this prospectus. Among other things, those historical and pro forma financial statements of our Predecessor include more detailed information regarding the basis of presentation for the following information. The historical financial results of our Predecessor are not necessarily indicative of results to be expected for any future periods.
|
|
|
Predecessor |
|
Pro Forma |
| ||||||||||||||
|
|
|
Nine Months Ended |
|
Year Ended |
|
Nine Months |
|
Year |
| ||||||||||
|
|
|
2016 |
|
2015 |
|
2015 |
|
2014 |
|
2016 |
|
2015 |
| ||||||
|
|
|
(unaudited) |
|
|
|
|
|
(unaudited) |
| ||||||||||
|
|
|
(in thousands, except per unit/common share data) |
| ||||||||||||||||
|
Statements of Operations Data: |
|
|
|
|
|
|
|
|
|
|
|
|
| ||||||
|
Revenues: |
|
|
|
|
|
|
|
|
|
|
|
|
| ||||||
|
Oil sales |
|
$ |
135,896 |
|
$ |
114,768 |
|
$ |
157,024 |
|
$ |
75,460 |
|
$ |
173,272 |
|
$ |
169,414 |
|
|
Natural gas sales |
|
27,730 |
|
17,707 |
|
26,019 |
|
9,247 |
|
37,620 |
|
30,118 |
| ||||||
|
NGL sales |
|
19,773 |
|
9,153 |
|
14,707 |
|
8,133 |
|
19,773 |
|
14,727 |
| ||||||
|
Total revenues |
|
183,399 |
|
141,628 |
|
197,750 |
|
92,840 |
|
230,665 |
|
214,259 |
| ||||||
|
Operating Expenses: |
|
|
|
|
|
|
|
|
|
|
|
|
| ||||||
|
Lease operating expenses |
|
40,819 |
|
18,806 |
|
30,628 |
|
5,067 |
|
45,734 |
|
36,263 |
| ||||||
|
Production taxes |
|
16,935 |
|
12,798 |
|
17,035 |
|
9,743 |
|
20,282 |
|
18,012 |
| ||||||
|
Exploration expenses |
|
14,735 |
|
6,763 |
|
18,636 |
|
126 |
|
14,735 |
|
18,636 |
| ||||||
|
Depletion, depreciation, amortization and accretion |
|
141,317 |
|
100,170 |
|
146,547 |
|
34,042 |
|
164,413 |
|
145,071 |
| ||||||
|
Impairment of long lived assets |
|
23,350 |
|
9,525 |
|
15,778 |
|
— |
|
23,350 |
|
15,778 |
| ||||||
|
Other operating expenses |
|
891 |
|
2,353 |
|
2,353 |
|
— |
|
891 |
|
2,353 |
| ||||||
|
Acquisition transaction expenses |
|
345 |
|
6,000 |
|
6,000 |
|
— |
|
— |
|
— |
| ||||||
|
General and administrative expenses |
|
35,189 |
|
25,437 |
|
37,149 |
|
19,598 |
|
23,899 |
|
36,749 |
| ||||||
|
Total operating expenses |
|
273,581 |
|
181,852 |
|
274,126 |
|
68,576 |
|
293,304 |
|
272,862 |
| ||||||
|
Operating Income (Loss) |
|
(90,182 |
) |
(40,224 |
) |
(76,376 |
) |
24,264 |
|
(62,639 |
) |
(58,063 |
) | ||||||
|
Other Income (Expense): |
|
|
|
|
|
|
|
|
|
|
|
|
| ||||||
|
Commodity derivative gain (loss) |
|
(62,424 |
) |
38,478 |
|
79,932 |
|
48,008 |
|
(62,424 |
) |
79,932 |
| ||||||
|
Interest expense |
|
(57,914 |
) |
(36,350 |
) |
(51,030 |
) |
(22,454 |
) |
(31,775 |
) |
(42,046 |
) | ||||||
|
Other income |
|
120 |
|
36 |
|
210 |
|
24 |
|
120 |
|
210 |
| ||||||
|
Total other income (expense) |
|
(120,218 |
) |
2,164 |
|
29,112 |
|
25,578 |
|
(94,079 |
) |
38,096 |
| ||||||
|
Income (loss) before income taxes |
|
(210,400 |
) |
(38,060 |
) |
(47,264 |
) |
49,842 |
|
(156,718 |
) |
(20,507 |
) | ||||||
|
Income tax (expense) benefit |
|
— |
|
— |
|
— |
|
— |
|
59,552 |
|
7,792 |
| ||||||
|
Net Income (Loss) |
|
$ |
(210,400 |
) |
$ |
(38,060 |
) |
$ |
(47,264 |
) |
$ |
49,842 |
|
$ |
(97,166 |
) |
$ |
(12,715 |
) |
|
Net Income (Loss) per Unit/Common Share: |
|
|
|
|
|
|
|
|
|
|
|
|
| ||||||
|
Basic |
|
$ |
(0.63 |
) |
$ |
(0.14 |
) |
$ |
(0.17 |
) |
$ |
0.28 |
|
$ |
(0.64 |
) |
$ |
(0.17 |
) |
|
Diluted |
|
$ |
(0.63 |
) |
$ |
(0.14 |
) |
$ |
(0.17 |
) |
$ |
0.26 |
|
$ |
(0.64 |
) |
$ |
(0.17 |
) |
|
|
|
Predecessor |
|
Pro Forma |
| ||||||||||||||
|
|
|
Nine Months Ended |
|
Year Ended |
|
Nine Months |
|
Year |
| ||||||||||
|
|
|
2016 |
|
2015 |
|
2015 |
|
2014 |
|
2016 |
|
2015 |
| ||||||
|
|
|
(unaudited) |
|
|
|
|
|
(unaudited) |
| ||||||||||
|
|
|
(in thousands, except per unit/common share data) |
| ||||||||||||||||
|
Weighted Average Units/Common Shares Outstanding: |
|
|
|
|
|
|
|
|
|
|
|
|
| ||||||
|
Basic |
|
332,377 |
|
266,844 |
|
277,322 |
|
180,429 |
|
171,835 |
|
171,835 |
| ||||||
|
Diluted |
|
332,377 |
|
266,844 |
|
277,322 |
|
189,938 |
|
171,835 |
|
171,835 |
| ||||||
|
Statements of Cash Flows Data: |
|
|
|
|
|
|
|
|
|
|
|
|
| ||||||
|
Cash provided by (used in): |
|
|
|
|
|
|
|
|
|
|
|
|
| ||||||
|
Operating activities |
|
$ |
97,563 |
|
$ |
145,561 |
|
$ |
166,683 |
|
$ |
77,390 |
|
|
|
|
| ||
|
Investing activities |
|
(280,546 |
) |
(418,599 |
) |
(520,006 |
) |
(970,640 |
) |
|
|
|
| ||||||
|
Financing activities |
|
87,263 |
|
316,952 |
|
371,404 |
|
972,090 |
|
|
|
|
| ||||||
|
Balance Sheets Data (at period end): |
|
|
|
|
|
|
|
|
|
|
|
|
| ||||||
|
Cash and cash equivalents |
|
$ |
1,386 |
|
|
|
$ |
97,106 |
|
$ |
79,025 |
|
$ |
792,722 |
|
|
| ||
|
Total assets |
|
1,573,405 |
|
|
|
1,634,140 |
|
1,201,069 |
|
2,788,488 |
|
|
| ||||||
|
Total liabilities |
|
897,170 |
|
|
|
879,908 |
|
655,881 |
|
977,878 |
|
|
| ||||||
|
Total members’/stockholders’ equity |
|
676,235 |
|
|
|
754,232 |
|
545,188 |
|
1,653,122 |
|
|
| ||||||
|
Other Financial Data: |
|
|
|
|
|
|
|
|
|
|
|
|
| ||||||
|
Adjusted EBITDAX(1) |
|
$ |
137,975 |
|
$ |
129,905 |
|
$ |
176,120 |
|
$ |
66,892 |
|
$ |
176,979 |
|
$ |
186,417 |
|
(1) Adjusted EBITDAX is a non-GAAP financial measure. For a definition of Adjusted EBITDAX and a reconciliation to our most directly comparable financial measure calculated and presented in accordance with GAAP, please read “—Non-GAAP Financial Measures.”
Non-GAAP Financial Measures
Adjusted EBITDAX
Adjusted EBITDAX is not a measure of net income (loss) as determined by United States generally accepted accounting principles (“GAAP”). Adjusted EBITDAX is a supplemental non-GAAP financial measure that is used by management and external users of our Predecessor’s financial statements, such as industry analysts, investors, lenders and rating agencies. We define Adjusted EBITDAX as net income (loss) adjusted for certain cash and non-cash items, including depreciation, depletion, amortization and accretion (“DD&A”), impairment of long lived assets, exploration expenses, rig termination fees, acquisition transaction expenses, commodity derivative (gain) loss, settlements on commodity derivatives, premiums paid for derivatives that settled during the period, unit-based compensation expense, amortization of debt discount and debt issuance costs, interest expense, income taxes and non-recurring charges.
Management believes Adjusted EBITDAX is useful because it allows us to more effectively evaluate our operating performance and compare the results of our operations from period to period without regard to our financing methods or capital structure. We exclude the items listed above from net income (loss) in arriving at Adjusted EBITDAX because these amounts can vary substantially from company to company within our industry depending upon accounting methods and book values of assets, capital structures and the method by which the assets were acquired. Adjusted EBITDAX should not be considered as an alternative to, or more meaningful than, net income (loss) as determined in accordance with GAAP or as an indicator of our operating performance. Certain items excluded from Adjusted EBITDAX are significant components in understanding and assessing a company’s financial performance, such as a company’s cost of capital, hedging strategy and tax structure, as well as the historic costs of depreciable assets, none of which are components of Adjusted EBITDAX. Our computations of Adjusted EBITDAX may not be comparable to other similarly titled measure of other companies. We believe that Adjusted EBITDAX is a widely followed measure of operating performance.
The following table presents a reconciliation of Adjusted EBITDAX to the GAAP financial measure of net income (loss) for each of the periods indicated.
|
|
|
Predecessor |
|
Pro Forma |
| ||||||||||||||
|
|
|
|
|
Nine |
|
Year Ended |
| ||||||||||||
|
|
|
Nine Months Ended |
|
Year Ended |
|
Ended |
|
December |
| ||||||||||
|
|
|
2016 |
|
2015 |
|
2015 |
|
2014 |
|
30, 2016 |
|
2015 |
| ||||||
|
|
|
(unaudited) |
|
|
|
|
|
(unaudited) |
| ||||||||||
|
|
|
(in thousands) |
| ||||||||||||||||
|
Adjusted EBITDAX reconciliation to net income (loss): |
|
|
|
|
|
|
|
|
|
|
|
|
| ||||||
|
Net income (loss) |
|
$ |
(210,400 |
) |
$ |
(38,060 |
) |
$ |
(47,264 |
) |
$ |
49,842 |
|
$ |
(97,166 |
) |
$ |
(12,715 |
) |
|
Add back (subtract): |
|
|
|
|
|
|
|
|
|
|
|
|
| ||||||
|
Depreciation, depletion, amortization and accretion |
|
141,317 |
|
100,170 |
|
146,547 |
|
34,042 |
|
164,413 |
|
145,071 |
| ||||||
|
Impairment of long lived assets |
|
23,350 |
|
9,525 |
|
15,778 |
|
— |
|
23,350 |
|
15,778 |
| ||||||
|
Exploration expenses |
|
14,735 |
|
6,763 |
|
18,636 |
|
126 |
|
14,735 |
|
18,636 |
| ||||||
|
Rig termination fee |
|
891 |
|
1,657 |
|
1,657 |
|
— |
|
891 |
|
1,657 |
| ||||||
|
Acquisition transaction expenses |
|
345 |
|
6,000 |
|
6,000 |
|
— |
|
— |
|
— |
| ||||||
|
Commodity derivative loss (gain) |
|
62,424 |
|
(38,478 |
) |
(79,932 |
) |
(48,008 |
) |
62,424 |
|
(79,932 |
) | ||||||
|
Settlements on commodity derivatives |
|
37,947 |
|
42,441 |
|
59,785 |
|
3,974 |
|
37,947 |
|
59,785 |
| ||||||
|
Premiums paid for derivatives that settled during the period |
|
(5,470 |
) |
(1,046 |
) |
(2,087 |
) |
— |
|
(5,470 |
) |
(2,087 |
) | ||||||
|
Unit-based compensation expense |
|
14,922 |
|
4,583 |
|
5,970 |
|
4,462 |
|
3,632 |
|
5,970 |
| ||||||
|
Amortization of debt discount and debt issuance costs |
|
18,330 |
|
3,081 |
|
5,604 |
|
1,985 |
|
2,725 |
|
6,537 |
| ||||||
|
Interest expense |
|
39,584 |
|
33,269 |
|
45,426 |
|
20,469 |
|
29,050 |
|
35,509 |
| ||||||
|
Income tax expense (benefit) |
|
— |
|
— |
|
— |
|
— |
|
(59,552 |
) |
(7,792 |
) | ||||||
|
Adjusted EBITDAX |
|
$ |
137,975 |
|
$ |
129,905 |
|
$ |
176,120 |
|
$ |
66,892 |
|
$ |
176,979 |
|
$ |
186,417 |
|
PV-10
PV-10 is a non-GAAP financial measure and generally differs from Standardized Measure, the most directly comparable GAAP financial measure, because it does not include the effects of income taxes on future net revenues. Neither PV-10 nor Standardized Measure represents an estimate of the fair market value of our oil and natural gas properties. We and others in the industry use PV-10 as a measure to compare the relative size and value of proved reserves held by companies without regard to the specific tax characteristics of such entities.
The following table presents a reconciliation of PV-10 to the GAAP financial measure of Standardized Measure as of the dates indicated.
|
|
|
As of |
|
As of |
| ||
|
|
|
(in thousands) |
| ||||
|
PV-10 of proved reserves |
|
$ |
686,001 |
|
$ |
835,883 |
|
|
Present value of future income tax discounted at 10% |
|
(81,506 |
) |
(220,458 |
) | ||
|
Standardized Measure(1) |
|
$ |
604,495 |
|
$ |
615,425 |
|
(1) If we had been subject to entity-level U.S. federal and state income taxes, the pro forma, undiscounted, income tax expense at June 30, 2016 would have been $166.7 million ($81.5 million on a discounted basis) and the Standardized Measure would have been $604.5 million. If we had been subject to entity-level U.S. federal and state income taxes, the pro forma, undiscounted, income tax expense at December 31, 2015 would have been $453.9 million ($220.5 million on a discounted basis) and the Standardized Measure would have been $615.4 million.
Summary Reserve Data and Operating Data
The following tables present summary data with respect to our estimated net proved oil, natural gas and NGL reserves and operating data as of the dates presented.
The reserve estimates presented in the table below are based on reports prepared by Ryder Scott, which reports were prepared in accordance with current SEC rules and regulations regarding oil and natural gas reserve reporting. The following tables also contain summary unaudited information regarding production and sales of oil and natural gas with respect to such properties.
In evaluating the material presented below, please read “Risk Factors,” “Management’s Discussion and Analysis of Financial Condition and Results of Operations,” “Business—Oil and Natural Gas Data—Proved Reserves,” “Business—Oil, Natural Gas and NGL Production Prices and Production Costs—Production and Price History” and our financial statements and notes thereto. Our historical results of operations are not necessarily indicative of results to be expected for any future periods.
|
|
|
As of |
|
As of |
| ||
|
Proved Reserves: |
|
|
|
|
| ||
|
Oil (MBbls) |
|
79,111 |
|
71,500 |
| ||
|
Natural gas (MMcf) |
|
365,702 |
|
292,584 |
| ||
|
NGL (MBbls) |
|
47,227 |
|
38,383 |
| ||
|
Total Proved Reserves (MBoe)(2) |
|
187,288 |
|
158,647 |
| ||
|
Total Proved PV-10 (Millions)(3) |
|
$ |
686.0 |
|
$ |
835.9 |
|
|
Proved Developed Reserves: |
|
|
|
|
| ||
|
Oil (MBbls) |
|
17,391 |
|
14,249 |
| ||
|
Natural gas (MMcf) |
|
87,411 |
|
53,011 |
| ||
|
NGL (MBbls) |
|
11,340 |
|
7,058 |
| ||
|
Proved Developed Reserves (MBoe)(2) |
|
43,299 |
|
30,142 |
| ||
|
Proved Developed PV-10 (Millions)(3) |
|
$ |
398.7 |
|
$ |
368.1 |
|
|
Proved Developed PV-10 as a Percentage of Total Proved PV-10 |
|
58.1 |
% |
44.0 |
% | ||
|
Proved Undeveloped Reserves: |
|
|
|
|
| ||
|
Oil (MBbls) |
|
61,720 |
|
57,252 |
| ||
|
Natural gas (MMcf) |
|
278,291 |
|
239,572 |
| ||
|
NGL (MBbls) |
|
35,887 |
|
31,325 |
| ||
|
Proved Undeveloped Reserves (MBoe)(2) |
|
143,989 |
|
128,505 |
| ||
|
Proved Undeveloped PV-10 (Millions)(3) |
|
$ |
287.3 |
|
$ |
467.7 |
|
|
Proved Undeveloped PV-10 as a Percentage of Total Proved PV-10 |
|
41.9 |
% |
56.0 |
% | ||
(1) Our estimated net proved reserves were determined using average first-day-of-the-month prices for the prior 12 months in accordance with SEC guidance. The unweighted arithmetic average first-day-of-the-month prices for the prior 12 months were $43.12/Bbl for oil and $2.10/MMBtu for natural gas at June 30, 2016 and $50.28/Bbl for oil and $2.58/MMBtu for natural gas at December 31, 2015. These prices were adjusted by lease for quality, transportation fees, geographical differentials, marketing bonuses or deductions and other factors affecting the price received at the wellhead. For more information regarding commodity price risk, please see “Risk Factors—Risks Related to the Oil, Natural Gas and NGL Industry and Our Business—Reserve estimates depend on many assumptions that may turn out to be inaccurate. Any material inaccuracies in reserve estimates or underlying assumptions will materially affect the quantities and present value of our reserves.”
(2) One BOE is equal to six Mcf of natural gas or one Bbl of oil or NGL based on an approximate energy equivalency. This is an energy content correlation and does not reflect a value or price relationship between the commodities.
(3) PV-10 is a non-GAAP financial measure. For a reconciliation of PV-10 to the GAAP financial measure of Standardized Measure, please see “—Summary Historical and Pro Forma Financial and Operating Data—Non-GAAP Financial Measures.”
|
|
|
Nine Months Ended |
|
Year Ended |
| ||||||||
|
|
|
2016 |
|
2015 |
|
2015 |
|
2014 |
| ||||
|
|
|
(unaudited) |
| ||||||||||
|
Summary Historical Operating Data: |
|
|
|
|
|
|
|
|
| ||||
|
Production and Operating Data: |
|
|
|
|
|
|
|
|
| ||||
|
Net production volumes: |
|
|
|
|
|
|
|
|
| ||||
|
Oil (MBbls) |
|
3,808.4 |
|
2,792.3 |
|
3,945.6 |
|
1,022.2 |
| ||||
|
Natural gas (MMcf) |
|
12,851.3 |
|
7,224.9 |
|
10,823.0 |
|
2,664.1 |
| ||||
|
NGL (MBbls) |
|
1,478.9 |
|
857.1 |
|
1,334.6 |
|
325.3 |
| ||||
|
Total (MBoe)(1) |
|
7,429.2 |
|
4,853.6 |
|
7,084.0 |
|
1,791.5 |
| ||||
|
Average net production (BOE/d)(1) |
|
27,114 |
|
17,779 |
|
19,408 |
|
4,908 |
| ||||
|
Average sales prices(2): |
|
|
|
|
|
|
|
|
| ||||
|
Oil sales (per Bbl) |
|
$ |
35.68 |
|
$ |
41.10 |
|
$ |
39.80 |
|
$ |
73.82 |
|
|
Oil sales with derivative settlements (per Bbl) |
|
$ |
41.93 |
|
$ |
55.09 |
|
$ |
53.29 |
|
$ |
77.66 |
|
|
|
|
Nine Months Ended |
|
Year Ended |
| ||||||||
|
|
|
2016 |
|
2015 |
|
2015 |
|
2014 |
| ||||
|
|
|
(unaudited) |
| ||||||||||
|
Natural gas (per Mcf) |
|
$ |
2.16 |
|
$ |
2.45 |
|
$ |
2.40 |
|
$ |
3.47 |
|
|
Natural gas sales with derivative settlements (per Mcf) |
|
$ |
2.84 |
|
$ |
2.77 |
|
$ |
2.82 |
|
$ |
3.49 |
|
|
NGL (per Bbl) |
|
$ |
13.37 |
|
$ |
10.68 |
|
$ |
11.02 |
|
$ |
25.00 |
|
|
Average price per BOE |
|
$ |
24.69 |
|
$ |
29.18 |
|
$ |
27.92 |
|
$ |
51.82 |
|
|
Average price per BOE with derivative settlements |
|
$ |
29.06 |
|
$ |
37.71 |
|
$ |
36.06 |
|
$ |
54.04 |
|
|
Average unit costs per BOE: |
|
|
|
|
|
|
|
|
| ||||
|
Lease operating expenses |
|
$ |
5.49 |
|
$ |
3.87 |
|
$ |
4.32 |
|
$ |
2.83 |
|
|
Production taxes |
|
$ |
2.28 |
|
$ |
2.64 |
|
$ |
2.40 |
|
$ |
5.44 |
|
|
Exploration expenses |
|
$ |
1.98 |
|
$ |
1.39 |
|
$ |
2.63 |
|
$ |
0.07 |
|
|
Depreciation, depletion, amortization and accretion |
|
$ |
19.02 |
|
$ |
20.64 |
|
$ |
20.69 |
|
$ |
19.00 |
|
|
Impairment of long lived assets |
|
$ |
3.14 |
|
$ |
1.96 |
|
$ |
2.23 |
|
$ |
— |
|
|
Other operating expenses |
|
$ |
0.12 |
|
$ |
0.48 |
|
$ |
0.33 |
|
$ |
— |
|
|
Acquisition transaction expenses |
|
$ |
0.05 |
|
$ |
1.24 |
|
$ |
0.85 |
|
$ |
— |
|
|
General and administrative expenses |
|
$ |
4.74 |
|
$ |
5.24 |
|
$ |
5.24 |
|
$ |
10.94 |
|
|
Unit-based compensation |
|
$ |
2.01 |
|
$ |
0.94 |
|
$ |
0.84 |
|
$ |
2.49 |
|
|
Total operating expenses per BOE |
|
$ |
36.83 |
|
$ |
37.47 |
|
$ |
38.69 |
|
$ |
38.28 |
|
(1) One BOE is equal to six Mcf of natural gas or one Bbl of oil or NGL based on an approximate energy equivalency. This is an energy content correlation and does not reflect a value or price relationship between the commodities.
(2) Average prices shown in the table reflect prices both before and after the effects of our realized commodity hedging transactions. Our calculation of such effects includes both realized gains or losses on cash settlements for commodity derivative transactions and premiums paid or received on options, if any, that settled during the period.
An investment in our common stock involves a number of risks. You should carefully consider each of the following risk factors and all of the other information set forth in this prospectus and the documents we have incorporated by reference into this prospectus before making an investment decision. If any of the following risks actually occur, our business, financial condition and results of operations could be materially and adversely affected and we may not be able to achieve our goals. We cannot assure you that any of the events discussed in the risk factors below will not occur. Further, the risks and uncertainties described below are not the only ones we face. Additional risks not presently known to us or that we currently deem immaterial may also materially affect our business. If any of these risks occur, the trading price of our common stock could decline materially and you could lose all or part of your investment.
Risks Related to the Oil, Natural Gas and NGL Industry and Our Business
Oil and natural gas prices are volatile. An extended or further decline in commodity prices may adversely affect our business, financial condition or results of operations and our ability to meet our capital expenditure obligations and financial commitments. Additionally, the value of our proved reserves calculated using SEC pricing may be higher than the fair market value of our proved reserves calculated using current market prices.
The prices we receive for our oil, natural gas and NGL production heavily influence our revenue, profitability, access to capital and future rate of growth. Oil, natural gas and NGL are commodities and, therefore, their prices are subject to wide fluctuations in response to relatively minor changes in supply and demand. Historically, the commodities market has been volatile. For example, during the period from January 1, 2014 to September 30, 2016, NYMEX West Texas Intermediate oil prices ranged from a high of $107.26 per Bbl to a low of $26.21 per Bbl. Average daily prices for NYMEX Henry Hub gas ranged from a high of $6.15 per MMBtu to a low of $1.64 per MMBtu during the same period. The duration and magnitude of the recent decline in oil prices cannot be predicted. This market will likely continue to be volatile in the future. The prices we receive for our production, and the levels of our production, depend on numerous factors beyond our control. These factors include the following:
· worldwide and regional economic conditions impacting the global supply and demand for oil, natural gas and NGL;
· the price and quantity of foreign imports;
· political conditions in or affecting other producing countries, including conflicts in the Middle East, Africa, South America and Russia;
· the level of global exploration and production;
· the level of global inventories;
· prevailing prices on local price indices in the areas in which we operate;
· the proximity, capacity, cost and availability of gathering and transportation facilities;
· localized and global supply and demand fundamentals and transportation availability;
· weather conditions;
· technological advances affecting energy consumption;
· the price and availability of alternative fuels; and
· domestic, local and foreign governmental regulation and taxes.
Since November 2014, prices for U.S. oil have weakened in response to continued high levels of production by the Organization of the Petroleum Exporting Companies (“OPEC”), a buildup in inventories and lower global demand.
Lower commodity prices will reduce our cash flows and borrowing ability. We may be unable to obtain needed capital or financing on satisfactory terms, which could lead to a decline in the present value of our reserves and our ability to develop future reserves. Lower commodity prices may also reduce the amount of oil, natural gas and NGL that we can produce economically and may impact our ability to satisfy our obligations under firm-commitment transportation agreements. We have historically been able to hedge our oil and natural gas production at prices that are significantly higher than current strip prices. However, in the current commodity price environment, our ability to enter into comparable derivative arrangements may be limited, and, following this offering, we will not be under an obligation to hedge a specific portion of our oil or natural gas production.
Using lower prices in estimating proved reserves would likely result in a reduction in proved reserve volumes due to economic limits. While it is difficult to project future economic conditions and whether such conditions will result in impairment of proved property costs, we consider several variables including specific market factors and circumstances at the time of prospective impairment reviews, and the continuing evaluation of development plans, production data, economics and other factors. In addition, sustained periods with oil and natural gas prices at levels lower than current West Texas Intermediate strip prices and the resultant effect such prices may have on our drilling economics and our ability to raise capital may require us to re-evaluate and postpone or eliminate our development drilling, which could result in the reduction of some of our proved undeveloped reserves and related standardized measure. If we are required to curtail our drilling program, we may be unable to continue to hold leases that are scheduled to expire, which may further reduce our reserves. As a result, a substantial or extended decline in commodity prices may materially and adversely affect our future business, financial condition, results of operations, liquidity or ability to finance planned capital expenditures.
Our development and exploratory drilling efforts and our well operations may not be profitable or achieve our targeted returns.
We have acquired significant amounts of unproved property in order to further our development efforts and expect to continue to undertake acquisitions in the future. Development and exploratory drilling and production activities are subject to many risks, including the risk that no commercially productive reservoirs will be discovered. We acquire unproved properties and lease undeveloped acreage that we believe will enhance our growth potential and increase our results of operations over time. However, we cannot assure you that all prospects will be economically viable or that we will not abandon our investments. Additionally, we cannot assure you that unproved property acquired by us or undeveloped acreage leased by us will be profitably developed, that wells drilled by us in prospects that we pursue will be productive or that we will recover all or any portion of our investment in such unproved property or wells.
Properties we acquire may not produce as projected, and we may be unable to determine reserve potential, identify liabilities associated with the properties that we acquire or obtain protection from sellers against such liabilities.
Acquiring oil and natural gas properties requires us to assess reservoir and infrastructure characteristics, including recoverable reserves, development and operating costs and potential liabilities, including environmental liabilities. Such assessments are inexact and inherently uncertain. For these reasons, the properties we have acquired or will acquire in the future may not produce as projected. In connection with the assessments, we perform a review of the subject properties, but such a review will not reveal all existing or potential problems. In the course of our due diligence, we may not review every well, pipeline or associated facility. We cannot necessarily observe structural and environmental problems, such as pipe corrosion or groundwater contamination, when a review is performed. We may be unable to obtain contractual indemnities from the seller for liabilities created prior to our purchase of the property. We may be required to assume the risk of the physical condition of the properties in addition to the risk that the properties may not perform in accordance with our expectations.
Our exploration and development projects require substantial capital expenditures. We may be unable to obtain required capital or financing on satisfactory terms, which could lead to a decline in our reserves.
The oil and natural gas industry is capital intensive. We make and expect to continue to make substantial capital expenditures for the exploitation, development and acquisition of oil and natural gas reserves. We expect to fund our 2017 capital expenditures with the proceeds of the IPO, the Private Placement, cash generated by operations, borrowings under our revolving credit facility and possibly through asset sales or additional capital market transactions. The actual amount and timing of our future capital expenditures may differ materially from our estimates as a result of, among other things, oil, natural gas and NGL prices, actual drilling results, the availability of drilling rigs and other services and equipment, and regulatory, technological and competitive developments. A reduction in commodity prices from current levels may result in a decrease in our actual capital expenditures, which would negatively impact our ability to grow production. See “Management’s Discussion and Analysis of Financial Condition and Results of Operations—Liquidity and Capital Resources.”
Our cash flow from operations and access to capital are subject to a number of variables, including:
· our proved reserves;
· the level of hydrocarbons we are able to produce from existing wells;
· the prices at which our production is sold;
· the availability of takeaway capacity;
· our ability to acquire, locate and produce new reserves; and
· our ability to borrow under our revolving credit facility.
If our revenues or the borrowing base under our revolving credit facility decreases as a result of lower oil, natural gas and NGL prices, operating difficulties, declines in reserves or for any other reason, we may have limited ability to obtain the capital necessary to sustain our operations and growth at current levels. If additional capital is needed, we may not be able to obtain debt or equity financing on terms acceptable to us, if at all. If cash flow generated by our operations or available borrowings under our revolving credit facility are not sufficient to meet our capital requirements, the failure to obtain additional financing could result in a curtailment of our operations relating to development of our properties, which in turn could lead to a decline in our reserves and production, and would adversely affect our business, financial condition and results of operations.
Drilling for and producing oil and natural gas are high risk activities with many uncertainties that could adversely affect our business, financial condition or results of operations.
Our future financial condition and results of operations will depend on the success of our exploitation, development and acquisition activities, which are subject to numerous risks beyond our control, including the risk that drilling will not result in commercially viable oil and natural gas production.
Our decisions to purchase, explore, develop or otherwise exploit prospects or properties will depend in part on the evaluation of data obtained through geophysical and geological analyses, production data and engineering studies, the results of which are often inconclusive or subject to varying interpretations. For a discussion of the uncertainty involved in these processes, see “—Reserve estimates depend on many assumptions that may turn out to be inaccurate. Any material inaccuracies in reserve estimates or underlying assumptions will materially affect the quantities and present value of our reserves.” In addition, our cost of drilling, completing and operating wells is often uncertain before drilling commences.
Further, many factors may curtail, delay or cancel our scheduled drilling projects, including the following:
· delays imposed by or resulting from compliance with environmental and other regulatory requirements including limitations on or resulting from wastewater discharge and disposal, subsurface injections, greenhouse gas emissions and hydraulic fracturing;
· pressure or irregularities in geological formations;
· shortages of or delays in obtaining equipment and qualified personnel or in obtaining water for hydraulic fracturing activities;
· equipment failures or accidents;
· lack of available gathering facilities or delays in construction of gathering facilities;
· lack of available capacity on interconnecting transmission pipelines;
· adverse weather conditions, such as blizzards, tornados and ice storms;
· issues related to compliance with environmental and other governmental regulations;
· environmental hazards, such as oil and natural gas leaks, oil spills, pipeline and tank ruptures, encountering naturally occurring radioactive materials, and unauthorized discharges of brine, well stimulation and completion fluids, toxic gases or other pollutants into the surface and subsurface environment;
· declines in oil, natural gas and NGL prices;
· limited availability of financing at acceptable terms;
· title problems or legal disputes regarding leasehold rights; and
· limitations in the market for oil, natural gas and NGL.
Our identified drilling locations are scheduled over many years, making them susceptible to uncertainties that could materially alter the occurrence or timing of their drilling. In addition, we may not be able to raise the substantial amount of capital that would be necessary to drill such locations.
Our management team has specifically identified and scheduled certain drilling locations as an estimation of our future multi-year drilling activities on our existing acreage. These locations represent a significant part of our growth strategy. Our ability to drill and develop these locations depends on a number of uncertainties, including oil, natural gas and NGL prices, the availability and cost of capital, drilling and production costs, availability of drilling services and equipment, drilling results, lease expirations, gathering system and pipeline transportation constraints, access to and availability of water sourcing and distribution systems, regulatory approvals and other factors. Because of these uncertain factors, we do not know if the numerous potential well locations we have identified will ever be drilled or if we will be able to produce natural gas or oil from these or any other potential locations. In addition, unless production is established within the spacing units covering the undeveloped acres on which some of the potential locations are obtained, the leases for such acreage will expire. As such, our actual drilling activities may materially differ from those presently identified.
In addition, we will require significant additional capital over a prolonged period in order to pursue the development of these locations, and we may not be able to raise or generate the capital required to do so. Any drilling activities we are able to conduct on these potential locations may not be successful or result in our ability to add additional proved reserves to our overall proved reserves or may result in a downward revision of our estimated proved reserves, which could have a material adverse effect on our future business and results of operations.
Restrictions in our existing and future debt agreements could limit our growth and our ability to engage in certain activities.
Our debt arrangements contain a number of significant covenants, including restrictive covenants that may limit our ability to, among other things:
· incur additional indebtedness;
· sell assets;
· make loans to others;
· make certain acquisitions and investments;
· enter into mergers, consolidations or other transactions resulting in the transfer of all or substantially all of our assets;
· make certain payments, including paying dividends or distributions in respect of our equity;
· hedge future production or interest rates;
· redeem and prepay other debt;
· holding cash balances in excess of certain thresholds while carrying a balance of our revolving credit facility;
· incur liens; and
· engage in certain other transactions without the prior consent of the lenders.
In addition, our debt arrangements require us to maintain certain financial ratios or to reduce our indebtedness if we are unable to comply with such ratios. These restrictions may also limit our ability to obtain future financings to withstand a future downturn in our business or the economy in general, or to otherwise conduct necessary corporate activities. We may also be prevented from taking advantage of business opportunities that arise because of the limitations that the restrictive covenants under our debt arrangements will impose on us.
Our revolving credit facility limits the amount we can borrow up to the lower of our aggregate lender commitments and a borrowing base amount, which the lenders, in their sole discretion, will determine on a semi-annual basis based upon projected revenues from the oil and natural gas properties securing our loan. The lenders will be able to unilaterally adjust the borrowing base and the borrowings permitted to be outstanding under our revolving credit facility. Any increase in the borrowing base requires the consent of the lenders holding 100% of the commitments. If the requisite number of lenders does not agree to a proposed borrowing base, then the borrowing base will be the highest borrowing base acceptable to such lenders. We will be required to repay outstanding borrowings in excess of the borrowing base. As of September 30, 2016, our borrowing base was $350.0 million. On September 14, 2016, we entered into an amendment to our revolving credit facility that, among other things, increased the borrowing base to $450 million upon the consummation of the Bayswater Acquisition. The Bayswater Acquisition closed on October 3, 2016, which triggered the borrowing base increase. On December 7, 2016, our borrowing base was increased to $475 million.
A breach of any covenant in our revolving credit facility will result in a default under the revolving credit facility after any applicable grace periods. A default, if not waived, could result in acceleration of the indebtedness outstanding under the facility and a default with respect to, and an acceleration of, the indebtedness outstanding under other debt agreements. The accelerated indebtedness would become immediately due and payable. If that occurs, we may not be able to make all of the required payments or borrow sufficient funds to refinance such indebtedness. Even if new financing were available at that time, it may not be on terms that are acceptable to us. In addition, our obligations under our revolving credit facility are secured by perfected first priority liens and security interests on substantially all of our assets, including mortgage liens on oil and natural gas properties having at least 80% of the reserve value as determined by reserve reports, and if we are unable to repay our indebtedness under the revolving credit facility, the lenders could seek to foreclose on our assets.
We may not be able to generate sufficient cash to service all of our indebtedness and may be forced to take other actions to satisfy our obligations under our debt arrangements, which may not be successful.
Our ability to make scheduled payments on or to refinance our indebtedness obligations, including our revolving credit facility and our 2021 Notes, depends on our financial condition and operating performance, which
are subject to prevailing economic and competitive conditions and certain financial, business and other factors beyond our control. If oil and natural gas prices remain at their current level for an extended period of time or continue to decline, we may not be able to maintain a level of cash flows from operating activities sufficient to permit us to pay the principal, premium, if any, and interest on our indebtedness.
If our cash flows and capital resources are insufficient to fund debt service obligations, we may be forced to reduce or delay investments and capital expenditures, sell assets, seek additional capital or restructure or refinance indebtedness. Our ability to restructure or refinance indebtedness will depend on the condition of the capital markets and our financial condition at such time. Any refinancing of indebtedness could be at higher interest rates and may require us to comply with more onerous covenants, which could further restrict business operations. The terms of existing or future debt arrangements may restrict us from adopting some of these alternatives. In addition, any failure to make payments of interest and principal on outstanding indebtedness on a timely basis could harm our ability to incur additional indebtedness. In the absence of sufficient cash flows and capital resources, we could face substantial liquidity problems and might be required to dispose of material assets or operations to meet debt service and other obligations. Our revolving credit facility and the indenture governing our 2021 Notes currently restrict our ability to dispose of assets and our use of the proceeds from such disposition. We may not be able to consummate those dispositions, and the proceeds of any such disposition may not be adequate to meet any debt service obligations then due. These alternative measures may not be successful and may not permit us to meet scheduled debt service obligations.
In addition, we will require significant additional capital over a prolonged period in order to pursue the development of these locations, and we may not be able to raise or generate the capital required to do so. Any drilling activities we are able to conduct on these potential locations may not be successful or result in our ability to add additional proved reserves to our overall proved reserves or may result in a downward revision of our estimated proved reserves, which could have a material adverse effect on our future business and results of operations.
Our derivative activities could result in financial losses or could reduce our earnings.
To achieve more predictable cash flows and reduce our exposure to adverse fluctuations in the prices of oil, natural gas and NGL, we enter into commodity derivative contracts for a significant portion of our production, primarily consisting of swaps, put options and call options. See “Management’s Discussion and Analysis of Financial Condition and Results of Operations—Overview—Sources of Our Revenues.” Accordingly, our earnings may fluctuate significantly as a result of changes in fair value of our derivative instruments.
Derivative instruments also expose us to the risk of financial loss in some circumstances, including when:
· production is less than the volume covered by the derivative instruments;
· the counterparty to the derivative instrument defaults on its contractual obligations;
· there is an increase in the differential between the underlying price in the derivative instrument and actual prices received; or
· there are issues with regard to legal enforceability of such instruments.
The use of derivatives may, in some cases, require the posting of cash collateral with counterparties. If we enter into derivative instruments that require cash collateral and commodity prices or interest rates change in a manner adverse to us, our cash otherwise available for use in our operations would be reduced, which could limit our ability to make future capital expenditures and make payments on our indebtedness, and which could also limit the size of our borrowing base. Future collateral requirements will depend on arrangements with our counterparties, highly volatile oil, natural gas and NGL prices and interest rates. In addition, derivative arrangements could limit the benefit we would receive from increases in the prices for oil, natural gas and NGL, which could also have an adverse effect on our financial condition.
Our commodity derivative contracts expose us to risk of financial loss if a counterparty fails to perform under a contract. Disruptions in the financial markets could lead to sudden decreases in a counterparty’s liquidity, which could make them unable to perform under the terms of the contract and we may not be able to realize the benefit of
the contract. We are unable to predict sudden changes in a counterparty’s creditworthiness or ability to perform. Even if we do accurately predict sudden changes, our ability to negate the risk may be limited depending upon market conditions.
During periods of declining commodity prices, our derivative contract receivable positions generally increase, which increases our counterparty credit exposure. If the creditworthiness of our counterparties deteriorates and results in their nonperformance, we could incur a significant loss with respect to our commodity derivative contracts.
Reserve estimates depend on many assumptions that may turn out to be inaccurate. Any material inaccuracies in reserve estimates or underlying assumptions will materially affect the quantities and present value of our reserves.
The process of estimating oil and natural gas reserves is complex. It requires interpretations of available technical data and many assumptions, including assumptions relating to current and future economic conditions and commodity prices. Any significant inaccuracies in these interpretations or assumptions could materially affect the estimated quantities and present value of our reserves.
In order to prepare reserve estimates, we must project production rates and timing of development expenditures. We must also analyze available geological, geophysical, production and engineering data. The extent, quality and reliability of this data can vary. The process also requires economic assumptions about matters such as oil, natural gas and NGL prices, drilling and operating expenses, capital expenditures, taxes and availability of funds.
Actual future production, oil, natural gas and NGL prices, revenues, taxes, development expenditures, operating expenses and quantities of recoverable oil and natural gas reserves will vary from our estimates. Any significant variance could materially affect the estimated quantities and present value of our reserves. In addition, we may revise reserve estimates to reflect production history, results of exploration and development, existing commodity prices and other factors, many of which are beyond our control.
You should not assume that the present value of future net revenues from our reserves is the current market value of our estimated reserves. We generally base the estimated discounted future net cash flows from reserves on prices and costs on the date of the estimate. Actual future prices and costs may differ materially from those used in the present value estimate. For example, our estimated proved reserves as of June 30, 2016 were calculated under SEC rules using the unweighted arithmetic average first-day-of-the-month prices for the prior 12 months of $43.12/Bbl for oil and $2.10/MMBtu for natural gas, which for certain periods of 2016 were substantially above the available spot oil and natural gas prices. Using lower prices in estimating proved reserves would likely result in a reduction in proved reserve volumes due to economic limits.
There is a limited amount of production data from horizontal wells completed in the Wattenberg Field. As a result, reserve estimates associated with horizontal wells in this area are subject to greater uncertainty than estimates associated with reserves attributable to vertical wells in the same area.
Reserve engineers rely in part on the production history of nearby wells in establishing reserve estimates for a particular well or field. Horizontal drilling in the Wattenberg Field is a relatively recent development, whereas vertical drilling has been utilized by producers in this area for over 50 years. As a result, the amount of production data from horizontal wells available to reserve engineers is relatively small compared to that of production data from vertical wells. Until a greater number of horizontal wells have been completed in the Wattenberg Field, and a longer production history from these wells has been established, there may be a greater variance in our proved reserves on a year-over-year basis due to the transition from vertical to horizontal reserves in both the proved developed and proved undeveloped categories. We cannot assure you that any such variance would not be material and any such variance could have a material and adverse impact on our cash flows and results of operations.
Part of our strategy involves drilling using the latest available horizontal drilling and completion techniques, which involve risks and uncertainties in their application.
Our operations involve utilizing the latest drilling and completion techniques as developed by us and our service providers. As of September 30, 2016, we have drilled 293 gross one-mile equivalent horizontal wells and have
completed 245 gross one-mile equivalent horizontal wells, and therefore are subject to increased risks associated with horizontal drilling as compared to companies that have greater experience in horizontal drilling activities. Risks that we face while drilling include, but are not limited to, failing to land our wellbore in the desired drilling zone, not staying in the desired drilling zone while drilling horizontally through the formation, not running our casing the entire length of the wellbore and not being able to run tools and other equipment consistently through the horizontal wellbore. Risks that we face while completing our wells include, but are not limited to, not being able to fracture stimulate the planned number of stages, not being able to run tools the entire length of the wellbore during completion operations and not successfully cleaning out the wellbore after completion of the final fracture stimulation stage. In addition, our horizontal drilling activities may adversely affect our ability to successfully drill in one or more of our identified vertical drilling locations. Ultimately, the success of these drilling and completion techniques can only be evaluated over time as more wells are drilled and production profiles are established over a sufficiently long time period. If our drilling results are less than anticipated or we are unable to execute our drilling program because of capital constraints, lease expirations, access to gathering systems and/or commodity prices decline, the return on our investment in these areas may not be as attractive as we anticipate. Further, as a result of any of these developments we could incur material write-downs of our oil and natural gas properties and the value of our undeveloped acreage could decline in the future.
Approximately 53% of our net leasehold acreage is undeveloped, and that acreage may not ultimately be developed or become commercially productive, which could cause us to lose rights under our leases as well as have a material adverse effect on our oil and natural gas reserves and future production and, therefore, our future cash flow and income.
As of September 30, 2016, approximately 53% of our net leasehold acreage was undeveloped, without giving effect to the Bayswater Acquisition, or acreage on which wells have not been drilled or completed to a point that would permit the production of commercial quantities of oil and natural gas regardless of whether such acreage contains proved reserves. Unless production is established on the undeveloped acreage covered by our leases, such leases will expire. Our future oil and natural gas reserves and production and, therefore, our future cash flow and income are highly dependent on successfully developing our undeveloped leasehold acreage.
Substantially all of our producing properties are located in the Wattenberg Field within the DJ Basin of Colorado, making us vulnerable to risks associated with operating in one major geographic area. Specifically, as the DJ Basin is an area of high industry activity, we may be unable to hire, train or retain qualified personnel needed to manage and operate our assets.
Substantially all of our producing properties are geographically concentrated in the Wattenberg Field of Colorado, an area in which industry activity has increased rapidly. At June 30, 2016, substantially all of our total estimated proved reserves were attributable to properties located in this area. As a result of this concentration, we may be disproportionately exposed to the impact of regional supply and demand factors, delays or interruptions of production from wells in this area caused by governmental regulation, processing or transportation capacity constraints, market limitations, water shortages or other drought or extreme weather related conditions or interruption of the processing or transportation of oil, natural gas or NGL.
Specifically, demand for qualified personnel in this area, and the cost to attract and retain such personnel, has increased over the past few years and may increase substantially in the future. Moreover, our competitors, including those operating in multiple basins, may be able to offer better compensation packages to attract and retain qualified personnel than we are able to offer. Any delay or inability to secure the personnel necessary for us to continue or complete our current and planned development activities could have a negative effect on production volumes or significantly increase costs, which could have a material adverse effect on our results of operations, liquidity and financial condition.
The marketability of our production is dependent upon transportation and other facilities, certain of which we do not control. If these facilities are unavailable, our operations could be interrupted and our revenues reduced.
The marketing of oil, natural gas and NGL production depends in large part on the availability, proximity and capacity of pipelines and storage facilities, gas gathering systems and other transportation, processing and refining facilities, as well as the existence of adequate markets. If there is insufficient capacity available on these systems, or if these systems are unavailable to us, the price offered for our production could be significantly depressed, or we
could be forced to shut in some production or delay or discontinue drilling plans and commercial production following a discovery of hydrocarbons while we construct our own facility. We also rely (and expect to rely in the future) on facilities developed and owned by third parties in order to store, process, transport and sell our oil, natural gas and NGL production. Our plans to develop and sell our oil and gas reserves could be materially and adversely affected by the inability or unwillingness of third parties to provide sufficient transportation, storage or processing facilities to us, especially in areas of planned expansion where such facilities do not currently exist.
Our drilling and production programs may not be able to obtain access on commercially reasonable terms or otherwise to truck transportation, pipelines, gas gathering, transmission, storage and processing facilities to market our oil and gas production, and our initiatives to expand our access to midstream and operational infrastructure may be unsuccessful.
The marketing of oil and natural gas production depends in large part on the capacity and availability of trucks, pipelines and storage facilities, gas gathering systems and other transportation, processing and refining facilities. Access to such facilities is, in many respects, beyond our control. If these facilities are unavailable to us on commercially reasonable terms or otherwise, we could be forced to shut in some production or delay or discontinue drilling plans and commercial production following a discovery of hydrocarbons. We rely (and expect to rely in the future) on facilities developed and owned by third parties in order to store, process, transmit and sell our oil and gas production. Our plans to develop and sell our oil and gas reserves could be materially and adversely affected by the inability or unwillingness of third parties to provide sufficient facilities and services to us on commercially reasonable terms or otherwise. The amount of oil and gas that can be produced is subject to limitation in certain circumstances, such as pipeline interruptions due to scheduled and unscheduled maintenance, excessive pressure, damage to the gathering, transportation, refining or processing facilities, or lack of capacity on such facilities. For example, recent increases in activity in the Wattenberg Field have contributed to bottlenecks in processing and transportation that have negatively affected our results of operations, and these adverse effects may be disproportionately severe to us compared to our more geographically diverse competitors. Capacity constraints typically reduce the productivity of some of our older vertical wells and may on occasion limit incremental production from some of our newer horizontal wells. This constrains our production and reduces our revenue from the affected wells. Capacity constraints affecting natural gas production also impact the associated NGL. We are also dependent on the availability and capacity of oil purchasers for our production. Increases in the amount of oil that we transport out of the Wattenberg area for sale would result in an increase in our transportation costs and would reduce the price we receive for the affected production.
Similarly, the concentration of our assets within a small number of producing formations exposes us to risks, such as changes in field-wide rules, which could adversely affect development activities or production relating to those formations. In addition, in areas where exploration and production activities are increasing, as has been the case in recent years in the Wattenberg Field, we are subject to increasing competition for drilling rigs, oilfield equipment, services, supplies and qualified personnel, which may lead to periodic shortages or delays. The curtailments arising from these and similar circumstances may last from a few days to several months, and in many cases, we may be provided only limited, if any, notice as to when these circumstances will arise and their duration.
While we have undertaken initiatives to expand our access to midstream and operational infrastructure, these initiatives may be delayed or unsuccessful. As a result, our business, financial condition and results of operations could be adversely affected.
We are required to pay fees to our service providers based on minimum volumes under a long-term contract regardless of actual volume throughput.
We may enter into firm transportation, gas processing, gathering and compression service, water handling and treatment, or other agreements that require minimum volume delivery commitments. We are currently party to a firm transportation agreement that commences in November 2016 and has a ten-year term, which obligates us to meet delivery commitments of 40,000 Bbl/d in year one, 52,000 Bbl/d in year two, and 58,000 Bbl/d in years three through ten. Upon closing the Bayswater Acquisition, we became subject to two additional long-term crude oil delivery commitments, one for a term of seven years and one for a term of five years. We have total delivery commitment obligations of 5,000 Bpd in year one and 3,800 Bpd in year two through seven. We are obligated to pay fees on minimum volumes to this service provider regardless of actual volume throughput. Lower commodity prices may lead to reductions in our drilling program, which may result in insufficient production to utilize our full firm
transportation and processing capacity. As of September 30, 2016, the aggregate amount of estimated payments over the ten-year term of these agreements was $952.9 million. If we have insufficient production to meet the minimum volumes under this agreement or any other firm commitment agreement we may enter into, our cash flow from operations will be reduced, which may require us to reduce or delay our planned investments and capital expenditures or seek alternative means of financing, all of which may have a material adverse effect on our results or operations.
The prices we receive for our production may be affected by local and regional factors.
The prices we receive for our production will be determined to a significant extent by factors affecting the local and regional supply of and demand for oil and natural gas, including the adequacy of the pipeline and processing infrastructure in the region to process, and transport, our production and that of other producers. Those factors result in basis differentials between the published indices generally used to establish the price received for regional oil and natural gas production and the actual price we receive for our production, which may be lower than index prices. If the price differentials pursuant to which our production is subject were to widen due to oversupply or other factors, our revenue could be negatively impacted.
Extreme weather conditions could adversely affect our ability to conduct drilling activities in the areas where we operate.
Our exploration, exploitation and development activities and equipment could be adversely affected by extreme weather conditions, such as winter storms, which may cause a loss of production from temporary cessation of activity or lost or damaged facilities and equipment. Such extreme weather conditions could also impact other areas of our operations, including access to our drilling and production facilities for routine operations, maintenance and repairs and the availability of, and our access to, necessary third-party services, such as gathering, processing, compression and transportation services. These constraints and the resulting shortages or high costs could delay or temporarily halt our operations and materially increase our operation and capital costs, which could have a material adverse effect on our business, financial condition and results of operations.
Changes in the legal and regulatory environment governing the oil and natural gas industry, particularly changes in the current Colorado forced pooling system, could have a material adverse effect on our business.
Our business is subject to various forms of government regulation, including laws and regulations concerning the location, spacing and permitting of the oil and natural gas wells we drill, among other matters. In particular, our business utilizes a methodology available in Colorado known as “forced pooling,” which refers to the ability of a holder of an oil and natural gas interest in a particular prospective drilling spacing unit to apply to the Colorado Oil & Gas Conservation Commission (the “COGCC”) for an order forcing all other holders of oil and natural gas interests in such area into a common pool for purposes of developing that drilling spacing unit. This methodology is especially important for our operations in the Greeley area, where there are many interest holders. Changes in the legal and regulatory environment governing our industry, particularly any changes to Colorado forced pooling procedures that make forced pooling more difficult to accomplish, could result in increased compliance costs and adversely affect our business, financial condition and results of operations.
SEC rules could limit our ability to book additional proved undeveloped reserves (“PUDs”) in the future.
SEC rules require that, subject to limited exceptions, PUDs may only be booked if they relate to wells scheduled to be drilled within five years after the date of booking. This requirement has limited and may continue to limit our ability to book additional PUDs as we pursue our drilling program. Moreover, we may be required to write down our PUDs if we do not drill or plan on delaying those wells within the required five-year timeframe.
The development of our estimated proved undeveloped reserves may take longer and may require higher levels of capital expenditures than we currently anticipate. Therefore, our estimated proved undeveloped reserves may not be ultimately developed or produced.
At June 30, 2016, before giving effect to the Bayswater Acquisition, approximately 80% of our total estimated proved reserves were classified as proved undeveloped. Our approximately 129,234 MBoe of estimated proved undeveloped reserves will require an estimated $1.1 billion of development capital over the next five years.
Development of these reserves may take longer and require higher levels of capital expenditures than we currently anticipate. The future development of our proved undeveloped reserves is dependent on future commodity prices, costs and economic assumptions that align with our internal forecast, as well as access to liquidity sources, such as the capital markets, our revolving credit facility and derivative contracts. Delays in the development of our reserves, increases in costs to drill and develop such reserves, or decreases in commodity prices will reduce the PV-10 value of our estimated proved undeveloped reserves and future net revenues estimated for such reserves and may result in some projects becoming uneconomic. In addition, delays in the development of reserves could cause us to have to reclassify our proved undeveloped reserves as unproved reserves.
We participate in oil and gas leases with third parties who may not be able to fulfill their commitments to our projects.
We own less than 100% of the working interest in the oil and gas leases on which we conduct operations, and other parties will own the remaining portion of the working interest. Financial risks are inherent in any operation where the cost of drilling, equipping, completing and operating wells is shared by more than one person. We could be held liable for joint activity obligations of other working interest owners, such as nonpayment of costs and liabilities arising from the actions of other working interest owners. In addition, declines in oil, natural gas and NGL prices may increase the likelihood that some of these working interest owners, particularly those that are smaller and less established, are not able to fulfill their joint activity obligations. A partner may be unable or unwilling to pay its share of project costs, and, in some cases, a partner may declare bankruptcy. In the event any of our project partners do not pay their share of such costs, we would likely have to pay those costs, and we may be unsuccessful in any efforts to recover these costs from our partners, which could materially adversely affect our financial position.
We own non-operating interests in properties developed and operated by third parties, and as a result, we are unable to control the operation and profitability of such properties.
We participate in the drilling and completion of wells with third-party operators that exercise exclusive control over such operations. As a participant, we rely on the third-party operators to successfully operate these properties pursuant to joint operating agreements and other similar contractual arrangements.
As a participant in these operations, we may not be able to maximize the value associated with these properties in the manner we believe appropriate, or at all. For example, we cannot control the success of drilling and development activities on properties operated by third parties, which depend on a number of factors under the control of a third-party operator, including such operator’s determinations with respect to, among other things, the nature and timing of drilling and operational activities, the timing and amount of capital expenditures and the selection of suitable technology. In addition, the third-party operator’s operational expertise and financial resources and its ability to gain the approval of other participants in drilling wells will impact the timing and potential success of drilling and development activities in a manner that we are unable to control. A third-party operator’s failure to adequately perform operations, breach of the applicable agreements or failure to act in ways that are favorable to us could reduce our production and revenues, negatively impact our liquidity and cause us to spend capital in excess of our current plans, and have a material adverse effect on our financial condition and results of operations.
If commodity prices decrease to a level such that our future undiscounted cash flows from our properties are less than their carrying value for a significant period of time, we will be required to take write-downs of the carrying values of our properties.
Accounting rules require that we periodically review the carrying value of our properties for possible impairment. Based on specific market factors and circumstances at the time of prospective impairment reviews, and the continuing evaluation of development plans, production data, economics and other factors, we may be required to write down the carrying value of our properties. A write down constitutes a non-cash charge to earnings. If market or other economic conditions deteriorate or if oil, natural gas and NGL prices continue to decline, we may incur impairment charges in 2016 or later periods, which may have a material adverse effect on our results of operations.
Unless we replace our reserves with new reserves and develop those reserves, our reserves and production will decline, which would adversely affect our future cash flows and results of operations.
Producing oil and natural gas reservoirs generally are characterized by declining production rates that vary depending upon reservoir characteristics and other factors. Unless we conduct successful ongoing exploitation, development and exploration activities or continually acquire properties containing proved reserves, our proved reserves will decline as those reserves are produced. Our future reserves and production, and therefore our future cash flow and results of operations, are highly dependent on our success in efficiently developing and exploiting our current reserves and economically finding or acquiring additional recoverable reserves. We may not be able to develop, exploit, find or acquire sufficient additional reserves to replace our current and future production. If we are unable to replace our current and future production, the value of our reserves will decrease, and our business, financial condition and results of operations would be adversely affected.
Conservation measures and technological advances could reduce demand for oil, natural gas and NGL.
Fuel conservation measures, alternative fuel requirements, increasing consumer demand for alternatives to oil, natural gas and NGL, technological advances in fuel economy and energy generation devices could reduce demand for oil, natural gas and NGL. The impact of the changing demand for oil and gas services and products may have a material adverse effect on our business, financial condition, results of operations and cash flows.
We depend upon several significant purchasers for the sale of most of our oil and natural gas production. The loss of one or more of these purchasers could, among other factors, limit our access to suitable markets for the oil, natural gas and NGL we produce.
The availability of a ready market for any oil, natural gas and NGL we produce depends on numerous factors beyond the control of our management, including but not limited to the extent of domestic production and imports of oil, the proximity and capacity of pipelines, the availability of skilled labor, materials and equipment, the effect of state and federal regulation of oil and natural gas production and federal regulation of oil and gas sold in interstate commerce. In addition, we depend upon several significant purchasers for the sale of most of our oil and natural gas production. See “Business—Operations—Marketing and Customers.” We cannot assure you that we will continue to have ready access to suitable markets for our future oil and natural gas production.
The inability of one or more of our purchasers to meet their obligations may adversely affect our financial results.
We have exposure to credit risk through receivables from purchasers of our oil, natural gas and NGL production. Three purchasers accounted for more than 10% of our revenues in the year ended December 31, 2014, and four purchasers accounted for more than 10% of our revenues during the year ended December 31, 2015. This concentration of purchasers may impact our overall credit risk in that these entities may be similarly affected by changes in economic conditions or commodity price fluctuations. We do not require our customers to post collateral. The inability or failure of our significant purchasers to meet their obligations to us or their insolvency or liquidation may materially adversely affect our financial condition and results of operations.
A substantial portion of our reserves is located in urban areas, which could increase our costs of development and delay production.
A substantial portion of our reserves are located in urban portions of the Wattenberg Field, which could disproportionately expose us to operational and regulatory risk in that area. Much of our operations are within the city limits of various municipalities in northeastern Colorado. In such urban and other populated areas, we may incur additional expenses, including expenses relating to mitigation of noise, odor and light that may be emitted in our operations, expenses related to the appearance of our facilities and limitations regarding when and how we can operate. The process of obtaining permits for drilling or for gathering lines to move our production to market in such areas may be more time consuming and costly than in more rural areas. In addition, we may experience a higher rate of litigation or increased insurance and other costs related to our operations or facilities in such highly populated areas.
We may incur substantial losses and be subject to substantial liability claims as a result of our operations. Additionally, we may not be insured for, or our insurance may be inadequate to protect us against, these risks.
We are not insured against all risks. Losses and liabilities arising from uninsured and underinsured events could materially and adversely affect our business, financial condition or results of operations.
Our exploration and production activities are subject to all of the operating risks associated with drilling for and producing oil and natural gas, including the risk of fire, explosions, blowouts, surface cratering, uncontrollable flows of natural gas, oil and formation water, pipe or pipeline failures, abnormally pressured formations, casing collapses and environmental hazards such as oil spills, natural gas leaks, ruptures or discharges of toxic gases.
Any of these risks could adversely affect our ability to conduct operations or result in substantial loss to us as a result of claims for:
· injury or loss of life;
· damage to and destruction of property, natural resources and equipment;
· pollution and other environmental damage;
· regulatory investigations and penalties;
· suspension of our operations; and
· repair and remediation costs.
We may elect not to obtain insurance for any or all of these risks if we believe that the cost of available insurance is excessive relative to the risks presented. Moreover, insurance may not be available in the future at commercially reasonable costs and on commercially reasonable terms. Also, pollution and environmental risks generally are not fully insurable. The occurrence of an event that is not covered or fully covered by insurance and any delay in the payment of insurance proceeds for covered events could have a material adverse effect on our business, financial condition and results of operations.
Properties that we decide to drill may not yield oil, natural gas or NGL in commercially viable quantities.
Properties that we decide to drill that do not yield oil, natural gas or NGL in commercially viable quantities will adversely affect our results of operations and financial condition. There is no way to predict in advance of drilling and testing whether any particular prospect will yield oil or natural gas in sufficient quantities to recover drilling or completion costs or to be economically viable. The use of micro-seismic data and other technologies and the study of producing fields in the same area will not enable us to know conclusively prior to drilling whether oil or natural gas will be present or, if present, whether oil or natural gas will be present in commercial quantities. We cannot assure you that the analogies we draw from available data from other wells, more fully explored prospects or producing fields will be applicable to our drilling prospects. Further, our drilling operations may be curtailed, delayed or cancelled as a result of numerous factors, including:
· unexpected drilling conditions;
· title problems;
· pressure or lost circulation in formations;
· equipment failure or accidents;
· adverse weather conditions;
· compliance with environmental and other governmental or contractual requirements; and
· increase in the cost of, shortages or delays in the availability of, electricity, supplies, materials, drilling or workover rigs, equipment and services.
We may be unable to make accretive acquisitions or successfully integrate acquired businesses or assets, and any inability to do so may disrupt our business and hinder our ability to grow.
In the future we may make acquisitions of oil and gas properties or businesses that complement or expand our current business. The successful acquisition of oil and gas properties requires an assessment of several factors, including:
· recoverable reserves;
· future oil, natural gas and NGL prices and their applicable differentials;
· operating costs; and
· potential environmental and other liabilities.
The accuracy of these assessments is inherently uncertain and we may not be able to identify accretive acquisition opportunities. In connection with these assessments, we perform a review of the subject properties that we believe to be generally consistent with industry practices. Our review will not reveal all existing or potential problems nor will it permit us to become sufficiently familiar with the properties to assess fully their deficiencies and capabilities. Reviews may not always be performed on every well, and environmental problems, such as groundwater contamination, are not necessarily observable even when a review is performed. Even when problems are identified, the seller may be unwilling or unable to provide effective contractual protection against all or part of the problems. We often are not entitled to contractual indemnification for environmental liabilities and acquire properties on an “as is” basis. Even if we do identify accretive acquisition opportunities, we may not be able to complete the acquisition or do so on commercially acceptable terms.
The success of any completed acquisition will depend on our ability to integrate effectively the acquired business into our existing operations. The process of integrating acquired businesses may involve unforeseen difficulties and may require a disproportionate amount of our managerial and financial resources. In addition, possible future acquisitions may be larger and for purchase prices significantly higher than those paid for earlier acquisitions. No assurance can be given that we will be able to identify additional suitable acquisition opportunities, negotiate acceptable terms, obtain financing for acquisitions on acceptable terms or successfully acquire identified targets. Our failure to achieve consolidation savings, to integrate the acquired businesses and assets into our existing operations successfully or to minimize any unforeseen operational difficulties could have a material adverse effect on our financial condition and results of operations.
In addition, our debt arrangements will impose certain limitations on our ability to enter into mergers or combination transactions. Our debt arrangements will also limit our ability to incur certain indebtedness, which could indirectly limit our ability to engage in acquisitions.
We may incur losses as a result of title defects in the properties in which we invest.
It is our practice in acquiring oil and natural gas leases or interests not to incur the expense of retaining lawyers to examine the title to the mineral interest at the time of acquisition. Rather, we rely upon the judgment of lease brokers or land men who perform the fieldwork in examining records in the appropriate governmental office before attempting to acquire a lease in a specific mineral interest. The existence of a material title deficiency can render a lease worthless and can adversely affect our results of operations and financial condition. While we do typically obtain title opinions prior to commencing drilling operations on a lease or in a unit, the failure of title may not be discovered until after a well is drilled, in which case we may lose the lease and the right to produce all or a portion of the minerals under the property.
We are subject to stringent federal, state and local laws and regulations related to environmental and occupational health and safety issues that could adversely affect the cost, manner or feasibility of conducting our operations or expose us to significant liabilities.
Our operations are subject to stringent federal, state and local laws and regulations governing occupational safety and health aspects of our operations, the discharge of materials into the environment and environmental protection. These laws and regulations may impose numerous obligations applicable to our operations including the acquisition of a permit before conducting drilling and other regulated activities; the restriction of types, quantities and concentration of materials that may be released into the environment; the limitation or prohibition of drilling activities on certain lands lying within wilderness, wetlands and other protected areas; the application of specific health and safety criteria addressing worker protection; and the imposition of substantial liabilities for pollution resulting from our operations. Numerous governmental authorities, such as the U.S. Environmental Protection Agency (“EPA”) and analogous state agencies have the power to enforce compliance with these laws and regulations and the permits issued under them. Such enforcement actions often involve taking difficult and costly compliance measures or corrective actions. Failure to comply with these laws and regulations may result in the assessment of sanctions, including administrative, civil or criminal penalties, the imposition of investigatory or remedial obligations, and the issuance of orders limiting or prohibiting some or all of our operations. In addition, we may experience delays in obtaining or be unable to obtain required permits, which may delay or interrupt our operations or specific projects and limit our growth and revenue.
There is inherent risk of incurring significant environmental costs and liabilities in the performance of our operations due to our handling of petroleum hydrocarbons and other hazardous substances and wastes, as a result of air emissions and wastewater discharges related to our operations, and because of historical operations and waste disposal practices at our leased and owned properties. Spills or other releases of regulated substances, including such spills and releases that occur in the future, could expose us to material losses, expenditures and liabilities under applicable environmental laws and regulations. Under certain of such laws and regulations, we could be subject to strict, joint and several liability for the removal or remediation of previously released materials or property contamination, regardless of whether we were responsible for the release or contamination and even if our operations met previous standards in the industry at the time they were conducted. We may not be able to recover some or any of these costs from insurance. Changes in environmental laws and regulations occur frequently, and any changes that result in more stringent or costly well drilling, construction, completion or water management activities, air emissions control or waste handling, storage, transport, disposal or cleanup requirements could require us to make significant expenditures to attain and maintain compliance and may otherwise have a material adverse effect on our results of operations, competitive position or financial condition. For example, in October 2015, the EPA issued a final rule under the Clean Air Act, lowering the National Ambient Air Quality Standard (“NAAQS”) for ground-level ozone from the current standard of 75 parts per billion (“ppb”) for the current 8-hour primary and secondary ozone standards to 70 ppb for both standards. States are expected to implement more stringent requirements as a result of this new final rule, which could apply to our operations. Compliance with this more stringent standard and other environmental regulations could delay or prohibit our ability to obtain permits for operations or require us to install additional pollution control equipment, the costs of which could be significant. See “Business—Regulation of Environmental and Occupational Safety and Health Matters” for a further description of the laws and regulations that affect us.
The unavailability or high cost of additional drilling rigs, equipment, supplies, personnel and oilfield services could adversely affect our ability to execute our exploration and development plans within our budget and on a timely basis.
The demand for qualified and experienced field personnel to drill wells and conduct field operations, geologists, geophysicists, engineers and other professionals in the oil and natural gas industry can fluctuate significantly, often in correlation with oil, natural gas and NGL prices, causing periodic shortages. Historically, there have been shortages of drilling and workover rigs, pipe and other equipment as demand for rigs and equipment has increased along with the number of wells being drilled. We cannot predict whether these conditions will exist in the future and, if so, what their timing and duration will be. Such shortages could delay or cause us to incur significant expenditures that are not provided for in our capital budget, which could have a material adverse effect on our business, financial condition or results of operations.
Should we fail to comply with all applicable regulatory agency administered statutes, rules, regulations and orders, we could be subject to substantial penalties and fines.
Under the Energy Policy Act of 2005 (“EPAct 2005”), the Federal Energy Regulatory Commission (the “FERC”) has civil penalty authority under the Natural Gas Act of 1938 (“NGA”) to impose penalties for current violations of up to $1 million/d for each violation. The FERC may also impose administrative and criminal remedies and disgorgement of profits associated with any violation. While our operations have not been regulated by FERC as a natural gas company under the NGA, FERC has adopted regulations that may subject certain of our otherwise non-FERC jurisdictional facilities to FERC annual reporting requirements. We also must comply with the anti-market manipulation rules enforced by FERC. Additional rules and regulations pertaining to those and other matters may be considered or adopted by FERC from time to time. Additionally, the Federal Trade Commission (“FTC”) has regulations intended to prohibit market manipulation in the petroleum industry with authority to fine violators of the regulations civil penalties of up to $1 million/d, and the Commodity Futures Trading Commission (“CFTC”) prohibits market manipulation in the markets regulated by the CFTC, including similar anti-manipulation authority with respect to oil swaps and futures contracts as that granted to the CFTC with respect to oil purchases and sales. The CFTC rules subject violators to a civil penalty of up to the greater of $1 million or triple the monetary gain to the person for each violation. Failure to comply with those regulations in the future could subject us to civil penalty liability, as described in “Business—Regulation of the Oil and Gas Industry.”
We may be involved in legal proceedings that could result in substantial liabilities.
Like many oil and gas companies, we are from time to time involved in various legal and other proceedings, such as title, royalty or contractual disputes, regulatory compliance matters and personal injury or property damage matters, in the ordinary course of our business. Such legal proceedings are inherently uncertain and their results cannot be predicted. Regardless of the outcome, such proceedings could have an adverse impact on us because of legal costs, diversion of management and other personnel and other factors. In addition, it is possible that a resolution of one or more such proceedings could result in liability, penalties or sanctions, as well as judgments, consent decrees or orders requiring a change in our business practices, which could materially and adversely affect our business, operating results and financial condition. Accruals for such liability, penalties or sanctions may be insufficient. Judgments and estimates to determine accruals or range of losses related to legal and other proceedings could change from one period to the next, and such changes could be material.
Climate change laws and regulations restricting emissions of greenhouse gases could result in increased operating costs and reduced demand for the oil, natural gas and NGL that we produce while potential physical effects of climate change could disrupt our production and cause us to incur significant costs in preparing for or responding to those effects.
In response to findings that emissions of carbon dioxide, methane and other greenhouse gases (“GHGs”) present an endangerment to public health and the environment, the EPA has adopted regulations under existing provisions of the Clean Air Act that, among other things, establish Prevention of Significant Deterioration (“PSD”) construction and Title V operating permit reviews for GHG emissions from certain large stationary sources that are already potential major sources of certain principal, or criteria, pollutant emissions. Facilities required to obtain PSD permits for their GHG emissions also will be required to meet “best available control technology” standards that typically will be established by state agencies. In addition, the EPA has adopted rules requiring the monitoring and annual reporting of GHG emissions from specified large GHG emission sources in the United States, including certain onshore oil and natural gas production sources, which include certain of our operations.
While Congress has from time to time considered legislation to reduce emissions of GHGs, there has not been significant activity in the form of adopted legislation to reduce GHG emissions at the federal level in recent years. In the absence of such federal climate legislation, a number of state and regional efforts have emerged that are aimed at tracking and/or reducing GHG emissions by means of cap and trade programs that typically require major sources of GHG emissions to acquire and surrender emission allowances in return for emitting those GHGs. In addition, the United States is one of almost 200 nations that, in December 2015, agreed to an international climate change agreement in Paris, France (“Paris Agreement”) that calls for countries to set their own GHG emissions targets and be transparent about the measures each country will use to achieve its GHG emissions targets. Although it is not possible at this time to predict how new laws or regulations in the United States or any legal requirements imposed following the United States’ agreeing to the Paris Agreement that may be adopted or issued to address GHG
emissions would impact our business, any such future laws, regulations or legal requirements imposing reporting or permitting obligations on, or limiting emissions of GHGs from, our equipment and operations could require us to incur costs to reduce emissions of GHGs associated with our operations as well as delays or restrictions in our ability to permit GHG emissions from new or modified sources. In addition, substantial limitations on GHG emissions could adversely affect demand for the oil, natural gas and NGL we produce. Finally, it should be noted that increasing concentrations of GHGs in the Earth’s atmosphere may produce climate changes that have significant physical effects, such as increased frequency and severity of storms, floods and other climatic events; if any such effects were to occur, they could have an adverse effect on our exploration and production operations.
Federal, state and local legislative and regulatory initiatives relating to hydraulic fracturing as well as governmental reviews of such activities could result in increased costs and additional operating restrictions or delays in the completion of oil and natural gas wells and adversely affect our production.
Hydraulic fracturing is an important and common practice that is used to stimulate production of natural gas and/or oil from dense subsurface rock formations. We regularly use hydraulic fracturing as part of our operations. Hydraulic fracturing involves the injection of water, sand or alternative proppant and chemicals under pressure into targeted geological formations to fracture the surrounding rock and stimulate production.
Hydraulic fracturing is typically regulated by state oil and natural gas commissions. However, several federal agencies have asserted regulatory authority over certain aspects of the process. For example, the EPA has published final Clean Air Act (“CAA”) regulations in 2012 and, more recently, in June 2016 governing performance standards, including standards for the capture of air emissions released during oil and natural gas hydraulic fracturing, leak detection, and permitting; published in June 2016 an effluent limited guideline final rule prohibiting the discharge of wastewater from onshore unconventional oil and natural gas extraction facilities to publicly owned wastewater treatment plants; and issued in 2014 a prepublication of its Advance Notice of Proposed Rulemaking regarding Toxic Substances Control Act reporting of the chemical substances and mixtures used in hydraulic fracturing. Also, the federal Bureau of Land Management (“BLM”) published a final rule in March 2015, establishing stringent standards relating to hydraulic fracturing on federal and American Indian lands, including well casing and wastewater storage requirements and an obligation for exploration and production operators to disclose what chemicals they are using in fracturing activities; however, in June 2016, a Wyoming federal judge struck down this final rule, finding that the BLM lacked congressional authority to promulgate the rule. Also, from time to time, legislation has been introduced, but not enacted, in Congress to provide for federal regulation of hydraulic fracturing and to require disclosure of the chemicals used in the fracturing process. In the event that a new, federal level of legal restrictions relating to the hydraulic-fracturing process is adopted in areas where we operate, we may incur additional costs to comply with such federal requirements that may be significant in nature, and also could become subject to additional permitting requirements and experience added delays or curtailment in the pursuit of exploration, development, or production activities.
Several governmental reviews are underway that focus on environmental aspects of hydraulic fracturing activities. The White House Council on Environmental Quality is coordinating an administration-wide review of hydraulic fracturing practices. Also, the EPA released its draft report on the potential impacts of hydraulic fracturing on drinking water resources in June 2015, which report concluded that hydraulic fracturing activities have not led to widespread, systemic impacts on drinking water sources in the United States, although there are above and below ground mechanisms by which hydraulic fracturing activities have the potential to impact drinking water sources. However, in January 2016, the EPA’s Science Advisory Board provided its comments on the draft study, indicating its concern that EPA’s conclusion of no widespread, systemic impacts on drinking water sources arising from fracturing activities did not reflect the uncertainties and data limitations associated with such impacts, as described in the body of the draft report. The final version of this EPA report remains pending and is expected to be completed in 2016. These existing or any future studies, depending on their degree of pursuit and any meaningful results obtained, could spur efforts to further regulate hydraulic fracturing.
At the state level, Colorado, where we conduct operations, is among the states that has adopted, and other states are considering adopting, regulations that impose new or more stringent permitting, disclosure or well-construction requirements on hydraulic fracturing operations. For example, in January 2016, the COGCC approved two new rules that require increased collaborative efforts between oil and natural gas operators and local governments regarding the siting of large-scale oil and natural gas facilities in certain urban mitigation areas, and require such operators to pursue certain registrations and/or notifications of local governments with respect to future oil and natural gas
drilling and production facility locations so that they can be integrated into the local comprehensive planning process. In addition to state laws, local land use restrictions may restrict drilling in general and/or hydraulic fracturing in particular. For example, several cities in Colorado passed temporary or permanent moratoria on hydraulic fracturing within their respective cities’ limits in 2012-2013 but, since that time, local district courts struck down the ordinances for certain of those Colorado cities in 2014, which decisions were upheld by the Colorado Supreme Court in May 2016. Notwithstanding attempts at the local level to prohibit hydraulic fracturing, there exists the opportunity for cities to adopt local ordinances allowing hydraulic fracturing activities within their jurisdictions but regulating the time, place and manner of those activities. Moreover, the COGCC may pursue more stringent policies or rules and the Colorado state legislature may seek to adopt new legislation relating to oil and natural gas operations, including measures that would give local governments in Colorado greater authority to limit hydraulic fracturing and other oil and natural gas operations or require greater distances between wells sites and occupied structures.
In the event that local or state restrictions or prohibitions are adopted in areas where we conduct operations, including the Wattenberg Field in Colorado, that impose more stringent limitations on the production and development of oil and natural gas, we may incur significant costs to comply with such requirements or may experience delays or curtailment in the pursuit of exploration, development, or production activities, and possibly be limited or precluded in the drilling of wells or in the amounts that we are ultimately able to produce from our reserves. Any such increased costs, delays, cessations, restrictions or prohibitions could have a material adverse effect on our business, prospects, results of operations, financial condition, and liquidity.
Please read “Business—Regulation of Environmental and Occupational Safety and Health Matters” for a further description of the laws and regulations that affect us.
Ballot initiatives in Colorado that would impose more stringent restrictions for new oil and natural gas wells and related facilities may serve to limit future oil and natural gas exploration and production activities and could have a material adverse effect on our results of operations, financial position and business.
Certain interest groups in Colorado opposed to oil and natural gas development generally, and hydraulic fracturing in particular, have from time to time advanced various options for ballot initiatives that, if approved, would allow revisions to the state constitution in a manner that would make such exploration and production activities in the state more difficult in the future. For example, proponents of such initiatives sought to include on the Colorado November 2016 ballot certain amendments that, if approved, could, among other things, authorize local governmental control over oil and natural gas development in Colorado that could impose more stringent requirements than currently implemented under state law and impose a 2,500-foot mandatory setback between certain oil and natural gas development facilities and specified occupied structures and areas of interest. These particular amendments failed to gather enough valid signatures to be placed on the November 2016 ballot. However, one other amendment that was placed on the Colorado 2016 ballot and approved by voters, Amendment 71, now makes it more difficult to place an initiative on the state ballot. Amendment 71 requires that in order to place an initiative on a state ballot in the future, signatures from 2 percent of registered voters must be obtained in each of the state’s 35 Senate districts and, further, must be approved by 55 percent of the vote rather than a simple majority. Nonetheless, even though recent past amendments seeking to restrict oil and natural gas development in Colorado failed to be placed on the ballot and Amendment 71 now makes it more difficult to place an initiative on the ballot, should ballot initiatives or local or state restrictions or prohibitions be adopted in the future in areas where we conduct operations that impose more stringent limitations on the production and development of oil and natural gas, we may incur significant costs to comply with such requirements or may experience delays or curtailment in the pursuit of exploration, development, or production activities, and possibly be limited or precluded in the drilling of wells or in the amounts that we are ultimately able to produce from our reserves.
Rules regulating methane emissions from oil and natural gas operations could cause us to incur increased capital expenditures and operating costs or delays in production of oil and natural gas, which could have a material adverse effect on our business.
In June 2016, the EPA published final rules establishing new air emission controls for methane emissions from certain new, modified or reconstructed equipment and processes in the oil and natural gas source category, including production, processing, transmission and storage activities, as part of an overall effort to reduce methane emissions in the oil and natural gas source category by up to 45% from 2012 levels by the year 2025. The EPA’s final rules include New Source Performance Standards (“NSPS”) to limit methane emissions from equipment and processes
across the oil and natural gas source category. The rules also extend limitations on volatile organic compound (“VOC”) emissions to sources that were unregulated under the previous NSPS at Subpart OOOO. Affected methane and VOC sources include hydraulically fractured (or re-fractured) oil and natural gas well completions, fugitive emissions from well sites and compressors, and pneumatic pumps. The new methane and VOC standards require the implementation of the best system of emission reduction to achieve these emission reductions, mirroring the existing VOC standards under Subpart OOOO. Moreover, the EPA is formally seeking additional information from oil and natural gas operators to eventually expand these final rules to include air emission controls for methane emissions applicable to existing equipment and processes. These rules could require a number of modifications to our operations, including the installation of new equipment to control methane and VOC emissions from certain hydraulic fracturing wells, which could result in significant costs, including increased capital expenditures and operating costs, and could adversely impact or delay oil and natural gas production activities, which could have a material adverse effect on our business.
Competition in the oil and natural gas industry is intense, making it more difficult for us to acquire properties and market oil or natural gas.
Our ability to acquire additional prospects and to find and develop reserves in the future will depend on our ability to evaluate and select suitable properties and to consummate transactions in a highly competitive environment for acquiring properties, marketing oil and natural gas and securing trained personnel. Also, there is substantial competition for capital available for investment in the oil and natural gas industry. We may not be able to compete successfully in the future in acquiring prospective reserves, developing reserves, marketing hydrocarbons, and raising additional capital, which could have a material adverse effect on our business.
Our undeveloped acreage must be drilled before lease expiration to hold the acreage by production. In highly competitive markets for acreage, failure to drill sufficient wells to hold acreage could result in a substantial lease renewal cost or, if renewal is not feasible, loss of our lease and prospective drilling opportunities.
Unless production is established within the spacing units covering the undeveloped acres on which some of our drilling locations are identified, our leases for such acreage will expire. The cost to renew such leases may increase significantly, and we may not be able to renew such leases on commercially reasonable terms or at all. As such, our actual drilling activities may differ materially from our current expectations, which could adversely affect our business. These risks are greater at times and in areas where the pace of our exploration and development activity slows.
Declining general economic, business or industry conditions may have a material adverse effect on our results of operations, liquidity and financial condition.
Concerns over global economic conditions, energy costs, geopolitical issues, inflation, the availability and cost of credit and the United States financial market have contributed to increased economic uncertainty and diminished expectations for the global economy. In addition, continued hostilities in the Middle East and the occurrence or threat of terrorist attacks in the United States or other countries could adversely affect the global economy. These factors, combined with volatile commodity prices, declining business and consumer confidence and increased unemployment, have precipitated an economic slowdown and a recession. Concerns about global economic growth have had a significant adverse impact on global financial markets and commodity prices. If the economic climate in the United States or abroad deteriorates, worldwide demand for petroleum products could diminish, which could impact the price at which we can sell our production, affect the ability of our vendors, suppliers and customers to continue operations and ultimately adversely impact our results of operations, liquidity and financial condition.
The loss of senior management or technical personnel could adversely affect operations.
We depend on the services of our senior management and technical personnel. We do not maintain, nor do we plan to obtain, any insurance against the loss of any of these individuals. The loss of the services of our senior management or technical personnel could have a material adverse effect on our business, financial condition and results of operations.
We are susceptible to the potential difficulties associated with rapid growth and expansion and have a limited operating history.
We have grown rapidly since we began operations in late 2012. Our management believes that our future success depends on our ability to manage the rapid growth that we have experienced and the demands from increased responsibility on management personnel. The following factors could present difficulties:
· increased responsibilities for our executive level personnel;
· increased administrative burden;
· increased capital requirements; and
· increased organizational challenges common to large, expansive operations.
Our operating results could be adversely affected if we do not successfully manage these potential difficulties. The historical financial information incorporated herein is not necessarily indicative of the results that may be realized in the future. In addition, our operating history is limited and the results from our current producing wells are not necessarily indicative of success from our future drilling operations.
Increases in interest rates could adversely affect our business.
Our business and operating results can be harmed by factors such as the availability, terms and cost of capital, increases in interest rates or a reduction in credit rating. These changes could cause our cost of doing business to increase, limit our ability to pursue acquisition opportunities, reduce cash flow used for drilling and place us at a competitive disadvantage. Potential disruptions and volatility in the global financial markets may lead to a contraction in credit availability impacting our ability to finance our operations. We require continued access to capital. A significant reduction in cash flows from operations or the availability of credit could materially and adversely affect our ability to achieve our planned growth and operating results.
Our use of 2-D and 3-D seismic data is subject to interpretation and may not accurately identify the presence of oil and natural gas, which could adversely affect the results of our drilling operations.
Even when properly used and interpreted, 2-D and 3-D seismic data and visualization techniques are only tools used to assist geoscientists in identifying subsurface structures and hydrocarbon indicators and do not enable the interpreter to know whether hydrocarbons are, in fact, present in those structures. In addition, the use of 3-D seismic and other advanced technologies requires greater predrilling expenditures than traditional drilling strategies, and we could incur losses as a result of such expenditures. As a result, our drilling activities may not be successful or economical.
Adverse weather conditions may negatively affect our operating results and our ability to conduct drilling activities.
Adverse weather conditions may cause, among other things, increases in the costs of, and delays in, drilling or completing new wells, power failures, temporary shut-in of production and difficulties in the transportation of our oil, natural gas and NGL. Any decreases in production due to poor weather conditions will have an adverse effect on our revenues, which will in turn negatively affect our cash flow from operations.
Our operations are substantially dependent on the availability of water. Restrictions on our ability to obtain water may have an adverse effect on our financial condition, results of operations and cash flows.
Water is an essential component of deep shale oil and natural gas production during both the drilling and hydraulic fracturing processes. Historically, we have been able to purchase water from local land owners for use in our operations. Drought conditions have led governmental authorities to restrict the use of water subject to their jurisdiction for hydraulic fracturing to protect local water supplies. If we are unable to obtain water to use in our operations from local sources, we may be unable to produce oil, natural gas and NGL economically, which could have an adverse effect on our financial condition, results of operations and cash flows.
Restrictions on drilling activities intended to protect certain species of wildlife may adversely affect our ability to conduct drilling activities areas where we operate.
Oil and natural gas operations in our operating areas may be adversely affected by seasonal or permanent restrictions on drilling activities designed to protect various wildlife. Seasonal restrictions may limit our ability to operate in protected areas and can intensify competition for drilling rigs, oilfield equipment, services, supplies and qualified personnel, which may lead to periodic shortages when drilling is allowed. These constraints and the resulting shortages or high costs could delay our operations or materially increase our operating and capital costs. Permanent restrictions imposed to protect endangered species could prohibit drilling in certain areas or require the implementation of expensive mitigation measures. The designation of previously unprotected species in areas where we operate as threatened or endangered could cause us to incur increased costs arising from species protection measures or could result in limitations on our exploration and production activities that could have a material adverse impact on our ability to develop and produce our reserves.
The enactment of derivatives legislation could have an adverse effect on our ability to use derivative instruments to reduce the effect of commodity price, interest rate and other risks associated with our business.
The Dodd-Frank Act, enacted on July 21, 2010, established federal oversight and regulation of the over-the-counter derivatives market and of entities, such as us, that participate in that market. The Dodd-Frank Act requires the CFTC and the SEC to promulgate rules and regulations implementing the Dodd-Frank Act. In its rulemaking under the Dodd-Frank Act, in November 2013, the CFTC proposed new rules that would place limits on positions in certain core futures and equivalent swaps contracts for or linked to certain physical commodities, subject to exceptions for certain bona fide hedging transactions. As these new position limit rules are not yet final, the impact of those provisions on us is uncertain at this time. The Dodd-Frank Act and CFTC rules also will require us, in connection with certain derivatives activities, to comply with clearing and trade-execution requirements (or to take steps to qualify for an exemption to such requirements). In addition, the CFTC and certain banking regulators have recently adopted final rules establishing minimum margin requirements for uncleared swaps. Although we expect to qualify for the end-user exception to the mandatory clearing, trade-execution and margin requirements for swaps entered to hedge our commercial risks, the application of such requirements to other market participants, such as swap dealers, may change the cost and availability of the swaps that we use for hedging. In addition, if any of our swaps do not qualify for the commercial end-user exception, posting of collateral could impact liquidity and reduce cash available to us for capital expenditures, therefore reducing our ability to execute hedges to reduce risk and protect cash flow. It is not possible at this time to predict with certainty the full effects of the Dodd-Frank Act and CFTC rules on us or the timing of such effects. The Dodd-Frank Act and any new regulations could significantly increase the cost of derivative contracts, materially alter the terms of derivative contracts, reduce the availability of derivatives to protect against risks we encounter, and reduce our ability to monetize or restructure our existing derivative contracts. If we reduce our use of derivatives as a result of the Dodd-Frank Act and CFTC rules, our results of operations may become more volatile and our cash flows may be less predictable, which could adversely affect our ability to plan for and fund capital expenditures. Finally, the Dodd-Frank Act was intended, in part, to reduce the volatility of oil, natural gas and NGL prices, which some legislators attributed to speculative trading in derivatives and commodity instruments related to oil, natural gas and NGL. Our revenues could therefore be adversely affected if a consequence of the Dodd-Frank Act and CFTC rules is to lower commodity prices. Any of these consequences could have a material and adverse effect on us, our financial condition or our results of operations. In addition, the European Union and other non-U.S. jurisdictions are implementing regulations with respect to the derivatives market. To the extent we transact with counterparties in foreign jurisdictions, we may become subject to such regulations, the impact of which is not clear at this time.
Certain federal income tax deductions currently available with respect to natural gas and oil exploration and development may be eliminated, and additional state taxes on natural gas extraction may be imposed, as a result of future legislation.
In past years, legislation has been proposed that would, if enacted into law, make significant changes to U.S. tax laws, including to certain key U.S. federal income tax provisions currently available to oil and gas companies. Such legislative changes have included, but not been limited to, (i) the repeal of the percentage depletion allowance for oil and gas properties, (ii) the elimination of current deductions for intangible drilling and development costs, (iii) the elimination of the deduction for certain domestic production activities, and (iv) an extension of the amortization period for certain geological and geophysical expenditures. Congress could consider, and could include, some or all
of these proposals as part of tax reform legislation, to accompany lower federal income tax rates. Moreover, other more general features of tax reform legislation including changes to cost recovery rules and to the deductibility of interest expense may be developed that also would change the taxation of oil and gas companies. It is unclear whether these or similar changes will be enacted and, if enacted, how soon any such changes could take effect. The passage of any legislation as a result of these proposals or any similar changes in U.S. federal income tax laws could eliminate or postpone certain tax deductions that currently are available with respect to oil and gas development, or increase costs, and any such changes could have an adverse effect on the Company’s financial position, results of operations and cash flows.
We may not be able to keep pace with technological developments in our industry.
The oil and natural gas industry is characterized by rapid and significant technological advancements and introductions of new products and services using new technologies. As others use or develop new technologies, we may be placed at a competitive disadvantage or may be forced by competitive pressures to implement those new technologies at substantial costs. In addition, other oil and natural gas companies may have greater financial, technical and personnel resources that allow them to enjoy technological advantages and that may in the future allow them to implement new technologies before we can. We may not be able to respond to these competitive pressures or implement new technologies on a timely basis or at an acceptable cost. If one or more of the technologies we use now or in the future were to become obsolete, our business, financial condition or results of operations could be materially and adversely affected.
Our business could be negatively affected by security threats, including cybersecurity threats, and other disruptions.
As an oil and natural gas producer, we face various security threats, including cybersecurity threats to gain unauthorized access to sensitive information or to render data or systems unusable; threats to the security of our facilities and infrastructure or third party facilities and infrastructure, such as processing plants and pipelines; and threats from terrorist acts. The potential for such security threats has subjected our operations to increased risks that could have a material adverse effect on our business. In particular, our implementation of various procedures and controls to monitor and mitigate security threats and to increase security for our information, facilities and infrastructure may result in increased capital and operating costs. Moreover, there can be no assurance that such procedures and controls will be sufficient to prevent security breaches from occurring. If any of these security breaches were to occur, they could lead to losses of sensitive information, critical infrastructure or capabilities essential to our operations and could have a material adverse effect on our reputation, financial position, results of operations or cash flows. Cybersecurity attacks in particular are becoming more sophisticated and include, but are not limited to, malicious software, attempts to gain unauthorized access to data and systems, and other electronic security breaches that could lead to disruptions in critical systems, unauthorized release of confidential or otherwise protected information, and corruption of data. These events could lead to financial losses from remedial actions, loss of business or potential liability.
Loss of our information and computer systems could adversely affect our business.
We are dependent on our information systems and computer-based programs, including our well operations information, seismic data, electronic data processing and accounting data. If any of such programs or systems were to fail or create erroneous information in our hardware or software network infrastructure, possible consequences include our loss of communication links, inability to find, produce, process and sell oil and natural gas and inability to automatically process commercial transactions or engage in similar automated or computerized business activities. Any such consequence could have a material adverse effect on our business.
Risks Related to the Offering and our Common Stock
The requirements of being a public company, including compliance with the reporting requirements of the Securities Exchange Act of 1934, as amended (the “Exchange Act”), and the requirements of the Sarbanes-Oxley Act, may strain our resources, increase our costs and distract management, and we may be unable to comply with these requirements in a timely or cost-effective manner.
We completed our IPO in October 2016. As a public company, we must comply with various laws, regulations and requirements, certain corporate governance provisions of the Sarbanes-Oxley Act, related regulations of the SEC and the requirements of the NASDAQ, with which we were not required to comply as a private company. Complying with these statutes, regulations and requirements will occupy a significant amount of time of our board of directors and management and will significantly increase our costs and expenses. We are now required to:
· institute a more comprehensive compliance function;
· comply with rules promulgated by the NASDAQ;
· continue to prepare and distribute periodic public reports in compliance with our obligations under the federal securities laws;
· establish new internal policies, such as those relating to insider trading; and
· involve and retain to a greater degree outside counsel and accountants in the above activities.
Furthermore, while we generally must comply with Section 404 of the Sarbanes Oxley Act for our fiscal year ending December 31, 2017, we are not required to have our independent registered public accounting firm attest to the effectiveness of our internal controls until our first annual report subsequent to our ceasing to be an “emerging growth company” within the meaning of Section 2(a)(19) of the Securities Act. Accordingly, we may not be required to have our independent registered public accounting firm attest to the effectiveness of our internal controls until as late as our annual report for the fiscal year ending December 31, 2022. Once it is required to do so, our independent registered public accounting firm may issue a report that is adverse in the event it is not satisfied with the level at which our controls are documented, designed, operated or reviewed.
Any failure to develop or maintain effective internal controls, or difficulties encountered in implementing or improving our internal controls, could harm our operating results or cause us to fail to meet our reporting obligations. Moreover, if we are not able to comply with the requirements of Section 404 in a timely manner, or if in the future we or our independent registered public accounting firm identifies deficiencies in our internal controls over financial reporting that are deemed to be material weaknesses, the market price of our stock could decline, and we could be subject to sanctions or investigations by the SEC or other regulatory authorities, which would require additional financial and management resources.
In addition, we expect that being a public company subject to these rules and regulations may make it more difficult and more expensive for us to obtain director and officer liability insurance and we may be required to accept reduced policy limits and coverage or incur substantially higher costs to obtain the same or similar coverage. As a result, it may be more difficult for us to attract and retain qualified individuals to serve on our board of directors or as executive officers.
If we fail to develop or maintain an effective system of internal controls, we may not be able to accurately report our financial results or prevent fraud. If one or more material weaknesses emerge related to financial reporting, or if we otherwise fail to establish and maintain effective internal control over financial reporting, our ability to accurately report our financial results could be adversely affected. As a result, current and potential stockholders could lose confidence in our financial reporting, which would harm our business and the trading price of our common stock.
Effective internal controls are necessary for us to provide reliable financial reports, prevent fraud and operate successfully as a public company. If we cannot provide reliable financial reports or prevent fraud, our reputation and operating results would be harmed. We cannot be certain that our efforts to develop and maintain our internal
controls will be successful, that we will be able to maintain adequate controls over our financial processes and reporting in the future or that we will be able to comply with our obligations under Section 404 of the Sarbanes Oxley Act of 2002. Any failure to develop or maintain effective internal controls, or difficulties encountered in implementing or improving our internal controls, could harm our operating results or cause us to fail to meet our reporting obligations. Ineffective internal controls could also cause investors to lose confidence in our reported financial information, which would likely have a negative effect on the trading price of our common stock.
Yorktown’s funds collectively hold a substantial portion of the voting power of our common stock.
After accounting for the Private Placement, Yorktown’s funds currently collectively hold approximately 29% of our common stock. See “Security Ownership of Certain Beneficial Owners and Management” for more information regarding ownership of our common stock by the Yorktown funds. The existence of affiliated stockholders with significant aggregate holdings that may act as a group may have the effect of deterring hostile takeovers, delaying or preventing changes in control or changes in management, or limiting the ability of our other stockholders to approve transactions that they may deem to be in the best interests of our company. Moreover, this concentration of stock ownership may adversely affect the trading price of our common stock to the extent investors perceive a disadvantage in owning stock of a company with affiliated stockholders with significant aggregate holdings that may act as a group.
Conflicts of interest could arise in the future between us, on the one hand, and Yorktown and its affiliates, including its funds and their respective portfolio companies, on the other hand, concerning among other things, potential competitive business activities or business opportunities.
Yorktown’s funds are in the business of making investments in entities in the U.S. energy industry. As a result, Yorktown’s funds may, from time to time, acquire interests in businesses that directly or indirectly compete with our business, as well as businesses that are significant existing or potential customers. Yorktown’s funds and their respective portfolio companies may acquire or seek to acquire assets that we seek to acquire and, as a result, those acquisition opportunities may not be available to us or may be more expensive for us to pursue. Under our certificate of incorporation, Yorktown’s funds and/or one or more of their respective affiliates are permitted to engage in business activities or invest in or acquire businesses which may compete with our business or do business with any client of ours. Any actual or perceived conflicts of interest with respect to the foregoing could have an adverse impact on the trading price of our common stock.
Our certificate of incorporation and bylaws, as well as Delaware law, contain provisions that could discourage acquisition bids or merger proposals, which may adversely affect the market price of our common stock.
Our certificate of incorporation authorizes our board of directors to issue preferred stock without stockholder approval. If our board of directors elects to issue preferred stock in addition to the Series A Preferred Stock, it could be more difficult for a third party to acquire us. In addition, some provisions of our certificate of incorporation and bylaws could make it more difficult for a third party to acquire control of us, even if the change of control would be beneficial to our stockholders, including:
· limitations on the removal of directors;
· limitations on the ability of our stockholders to call special meetings;
· establishing advance notice provisions for stockholder proposals and nominations for elections to the board of directors to be acted upon at meetings of stockholders; and
· providing that the board of directors is expressly authorized to adopt, or to alter or repeal our bylaws.
We do not intend to pay dividends on our common stock, and our debt arrangements and the Series A Preferred Stock place certain restrictions on our ability to do so. Consequently, it is possible that your only opportunity to achieve a return on your investment will be if the price of our common stock appreciates.
We do not plan to declare dividends on shares of our common stock in the foreseeable future. Additionally, our debt arrangements and the Series A Preferred Stock restrict our ability to pay cash dividends. Consequently, it is possible that your only opportunity to achieve a return on your investment in us will be if you sell your common
stock at a price greater than you paid for it. There is no guarantee that the price of our common stock that will prevail in the market will ever exceed the price that you pay in this offering.
Future sales of our common stock in the public market could reduce our stock price, and any additional capital raised by us through the sale of equity or convertible securities may dilute your ownership in us.
We may sell additional shares of common stock in subsequent public offerings. We may also issue additional shares of common stock or convertible securities. Upon the conversion of our Series A Preferred Stock including any shares of Series A Preferred Stock that may be issued pursuant to our option to pay dividends on the Series A Preferred Stock in kind pursuant to the terms of the Certificate of Designations setting forth the terms of the Series A Preferred Stock and after the completion of this offering, we will have 190,633,537 outstanding shares of common stock. In connection with the IPO, we filed a registration statement with the SEC on Form S-8 providing for the registration of 23,000,000 shares of our common stock issued or reserved for issuance under our equity incentive plan. Subject to the satisfaction of vesting conditions, the expiration of lock-up agreements and the requirements of Rule 144, shares registered under the registration statement on Form S-8 will be available for resale immediately in the public market without restriction.
We cannot predict the size of future issuances of our common stock or securities convertible into common stock or the effect, if any, that future issuances and sales of shares of our common stock will have on the market price of our common stock. Sales of substantial amounts of our common stock (including shares issued in connection with an acquisition), or the perception that such sales could occur, may adversely affect prevailing market prices of our common stock.
The underwriters of the IPO may waive or release parties to the lock-up agreements entered into in connection with the IPO, which could adversely affect the price of our common stock.
In connection with the IPO, we and all of our directors and executive officers and certain of our stockholders have entered into lock-up agreements with respect to their common stock, pursuant to which we and they are subject to certain resale restrictions for a period of 180 days following the effectiveness date of the registration statement filed in connection with the IPO (the “IPO prospectus”). Credit Suisse Securities (USA) LLC, Barclays Capital Inc. and Goldman, Sachs & Co., at any time and without notice, may release all or any portion of the common stock subject to the foregoing lock-up agreements. If the restrictions under the lock-up agreements are waived, then common stock will be available for sale into the public markets, which could cause the market price of our common stock to decline and impair our ability to raise capital.
For as long as we are an emerging growth company, we will not be required to comply with certain reporting requirements, including those relating to accounting standards and disclosure about our executive compensation, that apply to other public companies.
We are classified as an “emerging growth company” under the JOBS Act. For as long as we are an emerging growth company, which may be up to five full fiscal years, unlike other public companies, we will not be required to, among other things, (1) provide an auditor’s attestation report on management’s assessment of the effectiveness of our system of internal control over financial reporting pursuant to Section 404(b) of the Sarbanes-Oxley Act, (2) comply with any new requirements adopted by the PCAOB requiring mandatory audit firm rotation or a supplement to the auditor’s report in which the auditor would be required to provide additional information about the audit and the financial statements of the issuer, (3) provide certain disclosure regarding executive compensation required of larger public companies or (4) hold nonbinding advisory votes on executive compensation. We will remain an emerging growth company for up to five years, although we will lose that status sooner if we have more than $1.0 billion of revenues in a fiscal year, have more than $700 million in market value of our common stock held by non-affiliates, or issue more than $1.0 billion of non-convertible debt over a three-year period.
To the extent that we rely on any of the exemptions available to emerging growth companies, you will receive less information about our executive compensation and internal control over financial reporting than issuers that are not emerging growth companies. If some investors find our common stock to be less attractive as a result, there may be a less active trading market for our common stock and our stock price may be more volatile.
We may issue additional preferred stock whose terms could adversely affect the voting power or value of our common stock.
Our certificate of incorporation authorizes us to issue, without the approval of our stockholders, one or more classes or series of preferred stock having such designations, preferences, limitations and relative rights, including preferences over our common stock respecting dividends and distributions, as our board of directors may determine. The terms of one or more classes or series of preferred stock, including the Series A Preferred Stock, could adversely impact the voting power or value of our common stock. For example, we might grant holders of preferred stock the right to elect some number of our directors in all events or on the happening of specified events or the right to veto specified transactions. Similarly, the repurchase or redemption rights or liquidation preferences we might assign to holders of preferred stock could affect the residual value of the common stock.
If securities or industry analysts do not publish research or reports about our business, if they adversely change their recommendations regarding our common stock or if our operating results do not meet their expectations, our stock price could decline.
The trading market for our common stock will be influenced by the research and reports that industry or securities analysts publish about us or our business. If one or more of these analysts cease coverage of our company or fail to publish reports on us regularly, we could lose visibility in the financial markets, which in turn could cause our stock price or trading volume to decline. Moreover, if one or more of the analysts who cover our company downgrades our common stock or if our operating results do not meet their expectations, our stock price could decline.
Our certificate of incorporation designates the Court of Chancery of the State of Delaware as the sole and exclusive forum for certain types of actions and proceedings that may be initiated by our stockholders, which could limit our stockholders’ ability to obtain a favorable judicial forum for disputes with us or our directors, officers, employees or agents.
Our certificate of incorporation provides that unless we consent in writing to the selection of an alternative forum, the Court of Chancery of the State of Delaware will, to the fullest extent permitted by applicable law, be the sole and exclusive forum for (i) any derivative action or proceeding brought on our behalf, (ii) any action asserting a claim for a breach of a fiduciary duty owed by any of our directors, officers, employees or agents to us or our stockholders, (iii) any action asserting a claim arising pursuant to any provision of the Delaware General Corporation Law (the “DGCL”), our certificate of incorporation or our bylaws, or (iv) any action asserting a claim against us that is governed by the internal affairs doctrine, in each such case subject to such Court of Chancery having personal jurisdiction over the indispensable parties named as defendants therein. Any person or entity purchasing or otherwise acquiring any interest in shares of our capital stock will be deemed to have notice of, and consented to, the provisions of our certificate of incorporation described in the preceding sentence. This choice of forum provision may limit a stockholder’s ability to bring a claim in a judicial forum that it finds favorable for disputes with us or our directors, officers, employees or agents, which may discourage such lawsuits against us and such persons. Alternatively, if a court were to find these provisions of our certificate of incorporation inapplicable to, or unenforceable in respect of, one or more of the specified types of actions or proceedings, we may incur additional costs associated with resolving such matters in other jurisdictions, which could adversely affect our business, financial condition or results of operations.
CAUTIONARY NOTE REGARDING FORWARD-LOOKING STATEMENTS
The information discussed in this prospectus and the documents and other information incorporated by reference herein includes “forward-looking statements.” All statements, other than statements of historical facts, included or incorporated by reference herein concerning, among other things, planned capital expenditures, increases in oil and gas production, the number of anticipated wells to be drilled or completed after the date hereof, future cash flows and borrowings, pursuit of potential acquisition opportunities, our financial position, business strategy and other plans and objectives for future operations, are forward-looking statements. These forward-looking statements are identified by their use of terms and phrases such as “may,” “expect,” “estimate,” “project,” “plan,” “believe,” “intend,” “achievable,” “anticipate,” “will,” “continue,” “potential,” “should,” “could,” and similar terms and phrases. Although we believe that the expectations reflected in these forward-looking statements are reasonable, they do involve certain assumptions, risks and uncertainties. Our results could differ materially from those anticipated in these forward-looking statements as a result of certain factors, including, among others:
· federal and state regulations and laws;
· capital requirements and uncertainty of obtaining additional funding on terms acceptable to us;
· risks and restrictions related to our debt agreements;
· our ability to use derivative instruments to manage commodity price risk;
· realized oil, natural gas and NGL prices;
· a decline in oil, natural gas and NGL production, and the impact of general economic conditions on the demand for oil, natural gas and NGL and the availability of capital;
· unsuccessful drilling and completion activities and the possibility of resulting write-downs;
· geographical concentration of our operations;
· our ability to meet our proposed drilling schedule and to successfully drill wells that produce oil or natural gas in commercially viable quantities;
· shortages of oilfield equipment, supplies, services and qualified personnel and increased costs for such equipment, supplies, services and personnel;
· adverse variations from estimates of reserves, production, production prices and expenditure requirements, and our inability to replace our reserves through exploration and development activities;
· incorrect estimates associated with properties we acquire relating to estimated proved reserves, the presence or recoverability of estimated oil and natural gas reserves and the actual future production rates and associated costs of such acquired properties;
· hazardous, risky drilling operations, including those associated with the employment of horizontal drilling techniques, and adverse weather and environmental conditions;
· limited control over non-operated properties;
· title defects to our properties and inability to retain our leases;
· our ability to successfully develop our large inventory of undeveloped operated and non-operated acreage;
· our ability to retain key members of our senior management and key technical employees;
· constraints in the DJ Basin of Colorado with respect to gathering, transportation and processing facilities and marketing;
· risks relating to managing our growth, particularly in connection with the integration of significant acquisitions;
· impact of environmental, health and safety, and other governmental regulations, and of current or pending legislation;
· changes in tax laws;
· effects of competition; and
· seasonal weather conditions.
Reserve engineering is a process of estimating underground accumulations of oil and natural gas that cannot be measured in an exact way. The accuracy of any reserve estimate depends on the quality of available data, the interpretation of such data and price and cost assumptions made by reserve engineers. In addition, the results of drilling, testing and production activities may justify revisions of estimates that were made previously. If significant, such revisions would change the schedule of any further production and development drilling. Accordingly, reserve estimates may differ significantly from the quantities of oil and natural gas that are ultimately recovered.
All forward-looking statements attributable to us or persons acting on our behalf are expressly qualified in their entirety by the cautionary statements in this section and elsewhere in this prospectus. Except as required by law, we do not assume a duty to update these forward-looking statements, whether as a result of new information, subsequent events or circumstances, changes in expectations or otherwise.
We will not receive any of the proceeds from the sale of shares of our common stock by the selling stockholders.
We do not anticipate declaring or paying any cash dividends to holders of our common stock in the foreseeable future. We currently intend to retain future earnings, if any, to finance the growth of our business. Our future dividend policy is within the discretion of our board of directors and will depend upon then-existing conditions, including our results of operations, financial condition, capital requirements, investment opportunities, statutory restrictions on our ability to pay dividends and other factors our board of directors may deem relevant. Additionally, our debt arrangements and the Series A Preferred Stock place certain restrictions on our ability to pay cash dividends.
SELECTED HISTORICAL AND PRO FORMA FINANCIAL DATA
The selected historical financial data as of and for the nine months ended September 30, 2016 and 2015 and the years ended December 31, 2015 and 2014 were derived from the unaudited and audited historical financial statements, respectively, of our Predecessor, included elsewhere in this prospectus. The selected unaudited pro forma statement of operations data of our Predecessor for the nine months ended September 30, 2016 and the year ended December 31, 2015 have been prepared to give pro forma effect to (i) the Financing Transactions, (ii) the Bayswater Acquisition and the March 2015 Acquisition as described under “Management’s Discussion and Analysis of Financial Condition and Results of Operations—Recent Developments,” (iii) the transactions described under “Prospectus Summary—Corporate Reorganization,” (iv) the IPO and the application of the net proceeds from the IPO, and (v) the Private Placement, as if each such transaction had been completed as of January 1, 2015. The pro forma balance sheet data of our Predecessor as of September 30, 2016 have been prepared to give pro forma effect to (i) the Bayswater Acquisition, (ii) the transactions described under “Prospectus Summary—Corporate Reorganization”, (iii) the IPO and the application of the net proceeds from the IPO, and (iv) the Private Placement, as if each such transaction had been completed on September 30, 2016. The selected unaudited pro forma financial data of our Predecessor is presented for informational purposes only and should not be considered indicative of actual results of operations that would have been achieved had these transactions been consummated on the dates indicated and do not purport to be indicative of statements of financial position or results of operations as of any future date or for any future periods.
You should read the following selected data in conjunction with “Use of Proceeds,” “Management’s Discussion and Analysis of Financial Condition and Results of Operations” and the historical and pro forma financial statements included elsewhere in this prospectus. Among other things, those historical and pro forma financial statements of our Predecessor include more detailed information regarding the basis of presentation for the following information. The historical financial results of our Predecessor are not necessarily indicative of results to be expected for any future periods.
|
|
|
|
|
Pro Forma |
| ||||||||||||||
|
|
|
Predecessor |
|
Nine Months |
|
|
| ||||||||||||
|
|
|
Nine Months Ended |
|
Year Ended |
|
Ended |
|
Year Ended |
| ||||||||||
|
|
|
2016 |
|
2015 |
|
2015 |
|
2014 |
|
2016 |
|
2015 |
| ||||||
|
|
|
(unaudited) |
|
|
|
|
|
(unaudited) |
| ||||||||||
|
|
|
(in thousands, except per unit/common share data) |
| ||||||||||||||||
|
Statements of Operations Data: |
|
|
|
|
|
|
|
|
|
|
|
|
| ||||||
|
Revenues: |
|
|
|
|
|
|
|
|
|
|
|
|
| ||||||
|
Oil sales |
|
$ |
135,896 |
|
$ |
114,768 |
|
$ |
157,024 |
|
$ |
75,460 |
|
$ |
173,272 |
|
$ |
169,414 |
|
|
Natural gas sales |
|
27,730 |
|
17,707 |
|
26,019 |
|
9,247 |
|
37,620 |
|
30,118 |
| ||||||
|
NGL sales |
|
19,773 |
|
9,153 |
|
14,707 |
|
8,133 |
|
19,773 |
|
14,727 |
| ||||||
|
Total revenues |
|
183,399 |
|
141,628 |
|
197,750 |
|
92,840 |
|
230,665 |
|
214,259 |
| ||||||
|
Operating Expenses: |
|
|
|
|
|
|
|
|
|
|
|
|
| ||||||
|
Lease operating expenses |
|
40,819 |
|
18,806 |
|
30,628 |
|
5,067 |
|
45,734 |
|
36,263 |
| ||||||
|
Production taxes |
|
16,935 |
|
12,798 |
|
17,035 |
|
9,743 |
|
20,282 |
|
18,012 |
| ||||||
|
Exploration expenses |
|
14,735 |
|
6,763 |
|
18,636 |
|
126 |
|
14,735 |
|
18,636 |
| ||||||
|
Depletion, depreciation, amortization and accretion |
|
141,317 |
|
100,170 |
|
146,547 |
|
34,042 |
|
164,413 |
|
145,071 |
| ||||||
|
Impairment of long lived assets |
|
23,350 |
|
9,525 |
|
15,778 |
|
— |
|
23,350 |
|
15,778 |
| ||||||
|
Other operating expenses |
|
891 |
|
2,353 |
|
2,353 |
|
— |
|
891 |
|
2,353 |
| ||||||
|
Acquisition transaction expenses |
|
345 |
|
6,000 |
|
6,000 |
|
— |
|
— |
|
— |
| ||||||
|
General and administrative expenses |
|
35,189 |
|
25,437 |
|
37,149 |
|
19,598 |
|
23,899 |
|
36,749 |
| ||||||
|
Total operating expenses |
|
273,581 |
|
181,852 |
|
274,126 |
|
68,576 |
|
293,304 |
|
272,862 |
| ||||||
|
Operating Income (Loss) |
|
(90,182 |
) |
(40,224 |
) |
(76,376 |
) |
24,264 |
|
(62,639 |
) |
(58,603 |
) | ||||||
|
Other Income (Expense): |
|
|
|
|
|
|
|
|
|
|
|
|
| ||||||
|
Commodity derivative gain (loss) |
|
(62,424 |
) |
38,478 |
|
79,932 |
|
48,008 |
|
(62,424 |
) |
79,932 |
| ||||||
|
Interest expense |
|
(57,914 |
) |
(36,350 |
) |
(51,030 |
) |
(22,454 |
) |
(31,775 |
) |
(42,046 |
) | ||||||
|
Other income |
|
120 |
|
36 |
|
210 |
|
24 |
|
120 |
|
210 |
| ||||||
|
Total other income (expense) |
|
(120,218 |
) |
2,164 |
|
29,112 |
|
25,578 |
|
(94,079 |
) |
38,096 |
| ||||||
|
Income (loss) before income taxes |
|
(210,400 |
) |
(38,060 |
) |
(47,264 |
) |
49,842 |
|
(156,718 |
) |
(20,507 |
) | ||||||
|
|
|
|
|
Pro Forma |
| ||||||||||||||
|
|
|
Predecessor |
|
Nine Months |
|
|
| ||||||||||||
|
|
|
Nine Months Ended |
|
Year Ended |
|
Ended |
|
Year Ended |
| ||||||||||
|
|
|
2016 |
|
2015 |
|
2015 |
|
2014 |
|
2016 |
|
2015 |
| ||||||
|
|
|
(unaudited) |
|
|
|
|
|
(unaudited) |
| ||||||||||
|
|
|
(in thousands, except per unit/common share data) |
| ||||||||||||||||
|
Income tax (expense) benefit |
|
— |
|
— |
|
— |
|
— |
|
59,552 |
|
7,792 |
| ||||||
|
Net Income (Loss) |
|
$ |
(210,400 |
) |
$ |
(38,060 |
) |
$ |
(47,264 |
) |
$ |
49,842 |
|
$ |
(97,166 |
) |
$ |
(12,715 |
) |
|
Net Income (Loss) per Unit/Common Share: |
|
|
|
|
|
|
|
|
|
|
|
|
| ||||||
|
Basic |
|
$ |
(0.63 |
) |
$ |
(0.14 |
) |
$ |
(0.17 |
) |
$ |
0.28 |
|
$ |
(0.64 |
) |
$ |
(0.17 |
) |
|
Diluted |
|
$ |
(0.63 |
) |
$ |
(0.14 |
) |
$ |
(0.17 |
) |
$ |
0.26 |
|
$ |
(0.64 |
) |
$ |
(0.17 |
) |
|
Weighted Average Units/Common Shares Outstanding: |
|
|
|
|
|
|
|
|
|
|
|
|
| ||||||
|
Basic |
|
332,377 |
|
266,844 |
|
277,322 |
|
180,429 |
|
171,835 |
|
171,835 |
| ||||||
|
Diluted |
|
332,377 |
|
266,844 |
|
277,322 |
|
189,938 |
|
171,835 |
|
171,835 |
| ||||||
|
Statements of Cash Flows Data: |
|
|
|
|
|
|
|
|
|
|
|
|
| ||||||
|
Cash provided by (used in): |
|
|
|
|
|
|
|
|
|
|
|
|
| ||||||
|
Operating activities |
|
$ |
97,563 |
|
$ |
145,561 |
|
$ |
166,683 |
|
$ |
77,390 |
|
|
|
|
| ||
|
Investing activities |
|
(280,546 |
) |
(418,599 |
) |
(520,006 |
) |
(970,640 |
) |
|
|
|
| ||||||
|
Financing activities |
|
87,263 |
|
316,952 |
|
371,404 |
|
972,090 |
|
|
|
|
| ||||||
|
Balance Sheets Data (at period end): |
|
|
|
|
|
|
|
|
|
|
|
|
| ||||||
|
Cash and cash equivalents |
|
$ |
1,386 |
|
|
|
$ |
97,106 |
|
$ |
79,025 |
|
$ |
792,722 |
|
|
| ||
|
Total assets |
|
1,573,405 |
|
|
|
1,634,140 |
|
1,201,069 |
|
2,788,488 |
|
|
| ||||||
|
Total liabilities |
|
897,170 |
|
|
|
879,908 |
|
655,881 |
|
977,878 |
|
|
| ||||||
|
Total members’/stockholders’ equity |
|
676,235 |
|
|
|
754,232 |
|
545,188 |
|
1,653,122 |
|
|
| ||||||
|
Other Financial Data: |
|
|
|
|
|
|
|
|
|
|
|
|
| ||||||
|
Adjusted EBITDAX(1) |
|
$ |
137,975 |
|
$ |
129,905 |
|
$ |
176,120 |
|
$ |
66,892 |
|
$ |
176,979 |
|
$ |
186,417 |
|
(1) Adjusted EBITDAX is a non-GAAP financial measure. For a definition of Adjusted EBITDAX and a reconciliation to our most directly comparable financial measure calculated and presented in accordance with GAAP, please read “Prospectus Summary—Summary Historical and Pro Forma Financial and Operating Data—Non-GAAP Financial Measures.”
MANAGEMENT’S DISCUSSION AND ANALYSIS OF FINANCIAL CONDITION AND RESULTS OF OPERATIONS
The following discussion and analysis should be read in conjunction with the “Summary Historical and Pro Forma Financial and Operating Data” and the accompanying financial statements and related notes included elsewhere in this prospectus. The following discussion contains forward-looking statements that reflect our future plans, estimates, beliefs and expected performance. The forward-looking statements are dependent upon events, risks and uncertainties that may be outside our control. Our actual results could differ materially from those discussed in these forward-looking statements. Factors that could cause or contribute to such differences include, but are not limited to, market prices for oil, natural gas and NGL, production volumes, estimates of proved reserves, capital expenditures, economic and competitive conditions, regulatory changes and other uncertainties, as well as those factors discussed below and elsewhere in this prospectus, particularly in “Risk Factors” and “Cautionary Note Regarding Forward-Looking Statements,” all of which are difficult to predict. In light of these risks, uncertainties and assumptions, the forward-looking events discussed may not occur. We do not undertake any obligation to publicly update any forward-looking statements except as otherwise required by applicable law.
Executive Summary
We are an independent oil and gas company focused on the acquisition, development and production of crude oil, natural gas and NGL reserves in the Rocky Mountain region of the United States, primarily in the Wattenberg Field. We have developed an oil, natural gas and NGL asset base of proved reserves, as well as a portfolio of development drilling opportunities on high resource-potential leasehold on contiguous acreage blocks in the Wattenberg Field. We are focused on growing our proved reserves and production primarily through the development of our large inventory of identified liquids-rich horizontal drilling locations.
Our Properties
We have assembled, as of September 30, 2016, approximately 100,000 net acres of large, contiguous acreage blocks in some of the most productive areas of the Wattenberg Field as indicated by the results of our horizontal drilling program and the results of offset operators. Additionally, we hold approximately 120,000 net acres in the DJ Basin, which we refer to as our “Northern Extension Area,” that we believe is prospective for many of the same formations as our properties in the Wattenberg Field. We operated 96% of our horizontal production for the nine months ended September 30, 2016 and as of June 30, 2016, our total estimated proved reserves were approximately 187.3 MMBoe, after giving effect to the Bayswater Acquisition, of which approximately 23% were classified as proved developed reserves. For more information about our properties, please read “Business—Our Properties.”
Recent Developments
Bayswater Acquisition
On July 29, 2016, we entered into a definitive agreement with subsidiaries of Bayswater Exploration & Production to acquire additional oil and gas properties primarily located in the Wattenberg Field for total consideration of approximately $419.0 million in cash after customary purchase price adjustments. The Bayswater Acquisition consist of working interests in approximately 6,100 net acres, and had a net daily production of approximately 8,600 net BOE/d for the three months ended September 30, 2016. As of September 30, 2016, the Bayswater Acquisition included 31 gross (19 net) drilled but uncompleted wells. We expect the majority of these drilled but uncompleted wells to be brought online in the first half of 2017. We closed the Bayswater Acquisition on October 3, 2016.
Option to Acquire Additional Assets from the Bayswater Acquisition
Upon the closing of the Bayswater Acquisition, we made a $10.0 million non-refundable payment for an option to purchase additional assets from the seller of the Bayswater Acquisition for an additional $190.0 million, for a total purchase price for the Additional Assets of $200.0 million. The option may be exercised at any time until March 31, 2017. If we do not exercise the option to acquire the Additional Assets, the seller will have the right until April 30, 2017 to elect to sell those assets to the Company for an additional $120.0 million, for a total purchase price
for the Additional Assets of $130.0 million. The Additional Assets include approximately 9,100 net acres of leasehold and related producing and non-producing properties located primarily in Weld County, and to a lesser extent Adams and Arapahoe Counties, Colorado, along with various other related rights, permits, contracts, equipment, rights of way, gathering systems and other assets. The Additional Assets would provide new development opportunities in the DJ Basin.
Initial Public Offering
On October 17, 2016, we completed an initial public offering of 33.3 million shares of our common stock at a price to the public of $19.00 per share and we became a publicly traded company listed on NASDAQ under the ticker symbol “XOG”. After deducting underwriting discounts and commissions and estimated offering expenses payable by us, we received approximately $683.7 million of aggregate net proceeds from our IPO, after the underwriters exercised their option on October 24, 2016 to purchase 5.0 million additional shares in full.
Senior Notes and the Redemption of Second Lien Notes
In July 2016, we closed a private offering of our unsecured 7.875% Senior Notes due 2021 that resulted in net proceeds of approximately $537.5 million. Our Senior Notes bear interest at an annual rate of 7.875%. Interest on our Senior Notes is payable on January 15 and July 15 of each year, and the first interest payment will be due on January 15, 2017. Our Senior Notes will mature on July 15, 2021. A portion of the proceeds of the 2016 Notes Offering was used to repay all of the outstanding borrowings and related premium, fees and expenses under our Second Lien Notes and terminate such notes, and the remaining proceeds were used to repay borrowings under our revolving credit facility and for general business purposes, including acquisitions. Our Senior Notes are guaranteed by all of our current and future restricted subsidiaries (other than Extraction Finance Corp., the co-issuer of our Senior Notes).
Convertible Preferred Securities
On October 3, 2016, Holdings issued to affiliates of Apollo Capital Management $75.0 million in Series A Preferred Units to fund a portion of the purchase price for the Bayswater Acquisition. The Series A Preferred Units were entitled to receive a cash dividend of 10% per year, payable quarterly in arrears. We used $90.0 million of the net proceeds from the IPO to redeem the Series A Preferred Units in full, which included a premium of $15.0 million.
In addition, Holdings issued to, among others, investment funds affiliated with OZ Management LP and Yorktown $185.3 million in Series B Preferred Units to fund a portion of the purchase price for the Bayswater Acquisition. The Series B Preferred Units were entitled to receive a cash dividend of 10% per year, payable quarterly in arrears, and Holdings had the ability to pay up to 50% of the quarterly dividend in kind. The Series B Preferred Units were converted in connection with the closing of the IPO into shares of our Series A Preferred Stock.
Series A Preferred Stock
In connection with the consummation of the IPO, we issued 185,280 shares of our Series A Preferred Stock to the holders of Holdings’ Series B Preferred Units in conversion of such units. The Series A Preferred Stock is entitled to receive a cash dividend of 5.875% per year, payable quarterly in arrears, and we have the ability to pay such quarterly dividends in kind at a dividend rate of 10% per year (decreased proportionately to the extent such quarterly dividends are paid in cash). Beginning on or after the later of (a) 90 days after the closing of the IPO and (b) the Lock-Up Period End Date, the Series A Preferred Stock will be convertible into shares of our common stock at the election of the holders of the Series A Preferred Stock at a conversion ratio per share of Series A Preferred Stock of 61.9195. Beginning on or after the Lock-Up Period End Date until the three year anniversary of the closing of the IPO, we may elect to convert the Series A Preferred Stock at a conversion ratio per share of Series A Preferred Stock of 61.9195, but only if the closing price of our common stock trades at or above a certain premium to our initial offering price, such premium to decrease with time. In certain situations, including a change of control, the Series A Preferred Stock may be redeemed for cash in an amount equal to the greater of (i) 135% of the liquidation preference of the Series A Preferred Stock and (ii) a 17.5% annualized internal rate of return on the liquidation preference of the Series A Preferred Stock. The Series A Preferred Stock matures on October 15, 2021,
at which time they are mandatorily redeemable for cash at the liquidation preference. See “Description of Capital Stock — Preferred Stock — Series A Preferred Stock.”
Private Placement of Common Stock
On December 15, 2016, we issued 25,041,041 shares of common stock, at a price of $18.25 per share, in connection with the Private Placement. The Private Placement resulted in approximately $457.0 million of gross proceeds and approximately $441.8 million of net proceeds (after deducting placement agent commissions and our expenses).
Recent Acquisitions
We recently closed on two separate transactions from unrelated sellers to acquire approximately 16,800 net acres in the DJ Basin for aggregate cash consideration of approximately $177 million. The acquisitions include de minimis oil and gas production and approximately 425 net 1-mile equivalent drilling locations. Net proceeds from the Private Placement were used, in part, to replenish cash used to pay the cash consideration of the acquisitions.
Public Company Expenses
General and administrative expenses related to being a publicly traded company include: Exchange Act reporting expenses; expenses associated with Sarbanes-Oxley compliance; expenses associated with listing on the NASDAQ; incremental independent auditor fees; incremental legal fees; investor relations expenses; registrar and transfer agent fees; incremental director and officer liability insurance costs; and director compensation. As a publicly traded company, we expect that general and administrative expenses will increase in future periods.
Income Taxes
In conjunction with the IPO, we converted from a limited liability company into a corporation. Prior to this conversion, we were not subject to federal or state income taxes. Accordingly, the financial data attributable to us prior to such conversion contain no provision for federal or state income taxes because the tax liability with respect to our taxable income was passed through to our members. Beginning October 12, 2016, we began to be taxed as a C corporation under the Internal Revenue Code and subject to federal and state income taxes at a blended statutory rate of approximately 38% of pretax earnings.
How We Evaluate Our Operations
We use a variety of financial and operational metrics to assess the performance of our oil and gas operations, including:
· Sources of revenue;
· Sales volumes;
· Realized prices on the sale of oil, natural gas and NGL, including the effect of our commodity derivative contracts;
· Lease operating expenses (“LOE”);
· Capital expenditures; and
· Adjusted EBITDAX (a Non-GAAP measure).
Sources of Our Revenues
Our revenues are derived from the sale of our oil and natural gas production, as well as the sale of NGL that are extracted from our natural gas during processing. Our oil, natural gas and NGL revenues do not include the effects of derivatives. For the nine months ended September 30, 2016, our revenues were derived 74% from oil sales, 15%
from natural gas sales and 11% from NGL sales. For the nine months ended September 30, 2015, our revenues were derived 81% from oil sales, 13% from natural gas sales and 6% from NGL sales. For the year ended December 31, 2015, our revenues were derived 79% from oil sales, 13% from natural gas sales and 8% from NGL sales. For the year ended December 31, 2014, our revenues were derived 81% from oil sales, 10% from natural gas sales and 9% from NGL sales. Our revenues may vary significantly from period to period as a result of changes in volumes of production sold or changes in commodity prices.
Sales Volumes
The following table presents historical sales volumes for our properties for the nine months ended September 30, 2016 and 2015, respectively and for the years ended December 31, 2015 and 2014:
|
|
|
For the Nine Months Ended |
|
For the Years Ended |
| ||||
|
|
|
2016 |
|
2015 |
|
2015 |
|
2014 |
|
|
Oil (MBbl) |
|
3,808.4 |
|
2,792.3 |
|
3,945.6 |
|
1,022.2 |
|
|
Natural gas (MMcf) |
|
12,851.3 |
|
7,224.9 |
|
10,823.0 |
|
2,664.1 |
|
|
NGL (MBbl) |
|
1,478.9 |
|
857.1 |
|
1,334.6 |
|
325.3 |
|
|
Total (MBoe) |
|
7,429.2 |
|
4,853.6 |
|
7,084.0 |
|
1,791.5 |
|
|
Average net sales (BOE/d) |
|
27,113.8 |
|
17,778.6 |
|
19,408.3 |
|
4,908.3 |
|
As reservoir pressures decline, production from a given well or formation decreases. Growth in our future production and reserves will depend on our ability to continue to add proved reserves in excess of our production. Accordingly, we plan to maintain our focus on adding reserves through organic growth as well as acquisitions. Our ability to add reserves through development projects and acquisitions is dependent on many factors, including takeaway capacity in our areas of operation and our ability to raise capital, obtain regulatory approvals, procure contract drilling rigs and personnel and successfully identify and consummate acquisitions.
Realized Prices on the Sale of Oil, Natural Gas and NGL
Our results of operations depend upon many factors, particularly the price of oil, natural gas and NGL and our ability to market our production effectively. Oil, natural gas and NGL prices are among the most volatile of all commodity prices. For example, during the period from January 1, 2014 to October 15, 2016, NYMEX West Texas Intermediate oil prices ranged from a high of $107.26 per Bbl to a low of $26.21 per Bbl. Average daily prices for NYMEX Henry Hub gas ranged from a high of $6.15 per MMBtu to a low of $1.64 per MMBtu during the same period. Declines in, and continued depression of, the price of oil and natural gas occurring during 2015 and continuing during 2016 are due to a combination of factors including increased U.S. supply and global economic concerns. These price variations can have a material impact on our financial results and capital expenditures.
Oil pricing is predominately driven by the physical market, supply and demand, financial markets and national and international politics. The NYMEX WTI futures price is a widely used benchmark in the pricing of domestic and imported oil in the United States. The actual prices realized from the sale of oil differ from the quoted NYMEX WTI price as a result of quality and location differentials. In the Wattenberg Field, oil is sold under various purchase contracts with monthly pricing provisions based on NYMEX pricing, adjusted for differentials.
Natural gas prices vary by region and locality, depending upon the distance to markets, availability of pipeline capacity and supply and demand relationships in that region or locality. The NYMEX Henry Hub price of natural gas is a widely used benchmark for the pricing of natural gas in the United States. Similar to oil, the actual prices realized from the sale of natural gas differ from the quoted NYMEX Henry Hub price as a result of quality and location differentials. For example, wet natural gas with a high Btu content sells at a premium to low Btu content dry natural gas because it yields a greater quantity of NGL. Location differentials to NYMEX Henry Hub prices result from variances in transportation costs based on the natural gas’ proximity to the major consuming markets to which it is ultimately delivered. Also affecting the differential is the processing fee deduction retained by the natural gas processing plant generally in the form of percentage of proceeds. The price we receive for our natural gas produced in the Wattenberg Field is based on CIG prices, adjusted for certain deductions.
Our price for NGL produced in the Wattenberg Field is based on a combination of prices from the Conway hub in Kansas and Mont Belvieu in Texas where this production is marketed.
The following table provides the high and low prices for NYMEX WTI and NYMEX Henry Hub prompt month contract prices and our differential to the average of those benchmark prices for the periods indicated. In the table below, the NYMEX averages and our average realized prices, with and without derivative settlements, are calculated based on the average of each month’s prices for the periods indicated. The differential varies, but our oil, natural gas and NGL normally sells at a discount to the NYMEX WTI and NYMEX Henry Hub price, as applicable.
|
|
|
Nine Months Ended September 30, |
|
Year Ended December 31, |
| ||||||||
|
|
|
2016 |
|
2015 |
|
2015 |
|
2014 |
| ||||
|
Oil |
|
|
|
|
|
|
|
|
| ||||
|
NYMEX WTI High ($/Bbl) |
|
$ |
51.23 |
|
$ |
61.43 |
|
$ |
61.43 |
|
$ |
107.26 |
|
|
NYMEX WTI Low ($/Bbl) |
|
$ |
26.21 |
|
$ |
38.24 |
|
$ |
34.73 |
|
$ |
53.27 |
|
|
NYMEX WTI Average ($/Bbl) |
|
$ |
41.33 |
|
$ |
51.00 |
|
$ |
48.80 |
|
$ |
93.00 |
|
|
Average Realized Price ($/Bbl) |
|
$ |
35.86 |
|
$ |
40.95 |
|
$ |
39.85 |
|
$ |
81.48 |
|
|
Average Realized Price, with derivative settlements ($/Bbl) |
|
$ |
41.99 |
|
$ |
55.58 |
|
$ |
53.97 |
|
$ |
83.59 |
|
|
Average Realized Price as a % of Average NYMEX WTI |
|
86.8 |
% |
80.3 |
% |
81.7 |
% |
87.6 |
% | ||||
|
Differential ($/Bbl) to Average NYMEX WTI |
|
$ |
(5.47 |
) |
$ |
(10.06 |
) |
$ |
(8.94 |
) |
$ |
(11.52 |
) |
|
Natural Gas |
|
|
|
|
|
|
|
|
| ||||
|
NYMEX Henry Hub High ($/MMBtu) |
|
$ |
3.06 |
|
$ |
3.23 |
|
$ |
3.23 |
|
$ |
6.15 |
|
|
NYMEX Henry Hub Low ($/MMBtu) |
|
$ |
1.64 |
|
$ |
2.49 |
|
$ |
1.76 |
|
$ |
2.89 |
|
|
NYMEX Henry Hub Average ($/MMBtu) |
|
$ |
2.34 |
|
$ |
2.76 |
|
$ |
2.63 |
|
$ |
4.28 |
|
|
Average Realized Price ($/Mcf) |
|
$ |
2.14 |
|
$ |
2.47 |
|
$ |
2.43 |
|
$ |
4.11 |
|
|
Average Realized Price, with derivative settlements ($/Mcf) |
|
$ |
2.84 |
|
$ |
2.79 |
|
$ |
2.82 |
|
$ |
4.11 |
|
|
Average Realized Price as a % of Average NYMEX Henry Hub |
|
83.2 |
% |
81.4 |
% |
84.0 |
% |
87.3 |
% | ||||
|
Differential ($/Mcf) to Average NYMEX Henry Hub(1) |
|
$ |
(0.43 |
) |
$ |
(0.57 |
) |
$ |
(0.46 |
) |
$ |
(0.60 |
) |
|
NGL |
|
|
|
|
|
|
|
|
| ||||
|
Average Realized Price ($/Bbl) |
|
$ |
13.24 |
|
$ |
10.81 |
|
$ |
11.02 |
|
$ |
27.20 |
|
|
Averaged Realized Price as a % of Average NYMEX WTI |
|
32.0 |
% |
21.5 |
% |
22.6 |
% |
29.2 |
% | ||||
(1) Based on the difference between our average realized price and the NYMEX Henry Hub Average as converted into Mcf. settlement price.
Derivative Arrangements
To achieve more predictable cash flow and to reduce our exposure to adverse fluctuations in commodity prices, from time to time we enter into derivative arrangements for our oil and natural gas production. By removing a significant portion of price volatility associated with our oil production, we believe we will mitigate, but not eliminate, the potential negative effects of reductions in oil prices on our cash flow from operations for those periods. However, in a portion of our current positions, our hedging activity may also reduce our ability to benefit from increases in oil and natural gas prices. We will sustain losses to the extent our derivatives contract prices are lower than market prices and, conversely, we will sustain gains to the extent our derivatives contract prices are higher than market prices. In certain circumstances, where we have unrealized gains in our derivative portfolio, we may choose to restructure existing derivative contracts or enter into new transactions to modify the terms of current contracts in order to realize the current value of our existing positions. See “—Quantitative and Qualitative Disclosure About Market Risk—Commodity Price Risk” for information regarding our exposure to market risk, including the effects of changes in commodity prices, and our commodity derivative contracts.
We will continue to use commodity derivative instruments to hedge our price risk in the future. Our hedging strategy and future hedging transactions will be determined at our discretion and may be different than what we have done on a historical basis. As a result of recent volatility in the price of oil and natural gas, we have relied on a variety of hedging strategies and instruments to hedge our future price risk. We have utilized swaps, put options, and call options, which in some instances require the payment of a premium, to reduce the effect of price changes on a
portion of our future oil and natural gas production. We expect to continue to use a variety of hedging strategies and instruments for the foreseeable future.
A swap has an established fixed price. When the settlement price is below the fixed price, the counterparty pays us an amount equal to the difference between the settlement price and the fixed price multiplied by the hedged contract volume. When the settlement price is above the fixed price, we pay our counterparty an amount equal to the difference between the settlement price and the fixed price multiplied by the hedged contract volume.
A put option has an established floor price. The buyer of the put option pays the seller a premium to enter into the put option. When the settlement price is below the floor price, the seller pays the buyer an amount equal to the difference between the settlement price and the strike price multiplied by the hedged contract volume. When the settlement price is above the floor price, the put option expires worthless. Some of our purchased put options have deferred premiums. For the deferred premium puts, we agreed to pay a premium to the counterparty at the time of settlement.
A call option has an established ceiling price. The buyer of the call option pays the seller a premium to enter into the call option. When the settlement price is above the ceiling price, the seller pays the buyer an amount equal to the difference between the settlement price and the strike price multiplied by the hedged contract volume. When the settlement price is below the ceiling price, the call option expires worthless.
We combine swaps, purchased put options, sold put options, and sold call options in order to achieve various hedging strategies. Some examples of our hedging strategies are collars which include purchased put options and sold call options, three-way collars which include purchased put options, sold put options, and sold call options, and enhanced swaps, which include either sold put options or sold call options with the associated premiums rolled into an enhanced fixed price swap.
We have historically relied on commodity derivative contracts to mitigate our exposure to lower commodity prices. We have historically been able to hedge our oil and natural gas production at prices that are significantly higher than current strip prices. However, in the current commodity price environment, our ability to enter into comparable derivative arrangements at favorable prices may be limited, and, we are not obligated to hedge a specific portion of our oil or natural gas production.
Our open positions as of September 30, 2016 were as follows:
|
|
|
2016 |
|
2017 |
|
2018 |
| |||
|
NYMEX WTI(1) Crude Swaps: |
|
|
|
|
|
|
| |||
|
Notional volume (Bbl) |
|
525,000 |
|
1,950,000 |
|
— |
| |||
|
Weighted average fixed price ($/Bbl) |
|
$ |
38.70 |
|
$ |
43.91 |
|
|
| |
|
NYMEX WTI(1) Crude Purchased Puts: |
|
|
|
|
|
|
| |||
|
Notional volume (Bbl) |
|
1,125,000 |
|
4,000,000 |
|
— |
| |||
|
Weighted average purchase put price ($/Bbl) |
|
$ |
51.44 |
|
$ |
46.15 |
|
|
| |
|
NYMEX WTI(1) Crude Sold Calls: |
|
|
|
|
|
|
| |||
|
Notional volume (Bbl) |
|
839,000 |
|
4,000,000 |
|
100,000 |
| |||
|
Weighted average fixed price ($/Bbl) |
|
$ |
55.15 |
|
$ |
53.39 |
|
$ |
55.00 |
|
|
NYMEX WTI(1) Crude Sold Puts: |
|
|
|
|
|
|
| |||
|
Notional volume (Bbl) |
|
750,000 |
|
3,800,000 |
|
— |
| |||
|
Weighted average purchased put price ($/Bbl) |
|
$ |
45.00 |
|
$ |
36.41 |
|
|
| |
|
NYMEX HH(2) Natural Gas Swaps: |
|
|
|
|
|
|
| |||
|
Notional volume (MMBtu) |
|
3,315,000 |
|
20,620,000 |
|
1,200,000 |
| |||
|
Weighted average fixed price ($/MMBtu) |
|
$ |
3.09 |
|
$ |
3.02 |
|
$ |
3.03 |
|
|
CIG(3) Basis Gas Swaps: |
|
|
|
|
|
|
| |||
|
Notional volume (MMBtu) |
|
990,000 |
|
990,000 |
|
— |
| |||
|
Weighted average fixed basis price ($/MMBtu) |
|
$ |
(0.19 |
) |
$ |
(0.19 |
) |
|
| |
(1) NYMEX WTI refers to West Texas Intermediate crude oil price on the New York Mercantile Exchange
(2) NYMEX HH refers to the Henry Hub natural gas price on the New York Mercantile Exchange
(3) CIG refers to the NYMEX HH settlement price less the fixed basis price, the Rocky Mountains (CIGC) Inside FERC settlement price.
The following table summarizes our historical derivative positions and the settlement amounts for each of the periods indicated.
|
|
|
Nine Months |
|
Year Ended |
|
Year Ended |
| |||
|
NYMEX HH(1) Natural Gas Swaps: |
|
|
|
|
|
|
| |||
|
Notional volume (MMBtu) |
|
9,879,600 |
|
6,444,552 |
|
761,766 |
| |||
|
Weighted average fixed price ($/MMBtu) |
|
$ |
3.15 |
|
$ |
3.27 |
|
$ |
3.92 |
|
|
CIG(3) Basis Gas Swaps: |
|
|
|
|
|
|
| |||
|
Notional volume (MMBtu) |
|
1,980,000 |
|
— |
|
— |
| |||
|
Weighted average fixed price ($/MMBtu) |
|
$ |
(0.19 |
) |
$ |
|
|
$ |
|
|
|
NYMEX WTI(2) Crude Swaps: |
|
|
|
|
|
|
| |||
|
Notional volume (Bbl) |
|
1,464,060 |
|
1,293,769 |
|
262,993 |
| |||
|
Weighted average fixed price ($/Bbl) |
|
$ |
43.01 |
|
$ |
76.24 |
|
$ |
94.65 |
|
|
NYMEX WTI(2) Crude Sold Puts: |
|
|
|
|
|
|
| |||
|
Notional volume (Bbl) |
|
1,350,000 |
|
— |
|
— |
| |||
|
Weighted average sold put price ($/Bbl) |
|
$ |
44.89 |
|
$ |
|
|
$ |
|
|
|
NYMEX WTI(2) Crude Purchased Puts: |
|
|
|
|
|
|
| |||
|
Notional volume (Bbl) |
|
3,599,150 |
|
1,943,588 |
|
— |
| |||
|
Weighted average purchased put price ($/Bbl) |
|
$ |
51.94 |
|
$ |
57.67 |
|
$ |
|
|
|
NYMEX WTI(2) Crude Sold Calls: |
|
|
|
|
|
|
| |||
|
Notional volume (Bbl) |
|
1,947,090 |
|
1,943,588 |
|
— |
| |||
|
Weighted average sold call price ($/Bbl) |
|
$ |
61.29 |
|
$ |
67.21 |
|
$ |
|
|
|
NYMEX WTI(2) Crude Purchased Calls: |
|
|
|
|
|
|
| |||
|
Notional volume (Bbl) |
|
216,000 |
|
— |
|
— |
| |||
|
Weighted average purchased call price ($/Bbl) |
|
$ |
69.58 |
|
$ |
|
|
$ |
|
|
|
Total Amounts Received/(Paid) from Settlement (in thousands) |
|
$ |
37,948 |
|
$ |
59,785 |
|
$ |
3,974 |
|
|
Cash provided by (used in) changes in Accounts Receivable and Accounts Payable related to Commodity Derivatives |
|
$ |
5,067 |
|
$ |
(4,015 |
) |
$ |
(2,250 |
) |
|
Cash Settlements on Commodity Derivatives per Consolidated Statements of Cash Flows |
|
$ |
43,015 |
|
$ |
55,770 |
|
$ |
1,724 |
|
(1) NYMEX HH refers to the Henry Hub natural gas price on the New York Mercantile Exchange.
(2) NYMEX WTI refers to West Texas Intermediate crude oil price on the New York Mercantile Exchange.
(3) CIG refers to the NYMEX HH settlement price less the fixed basis price, the Rocky Mountains (CIGC) Inside FERC
We recently updated our 2017 hedge position and currently have the following commodity derivative positions through the fourth quarter of 2017: (i) approximately 1,500 MBbls of oil hedged with swaps that have an average swap price of $43.84/Bbl, (ii) approximately 6,250 MBbls of oil hedged with collars that have average floor and ceiling prices of $47.70/Bbl and $55.94/Bbl, respectively, and (iii) approximately 25,420,000 MMBtu of natural gas hedged with swaps that have an average swap price of $3.06/MMBtu.
Lease Operating Expenses
All direct and allocated indirect costs of lifting hydrocarbons from a producing formation to the surface constituting part of the current operating expenses of a working interest. Such costs include labor, superintendence, supplies, repairs, maintenance, allocated overhead charges, workover, insurance and other expenses incidental to production, but exclude lease acquisition or drilling or completion expenses. LOEs also include expenses incurred to gather and deliver natural gas to the processing plant and/or selling point.
Capital Expenditures
For the nine months ended September 30, 2016, our aggregate drilling, completion and leasehold capital expenditures was approximately $203.1 million, excluding acquisitions. We intend to allocate approximately $335.0 million of our 2016 capital budget to the drilling of 100 gross (90 net) wells and the completion of 92 gross (82 net) wells, approximately $5.0 million to midstream, and approximately $25.0 million to leaseholds. As of
September 30, 2016, 69 gross (60 net) of the 100 gross (90 net) budgeted have been drilled, and 55 gross (44 net) of the 92 gross (82 net) wells have been completed. Our capital budget excludes any amounts that were or may be paid for potential acquisitions, including the Bayswater Acquisition.
Our 2017 capital budget is approximately $795-935 million, substantially all of which we intend to allocate to the DJ Basin. We intend to allocate approximately $675-775 million of our 2017 capital budget to the drilling of 185-190 gross operated wells and the completion of 190-195 gross operated wells, approximately $60-80 million to land, midstream and other uses, and approximately $60-80 million to non-operated drilling and completion. We are currently running an effective three-rig program.
The amount and timing of these capital expenditures is within our control and subject to our management’s discretion. We retain the flexibility to defer a portion of these planned capital expenditures depending on a variety of factors, including but not limited to the success of our drilling activities, prevailing and anticipated prices for oil, natural gas and NGL, the availability of necessary equipment, infrastructure and capital, the receipt and timing of required regulatory permits and approvals, seasonal conditions, drilling and acquisition costs and the level of participation by other interest owners. Any postponement or elimination of our development drilling program could result in a reduction of proved reserve volumes and related standardized measure. These risks could materially affect our business, financial condition and results of operations.
Adjusted EBITDAX
Adjusted EBITDAX is not a measure of net income (loss) as determined by GAAP. Adjusted EBITDAX is a supplemental non-GAAP financial measure that is used by management and external users of our predecessor’s financial statements, such as industry analysts, investors, lenders and rating agencies. We define Adjusted EBITDAX as net income (loss) adjusted for certain cash and non-cash items, including DD&A, impairment of long lived assets, exploration expenses, rig termination fees, acquisition transaction expenses, commodity derivative (gain) loss, settlements on commodity derivatives, premiums paid for derivatives that settled during the period, unit-based compensation expense, amortization of debt discount and debt issuance costs, interest expense, income taxes and non-recurring charges.
Management believes Adjusted EBITDAX is useful because it allows us to more effectively evaluate our operating performance and compare the results of our operations from period to period without regard to our financing methods or capital structure. We exclude the items listed above from net income (loss) in arriving at Adjusted EBITDAX because these amounts can vary substantially from company to company within our industry depending upon accounting methods and book values of assets, capital structures and the method by which the assets were acquired. Adjusted EBITDAX should not be considered as an alternative to, or more meaningful than, net income (loss) as determined in accordance with GAAP or as an indicator of our operating performance. Certain items excluded from Adjusted EBITDAX are significant components in understanding and assessing a company’s financial performance, such as a company’s cost of capital, hedging strategy and tax structure, as well as the historic costs of depreciable assets, none of which are components of Adjusted EBITDAX. Our computations of Adjusted EBITDAX may not be comparable to other similarly titled measure of other companies. We believe that Adjusted EBITDAX is a widely followed measure of operating performance. Additionally, our management team believes Adjusted EBITDAX is useful to an investor in evaluating our financial performance because this measure:
· is widely used by investors in the oil and natural gas industry to measure a company’s operating performance without regard to items excluded from the calculation of such term, among other factors;
· helps investors to more meaningfully evaluate and compare the results of our operations from period to period by removing the effect of our capital structure from our operating structure; and
· is used by our management team for various purposes, including as a measure of operating performance, in presentations to our board of directors, as a basis for strategic planning and forecasting. Adjusted EBITDAX is also used by our Board of Directors as a performance measure in determining executive compensation.
The following table presents a reconciliation of Adjusted EBITDAX to the GAAP financial measure of net income (loss) for each of the periods indicated.
|
|
|
For the Nine Months Ended |
|
For the Year Ended |
| ||||||||
|
|
|
2016 |
|
2015 |
|
2015 |
|
2014 |
| ||||
|
Reconciliation of Adjusted EBITDAX: |
|
|
|
|
|
|
|
|
| ||||
|
Net income (loss) |
|
$ |
(210,400 |
) |
$ |
(38,060 |
) |
$ |
(47,264 |
) |
$ |
49,842 |
|
|
Add back: |
|
|
|
|
|
|
|
|
| ||||
|
Depreciation, depletion, amortization, and accretion |
|
141,317 |
|
100,170 |
|
146,547 |
|
34,042 |
| ||||
|
Impairment of long lived assets |
|
23,350 |
|
9,525 |
|
15,778 |
|
— |
| ||||
|
Exploration expenses |
|
14,735 |
|
6,763 |
|
18,636 |
|
126 |
| ||||
|
Rig termination fee |
|
891 |
|
1,657 |
|
1,657 |
|
— |
| ||||
|
Acquisition transaction expenses |
|
345 |
|
6,000 |
|
6,000 |
|
— |
| ||||
|
(Gain) loss on commodity derivatives |
|
62,424 |
|
(38,478 |
) |
(79,932 |
) |
(48,008 |
) | ||||
|
Settlements on commodity derivative instruments |
|
37,947 |
|
42,441 |
|
59,785 |
|
3,974 |
| ||||
|
Premiums paid for derivative that settled during the period |
|
(5,470 |
) |
(1,046 |
) |
(2,087 |
) |
— |
| ||||
|
Unit-based compensation expense |
|
14,922 |
|
4,583 |
|
5,970 |
|
4,462 |
| ||||
|
Amortization of debt discount and debt issuance costs |
|
18,330 |
|
3,081 |
|
5,604 |
|
1,985 |
| ||||
|
Interest expense |
|
39,584 |
|
33,269 |
|
45,426 |
|
20,469 |
| ||||
|
Adjusted EBITDAX |
|
$ |
137,975 |
|
$ |
129,905 |
|
$ |
176,120 |
|
$ |
66,892 |
|
Principal Components of Our Cost Structure
Lease Operating Expenses. All direct and allocated indirect costs of lifting hydrocarbons from a producing formation to the surface constituting part of the current operating expenses of a working interest. Such costs include labor, superintendence, supplies, repairs, maintenance, allocated overhead charges, workover, insurance and other expenses incidental to production, but exclude lease acquisition or drilling or completion expenses. LOEs also include expenses incurred to gather and deliver natural gas to the processing plant and/or selling point.
Production Taxes. Production taxes are paid on produced oil, natural gas and NGL based on a percentage of revenues from production sold at fixed rates established by state or local taxing authorities. In general, the production taxes we pay correlate to the changes in oil and natural gas revenues.
Exploration Expenses. Exploration expenses are comprised primarily of impairments and abandonment of unproved properties, geological and geophysical expenditures, the cost to carry and retain unproved properties and exploratory dry hole costs.
Depletion, Depreciation, Amortization and Accretion. We use the successful efforts method of accounting for oil and natural gas activities and, as such, we capitalize all costs associated with our acquisition and development efforts and all successful exploration efforts, which are then allocated to each unit of production using the unit of production method.
Impairment of Long Lived Assets. Impairment of long lived assets are comprised primarily of impairment of proved oil and gas properties. We review our proved properties for impairment whenever events and changes in circumstances indicate that a decline in the recoverability of their carrying value may have occurred. See “—Critical Accounting Policies and Estimates” for further discussion.
Acquisition Transaction Expenses. Acquisition transaction expenses consists of non-cash transaction costs associated with acquisitions accounted for using the acquisition method under ASC 805, Business Combinations.
General and Administrative Expenses. These are costs incurred for overhead, including payroll and benefits for our corporate staff, unit-based compensation expense, costs of maintaining our headquarters, costs of managing our production and development operations including numerous software applications, audit and other fees for professional services and legal compliance.
Factors Affecting the Comparability of Our Financial Condition and Results of Operations
Our historical financial condition and results of operations for the periods presented may not be comparable, either from period to period or going forward, for the following reasons:
Oil and Gas Property Acquisitions
The following is a summary of our significant acquisition activity that occurred during 2014, 2015 and 2016:
May 2014 Acquisition. On May 29, 2014, we acquired interests in approximately 6,200 net acres of leaseholds and related producing properties located primarily in Weld County, Colorado, along with various other related rights, permits, contracts, equipment and other assets (the “May 2014 Acquisition”). The May 2014 Acquisition included 22 producing wells and, at the time of acquisition, had net daily production of approximately 3,000 BOE/d.
July 2014 Acquisition. On July 28, 2014, we acquired interests in approximately 9,000 net acres of leaseholds and related producing properties located primarily in Weld County, Colorado, along with various other related rights, permits, contracts, equipment and other assets (the “July 2014 Acquisition”). The July 2014 Acquisition included 126 producing wells and, at the time of acquisition, had net daily production of 900 BOE/d.
August 2014 Acquisition. On August 21, 2014, we acquired interests in approximately 6,400 net acres of leaseholds and related producing properties located primarily in Weld County, Colorado, along with various other related rights, permits, contracts, equipment and other assets (the “August 2014 Acquisition”). The August 2014 Acquisition included 94 producing wells and, at the time of acquisition, had net daily production of 2,600 BOE/d.
October 2014 Acquisition. On October 15, 2014, we acquired interests in approximately 9,178 net acres of leaseholds and related producing properties located primarily in Weld County, Colorado, along with various other related rights, permits, contracts, equipment and other assets (the “October 2014 Acquisition”). The October 2014 Acquisition included 29 producing wells and, at the time of acquisition, had net daily production of 232 BOE/d.
March 2015 Acquisition. On March 10, 2015, we acquired interests in approximately 39,000 net acres of leaseholds and related producing properties located primarily in Adams, Broomfield, Boulder and Weld Counties, Colorado, along with various related rights, permits, contracts, equipment and other assets (the “March 2015 Acquisition”). The March 2015 Acquisition included 444 producing wells and, at the time of acquisition, had net daily production of approximately 1,100 BOE/d.
Bayswater Acquisition. On July 29, 2016, we entered into a definitive agreement with subsidiaries of Bayswater Exploration & Production to acquire the Bayswater Assets for total consideration of approximately $419 million in cash after customary purchase price adjustments. The Bayswater Assets consist of working interests in approximately 6,100 net acres, and had a net daily production of approximately 8,600 net BOE/d for the three months ended September 30, 2016. As of July 29, 2016, the Bayswater Assets included 53 gross (32 net) drilled but uncompleted wells, 30 of which are unique locations. We expect the majority of these drilled but uncompleted wells to be brought online in the first half of 2017.
Incentive Unit Compensation
In 2015, we granted certain members of management incentive units pursuant to Holdings’ 2014 Membership Unit Incentive Plan and its limited liability company agreement. These equity-based awards are subject to time-based vesting requirements, as well as accelerated vesting upon the occurrence of a change of control. Our IPO constituted a change in control for purposes of the incentive units. After members that have made capital contributions to us have received cumulative distributions in respect of their membership interests equal to specified rates of return, these incentive units may upon vesting entitle the holders to a disproportionate share of the distributions payable to holders of our membership interests. The incentive units are accounted for as
liability awards under ASC 718, Compensation—Stock Compensation. At such time that the occurrence of the performance conditions associated with any of these incentive units, as further described under “Executive Compensation—Narrative Disclosure to Summary Compensation Table and Outstanding Equity Awards at Fiscal Year-End—Long-Term Incentive Compensation—Incentive Units (Profits Interests),” are deemed probable, we will record non-cash compensation expense equal to a percentage of the then-determined fair value of those awards based on the implied service period that has been rendered at that date. As long as we continue to view the achievement of the performance conditions as probable of occurring, we will remeasure the amount of compensation expense to be recognized each period until the awards are settled. No incentive compensation expense was recorded during the year ended December 31, 2015 or the nine months ended September 30, 2016, because it was not probable that the performance criterion would be met. Any liquidity event would meet the performance criterion.
As part of the transactions described under “Prospectus Summary—Corporate Reorganization,” Holdings merged with and into us, and we were the surviving entity to such merger, with the equity holders in Holdings, other than the holders of the Series B Preferred Units (which were converted in connection with the closing of the IPO into shares of Series A Preferred Stock), but including the holders of restricted units and incentive units, receiving an aggregate number of shares of our common stock based on an implied valuation for us based on the 10-day value weighted average price of our common stock and the relative levels of ownership in Holdings, pursuant to the terms of the limited liability company agreement of Holdings. As a result, as of the effective date of Holdings’ merger with and into us, we began accounting for the incentive unit awards as equity-classified awards pursuant to ASC Topic 718. Upon the consummation of the IPO, this resulted in the recognition of approximately $172.1 million of compensation cost equal to the excess of the modified awards’ fair value (based on the IPO price of $19.00 per share) over the amount of cumulative compensation cost recognized prior to that date.
Series A Preferred Stock
In connection with the consummation of the IPO, we issued 185,280 shares of our Series A Preferred Stock to the holders of Holdings’ Series B Preferred Units in conversion of such units. The Series A Preferred Stock are entitled to receive a cash dividend of 5.875% per year, payable quarterly in arrears, and we have the ability to pay such quarterly dividends in kind at a dividend rate of 10% per year (decreased proportionately to the extent such quarterly dividends are paid in cash). Beginning on or after the later of (a) 90 days after the closing of the IPO and (b) the earlier of 120 days after the closing of the IPO and the expiration of the lock-up period contained in the underwriting agreement entered into in connection with the IPO (the “Lock-Up Period End Date”), the Series A Preferred Stock will be convertible into shares of our common stock at the election of the holders of the Series A Preferred Stock (the “Series A Preferred Holders”) at a conversion ratio per share of Series A Preferred Stock of 61.9195. Beginning on or after the Lock-Up Period End Date until the three year anniversary of the closing of the IPO, we may elect to convert the Series A Preferred Stock at a conversion ratio per share of Series A Preferred Stock of 61.9195, but only if the closing price of our common stock trades at or above a certain premium to our initial offering price, such premium to decrease with time. In certain situations, including a change of control, the Series A Preferred Stock may be redeemed for cash in an amount equal to the greater of (i) 135% of the liquidation preference of the Series A Preferred Stock and (ii) a 17.5% annualized internal rate of return on the liquidation preference of the Series A Preferred Stock. The Series A Preferred Stock matures on October 15, 2021, at which time they are mandatorily redeemable for cash at the liquidation preference. See “Description of Capital Stock—Preferred Stock—Series A Preferred Stock.”
Public Company Expenses
General and administrative expenses related to being a publicly traded company include: Exchange Act reporting expenses; expenses associated with Sarbanes-Oxley compliance; expenses associated with listing on the NASDAQ; incremental independent auditor fees; incremental legal fees; investor relations expenses; registrar and transfer agent fees; incremental director and officer liability insurance costs; and director compensation. As a publicly traded company, we expect that general and administrative expenses will increase in future periods.
Income Taxes
In conjunction with the IPO, we converted from a limited liability company into a corporation. Prior to this conversion, we were not subject to federal or state income taxes. Accordingly, the financial data attributable to us prior to such conversion contain no provision for federal or state income taxes because the tax liability with respect to our taxable income was passed through to our members. Beginning October 12, 2016, we began to be taxed as a C corporation under the Internal Revenue Code and subject to federal and state income taxes at a blended statutory rate of approximately 38% of pretax earnings.
Historical Results of Operations and Operating Expenses
Oil, Natural Gas and NGL Sales Revenues, Operating Expenses and Other Income (Expense).
The following table provides the components of our revenues, operating expenses, other income (expense) and net income (loss) for the periods indicated (in thousands):
|
|
|
For the Nine Months Ended |
|
For the Year Ended |
| ||||||||
|
|
|
2016 |
|
2015 |
|
2015 |
|
2014 |
| ||||
|
|
|
(Unaudited) |
| ||||||||||
|
Revenues: |
|
|
|
|
|
|
|
|
| ||||
|
Oil sales |
|
$ |
135,896 |
|
$ |
114,768 |
|
$ |
157,024 |
|
$ |
75,460 |
|
|
Natural gas sales |
|
27,730 |
|
17,707 |
|
26,019 |
|
9,247 |
| ||||
|
NGL sales |
|
19,773 |
|
9,153 |
|
14,707 |
|
8,133 |
| ||||
|
Total Revenues |
|
183,399 |
|
141,628 |
|
197,750 |
|
92,840 |
| ||||
|
Operating Expenses: |
|
|
|
|
|
|
|
|
| ||||
|
Lease operating expenses |
|
40,819 |
|
18,806 |
|
30,628 |
|
5,067 |
| ||||
|
Production taxes |
|
16,935 |
|
12,798 |
|
17,035 |
|
9,743 |
| ||||
|
Exploration expenses |
|
14,735 |
|
6,763 |
|
18,636 |
|
126 |
| ||||
|
Depletion, depreciation, amortization and accretion |
|
141,317 |
|
100,170 |
|
146,547 |
|
34,042 |
| ||||
|
Impairment of long lived assets |
|
23,350 |
|
9,525 |
|
15,778 |
|
— |
| ||||
|
Other operating expenses |
|
891 |
|
2,353 |
|
2,353 |
|
— |
| ||||
|
Acquisition transaction expenses |
|
345 |
|
6,000 |
|
6,000 |
|
— |
| ||||
|
General and administrative expenses |
|
35,189 |
|
25,437 |
|
37,149 |
|
19,598 |
| ||||
|
Total Operating Expenses |
|
273,581 |
|
181,852 |
|
274,126 |
|
68,576 |
| ||||
|
Operating Income (Loss) |
|
(90,182 |
) |
(40,224 |
) |
(76,376 |
) |
24,264 |
| ||||
|
Other Income (Expense): |
|
|
|
|
|
|
|
|
| ||||
|
Commodity derivatives gain (loss) |
|
(62,424 |
) |
38,478 |
|
79,932 |
|
48,008 |
| ||||
|
Interest expense |
|
(57,914 |
) |
(36,350 |
) |
(51,030 |
) |
(22,454 |
) | ||||
|
Other income |
|
120 |
|
36 |
|
210 |
|
24 |
| ||||
|
Other Income (Expense) |
|
(120,218 |
) |
2,164 |
|
29,112 |
|
25,578 |
| ||||
|
Net Income (Loss) |
|
$ |
(210,400 |
) |
$ |
(38,060 |
) |
$ |
(47,264 |
) |
$ |
49,842 |
|
The following table provides a summary of our sales volumes, average prices and operating expenses on a per BOE basis for the periods indicated:
|
|
|
Nine Months Ended September 30, |
|
Year Ended December 31, |
| ||||||||
|
|
|
2016 |
|
2015 |
|
2015 |
|
2014 |
| ||||
|
|
|
(unaudited) |
| ||||||||||
|
Sales (MBoe)(1): |
|
7,429.2 |
|
4,853.6 |
|
7,084.0 |
|
1,791.5 |
| ||||
|
Oil sales (MBbl) |
|
3,808.4 |
|
2,792.3 |
|
3,945.6 |
|
1,022.2 |
| ||||
|
Natural gas sales (MMcf) |
|
12,851.3 |
|
7,224.9 |
|
10,823.0 |
|
2,664.1 |
| ||||
|
NGL sales (MBbl) |
|
1,478.9 |
|
857.1 |
|
1,334.6 |
|
325.3 |
| ||||
|
Sales (BOE/d)(1): |
|
27,114 |
|
17,779 |
|
19,408 |
|
4,908 |
| ||||
|
Oil sales (Bbl/d) |
|
13,899 |
|
10,228 |
|
10,810 |
|
2,801 |
| ||||
|
Natural gas sales (Mcf/d) |
|
46,903 |
|
26,465 |
|
29,652 |
|
7,299 |
| ||||
|
NGL sales (Bbl/d) |
|
5,397 |
|
3,140 |
|
3,656 |
|
891 |
| ||||
|
Average sales prices(2): |
|
|
|
|
|
|
|
|
| ||||
|
Oil sales (per Bbl) |
|
$ |
35.68 |
|
$ |
41.10 |
|
$ |
39.80 |
|
$ |
73.82 |
|
|
Oil sales with derivative settlements (per Bbl) |
|
41.93 |
|
55.09 |
|
53.29 |
|
77.66 |
| ||||
|
Natural gas sales (per Mcf) |
|
2.16 |
|
2.45 |
|
2.40 |
|
3.47 |
| ||||
|
|
|
Nine Months Ended September 30, |
|
Year Ended December 31, |
| ||||||||
|
|
|
2016 |
|
2015 |
|
2015 |
|
2014 |
| ||||
|
|
|
(unaudited) |
| ||||||||||
|
Natural gas sales with derivative settlements (per Mcf) |
|
2.84 |
|
2.77 |
|
2.82 |
|
3.49 |
| ||||
|
NGL sales (per Bbl) |
|
13.37 |
|
10.68 |
|
11.02 |
|
25.00 |
| ||||
|
Average price per BOE |
|
24.69 |
|
29.18 |
|
27.92 |
|
51.82 |
| ||||
|
Average price per BOE with derivative settlements |
|
29.06 |
|
37.71 |
|
36.06 |
|
54.04 |
| ||||
|
Expense per BOE: |
|
|
|
|
|
|
|
|
| ||||
|
Lease operating expenses |
|
$ |
5.49 |
|
$ |
3.87 |
|
$ |
4.32 |
|
$ |
2.83 |
|
|
Production taxes |
|
2.28 |
|
2.64 |
|
2.40 |
|
5.44 |
| ||||
|
Exploration expenses |
|
1.98 |
|
1.39 |
|
2.63 |
|
0.07 |
| ||||
|
Depletion, depreciation, amortization, and accretion |
|
19.02 |
|
20.64 |
|
20.69 |
|
19.00 |
| ||||
|
Impairment of long lived assets |
|
3.14 |
|
1.96 |
|
2.23 |
|
— |
| ||||
|
Other operating expenses |
|
0.12 |
|
0.48 |
|
0.33 |
|
— |
| ||||
|
Acquisition transaction expenses |
|
0.05 |
|
1.24 |
|
0.85 |
|
— |
| ||||
|
General and administrative expenses |
|
4.74 |
|
5.24 |
|
5.24 |
|
10.94 |
| ||||
|
Unit-based compensation |
|
2.01 |
|
0.94 |
|
0.84 |
|
2.49 |
| ||||
|
Total operating expenses per BOE |
|
36.83 |
|
37.47 |
|
38.69 |
|
38.28 |
| ||||
(1) One BOE is equal to six Mcf of natural gas or one Bbl of oil or NGL based on an approximate energy equivalency. This is an energy content correlation and does not reflect a value or price relationship between the commodities.
(2) Average prices shown in the table reflect prices both before and after the effects of our settlements of our commodity derivative contracts. Our calculation of such effects includes both gains and losses on cash settlements for commodity derivatives and premiums paid or received on options that settled during the period.
Nine Months Ended September 30, 2016 Compared to Nine Months Ended September 30, 2015
Oil sales revenues. Crude oil sales revenues increased by $21.1 million to $135.9 million for the nine months ended September 30, 2016 as compared to crude oil sales of $114.8 million for the nine months ended September 30, 2015. An increase in sales volumes between these periods contributed a $41.7 million positive impact, which was partially offset by a $20.6 million negative impact due to declining crude oil prices.
For the nine months ended September 30, 2016, our crude oil sales averaged 13.9 MBbl/d. Our crude oil sales volume increased 36% to 3,808.4 MBbl for the nine months ended September 30, 2016 compared to 2,792.3 MBbl for the nine months ended September 30, 2015. The volume increase is primarily due to the development of our properties, and to a lesser extent, the March 2015 Acquisition. For the period from October 1, 2015 through September 30, 2016, we completed 92 gross wells. Offsetting the increased production from these new wells is the normal decline on the existing producing properties.
The average price we realized on the sale of crude oil was $35.68 per Bbl for the nine months ended September 30, 2016 compared to $41.10 per Bbl for the nine months ended September 30, 2015.
Natural gas sales revenues. Natural gas revenues increased by $10.0 million to $27.7 million for the nine months ended September 30, 2016 as compared to natural gas revenues of $17.7 million for the nine months ended September 30, 2015. An increase in sales volumes between these periods contributed a $13.8 million positive impact, which was partially offset by a $3.8 million negative impact due to declining natural gas prices.
For the nine months ended September 30, 2016, our natural gas sales averaged 46.9 MMcf/d. Natural gas sales volumes increased by 78% to 12,851.3 MMcf for the nine months ended September 30, 2016 as compared to 7,224.9 MMcf for the nine months ended September 30, 2015. The volume increase is primarily due to the development of our properties, and to a lesser extent, the March 2015 Acquisition. For the period from October 1, 2015 through September 30, 2016, we completed 92 gross wells. Offsetting the increased production from these new wells is the normal decline on the existing producing properties.
The average price we realized on the sale of our natural gas was $2.16 per Mcf for the nine months ended September 30, 2016 compared to $2.45 per Mcf for the nine months ended September 30, 2015.
NGL sales revenues. NGL revenues increased by $10.6 million to $19.8 million for the nine months ended September 30, 2016 as compared to NGL revenues of $9.2 million for the nine months ended September 30, 2015. An increase in sales volumes between these periods contributed a $6.6 million positive impact, while an increase in price contributed a $4.0 million positive impact.
For the nine months ended September 30, 2016, our NGL sales averaged 5.4 MBbl/d. NGL sales volumes increased by 73% to 1,478.9 MBbl for the nine months ended September 30, 2016 as compared to 857.1 MBbl for the nine months ended September 30, 2015. The volume increase is due to the development of our properties, and to a lesser extent, the March 2015 Acquisition. Our NGL sales are directly associated with our natural gas sales since the majority of our natural gas volumes are processed by third parties which return a percentage of the proceeds from both residue natural gas sales and NGL sales.
The average price we realized on the sale of our NGL was $13.37 per Bbl in the nine months ended September 30, 2016 compared to $10.68 per Bbl in the nine months ended September 30, 2015.
Lease operating expenses. Our LOE increased by $22.0 million to $40.8 million for the nine months ended September 30, 2016, from $18.8 million for the nine months ended September 30, 2015.
On a per unit basis, LOE increased from $3.87 per BOE sold for the nine months ended September 30, 2015 to $5.49 per BOE sold for the nine months ended September 30, 2016. The increase is primarily the result of (i) an increase in transportation and gathering fees on gas sales as a result of entering into fee-type gas contracts versus percent of proceeds, and (ii) the March 2015 Acquisition, which included older vertical wells that have higher cost, on a per BOE sold basis, than our newer horizontal wells. As wells mature, we expect to incur additional costs to put these wells on artificial lift, which increases costs in fuel, electricity and related expenses.
Production taxes. Our production taxes increased by $4.1 million to $16.9 million for the nine months ended September 30, 2016 as compared to $12.8 million for the nine months ended September 30, 2015. The increase is attributable to increased revenue as State of Colorado production taxes are calculated as a percentage of sales revenue. Production taxes as a percentage of sales revenue was 9.2% for the nine months ended September 30, 2016 as compared to 9.0% for the nine months ended September 30, 2015.
Exploration expenses. Our exploration expenses were $14.7 million for the nine months ended September 30, 2016. We recognized $11.2 million in expense attributable to the extension of leases and $3.3 million in impairment expense attributable to the abandonment and impairment of unproved properties for the nine months ended September 30, 2016. For the nine months ended September 30, 2015, we recognized $6.7 million in exploration expenses. Included in exploration expense for the nine months ended September 30, 2015 is $6.2 million in impairment expense attributable to the abandonment and impairment of unproved properties.
Depletion, depreciation, amortization and accretion expense. Our DD&A expense increased $41.1 million to $141.3 million for the nine months ended September 30, 2016 as compared to $100.2 million for the nine months ended September 30, 2015. This increase is due to more volumes being sold for the nine months ended September 30, 2016 as sales increased by approximately 2,575.6 MBoe. On a per unit basis, DD&A expense decreased from $20.64 per BOE for the nine months ended September 30, 2015 to $19.02 per BOE for the nine months ended September 30, 2016.
Impairment of long lived assets. We recognized $23.4 million and $9.5 million in impairment expense on proved oil and gas properties for the nine months ended September 30, 2016 and 2015, respectively. The impairment expense for the nine months ended September 30, 2016 and 2015 is related to impairment of the assets in our Northern field. The future undiscounted cash flows did not exceed the carrying amount associated with the proved oil and gas properties in the Northern field and it was determined that the proved oil and gas properties had no remaining fair value. Therefore, the full net book value of these proved oil and gas properties were impaired at June 30, 2016 and 2015, respectively.
Other operating expenses. Other operating expenses for the nine months ended September 30, 2016 are comprised of a $0.9 million rig termination fee related to the early termination of a rig in February 2016. Other operating expenses for the nine months ended September 30, 2015 are comprised of a $1.7 million rig termination fee related to the early termination of a rig in March 2015 and a rig standby fee of $0.7 million in September 2015.
Acquisition transaction expenses. As part of the August 2016 Acquisition and Bayswater Acquisition, we incurred $0.3 million of transaction costs associated with legal expense and due diligence for the nine months ended September 30, 2016. As part of the March 2015 Acquisition, we incurred $6.0 million of non-cash transaction costs associated with a finder’s fee to an unaffiliated third-party for the nine months ended September 30, 2015. We assigned an over-riding royalty interest in the proved and unproved oil and gas properties acquired in the March 2015 Acquisition, which had a fair value of $6.0 million on the measurement date.
General and administrative expense. General and administrative (“G&A”) expense increased by $9.8 million to $35.2 million for the nine months ended September 30, 2016 as compared to $25.4 million for the nine months ended September 30, 2015. This increase is primarily due to the acceleration of vesting of our RUAs and the associated expense during the nine months ended September 30, 2016. All outstanding RUAs were accelerated in connection with our IPO completed in October 2016. On a per unit basis, G&A expense decreased from $5.24 per BOE sold for the nine months ended September 30, 2015 to $4.74 per BOE sold in the nine months ended September 30, 2016. The decrease is primarily due to our increase in sales volumes from our acquisitions and our ongoing development program.
Our G&A expense includes the non-cash expense for unit-based compensation for equity awards granted to our employees and non-employee consultants. For the nine months ended September 30, 2016, unit-based compensation expense was $14.9 million as compared to $4.6 million for the nine months ended September 30, 2015.
Commodity derivative gain (loss). Primarily due to the increase in NYMEX crude oil futures prices at September 30, 2016 as compared to December 31, 2015 and change in fair value from the execution of new positions, we incurred a net loss on our commodity derivatives of $62.4 million for the nine months ended September 30, 2016. Primarily due to a decrease in NYMEX crude oil futures prices at September 30, 2015 as compared to December 31, 2014 and change in fair value from the execution of new positions, we incurred a net gain on our commodity derivatives of $38.5 million for the nine months ended September 30, 2015. This loss during the nine months ended September 30, 2016 and gain during the nine months ended September 30, 2015 is a result of our hedging program, which is used to mitigate our exposure to commodity price fluctuations. The fair value of the open commodity derivative instruments will continue to change in value until the transactions are settled and we will likely add to our hedging program. Therefore, we expect our net income (loss) to reflect the volatility of commodity price forward markets. Our cash flow will only be affected upon settlement of the transactions at the current market prices at that time. During the nine months ended September 30, 2016 and 2015, we had cash settlements of commodity derivatives totaling $37.9 million and $42.4 million, respectively.
Interest expense. Interest expense consists of interest expense on our long term debt, amortization of debt discount and debt issuance costs, net of capitalized interest. For the nine months ended September 30, 2016, we recognized interest expense of approximately $57.9 million as compared to $36.4 million for the nine months ended September 30, 2015, as a result of borrowings under our revolving credit facility and our second lien notes.
We incurred interest expense for the nine months ended September 30, 2016 and 2015 of approximately $38.9 million and $37.4 million, respectively, related to our revolving credit facility, our Second Lien Notes and our Senior Notes. Interest expense for the nine months ended September 30, 2016 includes the accelerated amortization of our remaining unamortized debt discount and debt issuance costs of $15.1 million upon the repayment of our Second Lien Notes in July 2016, the amortization of debt discount and debt issuance costs of $3.2 million and a prepayment penalty of $4.3 million also upon the repayment of our Second Lien Notes. Interest expense for the nine months ended September 30, 2015 includes amortization of debt discount and debt issuance costs of $3.1 million. For the nine months ended September 30, 2016 and 2015, we capitalized interest expense of $3.6 million and $4.1 million, respectively.
Year Ended December 31, 2015 Compared to Year Ended December 31, 2014
Oil sales revenues. Crude oil sales revenues increased by $81.6 million to $157.0 million for the year ended December 31, 2015 as compared to crude oil sales of $75.5 million for the year ended December 31, 2014. An increase in sales volumes between these periods contributed a $215.8 million positive impact, which was partially offset by a $134.2 million negative impact due to declining crude oil prices.
For the year ended December 31, 2015, our crude oil sales averaged 10.8 MBbls/d. Our crude oil sales volume increased 286% to 3,945.6 MBbls in the year ended December 31, 2015 compared to 1,022.2 MBbls in the year ended December 31, 2014. The volume increase is due to the development of our properties as well as our acquisitions during 2015 and 2014. Of the 2,923.4 MBbls increase in crude oil sales volume, 651.9 MBbls is related to the increase in production from producing wells acquired and 2,271.5 MBbls is attributed to our ongoing development of our properties and undeveloped acreage.
The average price we realized on the sale of crude oil was $39.80 per Bbl for the year ended December 31, 2015 compared to $73.82 per Bbl for the year ended December 31, 2014.
Natural gas sales revenues. Natural gas revenues increased by $16.8 million to $26.0 million for the year ended December 31, 2015 as compared to natural gas revenues of $9.2 million for the year ended December 31, 2014. An increase in sales volumes between these periods contributed a $28.3 million positive impact, which was partially offset by an $11.5 million negative impact due to declining natural gas prices.
For the year ended December 31, 2015, our natural gas sales averaged 29.7 MMcf/d. Natural gas sales volumes increased by 306% to 10,823.0 MMcf for the year ended December 31, 2015 as compared to 2,664.1 MMcf for the year ended December 31, 2014. The volume increase is due to the development of our properties as well as our acquisitions during 2015 and 2014. Of the 8,158.9 MMcf increase in natural gas sales volume, 3,072.5 MMcf was related to the increase in production from producing wells acquired and 5,086.4 MMcf was attributed to our ongoing development of our properties and undeveloped acreage.
The average price we realized on the sale of our natural gas was $2.40 per Mcf for the year ended December 31, 2015 compared to $3.47 per Mcf for the year ended December 31, 2014.
NGL sales revenues. NGL revenues increased by $6.6 million to $14.7 million for the year ended December 31, 2015 as compared to NGL revenues of $8.1 million for the year ended December 31, 2014. An increase in sales volumes between these periods contributed a $25.2 million positive impact, which was offset by a $18.6 million negative impact due to declining NGL prices.
For the year ended December 31, 2015, our NGL sales averaged 3.7 Bbl/d. NGL sales volumes increased by 310% to 1,334.6 MBbls for the year ended December 31, 2015 as compared to 325.3 MBbls for the year ended December 31, 2014. The volume increase is due to the development of our properties as well as our acquisitions during 2015 and 2014. Our NGL sales are directly associated with our natural gas sales since the majority of our natural gas volumes are processed by third parties which return a percentage of the proceeds from both residue natural gas sales and NGL sales.
The average price we realized on the sale of our NGL was $11.02 per Bbl in the year ended December 31, 2015 compared to $25.00 per Bbl in the year ended December 31, 2014.
Lease operating expenses. Our LOE increased by $25.6 million to $30.6 million for the year ended December 31, 2015, from $5.1 million for the year ended December 31, 2014.
On a per unit basis, LOE increased from $2.83 per BOE sold for the year ended December 31, 2014 to $4.32 per BOE sold for the year ended December 31, 2015. The increase is primarily the result of the March 2015 Acquisition, which included older vertical wells that have higher cost, on a per BOE sold basis, than our newer horizontal wells. As wells mature, we expect to incur additional costs to put these wells on artificial lift, which increases costs in fuel, electricity and related expenses.
Production taxes. Our production taxes increased by $7.3 million to $17.0 million for the year ended December 31, 2015 as compared to $9.7 million for the year ended December 31, 2014. The increase is attributable to increased revenue as State of Colorado production taxes are calculated as a percentage of sales revenue. Production taxes as a percentage of sales revenue was 8.6% for the year ended December 31, 2015 as compared to 10.5% for the year ended December 31, 2014.
Exploration expenses. Our exploration expenses were $18.6 million for the year ended December 31, 2015. We recognized $16.4 million in impairment expense attributable to the abandonment and impairment of unproved properties and $2.2 million for extensions on leases for the year ended December 31, 2015. For the year ended December 31, 2014, there were no significant exploration expenses or abandonment and impairment of unproved properties.
Depletion, depreciation, amortization and accretion expense. Our DD&A expense increased $112.5 million to $146.5 million for the year ended December 31, 2015 as compared to $34.0 million for the year ended December 31, 2014. This increase is due to more volumes being sold for the year ended December 31, 2015 as sales increased by approximately 5,292.4 MBoe. On a per unit basis, DD&A expense increased from $19.00 per BOE for the year ended December 31, 2014 to $20.69 per BOE for the year ended December 31, 2015.
Impairment of long lived assets. During 2015, we sold proved oil and gas properties for proceeds of $4.7 million. In connection with the sale, we determined that assets’ net book value exceeded the fair value of such properties by $2.7 million. We recognized that amount as an impairment expense for the year ended December 31, 2015. During 2015, we also recorded impairment expense of $9.5 million related to impairment of a subsidiary. Our subsidiary had negative future undiscounted cash flows associated with its proved oil and gas properties as of December 31, 2015, and it was determined that our subsidiary’s proved oil and gas properties had no remaining fair value. Therefore, our subsidiary’s full net book value of proved oil and gas properties were impaired. Additionally, we recognized $3.6 million in impairment expense related to a specifically proposed gas processing plant that is no longer being pursued.
Other operating expenses. Other operating expenses for the year ended December 31, 2015 are comprised of a $1.7 million rig termination fee related to the early termination of a rig in March 2015 and $0.7 million related to rig standby fees in September 2015. There were no other operating expenses for the year ended December 31, 2014.
Acquisition transaction expenses. As part of the March 2015 Acquisition, we incurred $6.0 million of non-cash transaction costs associated with a finder’s fee to an unaffiliated third-party. We assigned an over-riding royalty interest in the proved and unproved oil and gas properties acquired in the March 2015 Acquisition, which had a fair value of $6.0 million on the measurement date. For the year ended December 31, 2014, we did not recognize any non-cash acquisition transaction expenses.
General and administrative expense. G&A expense increased by $17.6 million to $37.1 million for the year ended December 31, 2015 as compared to $19.6 million for the year ended December 31, 2014. This increase is due to the growth in personnel and related costs as we have expanded our operational activities. On a per unit basis, G&A expense decreased from $10.94 per BOE sold for the year ended December 31, 2014 to $5.24 per BOE sold in the year ended December 31, 2015. The decrease is primarily due to our increase in sales volumes from our acquisitions and our ongoing development program.
Our G&A expense includes the non-cash expense for unit-based compensation for equity awards granted to our employees and non-employee consultants. For the year ended December 31, 2015, unit-based compensation expense was $6.0 million as compared to $4.5 million for the year ended December 31, 2014.
Commodity derivative gain. We began using commodity derivatives in September 2014. Primarily due to the decrease in NYMEX crude oil futures prices at December 31, 2015 as compared to December 31, 2014, we incurred a net gain on our commodity derivatives of $79.9 million for the year ended December 31, 2015. This gain is a result of our hedging program, which is used to mitigate our exposure to commodity price fluctuations. The fair value of the open commodity derivative instruments will continue to change in value until the transactions are settled and we will likely add to our hedging program. Therefore, we expect our net income to reflect the volatility of commodity price forward markets. Our cash flow will only be affected upon settlement of the transactions at the
current market prices at that time. During the years ended December 31, 2015 and 2014, we had cash settlements of commodity derivatives totaling $59.8 million and $4.0 million, respectively.
Interest expense. Interest expense consists of interest expense on our long term debt, amortization of debt discount and debt issuance costs, net of capitalized interest. For the year ended December 31, 2015, we recognized interest expense of approximately $51.0 million as compared to $22.5 million for the year ended December 31, 2014, as a result of borrowings under our revolving credit facility and our second lien notes.
We incurred interest expense for the years ended December 31, 2015 and 2014 of approximately $50.7 million and $23.1 million, respectively, related to our revolving credit facility and our second lien notes. Also included in interest expense for the years ended December 31, 2015 and 2014 was the amortization of debt issuance costs and debt discount of $4.2 million and $2.0 million, respectively. Additionally, during 2015, we incurred $1.4 million related to a potential financing transaction, and we recorded such amount as amortization expense for the year ended December 31, 2015. For the years ended December 31, 2015 and 2014, we capitalized interest costs of $5.3 million and $2.6 million, respectively.
Liquidity and Capital Resources
Our primary sources of liquidity and capital resources are cash flows generated by operating activities and borrowings under our revolving credit facility. Depending upon market conditions and other factors, we may also issue equity and debt securities if needed.
Historically, our primary sources of liquidity have been borrowings under our revolving credit facility, our Second Lien Notes, our Senior Notes (please refer to Note 4 — Long Term Debt to our historical unaudited financial statements for the nine months ended September 30, 2016 and 2015), equity provided by investors, including our management team, cash from the IPO and cash flows from operations. To date, our primary use of capital has been for the acquisition of oil and gas properties to increase our acreage position, as well as development and exploration of oil and gas properties. Our borrowings, net of unamortized debt discount and debt issuance costs, were approximately $626.6 million and $637.8 million at September 30, 2016, and December 31, 2015, respectively.
We plan to continue our practice of entering into hedging arrangements to reduce the impact of commodity price volatility on our cash flow from operations. Under this strategy, we intend to enter into commodity derivative contracts at times and on terms desired to maintain a portfolio of commodity derivative contracts covering approximately 50% to 80% of our projected oil production over a one-to-two year period at a given point in time, although we may from time to time hedge more or less than this approximate range.
Based on current expectations, we believe we have sufficient liquidity through our existing cash balances, cash flow from operations and available borrowings under our revolving credit facility to execute our 2017 capital program, excluding any acquisitions we may consummate, meet our debt obligations and pay dividends on our Series A Preferred Stock.
If cash flow from operations does not meet our expectations, we may reduce our expected level of capital expenditures and/or fund a portion of our capital expenditures using borrowings under our revolving credit facility, issuances of debt and equity securities or from other sources, such as asset sales. We cannot assure you that necessary capital will be available on acceptable terms or at all. Our ability to raise funds through the incurrence of additional indebtedness could be limited by the covenants in our debt arrangements. If we are unable to obtain funds when needed or on acceptable terms, we may not be able to complete acquisitions that may be favorable to us or finance the capital expenditures necessary to maintain our production or proved reserves.
Cash Flows
The following table summarizes our cash flows for the periods indicated:
|
|
|
For the Nine Months |
|
For the Years Ended |
| ||||||||
|
|
|
2016 |
|
2015 |
|
2015 |
|
2014 |
| ||||
|
|
|
(unaudited) |
|
|
|
|
| ||||||
|
|
|
(in thousands) |
| ||||||||||
|
Net cash provided by operating activities |
|
$ |
97,563 |
|
$ |
145,561 |
|
$ |
166,683 |
|
$ |
77,390 |
|
|
Net cash used in investing activities |
|
(280,546 |
) |
(418,599 |
) |
(520,006 |
) |
(970,640 |
) | ||||
|
Net cash provided by financing activities |
|
87,263 |
|
316,952 |
|
371,404 |
|
972,090 |
| ||||
Nine Months Ended September 30, 2016 Compared to the Nine Months Ended September 30, 2015
Net cash provided by operating activities. For the nine months ended September 30, 2016 as compared to the nine months ended September 30, 2015, our net cash provided by operating activities decreased by $48.0 million, primarily due to a decrease in changes in current assets and liabilities of $53.5 million, partially offset by an increase in settlements and premiums paid on commodity derivatives of $4.8 million.
Net cash used in investing activities. For the nine months ended September 30, 2016 as compared to the nine months ended September 30, 2015, our net cash used in investing activities decreased by $138.1 million primarily due to a decrease of $106.9 million used in acquisitions. Also contributing to this decrease was a decrease of $81.1 million in cash expended for drilling and completion activities and other property and equipment for the nine months ended September 30, 2016 as compared to the nine months ended September 30, 2015. Additionally, we received proceeds from the sale of land of $2.1 million which provided cash related to investing activities. Offsetting these decreases was the change in cash held in escrow of $52.1 million.
Net cash provided by financing activities. For the nine months ended September 30, 2016 as compared to the nine months ended September 30, 2015, our net cash provided by financing activities decreased by $229.7 million, primarily as a result of a decrease of $116.0 million in proceeds from the issuance of debt and borrowings under our revolving credit facility. In July 2016, we issued $550.0 million Senior Notes and used the proceeds to pay off our Second Lien Notes of $430.0 million and pay down our revolving credit facility. Also contributing to the decrease in net cash provided by financing activities was a decrease in proceeds received from the issuance of units of $102.0 million. Additionally, our costs associated with debt issuance increased by $11.3 million for the nine months ended September 30, 2016 compared to the nine months ended September 30, 2015, primarily due to the issuance of our Senior Notes in July 2016 and the amortization of remaining debt issuance costs associated with our Second Lien Notes when they were paid in full in July 2016.
Year Ended December 31, 2015 Compared to Year Ended December 31, 2014
Net cash provided by operating activities. For the year ended December 31, 2015 as compared to the year ended December 31, 2014, our net cash provided by operating activities increased by $89.3 million, primarily due to an increase in sales volumes of approximately 5,292.4 MBoe.
Net cash used in investing activities. For the year ended December 31, 2015 as compared to the year ended December 31, 2014, our net cash used in investing activities decreased by $450.6 million primarily due to a decrease of $586.8 million used in acquisitions. Partially offsetting this decrease was an increase of $150.8 million in cash expended for drilling and completion activities.
Net cash provided by financing activities. For the year ended December 31, 2015 as compared to the year ended December 31, 2014, our net cash provided by financing activities decreased by $600.7 million, primarily as a result of a decrease in proceeds received from the issuance of units of $220.4 million. Additionally, this decrease was partially due to a decrease of $398.5 million in borrowings under our revolving credit facility and our second lien notes. Offsetting these decreases was an $18.2 million decrease in cash used for debt and equity issuance costs for the year ended December 31, 2015 compare to the year ended December 31, 2014.
Working Capital
Our working capital was a deficit of $136.4 million at September 30, 2016 and was $47.5 million and $37.7 million at December 31, 2015 and 2014, respectively. Our cash balances totaled $1.4 million at September 30, 2016 and $97.1 million and $79.0 million at December 31, 2015 and 2014, respectively.
Due to the amounts that we incur related to our drilling and completion program and the timing of such expenditures, we may continue to incur working capital deficits in the future. We expect that our cash flows from operating activities and availability under our revolving credit facility after application of the estimated net proceeds from the IPO and the Private Placement will be sufficient to fund our working capital needs. We expect that our pace of development, production volumes, commodity prices and differentials to NYMEX prices for our oil and natural gas production will be the largest variables affecting our working capital.
Debt Arrangements
Our revolving credit facility has a maximum credit amount of $1 billion, subject to a borrowing base, and all of our current and future subsidiaries will be guarantors under such facility. Amounts repaid under our revolving credit facility may be re-borrowed from time to time, subject to the terms of the facility. For more information on the revolving credit facility, please see “—Revolving Credit Facility.” The revolving credit facility is secured by liens on substantially all of our properties.
On May 29, 2014, we entered into a second lien credit agreement with Wilmington Trust, National Association, as administrative agent, and a syndicate of lenders for the Second Lien Notes with an aggregate principal amount equal to $430.0 million. The full balance was repaid in July 2016 with proceeds from our Senior Note Offering.
In July 2016, we closed a private offering of our unsecured 7.875% Senior Notes due 2021 that resulted in net proceeds of approximately $537.5 million. Our Senior Notes bear interest at an annual rate of 7.875%. Interest on our Senior Notes is payable on January 15 and July 15 of each year, and the first interest payment will be due on January 15, 2017. Our Senior Notes will mature on July 15, 2021. A portion of the proceeds of the 2016 Notes Offering was used to repay all of the outstanding borrowings and related premium, fees and expenses under our second lien notes and terminate such notes, and the remaining proceeds were used to repay borrowings under our revolving credit facility and for general business purposes, including acquisitions. Our Senior Notes are guaranteed by all of our current and future restricted subsidiaries (other than Extraction Finance Corp., the co-issuer of our Senior Notes).
Revolving Credit Facility
The amount available to be borrowed under our revolving credit facility is subject to a borrowing base that is redetermined semiannually on each May 1 and November 1, and will depend on the volumes of our proved oil and gas reserves and estimated cash flows from these reserves and other information deemed relevant by the administrative agent under our revolving credit facility. As of September 30, 2016, the borrowing base was $350.0 million, and there was $89.0 million outstanding under our revolving credit facility. On September 14, 2016, we entered into an amendment to our revolving credit facility that, among other things, increased the borrowing base to $350.0 million. The amendment also provided that upon consummation of the Bayswater Acquisition, the borrowing base would be increased to $450.0 million. The Bayswater Acquisition closed on October 3, 2016, which triggered the borrowing base increase. On December 7, 2016, our borrowing base was increased to $475.0 million. Our revolving credit facility will mature November 29, 2018.
Principal amounts borrowed will be payable on the maturity date, and interest will be payable quarterly for alternate base rate loans and at the end of the applicable interest period for Eurodollar loans. We have a choice of borrowing in Eurodollars or at the alternate base rate. Eurodollar loans bear interest at a rate per annum equal to an adjusted LIBOR rate (equal to the product of: (a) the LIBOR rate, multiplied by (b) a fraction (expressed as a decimal), the numerator of which is the number one and the denominator of which is the number one minus the reserve percentages (expressed as a decimal) on such date at which the administrative agent under our revolving credit facility is required to maintain reserves on ‘Eurocurrency Liabilities’ as defined in and pursuant to Regulation D of the Board of Governors of the Federal Reserve System) plus an applicable margin ranging from 200 to 300 basis points, depending on the percentage of our borrowing base utilized. Alternate base rate loans bear interest at a
rate per annum equal to the greatest of (i) the agent bank’s reference rate, (ii) the federal funds effective rate plus 50 basis points and (iii) the adjusted one-month LIBOR rate (as calculated above) plus 100 basis points, plus an applicable margin ranging from 100 to 200 basis points, depending on the percentage of our borrowing base utilized. As of September 30, 2016, borrowings under our revolving credit facility had a weighted average interest rate of 3.0%. We may repay any amounts borrowed prior to the maturity date without any premium or penalty other than customary LIBOR breakage costs.
The revolving credit facility is secured by liens on substantially all of our properties and guarantees from us and our current and future subsidiaries. The revolving credit facility contains restrictive covenants that may limit our ability to, among other things:
· incur additional indebtedness;
· sell assets;
· make loans to others;
· make investments;
· make certain changes to our capital structure;
· make or declare dividends;
· hedge future production or interest rates;
· enter into transactions with our affiliates;
· holding cash balances in excess of certain thresholds while carrying a balance of our revolving credit facility;
· incur liens; and
· engage in certain other transactions without the prior consent of the lenders.
The revolving credit facility requires us to maintain the following financial ratios:
· a current ratio, which is the ratio of our consolidated current assets (includes unused commitments under our revolving credit facility and unrestricted cash and excludes derivative assets) to our consolidated current liabilities (excludes obligations under our revolving credit facility, the second lien notes and certain derivative assets), of not less than 1.0 to 1.0 as of the last day of any fiscal quarter; and
· a maximum leverage ratio, which is the ratio of (i) consolidated debt less cash balances in excess of certain thresholds to (ii) our consolidated EBITDAX for the four fiscal quarter period most recently ended, not to exceed 4.0 to 1.0 as of the last day of such fiscal quarter; provided that (a) for the quarters ending between December 31, 2016 through December 31, 2017, annualized EBITDAX will be based on the last six months’ consolidated EBITDAX multiplied by 2, and (b) for the quarter ending March 31, 2018, annualized EBITDAX will be based on the last nine months’ consolidated EBITDAX multiplied by 4/3, and (c) for the quarters ending on or after June 30, 2018, annualized EBITDAX will be based on the last twelve months’ consolidated EBITDAX.
Second Lien Notes
As of September 30, 2016, we had no borrowings outstanding under our Second Lien Notes where, among others, we acted as guarantors. In connection with the closing of the 2016 Notes Offering, we repaid all borrowings and related premium, fees and expenses under our Second Lien Notes and terminated such notes. Borrowings under our formerly outstanding Second Lien Notes bore interest at an aggregate weighted average rate equal to 10.7% per annum.
Senior Notes
In July 2016, we closed a private offering of our unsecured 7.875% Senior Notes due 2021 that resulted in net proceeds of approximately $537.5 million. Our Senior Notes bear interest at an annual rate of 7.875%. Interest on our Senior Notes is payable on January 15 and July 15 of each year, and the first interest payment will be due on January 15, 2017. Our Senior Notes will mature on July 15, 2021.
We may, at our option, redeem all or a portion of our Senior Notes at any time on or after July 15, 2018. We are also entitled to redeem up to 35% of the aggregate principal amount of our Senior Notes before July 15, 2018, with an amount of cash not greater than the net proceeds that we raise in certain equity offerings at a redemption price equal to 107.875% of the principal amount of our Senior Notes being redeemed plus accrued and unpaid interest, if any, to the redemption date. In addition, prior to July 15, 2018, we may redeem some or all of our Senior Notes at a price equal to 100% of the principal amount thereof, plus accrued and unpaid interest, if any, to the redemption date, plus a “make-whole” premium. If we experience certain kinds of changes of control, holders of our Senior Notes may have the right to require us to repurchase their notes at 101% of the principal amount of the notes, plus accrued and unpaid interest, if any, to the date of purchase.
Our Senior Notes are our senior unsecured obligations and rank equally in right of payment with all of our other senior indebtedness and senior to any of our subordinated indebtedness. Our Senior Notes are fully and unconditionally guaranteed on a senior unsecured basis by each of our current and future restricted subsidiaries (other than Extraction Finance Corp., the co-issuer of our Senior Notes) that guarantees our indebtedness under a credit facility. The notes are effectively subordinated to all of our secured indebtedness (including all borrowings and other obligations under our revolving credit facility) to the extent of the value of the collateral securing such indebtedness, and structurally subordinated in right of payment to all existing and future indebtedness and other liabilities (including trade payables) of any future subsidiaries that do not guarantee the notes.
Convertible Preferred Securities
We previously issued to affiliates of Apollo $75.0 million in Series A Preferred Units to fund a portion of the purchase price for the Bayswater Acquisition. The Series A Preferred Units were entitled to receive a cash dividend of 10% per year, payable quarterly in arrears. We used $90.0 million of the net proceeds from the IPO to redeem the Series A Preferred Units in full, which included a premium of $15.0 million.
In addition, we issued to, among others, investment funds affiliated with OZ Management LP and Yorktown $185.3 million in Series B Preferred Units to fund a portion of the purchase price for the Bayswater Acquisition. The Series B Preferred Units were entitled to receive a cash dividend of 10% per year, payable quarterly in arrears, and we had the ability to pay up to 50% of the quarterly dividend in kind. The Series B Preferred Units were converted in connection with the closing of the IPO into shares of our Series A Preferred Stock that are entitled to receive a cash dividend of 5.875% per year, payable quarterly in arrears, and we have the ability to pay such quarterly dividends in kind at a dividend rate of 10% per year (decreased proportionately to the extent such quarterly dividends are paid in cash). Beginning on or after the later of (a) 90 days after the closing of the IPO and (b) the Lock-Up Period End Date, the Series A Preferred Stock will be convertible into shares of our common stock at the election of the Series A Preferred Holders at a conversion ratio per share of Series A Preferred Stock of 61.9195. Beginning on or after the Lock-Up Period End Date until the three year anniversary of the closing of the IPO, we may elect to convert the Series A Preferred Stock at a conversion ratio per share of Series A Preferred Stock of 61.9195, but only if the closing price of our common stock trades at or above a certain premium to our initial offering price, such premium to decrease with time. In certain situations, including a change of control, the Series A Preferred Stock may be redeemed for cash in an amount equal to the greater of (i) 135% of the liquidation preference of the Series A Preferred Stock and (ii) a 17.5% annualized internal rate of return on the liquidation preference of the Series A Preferred Stock. The Series A Preferred Stock mature on October 15, 2021, at which time they are mandatorily redeemable for cash at the liquidation preference. See “Description of Capital Stock—Preferred Stock—Series A Preferred Stock.”
Contractual Obligations
A summary of our contractual obligations as of December 31, 2015 is provided in the following table.
|
|
|
Payments due by Period |
| |||||||||||||
|
|
|
Total |
|
Less than 1 |
|
1 - 3 years |
|
3 - 5 years |
|
More than 5 |
| |||||
|
|
|
|
|
|
|
(In thousands) |
|
|
| |||||||
|
Contractual Obligations |
|
|
|
|
|
|
|
|
|
|
| |||||
|
Office lease(1) |
|
$ |
22,666 |
|
$ |
1,668 |
|
$ |
4,990 |
|
$ |
4,400 |
|
$ |
11,608 |
|
|
Drilling rig obligations(2) |
|
3,029 |
|
3,029 |
|
— |
|
— |
|
— |
| |||||
|
Volume commitment(3) |
|
759,200 |
|
15,695 |
|
188,340 |
|
188,340 |
|
366,825 |
| |||||
|
Revolving credit facility and interest payable(4) |
|
244,675 |
|
6,738 |
|
237,937 |
|
— |
|
— |
| |||||
|
Second Lien Notes and interest payable(5) |
|
586,948 |
|
46,050 |
|
91,848 |
|
449,051 |
|
— |
| |||||
|
Total |
|
$ |
1,616,518 |
|
$ |
73,180 |
|
$ |
523,115 |
|
$ |
641,791 |
|
$ |
378,433 |
|
(1) We lease two office spaces in Denver, Colorado, one office space in Greeley, Colorado and one office space in Houston, Texas under four separate operating lease agreements. The Denver, Colorado leases expire on February 29, 2020 and May 31, 2026. The Greeley, Colorado and Houston, Texas leases expire on March 31, 2019 and October 31, 2017, respectively. Total rental commitments under non-cancelable leases for office space were $22.7 million at December 31, 2015.
(2) As of December 31, 2015, we were subject to commitments on two drilling rigs, which were set to expire on January 11, 2016 and November 9, 2016. In the event of early termination of these contracts, we would be obligated to pay an aggregate amount of approximately $3.0 million as of December 31, 2015, as required under the terms of the contracts. Upon the January 11, 2016 expiration, the corresponding drilling rig contract remained in effect on a month-to-month basis, subject to each party’s right to terminate upon 60 days’ notice. No notice for termination had been provided by either party as of May 12, 2016. In February 2016, we provided notice to terminate one of our drilling rigs that was subject to commitment at December 31, 2015. As part of this termination, we were obligated to pay $1.0 million in the second quarter of 2016.
(3) We entered into an agreement obligating us to deliver 40,000 Bbl/d of crude oil for a term of ten years and an additional 20,000 Bbl/d for a term of five years. Both commitments had an expected commencement date of November 30, 2016. The aggregate amount of estimated payments under these agreements was $759.2 million. In March 2016, we terminated the five-year 20,000 Bpd commitment and amended and restated our long-term crude oil delivery commitment agreement, which, as amended and restated, obligates us to deliver 40,000 Bbl/d during a ten-year period starting in November 30, 2016, such amount increasing to 58,000 Bbl/d by the third year of the contract. The aggregate amount of estimated payments under the new amended and restated agreement is $887.3 million over the ten years. For further discussion regarding our volume commitments, please refer to Note 11—Commitments and Contingencies to our historical unaudited financial statements for the nine months ended September 30, 2016 and 2015.
(4) Calculated based on December 31, 2015 outstanding borrowings under our revolving credit facility of $225.0 million and assumes no principal repayment until the maturity date of the notes. Interest on our revolving credit facility is payable at one of the following two variable rates as selected by us: a base rate based on the Prime Rate or the Eurodollar rate based in LIBOR. Either rate is adjusted upward by an applicable margin, based on the utilization percentage of the facility as outlined in the Pricing Grid. Additionally, our revolving credit facility provides for a commitment fee of 0.375% to 0.50%, depending on borrowing base usage. Cash interest expense on our revolving credit facility is estimated assuming no principal repayment until the maturity date and a fixed interest rate of 2.9% (our all-in rate on our revolving credit facility as of December 31, 2015).
(5) Calculated based on December 31, 2015 outstanding aggregate principal amount on our second lien notes of $430.0 million outstanding, at a weighted average fixed interest rate of 10.7%, Interest is payable on our second lien notes on a semi-annual basis through the maturity date of May 29, 2019. We used a portion of the net proceeds from the 2016 Notes Offering to repay all of the outstanding borrowings and related premium, fees, and expenses under our second lien notes (which were terminated concurrently with such repayment).
The above contractual obligations schedule does not include the 2016 Notes Offering, the Series A Preferred Stock, future anticipated settlement of derivative contracts or estimated amounts expected to be incurred in the future associated with the abandonment of our oil and gas properties, as we cannot determine with accuracy the timing of such payments. For further discussion regarding our derivative contracts and estimated future costs associated with the abandonment of our oil and gas properties, please refer to Note 6—Commodity Derivative Instruments and Note 7—Asset Retirement Obligations of our historical audited financial statements for the years ended December 31, 2015 and 2014. Additionally, for further information regarding our contractual obligations as of September 30, 2016, please refer to Note 11—Commitments and Contingencies to our historical unaudited financial statements for the nine months ended September 30, 2016 and 2015.
As is customary in the oil and gas industry, we may at times have commitments in place to reserve or earn certain acreage positions or wells. If we do not meet such commitments, the acreage positions or wells may be lost or we may be required to pay damages if certain performance conditions are not met.
Quarterly Financial Data
The following is a summary of the unaudited quarterly financial data for each of the quarters from first quarter 2014 through third quarter 2016 (in thousands, except per unit data). Operating results for the period ended September 30, 2016 are not necessarily indicative of the operating results for a full year. Historical results are not necessarily indicative of the results to be expected in future periods. You should read this data together with our consolidated financial statements and the related notes included elsewhere in this prospectus:
|
|
|
Three Months Ended |
| |||||||
|
|
|
March 31, |
|
June 30, |
|
September 30, |
| |||
|
Oil, natural gas and NGL sales |
|
$ |
45,133 |
|
$ |
65,364 |
|
$ |
72,902 |
|
|
Operating income (loss)(1) |
|
$ |
(16,635 |
) |
$ |
(3,593 |
) |
$ |
4,556 |
|
|
Net loss |
|
$ |
(45,519 |
) |
$ |
(127,614 |
) |
$ |
(37,267 |
) |
|
Basic loss per unit |
|
$ |
(0.15 |
) |
$ |
(0.38 |
) |
$ |
(0.11 |
) |
|
Diluted loss per unit |
|
$ |
(0.15 |
) |
$ |
(0.38 |
) |
$ |
(0.11 |
) |
|
|
|
Three Months Ended |
| ||||||||||
|
|
|
March 31, |
|
June 30, |
|
September 30, |
|
December 31, |
| ||||
|
Oil, natural gas and NGL sales |
|
$ |
36,559 |
|
$ |
56,223 |
|
$ |
48,846 |
|
$ |
56,122 |
|
|
Operating income (loss)(1) |
|
$ |
3,242 |
|
$ |
11,014 |
|
$ |
(4,401 |
) |
$ |
(6,315 |
) |
|
Net income (loss) |
|
$ |
(18,743 |
) |
$ |
(37,967 |
) |
$ |
18,650 |
|
$ |
(9,204 |
) |
|
Basic income (loss) per unit |
|
$ |
(0.08 |
) |
$ |
(0.14 |
) |
$ |
0.07 |
|
$ |
(0.03 |
) |
|
Diluted income (loss) per unit |
|
$ |
(0.08 |
) |
$ |
(0.14 |
) |
$ |
0.07 |
|
$ |
(0.03 |
) |
|
|
|
Three Months Ended |
| ||||||||||
|
|
|
March 31, |
|
June 30, |
|
September 30, |
|
December 31, |
| ||||
|
Oil, natural gas and NGL sales |
|
$ |
987 |
|
$ |
9,952 |
|
$ |
45,089 |
|
$ |
36,812 |
|
|
Operating income (1) |
|
$ |
669 |
|
$ |
4,941 |
|
$ |
24,826 |
|
$ |
13,552 |
|
|
Net income (loss) |
|
$ |
(1,082 |
) |
$ |
(1,878 |
) |
$ |
13,199 |
|
$ |
39,603 |
|
|
Basic income (loss) per unit |
|
$ |
(0.01 |
) |
$ |
(0.01 |
) |
$ |
0.07 |
|
$ |
0.17 |
|
|
Diluted income (loss) per unit |
|
$ |
(0.01 |
) |
$ |
(0.01 |
) |
$ |
0.10 |
|
$ |
0.17 |
|
(1) Oil, NGL and natural gas sales less lease operating expenses, production taxes and depreciation, depletion and amortization.
Quantitative and Qualitative Disclosure About Market Risk
We are exposed to market risk, including the effects of adverse changes in commodity prices and interest rates as described below. The primary objective of the following information is to provide quantitative and qualitative information about our potential exposure to market risks. The term “market risk” refers to the risk of loss arising from adverse changes in oil, natural gas and NGL prices and interest rates. The disclosures are not meant to be precise indicators of expected future losses, but rather indicators of reasonably possible losses. All of our market risk sensitive instruments were entered into for purposes other than speculative trading.
Commodity Price Risk
Our major market risk exposure is in the pricing that we receive for our oil, natural gas and NGL production. Pricing for oil, natural gas and NGL has been volatile and unpredictable for several years, and this volatility is expected to continue in the future. The prices we receive for our oil, natural gas and NGL production depend on many factors outside of our control, such as the strength of the global economy and global supply and demand for the commodities we produce.
To reduce the impact of fluctuations in oil prices on our revenues, we have periodically entered into commodity derivative contracts with respect to certain of our oil and natural gas production through various transactions that limit the downside of future prices received. We plan to continue our practice of entering into such transactions to reduce the impact of commodity price volatility on our cash flow from operations. Future transactions may include price swaps whereby we will receive a fixed price for our production and pay a variable market price to the contract counterparty. Additionally, we may enter into collars, whereby we receive the excess, if any, of the fixed floor over the floating rate or pay the excess, if any, of the floating rate over the fixed ceiling price. These hedging activities are intended to support oil prices at targeted levels and to manage our exposure to oil price fluctuations.
As of September 30, 2016, the fair market value of our oil derivative contracts was a net liability of $27.1 million. Based on our open oil derivative positions at September 30, 2016, a 10% increase in the NYMEX WTI price would increase our net oil derivative liability by approximately $32.4 million, while a 10% decrease in the NYMEX WTI price would decrease our net oil derivative liability by approximately $30.2 million. As of September 30, 2016, the fair market value of our natural gas derivative contracts was a net liability of $0.9 million. Based upon our open commodity derivative positions at September 30, 2016, a 10% increase in the NYMEX Henry Hub price would increase our net natural gas derivative liability by approximately $7.4 million, while a 10% decrease in the NYMEX Henry Hub price would decrease our net natural gas derivate liability by approximately $7.4 million. Please see “—How We Evaluate Our Operations—Derivative Arrangements.”
Counterparty and Customer Credit Risk
Our cash and cash equivalents are exposed to concentrations of credit risk. We manage and control this risk by investing these funds with major financial institutions. We often have balances in excess of the federally insured limits.
We sell oil, natural gas and NGL to various types of customers, including pipelines and refineries. Credit is extended based on an evaluation of the customer’s financial conditions and historical payment record. The future availability of a ready market for oil, natural gas and NGL depends on numerous factors outside of our control, none of which can be predicted with certainty. For the nine-months ended September 30, 2016, we had certain major customers that exceeded 10% of total oil, natural gas and NGL revenues. We do not believe the loss of any single purchaser would materially impact its operating results because oil, natural gas and NGL are fungible products with well-established markets and numerous purchasers.
At September 30, 2016, we had commodity derivative contracts with six counterparties. We do not require collateral or other security from counterparties to support derivative instruments; however, to minimize the credit risk in derivative instruments, it is our policy to enter into derivative contracts only with counterparties that are creditworthy financial institutions deemed by management as competent and competitive market-makers. Additionally, we use master netting agreements to minimize credit-risk exposure. The creditworthiness of our counterparties is subject to periodic review. Three of the six counterparties to the derivative instruments are highly rated entities with corporate ratings at A3 classifications or above by Moody’s. The other three counterparties had a corporate rating of Baa1 by Moody’s. For the three and nine months ended September 30, 2016 and 2015, we did not incur any losses with respect to counterparty contracts. None of our existing derivative instrument contracts contains credit-risk related contingent features.
Interest Rate Risk
At September 30, 2016, we had $89.0 million of variable-rate debt outstanding, with a weighted average interest rate of LIBOR plus 2.3%. Assuming no change in the amount outstanding, the impact on interest expense of a 1% increase or decrease in the average interest rate would be approximately $0.9 million per year. We may begin entering into interest rate swap arrangements on a portion of our outstanding debt to mitigate the risk of fluctuations in LIBOR. See “—Liquidity and Capital Resources—Debt Arrangements.”
Critical Accounting Policies and Estimates
Use of Estimates in the Preparation of Financial Statements
The preparation of the financial statements in conformity with GAAP requires management to make estimates and assumptions that affect the reported amounts of oil and gas reserves, assets and liabilities and disclosure of contingent assets and liabilities at the date of the financial statements and the reported amounts of revenues and expenses during the reporting period. Significant areas requiring the use of assumptions, judgments and estimates include (1) oil and gas reserves; (2) cash flow estimates used in impairment testing of oil and gas properties; (3) depreciation, depletion, amortization and accretion; (4) asset retirement obligations; (5) assigning fair value and allocating purchase price in connection with business combinations; (6) accrued revenue and related receivables; (7) valuation of commodity derivative instruments; (8) accrued liabilities; and (9) valuation of unit-based payments. Although management believes these estimates are reasonable, actual results could differ from these estimates. We evaluate our estimates on an on-going basis and base our estimates on historical experience and on various other assumptions we believe to be reasonable under the circumstances. Although actual results may differ from these estimates under different assumptions or conditions, we believe our estimates are reasonable.
Successful Efforts Method of Accounting
We follow the successful efforts method of accounting for oil and gas properties. Under this method of accounting, all property acquisition costs and development costs are capitalized when incurred and depleted on a units-of-production basis over the remaining life of proved reserves and proved developed reserves, respectively.
The costs of exploratory wells are initially capitalized pending a determination of whether proved reserves have been found. At the completion of drilling activities, the costs of exploratory wells remain capitalized if a determination is made that proved reserves have been found. If no proved reserves have been found, the costs of exploratory wells are charged to expense. In some cases, a determination of proved reserves cannot be made at the completion of drilling, requiring additional testing and evaluation of the wells. Cost incurred for exploratory wells that find reserves that cannot yet be classified as proved are capitalized if (a) the well has found a sufficient quantity of reserves to justify its completion as a producing well and (b) sufficient progress in assessing the reserves and the economic and operating viability of the project has been made. The status of suspended well costs is monitored continuously and reviewed quarterly. Due to the capital-intensive nature and the geographical characteristics of certain projects, it may take an extended period of time to evaluate the future potential of an exploration project and the economics associated with making a determination of its commercial viability.
Geological and geophysical costs are expensed as incurred. Costs of seismic studies that are utilized in development drilling within an area of proved reserves are capitalized as development costs. Amounts of seismic costs capitalized are based on only those blocks of data used in determining development well locations. To the extent that a seismic project covers areas of both developmental and exploratory drilling, those seismic costs are proportionately allocated between development costs and exploration expense.
We capitalize interest, if debt is outstanding, during drilling operations in our exploration and development activities.
Oil and Gas Reserves
Our estimates of proved reserves are based on the quantities of oil, natural gas and NGLs, which, by analysis of geoscience and engineering data, can be estimated with reasonable certainty to be economically producible from a given date forward from known reservoirs under existing economic conditions, operating methods and government regulations prior to the time at which contracts providing the right to operate expire, unless evidence indicates that renewal is reasonably certain, regardless of whether deterministic or probabilistic methods are used for the estimation. Our independent petroleum engineers, Ryder Scott, prepare a reserve and economic evaluation of all of our properties on a well-by-well basis. The accuracy of reserve estimates is a function of the:
· quality and quantity of available data;
· interpretation of that data;
· accuracy of various mandated economic assumptions; and
· judgment of the independent reserve engineer.
One of the most significant estimates we make is the estimate of oil, natural gas and NGL reserves. Oil, natural gas and NGL reserve estimates require significant judgments in the evaluation of all available geological, geophysical, engineering and economic data. The data for a given field may change substantially over time as a result of numerous factors including, but not limited to, additional development activity, production history, projected future production, economic assumptions relating to commodity prices, operating expenses, severance and other taxes, capital expenditures and remediation costs and these estimates are inherently uncertain. For example, if estimates of proved reserves decline, our DD&A rate will increase, resulting in a decrease in net income. A decline in estimates of proved reserves could also cause us to perform an impairment analysis to determine if the carrying amount of oil and gas properties exceeds fair value and could result in an impairment charge, which would reduce earnings. We cannot predict what reserve revisions may be required in future periods.
Ryder Scott estimated all of our proved reserve quantities as of June 30, 2016 and December 31, 2015. In connection with Ryder Scott performing their independent reserve estimations, we furnish them with the following information that they review: (1) technical support data, (2) technical analysis of geologic and engineering support information, (3) economic and production data and (4) our well ownership interests.
The following table presents information about proved reserve changes from period to period due to items we do not control, such as price, and from changes due to production history and well performance. These changes do not require a capital expenditure on our part, but may have resulted from capital expenditures we incurred to develop other estimated proved reserves.
|
|
|
Six Months Ended |
|
Year Ended |
|
|
|
|
MBoe Change |
|
MBoe Change |
|
|
Revisions resulting from price changes |
|
(2,394 |
) |
(48,578 |
) |
|
Revisions resulting from production and performance |
|
(10,066 |
) |
47,428 |
|
|
|
|
(12,460 |
) |
(1,150 |
) |
The recent significant decline in oil and natural gas prices increases the uncertainty as to the impact of commodity prices on our estimated proved reserves. We are unable to predict future commodity prices with any greater precision than the futures market. A prolonged period of depressed commodity prices may have a significant impact on the value and volumetric quantities of our proved reserve portfolio, assuming no other changes to our development plans or costs.
Depreciation, Depletion, Amortization and Accretion.
Our DD&A rate is dependent upon our estimates of total proved and proved developed reserves, which incorporate various assumptions and future projections. If our estimates of total proved or proved developed reserves decline, the rate at which we record DD&A expense increases, which in turn reduces our net income. Such a decline in reserves may result from lower commodity prices or other changes to reserve estimates, as discussed above, and we are unable to predict changes in reserve quantity estimates as such quantities are dependent on the success of our exploration and development program, as well as future economic conditions.
Impairment of Proved Oil and Gas Properties
Proved oil and gas properties are reviewed for impairment annually or when events and circumstances indicate a possible decline in the recoverability of the carrying amount of such property. We estimate the expected future cash flows of its oil and gas properties and compares these undiscounted cash flows to the carrying amount of the oil and gas properties to determine if the carrying amount is recoverable. If the carrying amount exceeds the estimated undiscounted future cash flows, we will write down the carrying amount of the oil and gas properties to fair value. The factors used to determine fair value include, but are not limited to, estimates of reserves, future commodity prices, future production estimates, estimated future capital expenditures and discount rates commensurate with the risk associated with realizing the projected cash flows. Impairment expense for proved oil and gas properties is
reported in impairment of long lived assets in the consolidated statements of operations, which increases accumulated depletion, depreciation and amortization.
We recognized an aggregate $12.2 million in impairment expense attributable to proved oil and gas properties for the year ended December 31, 2015. In December 2015, we sold proved oil and gas properties for proceeds of $4.7 million. As a result, these assets were fair valued on the date of the transaction in accordance with ASC 360, Property, Plant and Equipment. The net book value of these assets exceeded the fair value by $2.7 million, which we recognized as impairment expense attributable to these proved oil and gas properties for the year ended December 31, 2015. We recognized $22.5 million and $9.5 million in impairment expense on proved oil and gas properties for the nine months ended September 30, 2016 and 2015, respectively. The impairment expense for the nine months ended September 30, 2016 and 2015 is related to impairment of the assets in the Company’s Northern field. The future undiscounted cash flows did not exceed its carrying amount associated with its proved oil and gas properties in its Northern field and it was determined that the proved oil and gas properties had no remaining fair value. Therefore, the full net book value of these proved oil and gas properties were impaired at June 30, 2016 and 2015.
Our impairment analyses requires us to apply judgment in identifying impairment indicators and estimating future cash flows of our oil and gas properties. If actual results are not consistent with our assumptions and estimates or our assumptions and estimates change due to new information, we may be exposed to an impairment charge.
Forward commodity prices and estimates of future production also play a significant role in determining impairment of proved oil and gas properties. As a result of lower commodity prices and their impact on our estimated future cash flows, we have continued to review our proved oil and gas properties for impairment. At December 31, 2015, our expected undiscounted future cash flows exceeded the carrying value of our proved oil and gas properties by $0.8 billion, or 74%. At September 30, 2016, our expected undiscounted future cash flows exceeded the carrying value of our proved oil and gas properties by $1.6 billion, or 140%. The key assumptions used to determine the undiscounted future cash flows include estimates of future production, future commodity pricing, differentials, net estimated operating costs, anticipated capital expenditures and new wells on production. Future commodity pricing for oil and NGLs is based on six-year and five-year West Texas Intermediate strip prices, which increased 11% from an average of $48.40/Bbl at December 31, 2015 to an average of $53.48/Bbl at September 30, 2016, and on six-year and five-year Henry Hub strip prices, which increased 2% from an average of $2.70/MMBtu at December 31, 2015 to an average of $2.77/MMBtu at September 30, 2016. As part of our year-end reserves estimation process, we expect changes in the key assumptions used, which could be significant, including updates to future production estimates to align with our anticipated five-year drilling plan and changes in our differentials, capital costs and operating expense assumptions, which we expect to decrease further as a result of sustained lower commodity prices. Therefore, even if forward commodity prices remain at current levels, we are unable to quantify the amount of impairment of our proved oil and natural gas properties, if any, at this time until our year-end reserves estimation process is complete.
Impairment of Unproved Oil and Gas Properties
Unproved oil and gas properties consist of costs to acquire unevaluated leases as well as costs to acquire unproved reserves. We evaluate significant unproved oil and gas properties for impairment based on remaining lease term, drilling results, reservoir performance, seismic interpretation or future plans to develop acreage. When successful wells are drilled on undeveloped leaseholds, unproved property costs are reclassified to proved properties and depleted on a unit-of-production basis. Impairment expense and lease extension payments for unproved properties is reported in exploration expenses in the consolidated statements of operations. As a result of the abandonment and impairment of unproved properties, we recognized $3.3 million and $6.2 million in impairment expense for the nine months ended September 30, 2016 and 2015, respectively.
Commodity Derivative Instruments
We have entered into commodity derivative instruments, as described below. We have utilized swaps, put options, and call options to reduce the effect of price changes on a portion of our future oil and natural gas production.
A swap has an established fixed price. When the settlement price is below the fixed price, the counterparty pays us an amount equal to the difference between the settlement price and the fixed price multiplied by the hedged
contract volume. When the settlement price is above the fixed price, we pay our counterparty an amount equal to the difference between the settlement price and the fixed price multiplied by the hedged contract volume.
A put option has an established floor price. The buyer of the put option pays the seller a premium to enter into the put option. When the settlement price is below the floor price, the seller pays the buyer an amount equal to the difference between the settlement price and the strike price multiplied by the hedged contract volume. When the settlement price is above the floor price, the put option expires worthless. Some of our purchased put options have deferred premiums. For the deferred premium puts, we agree to pay a premium to the counterparty at the time of settlement.
A call option has an established ceiling price. The buyer of the call option pays the seller a premium to enter into the call option. When the settlement price is above the ceiling price, the seller pays the buyer an amount equal to the difference between the settlement price and the strike price multiplied by the hedged contract volume. When the settlement price is below the ceiling price, the call option expires worthless.
We combine swaps, purchased put options, sold put options, and sold call options in order to achieve various hedging strategies. Some examples of our hedging strategies are collars which include purchased put options and sold call options, three-way collars which include purchased put options, sold put options, and sold call options, and enhanced swaps, which include either sold put options or sold call options with the associated premiums rolled into an enhanced fixed price swap.
The objective of our use of commodity derivative instruments is to achieve more predictable cash flows in an environment of volatile oil and gas prices and to manage its exposure to commodity price risk. While the use of these commodity derivative instruments limits the downside risk of adverse price movements, such use may also limit our ability to benefit from favorable price movements. We may, from time to time, add incremental derivatives to hedge additional production, restructure existing derivative contracts or enter into new transactions to modify the terms of current contracts in order to realize the current value of our existing positions. We do not enter into derivative contracts for speculative purposes.
The commodity derivative instruments are measured at fair value and are included in the accompanying balance sheets as commodity derivative assets. We have not designated any of the derivative contracts as fair value or cash flow hedges. Therefore, we do not apply hedge accounting to the commodity derivative instruments. Net gains and losses on commodity derivative instruments are recorded based on the changes in the fair values of the derivative instruments. Net gains and losses on commodity derivative instruments are recorded in the commodity derivative gain (loss) line on the statements of operations. Our cash flow is only impacted when the actual settlements under the commodity derivative contracts result in making or receiving a payment to or from the counterparty. These settlements under the commodity derivative contracts are reflected as operating activities in our statements of cash flows.
Our valuation estimate takes into consideration the counterparties’ credit worthiness, our credit worthiness, and the time value of money. The consideration of the factors result in an estimated exit-price for each derivative asset or liability under a market place participant’s view. Management believes that this approach provides a reasonable, non-biased, verifiable, and consistent methodology for valuing commodity derivative instruments. Please see “—How We Evaluate Our Operations—Derivative Arrangements.”
Accounting for Business Combinations
We account for all of our business combinations using the purchase method, which is the only method permitted under FASB ASC Topic 805, Business Combinations, and involves the use of significant judgment. In connection with a business combination, the acquiring company must allocate the cost of the acquisition to assets acquired and liabilities assumed based on fair values as of the acquisition date. Any excess or shortage of amounts assigned to assets and liabilities over or under the purchase price is recorded as a gain on bargain purchase or goodwill. The amount of goodwill or gain on bargain purchase recorded in any particular business combination can vary significantly depending upon the values attributed to assets acquired and liabilities assumed.
In estimating the fair values of assets acquired and liabilities assumed in a business combination, we make various assumptions. The most significant assumptions relate to the estimated fair values assigned to proved and
unproved oil and gas properties. If sufficient market data is not available regarding the fair values of proved and unproved properties, we must prepare estimates. To estimate the fair values of these properties, we prepare estimates of gas, oil and NGL reserves. We estimate future prices to apply to the estimated reserves quantities acquired and estimate future operating and development costs to arrive at estimates of future net cash flows. For estimated proved reserves, the future net cash flows are discounted using a market-based weighted average cost of capital rate determined appropriate at the time of the acquisition. The market-based weighted average cost of capital rate is subjected to additional project-specific risking factors. To compensate for the inherent risk of estimating and valuing unproved reserves, when a discounted cash flow model is used, the discounted future net cash flows of probable and possible reserves are reduced by additional risk factors. In some instances, market comparable information of recent transactions is used to estimate fair value of unproved acreage.
Estimated fair values assigned to assets acquired can have a significant effect on results of operations in the future. A higher fair value assigned to a property results in higher DD&A expense, which results in lower net earnings. Fair values are based on estimates of future commodity prices, reserves quantities, operating expenses and development costs. This increases the likelihood of impairment if future commodity prices or reserves quantities are lower than those originally used to determine fair value, or if future operating expenses or development costs are higher than those originally used to determine fair value. Impairment would have no effect on cash flows but would result in a decrease in net income for the period in which the impairment is recorded.
Asset Retirement Obligations
Our asset retirement obligations (“ARO”) consist of estimated future costs associated with the plugging and abandonment of oil, natural gas and NGL wells, removal of equipment and facilities from leased acreage and land restoration in accordance with applicable local, state and federal laws. The fair value of an ARO liability is required to be recognized in the period in which it is incurred, with the associated asset retirement cost capitalized as part of the carrying cost of the oil and gas asset. The recognition of an ARO requires that management make numerous assumptions regarding such factors as the estimated probabilities, amounts and timing of settlements; the credit-adjusted risk-free discount rate to be used; inflation rates; and future advances in technology. In periods subsequent to the initial measurement of the ARO, we must recognize period-to-period changes in the liability resulting from the passage of time and revisions to either the timing or the amount of the original estimate of undiscounted cash flows. Increases in the ARO liability due to the passage of time impact net income as accretion expense. The related capitalized cost, including revisions thereto, is charged to expense through DD&A over the life of the oil and gas property.
Revenue Recognition
Revenues from the sale of oil, natural gas and NGL are recognized when the product is delivered at a fixed or determinable price, title has transferred, and collectability is reasonably assured and evidenced by a contract. We recognize revenues from the sale of oil, natural gas and NGL using the sales method of accounting, whereby revenue is recorded based on the our share of volume sold, regardless of whether we have taken our proportional share of volume produced. A receivable or liability is recognized only to the extent that we have an imbalance on a specific property greater than the expected remaining proved reserves. We receive payment one to three months after delivery. At the end of each month, we estimate the amount of production delivered to purchasers and the price we will receive. Variances between our estimates and the actual amounts received are recorded in the month payment is received. A 10% change in our September 30, 2016 and December 31, 2015 revenue accrual would have impacted total operating revenues by approximately $2.4 million and $1.6 million for the nine months ended September 30, 2016 and the year ended December 31, 2015, respectively.
Unit-Based Payments
We and PRL, on our behalf, granted restricted unit awards (“RUAs”) to certain of our employees and non-employee consultants, which therefore required us to recognize the expense in our financial statements. All unit-based payments to employees are measured at fair value on the grant date and expensed over the relevant service period. Unit-based payments to non-employees are measured at fair value at each financial reporting date and expensed over the period of performance, such that aggregate expense recognized is equal to the fair value of the RUAs on the date performance is completed. All unit-based payment expense is recognized using the straight-line method and is included within general and administrative expenses in the statements of operations. All RUAs were converted into shares of our common stock in connection with the IPO.
Income Taxes
Prior to the IPO, we were organized as a Delaware limited liability company and were treated as a flow-through entity for U.S. federal and state income tax purposes. As a result, our net taxable income and any related tax credits were passed through to the members and were included in their tax returns even though such net taxable income or tax credits may not have actually been distributed.
Recent Accounting Pronouncements
The accounting standard-setting organizations frequently issue new or revised accounting rules. We regularly review new pronouncements to determine their impact, if any, on its financial statements.
In January 2017, the Financial Accounting Standards Board (“FASB”) issued Accounting Standards Update (“ASU”) No. 2017-01, which clarifies the definition of a business when evaluating whether transactions should be accounted for as acquisitions or disposals of assets or businesses. For public entities, the new guidance is effective for fiscal years beginning after December 15, 2017, and interim periods within those fiscal years. Early adoption is permitted for transactions for which the acquisition date occurs before the issuance date or effective date of the amendments, only when the transaction has not been reported in the financial statements that have been issued or made available for issuance. We are currently evaluating this new standard to determine the potential impact to its financial statements and related disclosures.
In August 2016, the FASB issued ASU No. 2016-15, which addresses eight specific cash flow issues, including presentation of debt prepayments or debt extinguishment costs, with the objective of reducing the existing diversity in practice. For public entities, the new guidance is effective for fiscal years beginning after December 15, 2017, and interim periods within those fiscal years. Early adoption is permitted, including an adoption in an interim period, with a required retrospective application to each period presented. We are currently evaluating this new standard to determine the potential impact to its financial statements and related disclosures.
In March 2016, the FASB issued ASU No. 2016-09, which simplifies the accounting for share-based payment award transactions, including: (a) income tax consequences; (b) classification of awards as either equity or liabilities; and (c) classification on the consolidated statements of cash flows. ASU 2016-09 is effective for public companies for annual reporting periods beginning after December 15, 2016, including interim periods within those fiscal years. Early adoption is permitted in any interim period or annual period with any adjustment reflected as of the beginning of the fiscal year of adoption. We are currently evaluating this new standard to determine the potential impact to its financial statements and related disclosures.
In March 2016, the FASB issued ASU No. 2016-06, which clarifies the requirements to assess whether an embedded put or call option is clearly and closely related to the debt host, solely in accordance with the four-step decision sequence in FASB ASC Topic 815, Derivatives and Hedging, as amended by ASU 2016-06. This standard is effective for fiscal years, and interim periods within those fiscal years, beginning after December 15, 2016 and should be applied using a modified retrospective approach. Early adoption is permitted. We are currently evaluating the impact of adopting ASU 2016-06, however the standard is not expected to have a significant effect on its consolidated financial statements.
In February 2016, the FASB issued ASU No. 2016-02, which requires lessee recognition on the balance sheet of a right-of-use asset and a lease liability, initially measured at the present value of the lease payments. It further requires recognition in the income statement of a single lease cost, calculated so that the cost of the lease is allocated over the lease term on a generally straight-line basis. Finally, it requires classification of all cash payments within operating activities in the statements of cash flows. It is effective for fiscal years commencing after December 15, 2018 and early adoption is permitted. We are currently evaluating the impact this new standard will have on its financial statements.
In September 2015, the FASB issued ASU No. 2015-16. This ASU eliminates the requirement to retrospectively apply measurement-period adjustments made to provisional amounts recognized in a business combination. The accounting update also requires an entity to present separately on the face of the income statement, or disclose in the notes, the portion of the amount recorded in current-period earnings, by line item, that would have been recorded in previous reporting periods if the adjustment to the estimated amounts had been recognized as of the acquisition date. ASU 2015-16 is effective for fiscal years, and interim periods within those fiscal years, beginning after December 15, 2015. This standard should be applied prospectively, and early adoption is permitted. We elected for early adoption for its year end December 31, 2015 financial statements. The adoption of this standard did not have a significant impact on our financial statements.
In July 2015, the FASB issued ASU No. 2015-11, which updates the authoritative guidance for inventory, specifically that inventory should be valued at each reporting period at the lower of cost or net realizable value. This
guidance is effective for the annual period beginning after December 15, 2016; early adoption is permitted. We are currently evaluating the impact of this new standard; however, we do not expect adoption to have a material impact on its financial statements.
In April 2015, the FASB issued ASU No. 2015-03, with an objective to simplify the presentation of debt issuance costs in financial statements by presenting such costs in the balance sheet as a direct deduction from the related debt liability rather than as an asset. Effective January 1, 2016, we adopted ASU No. 2015-03 on a retrospective basis. FASB ASU No. 2015-03 should be applied retrospectively and represent a change in accounting principle.
In August 2015, the FASB issued ASU No. 2015-15, which amends ASU 2015-03 which had not addressed the balance sheet presentation of debt issuance costs incurred in connection with line-of-credit arrangements. Under ASU 2015-15, a Company may defer debt issuance costs associated with line-of-credit arrangements and present such costs as an asset, subsequently amortizing the deferred debt issuance costs ratably over the term of the line-of-credit arrangement, regardless of whether there are any outstanding borrowings. ASU 2015-15 is consistent with how we currently account for debt issuance costs related to our revolving credit facility.
In November 2014, the FASB issued ASU No. 2014-16, which updates authoritative guidance for derivatives and hedging instruments, specifically in determining whether the host contract in a hybrid financial instrument issued in the form of a share is more akin to debt or to equity. This guidance is effective for the annual period beginning after December 15, 2015; early adoption is permitted. We are currently evaluating the impact of this new standard; however, we do not expect adoption to have a material impact on its financial statements.
In August 2014, the FASB issued ASU No. 2014-15, with an objective to provide guidance on management’s responsibility to evaluate whether there is substantial doubt about a company’s ability to continue as a going concern and to provide related footnote disclosures. ASU 2014-15 is effective for fiscal years ending after December 15, 2016, and annual and interim periods thereafter. This standard is not expected to have an impact on our financial statements.
In May 2014, the FASB issued ASU No. 2014-09, which establishes a comprehensive new revenue recognition model designed to depict the transfer of goods or services to a customer in an amount that reflects the consideration the entity expects to receive in exchange for those goods or services. The ASU allows for the use of either the full or modified retrospective transition method. In August 2015, the FASB issued ASU No. 2015-14, which deferred ASU No. 2014-09 for one year, and is effective for annual reporting periods beginning after December 15, 2017, including interim reporting periods within that reporting period. Earlier application is permitted only as of reporting periods beginning after December 15, 2016. The FASB subsequent issued ASU 2016-08, ASU 2016-10, ASU 2016-11 and ASU 2016-12, which provided additional implementation guidance. We are currently evaluating the level of effort necessary to implement the standards, evaluating the provisions of each of these standards, and assessing their potential impact on our financial statements and disclosures, as well as determining whether to use the full retrospective method or the modified retrospective method.
There are no other accounting standards applicable to us that have been issued but not yet adopted by us as of September 30, 2016, and through the date the financial statements were available to be issued that would have a material impact on our financial statements.
Inflation
Inflation in the United States has been relatively low in recent years and did not have a material impact on our results of operations for the years ended 2015 and 2014 or for the nine months ended September 30, 2016. Although the impact of inflation has been insignificant in recent years, it is still a factor in the United States economy and we tend to experience inflationary pressure on the cost of oilfield services and equipment as increasing oil and gas prices increase drilling activity in our areas of operations. Given the recent decline in oil, natural gas and NGL prices, we would anticipate that costs of materials and services would also decline.
Off-Balance Sheet Arrangements
Currently, we do not have any off-balance sheet arrangements.
Overview
We are an independent oil and gas company focused on the acquisition, development and production of oil, natural gas NGL reserves in the Rocky Mountains, primarily in the Wattenberg Field of the Denver-Julesburg Basin (the “DJ Basin”) of Colorado. The Wattenberg Field has been producing since the 1970s and is a premier North American oil and natural gas basin characterized by high recoveries relative to drilling and completion costs, high initial production rates, long reserve life and multiple stacked producing horizons. We have assembled, as of September 30, 2016, approximately 100,000 net acres of large, contiguous acreage blocks in some of the most productive areas of the Wattenberg Field as indicated by the results of our horizontal drilling program and the results of offset operators. These properties have extensive production histories, high drilling success rates, and significant horizontal development potential. We believe our acreage in the Wattenberg Field has been significantly delineated by our own drilling success and by the success of offset operators, providing confidence that our inventory is relatively low-risk, repeatable and will continue to generate economic returns. We are primarily focused on growing our proved reserves and production primarily through the development of our large inventory of identified liquids-rich horizontal drilling locations in the Wattenberg Field.
We were founded in November 2012 with the objective of becoming a Wattenberg-focused company with acreage that has (i) low development risk as a result of being within the vicinity of other successful wells drilled by other oil and gas companies, (ii) limited vertical well drainage relative to offset operators in a field with significant historical vertical activity, and (iii) higher oil content than was traditionally targeted when many operators first established their position in the field seeking natural gas production. We believe these characteristics enhance our horizontal production capabilities, recoveries and economic results. Our drilling economics are further enhanced by our ability to drill longer laterals due to our large contiguous acreage position, which our management team built through organic leasing and a series of strategic acquisitions. We operated 96% of our horizontal production for the nine months ended September 30, 2016 and maintain control of a large majority of our drilling inventory. In addition, we proactively seek to secure the necessary midstream and operational infrastructure to keep pace with our production growth.
As of September 30, 2016, we have drilled 293 gross one-mile equivalent horizontal wells and have completed 245 gross one-mile equivalent horizontal wells. We are currently running an effective three-rig program and retain the flexibility to adjust our rig count based on the commodity price environment. We have demonstrated our ability to manage a drilling program of larger size, operating four rigs from time to time on a spot basis. Due to significant improvements in our drilling efficiency since late 2014, each of our rigs is currently able to drill over twice as many wells per year as we were previously able to drill. Our estimated average net daily production during the three months ended September 30, 2016 was approximately 37,600 BOE/d. The charts below demonstrate the substantial growth in our average net daily production and well count since the second quarter of 2014.
|
Average Net |
Wells Drilled and Completed(1) |
|
Daily Production (BOE/d) |
|
|
|
|

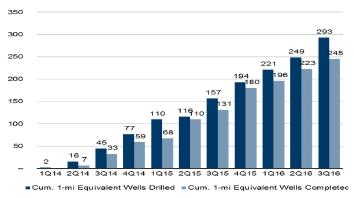
(1) Reflects one-mile equivalent wells drilled or completed by us.
(2) Reflects 28,948 BOE/d attributable to our historically owned properties and approximately 8,600 BOE/d attributable to the Bayswater Assets.
The following table provides summary information regarding our proved reserves as of June 30, 2016, and our estimated average net daily production during the three months ended September 30, 2016.
|
Estimated Total Proved Reserves |
|
Average |
|
|
| ||||||||||||
|
Oil |
|
Natural |
|
NGL |
|
Total |
|
% |
|
% |
|
% |
|
Production |
|
R/P Ratio |
|
|
79,111 |
|
365,702 |
|
47,227 |
|
187,288 |
|
42 |
% |
67 |
% |
23 |
% |
37,600 |
|
14.1 |
|
(1) Includes de minimis reserves and production attributable to properties in our Northern Extension Area. Please see “—Other Properties.”
(2) Includes both oil and NGL.
(3) Estimated average net daily production. Consisted of approximately 48% oil, 30% natural gas and 22% NGL.
(4) Represents the number of years proved reserves would last assuming production continued at the average rate for the three months ended September 30, 2016. Because production rates naturally decline over time, the R/P Ratio is not a useful estimate of how long properties should economically produce.
Our management team has significant experience in the Wattenberg Field. Our management team members were key participants in the shift from vertical to horizontal drilling that recently occurred during their tenures at key Wattenberg operators, such as Anadarko Petroleum, Noble Energy, PDC Energy and others. Our management and technical teams have collectively participated in the drilling of over 500 horizontal wells in the Niobrara and Codell formations in the Wattenberg Field. To date, we have focused our horizontal drilling program primarily in the Niobrara and Codell formations; however, based on results from our horizontal drilling program and those of offset operators such as Anadarko Petroleum and Noble Energy, we believe significant development opportunities exist in the J-Sand, Greenhorn and Sussex formations. In addition, based on our current permitting activities, we believe that, via additional downspacing in the Niobrara formation, we could have up to approximately 600 additional drilling locations, which are not captured in the inventory numbers below. As of September 30, 2016, we had a drilling inventory consisting of 3,929 gross (2,575 net) identified locations within the Wattenberg Field, as adjusted to one-mile equivalents. The table below sets forth a summary of our identified gross horizontal drilling locations in the Wattenberg Field by target zone as of September 30, 2016.
|
|
|
Identified Gross Horizontal Drilling Locations(1)(2) |
|
Horizontal Drilling |
| ||||
|
Net Acreage(3) |
|
Niobrara |
|
Codell |
|
Total(4)(5) |
|
Inventory (Years)(6) |
|
|
100,000 |
|
2,532 |
|
1,397 |
|
3,929 |
|
14.3 |
|
(1) As adjusted for lateral length to present one-mile equivalents (approximately 4,200 feet). Please see “Business—Drilling Locations” for more information regarding the process and criteria through which these drilling locations were identified. The drilling locations on which we actually drill will depend on the availability of capital, regulatory approvals, takeaway capacity, commodity prices, costs, actual drilling results and other factors. Any drilling activities we are able to conduct on these identified locations may not be successful and may not result in the addition of proved reserves to our existing proved reserves base. See “Risk Factors—Risks Related to the Oil, Natural Gas and NGL Industry and Our Business—Our identified drilling locations are scheduled over many years, making them susceptible to uncertainties that could materially alter the occurrence or timing of their drilling. In addition, we may not be able to raise the substantial amount of capital that would be necessary to drill such locations.”
(2) Includes 159 drilled but uncompleted one-mile equivalent wells.
(3) As of September 30, 2016. Approximate net acreage represents only our oil and gas properties in the Wattenberg Field and does not include the approximately 120,000 net acres associated with our Northern Extension Area. We have not identified any drilling locations at this time on our Northern Extension Area. Please see “—Other Properties.”
(4) Includes 918 identified drilling locations associated with proved undeveloped reserves as of September 30, 2016, as adjusted for lateral length to present one-mile equivalents (approximately 4,200 feet).
(5) If converted to 1.5-mile equivalent locations (approximately 6,800 feet), we would have an estimated 2,619 identified gross horizontal drilling locations. If converted to 2.0-mile equivalent locations (approximately 9,400 feet), we would have an estimated 1,965 identified gross horizontal drilling locations.
(6) Based on a continuous three-rig drilling program and a four day spud-to-spud drilling time.
As estimated by Ryder Scott Company, as of June 30, 2016, our estimated average EUR from our 156 Codell wells and 312 Niobrara wells classified as PUDs were 574 MBoe and 556 MBoe, respectively.
Other Properties
We hold approximately 120,000 net acres in the DJ Basin outside of the Wattenberg, which we refer to as our “Northern Extension Area,” that we believe is prospective for many of the same formations as our properties in the Wattenberg Field. As of September 30, 2016, there were de minimis proved reserves associated with this acreage. Average daily production associated with these properties for the quarter ended September 30, 2016 was approximately 663 BOE/d. We have not identified any drilling locations at this time on our Northern Extension Area.
Historical Capital Expenditures and Capital Budget
For the year ended December 31, 2015 and the nine months ended September 30, 2016, our aggregate drilling, completion and leasehold capital expenditures were approximately $398.4 million and $203.1 million, respectively, excluding acquisitions. We intend to allocate approximately $335.0 million of our 2016 capital budget to the drilling of 100 gross (90 net) wells and the completion of 92 gross (82 net) wells, approximately $5.0 million to midstream, and approximately $25.0 million to leaseholds. As of September 30, 2016, 69 gross (60 net) of the 100 gross (90 net) budgeted have been drilled, and 55 gross (44 net) of the 92 gross (82 net) wells have been completed. Our capital budget excludes any amounts that were or may be paid for potential acquisitions, including the Bayswater Acquisition.
Our 2017 capital budget is approximately $795-935 million, substantially all of which we intend to allocate to the DJ Basin. We intend to allocate approximately $675-775 million of our 2017 capital budget to the drilling of 185-190 gross operated wells and the completion of 190-195 gross operated wells, approximately $60-80 million to land, midstream and other uses, and approximately $60-80 million to non-operated drilling and completion. We are currently running a three-rig program.
The amount and timing of these capital expenditures is within our control and subject to our management’s discretion. We retain the flexibility to defer a portion of these planned capital expenditures depending on a variety of factors, including but not limited to the success of our drilling activities, prevailing and anticipated prices for oil, natural gas and NGL, the availability of necessary equipment, infrastructure and capital, the receipt and timing of required regulatory permits and approvals, seasonal conditions, drilling and acquisition costs and the level of participation by other interest owners. Any postponement or elimination of our development drilling program could result in a reduction of proved reserve volumes and related standardized measure. These risks could materially affect our business, financial condition and results of operations.
Our Business Strategies
Our business strategy is to increase stockholder value through the following:
· Grow proved reserves and production by developing our extensive horizontal drilling inventory. As of September 30, 2016, we identified a horizontal drilling inventory of 3,929 gross locations targeting the Niobrara and Codell zones, as adjusted to one-mile equivalents. While horizontal development of the Wattenberg Field is a relatively recent development, we consider our large inventory of horizontal drilling locations in the Wattenberg Field to be relatively low-risk based on information gained from the large number of existing wells in the area, industry activity surrounding our acreage, and the consistent and predictable geology surrounding our positions. We believe the combination of our large inventory of relatively low-risk drilling locations with long-lived reserves leads to a predictable production profile. We are able to enhance our drilling economics and generate higher EURs per well drilled by taking advantage of our large contiguous acreage position to drill longer laterals. Based on results from our horizontal drilling program and those of offset operators such as Anadarko Petroleum and Noble Energy, we believe significant development opportunities exist in the J-Sand, Greenhorn and Sussex formations as well as via additional downspacing in the Niobrara formation, thus potentially increasing our horizontal drilling inventory significantly.
· Maintain a high degree of operational control in order to continuously improve operating and cost efficiencies. We operated approximately 96% of our horizontal production for the nine months ended September 30, 2016 and intend to maintain operational control of substantially all of our producing properties. We believe that retaining control of our production enables us to increase recovery rates, lower well costs, improve drilling performance and increase ultimate hydrocarbon recovery through optimization of our drilling and completion techniques. Additionally, operating our production allows us to more efficiently manage the pace of our horizontal development program and the gathering and marketing of our production. We continually monitor and adjust our drilling program with the objective of achieving the highest total returns on our portfolio of drilling opportunities.
· Leverage our experience operating in the Wattenberg Field to maximize returns. Members of our management and technical teams have spent the majority of their careers focused on operations in the Wattenberg Field. These team members were key participants in the shift from vertical to horizontal drilling that recently occurred during their tenures at key Wattenberg operators, including Anadarko Petroleum, Noble Energy, PDC Energy and others. As a result, we believe our management and technical teams are among the best operators in the Wattenberg Field today. Our team regularly benchmarks our operating data in order to evaluate our performance and identify opportunities to optimize our drilling and completion techniques and make informed decisions about our capital program and drilling activity levels. We intend to leverage our management and technical teams’ experiences in applying unconventional drilling and completion techniques in the Wattenberg Field to maximize our returns. As an example, our management team initially designed and utilized new and improved drilling and completion techniques, which were different than the industry standard, to avoid having to compete with larger operators on prices for services and products.
· Continue expanding our access to midstream infrastructure to keep pace with our production growth. We proactively seek to secure the necessary midstream and operational infrastructure necessary to support our drilling schedule and keep pace with our expected production growth. We are an anchor tenant on the Grand Mesa pipeline, which currently transports oil and gas out of the Wattenberg Field to Cushing, Oklahoma. We are committed to meet delivery commitments of 40,000 Bbls/d out of the basin, increasing to 58,000 Bbls/d by November 2018 and through 2026. Upon closing the Bayswater Acquisition, we became subject to two additional long-term crude oil delivery commitments, one for a term of seven years and one for a term of five years. We have total delivery commitment obligations of 5,000 Bpd in year one and 3,800 Bpd in year two through seven.
· Strategically augment acreage position through opportunistic acquisitions. Since inception, we have consummated six significant acquisitions in the Wattenberg Field, acquiring approximately 76,100 net acres, as of September 30, 2016. We intend to continue to strategically make opportunistic acquisitions as well as pursue additional leasing opportunities to further supplement our oil and natural gas properties, but expect such expenditures to represent a smaller proportion of our total capital budget.
· Maintain financial flexibility and apply a disciplined approach to capital allocation. We intend to maintain a conservative financial profile that will afford us flexibility through commodity price cycles. As of September 30, 2016, after giving effect to the Bayswater Acquisition, the issuance of the Convertible Preferred Securities, the IPO, the Private Placement and our recent increase to the borrowing base of our revolving credit facility, we have approximately $1,267.7 million of liquidity, with $792.7 million of cash and cash equivalents and $475.0 million of available borrowing capacity under our revolving credit facility. Consistent with our disciplined approach to financial management, we have an active commodity hedging program that seeks to reduce our exposure to downside commodity price fluctuations, enabling us to protect cash flows and maintain liquidity to fund our capital program and investment opportunities.
Our Competitive Strengths
We believe that the following strengths will allow us to successfully execute our business strategies:
· Large, contiguous acreage blocks concentrated in the Wattenberg Field. We own extensive and contiguous acreage blocks in the Wattenberg Field, which we believe to be one of the most prolific and
economic fields in the nation. Based on the results of our horizontal drilling program, and as evidenced by our 30-day, 90-day and 180-day production rates, we believe our wells are among the most productive in the Wattenberg Field. Our large, contiguous acreage blocks and focus on maintaining operational control allow us the flexibility to adjust our drilling and completion techniques, primarily through the length of our laterals, in order to optimize our well results and drilling economics. Additionally, our contiguous acreage allows us to leverage existing infrastructure for more cost efficient development and transportation as compared to non-contiguous acreage. We believe our approximately 100,000 net acres in the Wattenberg Field as of September 30, 2016 position us to continue growing our proved reserves and production in the current commodity price environment.
· Low-risk Wattenberg acreage position with multi-year inventory of liquids-rich drilling locations. We view our large identified horizontal drilling inventory targeting liquids-rich drilling opportunities to be relatively low-risk based on information gained from the large number of existing wells in the area, industry activity surrounding our acreage, and the consistent and predictable geology underlying our positions. We have used the subsurface and 3-D seismic data from our development programs, as well as vertical well penetration, to demonstrate the subsurface consistency of our inventory. We currently have 3-D seismic data on all locations in our drilling plan, which we believe reduces the risk associated with our development plan. As of September 30, 2016, our horizontal drilling inventory consisted of 3,929 gross (2,575 net) identified locations targeting the Niobrara and Codell formations, as adjusted to one-mile equivalents. Based on the results from our horizontal drilling program and those of offset operators such as Anadarko Petroleum and Noble Energy, we believe significant development opportunities exist in the J-Sand, Greenhorn and Sussex formations as well as via additional downspacing in the Niobrara formation. Based on a four day spud-to-spud and a three-rig drilling program, we have a drilling inventory of approximately 14.3 years, prior to considering locations other than those in the Niobrara and Codell formations.
· Significant operational control with low development costs. We operated 96% of our horizontal production for the nine months ended September 30, 2016. We intend to maintain operational control of a substantial majority of our drilling inventory. We believe that maintaining operating control enables us to increase our reserves while lowering our development costs. Our control over operations also allows us to utilize cost-effective operating practices, including the selection of drilling locations, timing of development and associated capital expenditures and continuous improvement of drilling, completion and stimulation techniques. We have been successful in achieving significant reductions in our drilling, completion and facilities costs. In addition, our drilling contract structure allows us to proactively adjust our rig count based on the commodity price environment. These factors contribute to our ability to grow production and reserves in lower commodity price environments.
· High caliber management team with substantial technical expertise and demonstrated record navigating through commodity price volatility. Our management and technical teams have extensive experience and a history of working together on the cost-efficient management of large scale drilling programs in the Wattenberg Field. Our management and technical teams are also experienced in the disciplined allocation of capital focused on growing reserves and production and identifying, executing and integrating acquisitions. Members of our management team have significant experience in the Wattenberg Field and were key participants in the shift from vertical to horizontal drilling that recently occurred during their tenures at industry leaders, including Anadarko Petroleum, Noble Energy, PDC Energy and others. Our management and technical teams have collectively participated in the drilling of over 500 horizontal wells in the Niobrara and Codell formations in the field. Through the significant decrease and volatility in commodity prices in late 2014, we have demonstrated our ability to responsibly grow our production and proved reserves while maintaining a conservative balance sheet.
· Financial strength and flexibility. We have a strong financial position and a prudent financial management strategy, which will allow us to actively allocate capital in order to grow our proved reserves and production, both organically and through strategic acquisitions. As of September 30, 2016, after giving effect to the Bayswater Acquisition, the issuance of the Convertible Preferred Securities, the IPO, the Private Placement and our recent increase to the borrowing base of our revolving credit facility, we have approximately $1,267.7 million of liquidity, with $792.7 million of cash and cash equivalents and $475.0
million of available borrowing capacity under our revolving credit facility. We believe this borrowing capacity, along with our cash flow from operations and existing cash on the balance sheet, will provide us with sufficient liquidity to execute on our 2017 capital program. We have an established hedging program to protect our future cash flows and provide some certainty for the budgeting of our capital plan.
Recent Developments
Initial Public Offering
On October 17, 2016, we completed an initial public offering of 33,333,333 shares of our common stock at a price to the public of $19.00 per share and we became a publicly traded company listed on NASDAQ under the ticker symbol “XOG”. After deducting underwriting discounts and commissions and estimated offering expenses payable by us, we received approximately $683.7 million of aggregate net proceeds from our initial public offering after the underwriters exercised their option on October 24, 2016 to purchase 5,000,000 additional shares in full.
Bayswater Acquisition
Bayswater Assets
On July 29, 2016, we entered into a definitive agreement with Bayswater Exploration & Production, LLC and certain of its affiliates to acquire additional oil and gas properties primarily located in the Wattenberg Field for total consideration of approximately $419 million in cash after customary purchase price adjustments. Upon completion of the Bayswater Acquisition, we acquired producing and non-producing assets primarily located in the central and northwest portions of the Wattenberg Field from an existing working interest partner, primarily around our existing Greeley and Windsor areas.
The Bayswater Assets consist of working interests in approximately 6,100 net acres and produced approximately 8,600 net BOE/d for the three months ended September 30, 2016. As of July 29, 2016, the Bayswater Assets included 36 gross (20 net) drilled but uncompleted wells, representing 53 gross (32 net) wells on a 1-mile equivalent basis. We expect the majority of these drilled but uncompleted wells to be brought online in the first half of 2017. In addition, the Bayswater Assets will result in an additional 1,119 gross drilling locations (or 119 net locations on a 1-mile equivalent basis). A majority of these locations are located on acreage in which we already own a majority working interest and operate, resulting in an additional 90 unique gross drilling locations and 30 drilled but uncompleted wells. The Bayswater Assets are subject to two firm transportation agreements for a total term of seven years, which result in delivery commitment obligations of 5,000 Bpd in year one and 3,800 Bpd in year two through seven.
Based on a reserve report from Ryder Scott, there are approximately 25,992 MBoe of proved reserves associated with the Bayswater Assets as of June 30, 2016, of which 57% were undeveloped.
We closed the Bayswater Acquisition on October 3, 2016. We funded the purchase price through the issuance of $260.3 million in convertible preferred securities and borrowings under our revolving credit facility.
Option to Acquire Additional Assets from Bayswater
In connection with the consummation of the Bayswater Acquisition, we paid $10.0 million for an option to purchase additional assets from Bayswater for an additional $190.0 million, for a total purchase price for the Additional Bayswater Assets of $200.0 million. The option may be exercised at any time until March 31, 2017. If we do not exercise our option to acquire the Additional Bayswater Assets, Bayswater will have the right until April 30, 2017 to elect to sell those assets to us for an additional $120.0 million, for a total purchase price for the Additional Bayswater Assets of $130.0 million. The Additional Bayswater Assets include working interests in approximately 9,100 net acres primarily in the Wattenberg Field.
Convertible Preferred Securities
We previously issued to affiliates of Apollo $75.0 million in Series A Preferred Units to fund a portion of the purchase price for the Bayswater Acquisition. The Series A Preferred Units were entitled to receive a cash dividend of 10% per year, payable quarterly in arrears. In connection with the consummation of the IPO, we used $90.0
million of the net proceeds to redeem the Series A Preferred Units in full, which included a premium of $15.0 million.
In addition, we issued to, among others, investment funds affiliated with OZ Management LP and Yorktown, $185.3 million in Series B Preferred Units to fund a portion of the purchase price for the Bayswater Acquisition. The Series B Preferred Units were entitled to receive a cash dividend of 10% per year, payable quarterly in arrears, and we had the ability to pay up to 50% of the quarterly dividend in kind. The Series B Preferred Units were converted in connection with the closing of the IPO into shares of our Series A Preferred Stock that are entitled to receive a cash dividend of 5.875% per year, payable quarterly in arrears, and we have the ability to pay such quarterly dividends in kind at a dividend rate of 10% per year (decreased proportionately to the extent such quarterly dividends are paid in cash). Beginning on or after the later of (a) 90 days after the closing of the IPO and (b) the Lock-Up Period End Date, the Series A Preferred Stock will be convertible into shares of our common stock at the election of the Series A Preferred Holders at a conversion ratio per share of Series A Preferred Stock of 61.9195. Beginning on or after the Lock-Up Period End Date until the three year anniversary of the closing of the IPO, we may elect to convert the Series A Preferred Stock at a conversion ratio per share of Series A Preferred Stock of 61.9195, but only if the closing price of our common stock trades at or above a certain premium to our initial offering price, such premium to decrease with time. In certain situations, including a change of control, the Series A Preferred Stock may be redeemed for cash in an amount equal to the greater of (i) 135% of the liquidation preference of the Series A Preferred Stock and (ii) a 17.5% annualized internal rate of return on the liquidation preference of the Series A Preferred Stock. The Series A Preferred Stock matures on October 15, 2021, at which time they are mandatorily redeemable for cash at the liquidation preference. See “Description of Capital Stock—Preferred Stock—Series A Preferred Stock.”
We refer to the 2016 Notes Offering and the issuance of the Series A Preferred Units and Series B Preferred Units as the “Financing Transactions.”
Amendment to Revolving Credit Facility
On September 14, 2016, we entered into an amendment to our revolving credit facility that, among other things, increased the borrowing base to $450 million upon the consummation of the Bayswater Acquisition. On December 7, 2016, our borrowing base was increased to $475 million. See “Management’s Discussion and Analysis of Financial Condition and Results of Operations—Liquidity and Capital Resources—Revolving Credit Facility.”
Private Placement of Common Stock
On December 15, 2016, we issued 25,041,041 shares of common stock, at a price of $18.25 per share, in connection with the Private Placement. The Private Placement resulted in approximately $457.0 million of gross proceeds and approximately $441.8 million of net proceeds (after deducting placement agent commissions and our expenses).
Recent Acquisitions
We recently closed on two separate transactions from unrelated sellers to acquire approximately 16,800 net acres in the DJ Basin for aggregate cash consideration of approximately $177 million. The acquisitions include de minimis oil and gas production and approximately 425 net 1-mile equivalent drilling locations. Net proceeds from the Private Placement were used, in part, to replenish cash used to pay the cash consideration of the acquisitions.
Our Properties—Wattenberg Field
Our current operations are located in the Wattenberg Field where we target the oil and liquids-weighted Niobrara and Codell formations. As of September 30, 2016, our position in Wattenberg consisted of approximately 100,000 net acres. We either own or are shooting 3-D seismic surveys on our acreage prior to drilling, which helps to provide efficient and targeted horizontal drilling operations.
Our estimated proved reserves at December 31, 2015 were 158.6 MMBoe. As of September 30, 2016, we had a total of 1,034 gross producing wells, of which 342 were horizontal wells. The vertical wells we operate primarily
serve to hold leases until we can drill more efficient horizontal wells on acreage we lease. Therefore, production from vertical wells does not represent a material amount of our current production and is anticipated to decline as a percentage of total production in the future as we drill more horizontal wells. Our estimated average net daily production during the three months ended September 30, 2016 was approximately 37,600 BOE/d. Our working interest for all producing wells averages approximately 72% and our net revenue interest is approximately 59%.
We continue to expand our proved reserves in this area by drilling non-proved horizontal locations. As of December 31, 2015, we had an identified drilling inventory of approximately 489 gross (293 net) proved undeveloped horizontal drilling locations with varying lateral lengths on our acreage with average well costs of $3.7 million ($2.5 million normalized to 4,200 foot lateral length). During 2015 and 2014, we drilled 83 and 59 gross operated horizontal wells, respectively, and completed 82 and 50 gross operated horizontal wells, respectively.
In the Niobrara formation, in 2015, we drilled 26 1-mile (approximately 4,200 foot lateral) gross operated horizontal wells, 10 1.5-mile (approximately 6,800 foot lateral) gross operated horizontal wells, and 12 2-mile (approximately 9,400 foot lateral) gross operated horizontal wells. Further, in 2014, we drilled 21 1-mile (approximately 4,200 foot lateral) gross operated horizontal wells, seven 1.5-mile (approximately 6,800 foot lateral) gross operated horizontal wells, and 13 2-mile (approximately 9,400 foot lateral) gross operated horizontal wells. Since we began our horizontal Niobrara drilling program in 2014, through September 30, 2016, we have drilled approximately 189 1-mile equivalent wells and completed approximately 153 1-mile equivalent wells, of which 150 are on 40-acre spacing, 34 are at 80-acre spacing and 6 are at greater than 80-acre spacing. We believe the economies of scale demonstrated by our longer laterals warrant continued drilling of lateral lengths greater than 4,200 feet.
In the Codell formation, in 2015, we drilled 19 1-mile (approximately 4,200 foot lateral) gross operated horizontal wells, four 1.5-mile (approximately 6,800 foot lateral) gross operated horizontal wells, and 12 2-mile (approximately 9,400 foot lateral) gross operated horizontal wells. Further, in 2014, we drilled 14 1-mile (approximately 4,200 foot lateral) gross operated horizontal wells, three 1.5-mile (approximately 6,800 foot lateral) gross operated horizontal wells, and one 2-mile (approximately 9,400 foot lateral) gross operated horizontal wells. Since we began our horizontal Codell drilling program in 2014, through September 30, 2016, we have drilled approximately 101 gross 1-mile equivalent wells and completed 90 1-mile equivalent wells, of which 93 are on 80-acre spacing and 8 are at greater than 80-acre spacing. We believe the economies of scale demonstrated by our longer laterals warrant continued drilling of lateral lengths greater than 4,200 feet.
For the year ended December 31, 2015 and the nine months ended September 30, 2016, our aggregate drilling, completion and leasehold capital expenditures were approximately $398.4 million and $203.1 million, respectively, excluding acquisitions. For the year ended December 31, 2015, authorizations for expenditure in the Niobrara formation averaged approximately $2.9 million for a 4,200 foot lateral well, $3.9 million for a 6,800 foot lateral well, $4.8 million for a 9,400 foot lateral well and $6.4 million for a 12,000 foot lateral well, down from an average of $4.5 million for a 4,200 foot lateral well, $7.0 million for a 6,800 foot lateral well and $7.9 million for a 9,400 foot lateral well, respectively, for the year ended December 31, 2014. For the year ended December 31, 2015, well costs in the Codell formation averaged approximately $2.6 million for a 4,200 foot lateral well, $3.5 million for a 6,800 foot lateral well, $4.3 million for a 9,400 foot lateral well and $5.8 million for a 12,000 foot lateral well, down from an average of $4.5 million for a 4,200 foot lateral well, $7.0 million for a 6,800 foot lateral well and $7.9 million for a 9,400 foot lateral well, respectively, for the year ended December 31, 2014.
Wattenberg Field
Since the implementation of horizontal drilling technology, the DJ Basin has become recognized as a premier U.S. liquids resource play. The DJ Basin is a structural basin located in eastern Colorado, southeastern Wyoming, western Kansas, and the Nebraska Panhandle and covers an area of more than 42,000 square miles. The basin has a long history of crude oil and natural gas exploration and production, predominantly from an area described as the Wattenberg Field, which covers approximately 1,500 square miles, and is primarily centered around Weld County, Colorado. According to the EIA, the Wattenberg Field is the fourth largest producing oil field and ninth largest producing gas field in the U.S. by 2013 estimated production. While historically a natural gas-focused field, the Wattenberg is also known for its high liquids content, evidenced by the significant growth in crude oil production from the Niobrara and Codell shale formations.
The history of crude oil and natural gas production in the Wattenberg Field dates back to 1970 with early production coming from the J Sand. During the 1980s, tax credits provided incentives for tight gas development, leading operators to target the tighter Codell sand and Niobrara chalk. Increased well spacing regulations, along with new technology continued to boost activity in the area through the 1990s and 2000s. In 2010, operators began to shift to horizontal drilling in an effort to increase recovery and return. Downspacing and expanding development beyond the Niobrara benches and Codell sands continues to be a focus moving forward.
The Niobrara formation is centered around the Wattenberg Field with an average depth of approximately 6,800 feet in the Wattenberg Field. The formation consists of chalky benches created from skeletal debris of planktonic organisms deposited in a shallow marine environment. The Niobrara A, B and C benches serve as a source rock that generates oil and gas. The Codell formation, which is located just below the Niobrara benches, is typically 13 to 16.5 feet thick, adding to the 240 to 330 feet of Niobrara pay. Niobrara and Codell porosity is commonly 10% or less, primarily due to abundant pore-filling clay, calcite cements and iron oxide. The J Sand is found at depths of 7,200 to 8,500 feet and is approximately 20 feet thick.
Other Properties
We hold approximately 120,000 net acres in the DJ Basin outside of the Wattenberg, which we refer to as our “Northern Extension Area,” that we believe is prospective for many of the same formations as our properties in the Wattenberg Field. As of September 30, 2016, there were de minimis proved reserves associated with this acreage. Average daily production associated with these properties for the quarter ended September 30, 2016 was approximately 663 BOE/d. We have not identified any drilling locations at this time on our Northern Extension Area.
Drilling Locations
As of September 30, 2016, we have identified a total of 3,929 gross identified drilling locations as adjusted to one-mile equivalents. Our target horizontal location count implies lateral lengths of 4,200 feet per well. Approximately 23% of our gross identified drilling locations are attributable to proved undeveloped reserves. Our identified drilling locations have been identified based on our review of structure as well as production data from offsetting wells. We have internally generated this production data based on our evaluation of an extensive geological and engineering database. Information incorporated into this process includes both our own proprietary information as well as publicly available industry data. Specifically, open hole logging data, production statistics from operated and non-operated wells, and petrophysical data from cores taken from wellbores has provided the technical basis from which we identified the potential locations. These data have allowed us to determine areas for each reservoir that may produce commercial quantities of hydrocarbons and the viability of the potential locations.
Oil and Natural Gas Data
Proved Reserves
Evaluation and Review of Proved Reserves. Our historical proved reserve estimates as of June 30, 2016, December 31, 2015 and 2014 were prepared based on a report by Ryder Scott, our independent petroleum engineers. Within Ryder Scott, the technical person primarily responsible for preparing the estimates set forth in the Ryder Scott summary reserve reports incorporated herein is Richard Marshall. Mr. Marshall has been practicing consulting petroleum engineering at Ryder Scott since 1981. Mr. Marshall is a registered Professional Engineer in the State of Colorado and has over 30 years of practical experience in the estimation and evaluation of reserves. Mr. Marshall graduated from the University of Missouri in 1974 with a Bachelor of Science Degree in Geology and from the University of Missouri at Rolla in 1976 with a Master of Science Degree in Geological Engineering. As technical principal, Mr. Marshall meets or exceeds the education, training, and experience requirements set forth in the Standards Pertaining to the Estimating and Auditing of Oil and Gas Reserves Information promulgated by the Society of Petroleum Engineers and is proficient in applying industry standard practices to engineering evaluations as well as applying SEC and other industry reserves definitions and guidelines. Ryder Scott does not own an interest in any of our properties, nor is it employed by us on a contingent basis.
We maintain an internal staff of petroleum engineers and geoscience professionals who worked closely with our independent reserve engineers to ensure the integrity, accuracy and timeliness of the data used to calculate our
proved reserves relating to our assets in the DJ Basin. Our internal technical team members meet with our independent reserve engineers periodically during the period covered by the proved reserve report to discuss the assumptions and methods used in the proved reserve estimation process. We provide historical information to the independent reserve engineers for our properties, such as ownership interest, oil and natural gas production, well test data, commodity prices and operating and development costs.
The preparation of our proved reserve estimates are completed in accordance with our internal control procedures. These procedures, which are intended to ensure reliability of reserve estimations, include the following:
· review and verification of historical production data, which data is based on actual production as reported by us;
· preparation of reserve estimates; and
· verification of property ownership by our land department.
Estimation of Proved Reserves. Under SEC rules, proved reserves are those quantities of oil and natural gas, which, by analysis of geoscience and engineering data, can be estimated with reasonable certainty to be economically producible—from a given date forward, from known reservoirs and under existing economic conditions, operating methods and government regulations—prior to the time at which contracts providing the right to operate expire, unless evidence indicates that renewal is reasonably certain, regardless of whether deterministic or probabilistic methods are used for the estimation. If deterministic methods are used, the SEC has defined reasonable certainty for proved reserves as a “high degree of confidence that the quantities will be recovered.” All of our proved reserves as of June 30, 2016 and 2015 were estimated using a deterministic method. The estimation of reserves involves two distinct determinations. The first determination results in the estimation of the quantities of recoverable oil and natural gas and the second determination results in the estimation of the uncertainty associated with those estimated quantities in accordance with the definitions established under SEC rules. The process of estimating the quantities of recoverable oil and natural gas reserves relies on the use of certain generally accepted analytical procedures. These analytical procedures fall into four broad categories or methods: (1) production performance-based methods; (2) material balance-based methods; (3) volumetric-based methods; and (4) analogy. These methods may be used singularly or in combination by the reserve evaluator in the process of estimating the quantities of reserves. Reserves for proved developed producing wells were estimated using production performance methods for the vast majority of properties. Certain new producing properties with very little production history were forecast using a combination of production performance and analogy to similar production, both of which are considered to provide a relatively high degree of accuracy. Non-producing reserve estimates, for developed and undeveloped properties, were forecast using either volumetric or analogy methods, or a combination of both. These methods provide a relatively high degree of accuracy for predicting proved developed non-producing and proved undeveloped reserves for our properties, due to the mature nature of the properties targeted for development and an abundance of subsurface control data.
To estimate economically recoverable proved reserves and related future net cash flows, Ryder Scott considered many factors and assumptions, including the use of reservoir parameters derived from geological and engineering data which cannot be measured directly, economic criteria based on current costs and the SEC pricing requirements and forecasts of future production rates.
Under SEC rules, reasonable certainty can be established using techniques that have been proven effective by actual production from projects in the same reservoir or an analogous reservoir or by other evidence using reliable technology that establishes reasonable certainty. Reliable technology is a grouping of one or more technologies (including computational methods) that has been field tested and has been demonstrated to provide reasonably certain results with consistency and repeatability in the formation being evaluated or in an analogous formation. To establish reasonable certainty with respect to our estimated proved reserves, the technologies and economic data used in the estimation of our proved reserves have been demonstrated to yield results with consistency and repeatability, and include production and well test data, downhole completion information, geologic data, electrical logs, radioactivity logs, core analyses, historical well cost and operating expense data.
Summary of Oil, Natural Gas and NGL Reserves. The following table presents our estimated net proved oil, natural gas and NGL reserves as of June 30, 2016 and December 31, 2015.
|
|
|
As of June 30, |
|
As of December |
|
|
Proved Developed Producing Reserves: |
|
|
|
|
|
|
Oil (MBbls) |
|
17,203 |
|
10,769 |
|
|
Natural gas (MMcf) |
|
85,882 |
|
41,773 |
|
|
NGL (MBbls) |
|
11,141 |
|
5,402 |
|
|
Combined (MBoe)(1) |
|
42,657 |
|
23,133 |
|
|
Proved Developed Not Producing Reserves: |
|
|
|
|
|
|
Oil (MBbls) |
|
188 |
|
3,480 |
|
|
Natural gas (MMcf) |
|
1,529 |
|
11,238 |
|
|
NGL (MBbls) |
|
199 |
|
1,656 |
|
|
Combined (MBoe)(1) |
|
642 |
|
7,009 |
|
|
Proved Undeveloped Reserves: |
|
|
|
|
|
|
Oil (MBbls) |
|
61,720 |
|
57,252 |
|
|
Natural gas (MMcf) |
|
278,291 |
|
239,572 |
|
|
NGL (MBbls) |
|
35,887 |
|
31,325 |
|
|
Combined (MBoe)(1) |
|
143,989 |
|
128,505 |
|
|
Proved Reserves: |
|
|
|
|
|
|
Oil (MBbls) |
|
79,111 |
|
71,500 |
|
|
Natural gas (MMcf) |
|
365,702 |
|
292,584 |
|
|
NGL (MBbls) |
|
47,227 |
|
38,383 |
|
|
Combined (MBoe)(1) |
|
187,288 |
|
158,647 |
|
(1) One BOE is equal to six Mcf of natural gas or one Bbl of oil or NGL based on an approximate energy equivalency. This is an energy content correlation and does not reflect a value or price relationship between the commodities.
Reserve engineering is and must be recognized as a subjective process of estimating volumes of economically recoverable oil and natural gas that cannot be measured in an exact manner. The accuracy of any reserve estimate is a function of the quality of available data and of engineering and geological interpretation. As a result, the estimates of different engineers often vary. In addition, the results of drilling, testing and production may justify revisions of such estimates. Accordingly, reserve estimates often differ from the quantities of oil and natural gas that are ultimately recovered. Estimates of economically recoverable oil and natural gas and of future net revenues are based on a number of variables and assumptions, all of which may vary from actual results, including geologic interpretation, prices and future production rates and costs. Please read “Risk Factors” appearing elsewhere in this prospectus.
Additional information regarding our proved reserves can be found in the notes to our financial statements included elsewhere in this prospectus.
Proved Undeveloped Reserves (PUDs)
As of December 31, 2015, our proved undeveloped reserves were composed of 57,252 MBbls of oil, 239,572 MMcf of natural gas and 31,325 MBbls of NGL, for a total of 128,505 MBoe. PUDs will be converted from undeveloped to developed as the applicable wells begin production.
The following table summarizes our changes in PUDs during the years ended December 31, 2015 and 2014 (in MBoe):
|
Balance, December 31, 2013 |
|
0 |
|
|
Purchases of reserves |
|
31,172 |
|
|
Extensions and discoveries |
|
42,780 |
|
|
Revisions of previous estimates |
|
2,433 |
|
|
Transfers to proved developed |
|
(3,878 |
) |
|
Balance, December 31, 2014 |
|
72,507 |
|
|
Purchases of reserves |
|
25,476 |
|
|
Extensions and discoveries |
|
37,470 |
|
|
Revisions of previous estimates |
|
275 |
|
|
Transfers to proved developed |
|
(7,223 |
) |
|
Balance, December 31, 2015 |
|
128,505 |
|
Extensions and discoveries of 37,470 MBoe and 42,780 MBoe during the years ended December 31, 2015 and 2014, respectively, resulted primarily from new proved undeveloped locations added as a result of the drilling and completion of new wells. Revisions of previous estimates of 275 MBoe and 2,433 MBoe during the years ended December 31, 2015 and 2014, respectively, resulted primarily from the revisions resulting from price changes and revisions resulting from production and performance.
Estimated future development costs relating to the development of PUDs at December 31, 2015 were projected to be approximately $120.2 million in the year ending December 31, 2016, $207.2 million in 2017, $306.9 million in 2018, $322.7 million in 2019 and $160.4 million in 2020. Costs incurred relating to the development of PUDs were $35.1 million during the year ended December 31, 2014 and $94.6 million during the year ended December 31, 2015. As we continue to develop our properties and have more well production and completion data, we believe we will continue to realize cost savings and experience lower relative drilling and completion costs as we convert PUDs into proved developed reserves in upcoming years. All of our PUD drilling locations are scheduled to be drilled within five years of their initial booking. We converted 7,223 MBoe and 3,878 MBoe to proved developed producing reserves in the years ended December 31, 2015 and 2014, respectively.
Oil, Natural Gas and NGL Production Prices and Production Costs
Production and Price History
The following table sets forth information regarding net production of oil, natural gas and NGL, and certain price and cost information for the periods indicated:
|
|
|
Nine Months Ended September 30, |
|
Year Ended December 31, |
| ||||||||
|
|
|
2016 |
|
2015 |
|
2015 |
|
2014 |
| ||||
|
|
|
(unaudited) |
| ||||||||||
|
|
|
(in thousands) |
| ||||||||||
|
Summary Historical Operating Data: |
|
|
|
|
|
|
|
|
| ||||
|
Production and Operating Data: |
|
|
|
|
|
|
|
|
| ||||
|
Net production volumes: |
|
|
|
|
|
|
|
|
| ||||
|
Oil (MBbls) |
|
3,808.4 |
|
2,792.3 |
|
3,945.6 |
|
1,022.2 |
| ||||
|
Natural gas (MMcf) |
|
12,851.3 |
|
7,224.9 |
|
10,823.0 |
|
2,664.1 |
| ||||
|
NGL (MBbls) |
|
1,478.9 |
|
857.1 |
|
1,334.6 |
|
325.3 |
| ||||
|
Total (MBoe)(1) |
|
7,429.2 |
|
4,853.6 |
|
7,084.0 |
|
1,791.5 |
| ||||
|
Average net production (BOE/d)(1) |
|
27,114 |
|
17,779 |
|
19,408 |
|
4,908 |
| ||||
|
Average sales prices(2): |
|
|
|
|
|
|
|
|
| ||||
|
Oil sales (per Bbl) |
|
$ |
35.68 |
|
$ |
41.10 |
|
$ |
39.80 |
|
$ |
73.82 |
|
|
Oil sales with derivative settlements (per Bbl) |
|
$ |
41.93 |
|
$ |
55.09 |
|
$ |
53.29 |
|
$ |
77.66 |
|
|
Natural gas (per Mcf) |
|
$ |
2.16 |
|
$ |
2.45 |
|
$ |
2.40 |
|
$ |
3.47 |
|
|
Natural gas sales with derivative settlements (per Mcf) |
|
$ |
2.84 |
|
$ |
2.77 |
|
$ |
2.82 |
|
$ |
3.49 |
|
|
NGL (per Bbl) |
|
$ |
13.37 |
|
$ |
10.68 |
|
$ |
11.02 |
|
$ |
25.00 |
|
|
Average price per BOE |
|
$ |
24.69 |
|
$ |
29.18 |
|
$ |
27.92 |
|
$ |
51.82 |
|
|
Average price per BOE with derivative settlements |
|
$ |
29.06 |
|
$ |
37.71 |
|
$ |
36.06 |
|
$ |
54.04 |
|
|
Average unit costs per BOE: |
|
|
|
|
|
|
|
|
| ||||
|
Lease operating expenses |
|
$ |
5.49 |
|
$ |
3.87 |
|
$ |
4.32 |
|
$ |
2.83 |
|
|
Production taxes |
|
$ |
2.28 |
|
$ |
2.64 |
|
$ |
2.40 |
|
$ |
5.44 |
|
|
Exploration expenses |
|
$ |
1.98 |
|
$ |
1.39 |
|
$ |
2.63 |
|
$ |
0.07 |
|
|
Depreciation, depletion, amortization and accretion |
|
$ |
19.02 |
|
$ |
20.64 |
|
$ |
20.69 |
|
$ |
19.00 |
|
|
Impairment of long lived assets |
|
$ |
3.14 |
|
$ |
1.96 |
|
$ |
2.23 |
|
$ |
— |
|
|
Other operating expenses |
|
$ |
0.12 |
|
$ |
0.48 |
|
$ |
0.33 |
|
$ |
— |
|
|
Acquisition transaction expenses |
|
$ |
0.05 |
|
$ |
1.24 |
|
$ |
0.85 |
|
$ |
— |
|
|
General and administrative expenses |
|
$ |
4.74 |
|
$ |
5.24 |
|
$ |
5.24 |
|
$ |
10.94 |
|
|
Unit-based compensation |
|
$ |
2.01 |
|
$ |
0.94 |
|
$ |
0.84 |
|
$ |
2.49 |
|
|
Total operating expenses per BOE |
|
$ |
36.83 |
|
$ |
37.47 |
|
$ |
38.69 |
|
$ |
38.28 |
|
(1) One BOE is equal to six Mcf of natural gas or one Bbl of oil or NGL based on an approximate energy equivalency. This is an energy content correlation and does not reflect a value or price relationship between the commodities.
(2) Average prices shown in the table reflect prices both before and after the effects of our realized commodity hedging transactions. Our calculation of such effects includes both realized gains or losses on cash settlements for commodity derivative transactions and premiums paid or received on options, if any, that settled during the period.
Productive Wells
As of September 30, 2016, we owned an average 72% working interest in 1,034 gross (747 net) productive wells. As of December 31, 2015, we owned an average 64% working interest in 595 gross (384 net) productive wells. As of December 31, 2014, we owned an average 65% working interest in 262 gross (171 net) productive wells. Of our 171 net horizontal wells producing as of September 13, 2016, we owned an average 66% working interest prior to drilling and then increased our average working interest to 74% following drilling as a result of force pooling interests in 124 of the 171 net horizontal wells. Productive wells consist of producing wells and wells capable of production, including oil wells awaiting connection to production facilities. Gross wells are the total number of producing wells in which we have an interest, and net wells are the sum of our fractional working interests owned in gross wells.
Developed and Undeveloped Acreage
The following tables set forth information as of September 30, 2016 relating to our leasehold acreage without giving effect to the Bayswater Acquisition. Developed acreage is acres spaced or assigned to productive wells and does not include undrilled acreage held by production under the terms of the lease. Undeveloped acreage is acres on which wells have not been drilled or completed to a point that would permit the production of commercial quantities of oil or natural gas, regardless of whether such acreage contains proved reserves. A gross acre is an acre in which a working interest is owned. The number of gross acres is the total number of acres in which a working interest is owned. A net acre is deemed to exist when the sum of the fractional ownership working interests in gross acres equals one. The number of net acres is the sum of the fractional working interests owned in gross acres expressed as whole numbers and fractions thereof.
The following table sets forth our gross and net acres of developed and undeveloped oil and gas leases as of September 30, 2016, without giving effect to the Bayswater Acquisition:
|
|
|
Developed Acreage(1) |
|
Undeveloped Acreage(2) |
|
Total Acreage |
| ||||||
|
Area |
|
Gross(3) |
|
Net(4) |
|
Gross(3) |
|
Net(4) |
|
Gross(3) |
|
Net(4) |
|
|
DJ Basin |
|
149,771 |
|
99,699 |
|
189,332 |
|
113,442 |
|
339,103 |
|
213,141 |
|
(1) Developed acreage is acres spaced or assigned to productive wells and does not include undrilled acreage held by production under the terms of the lease.
(2) Undeveloped acreage are acres on which wells have not been drilled or completed to a point that would permit the production of commercial quantities of oil or natural gas, regardless of whether such acreage contains proved reserves.
(3) A gross acre is an acre in which a working interest is owned. The number of gross acres is the total number of acres in which a working interest is owned.
(4) A net acre is deemed to exist when the sum of the fractional ownership working interests in gross acres equals one. The number of net acres is the sum of the fractional working interests owned in gross acres expressed as whole numbers and fractions thereof.
Many of the leases comprising the undeveloped acreage set forth in the table above will expire at the end of their respective primary terms unless production from the leasehold acreage has been established prior to such date, in which event the lease will remain in effect until the cessation of production. We intend to extend all of our material leases to the extent possible and expect to incur $35.6 million to extend every material lease that is set to expire in the next three years, without taking into account the drilling of PUDs and holding leases by production and therefore we do not expect a material reduction in our proved undeveloped reserves as a result of lease expirations. The following table sets forth the undeveloped acreage, as of September 30, 2016, that will expire in the years indicated below unless production is established within the spacing units covering the acreage or the lease is renewed or extended under continuous drilling provisions prior to the primary term expiration dates.
|
|
|
2016 |
|
2017 |
|
2018 |
|
2019+ |
| ||||||||
|
Area |
|
Gross |
|
Net |
|
Gross |
|
Net |
|
Gross |
|
Net |
|
Gross |
|
Net |
|
|
DJ Basin |
|
8,678 |
|
3,665 |
|
16,686 |
|
8,819 |
|
6,714 |
|
3,646 |
|
13,196 |
|
6,715 |
|
Drilling Results
The following table sets forth information with respect to the number of wells completed by us during the periods indicated. The information should not be considered indicative of future performance, nor should it be assumed that there is necessarily any correlation between the number of productive wells drilled, quantities of reserves found or economic value. Productive wells are those that produce commercial quantities of hydrocarbons, whether or not they produce a reasonable rate of return.
|
|
|
Year Ended December 31, |
| ||||||
|
|
|
2015 |
|
2014 |
| ||||
|
|
|
Gross |
|
Net |
|
Gross |
|
Net |
|
|
Development Wells(2): |
|
|
|
|
|
|
|
|
|
|
Productive(1) |
|
79 |
|
60.9 |
|
50 |
|
33.4 |
|
|
Dry |
|
— |
|
— |
|
— |
|
— |
|
|
Exploratory Wells(2): |
|
|
|
|
|
|
|
|
|
|
Productive(1) |
|
4 |
|
3.5 |
|
— |
|
— |
|
|
Dry |
|
— |
|
— |
|
— |
|
— |
|
|
Total(2): |
|
|
|
|
|
|
|
|
|
|
Productive(1) |
|
83 |
|
64.4 |
|
50 |
|
33.4 |
|
|
Dry |
|
— |
|
— |
|
— |
|
— |
|
(1) Although a well may be classified as productive upon completion, future changes in oil, natural gas and NGL prices, operating costs and production may result in the well becoming uneconomical, particularly exploratory wells where there is no production history.
(2) Includes only wells completed by us.
As of December 31, 2015 we had 59 gross (45 net) drilled, non-producing wells of varying lateral lengths waiting on gas connect or commencement of completion activities.
Operations
General
We operated 96% of our horizontal production for the nine months ended September 30, 2016. As operator, we design and manage the development of a well and supervise operation and maintenance activities on a day-to-day basis. Independent contractors engaged by us provide all the equipment and personnel associated with these activities. We employ petroleum engineers, geologists and land professionals who work to improve production rates, increase reserves and lower the cost of operating our oil and natural gas properties.
Marketing and Customers
We market the majority of the production from properties we operate for both our account and the account of the other working interest owners in these properties. We sell our production to purchasers at market prices.
During the year ended December 31, 2015, approximately 88% of our production was sold to four customers. However, we do not believe that the loss of a single purchaser, including these four, would materially affect our business because there are numerous other potential purchasers in the area in which we sell our production. For the year ended December 31, 2015 purchases by the following companies exceeded 10% of our total oil and gas revenues.
|
|
|
For the Year |
|
|
NGL Crude Logistics, LLC |
|
30 |
% |
|
Devlar Energy Marketing, LLC |
|
24 |
% |
|
DCP Midstream, LP |
|
17 |
% |
|
United Energy Trading LLC |
|
17 |
% |
Transportation
During the initial development of our fields, we consider all gathering and delivery infrastructure in the areas of our production. Our oil is collected from the wellhead to our tank batteries and then transported by the purchaser by truck or pipeline to a tank farm, another pipeline or a refinery. Our natural gas is transported from the wellhead to the purchaser’s meter and pipeline interconnection point.
We are subject to long-term delivery commitments for the transportation of our production. We are currently party to a firm transportation agreement that commences in November 2016 and has a ten-year term, which obligates us to meet delivery commitments of 40,000 Bbl/d in year one, 52,000 Bbl/d in year two, and 58,000 Bbl/d in years three through ten. Upon closing the Bayswater Acquisition, we became subject to two additional long-term crude oil delivery commitments, one for a term of seven years and one for a term of five years. We have total delivery commitment obligations of 5,000 Bpd in year one and 3,800 Bpd in year two through seven.
Competition
The oil and natural gas industry is intensely competitive, and we compete with other companies that have greater resources. Many of these companies not only explore for and produce oil and natural gas, but also carry on midstream and refining operations and market petroleum and other products on a regional, national or worldwide basis. These companies may be able to pay more for productive oil and natural gas properties and exploratory prospects or to define, evaluate, bid for and purchase a greater number of properties and prospects than our financial or human resources permit. In addition, these companies may have a greater ability to continue exploration activities during periods of low oil, natural gas and NGL market prices. Our larger or more integrated competitors may be able to absorb the burden of existing, and any changes to, federal, state and local laws and regulations more easily than we can, which would adversely affect our competitive position. Our ability to acquire additional properties and to discover reserves in the future will be dependent upon our ability to evaluate and select suitable properties and to consummate transactions in a highly competitive environment. In addition, because we have fewer financial and human resources than many companies in our industry, we may be at a disadvantage in bidding for exploratory prospects and producing oil and natural gas properties.
There is also competition between oil and natural gas producers and other industries producing energy and fuel. Furthermore, competitive conditions may be substantially affected by various forms of energy legislation and/or regulation considered from time to time by the governments of the United States and the jurisdictions in which we operate. It is not possible to predict the nature of any such legislation or regulation which may ultimately be adopted or its effects upon our future operations. Such laws and regulations may substantially increase the costs of exploring for, developing or producing oil and natural gas and may prevent or delay the commencement or continuation of a given operation. Our larger competitors may be able to absorb the burden of existing, and any changes to, federal, state and local laws and regulations more easily than we can, which would adversely affect our competitive position.
Title to Properties
As is customary in the oil and natural gas industry, we initially conduct only a cursory review of the title to our properties in connection with acquisition of leasehold acreage. At such time as we determine to conduct drilling operations on those properties, we conduct a thorough title examination and perform curative work with respect to significant defects prior to commencement of drilling operations. To the extent title opinions or other investigations reflect title defects on those properties, we are typically responsible for curing any title defects at our expense. We generally will not commence drilling operations on a property until we have cured any material title defects on such property. We have obtained title opinions on substantially all of our producing properties and believe that we have satisfactory title to our producing properties in accordance with standards generally accepted in the oil and natural gas industry.
Prior to completing an acquisition of producing oil and natural gas leases, we perform title reviews on the most significant leases and, depending on the materiality of properties, we may obtain a title opinion, obtain an updated title review or opinion or review previously obtained title opinions. Our oil and natural gas properties are subject to customary royalty and other interests, liens for current taxes and other burdens which we believe do not materially interfere with the use of or affect our carrying value of the properties.
We believe that we have satisfactory title to all of our material assets. Although title to these properties is subject to encumbrances in some cases, such as customary interests generally retained in connection with the acquisition of real property, customary royalty interests and contract terms and restrictions, liens under operating agreements, liens related to environmental liabilities associated with historical operations, liens for current taxes and other burdens, easements, restrictions and minor encumbrances customary in the oil and natural gas industry, we believe that none of these liens, restrictions, easements, burdens and encumbrances will materially detract from the value of these properties or from our interest in these properties or materially interfere with our use of these properties in the operation of our business. In addition, we believe that we have obtained sufficient rights-of-way grants and permits from public authorities and private parties for us to operate our business in all material respects as described in this prospectus.
Seasonality of Business
Weather conditions affect the demand for, and prices of, oil, natural gas and NGL. Demand for oil, natural gas and NGL is typically higher in the fourth and first quarters resulting in higher prices. Due to these seasonal fluctuations, results of operations for individual quarterly periods may not be indicative of the results that may be realized on an annual basis.
Oil and Natural Gas Leases
The typical oil and natural gas lease agreement covering our properties provides for the payment of royalties to the mineral owner for all oil and natural gas produced from any wells drilled on the leased premises. The lessor royalties and other leasehold burdens on our properties are generally 80%. Our working interest for all producing wells averages approximately 72% and our net revenue interest is approximately 59%.
Regulation of the Oil and Gas Industry
Our operations are substantially affected by federal, state and local laws and regulations. Failure to comply with applicable laws and regulations can result in substantial penalties. The regulatory burden on the industry increases the cost of doing business and affects profitability. Historically, our compliance costs have not had a material adverse effect on our results of operations; however, we are unable to predict the future costs or impact of compliance. Additional proposals and proceedings that affect the oil and natural gas industry are regularly considered by Congress, the states, the FERC and the courts. We cannot predict when or whether any such proposals may become effective. We do not believe that we would be affected by any such action materially differently than similarly situated competitors.
Regulation Affecting Production
The production of oil and natural gas is subject to United States federal and state laws and regulations, and orders of regulatory bodies under those laws and regulations, governing a wide variety of matters. All of the jurisdictions in which we own or operate producing oil and natural gas properties have statutory provisions regulating the exploration for and production of oil and natural gas, including provisions related to permits for the drilling of wells, bonding requirements to drill or operate wells, the location of wells, the method of drilling and casing wells, the surface use and restoration of properties upon which wells are drilled, sourcing and disposal of water used in the drilling and completion process, and the abandonment of wells. Our operations are also subject to various conservation laws and regulations. These include the regulation of the size of drilling and spacing units or proration units, the number of wells which may be drilled in an area, and the unitization or pooling of oil or natural gas wells, as well as regulations that generally prohibit the venting or flaring of natural gas, and impose certain requirements regarding the ratability or fair apportionment of production from fields and individual wells. These laws and regulations may limit the amount of oil and gas we can drill. Moreover, each state generally imposes a production or severance tax with respect to the production and sale of oil, NGL and gas within its jurisdiction. States do not regulate wellhead prices or engage in other similar direct regulation, but there can be no assurance that they will not do so in the future. The effect of such future regulations may be to limit the amounts of oil and gas that may be produced from our wells, negatively affect the economics of production from these wells or limit the number of locations we can drill.
The failure to comply with the rules and regulations of oil and natural gas production and related operations can result in substantial penalties. Our competitors in the oil and natural gas industry are subject to the same regulatory requirements and restrictions that affect our operations.
Regulation Affecting Sales and Transportation of Commodities
Sales prices of gas, oil, condensate and NGL are not currently regulated and are made at market prices. Although prices of these energy commodities are currently unregulated, the United States Congress historically has been active in their regulation. We cannot predict whether new legislation to regulate oil and gas, or the prices charged for these commodities might be proposed, what proposals, if any, might actually be enacted by the United States Congress or the various state legislatures and what effect, if any, the proposals might have on our operations. Sales of oil and natural gas may be subject to certain state and federal reporting requirements.
The price and terms of service of transportation of the commodities, including access to pipeline transportation capacity, are subject to extensive federal and state regulation. Such regulation may affect the marketing of oil and natural gas produced by the partnership, as well as the revenues received for sales of such production. Gathering systems may be subject to state ratable take and common purchaser statutes. Ratable take statutes generally require gatherers to take, without undue discrimination, oil and natural gas production that may be tendered to the gatherer for handling. Similarly, common purchaser statutes generally require gatherers to purchase, or accept for gathering, without undue discrimination as to source of supply or producer. These statutes are designed to prohibit discrimination in favor of one producer over another producer or one source of supply over another source of supply. These statutes may affect whether and to what extent gathering capacity is available for oil and natural gas production, if any, of the drilling program and the cost of such capacity. Further state laws and regulations govern rates and terms of access to intrastate pipeline systems, which may similarly affect market access and cost.
The FERC regulates interstate natural gas pipeline transportation rates and service conditions. The FERC is continually proposing and implementing new rules and regulations affecting interstate transportation. The stated purpose of many of these regulatory changes is to ensure terms and conditions of interstate transportation service are not unduly discriminatory or unduly preferential, to promote competition among the various sectors of the natural gas industry and to promote market transparency. We do not believe that our drilling program will be affected by any such FERC action in a manner materially differently than other similarly situated natural gas producers.
In addition to the regulation of natural gas pipeline transportation, FERC has additional, jurisdiction over the purchase or sale of gas or the purchase or sale of transportation services subject to FERC’s jurisdiction pursuant to the EPAct 2005. Under the EPAct 2005, it is unlawful for “any entity,” including producers such as us, that are otherwise not subject to FERC’s jurisdiction under the NGA to use any deceptive or manipulative device or contrivance in connection with the purchase or sale of gas or the purchase or sale of transportation services subject to regulation by FERC, in contravention of rules prescribed by FERC. FERC’s rules implementing this provision make it unlawful, in connection with the purchase or sale of gas subject to the jurisdiction of FERC, or the purchase or sale of transportation services subject to the jurisdiction of FERC, for any entity, directly or indirectly, to use or employ any device, scheme or artifice to defraud; to make any untrue statement of material fact or omit to make any such statement necessary to make the statements made not misleading; or to engage in any act or practice that operates as a fraud or deceit upon any person. EPAct 2005 also gives FERC authority to impose civil penalties for violations of the NGA and the Natural Gas Policy Act of 1978 up to $1.0 million/d per violation. The anti-manipulation rule applies to activities of otherwise non-jurisdictional entities to the extent the activities are conducted “in connection with” gas sales, purchases or transportation subject to FERC jurisdiction, which includes the annual reporting requirements under FERC Order No. 704 (defined below).
In December 2007, FERC issued a final rule on the annual natural gas transaction reporting requirements, as amended by subsequent orders on rehearing (“Order No. 704”). Under Order No. 704, any market participant, including a producer that engages in certain wholesale sales or purchases of gas that equal or exceed 2.2 million MMBtus of physical natural gas in the previous calendar year, must annually report such sales and purchases to FERC on Form No. 552 on May 1 of each year. Form No. 552 contains aggregate volumes of natural gas purchased or sold at wholesale in the prior calendar year to the extent such transactions utilize, contribute to the formation of price indices. Not all types of natural gas sales are required to be reported on Form No. 552. It is the responsibility of the reporting entity to determine which individual transactions should be reported based on the guidance of Order
No. 704. Order No. 704 is intended to increase the transparency of the wholesale gas markets and to assist FERC in monitoring those markets and in detecting market manipulation.
The FERC also regulates rates and terms and conditions of service on interstate transportation of liquids, including oil and NGL, under the Interstate Commerce Act, as it existed on October 1, 1977 (“ICA”). Prices received from the sale of liquids may be affected by the cost of transporting those products to market. The ICA requires that certain interstate liquids pipelines maintain a tariff on file with FERC. The tariff sets forth the established rates as well as the rules and regulations governing the service. The ICA requires, among other things, that rates and terms and conditions of service on interstate common carrier pipelines be “just and reasonable.” Such pipelines must also provide jurisdictional service in a manner that is not unduly discriminatory or unduly preferential. Shippers have the power to challenge new and existing rates and terms and conditions of service before FERC.
The rates charged by many interstate liquids pipelines are currently adjusted pursuant to an annual indexing methodology established and regulated by FERC, under which pipelines increase or decrease their rates in accordance with an index adjustment specified by FERC. For the five-year period beginning July 1, 2011, FERC established an annual index adjustment equal to the change in the producer price index for finished goods plus 2.65%. This adjustment is subject to review every five years. Under FERC’s regulations, a liquids pipeline can request a rate increase that exceeds the rate obtained through application of the indexing methodology by obtaining market-based rate authority (demonstrating the pipeline lacks market power), establishing rates by settlement with all existing shippers, or through a cost-of-service approach (if the pipeline establishes that a substantial divergence exists between the actual costs experienced by the pipeline and the rates resulting from application of the indexing methodology). Increases in liquids transportation rates may result in lower revenue and cash flows for the partnership.
In addition, due to common carrier regulatory obligations of liquids pipelines, capacity must be prorated among shippers in an equitable manner in the event there are nominations in excess of capacity or for new shippers. Therefore, new shippers or increased volume by existing shippers may reduce the capacity available to us. Any prolonged interruption in the operation or curtailment of available capacity of the pipelines that we rely upon for liquids transportation could have a material adverse effect on our business, financial condition, results of operations and cash flows. However, we believe that access to liquids pipeline transportation services generally will be available to us to the same extent as to our similarly situated competitors.
Rates for intrastate pipeline transportation of liquids are subject to regulation by state regulatory commissions. The basis for intrastate liquids pipeline regulation, and the degree of regulatory oversight and scrutiny given to intrastate liquids pipeline rates, varies from state to state. We believe that the regulation of liquids pipeline transportation rates will not affect our operations in any way that is materially different from the effects on our similarly situated competitors.
In addition to FERC’s regulations, we are required to observe anti-market manipulation laws with regard to our physical sales of energy commodities. In November 2009, the FTC issued regulations pursuant to the Energy Independence and Security Act of 2007, intended to prohibit market manipulation in the petroleum industry. Violators of the regulations face civil penalties of up to $1 million per violation per day. In July 2010, Congress passed the Dodd-Frank Act, which incorporated an expansion of the authority of the CFTC to prohibit market manipulation in the markets regulated by the CFTC. This authority, with respect to oil swaps and futures contracts, is similar to the anti-manipulation authority granted to the FTC with respect to oil purchases and sales. In July 2011, the CFTC issued final rules to implement their new anti-manipulation authority. The rules subject violators to a civil penalty of up to the greater of $1 million or triple the monetary gain to the person for each violation.
Regulation of Environmental and Occupational Safety and Health Matters
Our operations are subject to stringent federal, state and local laws and regulations governing occupational safety and health aspects of our operations, the discharge of materials into the environment and environmental protection. Numerous governmental entities, including the EPA and analogous state agencies have the power to enforce compliance with these laws and regulations and the permits issued under them, often requiring difficult and costly actions. These laws and regulations may, among other things (i) require the acquisition of permits to conduct drilling and other regulated activities; (ii) restrict the types, quantities and concentration of various substances that
can be released into the environment or injected into formations in connection with oil and natural gas drilling and production activities; (iii) limit or prohibit drilling activities on certain lands lying within wilderness, wetlands and other protected areas; (iv) require remedial measures to mitigate pollution from former and ongoing operations, such as requirements to close pits and plug abandoned wells; (v) apply specific health and safety criteria addressing worker protection; and (vi) impose substantial liabilities for pollution resulting from drilling and production operations. Any failure to comply with these laws and regulations may result in the assessment of administrative, civil and criminal penalties, the imposition of corrective or remedial obligations, the occurrence of delays or restrictions in permitting or performance of projects, and the issuance of orders enjoining performance of some or all of our operations.
These laws and regulations may also restrict the rate of oil and natural gas production below the rate that would otherwise be possible. The regulatory burden on the oil and natural gas industry increases the cost of doing business in the industry and consequently affects profitability. The trend in environmental regulation is to place more restrictions and limitations on activities that may affect the environment, and thus any changes in environmental laws and regulations or re-interpretation of enforcement policies that result in more stringent and costly well drilling, construction, completion or water management activities, or waste handling, storage transport, disposal, or remediation requirements could have a material adverse effect on our financial position and results of operations. We may be unable to pass on such increased compliance costs to our customers. Moreover, accidental releases or spills may occur in the course of our operations, and we cannot assure you that we will not incur significant costs and liabilities as a result of such releases or spills, including any third-party claims for damage to property, natural resources or persons. Continued compliance with existing requirements is not expected to materially affect us. However, there is no assurance that we will be able to remain in compliance in the future with such existing or any new laws and regulations or that such future compliance will not have a material adverse effect on our business and operating results.
The following is a summary of the more significant existing and proposed environmental and occupational safety and health laws, as amended from time to time, to which our business operations are or may be subject and for which compliance may have a material adverse impact on our capital expenditures, results of operations or financial position.
Hazardous Substances and Wastes
The Resource Conservation and Recovery Act (“RCRA”), and comparable state statutes, regulate the generation, transportation, treatment, storage, disposal and cleanup of hazardous and non-hazardous wastes. Pursuant to rules issued by the EPA, the individual states administer some or all of the provisions of RCRA, sometimes in conjunction with their own, more stringent requirements. Drilling fluids, produced waters, and most of the other wastes associated with the exploration, development, and production of oil or natural gas, if properly handled, are currently exempt from regulation as hazardous waste under RCRA and, instead, are regulated under RCRA’s less stringent non-hazardous waste provisions, state laws or other federal laws. However, it is possible that certain oil and natural gas drilling and production wastes now classified as non-hazardous could be classified as hazardous wastes in the future. For example, in May 2016, several non-governmental environmental groups filed suit against the EPA in the U.S. District Court for the District of Columbia for failing to timely assess its RCRA Subtitle D criteria regulations for oil and natural gas wastes, asserting that the agency is required to review its Subtitle D regulations every three years but has not conducted an assessment on those oil and natural gas waste regulations since July 1988. Any such change could result in an increase in our as well as the oil and natural gas exploration and production industry’s costs to manage and dispose of wastes, which could have a material adverse effect on our results of operations and financial position. In the course of our operations, we generate some amounts of ordinary industrial wastes, such as paint wastes, waste solvents and waste oils that may be regulated as hazardous wastes.
The Comprehensive Environmental Response, Compensation and Liability Act (“CERCLA”), also known as the Superfund law, and comparable state laws impose joint and several liability, without regard to fault or legality of conduct, on classes of persons who are considered to be responsible for the release of a hazardous substance into the environment. These persons include the current and former owners and operators of the site where the release occurred and anyone who disposed or arranged for the disposal of a hazardous substance released at the site. Under CERCLA, such persons may be subject to joint and several liability for the costs of cleaning up the hazardous substances that have been released into the environment, for damages to natural resources and for the costs of certain
health studies. CERCLA also authorizes the EPA and, in some instances, third parties to act in response to threats to the public health or the environment and to seek to recover from the responsible classes of persons the costs they incur. In addition, it is not uncommon for neighboring landowners and other third-parties to file claims for personal injury and property damage allegedly caused by the hazardous substances released into the environment. We generate materials in the course of our operations that may be regulated as hazardous substances.
We currently own, lease, or operate numerous properties that have been used for oil and natural gas exploration, production and processing for many years. Although we believe that we have utilized operating and waste disposal practices that were standard in the industry at the time, hazardous substances, wastes, or petroleum hydrocarbons may have been released on, under or from the properties owned or leased by us, or on, under or from other locations, including off-site locations, where such substances have been taken for treatment or disposal. In addition, some of our properties have been operated by third parties or by previous owners or operators whose treatment and disposal of hazardous substances, wastes, or petroleum hydrocarbons was not under our control. These properties and the substances disposed or released on, under or from them may be subject to CERCLA, RCRA and analogous state laws. Under such laws, we could be required to undertake response or corrective measures, which could include removal of previously disposed substances and wastes, cleanup of contaminated property or performance of remedial plugging or pit closure operations to prevent future contamination, the costs of which could be substantial.
Water Discharges
The Federal Water Pollution Control Act, also known as the Clean Water Act (“CWA”), and analogous state laws, impose restrictions and strict controls with respect to the discharge of pollutants, including spills and leaks of oil and hazardous substances, into state waters and waters of the United States. The discharge of pollutants into regulated waters is prohibited, except in accordance with the terms of a permit issued by the EPA or an analogous state agency. Spill prevention, control and countermeasure plan requirements imposed under the CWA require appropriate containment berms and similar structures to help prevent the contamination of navigable waters in the event of a petroleum hydrocarbon tank spill, rupture or leak. In addition, the CWA and analogous state laws require individual permits or coverage under general permits for discharges of storm water runoff from certain types of facilities. The CWA also prohibits the discharge of dredge and fill material in regulated waters, including wetlands, unless authorized by permit. The EPA has issued final rules attempting to clarify the federal jurisdictional reach over waters of the United States but this rule has been stayed nationwide by the U.S. Sixth Circuit Court of Appeals as that appellate court and numerous district courts ponder lawsuits opposing implementation of the rule. In February 2016, a split three-judge panel of the Sixth Circuit Court of Appeals concluded that it has jurisdiction to review challenges to these final rules and the Sixth Circuit subsequently elected not to review this decision en banc but it is currently unknown whether other federal Circuit Courts or state courts currently considering this rulemaking will place their cases on hold, pending the Sixth Circuit’s hearing of the case. Briefing before the Sixth Circuit is ongoing. Federal and state regulatory agencies can impose administrative, civil and criminal penalties for non-compliance with discharge permits or other requirements of the CWA and analogous state laws and regulations.
The Oil Pollution Act of 1990 (“OPA”), amends the CWA and sets minimum standards for prevention, containment and cleanup of oil spills. The OPA applies to vessels, offshore facilities, and onshore facilities, including exploration and production facilities that may affect waters of the United States. Under OPA, responsible parties including owners and operators of onshore facilities may be held strictly liable for oil cleanup costs and natural resource damages as well as a variety of public and private damages that may result from oil spills. The OPA also requires owners or operators of certain onshore facilities to prepare Facility Response Plans for responding to a worst-case discharge of oil into waters of the United States.
Subsurface Injections
In the course of our operations, we produce water in addition to oil and natural gas. Water that is not recycled may be disposed of in disposal wells, which inject the produced water into non-producing subsurface formations. Underground injection operations are regulated pursuant to the Underground Injection Control (“UIC”) program established under the federal Safe Drinking Water Act (“SDWA”) and analogous state laws. The UIC program requires permits from the EPA or an analogous state agency for the construction and operation of disposal wells, establishes minimum standards for disposal well operations, and restricts the types and quantities of fluids that may be disposed. A change in UIC disposal well regulations or the inability to obtain permits for new disposal wells in the future may affect our ability to dispose of produced water and ultimately increase the cost of our operations. For
example, in response to recent seismic events near belowground disposal wells used for the injection of oil and natural gas-related wastewaters, federal and some state agencies have begun investigating whether such wells have caused increased seismic activity, and some states have shut down or imposed moratoria on the use of such disposal wells. In response to these concerns, regulators in some states have adopted, and other states are considering adopting, additional requirements related to seismic safety. Increased costs associated with the transportation and disposal of produced water, including the cost of complying with regulations concerning produced water disposal, may reduce our profitability; however, these costs are commonly incurred by all oil and natural gas producers and we do not believe that the costs associated with the disposal of produced water will have a material adverse effect on our operations.
Air Emissions
The CAA and comparable state laws restrict the emission of air pollutants from many sources, such as, for example, tank batteries and compressor stations, through air emissions standards, construction and operating permitting programs and the imposition of other compliance standards. These laws and regulations may require us to obtain pre-approval for the construction or modification of certain projects or facilities expected to produce or significantly increase air emissions, obtain and strictly comply with stringent air permit requirements or utilize specific equipment or technologies to control emissions of certain pollutants. The need to obtain permits has the potential to delay the development of oil and natural gas projects. Over the next several years, we may be charged royalties on natural gas losses or required to incur certain capital expenditures for air pollution control equipment or other air emissions related issues. For example, in January 2016, the BLM released a proposed rule aimed at reducing natural gas lost through natural gas venting, flaring and equipment leaks from both new and existing production activities on federal lands. Except where natural gas loss is “unavoidable,” as defined by the proposed rule, operators would be charged royalties on natural gas losses from onshore federal and Indian mineral leases administered by the BLM. In a second example, the EPA promulgated rules in 2012 under the CAA that subject oil and natural gas production, processing, transmission and storage operations to regulation under the NSPS and a separate set of requirements to address certain hazardous air pollutants frequently associated with oil and natural gas production and processing activities pursuant to the National Standards for Emission of Hazardous Air Pollutants (“NESHAPS”) program. With regards to production activities, these final rules require, among other things, the reduction of VOC emissions from certain fractured and refractured natural gas wells for which well completion operations are conducted and further requires that a subset of these selected wells use reduced emission completions, also known as “green completions.” These regulations also establish specific new requirements regarding emissions from production-related wet seal and reciprocating compressors, and from pneumatic controllers and storage vessels. In June 2016, the EPA published final rules establishing new air emission controls for methane emissions from certain new, modified or reconstructed equipment and processes in the oil and natural gas source category, including production, processing, transmission and storage activities. The EPA’s final rules include the NSPS to limit methane emissions from equipment and processes across the oil and natural gas source category. The rules also extend limitations on VOC emissions to sources that were unregulated under the previous NSPS at Subpart OOOO. Affected methane and VOC sources include hydraulically fractured (or re-fractured) oil and natural gas well completions, fugitive emissions from well sites and compressors, and pneumatic pumps. Moreover, the EPA is formally seeking additional information from oil and natural gas operators to eventually expand these final rules to include air emission controls for methane emissions applicable to existing equipment and processes. In a third example, in October 2015, the EPA issued a final rule under the Clean Air Act, lowering the NAAQS for ground-level ozone from the current standard of 75 ppb for the current 8-hour primary and secondary ozone standards to 70 ppb for both standards. States are expected to implement more stringent requirements as a result of this new final rule, which could apply to our operations.
Compliance with one or more of these and other air pollution control and permitting requirements has the potential to delay the development of oil and natural gas projects and increase our costs of development and production, which costs could be significant.
Regulation of GHG Emissions
In response to findings that emissions of carbon dioxide, methane and other GHGs present an endangerment to public health and the environment, the EPA has adopted regulations under existing provisions of the Clean Air Act that, among other things, establish PSD construction and Title V operating permit reviews for certain large stationary sources that are already potential major sources of certain principal, or criteria, pollutant emissions.
Facilities required to obtain PSD permits for their GHG emissions also will be required to meet “best available control technology” standards that typically will be established by state agencies. In addition, the EPA has adopted rules requiring the monitoring and annual reporting of GHG emissions from specified large, GHG emission sources in the United States, including certain onshore and offshore oil and natural gas production sources, which include certain of our operations.
While Congress has from time to time considered legislation to reduce emissions of GHGs, there has not been significant activity in the form of adopted legislation to reduce GHG emissions at the federal level in recent years. In the absence of such federal climate legislation, a number of state and regional efforts have emerged that are aimed at tracking and/or reducing GHG emissions by means of cap and trade programs that typically require major sources of GHG emissions to acquire and surrender emission allowances in return for emitting those GHGs. In addition, the United States is one of almost 200 nations that, in December 2015, agreed to the Paris Agreement, an international climate change agreement in Paris, France that calls for countries to set their own GHG emissions targets and be transparent about the measures each country will use to achieve its GHG emissions targets. A long-term goal of this Paris Agreement is to limit global warming to below two degrees Celsius by 2100 from temperatures in the pre-industrial era. Although it is not possible at this time to predict how new laws or regulations in the United States or any legal requirements imposed following the United States’ agreeing to the Paris Agreement that may be adopted or issued to address GHG emissions would impact our business, any such future laws, regulations or legal requirements imposing reporting or permitting obligations on, or limiting emissions of GHGs from, our equipment and operations could require us to incur costs to reduce emissions of GHGs associated with our operations as well as delays or restrictions in our ability to permit GHG emissions from new or modified sources. In addition, substantial limitations on GHG emissions could adversely affect demand for the oil and natural gas we produce. Finally, it should be noted that increasing concentrations of GHGs in the Earth’s atmosphere may produce climate changes that have significant physical effects, such as increased frequency and severity of storms, floods and other climatic events; if any such effects were to occur, they could have an adverse effect on our exploration and production operations.
Hydraulic Fracturing Activities
Hydraulic fracturing is an important and common practice that is used to stimulate production of natural gas and/or oil from dense subsurface rock formations. We regularly use hydraulic fracturing as part of our operations. Hydraulic fracturing involves the injection of water, sand or alternative proppant and chemicals under pressure into targeted geological formations to fracture the surrounding rock and stimulate production.
Hydraulic fracturing is typically regulated by state oil and natural gas commissions. However, several federal agencies have asserted regulatory authority over certain aspects of the process. For example, the EPA published final CAA regulations in 2012 and, more recently, in June 2016 governing performance standards, including standards for the capture of air emissions released during oil and natural gas hydraulic fracturing, leak detection, and permitting; published in June 2016 an effluent limited guideline final rule prohibiting the discharge of wastewater from onshore unconventional oil and natural gas extraction facilities to publicly owned wastewater treatment plants; and issued in 2014 a prepublication of its Advance Notice of Proposed Rulemaking regarding Toxic Substances Control Act reporting of the chemical substances and mixtures used in hydraulic fracturing. Also, the BLM published a final rule in March 2015, establishing stringent standards relating to hydraulic fracturing on federal and American Indian lands, but in June 2016, a Wyoming federal judge struck down this final rule, finding that the BLM lacked congressional authority to promulgate the rule. Also, from time to time, legislation has been introduced, but not enacted, in Congress to provide for federal regulation of hydraulic fracturing and to require disclosure of the chemicals used in the fracturing process. In the event that a new, federal level of legal restrictions relating to the hydraulic-fracturing process is adopted in areas where we operate, we may incur additional costs to comply with such federal requirements that may be significant in nature, and also could become subject to additional permitting requirements and experience added delays or curtailment in the pursuit of exploration, development, or production activities.
At the state level, Colorado, where we conduct operations, is among the states that has adopted, and other states are considering adopting, regulations that could impose new or more stringent permitting, disclosure or well-construction requirements on hydraulic fracturing operations. For example, in January 2016, the COGCC approved two new rules that require increased collaborative efforts between oil and natural gas operators and local governments regarding the siting of large-scale oil and natural gas facilities in certain urban mitigation areas, and
require such operators to pursue certain registrations and/or notifications of local governments with respect to future oil and natural gas drilling and production facility locations so that they can be integrated into the local comprehensive planning process. Moreover, states could elect to prohibit high volume hydraulic fracturing altogether, following the approach taken by the State of New York in 2015. In addition to state laws, local land use restrictions, such as city ordinances, may restrict drilling in general and/or hydraulic fracturing in particular. For example, several cities in Colorado passed temporary or permanent moratoria on hydraulic fracturing within their respective cities’ limits in 2012-2013 but, since that time, local district courts struck down the ordinances for certain of those Colorado cities in 2014, which decisions were upheld by the Colorado Supreme Court in May 2016. Notwithstanding attempts at the local level to prohibit hydraulic fracturing, there exists the opportunity for cities to adopt local ordinances allowing hydraulic fracturing activities within their jurisdictions but regulating the time, place and manner of those activities. Moreover, the COGCC may pursue more stringent policies or rules and the Colorado state legislature may seek to adopt new legislation relating to oil and natural gas operations, including measures that would give local governments in Colorado greater authority to limit hydraulic fracturing and other oil and natural gas operations or require greater distances between wells sites and occupied structures.
In the event that local or state restrictions or prohibitions are adopted in areas where we conduct operations, including the Wattenberg Field in Colorado, that impose more stringent limitations on the production and development of oil and natural gas, including, among other things, the development of increased setback distances, we and similarly situated oil and natural exploration and production operators in the state may incur significant costs to comply with such requirements or may experience delays or curtailment in the pursuit of exploration, development, or production activities, and possibly be limited or precluded in the drilling of wells or in the amounts that we and similarly situated operates are ultimately able to produce from our reserves. Any such increased costs, delays, cessations, restrictions or prohibitions could have a material adverse effect on our business, prospects, results of operations, financial condition, and liquidity.
In addition, several governmental reviews are underway that focus on environmental aspects of hydraulic fracturing activities. The White House Council on Environmental Quality is coordinating an administration-wide review of hydraulic fracturing practices. Also, the EPA released its draft report on the potential impacts of hydraulic fracturing on drinking water resources in June 2015, which report concluded that hydraulic fracturing activities have not led to widespread, systemic impacts on drinking water sources in the United States, although there are above and below ground mechanisms by which hydraulic fracturing activities have the potential to impact drinking water sources. However, in January 2016, the EPA’s Science Advisory Board provided its comments on the draft study, indicating its concern that EPA’s conclusion of no widespread, systemic impacts on drinking water sources arising from fracturing activities did not reflect the uncertainties and data limitations associated with such impacts, as described in the body of the draft report. The final version of this EPA report remains pending and is expected to be completed in 2016. These existing or any future studies, depending on their degree of pursuit and any meaningful results obtained, could spur efforts to further regulate hydraulic fracturing.
Ballot Initiatives that would Further Limit Certain Oil and Natural Gas Development Activities
In accordance with the Colorado Constitution, citizens in Colorado have the right to pursue amended or new state legislation through a ballot initiative process that would allow revisions to the state constitution in a manner that would make such exploration and production activities in the state more difficult in the future. For example, proponents of such initiatives sought to include on the Colorado November 2016 ballot certain amendments that, if approved, could, among other things, authorize local governmental control over oil and natural gas development in Colorado that could impose more stringent requirements than currently implemented under state law and impose a 2,500-foot mandatory setback between certain oil and natural gas development facilities and specified occupied structures and areas of interest. These particular amendments failed to gather enough valid signatures to be placed on the November 2016 ballot. However, one other amendment that was placed on the Colorado 2016 ballot and approved by voters, Amendment 71, now makes it more difficult to place an initiative on the state ballot. Amendment 71 requires that in order to place an initiative on a state ballot in the future, signatures from 2 percent of registered voters must be obtained in each of the state’s 35 Senate districts and, further, must be approved by 55 percent of the vote rather than a simple majority. Nonetheless, even though recent past amendments seeking to restrict oil and natural gas development in Colorado failed to be placed on the
ballot and Amendment 71 now makes it more difficult to place an initiative on the ballot, should ballot initiatives or local or state restrictions or prohibitions be adopted in the future in areas where we conduct operations that impose more stringent limitations on the production and development of oil and natural gas, we may incur significant costs to comply with such requirements or may experience delays or curtailment in the pursuit of exploration, development, or production activities, and possibly be limited or precluded in the drilling of wells or in the amounts that we are ultimately able to produce from our reserves.
Activities on Federal Lands
Oil and natural gas exploration, development and production activities on federal lands, including American Indian lands and lands administered by the BLM, are subject to the National Environmental Policy Act (“NEPA”). NEPA requires federal agencies, including the BLM, to evaluate major agency actions having the potential to significantly impact the environment. In the course of such evaluations, an agency will prepare an Environmental Assessment that assesses the potential direct, indirect and cumulative impacts of a proposed project and, if necessary, will prepare a more detailed Environmental Impact Statement that may be made available for public review and comment. While we currently have minimal exploration, development and production activities on federal lands, our proposed exploration, development and production activities are expected to include leasing of federal mineral interests, which will require the acquisition of governmental permits or authorizations that are subject to the requirements of NEPA. This process has the potential to delay or limit, or increase the cost of, the development of oil and natural gas projects. Authorizations under NEPA are also subject to protest, appeal or litigation, any or all of which may delay or halt projects. Moreover, depending on the mitigation strategies recommended in Environmental Assessments or Environmental Impact Statements, we could incur added costs, which may be substantial.
Endangered Species and Migratory Birds Considerations
The federal Endangered Species Act (“ESA”), and comparable state laws were established to protect endangered and threatened species. Pursuant to the ESA, if a species is listed as threatened or endangered, restrictions may be imposed on activities adversely affecting that species’ habitat. Similar protections are offered to migrating birds under the Migratory Bird Treaty Act. We may conduct operations on oil and natural gas leases in areas where certain species that are listed as threatened or endangered are known to exist and where other species, such as the sage grouse, that potentially could be listed as threatened or endangered under the ESA may exist. Moreover, as a result of a 2011 settlement agreement, the U.S. Fish and Wildlife Service (“FWS”) is required to make a determination on listing of numerous species as endangered or threatened under the FSA by no later than completion of the agency’s 2017 fiscal year. The identification or designation of previously unprotected species as threatened or endangered in areas where underlying property operations are conducted could cause us to incur increased costs arising from species protection measures, time delays or limitations on our exploration and production activities that could have an adverse impact on our ability to develop and produce reserves. If we were to have a portion of our leases designated as critical or suitable habitat, it could adversely impact the value of our leases.
OSHA
We are subject to the requirements of the OSHA and comparable state statutes whose purpose is to protect the health and safety of workers. In addition, the OSHA hazard communication standard, the Emergency Planning and Community Right-to-Know Act and comparable state statutes and any implementing regulations require that we organize and/or disclose information about hazardous materials used or produced in our operations and that this information be provided to employees, state and local governmental authorities and citizens.
Related Permits and Authorizations
Many environmental laws require us to obtain permits or other authorizations from state and/or federal agencies before initiating certain drilling, construction, production, operation, or other oil and natural gas activities, and to maintain these permits and compliance with their requirements for on-going operations. These permits are generally subject to protest, appeal, or litigation, which can in certain cases delay or halt projects and cease production or operation of wells, pipelines, and other operations.
Related Insurance
We maintain insurance against some risks associated with above or underground contamination that may occur as a result of our exploration and production activities. However, this insurance is limited to activities at the well site and there can be no assurance that this insurance will continue to be commercially available or that this insurance will be available at premium levels that justify its purchase by us. The occurrence of a significant event that is not fully insured or indemnified against could have a materially adverse effect on our financial condition and operations. Further, we have no coverage for gradual, long-term pollution events.
Employees
As of September 30, 2016, we employed 136 people. We are not a party to any collective bargaining agreements and have not experienced any strikes or work stoppages. We consider our relations with our employees to be satisfactory.
From time to time we utilize the services of independent contractors to perform various field and other services.
Facilities
Our corporate headquarters is located in Denver, Colorado.
Legal Proceedings
We have received nine invoices related to a terminated firm natural gas transportation service agreement. The natural gas transportation provider has demanded payment under this terminated agreement. We have delivered written notice disputing any and all amounts due related to this terminated agreement. We intend to vigorously defend itself against any and all demands, if legal proceedings relating to this matter are initiated; we may incur material legal expenses if this dispute results in litigation. We are unable to estimate a reasonable possible loss. In the event there is an adverse outcome, we currently estimate that its future loss would range between $0 million to $37.2 million that would be paid over the remainder of the original 10 year term of transportation service agreement.
In the ordinary course of business, we may at times be subject to claims and legal actions. Except as described above, management believes it is remote that the impact of such matters will have a material adverse effect on our financial position, results of operations or liquidity.
Directors and Executive Officers
The following sets forth information regarding our directors and executive officers:
|
Name |
|
Age |
|
Position |
|
Mark A. Erickson |
|
57 |
|
Chief Executive Officer and Chairman |
|
Matthew R. Owens |
|
30 |
|
President and Director |
|
Russell T. Kelley, Jr. |
|
40 |
|
Chief Financial Officer |
|
Tom L. Brock |
|
44 |
|
Vice President, Chief Accounting Officer |
|
John S. Gaensbauer |
|
45 |
|
Director |
|
Peter A. Leidel |
|
60 |
|
Director |
|
Marvin M. Chronister |
|
65 |
|
Director |
|
Patrick D. O’Brien |
|
68 |
|
Director |
|
Wayne W. Murdy |
|
72 |
|
Director |
|
Donald L. Evans |
|
70 |
|
Director |
Mark A. Erickson—Chief Executive Officer and Chairman. Mr. Erickson is our Chairman, CEO and co-founder. From 2010 to 2014, he served as Chairman and CEO of Denver-based PRL, a privately held oil and gas exploration and development company, where he remains as Chairman of the Board. From 2001 to 2010, Mr. Erickson served as CEO, President and Director of publicly traded Gasco Energy, Inc. (“Gasco Energy”), a Uinta Basin-focused oil & gas company which he co-founded. Mr. Erickson served as President of Pannonian Energy Inc. from mid-1999 until it merged with Gasco Energy in February 2001. In late 1997, Mr. Erickson co-founded Pennaco Energy, Inc. (“Pennaco”), a publicly traded oil and gas company with properties in Wyoming’s Powder River Basin. He served as an officer and director of Pennaco from its inception until mid-1999. Mr. Erickson began his career at North American Resources, which was the exploration and production subsidiary of Montana Power Company. A Helena, Montana native, Mr. Erickson has over 30 years of experience in business development, finance, strategic planning, marketing, project management and petroleum engineering. He holds an MS in mineral economics from the Colorado School of Mines and a BS in petroleum engineering from the Montana College of Mineral Science and Technology. We believe that Mr. Erickson’s experience founding and leading our growth as our Chief Executive Officer and his extensive experience leading various oil and gas companies qualify him to serve on our board of directors.
Matthew R. Owens—President and Director. Mr. Owens is our co-founder and President. From 2008-2010, he served as Operations Engineer for Gasco Energy, working deep, high-pressured gas in the Uinta Basin. While at Gasco Energy, he drilled and completed over 50 wells in the Mancos, Blackhawk and Mesaverde formations. From 2010-2012, Mr. Owens worked at PDC Energy, an oil and gas exploration and development company with a primary focus on the Wattenberg Field, as an Operations Engineer, leading the horizontal completion and production activities in the Wattenberg Field. He completed over 45 horizontal Codell and Niobrara wells and was responsible for optimizing production for the program. Mr. Owens has been our President since our formation in 2012, which, at the time, was a wholly owned subsidiary of PRL. Mr. Owens holds a BS degree in petroleum engineering from the Colorado School of Mines. We believe that Mr. Owens’ experience founding and leading our growth as our President and his background in completion and production activities qualify him to serve on our board of directors.
Russell T. Kelley, Jr.—Chief Financial Officer. Mr. Kelley has served as our Chief Financial Officer since July 2014. Prior to joining us, he ran the Oil & Gas practice of Moelis & Company, a global investment bank, from 2011 to 2014, where he was a partner and managing director covering upstream and integrated oil & gas companies. From 2005 to 2011, he worked at Goldman, Sachs & Co., a global investment bank, where he was a Senior Vice President. In such roles, Mr. Kelley has executed over $70 billion of M&A/advisory assignments and has led capital market transactions raising over $15 billion for clients. He has been in the energy and financial sector since 1998, with experience in commodities trading, corporate development and investment banking. He holds a MBA from The Wharton School at the University of Pennsylvania where he graduated as a Palmer Scholar and a BA from Vanderbilt University.
Tom L. Brock — Vice President, Chief Accounting Officer. Mr. Brock has served as our Vice President, Chief Accounting Officer since October 2016. Prior to that time, Mr. Brock served as our Senior Director of Accounting since August 2016. Prior to joining us, Mr. Brock served as Vice President, Chief Accounting Officer and Corporate
Controller of the American Midstream GP, LLC and American Midstream Partners, LP from November 2013 until his resignation in August 2016. Mr. Brock had previously served as Vice President and Corporate Controller of American Midstream GP, LLC and American Midstream Partners LP from July 2012 until November 2013. Prior to that, Mr. Brock held the position of Director of Trading and Finance with BG Group in Houston, Texas, where he controlled accounting and other functions for its marketing and trading companies beginning in July 2010. Mr. Brock began his career with KPMG LLP, where he spent 13 years holding various positions serving clients in the energy industry. Mr. Brock holds a Bachelor of Accountancy from New Mexico State University and is a CPA licensed in the State of Texas.
John S. Gaensbauer—Director. Mr. Gaensbauer serves as a member of our board of directors, where he has served since our inception. Mr. Gaensbauer has an extensive background in international mining and natural resource transactions and finance which we believe qualify him for service on our board of directors. Mr. Gaensbauer is currently a Managing Director in the Natural Resource Group at Headwaters MB, a Denver-based investment banking firm (“Headwaters”). Prior to joining Headwaters in May 2016, Mr. Gaensbauer was a partner at Sierra Partners LLC, a Denver-based, private advisory group (“Sierra Partners”) providing strategic advisory services to clients in the global resource industry. Prior to Sierra Partners, Mr. Gaensbauer served as Group Executive, Investor Relations for Newmont Mining Corporation (NYSE: NEM) (“Newmont”). Prior to that, Mr. Gaensbauer served as in-house counsel to Newmont, managing the legal affairs and transactions for Newmont’s West African, Central Asian and European operations, as well as counsel to Newmont’s Treasury Group and Newmont Capital, Newmont’s in-house merchant banking group. Prior to joining Newmont, Mr. Gaensbauer practiced corporate and transactional law at Ballard Spahr LLP. Mr. Gaensbauer is currently a director of PRL, a position he has held since February 2011. Mr. Gaensbauer holds a BA degree from Cornell University and Masters of Finance and JD degrees from the University of Denver.
Peter A. Leidel—Director. Mr. Leidel has served as a member of our board of directors since our inception and as a director of PRE since June 2012. Mr. Leidel is a member of Yorktown, a position he has held since he co-founded it in September 1990. Previously, he was a partner of Dillon, Read & Co. Inc.’s venture capital group, an investment bank, held corporate treasury positions at Mobil Corporation, an oil and gas company, and worked for KPMG LLP, an accounting firm, and for the U.S. Patent and Trademark Office. Mr. Leidel is a director of Mid-Con Energy Partners L.P. and Carbon Natural Gas Company and is also a director of certain non-public companies in the energy industry in which Yorktown’s funds hold equity interests. He is also a director of the University of Wisconsin Foundation. He is a graduate of the University of Wisconsin, with a BBA degree in accounting and of the Wharton School at the University of Pennsylvania, with a MBA. We believe that Mr. Leidel’s strong accounting background and previous experience serving as director of various public companies engaged in the oil and natural gas industry qualify him for service on our board of directors.
Marvin M. Chronister—Director. Mr. Chronister has served on our board of directors since our IPO in October 2016. Mr. Chronister is currently the owner of Enfield Companies, which is engaged in consulting and investment activities in the oil and gas sector. Mr. Chronister previously served as Interim Chief Executive Officer and Interim President of Bonanza Creek Energy, Inc., a domestic energy exploration and production company, from January 2014 until November 2014 and as a director of Bonanza Creek Energy, Inc., from 2011 to June 2016. From September 2009 until December 2010, Mr. Chronister served as Chairman and interim CEO of Sonde Resources Corp., an oil and gas exploration and production company focused on Western Canada and North Africa, where he also served as a director from 2009 to 2012. Mr. Chronister’s prior professional experience includes roles at Deloitte & Touch, LLP, Kidder Peabody, Merrill Lynch, Transwestern Investments, Kiddie Corporation, and N.L. Industries. Mr. Chronister has previously served on the boards of Saratogo Resources, Inc., Harken Energy Corporation, Creel Energy Corporation, Resource Development Corporation, Transwestern Investments, Inc., and Electro-Marine, Inc. Mr. Chronister holds a Bachelor of Business Administration degree from Stephen F. Austin State University. We believe that Mr. Chronister’s experience in investing, corporate finance and corporate governance and his service on the board of various energy companies qualify him for service on our board of directors.
Patrick D. O’Brien—Director. Mr. O’Brien has served on our board of directors since our IPO in October 2016. Since September 2011, Mr. O’Brien has served as an advisor to PRL and, since July 2012, Mr. O’Brien has served as a board member of, and advisor to Elk Meadows Energy Corporation, a private oil and gas exploration and production company. From 2003 until 2010, Mr. O’Brien served as CEO of American Oil & Gas, which was acquired by Hess Corporation. Mr. O’Brien co-founded Tower Colombia Corporation in 1995 and served as its CEO
and President. He co-founded Tower Energy Corporation in 1984 and Tower Drilling Company in 1980. In 1980, he joined Montana Power Company as Senior Petroleum Engineer with the responsibility for design, long-range planning and performance economics for its exploration and development programs. He joined the Colorado Interstate Gas Company in 1974, where he was responsible for the design, acquisition and development of company-owned gas storage fields. Mr. O’Brien began his career in the oil and gas industry with the Dowell Division of Dow Chemical Company, where he engineered and supervised all phases of well stimulation and cementing. He has over 30 years of experience working the DJ Basin and the Powder River Basin. Mr. O’Brien received his BS in Petroleum Engineering from the Montana Tech. We believe that Mr. O’Brien’s extensive experience in the oil and gas industry generally and in our geographic area of operation specifically qualifies him for service on our board of directors.
Wayne W. Murdy — Director. Mr. Murdy has served on our board of directors since December 2016. Since June 2009, Mr. Murdy has also served as a director of BHP Billiton Limited and BHP Billiton Plc, a multinational mining, metals and petroleum company. Prior to that, Mr. Murdy served as Chief Executive Officer of Newmont Mining Corporation from 2001 to 2007, where he also served as Chairman from 2002 to 2007. Mr. Murdy is also a former Chairman of the International Council on Mining and Metals, a former Director of the U.S. Mining Association and a former member of the Manufacturing Council of the U.S. Department of Commerce. Mr. Murdy has previously served as a director of Weyerhaeuser Company and Qwest Communications International Inc. Mr. Murdy received his BS in Business Administration from California State University at Long Beach. We believe that Mr. Murdy’s extensive experience in the oil and gas industry as well as his financial and corporate finance experience qualify him for service on our board of directors.
Donald L. Evans — Director. Mr. Evans has served on our board of directors since December 2016. Mr. Evans currently serves as a Senior Partner and Principal at Quintana Capital Group, L.P., where he has served since December 2006, and as a Senior Advisor at Energy Capital Partners, where he has served since July 2006. From February 2010 to March 2014, Mr. Evans served as a director of Genesis Energy LLC. Prior to that, Mr. Evans served as Secretary of Commerce of the United States Department of Commerce from 2001 to 2005 and served as the Chief Executive Officer at the Financial Services Forum from June 2005 to 2007. Mr. Evans currently serves as the Non-Executive Chairman at Energy Future Holdings Corp. where he has served since October 2007, and as a director at Energy Future Intermediate Holding Company LLC. Mr. Evans is currently the Chairman of the George W. Bush Foundation and has previously served as the Chairman of the Board of Regents of the University of Texas System. Mr. Evans received his BS in Mechanical Engineering and M.B.A. from the University of Texas in Austin. We believe that Mr. Evans’ extensive experience serving as a director and his extensive financial experience in both the public and private sector qualify him for service on our board of directors.
Board of Directors
In evaluating director candidates, we assess whether a candidate possesses the integrity, judgment, knowledge, experience, skills and expertise that are likely to enhance the board’s ability to manage and direct our affairs and business, including, when applicable, to enhance the ability of the committees of the board to fulfill their duties. We have identified individuals who meet these standards and the relevant independence requirements and our Board has determined that each of Messrs. Chronister, Leidel, Evans and Murdy are independent under the independence standards of the NASDAQ.
Our directors hold office until the earlier of their death, resignation, retirement, disqualification or removal or until their successors have been duly elected and qualified.
Our directors are divided into three classes serving staggered three-year terms. At each annual meeting of stockholders held after the initial classification, directors will be elected to succeed the class of directors whose terms have expired. This classification of our board of directors could have the effect of increasing the length of time necessary to change the composition of a majority of the board of directors. In general, at least two annual meetings of stockholders will be necessary for stockholders to effect a change in a majority of the members of the board of directors. Messrs. Owens, Gaensbauer and Murdy are currently assigned to Class I, Messrs. O’Brien and Chronister are currently assigned to Class II, and Messrs. Erickson, Leidel and Evans are currently assigned to Class III.
Independence of the Board of Directors and Board Committees
Rule 5605 of the NASDAQ Marketplace Rules requires a majority of a listed company’s board of directors to be comprised of independent directors within one year of listing. In addition, the NASDAQ Marketplace Rules require that, subject to specified exceptions, each member of a listed company’s audit, compensation and nominating and governance committees be independent and that audit committee members also satisfy independence criteria set forth in Rule 10A-3 under the Exchange Act. Under Rule 5605(a)(2), a director will only qualify as an “independent director” if, in the opinion of our board of directors, that person does not have a relationship that would interfere with the exercise of independent judgment in carrying out the responsibilities of a director. In order to be considered independent for purposes of Rule 10A-3, a member of an audit committee of a listed company may not, other than in his or her capacity as a member of the audit committee, the board of directors, or any other board committee: (1) accept, directly or indirectly, any consulting, advisory, or other compensatory fee from the listed company or any of its subsidiaries; or (2) be an affiliated person of the listed company or any of its subsidiaries.
In connection with the IPO, our board of directors undertook a review of the anticipated composition of our board of directors and its committees and the independence of each director. Based upon information requested from and provided by each director concerning his or her background, employment and affiliations, including family and other relationships, including those relationships described under “Certain Relationships and Related Party Transactions,” our board of directors has determined that neither Messrs. Chronister nor Leidel, representing two of our six directors upon consummation of the IPO, had a relationship that would interfere with the exercise of independent judgment in carrying out the responsibilities of a director and that each of these directors is “independent” as that term is defined under Rule 5605(a)(2) of the NASDAQ Marketplace Rules. Subsequent to the IPO, our Board nominated each of Messrs. Murdy and Evans to serve as a director on the Board, filling vacancies created by the expansion of the Board. In connection with the appointment of Messrs. Murdy and Evans, the Board determined that each of Messrs. Murdy and Evans also qualified as “independent” under Rule 5605(a)(2) of the NASDAQ Marketplace Rules. In addition, our board of directors also determined that Messrs. Chronister and Murdy, who are members of our audit committee, Messrs. Chronister and Leidel, who are members of our compensation committee, and Mr. Leidel, who is a member of our governance and nominating committee, satisfy the independence standards for such committees established by the SEC and the NASDAQ Marketplace Rules, as applicable. In making these determinations on the independence of our directors, our board of directors considered the relationships that each such non-employee director has with our company and all other facts and circumstances our board of directors deemed relevant in determining independence, including the beneficial ownership of our capital stock by each non-employee director.
Director Compensation
For a discussion of our director compensation arrangements, see “Executive Compensation—Director Compensation.”
Committees of the Board
The board of directors has a standing audit committee, compensation committee, nominating and corporate governance committee and executive committee.
Audit Committee
The audit committee is responsible for assisting the board of directors in its oversight of the integrity of our financial statements, the qualifications and independence of our independent auditors, and our internal financial and accounting controls. The audit committee has direct responsibility for the appointment, compensation, retention (including termination) and oversight of our independent auditors, and our independent auditors report directly to the audit committee. The audit committee also prepares the audit committee report that the SEC rules require to be included in our filings with the SEC.
The members of the audit committee are Messrs. Chronister, Leidel, O’Brien and Murdy. Under the applicable corporate governance standards of the NASDAQ Stock Market, a company listing in connection with its initial public offering is permitted to phase in its compliance with the independent audit committee requirements set forth
in NASDAQ Market Rule 5605 on the same schedule as it is permitted to phase in its compliance with the independent audit committee requirement pursuant to Rule 10A-3 under the Exchange Act, that is: (1) one independent member at the time of listing; (2) a majority of independent members within 90 days of listings; and (3) all independent members within one year of listing. Messrs. Chronister and Murdy qualify as independent directors under the corporate governance standards of the NASDAQ Stock Market and the independence requirements of Rule 10A-3 of the Exchange Act. Within 90 days and within one year of our listing on the NASDAQ Global Select Market, we expect that Mr. O’Brien and Mr. Leidel, respectively, will resign from our audit committee and be replaced with new directors, who are independent under NASDAQ Market Rules and Rule 10A-3 of the Exchange Act. Our board of directors has determined that Mr. Chronister qualifies as an “audit committee financial expert” as such term is currently defined in Item 407(d)(5) of Regulation S-K. Each member of the audit committee is able to read and understand fundamental financial statements, including our balance sheet, income statement and cash flows statements. The audit committee has adopted a charter that is posted on our website.
Compensation Committee
The compensation committee approves the compensation objectives for the company, provides a recommendation on the compensation of the Chief Executive Officer, which is subject to approval by the full board of directors, and establishes the compensation for other executives. The compensation committee reviews all compensation components including base salary, bonus, benefits and other perquisites.
The members of the compensation committee are Messrs. Chronister, Leidel and O’Brien. Each member of the compensation committee is a non-employee director within the meaning of Rule 16b-3 of the rules promulgated under the Exchange Act, each is an outside director, as defined by Section 162(m) of the United States Internal Revenue Code of 1986, as amended, or the Code, and each of Mr. Chronister and Mr. Leidel is an independent director, as defined by the NASDAQ Stock Market. The compensation committee has adopted a charter that is posted on our website.
Nominating and Corporate Governance Committee
The governance and nominating committee is responsible for making recommendations to the board of directors regarding candidates for directorships and the size and composition of the board. In addition, the governance and nominating committee is responsible for overseeing our corporate governance guidelines and reporting and making recommendations to the board concerning corporate governance matters.
The members of the governance and nominating committee are Messrs. Erickson, Leidel and O’Brien. Each of Mr. Leidel and Mr. O’Brien is a non-employee director within the meaning of Rule 16b-3 of the rules promulgated under the Exchange Act, and Mr. Leidel is an independent director, as defined by the NASDAQ Stock Market. The governance and nominating committee has adopted a charter that is posted on our website.
Executive Committee
The executive committee is responsible for assisting the Board and the audit committee in fulfilling their oversight responsibilities with respect to the annual review of our oil and natural gas reserves and of any independent qualified reserves consultant. The executive committee has adopted a charter that is posted on our website.
The members of the executive committee are Messrs. Erickson, Leidel, O’Brien and Owens.
Compensation Committee Interlocks and Insider Participation
None of our executive officers serve on the board of directors or compensation committee of a company that has an executive officer that serves on our board or compensation committee. No member of our board is an executive officer of a company in which one of our executive officers serves as a member of the board of directors or compensation committee of that company.
Code of Business Conduct and Ethics
Our board of directors has adopted a code of business conduct and ethics applicable to our employees, directors and officers, in accordance with applicable U.S. federal securities laws and the corporate governance rules of the NASDAQ. Any waiver of this code may be made only by our board of directors and will be promptly disclosed as required by applicable U.S. federal securities laws and the corporate governance rules of the NASDAQ.
Corporate Governance Guidelines
Our board of directors has adopted corporate governance guidelines in accordance with the corporate governance rules of the NASDAQ.
Named Executive Officers
We are currently considered an emerging growth company for purposes of the SEC’s executive compensation disclosure rules. Accordingly, our compensation disclosure obligations are more limited and extend only to the individuals serving as our chief executive officer and our two other most highly compensated executive officers (our “Named Executive Officers”). For the fiscal year ended December 31, 2016, our Named Executive Officers were:
|
Name |
|
Principal Position |
|
Mark A. Erickson |
|
Chief Executive Officer and Chairman |
|
Matthew R. Owens |
|
President and Director |
|
Russell T. Kelley, Jr. |
|
Chief Financial Officer |
2016 Summary Compensation Table
The following table summarizes the compensation awarded to, earned by, or paid to our Named Executive Officers for the fiscal years ended December 31, 2016, 2015 and 2014.
During the years prior to the completion of the IPO, our Named Executive Officers performed services both for us and for other business segments operated by Holdings, and the aggregate compensation paid to those Named Executive Officers has been in recognition of all services provided. Since 2016, 100% of the services of our Named Executive Officers have been allocated to us. For 2014 and 2015, the amounts set forth in the table below reflect only the portion of such aggregate compensation received by the Named Executive Officers relating to services provided to us. For 2016, the amounts set forth reflect 100% of compensation received by the Named Executive Officers.
|
Name and Principal Position |
|
Year |
|
Salary(1) |
|
Bonus(2) |
|
Stock |
|
Option |
|
All Other |
|
Total |
|
|
Mark A. Erickson |
|
2016 |
|
417,339 |
|
— |
|
14,891,303 |
|
10,125,000 |
|
— |
|
25,433,642 |
|
|
(Chief Executive Officer) |
|
2015 |
|
228,750 |
|
381,250 |
|
— |
|
— |
|
— |
|
610,000 |
|
|
|
|
2014 |
|
255,000 |
|
255,000 |
|
2,650,180 |
|
|
|
— |
|
3,160,180 |
|
|
Matthew R. Owens |
|
2016 |
|
417,339 |
|
— |
|
14,891,303 |
|
10,125,000 |
|
12,000 |
|
25,445,642 |
|
|
(President) |
|
2015 |
|
251,250 |
|
418,750 |
|
— |
|
— |
|
10,050 |
|
680,050 |
|
|
|
|
2014 |
|
277,500 |
|
277,500 |
|
1,920,375 |
|
|
|
21,497 |
|
2,496,872 |
|
|
Russell T. Kelley, Jr. |
|
2016 |
|
417,339 |
|
— |
|
11,426,600 |
|
10,125,000 |
|
12,000 |
|
21,980,939 |
|
|
(Chief Financial Officer) |
|
2015 |
|
264,000 |
|
440,000 |
|
— |
|
— |
|
10,560 |
|
714,560 |
|
|
|
|
2014 |
|
142,500 |
|
285,000 |
|
3,149,250 |
|
|
|
4,275 |
|
3,581,025 |
|
(1) For 2016, this column reflects 100% of the base salary received by each Named Executive Officer. In April 2016, our board of directors increased the base salary of each of our Named Executive Officers to $400,000, retroactive to January 1, 2016 in order to support the Company’s efforts to remain competitive and retain executive talent. In determining the amount of the increase in base salary, each Named Executive Officer’s service to us was evaluated with respect to the same factors that have historically been used to evaluate base salary increases. In connection with our IPO, the base salaries of our Named Executive Officers were increased to $450,000 to reflect the increased level of service required to lead a public company. For additional information regarding base salary, see Narrative Disclosure to Summary Compensation Table and Outstanding Equity Awards at Fiscal Year-End —Base Salary. For 2014 and 2015 this column reflects only the aggregate compensation received that is attributable to ervices performed for us. For 2015 this portion of aggregate compensation was estimated as 76% for Mr. Erickson, 84% for Mr. Owens, and 88% for Mr. Kelley. For 2014, this portion of aggregate compensation was estimated as 85% for Mr. Erickson, 93% for Mr. Owens, and 95% for Mr. Kelley. Mr. Kelley joined Extraction on June 30, 2014, so the amount included in this column for 2014 reflects a pro-rated annual base salary for the months of service to us.
(2) Amounts under our discretionary annual cash bonus program for 2016 have not yet been determined. Under our Named Executive Officers employment agreements (as discussed below), annual bonuses will continue to be based on criteria determined in the discretion of our board or a committee thereof, with a target bonus payment at planned or targeted levels of performance equal to a specific percentage of each Named Executive Officer’s annual base salary, which is a minimum of 150% for Mr. Erickson and 100% for each of Messrs. Owens and Kelley, and with final determination of annual bonus payments made by our board of directors or a committee thereof. Once determined, bonus amounts and updated aggregate total compensation amounts for 2016 will be disclosed. For 2014 and 2015, this column reflects the portion relating to services performed for us of the aggregate amounts received pursuant to our discretionary annual cash bonus program, which were paid on April 28, 2016 and May 1, 2015, respectively. For 2015, the portion of the aggregate discretionary bonus received in 2016 by each Named Executive Officer relating to services performed for us in 2015 was estimated as 76% for Mr. Erickson, 84% for Mr. Owens, and 88% for Mr. Kelley. For 2014, the portion of the aggregate discretionary bonus received in 2015 by each Named Executive Officer relating to services performed for us in 2014 was estimated as 85% for Mr. Erickson, 93% for Mr. Owens, and 95% for Mr. Kelley.
(3) Amounts reported in this column for 2016 represent the aggregate grant date fair value determined in accordance with Financial Accounting Standards Board Accounting Standards Codification Topic 718 (“FASB ASC Topic 718”). For restricted unit awards (RUAs) granted under the Holdings 2014 Membership Unit Incentive Plan, the amounts shown are based on the grant date fair value of an RUA on September 23, 2016, the date of grant, which was $5.84. For restricted stock units (RSUs) granted under the Extraction Oil & Gas, Inc. 2016 Long-Term Incentive Plan, the amounts shown are based on the closing price of our common stock on October 17, 2016, which was $21.51. For 2014, amounts reported represent the aggregate grant date fair value determined in accordance with FASB ASC Topic 718 for RUAs, adjusted to reflect the estimated portion of each Named Executive Officer’s aggregate services that were rendered to us during the year.
Amounts in this column do not correspond to the actual value that will be recognized by the executive. See Note 10—Unit-Based Compensation to the financial statements included in this registration statement for additional detail regarding assumptions underlying the value of these awards. Pursuant to SEC rules, the amounts shown in the table above for the RUAs and RSUs exclude the effect of estimated forfeitures.
(4) For 2016, this column represents the aggregate grant date fair value of nonstatutory stock option awards granted during the year under the Extraction Oil & Gas, Inc. 2016 Long-Term Incentive Plan, calculated based on a per option value of $6.75, as determined in accordance with FASB ASC Topic 718 using the Black-Scholes options-pricing model.
For 2015, the Named Executive Officers received a grant of incentive units (described below) under the Second Amended and Restated Limited Liability Company Agreement of Holdings (the “Holdings LLC Agreement”). We believe that, despite the fact that incentive units do not require the payment of an exercise price, they are most similar economically to stock options, and as such they are properly classified as “options” under the definition provided in Item 402(a)(6)(i) of Regulation S-K as an instrument with an “option-like feature.” Amounts reported in this column reflect a grant date fair value determined in accordance with FASB ASC Topic 718 of $0. Because the performance conditions related to these awards were not deemed probable at the time of grant in 2015, no amounts have been reported in 2015 for purposes of this table. These awards do not have maximum payout levels.
Amounts in this column do not correspond to the actual value that will be recognized by the executive. See Note 10—Unit-Based Compensation to the financial statements included in this registration statement for additional detail regarding assumptions underlying the value of these awards and for a description of their accounting treatment under FASB ASC Topic 718, including the liability treatment of the incentive units granted in 2015.
(5) Amounts reported in the “All Other Compensation” column for 2016 reflect a car allowance provided to Mr. Owens and Mr. Kelley. For 2015 and 2014, this column includes an adjusted amount of the car allowance provided to the Named Executive Officers as well as any employer matching contribuitons provided under our
401(k) plan, in each case reflecting the estimated allocable portion of compensation that relates to services performed for us.
Outstanding Equity Awards at Fiscal Year-End
The following table reflects information regarding outstanding equity-based awards that were held by our Named Executive Officers as of December 31, 2016. The amounts shown in the following table for Stock Awards represent restricted stock units and the amounts shown in the table for Option Awards represent nonstatutory stock options, both granted to our Named Executive Officers pursuant to the Extraction Oil & Gas, Inc. 2016 Long Term Incentive Plan in connection with the IPO. For additional information, see the discussion below under “Long-Term Incentive Compensation.”
|
|
|
Options Awards |
|
Stock Awards | |||||||||||||
|
|
|
Date of |
|
Number of |
|
Number of |
|
Option |
|
Option |
|
Date of |
|
Number of |
|
Market Value |
|
|
Mark A. Erickson |
|
10/11/2016 |
|
0 |
|
1,500,000 |
|
19.00 |
|
10/11/2026 |
|
10/17/2016 |
|
500,000 |
|
10,020,000 |
|
|
Matthew R. Owens |
|
10/11/2016 |
|
0 |
|
1,500,000 |
|
19.00 |
|
10/11/2026 |
|
10/17/2016 |
|
500,000 |
|
10,020,000 |
|
|
Russell T. Kelley, Jr. |
|
10/11/2016 |
|
0 |
|
1,500,000 |
|
19.00 |
|
10/11/2026 |
|
10/17/2016 |
|
500,000 |
|
10,020,000 |
|
(1) Amounts in this column represent nonstatutory stock options granted pursuant to the terms of the Extraction Oil & Gas, Inc. 2016 Long-Term Incentive Plan. The options become exercisable in equal annual installments on each of the first, second and third anniversaries of the date of grant. The treatment of these awards upon certain termination and change in control events is described below under “Additional Narrative Disclosure—Potential Payments Upon a Termination or Change in Control.”
(2) The restricted stock units reported in this column were granted pursuant to the terms of the Extraction Oil & Gas, Inc. 2016 Long-Term Incentive Plan and are subject to time-based vesting conditions, with 25% vesting on each of the first and second anniversaries of the date of grant, and the remaining 50% vesting on the third anniversary of the date of grant. The treatment of these awards upon certain termination and change in control events is described below under “Additional Narrative Disclosure—Potential Payments Upon a Termination or Change in Control.”
(3) Amounts in this column are calculated using a value of $20.04 per restricted stock unit, which was the closing price of one share of our common stock as of December 30, 2016.
Narrative Disclosure to Summary Compensation Table and Outstanding Equity Awards at Fiscal Year-End
Employment Agreements
We have historically not had any formal employment agreements in place with our Named Executive Officers. However, in connection with the IPO, our Named Executive Officers entered into employment agreements with us, effective as of October 11, 2016, to reflect the executive’s role with us going forward as a public company. Under these new employment agreements, each of our Named Executive Officers is entitled to a certain level of base salary, minimum target annual bonus, and expected minimum target annual performance-based equity grants, as well as certain severance benefits upon a qualifying termination of employment. The employment agreements include customary restrictive covenants, including those precluding the executives from soliciting employees or competing with us for a period of two years following termination of employment. See “Additional Narrative Disclosure—Potential Payments Upon Termination or Change in Control” below for further details regarding the
payments that our employment agreements provide the Named Executive Officers upon a termination of employment or a change in control.
Base Salary
Each Named Executive Officer’s base salary is a fixed component of compensation for each year for performing specific job duties and functions. Historically, our board of directors has established the annual base salary rate for each of the Named Executive Officers at a competitive level, subject to periodic review, in consultation with management. Any adjustments to the base salary rates of the Named Executive Officers have been based upon consideration of any factors that our board of directors deems relevant, including but not limited to: (a) any increase or decrease in the executive’s responsibilities, (b) the executive’s job performance, and (c) the level of compensation paid to executives of other companies with which we compete for executive talent, as estimated based on publicly available information and the experience of members of our board of directors and our Chief Executive Officer. In April 2016, our Board increased our Named Executive Officers’ base salary to $400,000, retroactive to January 1, 2016, in order to support the Company’s efforts to remain competitive and retain top executive talent. The board of directors evaluated each Named Executive Officer’s service to us with respect to the factors historically used by our board of directors to determine salary increases, including the factors described above. In connection with the IPO, we entered into employment agreements with our Named Executive Officers that provide for a minimum annual base salary of $450,000. This amount reflects the increased responsibilities our executives are expected to assume as a result of us becoming a public company. Base salary amounts under the employment agreements will be subject to increases from time to time in the sole discretion of our board of directors or a committee thereof. There were no changes in base salary for our Named Executive Officers from 2014 to 2015, and the different amounts reflected in the Summary Compensation Table for these years is attributable to the reduced allocable share of services that our Named Executive Officers provided to us, relative to their services performed for Holdings.
Annual Bonus
Historically, we have maintained a fully discretionary bonus program. Following the close of a fiscal year, our board has previously determined the amount, if any, of the discretionary annual bonuses awarded to each of our Named Executive Officers after careful review of our performance over the course of the preceding fiscal year. Items that have been taken into account during this subjective assessment have included, but were not limited to, reserves growth, production growth, and our financial performance as measured by EBITDA. There were no performance metrics or formulas used to calculate the amounts of bonuses paid although the bonus guideline percentage of salary was considered in the board’s determination.
Following the closing of the IPO, our Chief Executive Officer has been working with our board of directors to establish an annual bonus program for our employees for future years. No decisions regarding our future annual bonus program have been made at this time. However, under new employment agreements we have entered into with our Named Executive Officers, annual bonuses will be based on criteria determined in the discretion of our board or a committee thereof, with a target bonus payment at planned or targeted levels of performance equal to a specific percentage of each Named Executive’s annual base salary, which is a minimum of 150% for Mr. Erickson and 100% for each of Messrs. Owens and Kelley, and with final determination of annual bonus payments made by our board of directors or a committee thereof.
Long-Term Incentive Compensation
Restricted Unit Awards (RUAs)
Long-term incentives were historically granted to our Named Executive Officers through grants of restricted unit awards, or RUAs, pursuant to the Holdings 2014 Membership Unit Incentive Plan (the “Incentive Plan”). These equity-based awards were subject to time-based vesting requirements, as well as accelerated vesting upon the occurrence of a termination of employment in connection with a change of control. The RUAs granted in 2014 to each of the Named Executive Officers were designed to vest in three annual installments, as follows: 25% on each of the first and second anniversaries of the date of grant and 50% on the third anniversary of the date of grant; however, vesting was required to be fully accelerated if the award-holder’s service with Holdings was terminated as a result of a “change of control” (as defined below under “Additional Narrative Disclosure— Potential Payments Upon Termination or Change in Control”) occurring prior to the satisfaction of this time-based vesting schedule. Any unvested RUAs were forfeited without consideration upon the holder’s termination of employment or service. In 2016, 0ur Named Executive Officers were granted 1,531,542 RUAs (which consisted of 708 271 RUAs for each of Mr. Erickson and Mr. Owens, and 115,000 RUAs for Mr. Kelley) in connection with the IPO, subject to the same
vesting and forfeiture restrictions that applied under the previously granted RUAs (the “2016 RUAs”). Our IPO constituted a change of control under all RUAs, including the 2016 RUAs.
Incentive Units (Profits Interests)
In 2015, Holdings granted to each of the Named Executive Officers Incentive Units, which were profits interests representing an interest in the future profits (once a certain level of proceeds has been generated of Holdings and granted pursuant to the Holdings LLC Agreement. These profits interests (the “Incentive Units”) represented interests in Holdings that had no value for tax purposes on the date of grant and were designed to gain value only after the underlying assets have realized a certain level of growth and return to those individuals who held certain classes of Holdings’ equity. The Incentive Units were intended to provide the holders with the ability to benefit from the growth of Holdings, including the growth in our operations and business.
The Incentive Units were divided into three tiers. A potential payout for each tier would occur only after a specified level of cumulative cash distributions had been received by members that had made capital contributions to us, as further described below. Tier I, II, and III Incentive Units were designed to vest in three annual installments (25% on each of the first two anniversaries of the date of grant, and 50% on the third anniversary, with the second and third installments vesting on a monthly basis as described above) although vesting would be fully accelerated upon the occurrence of a “change of control” (as defined below under “Additional Narrative Disclosure—Potential Payments Upon Termination or Change in Control”) occurring prior to the time-based vesting becoming satisfied. The difference between a vested and unvested Incentive Unit was that once vested, in the event that the executive’s employment terminated other than for “cause” (defined below), the executive would retain all vested profits interests awards as non-voting interests. Any unvested profits interests would be forfeited without consideration upon the holder’s termination of employment or service, except in the event of certain qualifying terminations of employment, for which accelerated vesting was provided, as described below.
Under the Holdings LLC Agreement, the Tier I, Tier II and Tier III Incentive Units were entitled to 15%, 20% and 30%, respectively, of future distributions to members only after equity owners had received certain cumulative levels of distributions in respect of their membership interests.
As used in the paragraphs above, a “capital contribution” to Holdings generally meant, for any member thereof, the dollar amount of any cash and the fair market value of any property or services contributed to Holdings.
See “Additional Narrative Disclosure—Potential Payments Upon Termination or Change in Control” below for details regarding treatment of Incentive Units and RUAs upon a termination of employment or a change in control.
Treatment of Incentive Units and RUAs in Connection with the IPO
In connection with the IPO, all outstanding Incentive Units and RUAs were accelerated and all of Holdings’ outstanding equity interests, including the Incentive Units and the RUAs, but excluding the Series A Preferred Units (which were redeemed in connection with the IPO) and the Series B Preferred Units (which were converted into shares of our Series A Preferred Stock) were exchanged for shares of our common stock in connection with the merger of Holdings with and into us, calculated using an implied equity valuation for us based on the initial public offering price set forth on the cover of the IPO prospectus. The aggregate number of shares issued to the Existing Owners were not contingent upon the initial public offering price; however, the allocation of shares of our common stock amongst our Existing Owners, including with respect to the outstanding RUAs and Incentive Units held by our Named Executive Officers, was determined based on the 10-day volume weighted average price of our common stock immediately following the closing of the IPO. In accordance with the above allocation mechanism, Messrs. Erickson, Owens and Kelley each received 818,047; 518,576 and 478,947 shares of common stock, respectively, with respect to the RUAs they held in Holdings (including the 2016 RUAs that were granted prior to the offering) and 3,261,566; 3,261,561 and 2,536,770 shares of our common stock, respectively, with respect to the Incentive Units they held in Holdings.
Following the closing of the IPO, our executive officers no longer receive, pursuant to the Incentive Plan or the Holdings LLC Agreement, additional long-term incentive compensation for services rendered to us or our subsidiaries; rather, any such long-term incentive compensation will be awarded to our Named Executive Officers
pursuant to the long-term incentive plan that our board of directors adopted in connection with the IPO, as described in the succeeding paragraphs below.
Long-Term Incentive Plan
Our board of directors has adopted, and our equityholders approved, the Extraction Oil & Gas, Inc. 2016 Long-Term Incentive Plan (the “Plan”), pursuant to which employees, consultants, and directors of our company and its affiliates performing services for us, including our named executive officers, are eligible to receive awards. The Plan provides for the grant of stock options, stock appreciation rights, restricted stock, restricted stock units, bonus stock, dividend equivalents, other stock-based awards, substitute awards, annual incentive awards, and performance awards intended to align the interests of participants with those of our stockholders. The following description of the Plan is a summary of the material features of the Plan. This summary is qualified in its entirety by reference to the Plan, a copy of which has been included as an exhibit to this registration statement.
Administration. The Plan is administered by our board of directors, or a committee thereof (the “Plan Administrator”). The Plan Administrator has the authority to, among other things, designate eligible persons as participants under the Plan, determine the type or types of awards to be granted to eligible persons, determine the number of shares of our common stock to be covered by awards, determine the terms and conditions applicable to awards and interpret and administer the Plan. The Plan Administrator may terminate or amend the Plan at any time with respect to any shares of our common stock for which a grant has not yet been made. The Plan Administrator also has the right to alter or amend the Plan or any part of the Plan from time to time, including increasing the number of shares of our common stock that may be granted, subject to stockholder approval as required by any exchange upon which our common stock is listed at that time. However, no change in any outstanding award may be made that would materially and adversely affect the rights of the participant under the award without the consent of the participant.
Number of Shares. Subject to adjustment in the event of any distribution, recapitalization, split, merger, consolidation or similar corporate event, the number of shares available for delivery pursuant to awards granted under the Plan will not exceed 20,200,000 shares of our common stock. There is no limit on the number of awards that may be granted and paid in cash. Shares subject to awards under the Plan that are canceled, forfeited, exchanged, settled in cash or otherwise terminated, including shares withheld to satisfy exercise prices or tax withholding obligations, will again be available for awards under the Plan. The shares of our common stock to be delivered under the Plan will be made available from authorized but unissued shares, shares held in treasury, or previously issued shares reacquired by us, including by purchase on the open market.
Stock Options. A stock option, or option, is a right to purchase shares of our common stock at a specified price during specified time periods. It is anticipated that options will have an exercise price that may not be less than the fair market value of our common stock on the date of grant. Options granted under the Plan can be either incentive options (within the meaning of section 422 of the Code), which have certain tax advantages for recipients, or non-qualified options. No option will have a term that exceeds ten years.
Stock Appreciation Rights. A stock appreciation right is an award that, upon exercise, entitles a participant to receive the excess of the fair market value of our common stock on the exercise date over the grant price established for the stock appreciation right on the date of grant. Such excess will be paid in a form (cash, shares of our common stock, etc.) determined by the Plan Administrator. It is anticipated that stock appreciation rights will have a grant price that may not be less than the fair market value of our common stock on the date of grant.
Restricted Stock. A restricted stock grant is an award of common stock that vests over a period of time and, during such time, is subject to transfer limitations, a risk of forfeiture, and other restrictions imposed by the Plan Administrator, in its discretion. Except as otherwise provided under the terms of the Plan or an award agreement, during the restricted period, a participant will have rights as a stockholder, including the right to vote the common stock subject to the award and to receive cash dividends thereon (which may, if required by the Plan Administrator, be subjected to the same vesting terms that apply to the underlying award of restricted stock).
Restricted Stock Units. A restricted stock unit is a notional share that entitles the grantee to receive shares of our common stock, cash or a combination thereof, as determined by the Plan Administrator, at or some future date following the vesting of the restricted stock unit.
Bonus Stock Awards. A bonus stock award is a transfer of unrestricted shares of our common stock on terms and conditions determined by the Plan Administrator. The Plan Administrator will determine any terms and conditions applicable to grants of common stock, including performance criteria, if any, associated with a bonus stock award.
Dividend Equivalents. Dividend equivalents entitle a participant to receive cash, common stock, other awards, or other property equal in value to dividends paid with respect to a specified number of shares of our common stock, or other periodic payments at the discretion of the Plan Administrator. Dividend equivalents may be granted on a free-standing basis or in connection with another award (other than an award of restricted stock or a bonus stock award).
Other Stock-Based Awards. Other stock-based awards are award denominated in or payable in, valued in whole or in part by reference to, or otherwise based on or related to, the value of our common stock.
Substitute Awards. Substitute awards may be granted under the Plan in substitution for similar awards held for individuals who become eligible persons as a result of a merger, consolidation, or acquisition of another entity (or the assets of another entity) by or with us or one of our affiliates.
Performance Awards and Annual Incentive Awards. A performance award is a right to receive all or part of an award granted under the Plan based upon performance conditions specified by the Plan Administrator. The Plan Administrator will determine the period over which certain specified company or individual goals or objectives must be met. An annual incentive award is an award based on a performance period of the fiscal year and is also conditioned on one or more performance standards. The performance or annual incentive award may be paid in cash, common stock, other awards or other property, in the discretion of the Plan Administrator.
One or more of the following business criteria as applied to us on a consolidated basis, and/or to our subsidiaries, divisions, businesses or geographical units (except with respect to the total stockholder return, change in fair market value of our common stock, and earnings per share criteria) will be used by the Plan Administrator in establishing performance conditions for performance awards granted to covered employees that are intended to satisfy the requirements for “performance-based compensation” within the meaning of section 162(m) of the Code: (1) earnings per share; (2) revenues; (3) cash flow; (4) cash flow from operations; (5) cash flow return; (6) return on net assets; (7) return on assets; (8) return on investment; (9) return on capital; (10) return on equity; (11) economic value added; (12) operating margin; (13) contribution margin; (14) net income; (15) net income per share; (16) pretax earnings; (17) pretax earnings before interest, depreciation and amortization; (18) pretax operating earnings after interest expense and before incentives, service fees, and extraordinary or special items; (19) total stockholder return; (20) debt reduction or management; (21) market share; (22) change in the Fair Market Value of the Stock; (23) operating income; (24) enterprise value; (25) reserve volumes, present value of reserves, or PV-10; (26) top level production volumes; (27) finding and development costs or production costs per BOE; (28) net production (BOE/d); (29) lease operating expenses; (30) number of drilling locations; and (31) any of the above goals determined on a basic or adjusted basis, or on an absolute or relative basis, as compared to the performance of a published or special index deemed applicable by the Plan Administrator, including but not limited to, the Standard & Poor’s 500 Stock Index or a group of comparable companies.
Tax Withholding. The Plan Administrator will determine, in its sole discretion, the form of payment acceptable to satisfy a participant’s obligations with respect to withholding taxes and other tax obligations relating to an award, including, without limitation, the delivery of cash or cash equivalents, common stock (including previously owned shares, net settlement, broker-assisted sale or other cashless withholding or reduction of the amount of shares of our common stock otherwise issuable or delivered pursuant to the award), other property or any other legal consideration that the Plan Administrator deems appropriate.
Merger, Recapitalization, or Change in Control. If any change is made to our capitalization, such as a stock split, stock combination, stock dividend, exchange of shares or other recapitalization, merger or otherwise, which
results in an increase or decrease in the number of outstanding shares of common stock, appropriate adjustments will be made by the Plan Administrator to the shares available under the Plan and the shares subject to awards granted under the Plan. The Plan Administrator will also have the discretion to make certain adjustments to awards in the event of a change in control, such as accelerating the exercisability of options or SARs, requiring the surrender of an award, with or without consideration, or making any other adjustment or modification to the award that the Plan Administrator feels is appropriate in light of the transaction.
Termination of Employment or Service. The consequences of the termination of a participant’s employment, consulting arrangement, or membership on the board of directors will be determined by the Plan Administrator in the terms of the relevant award agreement.
In connection with the closing of the IPO, we granted stock options to our Named Executive Officers. On October 11, 2016, Messrs. Erickson, Owens and Kelley each received an award of options to purchase 1,500,000 shares. The options vest ratably in three equal annual tranches on the first, second and third anniversaries of the date of grant. We also made grants of restricted stock units to certain key employees (including our Named Executive Officers) in recognition of their increased efforts during the process of preparing for the IPO. Messrs. Erickson, Owens, and Kelley each received a grant of 500,000 restricted stock units. The restricted stock units vest over a period of three years, as follows: 25% on the first anniversary of the date of grant, 25% on the second anniversary, and 50% on the third anniversary. The options and the restricted stock units are subject to forfeiture pursuant to the terms of the applicable award agreements under which they were granted, as well as the terms of the Plan, or as otherwise provided in the employment agreements entered into with the Named Executive Officers, as described below in “Additional Narrative Disclosure—Potential Payments Upon Termination or Change of Control—Employment Agreements.”
Other Compensation Elements
We have historically offered participation in broad-based retirement and health and welfare plans to all of our employees. We currently maintain a retirement plan intended to provide benefits under section 401(k) of the Internal Revenue Code where employees, including our Named Executive Officers, are allowed to contribute portions of their base compensation to a tax-qualified retirement account. See “Additional Narrative Disclosure—Retirement Benefits” for more information. In addition, minimal perquisites have historically been provided to our Named Executive Officers, namely a car allowance. We expect that each of these benefits will continue to be provided to the Named Executive Officers.
Additional Narrative Disclosure
Retirement Benefits
We have not maintained, and do not currently maintain, a defined benefit pension plan or nonqualified deferred compensation plan. We currently maintain a retirement plan intended to provide benefits under section 401(k) of the Internal Revenue Code where employees, including our Named Executive Officers, are allowed to contribute portions of their base compensation to a tax-qualified retirement account. We provide matching contributions equal to 100% of the first 3% of employees’ eligible compensation contributed to the plan and 50% of the next 2% of employees’ eligible compensation contributed to the plan, for a total of 4% on the first 5% of eligible contributions. However, none of our Named Executive Officers received any matching contributions with respect to services provided to us in 2016.
Potential Payments Upon Termination or Change in Control
Employment Agreements
As described above in “Narrative Disclosure to Summary Compensation Table and Outstanding Equity Awards at Fiscal Year-End—Employment Agreements,” we entered into employment agreements (effective as of October 11, 2016) with each of our Named Executive Officers in connection with the IPO. The description of the new employment agreements set forth below is a summary of the material features of the agreements regarding potential payments upon termination or a change in control. This summary, however, does not purport to be a complete description of all the provisions of the agreements that we have entered into with the executives. This summary is qualified in its entirety by reference to the employment agreements, which are included as exhibits to this registration statement.
Under the terms of the new employment agreements, each Named Executive Officer is entitled to receive the following amounts upon a termination by the company for “cause” (as such term is defined below), upon a termination of employment by reason of death, disability, upon expiration of the term of the employment agreement, or upon the executive’s termination without “good reason” (as such term is defined below): (a) payment of all accrued and unpaid base salary to the date of termination, (b) reimbursement of all incurred but unreimbursed business expenses to which the executive would have been entitled to reimbursement, and (c) benefits to which the executive is entitled under the terms of any applicable benefit plan or program (together the “Accrued Rights”). If the termination is due to death or disability, such Named Executive Officer will also be entitled to (x) a severance payment equal to one times the sum of the executive’s base salary on the date of termination and the average annual bonus for the two prior calendar years and (y) accelerated vesting of any outstanding LTIP awards.
Under the terms of the new employment agreements, each Named Executive Officer is also entitled to receive the following amounts upon a termination by the executive for “good reason” (as such term is defined below) or by the company without “cause” (as such term is defined below) or upon our nonrenewal of the employment agreement: (a) the Accrued Rights; (b) any earned but unpaid annual bonus for the prior year; (c) a prorated annual bonus for the year of termination; (d) a severance payment equal to one and one-half times for our Chief Financial Officer and two times for each of our Chief Executive Officer and our President (two times and three times, respectively, in the event of a qualifying termination within the 12-month period following a “change in control” as such term is defined below) the sum of the executive’s base salary on the date of termination and the average annual bonus for the two prior calendar years; (e) accelerated vesting of any outstanding LTIP awards held by the executive as of the date of termination; and (f) continued coverage under our group health plan for any COBRA period (up to 18 months) elected for the executive and the executive’s spouse and eligible dependents, at no greater premium cost than that which applies to our active senior executive employees.
The following terms are defined under the new employment agreements for the Named Executive Officers, as described below:
· “Cause” means a determination by our board of directors (the “Board”) (or its delegate) that the executive (a) has engaged in gross negligence, gross incompetence or willful misconduct in the performance of the executive’s duties with respect to us or any of our affiliates, (b) has failed without proper legal reason to
substantially perform the executive’s duties and responsibilities to us or any of our affiliates, (c) has materially breached any provision of the employment agreement, (d) has committed an act of theft, fraud, embezzlement, misappropriation or willful breach of a fiduciary duty to us or any of our affiliates, or (e) has been convicted of, pleaded no contest to or received adjudicated probation or deferred adjudication in connection with a crime involving fraud, dishonesty or moral turpitude or any felony (or a crime of similar import in a foreign jurisdiction). In order to terminate the executive’s employment for Cause, the Board (or its delegate) must provide the executive with a written notice providing in reasonable detail the specific circumstances alleged to constitute Cause and the executive must not have cured or remedied the alleged Cause event (if susceptible to cure) in the Board’s (or its delegate) good faith judgment within thirty (30) days after his receipt of such notice.
· “Good Reason” means (a) a material diminution in the executive’s base salary; (b) a material diminution in the executive’s authority, duties, or responsibilities; (c) the involuntary relocation of the geographic location of the executive’s principal place of employment by more than 50 miles from the location of the executive’s principal place of employment as of the effective date of the employment agreement; or (d) a material breach by us of the employment agreement.
· “Change in Control” generally means (a) a merger, consolidation, or sale of all or substantially all of our assets if (i) our shareholders do not continue to own at least 50% of the voting power of the resulting entity in substantially the same proportions that they owned our equity securities prior to the transaction or event or (ii) the members of our board immediately prior to the transaction or event do not constitute at least a majority of the board of directors of the resulting entity immediately after the transaction or event; (b) the dissolution or liquidation of the Company; (c) when any person, entity, or group acquires or gains ownership or control of more than 50% of the combined voting power of the outstanding securities of the company; or (d) as a result of or in connection with a contested election of directors, the persons who were members of our board immediately before such election cease to constitute a majority of the board.
As described above, prior to the IPO, our Board accelerated the vesting of all outstanding Incentive Units and RUAs, including the 2016 RUAs, in light of the holders’ efforts in accomplishing certain corporate transactions that occurred in connection with the IPO.
Director Compensation
Our non-employee directors received compensation in 2016 as reflected in the following table:
|
Name(1) |
|
Fees Earned or |
|
Stock Awards(3) |
|
Total |
|
|
Marvin M. Chronister |
|
25,048 |
|
1,613,250 |
|
1,638,298 |
|
|
Donald L. Evans |
|
3,696 |
|
2,456,250 |
|
2,459,946 |
|
|
John S. Gaensbauer |
|
17,826 |
|
806,625 |
|
824,451 |
|
|
Bryan R. Lawrence |
|
— |
|
— |
|
— |
|
|
Peter A. Leidel |
|
22,394 |
|
2,688,750 |
|
2,711,144 |
|
|
Wayne W. Murdy |
|
4,620 |
|
2,456,250 |
|
2,460,870 |
|
|
Patrick D. O’Brien |
|
21,503 |
|
1,613,250 |
|
1,634,753 |
|
(1) Mr. Lawrence ceased serving as a member of our board of directors on October 11, 2016. He received no compensation for service on our board during 2016.
(2) Reflects the aggregate of the pro-rated annual retainer, committee membership retainers, and committee chair retainers (as applicable) earned by each of our directors pursuant to our non-employee director compensation program (as described below) for services performed during the period from the closing of the IPO through December 31, 2016.
(3) Amounts reported in this column represent the grant date fair value determined in accordance with FASB ASC Topic 718 of restricted stock units granted during 2016. The amounts shown are based on the closing price of our common stock on the applicable date of grant as follows: Messrs. Chronister , Gaensbauer, Leidel and O’Brien, $21.51(October 17, 2016) and Mr. Evans and Mr. Murdy, $19.65 (December 15, 2016). The value ultimately received by the director may or may not be equal to the values reflected above. Amounts in this column do not correspond to the actual value that will be recognized by the executive. See Note 10—Unit-Based Compensation to the financial statements included in this registration statement for additional detail regarding assumptions underlying the value of these awards. Pursuant to SEC rules, the amounts shown in the table above for the restricted stock units exclude the effect of estimated forfeitures.
In 2016, 125,000 restricted stock units were granted to each of Messrs. Leidel, Evans and Murdy, 37,500 restricted stock units were granted to Mr. Gaensbauer; and 75,000 restricted stock units were granted to each of Messrs. Chronister and O’Brien (the “2016 Awards”), all of which remained outstanding (and were the only equity awards outstanding for our non-employee directors) as of December 31, 2016.
Narrative Disclosure to Director Compensation Table
Our board of directors believes that attracting and retaining qualified non-employee directors on a going-forward basis will be critical to the future value growth and governance of our company. Our board of directors also believes that the compensation package for our non-employee directors should require a portion of the total compensation to be equity-based to align the interests of these directors with our stockholders. Following the closing of the IPO, we implemented a new non-employee director compensation program to reflect the increased time and responsibility that being the director of a publicly traded company entails. Under this new program, our non-employee directors receive the following:
· An annual retainer of $80,000;
· No board or committee meeting fees;
· Committee membership retainers of:
· $7,500 for the audit committee,
· $5,000 for the compensation committee, and
· $4,000 for the governance/audit committee;
· Committee chair retainers of:
· $20,000 for the audit committee,
· $15,000 for the compensation committee, and
· $8,000 for the governance/nominating committee;
· Annual equity grants of restricted stock units with a fair market value at grant of $130,000; and
· Lead director (if applicable) retainer of $15,000.
In order to attract and retain qualified non-employee directors to our board, our non-employee directors received initial grants of restricted stock units in lieu of the first annual grant of equity-based awards in the following amounts as reflected in the Director Compensation Table, above: 125,000 restricted stock units for Messrs. Leidel, Evans and Murdy; 37,500 restricted stock units for Mr. Gaensbauer; and 75,000 restricted stock units for each of Messrs. Chronister and O’Brien, which grants were made to Messrs. Liedel, Chronister, Gaensbauer and O’Brien following the closing of the IPO and to Messrs. Evans and Murdy upon their appointment to the board.
In connection with the IPO, all outstanding Incentive Units and RUAs were accelerated and all of Holdings’ outstanding equity interests, including the Incentive Units and the RUAs, but excluding the Series A Preferred Units (which were redeemed in connection with the IPO) and the Series B Preferred Units (which were converted into shares of our Series A Preferred Stock) were exchanged for shares of our common stock in connection with the merger of Holdings with and into us, calculated using an implied equity valuation for us based on the initial public offering price set forth on the cover of the IPO prospectus. The aggregate number of shares issued to the Existing Owners were not contingent upon the initial public offering price; however, the allocation of shares of our common stock amongst our Existing Owners, including with respect to the outstanding RUAs held by Mr. Gaensbauer and Mr. O’Brien, was determined based on the 10-day volume weighted average price of our common stock immediately following the closing of the IPO. In accordance with the above allocation mechanism, Mr. Gaensbauer and Mr. O’Brien received 40,422 and 66,935 shares of common stock, respectively, with respect to the Incentive Units and RUAs they held in Holdings.
PRINCIPAL AND SELLING STOCKHOLDERS
The shares of our common stock covered by this prospectus (the “Shares”) are to be issued by us to the selling stockholders upon conversion of our Series A Preferred Stock, including any shares of Series A Preferred Stock that may be issued pursuant to our option to pay dividends on the Series A Preferred Stock in kind pursuant to the terms of the Certificate of Designations setting forth the terms of the Series A Preferred Stock. The selling stockholders may from time to time offer and sell pursuant to this prospectus any or all of the Shares owned by them, but make no representation that any of the Shares will be offered for sale. The following table sets forth the beneficial ownership of our common stock that is currently owned by:
· each of the selling stockholders;
· each person known to us beneficially own more than 5% of any class of our outstanding common stock;
· each member of our board of directors;
· each of our named executive officers; and
· all of our directors and executive officers as a group.
For further information regarding material transactions between us and certain of our stockholders, see “Certain Relationships and Related Party Transactions.”
All information with respect to common stock ownership of the selling stockholders has been furnished by or on behalf of the selling stockholders and is as of December 1, 2016. We believe, based on information supplied by the selling stockholders, that except as may otherwise be indicated in the footnotes to the table below, the selling stockholders have sole voting and dispositive power with respect to the common stock reported as beneficially owned by them, except to the extent this power may be shared with a spouse. Because the selling stockholders identified in the table may sell some or all of the Shares owned by them which are included in this prospectus, no estimate can be given as to the number of Shares available for resale hereby that will be held by the selling stockholders upon termination of this offering. In addition, the selling stockholders may have sold, transferred or otherwise disposed of, or may sell, transfer or otherwise dispose of, at any time and from time to time, the common stock they hold in transactions exempt from the registration requirements of the Securities Act after the date on which they provided the information set forth on the table below. We have, therefore, assumed for the purposes of the following table, that the selling stockholders will sell all of the Shares beneficially owned by them that are covered by this prospectus, but will not sell any other shares of our common stock that they may presently own. The percent of beneficial ownership for the selling stockholders prior to this offering is based on 171,834,605 shares of our common stock outstanding as of the date of this prospectus.
Except as otherwise noted, the person or entities listed below have sole voting and investment power with respect to all shares of our common stock beneficially owned by them, except to the extent this power may be shared with a spouse. All information with respect to beneficial ownership has been furnished by the respective 5% or more stockholders, selling stockholders, directors, or executive officers, as the case may be. Unless otherwise noted, the mailing address of each listed beneficial owner is c/o Extraction Oil & Gas, Inc., 370 17th Street, Suite 5300, Denver, Colorado 80202.
|
|
|
Shares of Common Stock |
|
Shares of |
|
Number of Shares of Common |
|
Shares of Common Stock |
| ||||||
|
Name of Beneficial Owner |
|
Number |
|
Percentage |
|
Owned |
|
Number |
|
Percentage |
|
Number |
|
Percentage |
|
|
Selling Stockholders: |
|
|
|
|
|
|
|
|
|
|
|
|
|
|
|
|
Bronco Investments II (EQ), LLC(1) |
|
— |
|
— |
|
100,000 |
|
10,146,231 |
|
5.9 |
% |
— |
|
— |
|
|
MTP Energy Master Fund LTD(2) |
|
— |
|
— |
|
22,500 |
|
2,282,901 |
|
1.3 |
% |
— |
|
— |
|
|
MTP Energy Opportunities Fund II LLC(2) |
|
— |
|
— |
|
18,700 |
|
1,897,345 |
|
1.1 |
% |
— |
|
— |
|
|
MTP EOF II IP LLC(2) |
|
— |
|
— |
|
3,800 |
|
385,556 |
|
* |
|
— |
|
— |
|
|
Triangle Peak Partners II, LP(3) |
|
— |
|
— |
|
2,467 |
|
250,307 |
|
* |
|
— |
|
— |
|
|
TPP II Annex Fund, LP(4) |
|
— |
|
— |
|
2,533 |
|
257,004 |
|
* |
|
— |
|
— |
|
|
MSD Energy Investments Private III, LLC(5) |
|
2,829,766 |
|
1.6 |
% |
20,000 |
|
2,029,246 |
|
1.2 |
% |
2,829,766 |
|
1.5 |
% |
|
Arcadia Extraction Investors LLC(6) |
|
2,380,262 |
|
1.4 |
% |
10,000 |
|
1,014,623 |
|
* |
|
2,380,262 |
|
1.2 |
% |
|
YT Extraction Co Investment Partners, LP(7) |
|
20,340,747 |
|
11.8 |
% |
5,000 |
|
507,311 |
|
* |
|
20,340,747 |
|
10.7 |
% |
|
Gail B. Warden |
|
248,933 |
|
* |
|
150 |
|
15,219 |
|
* |
|
248,933 |
|
* |
|
|
Double D, LLC (8) |
|
218,960 |
|
* |
|
100 |
|
10,146 |
|
* |
|
218,960 |
|
* |
|
|
|
|
Shares of Common Stock |
|
Shares of |
|
Number of Shares of Common |
|
Shares of Common Stock |
| ||||||
|
Name of Beneficial Owner |
|
Number |
|
Percentage |
|
Owned |
|
Number |
|
Percentage |
|
Number |
|
Percentage |
|
|
David McMichael Berwind III |
|
15,584 |
|
* |
|
30 |
|
3,043 |
|
* |
|
15,584 |
|
* |
|
|
5% Stockholders: |
|
|
|
|
|
|
|
|
|
|
|
|
|
|
|
|
YT Extraction Co Investment Partners, LP(7) |
|
20,340,747 |
|
11.8 |
% |
5,000 |
|
507,311 |
|
* |
|
20,340,747 |
|
10.7 |
% |
|
Yorktown Energy Partners X, L.P.(9) |
|
17,554,262 |
|
10.2 |
% |
— |
|
— |
|
— |
|
17,554,262 |
|
9.2 |
% |
|
Yorktown Energy Partners IX, L.P.(10) |
|
7,700,358 |
|
4.5 |
% |
— |
|
— |
|
— |
|
7,700,358 |
|
4.0 |
% |
|
Bronco Investments (EQ), LLC(11) |
|
10,510,377 |
|
6.1 |
% |
— |
|
— |
|
— |
|
10,510,377 |
|
5.5 |
% |
|
Entities affiliated with Neuberger Berman(12) |
|
7,907,052 |
|
4.6 |
% |
— |
|
— |
|
— |
|
7,907,052 |
|
4.1 |
% |
|
BlackRock Inc.(13) |
|
8,976,850 |
|
5.2 |
% |
— |
|
— |
|
— |
|
8,976,850 |
|
4.7 |
% |
|
Named Executive Officers and Directors: |
|
|
|
|
|
|
|
|
|
|
|
|
|
|
|
|
Mark A. Erickson(14) |
|
4,158,411 |
|
2.4 |
% |
— |
|
— |
|
— |
|
4,158,411 |
|
2.2 |
% |
|
Matthew R. Owens(15) |
|
3,411,328 |
|
2.0 |
% |
— |
|
— |
|
— |
|
3,411,328 |
|
1.8 |
% |
|
Russell T. Kelley, Jr. |
|
2,871,309 |
|
1.7 |
% |
— |
|
— |
|
— |
|
2,871,309 |
|
1.5 |
% |
|
Tom L. Brock |
|
129,500 |
|
* |
|
— |
|
— |
|
— |
|
129,500 |
|
* |
|
|
John S. Gaensbauer |
|
77,922 |
|
* |
|
— |
|
— |
|
— |
|
77,922 |
|
* |
|
|
Peter A. Leidel |
|
125,000 |
|
* |
|
— |
|
— |
|
— |
|
125,000 |
|
* |
|
|
Marvin M. Chronister |
|
75,000 |
|
* |
|
— |
|
— |
|
— |
|
75,000 |
|
* |
|
|
Patrick O’Brien |
|
141,935 |
|
* |
|
— |
|
— |
|
— |
|
141,935 |
|
* |
|
|
Wayne W. Murdy |
|
125,000 |
|
* |
|
— |
|
— |
|
— |
|
125,000 |
|
* |
|
|
Donald L. Evans |
|
125,000 |
|
* |
|
— |
|
— |
|
— |
|
125,000 |
|
* |
|
|
Executive Officers and Directors as a Group (10 total): |
|
10,648,470 |
|
6.2 |
% |
— |
|
— |
|
— |
|
10,648,470 |
|
5.6 |
% |
* Less than 1%.
(1) Bronco Investments II (EQ), LLC is a Delaware limited liability company that is owned by certain investment funds affiliated with OZ Management LP (“OZ”) and OZ Management II LP (“OZII”), each a Delaware limited partnership. OZ and OZII are the principal investment managers to a number of investment funds and discretionary accounts (collectively, the “Accounts”). OZII is a wholly-owned subsidiary of OZ and, as such, OZ may be deemed to be the beneficial owner of the Units held in the Accounts managed by OZII. OZ’s sole general partner is Och-Ziff Holding Corporation (“OZHC”), a Delaware corporation, whose sole shareholder is Och-Ziff Capital Management Group LLC (“OZM”), a Delaware limited liability company. OZ is the sole member of Och-Ziff Holding II LLC (“OZHII”), a Delaware limited liability company, which serves as the general partner of OZII. The shares of common stock offered hereby are beneficially held in Accounts managed by OZ and OZII. Each of OZ, OZII, OZHC, OZHII, OZM and Daniel S. Och, in his capacity as the Chief Executive Officer of OZHC and the Chief Executive Officer, Chairman and an Executive Managing Director of OZM, may be deemed to be a beneficial owner of the Registrable Securities held by Bronco Investments II (EQ), LLC.
(2) MTP Energy Management LLC exercises voting and investment power over securities held for the accounts of MTP Energy Master Fund Ltd., MTP Energy Opportunities Fund II LLC and MTP EOF II IP LLC. Magnetar Financial LLC is the sole member of MTP Energy Management LLC, and Magnetar Capital Partners LP serves as the sole member and parent holding company of Magnetar Financial LLC. Supernova Management is the general partner of Magnetar Capital Partners LP. The manager of Supernova Management LLC is Mr. Alec Litowitz.
(3) Triangle Peak Partners II General Partner, LLC is the general partner of, and may be deemed to beneficially own securities beneficially owned by Triangle Peak Partners II, L.P. Each of Michael C. Morgan, David L. Pesikoff and Dain F. DeGroff is a manager of, and may be deemed to beneficially own securities beneficially owned by Triangle Peak Partners II General Partner, LLC.
(4) Triangle Peak Partners II General Partner, LLC is the general partner of, and may be deemed to beneficially own securities beneficially owned by TPP II Annex Fund, LP. Each of Michael C. Morgan, David L. Pesikoff and Dain F. DeGroff is a manager of, and may be deemed to beneficially own securities beneficially owned by Triangle Peak Partners II General Partner, LLC.
(5) MSD Capital, L.P., a Delaware limited partnership (“MSD Capital”) is the sole manager of, and may be deemed to beneficially own securities beneficially owned by, MSD Energy Investments Private III, LLC. MSD Capital Management LLC, a Delaware limited liability company (“MSD Capital Management”), is the general partner of, and may be deemed to beneficially own securities beneficially owned by, MSD Capital. Michael S. Dell is the controlling member of, and may be deemed to beneficially own securities beneficially owned by, MSD Capital Management. Each of Glenn R. Fuhrman, John C. Phelan and Marc R. Lisker is a manager of, and may be deemed to beneficially own securities beneficially owned by, MSD Capital Management.
(6) Each of Kammy Moalemzadeh and Joshua Nabatian is a manager of, and may be deemed to beneficially own securities beneficially owned by, Arcadia Extraction Investors LLC.
(7) YT Extraction Company LP is the sole general partner of YT Extraction Co Investment Partners, LP. YT Extraction Associates LLC is the sole general partner of YT Extraction Company LP. As a result, YT Extraction Associates LLC may be deemed to share the power to vote or direct the vote or to dispose or direct the disposition of the common stock owned by
YT Extraction Co Investment Partners, LP. YT Extraction Company LP and YT Extraction Associates LLC disclaim beneficial ownership of the common stock held by YT Extraction Co Investment Partners, LP in excess of their pecuniary interest therein. Peter A. Leidel is a manager of YT Extraction Associates LLC. Mr. Leidel disclaims beneficial ownership of the common stock held by YT Extraction Co Investment Partners, LP.
(8) Each of D. Michael Berwind Jr. and Carol Berwind is a manager of, and may be deemed to beneficially own securities beneficially owned by, Double D, LLC.
(9) Yorktown X Company LP is the sole general partner of Yorktown Energy Partners X, L.P. Yorktown X Associates LLC is the sole general partner of Yorktown X Company LP. As a result, Yorktown X Associates LLC may be deemed to share the power to vote or direct the vote or to dispose or direct the disposition of the common stock owned by Yorktown Energy Partners X, L.P. Yorktown X Company LP and Yorktown X Associates LLC disclaim beneficial ownership of the common stock held by Yorktown Energy Partners X, L.P. in excess of their pecuniary interest therein. Mr. Leidel is a manager of Yorktown X Associates LLC. Me. Leidel disclaims beneficial ownership of the common stock held by Yorktown Energy Partners X, L.P.
(10) Yorktown IX Company LP is the sole general partner of Yorktown Energy Partners IX, L.P. Yorktown IX Associates LLC is the sole general partner of Yorktown IX Company LP. As a result, Yorktown IX Associates LLC may be deemed to share the power to vote or direct the vote or to dispose or direct the disposition of the common stock owned by Yorktown Energy Partners IX, L.P. Yorktown IX Company LP and Yorktown IX Associates LLC disclaim beneficial ownership of the common stock held by Yorktown Energy Partners IX, L.P. in excess of their pecuniary interest therein. Mr. Leidel is a manager of Yorktown IX Associates LLC. Mr. Leidel disclaims beneficial ownership of the common stock held by Yorktown Energy Partners IX, L.P.
(11) Bronco Investments (EQ), LLC is a Delaware limited liability company that is owned by certain investment funds affiliated with OZ Management LP, a Delaware limited partnership (“OZ Management”). OZ Management’s sole general partner is Och-Ziff Holding Corporation (“OZHC”), a Delaware corporation, whose sole shareholder is Och-Ziff Capital Management Group LLC (“OZM”), a Delaware limited liability company. Each of OZ Management, OZHC, OZM and Daniel S. Och, in his capacity as the Chief Executive Officer of OZHC and the Chief Executive Officer, Chairman and an Executive Managing Director of OZM, may be deemed to be a beneficial owner of the common stock held by Bronco Investments (EQ), LLC. The address for Bronco Investments (EQ), LLC is 9 West 57th Street, 39th Floor, New York, New York 10019.
(12) Consists of:
(a) 988,374 shares of common stock held by NB PEP Holdings Limited (“NB PEP”), the General Partner of which is NB Private Equity Credit Opportunities Associates LP, which, pursuant to an investment advisory agreement, has delegated investment advisory authority to NB Alternatives Advisers LLC (“NBAA”); NBAA has appointed an investment committee composed of the following individuals: Anthony D. Tutrone, Michael S. Kramer, Susan Kasser and David Lyon, to make investment decisions for NB PEP, which have shared voting and dispositive power over the shares held by NB PEP;
(b) 418,359 shares of common stock held by NB Crossroads XX- MC Holdings LP (“Crossroads XX”), the General Partner of which is NB Crossroads Fund XX GP LLC, which, pursuant to an investment advisory agreement, has delegated investment advisory authority to NBAA; NBAA has appointed an investment committee composed of the following individuals: John P. Buser, John H. Massey, Joana P. Rocha, Jonathan D. Shofet, Brien P. Smith, David S. Stonberg, Anthony D. Tutrone and Peter J. Von Lehe, to make investment decisions for Crossroads XX, which have shared voting and dispositive power over the shares held by Crossroads XX;
(c) 209,179 shares of common stock held by NB Sauger Fund Limited Partnership (“Sauger”), the General Partner of which is NB Sauger Fund GP LLC, which, pursuant to an investment advisory agreement, has delegated investment advisory authority to NBAA; NBAA has appointed an investment committee composed of the following individuals: John P. Buser, Jonathan D. Shofet, Brien P. Smith, Joana P. Rocha, Peter J. von Lehe, John H. Massey, Anthony D. Tutrone and David S. Stonberg, to make investment decisions for Sauger, which have shared voting and dispositive power over the shares held by Sauger;
(d) 5,647,914 shares of common stock held by NBSCIP II Extraction Holdings (“NBSCIP”), the General Partner of which is Strategic Co-Investment Associates II LP, which, pursuant to an investment advisory agreement, has delegated investment advisory authority to NBAA; NBAA has appointed an investment committee composed of the following individuals: John P. Buser, Michael S. Kramer, John H. Massey, David H. Morse, Brien P. Smith, David S. Stonberg, Brian G. Talbot, Anthony D. Tutrone and Peter J. von Lehe, to make investment decisions for NBSCIP, which have shared voting and dispositive power over the shares held by NBSCIP; and
(e) 643,226 shares of common stock held by NB SOF III Holdings LP (“NB SOF III”), the General Partner of which is NB Secondary Opportunities Associates III LP, which, pursuant to an investment advisory agreement, has delegated investment advisory authority to NBAA; NBAA has appointed an investment committee composed of the following individuals: John P. Buser, Ethan Falkove, Tristram Perkins, David S. Stonberg, Brian G. Talbot and Anthony D.
Tutrone, to make investment decisions for NB SOF III, which have shared voting and dispositive power over the shares held by NB SOF III.
Each of Neuberger Berman, the ultimate owner of each general partner of the above-referenced funds, NBAA and each member of the corresponding investment committee expressly disclaims beneficial ownership of all shares held by the applicable fund. The address of such funds, such investment adviser subsidiaries and the ultimate parent holding company, Neuberger Berman, is 605 3rd Avenue, New York, NY 10158, USA.
(13) The registered holders of the referenced shares are: (a) 2,438,801 shares of common stock in the Company held by SBC Master Pension Trust, (b) 1,893,858 shares of common stock in the Company held by Red River Direct Investment Fund II, L.P., (c) 473,464 shares of common stock in the Company held by BR/ERB Co-Investment Fund II, L.P., (d) 468,776 shares of common stock in the Company held by BlackRock Private Opportunities Fund III, L.P., (e) 506,839 shares of common stock in the Company held by The Lincoln National Life Insurance Company, (f) 274,206 shares of common stock in the Company held by BlackRock Private Equity Onshore Holdings IV, L.P., (g) 83,997 shares of common stock in the Company held by Vesey Street Employee Fund IV, L.P., (h) 116,712 shares of common stock in the Company held by Vesey Street Fund V, L.P., (i) 71,819 shares of common stock in the Company held by Vesey Street Fund V-M, L.P., (j) 917,529 shares of common stock in the Company held by Orange PEP Fund, L.P., (k) 417,017 shares of common stock in the Company held by NHRS Private Opportunities Fund, L.P., (l) 91,752 shares of common stock in the Company held by OV Private Opportunities, L.P., (m) 41,701 shares of common stock in the Company held by The Equity-Broadway League Private Equity Fund I, L.P., (n) 14,885 shares of common stock in the Company held by Arthur Street Fund IV, L.P., (o) 9,805 shares of common stock in the Company held by Vesey Street Fund IV, L.P., (p) 28,357 shares of common stock in the Company held by Special Credit Opportunities—Series A, a series of Special Credit Opportunities, L.P., (q) 11,480 shares of common stock in the Company held by Special Credit Opportunities—Series B, a series of Special Credit Opportunities, L.P., (r) 365,852 shares of common stock in the Company held by Special Credit Opportunities—Series C, a series of Special Credit Opportunities, L.P., (s) 385,359 shares of common stock in the Company held by BlackRock Credit Alpha Master Fund, L.P., (t) 132,597 shares of common stock in the Company held by CA 534 Offshore Fund, L.P., (u) 41,436 shares of common stock in the Company held by BlackRock Multi-Strategy Master Fund Limited, and (v) 190,608 shares of common stock in the Company held by The Obsidian Master Fund. Each of the foregoing registered holders is a fund or account managed by investment adviser subsidiaries of BlackRock, Inc. BlackRock, Inc. is the ultimate parent holding company of such investment adviser entities. On behalf of such investment adviser entities, Jay Park, Sacha Bacro, and David Trucano, respectively as a managing directors of such entities, have voting and investment power over the shares held by the foregoing funds and accounts which are the registered holders of the referenced shares and units. Jay Park, Sacha Bacro, and David Trucano expressly disclaim beneficial ownership of all shares and units held by such funds and accounts. The address of such funds and accounts, such investment adviser subsidiaries and Jay Park is 1 University Square Drive, Princeton, NJ 08540 and the address of such funds and accounts, such investment adviser subsidiaries and Sasha Bacro and David Trucano is 55 East 52nd Street, New York, NY 10055.
(14) Includes 271,956 shares of common stock held by Jane M. Erickson, 2,046,449 shares of common stock held by MAE Investment Properties 2016, LLC, 271,957 shares of common stock held by JME Investment Properties 2016, LLC and 81 shares of common stock held by MAE Holdings 2011 LLC. Mr. Erickson has voting and dispositive power over these shares but disclaims beneficial ownership over these shares in excess of his pecuniary interest in these shares. MAE Investment Properties 2016, LLC and MAE Holdings 2011 LLC are entities owned by Mr. Erickson.
(15) Includes 1,944,898 shares of common stock held by OFI Properties LLC. Mr. Owens has voting and dispositive power over these shares but disclaims beneficial ownership over these shares in excess of his pecuniary interest in these shares. OFI Properties LLC is an entity owned by Mr. Owens.
CERTAIN RELATIONSHIPS AND RELATED PARTY TRANSACTIONS
Review, Approval or Ratification of Transactions with Related Persons
A “Related Party Transaction” is a transaction, arrangement or relationship in which we or any of our future subsidiaries was, is or will be a participant, the amount of which involved exceeds $120,000, and in which any Related Person had, has or will have a direct or indirect material interest. A “Related Person” means:
· any person who is, or at any time during the applicable period was, one of our executive officers or one of our directors;
· any person who is known by us to be the beneficial owner of more than 5% of our common stock;
· any immediate family member of any of the foregoing persons, which means any child, stepchild, parent, stepparent, spouse, sibling, mother-in-law, father-in-law, son-in-law, daughter-in-law, brother-in-law or sister-in-law of a director, executive officer or a beneficial owner of more than 5% of our common stock, and any person (other than a tenant or employee) sharing the household of such director, executive officer or beneficial owner of more than 5% of our common stock; and
· any firm, corporation or other entity in which any of the foregoing persons is a partner or principal or in a similar position or in which such person has a 10% or greater beneficial ownership interest.
Our board of directors adopted a written related party transactions policy in connection with the IPO. Pursuant to this policy, our audit committee will review all material facts of all Related Party Transactions.
Historical Transactions with Affiliates
Equity Redemption
On September 13, 2016, Holdings redeemed 1,195,472 units from two of our executive officers, with an aggregate value of approximately $7.8 million. On that same date, the executive officers used $5.6 million of the redemption value to settle in full and terminate their obligations under the promissory notes described below, including interest thereon.
Promissory Notes
In May 2014, Holdings received full recourse promissory notes from two of our executive officers under which Holdings advanced $5.4 million to the executive officers to meet their capital contributions. The promissory notes are due on May 29, 2021, or earlier in the event of termination or certain change in control events as stipulated in the individual promissory notes and any distributions of capital contributions are considered mandatory prepayments. The promissory notes have a stated interest rate of LIBOR plus 1% per annum. The promissory notes are recorded as a reduction of members’ equity. On September 13, 2016, the promissory notes were repaid in full and all obligations thereunder were terminated.
Second Lien Notes
Several lenders of our previously outstanding second lien notes (the “Second Lien Notes”) also hold equity in us. Of the $430.0 million formerly outstanding on the Second Lien Notes as of June 30, 2016, such equityholding lenders held approximately $311.7 million. A portion of the proceeds of the 2016 Notes Offering was used to repay all of the outstanding borrowings and related premium, fees and expenses under our Second Lien Notes and terminate such notes.
2021 Notes
Several of our equity holders are also owners of the 2021 Notes. As of the initial issuance of the $550.0 million principal amount on the Senior Notes, equity holders held approximately $168.5
Repurchase of Units
In May 2016, we repurchased 143,183 units from Keith Doss, our former Chief Accounting Officer, for $3.25 per unit for an aggregate purchase price of approximately $0.5 million. Mr. Doss retired from his role as our Chief Accounting Officer in May 2016.
Series A Preferred Units
On October 3, 2016, we issued to affiliates of Apollo Capital Management $75.0 million in Series A Preferred Units to fund a portion of the purchase price for the Bayswater Acquisition. The Series A Preferred Units were entitled to receive a cash dividend of 10% per year, payable quarterly in arrears. Upon consummation of the IPO, we used proceeds from the IPO to redeem the Series A Preferred Units in full.
Series B Preferred Units
We issued an aggregate of $185.3 million of the Series B Preferred Units to fund a portion of the purchase price for the Bayswater Acquisition. Investment funds affiliated with OZ Management LP and Yorktown, which each hold greater than 5% of our equity interests, purchased $100.0 million and $5.0 million, respectively, of the Series B Preferred Units and other investors purchased the remaining amount. The Series B Preferred Units were entitled to receive a cash dividend of 10% per year, payable quarterly in arrears, and we had the ability to pay up to 50% of the quarterly dividend in kind. The Series B Preferred Units were converted in connection with the closing of the IPO into 185,280 shares of Series A Preferred Stock that are entitled to receive a cash dividend of 5.875% per year, payable quarterly in arrears, and we have the ability to pay such quarterly dividends in kind at a dividend rate of 10% (decreased proportionately to the extent such quarterly dividends are paid in cash).
Private Placement of Common Stock
On December 15, 2016, we issued 25,041,041 shares of common stock, at a price of $18.25 per share, in connection with the Private Placement. Entities affiliated with BlackRock Inc. and Fidelity Investments purchased an aggregate of 750,000 and 1,753,370 shares of common stock, respectively, for an aggregate purchase price of $13,687,500 and $31,999,002.50, respectively.
Existing Owners Registration Rights Agreement
In connection with the closing of the IPO, we entered into a registration rights agreement (the “Existing Owners Registration Rights Agreement”) with Yorktown’s funds and certain of our existing equity holders. The Existing Owners Registration Rights Agreement provides for customary rights for these stockholders to demand that we file a resale shelf registration statement and certain piggyback rights in connection with the registration of securities. In addition, the agreement grants these stockholders customary rights to participate in certain underwritten offerings of our common stock that we may conduct.
Demand Rights
Subject to certain limitations, the equity holders party to the Existing Owners Registration Rights Agreement have the right to require us by written notice to prepare and file a registration statement registering the offer and sale of a certain number of their shares of our common stock. We are required to provide notice of the request to certain other holders of our common stock who may, in certain circumstances, participate in the registration. Subject to certain exceptions, we will not be obligated to effect a demand registration (i) on or before the date that is twelve months after the closing of the IPO, (ii) on or before 180 days after any other registered underwritten offering of our equity securities, or (iii) if we are not otherwise eligible at such time to file a registration statement on Form S-3 (or any applicable successor form).
Piggyback Rights
Subject to certain exceptions, if at any time we propose to register an offering of equity securities or conduct an underwritten offering, whether or not for our own account and subject to the ability of the holders of 75% of the shares to waive such a right, then we must notify the equity holders party to the Existing Owners Registration Rights Agreement of such proposal to allow them to include a specified number of their shares of our common stock in that registration statement or underwritten offering, as applicable.
Conditions and Limitations; Expenses
These registration rights are subject to certain conditions and limitations, including the right of the underwriters to limit the number of shares to be included in a registration and our right to delay a registration statement under certain circumstances. We will generally pay all registration expenses in connection with our obligations under the Existing Owners Registration Rights Agreement, regardless of whether a registration statement is filed or becomes effective.
Series A Preferred Registration Rights Agreement
In connection with the sale of the Series B Preferred Units, we entered into a Registration Rights Agreement with the Series A Preferred Holders (the “Registration Rights Agreement”) pursuant to which we agreed to file this shelf registration statement within 45 days of the closing of the IPO registering the sale of the shares of common stock issuable upon conversion of the Series A Preferred Stock. Additionally, subject to certain exceptions and limitations, the Series A Preferred Holders will have certain piggyback rights under such agreement, which will allow the holders the option to include a specified number of shares of common stock they receive following the conversion of their Series A Preferred Stock in any underwritten offering of our equity securities.
Private Placement Registration Rights Agreement
In connection with the closing of the Private Placement, we and the purchasers entered into a Registration Rights Agreement, dated December 15, 2016 (the “Private Placement Registration Rights Agreement”). Pursuant to the Private Placement Registration Rights Agreement, we agreed to (i) file a Registration Statement on Form S-1 with the SEC no later than 30 days following the closing of the Private Placement (such filing date, the “Mandatory Shelf Filing Date”) to register the shares sold in the Private Placement; provided, however, that if we have filed the registration statement on Form S-1 and subsequently becomes eligible to use Form S-3, we may elect, in our sole discretion, to (A) file a post-effective amendment to the registration statement converting such registration statement on Form S-1 to a registration statement on Form S-3 or (B) withdraw the registration statement on Form S-1 and file a registration statement on Form S-3; (ii) use our commercially reasonable efforts to cause such resale registration statement to be declared effective under the Securities Act by the Commission as soon as reasonably practicable after the Mandatory Shelf Filing Date; and (iii) use our commercially reasonable efforts to keep the registration statement continuously effective under the Securities Act until the earlier of (A) the date when all of the shares covered by such registration statement have been sold, and (B) the date on which all of the purchased shares cease to be registrable securities under the Private Placement Registration Rights Agreement.
The authorized capital stock of Extraction Oil & Gas, Inc. consists of 900,000,000 shares of common stock, $0.01 par value per share, of which 171,834,605 shares are issued and outstanding, and 50,000,000 shares of preferred stock, $0.01 par value per share, of which 185,280 shares of Series A Preferred Stock are issued and outstanding.
The following summary of the capital stock and certificate of incorporation and bylaws of Extraction Oil & Gas, Inc. does not purport to be complete and is qualified in its entirety by reference to the provisions of applicable law and to our certificate of incorporation and bylaws, which are filed as exhibits to the registration statement of which this prospectus is a part.
Common Stock
Except as provided by law or in a preferred stock designation, holders of common stock are entitled to one vote for each share held of record on all matters submitted to a vote of the stockholders, will have the exclusive right to vote for the election of directors and do not have cumulative voting rights. Except as otherwise required by law, holders of common stock are not entitled to vote on any amendment to the certificate of incorporation (including any certificate of designations relating to any series of preferred stock) that relates solely to the terms of any outstanding series of preferred stock if the holders of such affected series are entitled, either separately or together with the holders of one or more other such series, to vote thereon pursuant to the certificate of incorporation (including any certificate of designations relating to any series of preferred stock) or pursuant to the DGCL. Subject to prior rights and preferences that may be applicable to any outstanding shares or series of preferred stock, holders of common stock are entitled to receive ratably in proportion to the shares of common stock held by them such dividends (payable in cash, stock or otherwise), if any, as may be declared from time to time by our board of directors out of funds legally available for dividend payments. All outstanding shares of common stock are fully paid and non-assessable. The holders of common stock have no preferences or rights of conversion, exchange, pre-emption or other subscription rights. There are no redemption or sinking fund provisions applicable to the common stock. In the event of any voluntary or involuntary liquidation, dissolution or winding-up of our affairs, holders of common stock will be entitled to share ratably in our assets in proportion to the shares of common stock held by then that are remaining after payment or provision for payment of all of our debts and obligations and after distribution in full of preferential amounts to be distributed to holders of outstanding shares of preferred stock, if any.
Preferred Stock
Our certificate of incorporation authorizes our board of directors, subject to any limitations prescribed by law, without further stockholder approval, to establish and to issue from time to time one or more classes or series of preferred stock, par value $0.01 per share, covering up to an aggregate of 50,000,000 shares of preferred stock. Each class or series of preferred stock will cover the number of shares and will have the powers, preferences, rights, qualifications, limitations and restrictions determined by the board of directors, which may include, among others, dividend rights, liquidation preferences, voting rights, conversion rights, preemptive rights and redemption rights. Except as provided by law or in a preferred stock designation, the holders of preferred stock will not be entitled to vote at or receive notice of any meeting of stockholders.
Series A Preferred Stock
In connection with the consummation of the IPO, we issued 185,280 shares of our Series A Preferred Stock to the holders of Holdings’ Series B Preferred Units in conversion of such units. The Series A Preferred Stock is entitled to receive a cash dividend of 5.875% per year, payable quarterly in arrears, and we have the ability to pay such quarterly dividends in kind at a dividend rate of 10% per year (decreased proportionately to the extent such quarterly dividends are paid in cash). Beginning on or after the later of (a) 90 days after the closing of the IPO and (b) the Lock-Up Period End Date, the Series A Preferred Stock will be convertible into shares of our common stock at the election of the Series A Preferred Holders at a conversion ratio per share of Series A Preferred Stock of 61.9195. During the term beginning on the Lock-Up Period End Date until 18 months after the closing of the IPO, we may elect to convert the Series A Preferred Stock at a conversion ratio per share of Series A Preferred Stock of 61.9195, but only if the closing price of our common stock trades at a 20% premium to our initial offering price for 20 of the 30 trading days immediately prior to such conversion, including the trading day immediately prior to such
conversion. During the term beginning 18 months after the closing of the IPO until 36 months after the closing of the IPO, we may elect to convert the Series A Preferred Stock at a conversion ratio per share of Series A Preferred Stock of 61.9195, but only if the closing price of our common stock trades at a 15% premium to our initial offering price for 20 of the 30 trading days immediately prior to such conversion, including the trading day immediately prior to such conversion. In the event that any shares of Series A Preferred Stock are converted within the first year after the closing of the IPO, the common stock issued upon such conversion will be subject to a 60-day lock-up period, which will end upon the earlier of the expiration of the 60-day period and the one-year anniversary of the closing of the IPO.
Upon a change of control, subject to the Series A Preferred Holders’ conversion right, the Series A Preferred Stock may be redeemed for cash in amount equal to the greater of (i) 135% of the liquidation preference of the Series A Preferred Stock and (ii) a 17.5% annualized internal rate of return on the liquidation preference of the Series A Preferred Stock; provided however, that if the change of control event occurs after 36 months after the closing of the IPO, the Series A Preferred Stock may be redeemed for cash in an amount equal to the liquidation preference. The Series A Preferred Stock matures on October 15, 2021, at which time they are mandatorily redeemable for cash at the liquidation preference.
Anti-Takeover Effects of Provisions of Our Certificate of Incorporation, our Bylaws and Delaware Law
Some provisions of Delaware law, our certificate of incorporation and our bylaws will contain provisions that could make the following transactions more difficult: acquisitions of us by means of a tender offer, a proxy contest or otherwise; or removal of our incumbent officers and directors. These provisions may also have the effect of preventing changes in our management. It is possible that these provisions could make it more difficult to accomplish or could deter transactions that stockholders may otherwise consider to be in their best interest or in our best interests, including transactions that might result in a premium over the market price for our shares.
These provisions are expected to discourage coercive takeover practices and inadequate takeover bids. These provisions are also designed to encourage persons seeking to acquire control of us to first negotiate with us. We believe that the benefits of increased protection and our potential ability to negotiate with the proponent of an unfriendly or unsolicited proposal to acquire or restructure us outweigh the disadvantages of discouraging these proposals because, among other things, negotiation of these proposals could result in an improvement of their terms.
Delaware Law
Section 203 of the DGCL prohibits a Delaware corporation, including those whose securities are listed for trading on the NASDAQ, from engaging in any business combination with any interested stockholder for a period of three years following the date that the stockholder became an interested stockholder, unless:
· the transaction is approved by the board of directors before the date the interested stockholder attained that status;
· upon consummation of the transaction that resulted in the stockholder becoming an interested stockholder, the interested stockholder owned at least 85% of the voting stock of the corporation outstanding at the time the transaction commenced; or
· on or after such time the business combination is approved by the board of directors and authorized at a meeting of stockholders by at least two-thirds of the outstanding voting stock that is not owned by the interested stockholder.
We have elected to not be subject to the provisions of Section 203 of the DGCL.
Certificate of Incorporation and Bylaws
Provisions of our certificate of incorporation and bylaws may delay or discourage transactions involving an actual or potential change in control or change in our management, including transactions in which stockholders might otherwise receive a premium for their shares, or transactions that our stockholders might otherwise deem to be in their best interests. Therefore, these provisions could adversely affect the price of our common stock.
Among other things, our certificate of incorporation and bylaws:
· establish advance notice procedures with regard to stockholder proposals relating to the nomination of candidates for election as directors or new business to be brought before meetings of our stockholders. These procedures provide that notice of stockholder proposals must be timely given in writing to our corporate secretary prior to the meeting at which the action is to be taken. Generally, to be timely, notice must be received at our principal executive offices not less than 90 days nor more than 120 days prior to the first anniversary date of the annual meeting for the preceding year. Our bylaws specify the requirements as to form and content of all stockholders’ notices. These requirements may preclude stockholders from bringing matters before the stockholders at an annual or special meeting;
· provide our board of directors the ability to authorize undesignated preferred stock. This ability makes it possible for our board of directors to issue, without stockholder approval, preferred stock with voting or other rights or preferences that could impede the success of any attempt to change control of us. These and other provisions may have the effect of deferring hostile takeovers or delaying changes in control or management of our company;
· provide that subject to the rights of the holders of any series of preferred stock to elect directors under specified circumstances, the authorized number of directors may be changed only by resolution of the board of directors;
· provide that all vacancies, including newly created directorships, may, except as otherwise required by law or, if applicable, the rights of holders of a series of preferred stock, be filled by the affirmative vote of a majority of directors then in office, even if less than a quorum;
· provide that any action required or permitted to be taken by the stockholders must be effected at a duly called annual or special meeting of stockholders and may not be effected by any consent in writing in lieu of a meeting of such stockholders, subject to the rights of the holders of any series of preferred stock with respect to such series;
· provide our certificate of incorporation and bylaws may be amended by the affirmative vote of the holders of at least two-thirds of our then outstanding common stock;
· provide that special meetings of our stockholders may only be called by the board of directors (pursuant to a resolution adopted by a majority of the board), the chief executive officer or the chairman of the board;
· provide for our board of directors to be divided into three classes of directors, with each class as nearly equal in number as possible, serving staggered three year terms, other than directors which may be elected by holders of preferred stock, if any. This system of electing and removing directors may tend to discourage a third party from making a tender offer or otherwise attempting to obtain control of us, because it generally makes it more difficult for stockholders to replace a majority of the directors;
· provide that we renounce any interest in the business opportunities of (i) Yorktown or any of its officers, directors, employees, partners, affiliates and (ii) any portfolio company in which such entities or persons have an equity interest (other than us and our subsidiaries) (other than our directors that are presented business opportunities in their capacity as our directors) and that they have no obligation to offer us those investments or opportunities; and
· provide that our bylaws can be amended or repealed at any regular or special meeting of stockholders or by the board of directors.
Forum Selection
Our certificate of incorporation provides that unless we consent in writing to the selection of an alternative forum, the Court of Chancery of the State of Delaware will, to the fullest extent permitted by applicable law, be the sole and exclusive forum for:
· any derivative action or proceeding brought on our behalf;
· any action asserting a claim for a breach of a fiduciary duty owed by any of our directors, officers, employees or agents to us or our stockholders;
· any action asserting a claim against us arising pursuant to any provision of the DGCL, our certificate of incorporation or our bylaws; or
· any action asserting a claim against us that is governed by the internal affairs doctrine, in each such case subject to such Court of Chancery having personal jurisdiction over the indispensable parties named as defendants therein.
Our certificate of incorporation also provides that any person or entity purchasing or otherwise acquiring any interest in shares of our capital stock will be deemed to have notice of and to have consented to this forum selection provision. However, it is possible that a court could find our forum selection provision to be inapplicable or unenforceable.
Limitation of Liability and Indemnification Matters
Our bylaws limit the liability of our directors for monetary damages for breach of their fiduciary duty as directors, except for liability that cannot be eliminated under the DGCL. Delaware law provides that directors of a company will not be personally liable for monetary damages for breach of their fiduciary duty as directors, except for liabilities:
· for any breach of their duty of loyalty to us or our stockholders;
· for acts or omissions not in good faith or which involve intentional misconduct or a knowing violation of law;
· for unlawful payment of dividend or unlawful stock repurchase or redemption, as provided under Section 174 of the DGCL; or
· for any transaction from which the director derived an improper personal benefit.
Any amendment, repeal or modification of these provisions will be prospective only and would not affect any limitation on liability of a director for acts or omissions that occurred prior to any such amendment, repeal or modification.
Our bylaws also provide that we will indemnify our directors and officers to the fullest extent permitted by Delaware law. Our bylaws also permit us to purchase insurance on behalf of any officer, director, employee or other agent for any liability arising out of that person’s actions as our officer, director, employee or agent, regardless of whether Delaware law would permit indemnification. We have entered into indemnification agreements with each of our current and future directors and officers. These agreements require us to indemnify these individuals to the fullest extent permitted under Delaware law against liability that may arise by reason of their service to us, and to advance expenses incurred as a result of any proceeding against them as to which they could be indemnified. We believe that the limitation of liability provision in our bylaws and the indemnification agreements will facilitate our ability to continue to attract and retain qualified individuals to serve as directors and officers.
Transfer Agent and Registrar
The transfer agent and registrar for our common stock is American Stock Transfer & Trust Company, LLC.
Listing
Our common stock currently trades on the NASDAQ under the symbol “XOG.”
SHARES ELIGIBLE FOR FUTURE SALE
Prior to the IPO, there had been no public market for our common stock. Future sales of our common stock in the public market, or the availability of such shares for sale in the public market, could adversely affect the market price of our common stock prevailing from time to time. As described below, only a limited number of shares were available for sale shortly after our IPO due to contractual and legal restrictions on resale. Nevertheless, sales of a substantial number of shares of our common stock in the public market after such restrictions lapse, or the perception that those sales may occur, could adversely affect the prevailing market price of our common stock at such time and our ability to raise equity-related capital at a time and price we deem appropriate.
Sales of Restricted Shares
After accounting for the shares issued in the Private Placement, we have outstanding an aggregate of 171,834,605 shares of common stock. Of these shares, all of the 38,333,333 shares of common stock sold in the IPO are freely tradable without restriction or further registration under the Securities Act, unless the shares are held by any of our “affiliates” as such term is defined in Rule 144 under the Securities Act. All remaining shares of common stock are deemed “restricted securities” as such term is defined under Rule 144. The restricted securities were, or will be, issued and sold by us in private transactions and are eligible for public sale only if registered under the Securities Act or if they qualify for an exemption from registration under Rule 144 or Rule 701 under the Securities Act, which rules are summarized below.
In addition, in connection with the consummation of the IPO, we issued 185,280 shares of our Series A Preferred Stock to the holders of Holdings’ Series B Preferred Units in conversion of such units. Beginning on or after the later of (a) 90 days after the closing of the IPO and (b) the Lock-Up Period End Date, the Series A Preferred Stock will be convertible into shares of our common stock at the election of the Series A Preferred Holders at a conversion ratio per share of Series A Preferred Stock of 61.9195. During the term beginning on the Lock-Up Period End Date until 18 months after the closing of the IPO, we may elect to convert the Series A Preferred Stock at a conversion ratio per share of Series A Preferred Stock of 61.9195, but only if the closing price of our common stock trades at a 20% premium to our initial offering price for 20 of the 30 trading days immediately prior to such conversion, including the trading day immediately prior to such conversion. During the term beginning 18 months after the closing of the IPO until 36 months after the closing of the IPO, we may elect to convert the Series A Preferred Stock at a conversion ratio per share of Series A Preferred Stock of 61.9195, but only if the closing price of our common stock trades at a 15% premium to our initial offering price for 20 of the 30 trading days immediately prior to such conversion, including the trading day immediately prior to such conversion. In the event that any shares of Series A Preferred Stock are converted within the first year after the closing of the IPO, the common stock issued upon such conversion will be subject to a 60-day lock-up period, which will end upon the earlier of the expiration of the 60-day period and the one-year anniversary of the closing of the IPO. The Series A Preferred Holders hold 185,280 shares of Series A Preferred Stock, all of which will be convertible into 11,472,442 shares of our common stock (or 18,798,932 shares of our common stock if we elect to pay all dividends in kind with respect to the Series A Preferred Stock from the date of issuance through the maturity date at October 15, 2021). See “Description of Capital Stock—Preferred Stock—Series A Preferred Stock.” The shares of common stock we issue upon such conversions would be “restricted securities” as defined in Rule 144 described below. See “Certain Relationships and Related Party Transactions—Series A Preferred Registration Rights Agreement.”
On December 15, 2016, we issued 25,041,041 shares of common stock, at a price of $18.25 per share, in connection with the Private Placement.
As a result of the lock-up agreements described below and the provisions of Rule 144 and Rule 701 under the Securities Act, the shares of our common stock (excluding the shares to be sold in the IPO) that are available for sale in the public market are as follows:
· no shares will be eligible for sale prior to 180 days after the date of the IPO prospectus; and
· 87,898,302 shares will be eligible for sale upon the expiration of the lock-up agreements beginning 180 days after the date of the IPO prospectus and when permitted under Rule 144 or Rule 701.
Lock-up Agreements
We and all of our directors and executive officers and certain of our stockholders agreed not to sell any common stock or securities convertible into or exchangeable for shares of common stock for a period of 180 days from the date of the IPO prospectus, subject to certain exceptions.
Rule 144
In general, under Rule 144 under the Securities Act as currently in effect, a person (or persons whose shares are aggregated) who is not deemed to have been an affiliate of ours at any time during the three months preceding a sale, and who has beneficially owned restricted securities within the meaning of Rule 144 for a least six months (including any period of consecutive ownership of preceding non-affiliated holders) would be entitled to sell those shares, subject only to the availability of current public information about us. A non-affiliated person who has beneficially owned restricted securities within the meaning of Rule 144 for at least one year would be entitled to sell those shares without regard to the provisions of Rule 144.
A person (or persons whose shares are aggregated) who is deemed to be an affiliate of ours and who has beneficially owned restricted securities within the meaning of Rule 144 for at least six months would be entitled to sell within any three-month period a number of shares that does not exceed the greater of one percent of the then outstanding shares of our common stock or the average weekly trading volume of our common stock reported through the NASDAQ during the four calendar weeks preceding the filing of notice of the sale. Such sales are also subject to certain manner of sale provisions, notice requirements and the availability of current public information about us.
Rule 701
In general, under Rule 701 under the Securities Act, any of our employees, directors, officers, consultants or advisors who purchases shares from us in connection with a compensatory stock or option plan or other written agreement before the effective date of the IPO prospectus is entitled to sell such shares 90 days after the effective date of the IPO prospectus in reliance on Rule 144, without having to comply with the holding period requirement of Rule 144 and, in the case of non-affiliates, without having to comply with the public information, volume limitation or notice filing provisions of Rule 144. The SEC has indicated that Rule 701 will apply to typical stock options granted by an issuer before it becomes subject to the reporting requirements of the Exchange Act, along with the shares acquired upon exercise of such options, including exercises after the date of the IPO prospectus.
Stock Issued Under Employee Plans
We previously filed a registration statement on Form S-8 under the Securities Act to register 23,000,000 shares of common stock issuable under our LTIP. Accordingly, shares registered under such registration statement became available for sale in the open market following the effective date, except for those shares that are subject to vesting restrictions with us, Rule 144 restrictions applicable to our affiliates or the lock-up restrictions described above.
Registration Rights
Existing Owners Registration Rights Agreement
In connection with the closing of the IPO, we entered into the Existing Owners Registration Rights Agreement with Yorktown’s funds and certain of our existing equity holders. The Existing Owners Registration Rights Agreement provides for customary rights for these stockholders to demand that we file this shelf registration statement and certain piggyback rights in connection with the registration of securities. In addition, the agreement grants these stockholders customary rights to participate in certain underwritten offerings of our common stock that we may conduct.
Demand Rights
Subject to certain limitations, the equity holders party to the Existing Owners Registration Rights Agreement have the right to require us by written notice to prepare and file a registration statement registering the offer and sale of a certain number of their shares of our common stock. We are required to provide notice of the request to certain
other holders of our common stock who may, in certain circumstances, participate in the registration. Subject to certain exceptions, we will not be obligated to effect a demand registration (i) on or before the date that is twelve months after the closing of the IPO, (ii) on or before 180 days after any other registered underwritten offering of our equity securities, or (iii) if we are not otherwise eligible at such time to file a registration statement on Form S-3 (or any applicable successor form).
Piggyback Rights
Subject to certain exceptions, if at any time we propose to register an offering of equity securities or conduct an underwritten offering, whether or not for our own account, then we must notify the equity holders party to the Existing Owners Registration Rights Agreement of such proposal to allow them to include a specified number of their shares of our common stock in that registration statement or underwritten offering, as applicable.
Conditions and Limitations; Expenses
These registration rights are subject to certain conditions and limitations, including the right of the underwriters to limit the number of shares to be included in a registration and our right to delay a registration statement under certain circumstances. We will generally pay all registration expenses in connection with our obligations under the Existing Owners Registration Rights Agreement, regardless of whether a registration statement is filed or becomes effective.
Series A Preferred Registration Rights Agreement
In connection with the sale of the Series B Preferred Units, we entered into a Registration Rights Agreement with the Series A Preferred Holders pursuant to which we agreed to file this shelf registration statement within 45 days of the closing of the IPO registering the sale of the shares of common stock issuable upon conversion of the Series A Preferred Stock. Additionally, subject to certain exceptions and limitations, the Series A Preferred Holders have certain piggyback rights under such agreement, which allow the holders the option to include a specified number of the shares of common stock they receive following the conversion of their Series A Preferred Stock in any underwritten offering of our equity securities.
Private Placement Registration Rights Agreement
In connection with the closing of the Private Placement, we and the purchasers entered into the Private Placement Registration Rights Agreement. Pursuant to the Private Placement Registration Rights Agreement, we agreed to (i) file a Registration Statement on Form S-1 with the SEC no later than the Mandatory Shelf Filing Date to register the shares sold in the Private Placement; provided, however, that if we have filed the registration statement on Form S-1 and subsequently becomes eligible to use Form S-3, we may elect, in our sole discretion, to (A) file a post-effective amendment to the registration statement converting such registration statement on Form S-1 to a registration statement on Form S-3 or (B) withdraw the registration statement on Form S-1 and file a registration statement on Form S-3; (ii) use our commercially reasonable efforts to cause such resale registration statement to be declared effective under the Securities Act by the Commission as soon as reasonably practicable after the Mandatory Shelf Filing Date; and (iii) use our commercially reasonable efforts to keep the registration statement continuously effective under the Securities Act until the earlier of (A) the date when all of the shares covered by such registration statement have been sold, and (B) the date on which all of the purchased shares cease to be registrable securities under the Private Placement Registration Rights Agreement.
MATERIAL U.S. FEDERAL INCOME TAX CONSIDERATIONS FOR NON-U.S. HOLDERS
The following is a summary of the material U.S. federal income tax considerations related to the purchase, ownership and disposition of our common stock by a non-U.S. holder (as defined below), that holds our common stock as a “capital asset” (generally property held for investment). This summary is based on the provisions of the Internal Revenue Code of 1986, as amended (the “Code”), U.S. Treasury regulations, administrative rulings and judicial decisions, all as in effect on the date hereof, and all of which are subject to change, possibly with retroactive effect. We have not sought any ruling from the Internal Revenue Service (“IRS”) with respect to the statements made and the conclusions reached in the following summary, and there can be no assurance that the IRS or a court will agree with such statements and conclusions.
This summary does not address all aspects of U.S. federal income taxation that may be relevant to non-U.S. holders in light of their personal circumstances. In addition, this summary does not address the Medicare tax on certain investment income, U.S. federal estate or gift tax laws, any state, local or non-U.S. tax laws or any tax treaties. This summary also does not address tax considerations applicable to investors that may be subject to special treatment under the U.S. federal income tax laws, such as:
· banks, insurance companies or other financial institutions;
· tax-exempt or governmental organizations;
· qualified foreign pension funds (or any entities all of the interests of which are held by a qualified foreign pension fund);
· dealers in securities or foreign currencies;
· traders in securities that use the mark-to-market method of accounting for U.S. federal income tax purposes;
· persons subject to the alternative minimum tax;
· partnerships or other pass-through entities for U.S. federal income tax purposes or holders of interests therein;
· persons deemed to sell our common stock under the constructive sale provisions of the Code;
· persons that acquired our common stock through the exercise of employee stock options or otherwise as compensation or through a tax-qualified retirement plan;
· certain former citizens or long-term residents of the United States; and
· persons that hold our common stock as part of a straddle, appreciated financial position, synthetic security, hedge, conversion transaction or other integrated investment or risk reduction transaction.
PROSPECTIVE INVESTORS ARE ENCOURAGED TO CONSULT THEIR TAX ADVISORS WITH RESPECT TO THE APPLICATION OF THE U.S. FEDERAL INCOME TAX LAWS TO THEIR PARTICULAR SITUATION, AS WELL AS ANY TAX CONSEQUENCES OF THE PURCHASE, OWNERSHIP AND DISPOSITION OF OUR COMMON STOCK ARISING UNDER THE U.S. FEDERAL ESTATE OR GIFT TAX LAWS OR UNDER THE LAWS OF ANY STATE, LOCAL, NON-U.S. OR OTHER TAXING JURISDICTION OR UNDER ANY APPLICABLE INCOME TAX TREATY.
Non-U.S. Holder Defined
For purposes of this discussion, a “non-U.S. holder” is a beneficial owner of our common stock that is not for U.S. federal income tax purposes a partnership or any of the following:
· an individual who is a citizen or resident of the United States;
· a corporation (or other entity treated as a corporation for U.S. federal income tax purposes) created or organized in or under the laws of the United States, any state thereof or the District of Columbia;
· an estate the income of which is subject to U.S. federal income tax regardless of its source; or
· a trust (i) the administration of which is subject to the primary supervision of a U.S. court and which has one or more United States persons who have the authority to control all substantial decisions of the trust or (ii) which has made a valid election under applicable U.S. Treasury regulations to be treated as a United States person.
If a partnership (including an entity or arrangement treated as a partnership for U.S. federal income tax purposes) holds our common stock, the tax treatment of a partner in the partnership generally will depend upon the status of the partner, upon the activities of the partnership and upon certain determinations made at the partner level. Accordingly, we urge partners in partnerships (including entities or arrangements treated as partnerships for U.S. federal income tax purposes) considering the purchase of our common stock to consult their tax advisors regarding the U.S. federal income tax considerations of the purchase, ownership and disposition of our common stock by such partnership.
Distributions
We do not expect to pay any distributions on our common stock in the foreseeable future. However, in the event we do make distributions of cash or other property on our common stock, such distributions will constitute dividends for U.S. federal income tax purposes to the extent paid from our current or accumulated earnings and profits, as determined under U.S. federal income tax principles. To the extent those distributions exceed our current and accumulated earnings and profits, the distributions will be treated as a non-taxable return of capital to the extent of the non-U.S. holder’s tax basis in our common stock and thereafter as capital gain from the sale or exchange of such common stock. See “—Gain on Disposition of Common Stock.” Subject to the discussion below under “—Backup Withholding and Information Reporting” and “—Additional Withholding Requirements under FATCA,” any distribution made to a non-U.S. holder on our common stock generally will be subject to U.S. withholding tax at a rate of 30% of the gross amount of the distribution unless an applicable income tax treaty provides for a lower rate. To receive the benefit of a reduced treaty rate, a non-U.S. holder must provide the applicable withholding agent with an IRS Form W-8BEN or IRS Form W-8BEN-E (or other applicable or successor form) certifying qualification for the reduced rate.
Dividends paid to a non-U.S. holder that are effectively connected with a trade or business conducted by the non-U.S. holder in the United States (and, if required by an applicable income tax treaty, are treated as attributable to a permanent establishment maintained by the non-U.S. holder in the United States) generally will be taxed on a net income basis at the rates and in the manner generally applicable to United States persons (as defined under the Code). Such effectively connected dividends will not be subject to U.S. withholding tax if the non-U.S. holder satisfies certain certification requirements by providing the applicable withholding agent a properly executed IRS Form W-8ECI certifying eligibility for exemption. If the non-U.S. holder is a non-U.S. corporation, it may also be subject to a branch profits tax (at a 30% rate or such lower rate as specified by an applicable income tax treaty) on its effectively connected earnings and profits (as adjusted for certain items), which will include effectively connected dividends.
Gain on Disposition of Common Stock
Subject to the discussion below under “—Backup Withholding and Information Reporting” and “—Additional Withholding Requirements under FATCA,” a non-U.S. holder generally will not be subject to U.S. federal income tax on any gain realized upon the sale or other disposition of our common stock unless:
· the non-U.S. holder is an individual who is present in the United States for a period or periods aggregating 183 days or more during the calendar year in which the sale or disposition occurs and certain other conditions are met;
· the gain is effectively connected with a trade or business conducted by the non-U.S. holder in the United States (and, if required by an applicable income tax treaty, is attributable to a permanent establishment maintained by the non-U.S. holder in the United States); or
· our common stock constitutes a United States real property interest by reason of our status as a United States real property holding corporation (“USRPHC”) for U.S. federal income tax purposes.
A non-U.S. holder described in the first bullet point above will be subject to U.S. federal income tax at a rate of 30% (or such lower rate as specified by an applicable income tax treaty) on the amount of such gain, which generally may be offset by U.S. source capital losses.
A non-U.S. holder whose gain is described in the second bullet point above or, subject to the exceptions described in the next paragraph, the third bullet point above, generally will be taxed on a net income basis at the rates and in the manner generally applicable to United States persons (as defined under the Code) unless an applicable income tax treaty provides otherwise. If the non-U.S. holder is a corporation whose gain is described in the second bullet point above, then such gain would also be included in its effectively connected earnings and profits (as adjusted for certain items), which may be subject to a branch profits tax (at a 30% rate or such lower rate as specified by an applicable income tax treaty).
Generally, a corporation is a USRPHC if the fair market value of its United States real property interests equals or exceeds 50% of the sum of the fair market value of its worldwide real property interests and its other assets used or held for use in a trade or business. We believe that we currently are, and expect to remain for the foreseeable future, a USRPHC for U.S. federal income tax purposes. However, as long as our common stock continues to be regularly traded on an established securities market, only a non-U.S. holder that actually or constructively owns, or owned at any time during the shorter of the five-year period ending on the date of the disposition or the non-U.S. holder’s holding period for the common stock, more than 5% of our common stock will be taxable on gain realized on the disposition of our common stock as a result of our status as a USRPHC. If our common stock were not considered to be regularly traded on an established securities market, such non-U.S. holder (regardless of the percentage of stock owned) would be subject to U.S. federal income tax on a taxable disposition of our common stock, and a 15% withholding tax would apply to the gross proceeds from such disposition.
Non-U.S. holders should consult their tax advisors with respect to the application of the foregoing rules to their ownership and disposition of our common stock.
Backup Withholding and Information Reporting
Any dividends paid to a non-U.S. holder must be reported annually to the IRS and to the non-U.S. holder. Copies of these information returns may be made available to the tax authorities in the country in which the non-U.S. holder resides or is established. Payments of dividends to a non-U.S. holder generally will not be subject to backup withholding if the non-U.S. holder establishes an exemption by properly certifying its non-U.S. status on an IRS Form W-8BEN, IRS Form W-8BEN-E or other applicable or successor form.
Payments of the proceeds from a sale or other disposition by a non-U.S. holder of our common stock effected by or through a U.S. office of a broker generally will be subject to information reporting and backup withholding (at the applicable rate) unless the non-U.S. holder establishes an exemption by properly certifying its non-U.S. status on an IRS Form W-8BEN, IRS Form W-8BEN-E or other applicable or successor form and certain other conditions are met. Information reporting and backup withholding generally will not apply to any payment of the proceeds from a sale or other disposition of our common stock effected outside the United States by a non-U.S. office of a broker. However, unless such broker has documentary evidence in its records that the holder is not a United States person and certain other conditions are met, or the non-U.S. holder otherwise establishes an exemption, information reporting will apply to a payment of the proceeds of the disposition of our common stock effected outside the United States by such a broker if it has certain relationships within the United States.
Backup withholding is not an additional tax. Rather, the U.S. income tax liability (if any) of persons subject to backup withholding will be reduced by the amount of tax withheld. If backup withholding results in an overpayment of taxes, a refund may be obtained, provided that the required information is timely furnished to the IRS.
Additional Withholding Requirements under FATCA
Sections 1471 through 1474 of the Code, and the Treasury regulations and administrative guidance issued thereunder (“FATCA”), impose a 30% withholding tax on any dividends paid on our common stock and on the gross proceeds from a disposition of our common stock (if such disposition occurs after December 31, 2018), in each case if paid to a “foreign financial institution” or a “non-financial foreign entity” (each as defined in the Code) (including, in some cases, when such foreign financial institution or non-financial foreign entity is acting as an intermediary), unless (i) in the case of a foreign financial institution, such institution enters into an agreement with the U.S. government to withhold on certain payments, and to collect and provide to the U.S. tax authorities substantial information regarding U.S. account holders of such institution (which includes certain equity and debt holders of such institution, as well as certain account holders that are non-U.S. entities with U.S. owners), (ii) in the case of a non-financial foreign entity, such entity certifies that it does not have any “substantial United States owners” (as defined in the Code) or provides the applicable withholding agent with a certification identifying the direct and indirect substantial United States owners of the entity (in either case, generally on an IRS Form W-8BEN-E), or (iii) the foreign financial institution or non-financial foreign entity otherwise qualifies for an exemption from these rules and provides appropriate documentation (such as an IRS Form W-8BEN-E). Foreign financial institutions located in jurisdictions that have an intergovernmental agreement with the United States governing these rules may be subject to different rules. Under certain circumstances, a holder might be eligible for refunds or credits of such taxes.
Non-U.S. holders are encouraged to consult with their own tax advisors regarding the effects of FATCA on an investment in our common stock.
INVESTORS CONSIDERING THE PURCHASE OF OUR COMMON STOCK ARE URGED TO CONSULT THEIR OWN TAX ADVISORS REGARDING THE APPLICATION OF THE U.S. FEDERAL INCOME TAX LAWS TO THEIR PARTICULAR SITUATIONS AND THE APPLICABILITY AND EFFECT OF U.S. FEDERAL ESTATE AND GIFT TAX LAWS AND ANY STATE, LOCAL OR NON-U.S. TAX LAWS AND TAX TREATIES.
The selling stockholders may, from time to time, sell, transfer or otherwise dispose of any or all of their shares or interests in the shares on any stock exchange, market or trading facility on which the shares are traded or in private transactions. The selling stockholders may sell their shares of common stock from time to time at the prevailing market price or in privately negotiated transactions.
The selling stockholders may use any one or more of the following methods when disposing of shares or interests therein:
· ordinary brokerage transactions and transactions in which the broker-dealer solicits purchasers;
· block trades in which the broker-dealer will attempt to sell the shares as agent, but may position and resell a portion of the block as principal to facilitate the transaction;
· purchases by a broker-dealer as principal and resale by the broker-dealer for its account;
· an exchange distribution in accordance with the rules of the applicable exchange;
· privately negotiated transactions;
· short sales effected after the date the registration statement of which this prospectus is a part is declared effective by the SEC;
· through the writing or settlement of options or other hedging transactions, whether through an options exchange or otherwise;
· broker-dealers may agree with the selling stockholders to sell a specified number of such shares at a stipulated price per share;
· any other method permitted pursuant to applicable law and the terms of the Series A Preferred Registration Rights Agreement; and
· a combination of any such methods of sale.
The selling stockholders may sell the shares at fixed prices, at prices then prevailing or related to the then current market price or at negotiated prices. The offering price of the shares from time to time will be determined by the selling stockholders and, at the time of the determination, may be higher or lower than the market price of our common stock on the NASDAQ or any other exchange or market.
The shares may be sold directly or through broker-dealers acting as principal or agent, or pursuant to a distribution by one or more underwriters on a firm commitment or best-efforts basis. The selling stockholders may also enter into hedging transactions with broker-dealers. In connection with such transactions, broker-dealers of other financial institutions may engage in short sales of our common stock in the course of hedging the positions they assume with the selling stockholders. The selling stockholders may also enter into options or other transactions with broker-dealers or other financial institutions which require the delivery to such broker-dealer or other financial institution of shares offered by this prospectus, which shares such broker-dealer or other financial institution may resell pursuant to this prospectus (as supplemented or amended to reflect such transaction). In connection with an underwritten offering, underwriters or agents may receive compensation in the form of discounts, concessions or commissions from the selling stockholders or from purchasers of the offered shares for whom they may act as agents. In addition, underwriters may sell the shares to or through dealers, and those dealers may receive compensation in the form of discounts, concessions or commissions from the underwriters and/or commissions from the purchasers for whom they may act as agents. The selling stockholders and any underwriters, dealers or agents participating in a distribution of the shares may be deemed to be underwriters within the meaning of the Securities Act, and any profit on the sale of the shares by the selling stockholders and any commissions received by broker-dealers may be deemed to be underwriting commissions under the Securities Act.
The selling stockholders may agree to indemnify an underwriter, broker-dealer or agent against certain liabilities related to the selling of their shares, including liabilities arising under the Securities Act. Under the Registration Rights Agreement entered into with the selling stockholders, we have agreed to indemnify the selling stockholders against certain liabilities related to the sale of the common stock, including certain liabilities arising under the Securities Act. Under the Registration Rights Agreement, we have also agreed to pay the costs, expenses and fees of registering the shares of common stock. All other expenses of issuance and distribution will be borne by the selling stockholders.
The selling stockholders are subject to the applicable provisions of the Exchange Act, and the rules and regulations under the Exchange Act, including Regulation M. This regulation may limit the timing of purchases and sales of any of the shares of common stock offered in this prospectus by the selling stockholders. The anti-manipulation rules under the Exchange Act may apply to sales of shares in the market and to the activities of the selling stockholders and their affiliates. Furthermore, Regulation M may restrict the ability of any person engaged in the distribution of the shares to engage in market-making activities for the particular securities being distributed for a period of up to five business days before the distribution. The restrictions may affect the marketability of the shares and the ability of any person or entity to engage in market-making activities for the shares.
To the extent required, this prospectus may be amended and/or supplemented from time to time to describe a specific plan of distribution. Instead of selling the shares of common stock under this prospectus, the selling stockholders may sell the shares of common stock in compliance with the provisions of Rule 144 under the Securities Act, if available, or pursuant to other available exemptions from the registration requirements of the Securities Act. Under the securities laws of some states, if applicable, the securities registered hereby may be sold in those states only through registered or licensed brokers or dealers. In addition, in some states such securities may not be sold unless they have been registered or qualified for sale or an exemption from registration or qualification requirements is available and is complied with.
We cannot assure you that the selling stockholders will sell all or any portion of our common stock offered hereby.
Under the Registration Rights Agreement entered into with the selling stockholders, we agreed to, subject to the terms, conditions and limitations of the Registration Rights Agreement, keep the registration statement of which this prospectus constitutes a part continuously effective under the Securities Act until the date when all of the shares covered by such registration statement have been sold or cease to be Registrable Securities thereunder (as such term is defined in the registration rights agreement).
The validity of our common stock offered by this prospectus will be passed upon for us by Vinson & Elkins L.L.P., Houston, Texas.
The financial statements of Extraction Oil & Gas Holdings, LLC as of December 31, 2015 and December 31, 2014 and for each of the two years in the period ended December 31, 2015, included in this prospectus, have been so included in reliance on the report of PricewaterhouseCoopers LLP, an independent registered public accounting firm, given on the authority of said firm as experts in auditing and accounting.
The statements of revenue and direct operating expenses of Tekton Windsor, LLC for the three months ended March 31, 2014 and the year ended December 31, 2013, included in this prospectus, have been so included in reliance on the report (which contains an explanatory paragraph relating to the preparation of the financial statements in accordance with an SEC waiver, as described in Note 1 to the financial statements) of PricewaterhouseCoopers LLP, an independent registered public accounting firm, given on the authority of said firm as experts in auditing and accounting.
The statements of revenues and direct operating expenses for properties acquired by Extraction Oil & Gas, LLC from Sundance Energy Inc. for the years ended December 31, 2013 and 2012 included herein have been audited by Hein & Associates LLP, an independent registered public accounting firm, as stated in its report appearing herein, given the authority of the said firm as experts in auditing and accounting.
The statements of revenues and direct operating expenses for properties acquired by Extraction Oil & Gas, LLC from Mineral Resources, Inc. for the years ended December 31, 2013 and 2012 included herein have been audited by Hein & Associates LLP, an independent registered public accounting firm, as stated in its report appearing herein, given the authority of the said firm as experts in auditing and accounting.
The statements of revenues and direct operating expenses for properties acquired by Extraction Oil & Gas, LLC from Bayswater Exploration & Production, LLC for the year ended December 31, 2013 and for the nine-month period ended September 30, 2014 included herein have been audited by Hein & Associates LLP, an independent registered public accounting firm, as stated in its report appearing herein, given the authority of the said firm as experts in auditing and accounting.
The statements of revenues and direct operating expenses for properties acquired by Extraction Oil & Gas, LLC from Noble Energy Inc. for the year ended December 31, 2014 included herein have been audited by Hein & Associates LLP, an independent registered public accounting firm, as stated in its report appearing herein, given the authority of the said firm as experts in auditing and accounting
The statements of operating revenues and direct operating expenses of Bayswater Properties acquired by Extraction Oil & Gas, LLC for the nine months ended September 30, 2016 and 2015 and the year ended December 31, 2015, included in this prospectus, have been so included in reliance on the report of KPMG LLP, independent auditors, given on the authority of said firm as experts in auditing and accounting. With respect to the unaudited interim financial information for the periods ended September 30, 2016 and 2015, included herein, the independent auditors have reported that they applied limited procedures in accordance with professional standards for a review of such information. However, their separate report included in the Company’s Form S-1 included herein, states that they did not audit and they do not express an opinion on that interim financial information. Accordingly, the degree of reliance on their report on such information should be restricted in light of the limited nature of the review procedures applied. The accountants are not subject to the liability provisions of Section 11 of the Securities Act of 1933 (the “1933 Act”) for their report on the unaudited interim financial information because that report is not a “report” or a “part” of the registration statement prepared or certified by the accountants within the meaning of Sections 7 and 11 of the 1933 Act.
The information included in this prospectus regarding estimated quantities of proved reserves of Extraction Oil & Gas Holdings, LLC, the future net revenues from those reserves and their present value as of June 30, 2016 and December 31, 2015 and 2014 is based on the proved reserve reports prepared by Ryder Scott Company L.P., our independent petroleum engineers. These estimates are included in this prospectus in reliance upon the authority of such firm as an expert in these matters.
The information included in this prospectus regarding estimated quantities of proved reserves associated with the Bayswater Assets, the future net revenues from those reserves and their present value as of June 30, 2016 is based on the proved reserve reports prepared by Ryder Scott Company L.P., our independent petroleum engineers. These estimates are included in this prospectus in reliance upon the authority of such firm as an expert in these matters.
WHERE YOU CAN FIND MORE INFORMATION
We have filed with the SEC a registration statement on Form S-1 (including the exhibits, schedules and amendments thereto) under the Securities Act, with respect to the shares of our common stock offered hereby. This prospectus does not contain all of the information set forth in the registration statement and the exhibits and schedules thereto. For further information with respect to the common stock offered hereby, we refer you to the registration statement and the exhibits and schedules filed therewith. Statements contained in this prospectus as to the contents of any contract, agreement or any other document are summaries of the material terms of such contract, agreement or other document and are not necessarily complete. With respect to each of these contracts, agreements or other documents filed as an exhibit to the registration statement, reference is made to the exhibits for a more complete description of the matter involved. A copy of the registration statement, and the exhibits and schedules thereto, may be inspected without charge at the public reference facilities maintained by the SEC at 100 F Street NE, Washington, D.C. 20549. Copies of these materials may be obtained, upon payment of a duplicating fee, from the Public Reference Room of the SEC at 100 F Street NE, Washington, D.C. 20549. Please call the SEC at 1-800-SEC-0330 for further information on the operation of the Public Reference Room. The SEC maintains a website that contains reports, proxy and information statements and other information regarding registrants that file electronically with the SEC. The address of the SEC’s website is www.sec.gov.
As a publicly traded company, we are subject to full information requirements of the Exchange Act. We will fulfill our obligations with respect to such requirements by filing periodic reports and other information with the SEC. We intend to furnish our stockholders with annual reports containing financial statements certified by an independent public accounting firm.
|
F-100 | |
|
Notes to statements of revenues and direct operating expenses |
F-101 |
|
|
|
|
MARCH 2015 ACQUISITION |
|
|
|
|
|
Historical Financial Statements |
|
|
F-104 | |
|
F-105 | |
|
Notes to statements of revenues and direct operating expenses |
F-106 |
|
|
|
|
BAYSWATER ACQUISITION |
|
|
|
|
|
Historical Financial Statements |
|
|
F-110 | |
|
F-112 | |
|
Notes to statements of operating revenues and direct operating expenses |
F-113 |
EXTRACTION OIL & GAS, INC.
PRO FORMA FINANCIAL STATEMENTS
(Unaudited)
Extraction Oil & Gas, Inc. (the “Company”), was formed upon the conversion of Extraction Oil & Gas, LLC, a Delaware limited liability company (“XOG”), into a Delaware corporation in connection with the initial public offering of the Company (the “Offering” or “IPO”) that closed on October 17, 2016. XOG was formed to engage in the acquisition, development and production of oil, natural gas and natural gas liquid reserves in the Rocky Mountains, primarily in the Denver-Julesburg Basin of Colorado. Prior to the Offering, Extraction Oil & Gas Holdings, LLC (“Holdings”) owned 100% of the membership interests in XOG. Prior to the closing of the Offering, Holdings merged with and into the Company with the Company as the surviving entity.
The unaudited pro forma balance sheet of the Company is based on the unaudited historical balance sheet of Holdings, XOG’s accounting predecessor, as of September 30, 2016, and includes pro forma adjustments to give effect to the following transactions as if they occurred on September 30, 2016:
· The Bayswater Acquisition as defined and described in “Business—Recent Developments—Bayswater Acquisition” (the “Bayswater Acquisition”), including the issuance of Series A Preferred Units and Series B Preferred Units to pay a portion of the purchase price for such acquisition;
· The issuance of Series A and Series B Preferred Units as described in “Business—Recent Developments—Convertible Preferred Securities”;
· The corporate reorganization as described in “Prospectus Summary—Corporate Reorganization” (the “Corporate Reorganization”) and reflects unit based compensation expense of $172.1 million for the vesting of incentive units that occurred as a result of the offering; and
· The Offering of approximately 38.3 million shares of the Company’s common stock and the use of the net proceeds therefrom. The net proceeds from the Offering were approximately $688.2 million, net of underwriting discounts and commissions and other offering costs of approximately $40.1 million. These net proceeds exclude the impact of $4.5 million of deferred issuance costs accrued for as of September 30, 2016, which are presented in non-current assets on the pro forma balance sheet.
· The Private Placement of approximately 25.0 million shares of the Company’s common stock and the net proceeds therefrom as described in “Business—Recent Developments—Private Placement of Common Stock” (the “Private Placement”). The net proceeds from the Private Placement were approximately $441.8 million, net of underwriting discounts, commissions and other offering costs of approximately $15.2 million.
The unaudited pro forma statement of operations of the Company is based on the audited historical statement of operations of Holdings for the year ended December 31, 2015, having been adjusted to give effect to the following transactions as if they occurred on January 1, 2015:
· The (i) March 2015 Acquisition as defined and described under “Management’s Discussion and Analysis of Financial Condition and Results of Operations—Factors Affecting the Comparability of Our Financial Condition and Results of Operations—Oil and Gas Property Acquisitions”, and (ii) Bayswater Acquisition;
· The issuance of Series A and Series B Preferred Units as described in “Business—Recent Developments—Convertible Preferred Securities;”
· The 2016 Notes Offering;
· The Corporate Reorganization;
· The Offering; and
· The Private Placement, which resulted in the issuance of additional shares and is included in pro forma weighted average common shares outstanding.
The unaudited pro forma statement of operations of the Company is based on the unaudited historical statement of operations of Holdings for the nine months ended September 30, 2016, having been adjusted to give effect to the following transactions as if they occurred on January 1, 2015:
· The Bayswater Acquisition;
· The issuance of Series A and Series B Preferred Units as described in “Business—Recent Developments—Convertible Preferred Securities;”
· The 2016 Notes Offering;
· The Corporate Reorganization;
· The Offering; and
· The Private Placement, which resulted in the issuance of additional shares and is included in pro forma weighted average common shares outstanding.
SEPTEMBER 30, 2016
(In Thousands)
(Unaudited)
|
|
|
Company |
|
Bayswater |
|
Corporate |
|
Pro Forma |
|
Offering |
|
Private |
|
Company |
| |||||||
|
|
|
|
|
(a) |
|
|
|
|
|
|
|
|
|
|
| |||||||
|
ASSETS |
|
|
|
|
|
|
|
|
|
|
|
|
|
|
| |||||||
|
Current Assets: |
|
|
|
|
|
|
|
|
|
|
|
|
|
|
| |||||||
|
Cash and cash equivalents |
|
$ |
1,386 |
|
$ |
— |
|
$ |
— |
|
$ |
1,386 |
|
$ |
349,490 |
(e) |
$ |
441,846 |
(g) |
$ |
792,722 |
|
|
Accounts receivable: |
|
|
|
|
|
|
|
|
|
|
|
|
|
|
| |||||||
|
Trade |
|
19,011 |
|
— |
|
— |
|
19,011 |
|
— |
|
— |
|
19,011 |
| |||||||
|
Oil, natural gas and NGL sales |
|
24,444 |
|
— |
|
— |
|
24,444 |
|
— |
|
— |
|
24,444 |
| |||||||
|
Inventory and prepaid expenses |
|
5,695 |
|
— |
|
— |
|
5,695 |
|
— |
|
— |
|
5,695 |
| |||||||
|
Commodity derivative asset |
|
532 |
|
— |
|
— |
|
532 |
|
— |
|
— |
|
532 |
| |||||||
|
Total Current Assets |
|
51,068 |
|
— |
|
— |
|
51,068 |
|
349,490 |
|
441,846 |
|
842,404 |
| |||||||
|
Property and Equipment (successful efforts method), at cost: |
|
|
|
|
|
|
|
|
|
|
|
|
|
|
| |||||||
|
Proved oil and gas properties |
|
1,405,817 |
|
252,205 |
|
— |
|
1,658,022 |
|
— |
|
— |
|
1,658,022 |
| |||||||
|
Unproved oil and gas properties |
|
318,267 |
|
109,800 |
|
— |
|
428,067 |
|
— |
|
— |
|
428,067 |
| |||||||
|
Wells in progress |
|
61,064 |
|
— |
|
— |
|
61,064 |
|
— |
|
— |
|
61,064 |
| |||||||
|
Less: accumulated depletion, depreciation and amortization |
|
(341,050 |
) |
— |
|
— |
|
(341,050 |
) |
— |
|
— |
|
(341,050 |
) | |||||||
|
Net oil and gas properties |
|
1,444,098 |
|
362,005 |
|
— |
|
1,806,103 |
|
— |
|
— |
|
1,806,103 |
| |||||||
|
Other property and equipment, net of accumulated depreciation |
|
29,346 |
|
— |
|
— |
|
29,346 |
|
— |
|
— |
|
29,346 |
| |||||||
|
Net Property and Equipment |
|
1,473,444 |
|
362,005 |
|
— |
|
1,835,449 |
|
— |
|
— |
|
1,835,449 |
| |||||||
|
Non-Current Assets: |
|
|
|
|
|
|
|
|
|
|
|
|
|
|
| |||||||
|
Cash held in escrow |
|
42,000 |
|
— |
|
— |
|
42,000 |
|
— |
|
— |
|
42,000 |
| |||||||
|
Deferred equity issuance costs |
|
5,126 |
|
— |
|
— |
|
5,126 |
|
(5,126 |
)(e) |
— |
|
— |
| |||||||
|
Goodwill |
|
— |
|
66,868 |
|
— |
|
66,868 |
|
— |
|
— |
|
66,868 |
| |||||||
|
Other non-current assets |
|
1,767 |
|
— |
|
— |
|
1,767 |
|
— |
|
— |
|
1,767 |
| |||||||
|
Total Non-Current Assets |
|
48,893 |
|
66,868 |
|
— |
|
115,761 |
|
(5,126 |
) |
— |
|
110,635 |
| |||||||
|
Total Assets |
|
$ |
1,573,405 |
|
$ |
428,873 |
|
$ |
— |
|
$ |
2,002,278 |
|
$ |
344,364 |
|
$ |
441,846 |
|
$ |
2,788,488 |
|
|
LIABILITIES AND MEMBERS’/STOCKHOLDERS’ EQUITY |
|
|
|
|
|
|
|
|
|
|
|
|
|
|
| |||||||
|
Current Liabilities: |
|
|
|
|
|
|
|
|
|
|
|
|
|
|
| |||||||
|
Accounts payable and accrued liabilities |
|
$ |
76,982 |
|
$ |
2,886 |
|
$ |
— |
|
$ |
79,868 |
|
$ |
— |
|
$ |
— |
|
$ |
79,868 |
|
|
Revenue payable |
|
48,980 |
|
1,888 |
|
— |
|
50,868 |
|
— |
|
— |
|
50,868 |
| |||||||
|
Production taxes payable |
|
27,149 |
|
3,350 |
|
— |
|
30,499 |
|
— |
|
— |
|
30,499 |
| |||||||
|
Commodity derivative liability |
|
21,776 |
|
— |
|
— |
|
21,776 |
|
— |
|
— |
|
21,776 |
| |||||||
|
Accrued interest payable |
|
8,792 |
|
— |
|
— |
|
8,792 |
|
— |
|
— |
|
8,792 |
| |||||||
|
Asset retirement obligations |
|
3,742 |
|
— |
|
— |
|
3,742 |
|
— |
|
— |
|
3,742 |
| |||||||
|
Total Current Liabilities |
|
187,421 |
|
8,124 |
|
— |
|
195,545 |
|
— |
|
— |
|
195,545 |
| |||||||
|
Non-Current Liabilities: |
|
|
|
|
|
|
|
|
|
|
|
|
|
|
| |||||||
|
Credit facility |
|
89,000 |
|
160,951 |
|
— |
|
249,951 |
|
(249,951 |
)(e) |
— |
|
— |
| |||||||
|
Senior Notes, net of unamortized debt issuance costs |
|
537,601 |
|
— |
|
— |
|
537,601 |
|
— |
|
— |
|
537,601 |
| |||||||
|
Deferred tax liability |
|
— |
|
— |
|
157,879 |
(b) |
157,879 |
|
— |
|
— |
|
157,879 |
| |||||||
|
Production taxes payable |
|
23,406 |
|
— |
|
— |
|
23,406 |
|
— |
|
— |
|
23,406 |
| |||||||
|
Commodity derivative liability |
|
6,727 |
|
— |
|
— |
|
6,727 |
|
— |
|
— |
|
6,727 |
| |||||||
|
Other non-current liabilities |
|
3,523 |
|
— |
|
— |
|
3,523 |
|
— |
|
— |
|
3,523 |
| |||||||
|
Asset retirement obligations |
|
49,492 |
|
3,705 |
|
— |
|
53,197 |
|
— |
|
— |
|
53,197 |
| |||||||
|
Total Non-Current Liabilities |
|
709,749 |
|
164,656 |
|
157,879 |
|
1,032,284 |
|
(249,951 |
) |
— |
|
782,333 |
| |||||||
|
Commitments and Contingencies |
|
|
|
|
|
|
|
|
|
|
|
|
|
|
| |||||||
|
Total Liabilities |
|
897,170 |
|
172,780 |
|
157,879 |
|
1,227,829 |
|
(249,951 |
) |
— |
|
977,878 |
| |||||||
|
|
|
|
|
|
|
|
|
|
|
|
|
|
|
|
| |||||||
|
Mezzanine Equity |
|
|
|
|
|
|
|
|
|
|
|
|
|
|
| |||||||
|
Series A Preferred Units |
|
— |
|
73,688 |
|
— |
|
73,688 |
|
(73,688 |
)(e) |
— |
|
— |
| |||||||
|
Series A Preferred Stock |
|
— |
|
— |
|
— |
|
— |
|
157,488 |
(f) |
— |
|
157,488 |
| |||||||
|
|
|
|
|
|
|
|
|
|
|
|
|
|
|
|
| |||||||
|
Members’ Equity: |
|
|
|
|
|
|
|
|
|
|
|
|
|
|
| |||||||
|
Preferred tranche C units; unlimited units authorized; 114,168,176 units issued and outstanding |
|
370,418 |
|
— |
|
(370,418 |
)(c) |
— |
|
— |
|
— |
|
— |
| |||||||
|
Tranche A units; unlimited units authorized; 232,516,117 units issued and outstanding |
|
513,451 |
|
— |
|
(513,451 |
)(c) |
— |
|
— |
|
— |
|
— |
| |||||||
|
Stockholders’ Equity: |
|
|
|
|
|
|
|
|
|
|
|
|
|
|
| |||||||
|
Series B Preferred Units |
|
— |
|
185,280 |
|
— |
|
185,280 |
|
(185,280 |
)(e)(f) |
— |
|
— |
| |||||||
|
Common stock |
|
— |
|
— |
|
1,085 |
(c) |
1,085 |
|
383 |
(e) |
250 |
(g) |
1,718 |
| |||||||
|
Additional paid-in capital |
|
— |
|
— |
|
1,054,884 |
(c)(d) |
1,054,884 |
|
695,412 |
(e)(f) |
441,596 |
(g) |
2,191,892 |
| |||||||
|
Retained deficit |
|
(207,634 |
) |
(2,875 |
) |
(329,979 |
)(b)(d) |
(540,488 |
) |
— |
|
— |
|
(540,488 |
) | |||||||
|
Total Members’/Stockholders’ Equity |
|
676,235 |
|
182,405 |
|
(157,879 |
) |
700,761 |
|
510,515 |
|
441,846 |
|
1,653,122 |
| |||||||
|
Total Liabilities and Members’/Stockholders’ Equity |
|
$ |
1,573,405 |
|
$ |
428,873 |
|
$ |
— |
|
$ |
2,002,278 |
|
$ |
344,364 |
|
$ |
441,846 |
|
$ |
2,788,488 |
|
PRO FORMA STATEMENT OF OPERATIONS
FOR THE YEAR ENDED DECEMBER 31, 2015
(In thousands, except per unit / common share data)
(Unaudited)
|
|
|
Company |
|
March 2015 |
|
Bayswater |
|
Corporate |
|
Pro Forma |
|
Pro Forma |
|
Offering |
|
Company Pro |
| ||||||||
|
|
|
|
|
(a) |
|
(b) |
|
|
|
|
|
|
|
|
|
|
| ||||||||
|
Revenues: |
|
|
|
|
|
|
|
|
|
|
|
|
|
|
|
|
| ||||||||
|
Oil sales |
|
$ |
157,024 |
|
$ |
1,457 |
|
$ |
10,933 |
|
$ |
— |
|
$ |
— |
|
$ |
169,414 |
|
$ |
— |
|
$ |
169,414 |
|
|
Natural gas sales |
|
26,019 |
|
519 |
|
3,580 |
|
— |
|
— |
|
30,118 |
|
— |
|
30,118 |
| ||||||||
|
NGL sales |
|
14,707 |
|
20 |
|
— |
|
— |
|
— |
|
14,727 |
|
— |
|
14,727 |
| ||||||||
|
Total Revenues |
|
197,750 |
|
1,996 |
|
14,513 |
|
— |
|
— |
|
214,259 |
|
— |
|
214,259 |
| ||||||||
|
Operating Expenses: |
|
|
|
|
|
|
|
|
|
|
|
|
|
|
|
|
| ||||||||
|
Lease operating expenses |
|
30,628 |
|
1,621 |
|
4,014 |
|
— |
|
— |
|
36,263 |
|
— |
|
36,263 |
| ||||||||
|
Production taxes |
|
17,035 |
|
112 |
|
865 |
|
— |
|
— |
|
18,012 |
|
— |
|
18,012 |
| ||||||||
|
Exploration expenses |
|
18,636 |
|
— |
|
— |
|
— |
|
— |
|
18,636 |
|
— |
|
18,636 |
| ||||||||
|
Depletion, depreciation, amortization and accretion |
|
146,547 |
|
— |
|
— |
|
— |
|
(1,476 |
)(d) |
145,071 |
|
— |
|
145,071 |
| ||||||||
|
Impairment of long lived assets |
|
15,778 |
|
— |
|
— |
|
— |
|
— |
|
15,778 |
|
— |
|
15,778 |
| ||||||||
|
Other operating expenses |
|
2,353 |
|
— |
|
— |
|
— |
|
— |
|
2,353 |
|
— |
|
2,353 |
| ||||||||
|
Acquisition transaction expenses |
|
6,000 |
|
— |
|
— |
|
— |
|
(6,000 |
)(e) |
— |
|
— |
|
— |
| ||||||||
|
General and administrative expenses |
|
37,149 |
|
— |
|
— |
|
— |
|
(400 |
)(f) |
36,749 |
|
— |
|
36,749 |
| ||||||||
|
Total Operating Expenses |
|
274,126 |
|
1,733 |
|
4,879 |
|
— |
|
(7,876 |
) |
272,862 |
|
— |
|
272,862 |
| ||||||||
|
Operating Income (Loss) |
|
(76,376 |
) |
263 |
|
9,634 |
|
— |
|
7,876 |
|
(58,603 |
) |
— |
|
(58,603 |
) | ||||||||
|
Other Income (Expense) |
|
|
|
|
|
|
|
|
|
|
|
|
|
|
|
|
| ||||||||
|
Commodity derivative gain |
|
79,932 |
|
— |
|
— |
|
— |
|
— |
|
79,932 |
|
— |
|
79,932 |
| ||||||||
|
Interest expense |
|
(51,030 |
) |
— |
|
— |
|
— |
|
2,388 |
(g)(h) |
(48,642 |
) |
6,596 |
(j) |
(42,046 |
) | ||||||||
|
Other income |
|
210 |
|
— |
|
— |
|
— |
|
— |
|
210 |
|
— |
|
210 |
| ||||||||
|
Total Other Income (Expense) |
|
29,112 |
|
— |
|
— |
|
— |
|
2,388 |
|
31,500 |
|
6,596 |
|
38,096 |
| ||||||||
|
Income (Loss) Before Income Taxes |
|
(47,264 |
) |
263 |
|
9,634 |
|
— |
|
10,264 |
|
(27,103 |
) |
6,596 |
|
(20,507 |
) | ||||||||
|
Income Tax (Expense) Benefit |
|
— |
|
— |
|
— |
|
14,198 |
(c) |
(3,900 |
)(i) |
10,298 |
|
(2,506 |
)(j) |
7,792 |
| ||||||||
|
Net Income (Loss) |
|
$ |
(47,264 |
) |
$ |
263 |
|
$ |
9,634 |
|
$ |
14,198 |
|
$ |
6,364 |
|
$ |
(16,805 |
) |
$ |
4,090 |
|
$ |
(12,715 |
) |
|
Weighted Average Units Outstanding |
|
|
|
|
|
|
|
|
|
|
|
|
|
|
|
|
| ||||||||
|
Basic and Diluted |
|
277,322 |
|
|
|
|
|
(277,322 |
)(k) |
|
|
|
|
|
|
|
| ||||||||
|
Loss per Unit |
|
|
|
|
|
|
|
|
|
|
|
|
|
|
|
|
| ||||||||
|
Basic and Diluted |
|
$ |
(0.17 |
) |
|
|
|
|
|
|
|
|
|
|
|
|
|
| |||||||
|
Pro Forma Weighted Average Common Shares Outstanding (l) |
|
|
|
|
|
|
|
108,461 |
(k) |
|
|
108,461 |
(k) |
63,374 |
(k) |
171,835 |
| ||||||||
|
Basic and Diluted |
|
|
|
|
|
|
|
|
|
|
|
|
|
|
|
|
| ||||||||
|
Pro Forma Net Loss per Common Share (l)(m) |
|
|
|
|
|
|
|
|
|
|
|
|
|
|
|
|
| ||||||||
|
Basic and Diluted |
|
|
|
|
|
|
|
|
|
|
|
|
|
|
|
$ |
(0.17 |
)(l)(m) | |||||||
PRO FORMA STATEMENT OF OPERATIONS
FOR THE NINE MONTHS ENDED SEPTEMBER 30, 2016
(In thousands, except per unit / common share data)
(Unaudited)
|
|
|
Company |
|
Bayswater |
|
Corporate |
|
Pro Forma |
|
Pro Forma Prior to |
|
Offering |
|
Company Pro Forma |
| |||||||
|
|
|
|
|
(a) |
|
|
|
|
|
|
|
|
|
|
| |||||||
|
Revenues: |
|
|
|
|
|
|
|
|
|
|
|
|
|
|
| |||||||
|
Oil sales |
|
$ |
135,896 |
|
$ |
37,376 |
|
$ |
— |
|
$ |
— |
|
$ |
173,272 |
|
$ |
— |
|
$ |
173,272 |
|
|
Natural gas sales |
|
27,730 |
|
9,890 |
|
— |
|
— |
|
37,620 |
|
— |
|
37,620 |
| |||||||
|
NGL sales |
|
19,773 |
|
— |
|
— |
|
— |
|
19,773 |
|
— |
|
19,773 |
| |||||||
|
Total Revenues |
|
183,399 |
|
47,266 |
|
— |
|
— |
|
230,665 |
|
— |
|
230,665 |
| |||||||
|
Operating Expenses: |
|
|
|
|
|
|
|
|
|
|
|
|
|
|
| |||||||
|
Lease operating expenses |
|
40,819 |
|
4,915 |
|
— |
|
— |
|
45,734 |
|
— |
|
45,734 |
| |||||||
|
Production taxes |
|
16,935 |
|
3,347 |
|
— |
|
— |
|
20,282 |
|
— |
|
20,282 |
| |||||||
|
Exploration expenses |
|
14,735 |
|
— |
|
— |
|
— |
|
14,735 |
|
— |
|
14,735 |
| |||||||
|
Depletion, depreciation, amortization and accretion |
|
141,317 |
|
— |
|
— |
|
23,096 |
(c) |
164,413 |
|
— |
|
164,413 |
| |||||||
|
Impairment of long lived assets |
|
23,350 |
|
— |
|
— |
|
— |
|
23,350 |
|
— |
|
23,350 |
| |||||||
|
Other operating expenses |
|
891 |
|
— |
|
— |
|
— |
|
891 |
|
— |
|
891 |
| |||||||
|
Acquisition transaction expenses |
|
345 |
|
— |
|
— |
|
(345 |
)(d) |
— |
|
— |
|
— |
| |||||||
|
General and administrative expenses |
|
35,189 |
|
— |
|
— |
|
(11,290 |
)(e) |
23,899 |
|
— |
|
23,899 |
| |||||||
|
Total Operating Expenses |
|
273,581 |
|
8,262 |
|
— |
|
11,461 |
|
293,304 |
|
— |
|
293,304 |
| |||||||
|
Operating Income (Loss) |
|
(90,182 |
) |
39,004 |
|
— |
|
(11,461 |
) |
(62,639 |
) |
— |
|
(62,639 |
) | |||||||
|
Other Income (Expense): |
|
|
|
|
|
|
|
|
|
|
|
|
|
|
| |||||||
|
Commodity derivative loss |
|
(62,424 |
) |
— |
|
— |
|
— |
|
(62,424 |
) |
— |
|
(62,424 |
) | |||||||
|
Interest expense |
|
(57,914 |
) |
— |
|
— |
|
18,631 |
(f)(g) |
(39,283 |
) |
7,508 |
(i) |
(31,775 |
) | |||||||
|
Other income |
|
120 |
|
— |
|
— |
|
— |
|
120 |
|
— |
|
120 |
| |||||||
|
Other Income (Expense) |
|
(120,218 |
) |
— |
|
— |
|
18,631 |
|
(101,587 |
) |
7,508 |
|
(94,079 |
) | |||||||
|
Income (Loss) Before Income Taxes |
|
(210,400 |
) |
39,004 |
|
— |
|
7,170 |
|
(164,226 |
) |
7,508 |
|
(156,718 |
) | |||||||
|
Income Tax (Expense) Benefit |
|
— |
|
— |
|
65,130 |
(b) |
(2,725 |
)(h) |
62,405 |
|
(2,853 |
)(i) |
59,552 |
| |||||||
|
Net Income (Loss) |
|
$ |
(210,400 |
) |
$ |
39,004 |
|
$ |
65,130 |
|
$ |
4,445 |
|
$ |
(101,821 |
) |
$ |
4,655 |
|
$ |
(97,166 |
) |
|
Weighted Average Units Outstanding |
|
|
|
|
|
|
|
|
|
|
|
|
|
|
| |||||||
|
Basic and Diluted |
|
332,377 |
|
|
|
|
|
(332,377 |
)(j) |
|
|
|
|
|
| |||||||
|
Loss per Unit |
|
|
|
|
|
|
|
|
|
|
|
|
|
|
| |||||||
|
Basic and Diluted |
|
$ |
(0.63 |
) |
|
|
|
|
|
|
|
|
|
|
|
| ||||||
|
Pro Forma Weighted Average Common Shares Outstanding (i) |
|
|
|
|
|
|
|
|
|
|
|
|
|
|
| |||||||
|
Basic and Diluted |
|
|
|
|
|
|
|
108,461 |
(j) |
108,461 |
(j) |
63,374 |
(j) |
171,835 |
| |||||||
|
Pro Forma Net Loss per Common Share (i)(j) |
|
|
|
|
|
|
|
|
|
|
|
|
|
|
| |||||||
|
Basic and Diluted |
|
|
|
|
|
|
|
|
|
|
|
|
|
$ |
(0.64 |
)(k)(l) | ||||||
EXTRACTION OIL & GAS, INC.
NOTES TO UNAUDITED PRO FORMA FINANCIAL STATEMENTS
NOTE 1. BASIS OF PRESENTATION
The unaudited pro forma financial information is derived from the financial statements of Holdings, our predecessor, included elsewhere in this prospectus. The unaudited pro forma financial statements were prepared in accordance with GAAP and pursuant to Regulation S-X Article 11.
The pro forma data presented reflects events directly attributable to the described transactions and certain assumptions the Company believes are reasonable. The pro forma data are not necessarily indicative of financial results that would have been attained had the described transactions occurred on the dates indicated or which could be achieved in the future because they necessarily exclude various operating expenses, such as incremental general and administrative expenses. The adjustments are based on currently available information and certain estimates and assumptions. However, management believes that the assumptions provide a reasonable basis for presenting the significant effects of the transactions as contemplated and that the pro forma adjustments give appropriate effect to those assumptions and are properly applied in the unaudited pro forma financial statements.
The unaudited pro forma financial statements have been prepared on the basis that the Company will be taxed as a corporation, and as a result, will become a tax-paying entity subject to U.S. federal and state income taxes, and should be read in conjunction with “Prospectus Summary—Corporate Reorganization,” “Management’s Discussion and Analysis of Financial Condition and Results of Operations” and with the audited and unaudited historical financial statements and related notes of the Company, included elsewhere in this prospectus.
As a result of the Offering, the Company expects to incur direct, incremental general and administrative expenses as a result of being a publicly traded company, including, but not limited to, costs associated with annual and quarterly reports to stockholders, tax return preparation, incremental independent auditor fees, investor relations activities, registrar and transfer agent fees, incremental director and officer liability insurance costs, and independent director compensation. The Company estimates these direct, incremental general and administrative expenses initially will total approximately $3.0 million per year, which are not reflected in the historical financial statements or in the unaudited pro forma financial statements. Additionally, the unaudited pro forma statements of operations exclude the vesting of incentive units that occurred as a result of the Offering of $172.1 million and transaction costs associated with an option arrangement fee of $1.0 million and a finder’s fee to an unaffiliated third-party related to the Bayswater Acquisition of $2.0 million, as the charges are considered non-recurring.
NOTE 2. BUSINESS COMBINATION
Bayswater Acquisition
The Bayswater Acquisition is accounted for using the acquisition method under ASC 805, Business Combinations (“ASC 805”) and reflected in the unaudited pro forma financial statements.” In accordance with ASC 805, the assets acquired and the liabilities assumed have been measured at fair value based on various estimates. These estimates are based on key assumptions related to the business combinations, including reviews of publicly disclosed information for other acquisitions in the industry, historical experience of the companies, data that was available through the public domain and due diligence reviews of the acquiree businesses.
For purposes of measuring the estimated fair value, where applicable, of the assets acquired and the liabilities assumed as reflected in the unaudited pro forma financial information, the Company has applied the guidance in ASC 820, Fair Value Measurements, which we refer to as ASC 820, which establishes a framework for measuring fair value. In accordance with ASC 820, fair value is an exit price and is defined as “the price that would be received to sell an asset or paid to transfer a liability in an orderly transaction between market participants at the measurement date.” Under ASC 805, acquisition-related transaction costs and acquisition-related restructuring charges are not included as components of consideration transferred but are accounted for as expenses in the period in which the costs are incurred. In addition, the unaudited pro forma financial statements do not reflect any cost savings, operating synergies or revenue enhancements that the consolidated company may achieve as a result of the business
EXTRACTION OIL & GAS, INC.
NOTES TO UNAUDITED PRO FORMA FINANCIAL STATEMENTS (Continued)
combinations, the costs to integrate the operations of the companies or the costs necessary to achieve these cost savings, operating synergies and revenue enhancements.
The unaudited pro forma financial information includes various assumptions and estimates, including those related to the fair value of consideration transferred and the preliminary purchase price allocation of assets acquired and liabilities assumed in the transaction based on management’s best estimation of fair value as of the acquisition date of October 3, 2016. The Company has not completed the transaction’s post-closing settlement, which is scheduled to occur in April 2017. As the post-close settlement has not occurred, management has not had the opportunity to complete its assessment of the fair values of assets acquired and liabilities assumed. Accordingly, the below allocation will change as additional information becomes available and is assessed by the Company, and the impact of such changes may be material. The following table summarizes the preliminary purchase price and the preliminary estimated values of assets acquired and liabilities assumed (in thousands):
|
Preliminary Purchase Price |
|
October 3, 2016 |
| |
|
Consideration given |
|
|
| |
|
Cash |
|
$ |
419,044 |
|
|
Total consideration given(1) |
|
$ |
419,044 |
|
|
Preliminary Allocation of Purchase Price |
|
|
| |
|
Proved oil and gas properties |
|
$ |
252,205 |
|
|
Unproved oil and gas properties |
|
109,800 |
| |
|
Total fair value of oil and gas properties acquired(2) |
|
362,005 |
| |
|
Goodwill(3) |
|
$ |
66,868 |
|
|
Working capital |
|
(6,124 |
) | |
|
Asset retirement obligations |
|
(3,705 |
) | |
|
Preliminary fair value of net assets acquired |
|
$ |
419,044 |
|
|
Working capital acquired was estimated as follows: |
|
|
| |
|
Revenue payable |
|
$ |
(1,888 |
) |
|
Production taxes payable |
|
(3,350 |
) | |
|
Accrued liabilities |
|
(886 |
) | |
|
Total Working Capital |
|
$ |
(6,124 |
) |
(1) Sources of cash are comprised of (i) $185.3 million from the issuance of the Series B Preferred Units, (ii) $161.0 million of borrowings under the credit facility, and (iii) $73.7 million raised from the issuance of Series A Preferred Units, less transaction costs associated with an option arrangement fee of $1.0 million.
(2) Weighted average commodity prices utilized in the determination of the pro forma fair value of oil and gas properties was $53.24 per barrel of oil, $3.25 per Mcf of natural gas and $12.36 per barrel of oil equivalent of NGLs. The prices used were based upon commodity prices on October 3, 2016 using the NYMEX strip.
(3) Goodwill was determined as the excess consideration exchanged over the fair value of Bayswater’s assets acquired and liabilities assumed. Goodwill is primarily attributable to a decrease in commodity prices from the time the acquisition was negotiated and commodity prices on October 3, 2016, and the operational and financial synergies expected to be realized from the acquisition.
The preliminary purchase price allocations have been used to prepare pro forma adjustments for the Bayswater Acquisition. The final purchase price allocations will be determined when the Company when the Company completes the post-closing settlement, which is scheduled to occur in April 2017. The final allocation may result in (i) changes in fair value of proved and unproved oil and gas properties, (ii) changes in goodwill and (iii) other assets and liabilities.
In connection with the closing of the Bayswater Acquisition, the Company was required to make a $10.0 million non-refundable payment for an option to purchase additional assets (“Additional Assets”) from the seller for an additional $190.0 million, for a total purchase price for the Additional Assets of $200.0 million. The option may be exercised at any time until March 31, 2017. If the Company does not exercise the option to acquire the Additional Assets, the seller will have the right until April 30, 2017 to elect to sell those assets to the Company for an additional $120.0 million, for a total purchase price for the Additional Assets of $130.0 million. The $10.0 million payment is not included in the unaudited pro forma financial information.
EXTRACTION OIL & GAS, INC.
NOTES TO UNAUDITED PRO FORMA FINANCIAL STATEMENTS (Continued)
NOTE 3. PRO FORMA ADJUSTMENTS AND ASSUMPTIONS
The Company made the following adjustments and assumptions in the preparation of the unaudited pro forma balance sheet:
(a) Reflects (i) the estimated consideration to be paid in the Bayswater Acquisition, (ii) recording the estimated fair value of acquired assets and liabilities in accordance with the acquisition method of accounting as outlined in Note 2 Business Combinations, (iii) financing of the acquisition which reflects: issuance of $73.7 million of Series A Preferred Units, as defined in “Business—Recent Developments—Convertible Preferred Securities” net of $1.3 million in debt issuance costs, issuance of $185.3 million of Series B Preferred Units, as defined in “Business—Recent Developments—Convertible Preferred Securities” and $161.0 million of borrowings under the revolving credit facility, and (iv) transaction costs associated with an option arrangement fee of $1.0 million and a finder’s fee to an unaffiliated third-party of $2.0 million;
(b) Reflects the deferred tax liabilities arising from temporary difference between the historical cost basis and tax basis of the Company’s assets and liabilities as a result of its change in tax status to a subchapter C corporation;
(c) Reflects the issuance of 108.5 million shares of common stock in exchange for all the membership interest in Preferred Tranche C and Tranche A Units of the Company;
(d) Reflects unit based compensation expense of $172.1 million for incentive unit awards that occurred as a result of the Offering;
(e) Reflects gross proceeds of $728.3 million from the issuance and sale of shares of common stock at the initial public offering price of $19.00 per share, net of underwriting discounts, commissions and other offering costs of approximately $44.6 million, of which $4.5 million were incurred prior to September 30, 2016. Proceeds will be used to repay borrowings of $250.0 million under the revolving credit facility and $90.0 million to exercise the Company’s optional redemption of the Series A Preferred Units (which includes the mandatory redemption charge and for general corporate purposes. Additional paid in capital includes $15.0 million for the mandatory redemption charge including $1.3 million associated with the write off of the issuance costs of the Series A Preferred Units; and
(f) Reflects conversion of Series B Preferred Units into Series A Preferred Stock of $185.3 million, recorded as mezzanine equity net of a discount of $27.8 million, which is offset in additional paid in capital.
(g) Reflects estimated gross proceeds of $457.0 million from the issuance and sale of shares of common stock at the Private Placement price of $18.25 per share, net of underwriting discounts, commissions, and offering costs of approximately $15.2 million. Proceeds will be used for general corporate purposes.
The Company made the following adjustments and assumptions in the preparation of the unaudited pro forma statement of operations for the year ended December 31, 2015:
(a) Reflects the historical revenues and direct operating expenses from the assets acquired and liabilities assumed in the March 2015 Acquisition for the period from January 1, 2015, to the date of acquisition closing, March 10, 2015;
(b) Reflects the historical revenues and direct operating expenses from the assets acquired and liabilities assumed in the Bayswater Acquisition for the period from January 1, 2015, to December 31, 2015;
(c) Reflects estimated incremental income tax provision associated with the Company’s pro forma results of operations assuming the Company’s earnings had been subject to federal and state income tax as a subchapter C corporation using a combined federal and state statutory tax rate of approximately 38%. This rate may be subject to change and may not be reflective of the Company’s effective tax rate for future periods;
EXTRACTION OIL & GAS, INC.
NOTES TO UNAUDITED PRO FORMA FINANCIAL STATEMENTS (Continued)
(d) Reflects the adjustment to depletion, depreciation, amortization expense and accretion expense that would have been recorded had the March 2015 Acquisition and the Bayswater Acquisition occurred on January 1, 2015. The Company utilized reserve reports to estimate the useful lives of the acquired wells and depleted the capitalized costs on a units-of-production basis over the remaining life of proved and proved developed reserves, as described in the “Oil and Gas Properties” accounting policy footnote. The depletion rate used was approximately $18.24 per BOE;
(e) Reflects the reversal of $6.0 million in non-recurring non-cash transaction costs associated with a finder’s fee to an unaffiliated third-party related to the March 2015 Acquisition;
(f) Reflects the reversal of $0.4 million in non-recurring transaction costs related to the March 2015 Acquisition that were incurred during the year ended December 31, 2015;
(g) Reflects interest expense and amortization of debt issuance cost associated with the 2016 Notes Offering offset by (i) a reduction in interest expense and amortization of debt issuance and debt discount costs associated with the retirement of the Second Lien Notes, which have an interest rate of approximately 10.7% and (ii) repayments and drawdown of borrowings under the revolving credit facility, which has an interest rate of approximately 3.0%. A change in interest rate of 0.125 percent would increase or decrease interest expense by approximately $0.4 million for the year ended December 31, 2015;
(h) Reflects interest expenses and amortization of issuance cost associated with the financing of the Bayswater Acquisition;
(i) Reflects the associated income tax effect of pro forma adjustments, using an estimated combined federal and state statutory tax rate of approximately 38%;
(j) Reflects (i) the elimination of remaining interest expense associated with the repayment of borrowings under the revolving credit facility and (ii) the associated income tax effect;
(k) Reflects the issuance of 108.5 million shares of common stock in exchange for all of the membership interest in the Company, the issuance of 38.3 million shares of common stock associated with the offering, and the issuance of 25.0 million shares of common stock associated with the Private Placement;
(l) Reflects basic and diluted earnings per common share for the issuance of shares of common stock in the Corporate Reorganization, the Offering, and Private Placement; and
(m) EPS includes adjustments for Series A Preferred Stock dividends not available to common shareholders. The following table sets forth the computation of pro forma basic and diluted loss per common share for the year ended December 31, 2015 (in thousands, except per share data):
|
Net Loss |
|
$ |
(12,715 |
) |
|
Pro forma adjustment to reflect Series A Preferred Stock dividend |
|
(10,885 |
) | |
|
Pro forma adjustment to reflect accretion of Series A Preferred Stock discount |
|
(5,558 |
) | |
|
Net loss used to compute pro forma net loss per share |
|
$ |
(29,158 |
) |
|
Pro Forma Weighted Average Common Shares Outstanding |
|
|
| |
|
Basic and Diluted |
|
171,835 |
| |
|
Pro Forma Net Loss Per Common Share |
|
|
| |
|
Basic and Diluted |
|
$ |
(0.17 |
) |
The Company made the following adjustments and assumptions in the preparation of the unaudited pro forma statement of operations for the nine months ended September 30, 2016:
(a) Reflects the historical revenues and direct operating expenses from the assets acquired and liabilities assumed in the Bayswater Acquisition for the period from January 1, 2016, to September 30, 2016;
(b) Reflects estimated incremental income tax provision associated with the Company’s pro forma results of operations assuming the Company’s earnings had been subject to federal and state income tax as a
EXTRACTION OIL & GAS, INC.
NOTES TO UNAUDITED PRO FORMA FINANCIAL STATEMENTS (Continued)
subchapter C corporation using a combined federal and state statutory tax rate of approximately 38%. This rate may be subject to change and may not be reflective of the Company’s effective tax rate for future periods;
(c) Reflects adjustments to depletion, depreciation, amortization expense and accretion expense that would have been recorded had the Bayswater Acquisition occurred on January 1, 2015. The Company utilized reserve reports to estimate the useful lives of the acquired wells and depleted the capitalized costs on a units-of-production basis over the remaining life of proved and proved developed reserves, as described in the “Oil and Gas Properties” accounting policy footnote. The depletion rate used was approximately $17.92 per BOE;
(d) Reflects the reversal of $0.3 million in non-recurring transaction costs related to the Bayswater Acquisition that were incurred during the nine months ended September 30, 2016;
(e) Reflects the reversal of non-recurring unit based compensation expense of $11.2 million for the accelerated vesting of all previously outstanding RSUs that were vested in September 2016 in anticipation of the offering.
(f) Reflects interest expense and amortization of debt issuance cost associated with the 2016 Notes Offering offset by (i) a reduction in interest expense and amortization of debt issuance and debt discount costs associated with the retirement of the Second Lien Notes, which have an interest rate of approximately 10.7% and (ii) repayments and drawdown of borrowings under the revolving credit facility, which has an interest rate of approximately 3.0%;
(g) Reflects interest expenses and amortization of issuance cost associated with the financing of the Bayswater Acquisition;
(h) Reflects the associated income tax effect of pro forma adjustments, using an estimated combined federal and state statutory tax rate of approximately 38%;
(i) Reflects (i) the elimination of remaining interest expense associated with the repayment of borrowings under the revolving credit facility, which has an interest rate of approximately 3.0% and (ii) the associated income tax effect. A change in interest rate of 0.125 percent would increase or decrease interest expense by approximately $0.3 million for the nine months ended September 30, 2016;
(j) Reflects the issuance of 108.5 million shares of common stock in exchange for all of the membership interest in the Company, the issuance of 38.3 million shares of common stock associated with the offering, and the issuance of 25.0 million shares of common stock associated with the Private Placement;
(k) Reflects basic and diluted earnings per common share for the issuance of shares of common stock in the Corporate Reorganization, the Offering, and Private Placement; and
(l) EPS includes adjustments for Series A Preferred Stock dividends and accretion of discount not available to common shareholders. The following table sets forth the computation of pro forma basic and diluted loss per common share for the nine months ended September 30, 2016 (in thousands, except per share data):
|
Net Loss |
|
$ |
(97,166 |
) |
|
Pro forma adjustment to reflect Series A Preferred Stock dividend |
|
(8,164 |
) | |
|
Pro forma adjustment to reflect accretion of Series A Preferred Stock discount |
|
(4,169 |
) | |
|
Net loss used to compute pro forma net loss per share |
|
$ |
(109,499 |
) |
|
Pro Forma Weighted Average Common Shares Outstanding |
|
|
| |
|
Basic and Diluted |
|
171,835 |
| |
|
Pro Forma Net Loss Per Common Share |
|
|
| |
|
Basic and Diluted |
|
$ |
(0.64 |
) |
EXTRACTION OIL & GAS, INC.
NOTES TO UNAUDITED PRO FORMA FINANCIAL STATEMENTS (Continued)
NOTE 4. SUPPLEMENTARY DISCLOSURE OF OIL AND GAS OPERATIONS
The following pro forma standardized measure of the discounted net future cash flows and changes applicable to the Company’s proved reserves reflect the effect of income taxes assuming the Company’s standardized measure had been subject to federal and state income tax as a subchapter C corporation. The future cash flows are discounted at 10% per year and assume continuation of existing economic conditions.
The standardized measure of discounted future net cash flows, in management’s opinion, should be examined with caution. The basis for this table is the reserve studies prepared by independent petroleum engineering consultants, which contain imprecise estimates of quantities and rates of production of reserves. Revisions of previous year estimates can have a significant impact on these results. Also, exploration costs in one year may lead to significant discoveries in later years and may significantly change previous estimates of proved reserves and their valuation. Therefore, the standardized measure of discounted future net cash flow is not necessarily indicative of the fair value of the Company’s proved oil and gas properties. The data presented should not be viewed as representing the expected cash flow from or current value of, existing proved reserves since the computations are based on a large number of estimates and arbitrary assumptions. Reserve quantities cannot be measured with precision and their estimation requires many judgmental determinations and frequent revisions. Actual future prices and costs are likely to be substantially different from the prices and costs utilized in the computation of reported amounts.
The following table provides a pro forma rollforward of the total proved reserves for the year ended December 31, 2015, as well as pro forma proved developed and proved undeveloped reserves at the beginning and end of the year, as if the March 2015 Acquisition and the Bayswater Acquisition reflected occurred on January 1, 2015:
|
|
|
Extraction Oil & |
|
March 2015 |
|
Bayswater |
|
Pro Forma |
|
|
Proved developed and undeveloped reserves: |
|
|
|
|
|
|
|
|
|
|
January 1, 2015 |
|
92,352 |
|
— |
|
— |
|
92,352 |
|
|
Revisions of previous estimates |
|
(1,150 |
) |
(538 |
) |
(1,789 |
) |
(3,477 |
) |
|
Purchase of reserves |
|
30,097 |
|
(26,597 |
) |
21,316 |
|
24,816 |
|
|
Extensions, discoveries and other additions |
|
49,059 |
|
27,208 |
|
7,515 |
|
83,782 |
|
|
Discoveries |
|
— |
|
— |
|
— |
|
— |
|
|
Sale of reserves |
|
(4,627 |
) |
— |
|
— |
|
(4,627 |
) |
|
Production |
|
(7,084 |
) |
(73 |
) |
(515 |
) |
(7,672 |
) |
|
December 31, 2015 |
|
158,647 |
|
— |
|
26,527 |
|
185,174 |
|
|
Proved developed reserves: |
|
|
|
|
|
|
|
|
|
|
January 1, 2015 |
|
19,845 |
|
— |
|
— |
|
19,845 |
|
|
December 31, 2015 |
|
30,142 |
|
— |
|
10,643 |
|
40,785 |
|
|
Proved undeveloped reserves: |
|
|
|
|
|
|
|
|
|
|
January 1, 2015 |
|
72,507 |
|
— |
|
— |
|
72,507 |
|
|
December 31, 2015 |
|
128,505 |
|
— |
|
15,884 |
|
144,389 |
|
The pro forma standardized measure of discounted estimated future net cash flows was as follows as of December 31, 2015 (in thousands):
|
|
|
Extraction Oil & |
|
Bayswater |
|
Corporate |
|
Pro Forma |
| ||||
|
Future crude oil, natural gas and NGL sales |
|
$ |
4,119,888 |
|
$ |
735,986 |
|
$ |
— |
|
$ |
4,855,874 |
|
|
Future production costs |
|
(1,193,560 |
) |
(217,901 |
) |
— |
|
(1,411,461 |
) | ||||
|
Future development costs |
|
(1,141,330 |
) |
(82,411 |
) |
— |
|
(1,223,741 |
) | ||||
|
Future income tax expense |
|
— |
|
— |
|
(519,209 |
) |
(519,209 |
) | ||||
|
Future net cash flows |
|
1,784,998 |
|
435,674 |
|
(519,209 |
) |
1,701,463 |
| ||||
|
10% annual discount |
|
(949,115 |
) |
(184,526 |
) |
255,718 |
|
(877,923 |
) | ||||
|
Standardized measure of discounted future net cash flows |
|
$ |
835,883 |
|
$ |
251,148 |
|
$ |
(263,491 |
) |
$ |
823,540 |
|
The changes in the pro forma standardized measure of discounted estimated future net cash flows were as follows for 2015 (in thousands):
EXTRACTION OIL & GAS, INC.
NOTES TO UNAUDITED PRO FORMA FINANCIAL STATEMENTS (Continued)
|
|
|
Extraction Oil & |
|
March 2015 |
|
Bayswater |
|
Corporate |
|
Pro Forma |
| |||||
|
January 1, 2015 |
|
$ |
1,387,472 |
|
$ |
— |
|
$ |
— |
|
$ |
— |
|
$ |
1,387,472 |
|
|
Sales of crude oil, natural gas and NGL, net |
|
(150,087 |
) |
(263 |
) |
(9,634 |
) |
— |
|
(159,984 |
) | |||||
|
Net change in prices and production costs |
|
(1,292,364 |
) |
(5,669 |
) |
(219,981 |
) |
— |
|
(1,518,014 |
) | |||||
|
Net change in future development costs |
|
175,944 |
|
(14,360 |
) |
19,840 |
|
— |
|
181,424 |
| |||||
|
Extensions and discoveries |
|
284,216 |
|
225,348 |
|
84,613 |
|
— |
|
594,177 |
| |||||
|
Acquisitions of reserves |
|
240,989 |
|
(212,728 |
) |
307,453 |
|
— |
|
335,714 |
| |||||
|
Sale of reserves |
|
(50,018 |
) |
— |
|
— |
|
— |
|
(50,018 |
) | |||||
|
Revisions of previous quantity estimates |
|
(28,391 |
) |
(8,859 |
) |
(38,445 |
) |
— |
|
(75,695 |
) | |||||
|
Previously estimated development costs incurred |
|
102,060 |
|
— |
|
72,594 |
|
— |
|
174,654 |
| |||||
|
Net change in income taxes |
|
— |
|
— |
|
— |
|
(263,491 |
) |
(263,491 |
) | |||||
|
Accretion of discount |
|
156,723 |
|
1,451 |
|
29,357 |
|
— |
|
187,531 |
| |||||
|
Other |
|
9,339 |
|
15,080 |
|
5,351 |
|
— |
|
29,770 |
| |||||
|
December 31, 2015 |
|
$ |
835,883 |
|
$ |
— |
|
$ |
251,148 |
|
$ |
(263,491 |
) |
$ |
823,540 |
|


Report of Independent Registered Public Accounting Firm
To the Board of Managers of Extraction Oil & Gas Holdings, LLC:
In our opinion, the accompanying consolidated balance sheets and the related consolidated statements of operations, changes in members’ equity and cash flows present fairly, in all material respects, the financial position of Extraction Oil & Gas Holdings, LLC and its subsidiaries at December 31, 2015 and December 31, 2014, and the results of their operations and their cash flows for each of the two years in the period ended December 31, 2015 in conformity with accounting principles generally accepted in the United States of America. These financial statements are the responsibility of the Company’s management. Our responsibility is to express an opinion on these financial statements based on our audits. We conducted our audits of these statements in accordance with the standards of the Public Company Accounting Oversight Board (United States), and in accordance with auditing standards generally accepted in the United States of America. Those standards require that we plan and perform the audit to obtain reasonable assurance about whether the financial statements are free of material misstatement. An audit includes examining, on a test basis, evidence supporting the amounts and disclosures in the financial statements, assessing the accounting principles used and significant estimates made by management, and evaluating the overall financial statement presentation. We believe that our audits provide a reasonable basis for our opinion.
As discussed in Note 2 to the consolidated financial statements, the Company changed the manner in which it accounts for the presentation of debt issuance costs in 2015.
/s/ PricewaterhouseCoopers LLP
Denver, Colorado
April 22, 2016, except for the disclosure of basic and diluted earnings per unit within the Consolidated Statement of Operations and related disclosures within Note 11, as to which the date is July 8, 2016 and the disclosure of debt issuance costs within the Consolidated Balance Sheet and related disclosures within Note 2 and Note 5, as to which the date is September 13, 2016.
EXTRACTION OIL & GAS HOLDINGS, LLC
(In thousands)
|
|
|
December 31, |
|
December 31, |
| ||
|
ASSETS |
|
|
|
|
| ||
|
Current Assets: |
|
|
|
|
| ||
|
Cash and cash equivalents |
|
$ |
97,106 |
|
$ |
79,025 |
|
|
Accounts receivable |
|
|
|
|
| ||
|
Trade |
|
27,927 |
|
28,311 |
| ||
|
Oil, natural gas and NGL sales |
|
15,938 |
|
11,418 |
| ||
|
Inventory and prepaid expenses |
|
7,938 |
|
4,451 |
| ||
|
Commodity derivative asset |
|
68,885 |
|
39,793 |
| ||
|
Total Current Assets |
|
217,794 |
|
162,998 |
| ||
|
Property and Equipment (successful efforts method), at cost: |
|
|
|
|
| ||
|
Proved oil and gas properties |
|
1,128,022 |
|
594,847 |
| ||
|
Unproved oil and gas properties |
|
374,194 |
|
405,632 |
| ||
|
Wells in progress |
|
59,416 |
|
41,160 |
| ||
|
Less: accumulated depletion, depreciation and amortization |
|
(181,382 |
) |
(33,896 |
) | ||
|
Net oil and gas properties |
|
1,380,250 |
|
1,007,743 |
| ||
|
Other property and equipment, net of accumulated depreciation of $6,109 and $218, respectively |
|
30,402 |
|
12,642 |
| ||
|
Net Property and Equipment |
|
1,410,652 |
|
1,020,385 |
| ||
|
Non-Current Assets: |
|
|
|
|
| ||
|
Cash held in escrow |
|
— |
|
10,071 |
| ||
|
Other non-current assets |
|
1,846 |
|
1,507 |
| ||
|
Deferred equity issuance costs |
|
942 |
|
— |
| ||
|
Commodity derivative asset |
|
2,906 |
|
6,108 |
| ||
|
Total Non-Current Assets |
|
5,694 |
|
17,686 |
| ||
|
Total Assets |
|
$ |
1,634,140 |
|
$ |
1,201,069 |
|
|
LIABILITIES AND MEMBERS’ EQUITY |
|
|
|
|
| ||
|
Current Liabilities: |
|
|
|
|
| ||
|
Accounts payable and accrued liabilities |
|
$ |
111,127 |
|
$ |
81,611 |
|
|
Due to related party |
|
— |
|
183 |
| ||
|
Revenue payable |
|
38,752 |
|
35,050 |
| ||
|
Production taxes payable |
|
19,061 |
|
7,149 |
| ||
|
Accrued interest payable |
|
450 |
|
173 |
| ||
|
Asset retirement obligations |
|
952 |
|
1,175 |
| ||
|
Total Current Liabilities |
|
170,342 |
|
125,341 |
| ||
|
Non-Current Liabilities: |
|
|
|
|
| ||
|
Credit facility |
|
225,000 |
|
100,000 |
| ||
|
Second Lien Notes, net of unamortized debt discount and debt issuance costs (Note 5) |
|
412,790 |
|
408,903 |
| ||
|
Production taxes payable |
|
25,275 |
|
16,362 |
| ||
|
Other non-current liabilities |
|
3,086 |
|
— |
| ||
|
Asset retirement obligations |
|
43,415 |
|
5,275 |
| ||
|
Total Non-Current Liabilities |
|
709,566 |
|
530,540 |
| ||
|
Commitments and Contingencies—Note 12 |
|
|
|
|
| ||
|
Total Liabilities |
|
879,908 |
|
655,881 |
| ||
|
Members’ Equity: |
|
|
|
|
| ||
|
Preferred tranche C units; unlimited units authorized; 78,445,361 units issued and outstanding |
|
250,338 |
|
— |
| ||
|
Tranche A units; unlimited units authorized; 231,404,112 units issued and outstanding |
|
501,128 |
|
495,158 |
| ||
|
Retained earnings |
|
2,766 |
|
50,030 |
| ||
|
Total Members’ Equity |
|
754,232 |
|
545,188 |
| ||
|
Total Liabilities and Members’ Equity |
|
$ |
1,634,140 |
|
$ |
1,201,069 |
|
THE ACCOMPANYING NOTES ARE AN INTEGRAL PART OF THESE
CONSOLIDATED FINANCIAL STATEMENTS
EXTRACTION OIL & GAS HOLDINGS, LLC
CONSOLIDATED STATEMENTS OF OPERATIONS
(In thousands, except per unit data)
|
|
|
For the Years Ended December 31, |
| ||||
|
|
|
2015 |
|
2014 |
| ||
|
Revenues: |
|
|
|
|
| ||
|
Oil sales |
|
$ |
157,024 |
|
$ |
75,460 |
|
|
Natural gas sales |
|
26,019 |
|
9,247 |
| ||
|
NGL sales |
|
14,707 |
|
8,133 |
| ||
|
Total Revenues |
|
197,750 |
|
92,840 |
| ||
|
Operating Expenses: |
|
|
|
|
| ||
|
Lease operating expenses |
|
30,628 |
|
5,067 |
| ||
|
Production taxes |
|
17,035 |
|
9,743 |
| ||
|
Exploration expenses |
|
18,636 |
|
126 |
| ||
|
Depletion, depreciation, amortization and accretion |
|
146,547 |
|
34,042 |
| ||
|
Impairment of long lived assets |
|
15,778 |
|
— |
| ||
|
Other operating expense |
|
2,353 |
|
— |
| ||
|
Acquisition transaction expenses |
|
6,000 |
|
— |
| ||
|
General and administrative expenses |
|
37,149 |
|
19,598 |
| ||
|
Total Operating Expenses |
|
274,126 |
|
68,576 |
| ||
|
Operating Income (Loss) |
|
(76,376 |
) |
24,264 |
| ||
|
Other Income (Expense): |
|
|
|
|
| ||
|
Commodity derivatives gain |
|
79,932 |
|
48,008 |
| ||
|
Interest expense |
|
(51,030 |
) |
(22,454 |
) | ||
|
Other income |
|
210 |
|
24 |
| ||
|
Other Income (Expense) |
|
29,112 |
|
25,578 |
| ||
|
Net Income (Loss) |
|
$ |
(47,264 |
) |
$ |
49,842 |
|
|
Income (Loss) per Unit |
|
|
|
|
| ||
|
Basic |
|
$ |
(0.17 |
) |
$ |
0.28 |
|
|
Diluted |
|
$ |
(0.17 |
) |
$ |
0.26 |
|
|
Weighted Average Units Outstanding |
|
|
|
|
| ||
|
Basic |
|
277,322 |
|
180,429 |
| ||
|
Diluted |
|
277,322 |
|
189,938 |
| ||
|
Pro Forma Information (unaudited): |
|
|
|
|
| ||
|
Net loss |
|
$ |
(47,264 |
) |
|
| |
|
Pro forma provision for income taxes |
|
17,960 |
|
|
| ||
|
Pro forma net loss |
|
$ |
(29,304 |
) |
|
| |
|
Pro forma net loss per common share |
|
|
|
|
| ||
|
Basic and diluted |
|
$ |
(0.11 |
) |
|
| |
|
Weighted average pro forma common share outstanding |
|
|
|
|
| ||
|
Basic and diluted |
|
277,322 |
|
|
| ||
THE ACCOMPANYING NOTES ARE AN INTEGRAL PART OF THESE
CONSOLIDATED FINANCIAL STATEMENTS
EXTRACTION OIL & GAS HOLDINGS, LLC
CONSOLIDATED STATEMENTS OF CHANGES IN MEMBERS’ EQUITY
(In thousands)
|
|
|
Tranche A Units |
|
Preferred |
|
Amount |
|
Retained |
|
Total Members’ |
| |||
|
Balance at January 1, 2014 |
|
— |
|
— |
|
$ |
1,174 |
|
$ |
188 |
|
$ |
1,362 |
|
|
Related party—note payable converted to equity |
|
62,423 |
|
— |
|
62,423 |
|
— |
|
62,423 |
| |||
|
Convertible notes converted to equity |
|
14,514 |
|
— |
|
38,950 |
|
— |
|
38,950 |
| |||
|
Units issued |
|
150,175 |
|
— |
|
403,038 |
|
— |
|
403,038 |
| |||
|
Unit issuance costs |
|
— |
|
— |
|
(9,843 |
) |
— |
|
(9,843 |
) | |||
|
Promissory notes issued to officers |
|
— |
|
— |
|
(5,368 |
) |
— |
|
(5,368 |
) | |||
|
Restricted stock units issued |
|
671 |
|
— |
|
— |
|
— |
|
— |
| |||
|
Unit-based compensation |
|
— |
|
— |
|
4,462 |
|
— |
|
4,462 |
| |||
|
Units issued for oil and gas properties |
|
120 |
|
— |
|
322 |
|
— |
|
322 |
| |||
|
Net income |
|
— |
|
— |
|
— |
|
49,842 |
|
49,842 |
| |||
|
Balance at December 31, 2014 |
|
227,903 |
|
— |
|
$ |
495,158 |
|
$ |
50,030 |
|
$ |
545,188 |
|
|
Units issued |
|
— |
|
78,444 |
|
254,986 |
|
— |
|
254,986 |
| |||
|
Unit issuance costs |
|
— |
|
— |
|
(4,648 |
) |
— |
|
(4,648 |
) | |||
|
Restricted stock units issued |
|
3,198 |
|
— |
|
— |
|
— |
|
— |
| |||
|
Unit-based compensation |
|
— |
|
— |
|
5,970 |
|
— |
|
5,970 |
| |||
|
Net loss |
|
— |
|
— |
|
— |
|
(47,264 |
) |
(47,264 |
) | |||
|
Balance at December 31, 2015 |
|
231,101 |
|
78,444 |
|
$ |
751,466 |
|
$ |
2,766 |
|
$ |
754,232 |
|
THE ACCOMPANYING NOTES ARE AN INTEGRAL PART OF THESE
CONSOLIDATED FINANCIAL STATEMENTS
EXTRACTION OIL & GAS HOLDINGS, LLC
CONSOLIDATED STATEMENTS OF CASH FLOWS
(In thousands)
|
|
|
For the Years Ended December 31, |
| ||||
|
|
|
2015 |
|
2014 |
| ||
|
Cash flows from operating activities: |
|
|
|
|
| ||
|
Net income (loss) |
|
$ |
(47,264 |
) |
$ |
49,842 |
|
|
Reconciliation of net income (loss) to net cash provided by operating activities: |
|
|
|
|
| ||
|
Depletion, depreciation, amortization and accretion |
|
146,547 |
|
34,042 |
| ||
|
Abandonment and impairment of unproved properties |
|
16,414 |
|
— |
| ||
|
Impairment of long lived assets |
|
15,778 |
|
— |
| ||
|
Acquisition transaction expenses |
|
6,000 |
|
— |
| ||
|
Amortization of debt issuance costs and debt discount, net |
|
5,604 |
|
1,985 |
| ||
|
Deferred rent |
|
488 |
|
— |
| ||
|
Commodity derivatives gain |
|
(79,932 |
) |
(48,008 |
) | ||
|
Settlements on commodity derivatives |
|
55,770 |
|
1,724 |
| ||
|
Premiums paid on commodity derivatives |
|
(5,744 |
) |
(1,867 |
) | ||
|
Unit-based compensation |
|
5,970 |
|
4,462 |
| ||
|
Changes in current assets and liabilities: |
|
|
|
|
| ||
|
Accounts receivable—trade |
|
7,723 |
|
(25,290 |
) | ||
|
Accounts receivable—oil, natural gas and NGL sales |
|
(4,520 |
) |
(10,328 |
) | ||
|
Prepaid expenses |
|
(1,024 |
) |
2,583 |
| ||
|
Accounts payable and accrued liabilities |
|
24,452 |
|
11,096 |
| ||
|
Revenue payable |
|
2,984 |
|
35,050 |
| ||
|
Production taxes payable |
|
19,085 |
|
23,511 |
| ||
|
Accrued interest payable |
|
277 |
|
173 |
| ||
|
Asset retirement expenditures |
|
(1,742 |
) |
(662 |
) | ||
|
Due to related party |
|
(183 |
) |
(923 |
) | ||
|
Net cash provided by operating activities |
|
166,683 |
|
77,390 |
| ||
|
Cash flows from investing activities: |
|
|
|
|
| ||
|
Oil and gas property additions |
|
(391,250 |
) |
(240,447 |
) | ||
|
Acquired oil and gas properties |
|
(120,524 |
) |
(707,315 |
) | ||
|
Sale of oil and gas properties |
|
4,742 |
|
— |
| ||
|
Other property and equipment |
|
(23,045 |
) |
(12,807 |
) | ||
|
Cash held in escrow |
|
10,071 |
|
(10,071 |
) | ||
|
Net cash used in investing activities |
|
(520,006 |
) |
(970,640 |
) | ||
|
Cash flows from financing activities: |
|
|
|
|
| ||
|
Related party—note payable converted to equity |
|
— |
|
38,750 |
| ||
|
Convertible notes converted to equity |
|
— |
|
38,950 |
| ||
|
Borrowings under credit facility |
|
125,000 |
|
100,000 |
| ||
|
Proceeds from the issuance of Second Lien Notes |
|
— |
|
423,550 |
| ||
|
Proceeds from the issuance of units |
|
254,986 |
|
397,670 |
| ||
|
Debt issuance costs |
|
(2,876 |
) |
(17,318 |
) | ||
|
Unit and deferred equity issuance costs |
|
(5,706 |
) |
(9,512 |
) | ||
|
Net cash provided by financing activities |
|
371,404 |
|
972,090 |
| ||
|
Increase in cash and cash equivalents |
|
18,081 |
|
78,840 |
| ||
|
Cash and cash equivalents at beginning of period |
|
79,025 |
|
185 |
| ||
|
Cash and cash equivalents at end of the period |
|
$ |
97,106 |
|
$ |
79,025 |
|
|
Supplemental cash flow information: |
|
|
|
|
| ||
|
Property and equipment included in accounts payable and accrued liabilities |
|
$ |
72,236 |
|
$ |
69,262 |
|
|
Acquisition transaction expenses paid through oil and gas properties |
|
$ |
6,000 |
|
$ |
— |
|
|
Oil and gas property acquired through units |
|
$ |
— |
|
$ |
322 |
|
|
Cash paid for interest |
|
$ |
50,380 |
|
$ |
22,432 |
|
|
Promissory notes issued to officers |
|
$ |
— |
|
$ |
5,368 |
|
THE ACCOMPANYING NOTES ARE AN INTEGRAL PART OF THESE
CONSOLIDATED FINANCIAL STATEMENTS
EXTRACTION OIL & GAS HOLDINGS, LLC
NOTES TO CONSOLIDATED FINANCIAL STATEMENTS
Note 1—Organization
Description of Operations
Extraction Oil & Gas Holdings, LLC (“Holdings” or the “Company”), a Delaware limited liability company was formed on May 29, 2014 by PRE Resources, LLC (“PRL”) as a holding company with no independent operations apart from its ownership of the subsidiaries described below. PRL was formed in May 2012 to invest in oil and gas properties in Michigan, California, Wyoming, North Dakota and Colorado.
Extraction Oil & Gas, LLC (“Extraction”) formally a wholly-owned subsidiary of PRL is a wholly-owned subsidiary of Holdings. Extraction was formed on November 14, 2012, as a Delaware limited liability company and is focused on the acquisition, development and production of oil, natural gas and natural gas liquids (“NGL”) reserves in the Rocky Mountains, primarily in the Wattenberg Field of the Denver-Julesburg Basin (the “DJ Basin”) of Colorado.
Concurrent with the formation of Holdings, PRL contributed all of its membership interests in Extraction, to Holdings and distributed all of its interests in Holdings to its members in a pro rata distribution (the “Reorganization”). As all power and authority to control the core functions of Holdings and Extraction were controlled by PRL, the Reorganization was accounted for as a reorganization of entities under common control and the assets and liabilities of Extraction were recorded at Extraction’s historical costs. The consolidated financial statements have been retrospectively recast for all periods prior to May 29, 2014 to reflect the Reorganization as if the transfer of net assets occurred at the beginning of the period. Results of operations for the 2014 period include the results of operations from Extraction, the previously separate entity, from January 1, 2014 to May 29, 2014, the date the transfer was completed.
At the Reorganization, Yorktown Energy Partners (“Yorktown”) controlled Holdings through ownership of 76.1% of its membership interests. The remaining 23.9% of Holdings’ membership interests was owned by certain members of management and other third-party investors. Immediately after the Reorganization, Holdings completed an offering of its membership units (see Note 9—Members’ Equity). Following the membership offering, Yorktown controlled 51.8% of Holdings through three funds: Yorktown Energy Fund IX, LP, Yorktown Energy Fund X, LP, and Yorktown Extraction Co-Investment Partners, LP.
Subsequent to the membership offering described above, the Company issued additional membership interests (see Note 9—Members’ Equity). As a result, Yorktown owns 50.1% and certain members of management and other third-party investors own 49.9% of Holdings’ at December 31, 2015.
XTR Midstream, LLC (“XTR”) is also a wholly-owned subsidiary of Holdings. XTR was formed on September 10, 2014, as a Delaware limited liability company and is designing midstream assets to gather and process crude oil and gas production in the DJ Basin of Colorado.
7N, LLC (“7N”) is also a wholly-owned subsidiary of Holdings. 7N, LLC was formed on September 10, 2014, as a Delaware limited liability company to acquire certain real property and rights-of-way to support the build-out of XTR’s gathering and processing system.
Mountaintop Minerals, LLC (“Mountaintop”) is also a wholly-owned subsidiary of Holdings. Mountaintop was formed on March 10, 2015, as a Delaware limited liability company to engage in the acquisition of minerals, primarily in the DJ Basin of Colorado.
8 North, LLC (“8 North”) is also a wholly-owned subsidiary of Holdings. 8 North was formed on April 29, 2015, as a Delaware limited liability company and assigned certain leases in Boulder and Weld Counties previously owned by Extraction Oil & Gas, LLC. 8 North, LLC was formed to engage in the development of oil and gas leases currently categorized as unproved with a specific focus on Northern Colorado.
EXTRACTION OIL & GAS HOLDINGS, LLC
NOTES TO CONSOLIDATED FINANCIAL STATEMENTS (Continued)
XOG Services, LLC (“XOG”) is also a wholly-owned subsidiary of Holdings. XOG Services, LLC was formed on November 13, 2015, as a Delaware limited liability company to administer payroll and other general and administrative functions beginning in 2016 for all Holdings’ subsidiaries.
Note 2—Basis of Presentation and Significant Accounting Policies
Basis of Presentation
The consolidated financial statements include the accounts of the Company, including its wholly-owned subsidiaries, which are collectively referred to as “Holdings” or the “Company”. All significant intercompany balances and transactions have been eliminated in consolidation. The financial statements included herein were prepared from the records of the Company in accordance with generally accepted accounting principles in the United States (“GAAP”). In the opinion of management, all adjustments, consisting primarily of normal recurring accruals that are considered necessary for a fair presentation of the consolidated financial information, have been included.
Use of Estimates in the Preparation of Financial Statements
The preparation of the consolidated financial statements in conformity with GAAP requires management to make estimates and assumptions that affect the reported amounts of oil and gas reserves, assets and liabilities and disclosure of contingent assets and liabilities at the date of the financial statements and the reported amounts of revenues and expenses during the reporting period. Significant areas requiring the use of assumptions, judgments and estimates include (1) oil and gas reserves; (2) cash flow estimates used in impairment testing of oil and gas properties; (3) depreciation, depletion and amortization; (4) asset retirement obligations; (5) assigning fair value and allocating purchase price in connection with business combinations; (6) accrued revenue and related receivables; (7) valuation of commodity derivative instruments; (8) accrued liabilities; and (9) valuation of unit based payments. Although management believes these estimates are reasonable, actual results could differ from these estimates. The Company evaluates its estimates on an on-going basis and bases its estimates on historical experience and on various other assumptions the Company believes to be reasonable under the circumstances. Although actual results may differ from these estimates under different assumptions or conditions, the Company believes its estimates are reasonable.
Cash and Cash Equivalents
Cash and cash equivalents consist of all highly liquid investments that are readily convertible into cash and have original maturities of three months or less when purchased.
Cash Held in Escrow
Cash held in escrow includes deposits for purchases of certain oil and gas properties as required under the related purchase and sale agreements. On March 10, 2015, $10.1 million of cash held in escrow as of December 31, 2014, was released at closing of the 2015 purchase of certain oil and gas properties in Adams, Broomfield, Boulder and Weld Counties, Colorado. Please refer to Note 4—Acquisitions for further information.
Accounts Receivable
The Company records estimated oil and gas revenue receivable from third parties at its net revenue interest. The Company also reflects costs incurred on behalf of joint interest partners in accounts receivable. The Company generally has the ability to withhold future revenue disbursements to recover non-payment of joint interest billings. On an on-going basis, management reviews accounts receivable amounts for collectability and records its allowance for uncollectible receivables under the specific identification method. The Company did not record any allowance for uncollectible receivables for the years ended December 31, 2015 and 2014.
EXTRACTION OIL & GAS HOLDINGS, LLC
NOTES TO CONSOLIDATED FINANCIAL STATEMENTS (Continued)
Credit Risk and Other Concentrations
The Company’s cash and cash equivalents are exposed to concentrations of credit risk. The Company manages and controls this risk by investing these funds with major financial institutions. The Company often has balances in excess of the federally insured limits.
The Company sells oil, natural gas and natural gas liquids (“NGL”) to various types of customers, including pipelines and refineries. Credit is extended based on an evaluation of the customer’s financial conditions and historical payment record. The future availability of a ready market for oil, natural gas and NGL depends on numerous factors outside the Company’s control, none of which can be predicted with certainty. For the years ended December 31, 2015 and 2014, the Company had the following major customers that exceeded 10% of total oil, natural gas and NGL revenues. The Company does not believe the loss of any single purchaser would materially impact its operating results because crude oil, natural gas and NGLs are fungible products with well-established markets and numerous purchasers.
|
|
|
For the Years Ended December 31, |
| ||
|
|
|
2015 |
|
2014 |
|
|
Customer A |
|
30 |
% |
0 |
% |
|
Customer B |
|
24 |
% |
54 |
% |
|
Customer C |
|
17 |
% |
8 |
% |
|
Customer D |
|
17 |
% |
16 |
% |
At December 31, 2015, the Company had commodity derivative contracts with six counterparties. The Company does not require collateral or other security from counterparties to support derivative instruments; however, to minimize the credit risk in derivative instruments, it is the Company’s policy to enter into derivative contracts only with counterparties that are credit worthy financial institutions deemed by management as competent and competitive market-makers. Additionally, the Company uses master netting agreements to minimize credit-risk exposure. The credit worthiness of the Company’s counterparties is subject to periodic review. Three of the six counterparties to the derivative instruments are highly rated entities with corporate ratings at A3 classifications by Moody’s. The other three counterparties had a corporate rating of Baa1 by Moody’s. For the years ended December 31, 2015 and 2014, the Company did not incur any significant losses with respect to counterparty contracts. None of the Company’s existing derivative instrument contracts contains credit-risk related contingent features.
Inventory and prepaid expenses
The Company records well equipment inventory at the lower of cost or market value. Prepaid expenses and prepaid water are recorded at cost. Inventory and prepaid expenses are comprised of the following (in thousands):
|
|
|
December 31, |
|
December 31, |
| ||
|
Well equipment inventory |
|
$ |
6,238 |
|
$ |
3,431 |
|
|
Prepaid water |
|
253 |
|
622 |
| ||
|
Prepaid expenses |
|
1,447 |
|
398 |
| ||
|
|
|
$ |
7,938 |
|
$ |
4,451 |
|
Oil and Gas Properties
The Company follows the successful efforts method of accounting for oil and gas properties. Under this method of accounting, all property acquisition costs and development costs are capitalized when incurred and depleted on a units-of-production basis over the remaining life of proved reserves and proved developed reserves, respectively. At December 31, 2015 and 2014, the Company excluded $59.4 million and $41.2 million of capitalized costs from depletion related to wells in progress, respectively. Depreciation and depletion expense on capitalized oil and gas property was $140.2 million and $33.5 million for the years ended December 31, 2015 and 2014, respectively.
The costs of exploratory wells are initially capitalized pending a determination of whether proved reserves have been found. At the completion of drilling activities, the costs of exploratory wells remain capitalized if a
EXTRACTION OIL & GAS HOLDINGS, LLC
NOTES TO CONSOLIDATED FINANCIAL STATEMENTS (Continued)
determination is made that proved reserves have been found. If no proved reserves have been found, the costs of exploratory wells are charged to expense. In some cases, a determination of proved reserves cannot be made at the completion of drilling, requiring additional testing and evaluation of the wells. Cost incurred for exploratory wells that find reserves that cannot yet be classified as proved are capitalized if (a) the well has found a sufficient quantity of reserves to justify its completion as a producing well and (b) sufficient progress in assessing the reserves and the economic and operating viability of the project has been made. The status of suspended well costs is monitored continuously and reviewed not less than annually. Due to the capital-intensive nature and the geographical location of certain projects, it may take an extended period of time to evaluate the future potential of an exploration project and the economics associated with making a determination of its commercial viability. As of December 31, 2015, the Company had approximately $17.3 million in suspended well costs, all capitalized less than one year. The suspended well costs are included in wells in progress at December 31, 2015. These exploratory well costs are pending further engineering evaluation and analysis to determine if economic quantities of oil and gas reserves have been discovered. We expect our analysis to be complete in the second half of 2016. As of December 31, 2014, the Company had no suspended well costs recorded.
Geological and geophysical costs are expensed as incurred. Costs of seismic studies that are utilized in development drilling within an area of proved reserves are capitalized as development costs. Amounts of seismic costs capitalized are based on only those blocks of data used in determining development well locations. To the extent that a seismic project covers areas of both developmental and exploratory drilling, those seismic costs are proportionately allocated between development costs and exploration expense.
The Company capitalizes interest, if debt is outstanding, during drilling operations in its exploration and development activities. For the years ended December 31, 2015 and 2014, the Company capitalized interest of approximately $5.3 million and $2.6 million, respectively.
Impairment of Oil and Gas Properties
Proved oil and gas properties are reviewed for impairment annually or when events and circumstances indicate a possible decline in the recoverability of the carrying amount of such property. For each of our subsidiaries, the Company estimates the expected future cash flows of its oil and gas properties and compares these undiscounted cash flows to the carrying amount of the oil and gas properties to determine if the carrying amount is recoverable. If the carrying amount exceeds the estimated undiscounted future cash flows, the Company will write down the carrying amount of the oil and gas properties to fair value. The factors used to determine fair value include, but are not limited to, estimates of reserves, future commodity prices, future production estimates, estimated future capital expenditures and discount rates commensurate with the risk associated with realizing the projected cash flows. Impairment expense for proved properties is reported in impairment of long lived assets in the consolidated statements of operations. In December 2015, Extraction sold proved oil and gas properties for proceeds of $4.7 million. As a result, these assets were fair valued on the date of the transaction in accordance with ASC 360, Property, Plant and Equipment. The net book value of these assets exceeded the fair value by $2.7 million, which the Company recognized as impairment expense. Additionally, the Company recorded impairment expense of $9.5 million related to impairment of its subsidiary, 8 North. 8 North had negative future undiscounted cash flows associated with its proved oil and gas properties as of December 31, 2015, and it was determined that 8 North’s proved oil and gas properties had no remaining fair value. Therefore, 8 North’s full net book value of proved oil and gas properties were impaired. The Company recognized $12.2 million in impairment expense attributable to proved oil and gas properties for the year ended December 31, 2015. No impairment expense was recognized for the year ended December 31, 2014.
Unproved oil and gas properties consist of costs to acquire unevaluated leases as well as costs to acquire unproved reserves. The Company evaluates significant unproved oil and gas properties for impairment based on remaining lease term, drilling results, reservoir performance, seismic interpretation or future plans to develop acreage. When successful wells are drilled on undeveloped leaseholds, unproved property costs are reclassified to proved properties and depleted on a unit-of-production basis. Impairment expense for unproved properties is reported in exploration expenses in the consolidated statements of operations. The Company recognized $16.4 million in impairment expense for the year ended December 31, 2015 attributable to the abandonment and impairment of unproved properties. No impairment expense was attributable to unproved properties for the year ended December 31, 2014.
EXTRACTION OIL & GAS HOLDINGS, LLC
NOTES TO CONSOLIDATED FINANCIAL STATEMENTS (Continued)
Other Property and Equipment
Other property and equipment consists of (i) XTR assets such as rights of way, pipelines, equipment and engineering costs, (ii) compressors used in Extraction’s oil and gas operations, (iii) land to be used in the future development of the Company’s gas plant, compressor stations, central tank batteries, and disposal well facilities and (iv) other property and equipment including, office furniture and fixtures, leasehold improvements and computer hardware and software. Impairment expense for other property and equipment is reported in impairment of long lived assets in the consolidated statements of operations. The company recognized $3.6 million in impairment expense related to midstream facilities for the year ended December 31, 2015, which increased accumulated depreciation. The Company recognized this impairment expense as the result of contraction in the local oil and gas industry’s near term growth profile, therefore decreasing the need and support for the proposed gas processing facilities. No impairment expense was recorded for the year ended December 31, 2014. Other property and equipment is recorded at cost and depreciated using the straight-line method over their estimated useful lives ranging from three to 25 years. Other property and equipment is comprised of the following (in thousands):
|
|
|
December 31, |
|
December 31, |
| ||
|
Rental equipment |
|
$ |
2,910 |
|
$ |
1,315 |
|
|
Land |
|
14,778 |
|
4,104 |
| ||
|
Midstream facilities |
|
10,783 |
|
5,686 |
| ||
|
Office leasehold improvements |
|
3,967 |
|
230 |
| ||
|
Other |
|
4,073 |
|
1,525 |
| ||
|
Less: accumulated depreciation |
|
(6,109 |
) |
(218 |
) | ||
|
|
|
$ |
30,402 |
|
$ |
12,642 |
|
Deferred Lease Incentives
All incentives received from landlords for office leasehold improvements are recorded as deferred lease incentives and amortized over the term of the respective lease on a straight-line basis as a reduction of rental expense.
Debt Discount Costs
The $430.0 million in Second Lien Notes at December 31, 2015 were issued at a 1.5% original issue discount (“OID”) and the debt discount of $6.5 million has been recorded as a reduction of the Second Lien Notes. The debt discount costs related to Second Lien Notes are amortized to interest expense using the effective interest method over the term of the debt.
Debt Issuance Costs
Debt issuance costs include origination, legal, engineering, and other fees incurred to issue the debt in connection with the Company’s credit facility and Second Lien Notes. Debt issuance costs related to the credit facility are amortized to interest expense on a straight-line basis over the respective borrowing term. Debt issuance costs related to the Second Lien Notes are amortized to interest expense using the effective interest method over the term of the debt.
Deferred Equity Issuance Costs
In conjunction with a possible initial public offering (“IPO”) of a subsidiary of the Company, costs incurred related to the IPO are capitalized as deferred equity issuance costs until the common shares are issued or the potential offering is terminated. Upon issuance of common shares, these costs will be offset against the proceeds received; or if the IPO does not occur, they will be expensed. Offering costs include direct and incremental costs related to the offering such as legal fees and related costs associated with the subsidiary’s proposed IPO.
EXTRACTION OIL & GAS HOLDINGS, LLC
NOTES TO CONSOLIDATED FINANCIAL STATEMENTS (Continued)
Commodity Derivative Instruments
The Company has entered into commodity derivative instruments to reduce the effect of price changes on a portion of the Company’s future oil and natural gas production. The commodity derivative instruments are measured at fair value and are included in the accompanying balance sheets as commodity derivative assets. The Company has not designated any of the derivative contracts as fair value or cash flow hedges. Therefore, the Company does not apply hedge accounting to the commodity derivative instruments. Net gains and losses on commodity derivative instruments are recorded based on the changes in the fair values of the derivative instruments. Net gains and losses on commodity derivative instruments are recorded in the commodity derivative gain (loss) line on the consolidated statements of operations. The Company’s cash flow is only impacted when the actual settlements under the commodity derivative contracts result in making or receiving a payment to or from the counterparty. These settlements under the commodity derivative contracts are reflected as operating activities in the Company’s consolidated statements of cash flows.
The Company’s valuation estimate takes into consideration the counterparties’ credit worthiness, the Company’s credit worthiness, and the time value of money. The consideration of the factors result in an estimated exit-price for each derivative asset or liability under a market place participant’s view. Management believes that this approach provides a reasonable, non-biased, verifiable, and consistent methodology for valuing commodity derivative instruments. Please refer to Note 6—Commodity Derivative Instruments for additional discussion on commodity derivative instruments.
Fair Value of Financial Instruments
The Company’s financial instruments consist primarily of cash and cash equivalents, accounts receivable, accounts payable, commodity derivative instruments (discussed above) and long-term debt. The carrying values of cash and cash equivalents, accounts receivable and accounts payable are representative of their fair values due to their short-term maturities. The carrying amount of the Company’s credit facility approximates fair value as it bears interest at variable rates over the term of the loan. The Company’s Second Lien Notes are recorded at cost and the fair value is disclosed in Note 8—Fair Value Measurements. Considerable judgment is required to develop estimates of fair value. The estimates provided are not necessarily indicative of the amounts the Company would realize upon the sale or refinancing of such instruments.
Asset Retirement Obligation
The Company recognizes estimated liabilities for future costs associated with the abandonment of its oil and gas properties. A liability for the fair value of an asset retirement obligation and corresponding increase to the carrying value of the related long-lived asset are recorded at the time the Company makes the decision to complete the well or a well is acquired. For additional discussion on asset retirement obligations please refer to Note 7—Asset Retirement Obligations.
Environmental Liabilities
The Company is subject to federal, state and local environmental laws and regulations. These laws regulate the discharge of materials into the environment and may require the Company to remove or mitigate the environmental effects of the disposal or release of petroleum substances at various sites. Environmental expenditures are expensed or capitalized depending on their future economic benefit. Expenditures that relate to an existing condition caused by past operations and that have no future economic benefit are expensed.
Liabilities for expenditures of a non-capital nature are recorded when environmental assessments and/or remediation is probable, and the costs can be reasonably estimated. Such liabilities are generally undiscounted values unless the timing of cash payments for the liability or component is fixed or determinable. Management has determined that no environmental liabilities existed as of December 31, 2015.
EXTRACTION OIL & GAS HOLDINGS, LLC
NOTES TO CONSOLIDATED FINANCIAL STATEMENTS (Continued)
Revenue Recognition
Revenues from the sale of oil, natural gas and NGLs are recognized when the product is delivered at a fixed or determinable price, title has transferred, and collectability is reasonably assured and evidenced by a contract. The Company recognizes revenues from the sale of oil, natural gas and NGLs using the sales method of accounting, whereby revenue is recorded based on the Company’s share of volume sold, regardless of whether the Company has taken its proportional share of volume produced. A receivable or liability is recognized only to the extent that the Company has an imbalance on a specific property greater than the expected remaining proved reserves. There were no material imbalances at December 31, 2015 and December 31, 2014.
Unit-Based Payments
The Company has granted restricted stock units (“RSUs”) to certain employees and nonemployee consultants of the Company, which therefore required the Company to recognize the expense in its financial statements. All unit-based payments to employees are measured at fair value on the grant date and expensed over the relevant service period. Unit-based payments to nonemployees are measured at fair value at each financial reporting date and expensed over the period of performance, such that aggregate expense recognized is equal to the fair value of the restricted stock units on the date performance is completed. All unit-based payment expense is recognized using the straight-line method and is included within general and administrative expenses in the consolidated statements of operations.
Income Taxes
The Company is organized as a Delaware limited liability company and is treated as a flow-through entity for U.S. federal and state income tax purposes. As a result, the Company’s net taxable income and any related tax credits are passed through to the members and are included in their tax returns even though such net taxable income or tax credits may not have actually been distributed.
Unaudited Pro Forma Income Taxes
These financial statements have been prepared in anticipation of a proposed initial public offering (the “Offering”) of the common stock of Extraction Oil & Gas, Inc. In connection with the Offering, the Company will merge into Extraction Oil and Gas, LLC, and Extraction Oil & Gas, LLC will convert from a Delaware limited liability company into a Delaware corporation, which will be taxed as a corporation under the Internal Revenue Code of 1986, as amended. Accordingly, a pro forma income tax provision has been disclosed as if the Company was a taxable corporation for all periods presented. The Company has computed pro forma entity-level income tax expense using an estimated effective rate of 38%, inclusive of all applicable U.S. federal, state and local income taxes.
Unaudited Pro Forma Earnings Per Share
The Company has presented pro forma earnings per share for the most recent period. Pro forma basic and diluted income per share was computed by dividing pro forma net income attributable to the Company by the number of shares of common stock attributable to the Company to be issued in the initial public offering described in the registration statement, as if such shares were issued and outstanding for the period ended December 31, 2015.
Segment Reporting
The Company operates in only one industry segment which is the exploration and production of oil, natural gas and NGLs and related midstream activities. The Company’s wholly-owned subsidiary, XTR, is currently in the design phase and no revenue generating activities have commenced. All of the Company’s operations are conducted in one geographic area of the United States. All revenues are derived from customers located in the United States.
Recent Accounting Pronouncements
The accounting standard-setting organizations frequently issue new or revised accounting rules. The Company regularly reviews new pronouncements to determine their impact, if any, on its financial statements.
EXTRACTION OIL & GAS HOLDINGS, LLC
NOTES TO CONSOLIDATED FINANCIAL STATEMENTS (Continued)
In March 2016, the Financial Accounting Standards Board (“FASB”) issued Accounting Standards Update (“ASU”) No. 2016-09, which simplifies the accounting for share-based payment award transactions, including: (a) income tax consequences; (b) classification of awards as either equity or liabilities; and (c) classification on the consolidated statements of cash flows. ASU 2016-09 is effective for public companies for annual reporting periods beginning after December 15, 2016, including interim periods within those fiscal years. For non-public companies, ASU 2016-09 is effective for annual reporting periods beginning after December 31, 2017, and interim periods within annual periods beginning after December 15, 2018. Early adoption is permitted in any interim period or annual period with any adjustment reflected as of the beginning of the fiscal year of adoption. The Company is currently evaluating this new standard to determine the potential impact to its financial statements and related disclosures.
In February 2016, the FASB issued ASU No. 2016-02, which requires lessee recognition on the balance sheet of a right-of-use asset and a lease liability, initially measured at the present value of the lease payments. It further requires recognition in the income statement of a single lease cost, calculated so that the cost of the lease is allocated over the lease term on a generally straight-line basis. Finally, it requires classification of all cash payments within operating activities in the statements of cash flows. It is effective for fiscal years commencing after December 15, 2018 and early adoption is permitted. The Company is currently evaluating the impact this new standard will have on its financial statements.
In September 2015, the FASB issued ASU No. 2015-16. This ASU eliminates the requirement to retrospectively apply measurement-period adjustments made to provisional amounts recognized in a business combination. The accounting update also requires an entity to present separately on the face of the income statement, or disclose in the notes, the portion of the amount recorded in current-period earnings, by line item, that would have been recorded in previous reporting periods if the adjustment to the estimated amounts had been recognized as of the acquisition date. ASU 2015-16 is effective for fiscal years, and interim periods within those fiscal years, beginning after December 15, 2015. This standard should be applied prospectively, and early adoption is permitted. The Company has elected early adoption for its year end December 31, 2015 financial statements. The adoption of this standard did not have a significant impact on the Company’s financial statements.
In July 2015, the FASB issued ASU No. 2015-11, which updates the authoritative guidance for inventory, specifically that inventory should be valued at each reporting period at the lower of cost or net realizable value. This guidance is effective for the annual period beginning after December 15, 2016; early adoption is permitted. The Company is currently evaluating the impact of this new standard; however, the Company does not expect adoption to have a material impact on its financial statements.
In April 2015, the FASB issued ASU No. 2015-03, with an objective to simplify the presentation of debt issuance costs in financial statements by presenting such costs in the balance sheet as a direct deduction from the related debt liability rather than as an asset. Effective January 1, 2016, the Company adopted ASU No. 2015-03 on a retrospective basis. In accordance with this adoption, the Company has reclassified $12.3 million and $15.1 million of debt issuance costs related to its Second Lien Notes at December 31, 2015 and December 31, 2014 respectively from the debt issuance costs, net of amortization line item to the Second Lien, net of unamortized debt discount line item. The balance sheet line items that were adjusted as a result of the adoption of ASU 2015-03 are presented in the following table (in thousands):
|
|
|
As of December 31, 2015 |
|
As of December 31, 2014 |
| ||||||||
|
|
|
As Reported |
|
As Adjusted |
|
As Reported |
|
As Adjusted |
| ||||
|
Debt issuance costs |
|
$ |
14,196 |
|
N/A |
|
$ |
16,626 |
|
N/A |
| ||
|
Other non-current assets |
|
N/A |
|
$ |
1,846 |
|
N/A |
|
$ |
1,507 |
| ||
|
Total Non-Current Assets |
|
$ |
18,044 |
|
$ |
5,694 |
|
$ |
32,805 |
|
$ |
17,686 |
|
|
Total Assets |
|
$ |
1,646,490 |
|
$ |
1,634,140 |
|
$ |
1,216,188 |
|
$ |
1,201,069 |
|
|
Second Lien Notes, net of unamortized debt discount |
|
$ |
425,140 |
|
N/A |
|
$ |
424,022 |
|
N/A |
| ||
|
Second Lien Notes, net of unamortized debt discount and debt issuance costs |
|
N/A |
|
$ |
412,790 |
|
N/A |
|
$ |
408,903 |
| ||
|
Total Non-Current Liabilities |
|
$ |
721,916 |
|
$ |
709,566 |
|
$ |
545,659 |
|
$ |
530,540 |
|
|
Total Liabilities |
|
$ |
892,258 |
|
$ |
879,908 |
|
$ |
671,000 |
|
$ |
655,881 |
|
|
Total Liabilities and Members’ Equity |
|
$ |
1,646,490 |
|
$ |
1,634,140 |
|
$ |
1,216,188 |
|
$ |
1,201,069 |
|
EXTRACTION OIL & GAS HOLDINGS, LLC
NOTES TO CONSOLIDATED FINANCIAL STATEMENTS (Continued)
In August 2015, the FASB issued ASU No. 2015-15, which amends ASU 2015-03 which had not addressed the balance sheet presentation of debt issuance costs incurred in connection with line-of-credit arrangements. Under ASU 2015-15, a Company may defer debt issuance costs associated with line-of-credit arrangements and present such costs as an asset, subsequently amortizing the deferred debt issuance costs ratably over the term of the line-of-credit arrangement, regardless of whether there are any outstanding borrowings. ASU 2015-15 is consistent with how the Company currently accounts for debt issuance costs related to the Company’s credit facility.
In November 2014, the FASB issued ASU No. 2014-16, which updates authoritative guidance for derivatives and hedging instruments, specifically in determining whether the host contract in a hybrid financial instrument issued in the form of a share is more akin to debt or to equity. This guidance is effective for the annual period beginning after December 15, 2015; early adoption is permitted. The Company is currently evaluating the impact of this new standard; however, the Company does not expect adoption to have a material impact on its financial statements.
In August 2014, the FASB issued ASU No. 2014-15, with an objective to provide guidance on management’s responsibility to evaluate whether there is substantial doubt about a company’s ability to continue as a going concern and to provide related footnote disclosures. ASU 2014-15 is effective for fiscal years ending after December 15, 2016, and annual and interim periods thereafter. This standard is not expected to have an impact on the Company’s financial statements.
In May 2014, the FASB issued ASU No. 2014-09, which establishes a comprehensive new revenue recognition model designed to depict the transfer of goods or services to a customer in an amount that reflects the consideration the entity expects to receive in exchange for those goods or services. The ASU allows for the use of either the full or modified retrospective transition method. In August 2015, the FASB issued ASU No. 2015-14, which deferred ASU No. 2014-09 for one year, and is effective for annual reporting periods beginning after December 15, 2017, including interim reporting periods within that reporting period. Earlier application is permitted only as of reporting periods beginning after December 15, 2016. The Company is currently evaluating the impact of this new standard on its financial statements, as well as which transition method the Company intends to use.
There are no other accounting standards applicable to the Company that have been issued but not yet adopted by the Company as of December 31, 2015, and through the date the financial statements were available to be issued.
Subsequent Events
These financial statements considered subsequent events through April 22, 2016, the date the financial statements were available to be issued.
Note 3—Oil and Gas Properties
The Company’s oil and gas properties are entirely within the United States. The net capitalized costs related to the Company’s oil and gas producing activities were as follows (in thousands):
|
|
|
As of December 31, |
| ||||
|
|
|
2015 |
|
2014 |
| ||
|
Proved oil and gas properties |
|
$ |
1,128,022 |
|
$ |
594,847 |
|
|
Unproved oil and gas properties(1) |
|
374,194 |
|
405,632 |
| ||
|
Wells in progress(2) |
|
59,416 |
|
41,160 |
| ||
|
Total capitalized costs(3) |
|
$ |
1,561,632 |
|
$ |
1,041,639 |
|
|
Accumulated depletion, depreciation and amortization |
|
(181,382 |
) |
(33,896 |
) | ||
|
Net capitalized costs |
|
$ |
1,380,250 |
|
$ |
1,007,743 |
|
(1) Unproved oil and gas properties represent unevaluated costs the Company excludes from the amortization base until proved reserves are established or impairment is determined. The Company estimates that the remaining costs will be evaluated within 3 to 5 years.
(2) Costs from wells in progress are excluded from the amortization base until production commences.
(3) Includes interest capitalized of $8.2 million and $2.9 million at December 31, 2015 and 2014, respectively.
EXTRACTION OIL & GAS HOLDINGS, LLC
NOTES TO CONSOLIDATED FINANCIAL STATEMENTS (Continued)
The following table presents information regarding the Company’s net costs incurred in oil and gas property acquisition, exploration and development activities (in thousands):
|
|
|
For the Years Ended |
| ||||
|
|
|
December 31, |
|
December 31, |
| ||
|
|
|
(unaudited) |
| ||||
|
Property acquisition costs: |
|
|
|
|
| ||
|
Proved |
|
$ |
80,952 |
|
$ |
378,243 |
|
|
Unproved |
|
120,651 |
|
424,313 |
| ||
|
Exploration costs(1) |
|
19,584 |
|
126 |
| ||
|
Development costs |
|
337,968 |
|
212,442 |
| ||
|
Total |
|
$ |
559,155 |
|
$ |
1,015,124 |
|
|
Total excluding asset retirement obligations |
|
$ |
523,531 |
|
$ |
1,008,347 |
|
(1) Exploration costs do not include impairment and abandonment costs of unproved properties, which are included in the line item exploration expenses in the statements of operations.
Note 4—Acquisitions
May 2014 Acquisition
On May 29, 2014, the Company acquired an unaffiliated oil and gas company’s interests in approximately 6,200 net acres of leaseholds, and related producing properties located primarily in Weld County, Colorado, along with various other related rights, permits, contracts, equipment and other assets (the “May 2014 Acquisition”). The seller received aggregate consideration of approximately $219.3 million in cash. The effective date for the acquisition was January 1, 2014, with purchase price adjustments calculated as of the closing date on May 29, 2014. This acquisition was the Company’s initial entrance into the DJ Basin of significant size, the Company’s core project area. The Company incurred $0.4 million of transaction costs related to the acquisition for the year ended December 31, 2014. No transaction costs related to the acquisition were incurred for the year ended December 31, 2015. Transaction costs are recorded in the consolidated statements of operations within the general and administrative expense line item.
The acquisition is accounted for using the acquisition method under ASC 805, Business Combinations, which requires the acquired assets and liabilities to be recorded at fair value as of the acquisition date of May 29, 2014. In December 2014, the Company completed the transaction’s post-closing settlement. The following table summarizes the purchase price and the final allocation of the fair values of assets acquired and liabilities assumed (in thousands):
|
Purchase Price |
|
May 29, 2014 |
| |
|
Consideration given |
|
|
| |
|
Cash |
|
$ |
219,320 |
|
|
Total consideration given |
|
$ |
219,320 |
|
|
Allocation of Purchase Price |
|
|
| |
|
Proved oil and gas properties |
|
$ |
140,275 |
|
|
Unproved oil and gas properties |
|
73,600 |
| |
|
Total fair value of oil and gas properties acquired |
|
213,875 |
| |
|
Working capital |
|
$ |
5,675 |
|
|
Asset retirement obligations |
|
(230 |
) | |
|
Fair value of net assets acquired |
|
$ |
219,320 |
|
|
Working capital acquired was estimated as follows: |
|
|
| |
|
Accounts receivable |
|
$ |
19,081 |
|
|
Revenue payable |
|
(5,994 |
) | |
|
Production taxes payable |
|
(4,328 |
) | |
|
Accrued liabilities |
|
(3,084 |
) | |
|
Total working capital |
|
$ |
5,675 |
|
EXTRACTION OIL & GAS HOLDINGS, LLC
NOTES TO CONSOLIDATED FINANCIAL STATEMENTS (Continued)
July 2014 Acquisition
On July 28, 2014, the Company acquired an unaffiliated oil and gas company’s interests in approximately 9,000 net acres of leaseholds, and related producing properties located primarily in Weld County, Colorado, along with various other related rights, permits, contracts, equipment and other assets (the “July 2014 Acquisition”). The seller received aggregate consideration of approximately $113.4 million in cash. The effective date for the acquisition was March 1, 2014, with purchase price adjustments calculated as of the closing date on July 28, 2014. The acquisition provided strategic additions adjacent to the Company’s core project area. The Company incurred $0.3 million of transaction costs related to the acquisition for the year ended December 31, 2014. No transaction costs related to the acquisition were incurred for the year ended December 31, 2015. Transaction costs are recorded in the consolidated statements of operations within the general and administrative expense line item.
The acquisition is accounted for using the acquisition method under ASC 805, Business Combinations, which requires the acquired assets and liabilities to be recorded at fair value as of the acquisition date of July 28, 2014. In October 2014, the Company completed the transaction’s post-closing settlement. The following table summarizes the purchase price and the final allocation of the fair values of assets acquired and liabilities assumed (in thousands):
|
Purchase Price |
|
July 28, 2014 |
| |
|
Consideration given |
|
|
| |
|
Cash |
|
$ |
113,410 |
|
|
Total consideration given |
|
$ |
113,410 |
|
|
Allocation of Purchase Price |
|
|
| |
|
Proved oil and gas properties |
|
$ |
62,350 |
|
|
Unproved oil and gas properties |
|
52,508 |
| |
|
Total fair value of oil and gas properties acquired |
|
114,858 |
| |
|
Working capital |
|
$ |
2,337 |
|
|
Asset retirement obligations |
|
(3,785 |
) | |
|
Fair value of net assets acquired |
|
$ |
113,410 |
|
|
Working capital acquired was estimated as follows: |
|
|
| |
|
Accounts receivable |
|
$ |
5,157 |
|
|
Revenue payable |
|
(297 |
) | |
|
Production taxes payable |
|
(1,160 |
) | |
|
Accrued liabilities |
|
(1,363 |
) | |
|
Total working capital |
|
$ |
2,337 |
|
August 2014 Acquisition
On August 21, 2014, the Company acquired an unaffiliated oil and gas company’s interests in approximately 6,400 net acres of leaseholds, and related producing properties located primarily in Weld County, Colorado, along with various other related rights, permits, contracts, equipment and other assets (the “August 2014 Acquisition”). The seller received aggregate consideration of approximately $297.1 million in cash. The effective date for the acquisition was March 1, 2014, with purchase price adjustments calculated as of the closing date on August 21, 2014. The acquisition provided strategic additions adjacent to the Company’s core project area. The Company incurred $0.4 million of transaction costs related to the acquisition for the year ended December 31, 2014. No transaction costs related to the acquisition were incurred for the year ended December 31, 2015. Transaction costs are recorded in the consolidated statements of operations within the general and administrative expense line item.
The acquisition is accounted for using the acquisition method under ASC 805, Business Combinations, which requires the acquired assets and liabilities to be recorded at fair value as of the acquisition date of August 21, 2014. In April 2015, the Company completed the transaction’s post-closing settlement. The following table summarizes the purchase price and the final allocation of the fair values of assets acquired and liabilities assumed (in thousands):
EXTRACTION OIL & GAS HOLDINGS, LLC
NOTES TO CONSOLIDATED FINANCIAL STATEMENTS (Continued)
|
Purchase Price |
|
August 21, 2014 |
| |
|
Consideration given |
|
|
| |
|
Cash |
|
$ |
297,112 |
|
|
Total consideration given |
|
$ |
297,112 |
|
|
Allocation of Purchase Price |
|
|
| |
|
Proved oil and gas properties |
|
$ |
167,826 |
|
|
Unproved oil and gas properties |
|
132,568 |
| |
|
Total fair value of oil and gas properties acquired |
|
300,394 |
| |
|
Working capital |
|
$ |
(1,787 |
) |
|
Asset retirement obligations |
|
(1,495 |
) | |
|
Fair value of net assets acquired |
|
$ |
297,112 |
|
|
Working capital acquired was estimated as follows: |
|
|
| |
|
Accounts receivable |
|
$ |
9,065 |
|
|
Well equipment inventory |
|
503 |
| |
|
Revenue payable |
|
(4,967 |
) | |
|
Production taxes payable |
|
(1,688 |
) | |
|
Accrued liabilities |
|
(4,700 |
) | |
|
Total working capital |
|
$ |
(1,787 |
) |
October 2014 Acquisition
On October 15, 2014, the Company acquired an unaffiliated oil and gas company’s interests in 29 producing properties located primarily in Weld County, Colorado, along with various other related rights, permits, contracts and equipment (the “October 2014 Acquisition”). The seller received aggregate consideration of approximately $1.3 million in cash. The effective date for the acquisition was July 1, 2014, with purchase price adjustments calculated as of the closing date on October 15, 2014. The acquisition expanded the Company’s core project area. The Company incurred $0.4 million of transaction costs related to the acquisition for the year ended December 31, 2014. No transaction costs related to the acquisition were incurred for the year ended December 31, 2015. Transaction costs are recorded in the consolidated statements of operations within the general and administrative expense line item.
The acquisition is accounted for using the acquisition method under ASC 805, Business Combinations, which requires the acquired assets and liabilities to be recorded at fair value as of the acquisition date of October 15, 2014. In January 2015, the Company completed the transaction’s post-closing settlement. The following table summarizes the purchase price and the final allocation of the fair values of assets acquired and liabilities assumed (in thousands):
|
Purchase Price |
|
October 15, 2014 |
| |
|
Consideration given |
|
|
| |
|
Cash |
|
$ |
1,343 |
|
|
Total consideration given |
|
$ |
1,343 |
|
|
Allocation of Purchase Price |
|
|
| |
|
Proved oil and gas properties |
|
$ |
6,592 |
|
|
Total fair value of oil and gas properties acquired |
|
6,592 |
| |
|
Working capital |
|
$ |
(4,657 |
) |
|
Asset retirement obligations |
|
(592 |
) | |
|
Fair value of net assets acquired |
|
$ |
1,343 |
|
|
Working capital acquired was estimated as follows: |
|
|
| |
|
Accounts receivable |
|
$ |
135 |
|
|
Revenue payable |
|
(206 |
) | |
|
Production taxes payable |
|
(574 |
) | |
|
Accrued liabilities |
|
(4,012 |
) | |
|
Total working capital |
|
$ |
(4,657 |
) |
Additionally, as part of the October 2014 Acquisition, the Company acquired unproved acreage located primarily in Weld County, Colorado from the same unaffiliated oil and gas company for approximately $76.5 million.
EXTRACTION OIL & GAS HOLDINGS, LLC
NOTES TO CONSOLIDATED FINANCIAL STATEMENTS (Continued)
March 2015 Acquisition
On March 10, 2015, the Company acquired an unaffiliated oil and gas company’s interests in approximately 39,000 net acres of leaseholds, and related producing properties located primarily in Adams, Broomfield, Boulder and Weld Counties, Colorado, along with various other related rights, permits, contracts, equipment, rights of way, gathering systems and other assets (the “March 2015 Acquisition”). The seller received aggregate consideration of approximately $120.5 million in cash. The effective date for the acquisition was January 1, 2014, with purchase price adjustments calculated as of the closing date on March 10, 2015. The acquisition provided new development opportunities in the DJ Basin as well as additions adjacent to the Company’s core project area. No transaction costs related to the acquisition were incurred for the year ended December 31, 2014. The Company incurred $0.5 million of transaction costs related to the acquisition during the year ended December 31, 2015. These transaction costs are recorded in the consolidated statements of operations within the general and administrative expense line item. Additionally, the Company incurred $6.0 million of non-cash transaction costs associated with a finder’s fee to an unaffiliated third-party. The Company assigned an over-riding royalty interest in the proved and unproved oil and gas properties acquired in the March 2015 Acquisition, which had a fair value of $6.0 million on the measurement date. These transaction costs are recorded in the consolidated statements of operations within the acquisition transaction expense line item.
The acquisition is accounted for using the acquisition method under ASC 805, Business Combinations, which requires the acquired assets and liabilities to be recorded at fair value as of the acquisition date of March 10, 2015. In November 2015, the Company completed the transaction’s post-closing settlement. The following table summarizes the purchase price and the final allocation of the fair values of assets acquired and liabilities assumed (in thousands):
|
Purchase Price |
|
March 10, 2015 |
| |
|
Consideration given |
|
|
| |
|
Cash |
|
$ |
120,524 |
|
|
Total consideration given |
|
$ |
120,524 |
|
|
Allocation of Purchase Price |
|
|
| |
|
Proved oil and gas properties |
|
$ |
80,952 |
|
|
Unproved oil and gas properties |
|
69,450 |
| |
|
Total fair value of oil and gas properties acquired |
|
150,402 |
| |
|
|
|
|
| |
|
Working capital |
|
$ |
(1,996 |
) |
|
Asset retirement obligations |
|
(27,882 |
) | |
|
Fair value of net assets acquired |
|
$ |
120,524 |
|
|
Working capital acquired was estimated as follows: |
|
|
| |
|
Accounts receivable |
|
$ |
462 |
|
|
Revenue payable |
|
(718 |
) | |
|
Production taxes payable |
|
(1,740 |
) | |
|
Total working capital |
|
$ |
(1,996 |
) |
Pro Forma Financial Information (Unaudited)
For the years ended December 31, 2015 and 2014, the following pro forma financial information represents the combined results for the Company and the properties acquired in the May 2014 Acquisition, July 2014 Acquisition, August 2014 Acquisition, October 2014 Acquisition and March 2015 Acquisition as if the acquisition and related financing had occurred on January 1, 2014. For purposes of the pro forma it was assumed that the 2014 acquisitions were funded through capital contributions of $419.0 million and proceeds from the Second Lien Notes of $288.5 million. For purposes of the pro forma it was assumed that the Company issued equity to finance the March 2015 Acquisition. The pro forma information includes the effects of adjustments for depletion, depreciation, amortization and accretion expense of $1.5 million and $17.2 million for the years ended December 31, 2015 and 2014, respectively. The pro forma information includes the effects of a decrease in non-recurring transaction costs that are included in general and administrative expenses and acquisition transaction expenses of $6.4 million and $1.8 million for the years ended December 31, 2015 and 2014, respectively. No pro forma adjustments were made for amortization of debt issuance and debt discount costs or interest expense for the year ended December 31, 2015. The
EXTRACTION OIL & GAS HOLDINGS, LLC
NOTES TO CONSOLIDATED FINANCIAL STATEMENTS (Continued)
pro forma information includes the effects of adjustments for the amortization of debt issuance and debt discount costs of $1.3 million for the year ended December 31, 2014. The pro forma information includes the effects of adjustments for the incremental interest expense on acquisition financing of $15.7 million for the year ended December 31, 2014.
The following pro forma results (in thousands) do not include any cost savings or other synergies that may result from the acquisition or any estimated costs that have been or will be incurred by the Company to integrate the properties acquired. The pro forma results are not necessarily indicative of what actually would have occurred if the acquisition had been completed as of the beginning of the period, nor are they necessarily indicative of future results.
|
|
|
For the Years Ended December 31, |
| ||||
|
|
|
2015 |
|
2014 |
| ||
|
Revenues |
|
$ |
199,746 |
|
$ |
170,970 |
|
|
Operating expenses |
|
$ |
270,932 |
|
$ |
104,254 |
|
|
Net income (loss) |
|
$ |
(42,047 |
) |
$ |
75,288 |
|
Note 5—Long-Term Debt
As of the dates indicated the Company’s long-term debt consisted of the following (in thousands):
|
|
|
December 31, |
|
December 31, |
| ||
|
Credit facility due November 29, 2018 |
|
$ |
225,000 |
|
$ |
100,000 |
|
|
Second Lien Notes due May 29, 2019 |
|
430,000 |
|
430,000 |
| ||
|
Unamortized debt discount and debt issuance costs on Second Lien Notes |
|
(17,210 |
) |
(21,097 |
) | ||
|
Total long-term debt |
|
637,790 |
|
508,903 |
| ||
|
Less: current portion of long-term debt |
|
— |
|
— |
| ||
|
Total long-term debt, net of current portion |
|
$ |
637,790 |
|
$ |
508,903 |
|
(1) These amounts have been reclassified to conform to the current period presentation on the accompanying balance sheets. Please refer to the section Recent Accounting Pronouncements in Note 2—Basis of Presentation and Significant Accounting Policies for additional discussion.
Credit Facility
Extraction Oil & Gas Holdings, LLC (the “Borrower), on September 4, 2014 entered into a $500.0 million credit facility with a syndicate of banks, which is subject to a borrowing base. The credit facility matures on November 29, 2018. As of December 31, 2015, the credit facility was subject to a borrowing base of $285.0 million. As of December 31, 2015 and December 31, 2014, the Company had outstanding borrowings of $225.0 million and $100.0 million, respectively. As of December 31, 2015, the Company had standby letters of credit of $0.7 million. At December 31, 2015, the available credit under the credit facility was $59.3 million. Subsequent to December 31, 2015, the Company borrowed $10.0 million on the credit facility, bringing the outstanding balance as of the date of this filing under the credit facility to $235.0 million.
Redetermination of the borrowing base occurred initially quarterly (on February 1, 2015, May 1, 2015, August 1, 2015, November 1, 2015 and February 1, 2016) and semiannually thereafter on May 1 and November 1. Additionally, the Company and the Administrative Agent may each elect a redetermination of the borrowing base between any two scheduled redeterminations. In conjunction with the Company’s February 1, 2016 scheduled quarterly borrowing base redetermination, the Company’s borrowing base was reaffirmed at $285.0 million.
Interest on the credit facility is payable at one of the following two variable rates as selected by the Company: a base rate based on the Prime Rate or the Eurodollar rate, based on LIBOR. Either rate is adjusted upward by an applicable margin, based on the utilization percentage of the facility as outlined in the Pricing Grid. Additionally, the credit facility provides for a commitment fee of 0.375% to 0.50%, depending on borrowing base usage. The grid below shows the Base Rate Margin and Eurodollar Margin depending on the applicable Borrowing Base Utilization Percentage (as defined in the credit facility) as of the date of this filing:
EXTRACTION OIL & GAS HOLDINGS, LLC
NOTES TO CONSOLIDATED FINANCIAL STATEMENTS (Continued)
Borrowing Base Utilization Grid
|
Borrowing Base Utilization Percentage |
|
Utilization |
|
LIBOR Margin |
|
Base Rate |
|
Commitment Fee |
|
|
Level 1 |
|
< 25% |
|
1.75 |
% |
0.75 |
% |
0.375 |
% |
|
Level 2 |
|
> 25.0% < 50% |
|
2.00 |
% |
1.00 |
% |
0.375 |
% |
|
Level 3 |
|
> 50% < 75% |
|
2.25 |
% |
1.25 |
% |
0.500 |
% |
|
Level 4 |
|
> 75% < 90% |
|
2.50 |
% |
1.50 |
% |
0.500 |
% |
|
Level 5 |
|
> 90% |
|
2.75 |
% |
1.75 |
% |
0.500 |
% |
The credit facility contains representations, warranties, covenants, conditions and defaults customary for transactions of this type, including but not limited to: (i) limitations on liens and incurrence of debt covenants; (ii) limitations on dividends, distributions, redemptions and restricted payments covenants; (iii) limitations on investments, loans and advances covenants; and (iv) limitations on the sale of property, mergers, consolidations and other similar transactions covenants. Additionally, the credit facility requires the Borrower to enter into hedging agreements necessary to support the borrowing base.
The credit facility also contains customary reporting requirements that include a requirement to report within five days of notice any actions, suits, and proceedings before any governmental authority affecting the borrower or any of its subsidiaries that has a stated claim in excess of $2.0 million. In September 2014, Holdings was named in a third party complaint by R.K. Pinson, please refer to Note 12—Commitments and Contingencies for further information. The Company failed to provide timely notice of its involvement in the lawsuit and therefore defaulted under the credit agreement. This default was waived by the lenders on February 12, 2015. In April 2015, the Company failed to timely join a new subsidiary company to its Second Lien Notes and therefore defaulted on the note, creating a cross-default into the credit facility. This default was waived by the lenders on April 28, 2015.
The credit facility also contains financial covenants requiring the Borrower to comply with a current ratio of consolidated current assets (including unused borrowing capacity and excluding the fair value of commodity derivatives) to consolidated current liabilities of not less than 1.0:1.0 and to maintain, on the last day of each quarter, a ratio of total net debt (total debt less cash and cash equivalents) to EBITDAX (EBITDAX is defined as net income adjusted for certain cash and non-cash items including depreciation, depletion, amortization and accretion, exploration expense, gains/losses on derivative instruments, amortization of certain debt issuance costs, non-cash compensation expense, interest expense and prepayment premiums on extinguishment of debt) of not greater than 4.0:1.0. For the quarter ended December 31, 2015, EBITDAX is based on annualizing the three fiscal quarters ended December 31, 2015. Thereafter, EBITDAX is based on the four quarters then ended. The Company was in compliance with all financial covenants under the credit facility as of December 31, 2015.
Any borrowings under the credit facility are collateralized by the Borrower’s oil and gas producing properties, the Borrower’s personal property and the equity interests of the Borrower. Holdings has entered into oil and natural gas hedging transactions with several counterparties that are also lenders under the credit facility. The Company’s obligations under these hedging contracts are secured by the credit facility.
Second Lien Notes
On May 29, 2014, the Company entered in to a 5-year, $430.0 million term loan facility with a syndicate of lenders. The facility matures on May 29, 2019. As of December 31, 2015, the Company had drawn the full $430.0 million under the Second Lien Notes and no further commitments remained. The loan was drawn in four tranches: $230.0 million in May 2014 that bears an interest rate of 11.0%, $75.0 million in July 2014 that bears an interest rate of 11.0%; $75.0 million in August 2014 that bears an interest rate of 10.0%, and $50.0 million in October 2014 that bears an interest rate of 10.0%. The interest rates are fixed and interest is payable semi-annually.
Several lenders of Second Lien Notes are also members of Holdings. Of the $430.0 million outstanding on the Second Lien Notes, members held approximately $311.7 million.
The Second Lien Notes contain varying prepayment premiums if they are redeemed prior to three years from May 29, 2014. If the Company were to redeem the Notes after the first anniversary but prior to the second anniversary (after May 29, 2015 and prior to May 29, 2016), then the Company would be required to pay a premium
EXTRACTION OIL & GAS HOLDINGS, LLC
NOTES TO CONSOLIDATED FINANCIAL STATEMENTS (Continued)
to the face value of the notes equal to $19.3 million. If the Company were to redeem the Notes after the second anniversary but prior to the third anniversary (after May 29, 2016 and prior to May 29, 2017), the Company would be required to pay a premium to the face value of the notes equal to $4.3 million. If the Company were to redeem the Notes after the third anniversary (after May 29, 2017), no prepayment premium would apply.
The Second Lien Notes contains representations, warranties, covenants, conditions and defaults customary for transactions of this type, including but not limited to: (i) limitations on liens and incurrence of debt covenants; (ii) limitations on dividends, distributions, redemptions and restricted payments covenants; (iii) limitations on investments, loans and advances covenants; and (iv) limitations on the sale of property, mergers, consolidations and other similar transactions covenants.
The Second Lien Notes also contains a standard cross-default provision. In September 2014, the Company defaulted under its credit facility by failing to provide timely notice of being named as a third party defendant by R.K. Pinson in a lawsuit, please refer to Note 12—Commitments and Contingencies for further information. The cross-default provision in the Second Lien Notes provides that a default under the credit agreement also constitutes a default under the Second Lien Notes. The default under the Second Lien Notes was waived by the lenders on February 12, 2015. Additionally, the Second Lien
Notes contain requirements to timely join newly created subsidiary companies as a loan party. In April 2015, the Company failed to timely join its newly created wholly-owned subsidiary to its Second Lien Notes and therefore defaulted on the note. This default was waived by the lenders on April 28, 2015.
The Second Lien Notes also contain a debt incurrence covenant requiring the Borrower to comply with a ratio of total proved reserve value to pro-forma total debt of not less than 1.25:1.0 in order to incur additional debt under the Second Lien Notes. The Company was in compliance with all financial covenants under the Second Lien Notes as of December 31, 2015.
Debt Discount Costs on Second Lien Notes
As of December 31, 2015, the Company had a debt discount from the OID on its Second Lien Notes of $6.5 million. For the years ended December 31, 2015 and 2014, the Company recorded amortization expense related to the debt discount of $1.1 million and $0.5 million, respectively.
Debt Issuance Costs
As of December 31, 2015 and 2014, the Company had debt issuance costs of $20.2 million and $18.1 million related to its credit facility and Second Lien Notes, respectively, which has also been reflected on the Company’s balance sheet. Debt issuance costs include origination, legal, engineering, and other fees incurred in connection with the Company’s credit facility and Second Lien Notes. For the years ended December 31, 2015 and 2014, the Company recorded amortization expense related to the debt issuance costs of $3.1 million and $1.5 million, respectively.
Additionally, at December 31, 2015, the Company had debt issuance costs of $1.4 million related to its anticipated Senior Notes offerings, which has also been reflected on the Company’s balance sheet. During 2015, the Company was pursuing a Senior Notes offering. As a result of deteriorating credit market conditions, the Company terminated the offering and recorded amortization expense of $1.4 million for the capitalized costs related to the Senior Notes offerings. The amortization expense on these costs are recorded in the statements of operations within the interest expense line item.
Interest Incurred On Long-Term Debt
For the years ended December 31, 2015 and 2014, the Company incurred interest expense on long-term debt of $50.5 million and $23.1 million, respectively, and capitalized interest expense of $5.3 million and $2.6 million, respectively, which has been reflected in the Company’s financial statements.
EXTRACTION OIL & GAS HOLDINGS, LLC
NOTES TO CONSOLIDATED FINANCIAL STATEMENTS (Continued)
Note 6—Commodity Derivative Instruments
The Company has entered into commodity derivative instruments, as described below. The Company has utilized swaps, collars, three-way collars and puts to reduce the effect of price changes on a portion of the Company’s future oil and natural gas production. A swap requires the Company to pay the counterparty if the settlement price exceeds the strike price and the same counterparty is required to pay the Company if the settlement price is less than the strike price. A collar requires the Company to pay the counterparty if the settlement price is above the ceiling price and requires the counterparty to pay the Company if the settlement price is below the floor price. A three-way collar is a combination of three options: a sold call, a purchased put, and a sold put. The sold call establishes the maximum price that the Company will receive for the contracted commodity volumes. The purchased put establishes the minimum price that the Company will receive for the contracted volumes unless the market price for the commodity falls below the sold put strike price, at which point the minimum price equals the reference price (e.g., NYMEX) plus the excess of the purchased put strike price over the sold put strike price. The objective of the Company’s use of derivative financial instruments is to achieve more predictable cash flows in an environment of volatile oil and gas prices and to manage its exposure to commodity price risk. While the use of these derivative instruments limits the downside risk of adverse price movements, such use may also limit the Company’s ability to benefit from favorable price movements. The Company may, from time to time, add incremental derivatives to hedge additional production, restructure existing derivative contracts or enter into new transactions to modify the terms of current contracts in order to realize the current value of the Company’s existing positions. The Company does not enter into derivative contracts for speculative purposes.
The use of derivatives involves the risk that the counterparties to such instruments will be unable to meet the financial terms of such contracts. The Company’s derivative contracts are currently with six counterparties. The Company has netting arrangements with the counterparties that provide for the offset of payables against receivables from separate derivative arrangements with the counterparties in the event of contract termination. The derivative contracts may be terminated by a non-defaulting party in the event of default by one of the parties to the agreement.
The Company’s commodity derivative contracts as of December 31, 2015 are summarized below:
|
|
|
2016 |
|
2017 |
| ||
|
NYMEX WTI(1) Crude Swaps: |
|
|
|
|
| ||
|
Notional volume (Bbl) |
|
250,000 |
|
— |
| ||
|
Weighted average fixed price ($/Bbl) |
|
$ |
51.63 |
|
|
| |
|
NYMEX WTI(1) Crude Collars: |
|
|
|
|
| ||
|
Notional volume (Bbl) |
|
2,574,150 |
|
— |
| ||
|
Weighted average purchased put price ($/Bbl) |
|
$ |
57.01 |
|
|
| |
|
Weighted average sold call price ($/Bbl) |
|
$ |
67.84 |
|
|
| |
|
NYMEX WTI(1) Crude 3-Way Collars: |
|
|
|
|
| ||
|
Notional volume (Bbl) |
|
1,650,000 |
|
— |
| ||
|
Weighted average purchased put price ($/Bbl) |
|
$ |
53.25 |
|
|
| |
|
Weighted average sold call price ($/Bbl) |
|
$ |
58.19 |
|
|
| |
|
Weighted average sold put price ($/Bbl) |
|
$ |
45.00 |
|
|
| |
|
NYMEX WTI(1) Crude Enhanced Swaps: |
|
|
|
|
| ||
|
Notional volume (Bbl) |
|
700,000 |
|
— |
| ||
|
Weighted average fixed price ($/Bbl) |
|
$ |
55.28 |
|
|
| |
|
Weighted average sold put price ($/Bbl) |
|
$ |
44.36 |
|
|
| |
|
NYMEX WTI(1) Crude Purchased Puts: |
|
|
|
|
| ||
|
Notional volume (Bbl) |
|
300,000 |
|
— |
| ||
|
Weighted average purchased put price ($/Bbl) |
|
$ |
40.00 |
|
|
| |
|
NYMEX HH(2) Natural Gas Swaps: |
|
|
|
|
| ||
|
Notional volume (MMBtu) |
|
13,357,278 |
|
13,320,000 |
| ||
|
Weighted average fixed price ($/MMBtu) |
|
$ |
3.13 |
|
$ |
3.01 |
|
(1) NYMEX WTI refers to West Texas Intermediate crude oil price on the New York Mercantile Exchange
(2) NYMEX HH refers to the Henry Hub natural gas price on the New York Mercantile Exchange
The following tables detail the fair value of the Company’s derivative instruments, including the gross amounts and adjustments made to net the derivative instruments for the presentation in the balance sheet (in thousands):
EXTRACTION OIL & GAS HOLDINGS, LLC
NOTES TO CONSOLIDATED FINANCIAL STATEMENTS (Continued)
|
|
|
|
|
As of December 31, 2015 |
| |||||||
|
Underlying Commodity |
|
Location on |
|
Gross |
|
Gross |
|
Net |
| |||
|
Oil and natural gas derivative contracts |
|
Current assets |
|
$ |
89,746 |
|
$ |
(20,861 |
) |
$ |
68,885 |
|
|
Oil and natural gas derivative contracts |
|
Non-current assets |
|
$ |
5,916 |
|
$ |
(3,010 |
) |
$ |
2,906 |
|
|
Oil and natural gas derivative contracts |
|
Current liabilities |
|
$ |
(20,861 |
) |
$ |
20,861 |
|
$ |
— |
|
|
Oil and natural gas derivative contracts |
|
Non-current liabilities |
|
$ |
(3,010 |
) |
$ |
3,010 |
|
$ |
— |
|
|
|
|
|
|
|
|
|
|
|
| |||
|
|
|
|
|
As of December 31, 2014 |
| |||||||
|
Underlying Commodity |
|
Location on |
|
Gross |
|
Gross |
|
Net |
| |||
|
Oil and natural gas derivative contracts |
|
Current assets |
|
$ |
44,902 |
|
$ |
(5,109 |
) |
$ |
39,793 |
|
|
Oil and natural gas derivative contracts |
|
Non-current assets |
|
$ |
6,608 |
|
$ |
(500 |
) |
$ |
6,108 |
|
|
Oil and natural gas derivative contracts |
|
Current liabilities |
|
$ |
(5,109 |
) |
$ |
5,109 |
|
$ |
— |
|
|
Oil and natural gas derivative contracts |
|
Non-current liabilities |
|
$ |
(500 |
) |
$ |
500 |
|
$ |
— |
|
The Company recognized a net gain on commodity derivatives of $79.9 million and $48.0 million for the years ended December 31, 2015 and 2014, respectively.
Note 7—Asset Retirement Obligations
The Company follows accounting for asset retirement obligations in accordance with ASC 410, Asset Retirement and Environmental Obligations, which requires that the fair value of a liability for an asset retirement obligation be recognized in the period in which it was incurred if a reasonable estimate of fair value could be made. The Company’s asset retirement obligations primarily represent the estimated present value of the amounts expected to be incurred to plug, abandon and remediate producing and shut-in wells at the end of their productive lives in accordance with applicable state and federal laws. The Company determines the estimated fair value of its asset retirement obligations by calculating the present value of estimated cash flows related to plugging and abandonment liabilities. The significant inputs used to calculate such liabilities include estimates of costs to be incurred; the Company’s credit adjusted discount rates, inflation rates and estimated dates of abandonment. The asset retirement liability is accreted to its present value each period and the capitalized asset retirement costs are depleted with proved oil and gas properties using the unit of production method.
The following table summarizes the activities of the Company’s asset retirement obligations for the years ended December 31, 2015 and 2014 (in thousands):
|
|
|
For the Year |
|
For the Year |
| ||
|
Balance beginning of period |
|
$ |
6,450 |
|
$ |
9 |
|
|
Liabilities incurred or acquired |
|
35,624 |
|
6,778 |
| ||
|
Liabilities settled |
|
(1,742 |
) |
(662 |
) | ||
|
Revisions in estimated cash flows |
|
— |
|
— |
| ||
|
Accretion expense |
|
4,035 |
|
325 |
| ||
|
Balance end of period |
|
$ |
44,367 |
|
$ |
6,450 |
|
EXTRACTION OIL & GAS HOLDINGS, LLC
NOTES TO CONSOLIDATED FINANCIAL STATEMENTS (Continued)
Note 8—Fair Value Measurements
ASC Topic 820, Fair Value Measurement and Disclosure, establishes a hierarchy for inputs used in measuring fair value that maximizes the use of observable inputs and minimizes the use of unobservable inputs by requiring that the most observable inputs be used when available. Observable inputs are inputs that market participants would use in pricing the asset or liability developed based on market data obtained from sources independent of the Company. Unobservable inputs are inputs that reflect the Company’s assumptions of what market participants would use in pricing the asset or liability developed based on the best information available in the circumstances. The hierarchy is broken down into three levels based on the reliability of the inputs as follows:
· Level 1: Quoted prices are available in active markets for identical assets or liabilities;
· Level 2: Quoted prices in active markets for similar assets and liabilities that are observable for the asset or liability;
· Level 3: Unobservable pricing inputs that are generally less observable from objective sources, such as discounted cash flow models or valuations.
The financial assets and liabilities are classified based on the lowest level of input that is significant to the fair value measurement. The Company’s assessment of the significance of a particular input to the fair value measurement requires judgment, and may affect the valuation of the fair value of assets and liabilities and their placement within the fair value hierarchy levels.
The following table presents the Company’s financial assets and liabilities that were accounted for at fair value on a recurring basis as of December 31, 2015 and December 31, 2014 by level within the fair value hierarchy (in thousands):
|
|
|
Fair Value Measurements at |
| ||||||||||
|
|
|
Level 1 |
|
Level 2 |
|
Level 3 |
|
Total |
| ||||
|
Financial Assets: |
|
|
|
|
|
|
|
|
| ||||
|
Commodity derivative asset |
|
$ |
— |
|
$ |
71,791 |
|
$ |
— |
|
$ |
71,791 |
|
|
Financial Liabilities: |
|
|
|
|
|
|
|
|
| ||||
|
Commodity derivative liabilities |
|
$ |
— |
|
$ |
— |
|
$ |
— |
|
$ |
— |
|
|
|
|
|
|
|
|
|
|
|
| ||||
|
|
|
Fair Value Measurements at |
| ||||||||||
|
|
|
Level 1 |
|
Level 2 |
|
Level 3 |
|
Total |
| ||||
|
Financial Assets: |
|
|
|
|
|
|
|
|
| ||||
|
Commodity derivative asset |
|
$ |
— |
|
$ |
45,901 |
|
$ |
— |
|
$ |
45,901 |
|
|
Financial Liabilities: |
|
|
|
|
|
|
|
|
| ||||
|
Commodity derivative liabilities |
|
$ |
— |
|
$ |
— |
|
$ |
— |
|
$ |
— |
|
The following methods and assumptions were used to estimate the fair value of the assets and liabilities in the table above:
Commodity Derivative Instruments
The Company determines its estimate of the fair value of derivative instruments using a market approach based on several factors, including quoted market prices in active markets, implied market volatility factors, quotes from third parties, the credit rating of each counterparty, and the Company’s own credit rating. In consideration of counterparty credit risk, the Company assessed the possibility of whether each counterparty to the derivative would default by failing to make any contractually required payments. Additionally, the Company considers that it is of substantial credit quality and has the financial resources and willingness to meet its potential repayment obligations associated with the derivative transactions. At December 31, 2015 derivative instruments utilized by the Company consist of swaps, enhanced swaps, collars, three way collars and puts. The oil and natural gas derivative markets are highly active. Although the Company’s derivative instruments are valued using public indices, the instruments
EXTRACTION OIL & GAS HOLDINGS, LLC
NOTES TO CONSOLIDATED FINANCIAL STATEMENTS (Continued)
themselves are traded with third-party counterparties and are not openly traded on an exchange. As such, the Company has classified these instruments as Level 2.
Fair Value of Financial Instruments
The Company’s financial instruments consist primarily of cash and cash equivalents, accounts receivable, accounts payable, commodity derivative instruments (discussed above) and long-term debt. The carrying values of cash and cash equivalents, accounts receivable and accounts payable are representative of their fair values due to their short-term maturities. The carrying amount of the Company’s credit facility approximated fair value as it bears interest at variable rates over the term of the loan. The fair value of the Second Lien Notes was derived from available market data. As such, the
Company has classified the Second Lien Notes as Level 2. Please refer to Note 5—Long-Term Debt for further information. This disclosure (in thousands) does not impact the Company’s financial position, results of operations or cash flows.
|
|
|
At December 31, 2015 |
|
At December 31, 2014 |
| ||||||||
|
|
|
Carrying |
|
Fair Value |
|
Carrying |
|
Fair Value |
| ||||
|
Credit facility |
|
$ |
225,000 |
|
$ |
225,000 |
|
$ |
100,000 |
|
$ |
100,000 |
|
|
Second Lien Notes(1) |
|
$ |
412,790 |
|
$ |
433,196 |
|
$ |
408,903 |
|
$ |
463,058 |
|
(1) The carrying amount of the Second Lien Notes includes unamortized debt discount and debt issuance costs of $17.2 million and $21.1 million as of December 31, 2015 and December 31, 2014, respectively.
Non-Recurring Fair Value Measurements
The Company applies the provisions of the fair value measurement standard on a non-recurring basis to its non-financial assets and liabilities, including proved property. These assets and liabilities are not measured at fair value on a recurring basis, but are subject to fair value adjustments when facts are circumstances arise that indicate a need for measurement.
The Company utilizes fair value on a non-recurring basis to review its proved oil and gas properties for potential impairment when events and circumstances indicate a possible decline in the recoverability of the carrying value of such property. In December of 2015, the Company sold certain proved property and in accordance with ASC 360—Property, Plant and Equipment, measured the property at its fair value prior to the sale of the assets. The Company used an income approach analysis based on the net discounted future cash-flows of producing property. The future cash-flows are based on Management’s estimates for the future. Unobservable inputs included estimates of oil and gas production, as the case may be, from the Company’s reserve reports, commodity prices based on the sales contract terms or forward price curves, operating and development costs, and a discount rate based on the Company’s weighted average cost of capital (all of which are Level 3 inputs within the fair value hierarchy). The impairment tests on the proved property sold indicated that an impairment had occurred at Extraction, and therefore Extraction recorded impairment expense of $2.7 million to reduce the carrying value of the property to its fair value. Additionally, the Company recorded impairment expense of $9.5 million related to impairment of its subsidiary, 8 North. 8 North had negative future undiscounted cash flows associated with its proved oil and gas properties as of December 31, 2015, and it was determined that 8 North’s proved oil and gas properties had no remaining fair value. Therefore, 8 North’s full net book value of proved oil and gas properties were impaired. The Company recognized $12.2 million in impairment expense attributable to proved oil and gas properties for the year ended December 31, 2015.
The Company’s other non-recurring fair value measurements include the purchase price allocations for the fair value of assets and liabilities acquired through business combinations, please refer to Note 4—Acquisitions. The fair value of assets and liabilities acquired through business combinations is calculated using a discounted-cash flow approach using level 3 inputs. Cash flow estimates require forecasts and assumptions for many years into the future for a variety of factors, including risk-adjusted oil and gas reserves, commodity prices and operating costs, based on market participant assumptions.
EXTRACTION OIL & GAS HOLDINGS, LLC
NOTES TO CONSOLIDATED FINANCIAL STATEMENTS (Continued)
The fair value of assets or liabilities associated with purchase price allocations is on a non-recurring basis and is not measured in periods after initial recognition.
Note 9—Members’ Equity
Tranche A, Tranche B and Preferred Tranche C Unit Issuance
At December 31, 2015, the Company’s operations were governed by the provisions of the Amended and Restated Limited Liability Company Agreement effective March 10, 2015 (“Holdings LLC Agreement”) and the Company had two classes of voting membership interests outstanding, the Tranche A Equity Units and the Tranche C Equity Units. In connection with the Reorganization, on May 29, 2014, the following Tranche A Equity Units were issued:
· 62.4 million Tranche A Equity Units were issued to certain members that had made historical capital contributions to Extraction through PRL at a price of $1.02 per unit for gross proceeds of $63.4 million; and,
· 14.5 million Tranche A Equity Units were issued to certain members to settle $39.0 million of Extraction convertible notes at a price of $2.68 per unit for gross proceeds of $39.0 million.
Additionally, on May 29, 2014, 75.6 million Tranche A Equity Units were issued to new and existing members in exchange for additional capital contributions at a price of $2.68 per unit for gross proceeds of $202.9 million.
On August 20, 2014, the Company issued an additional 74.5 million Tranche A Equity Units to new and existing members in exchange for additional capital contributions at a price of $2.68 per unit for gross proceeds of $199.9 million.
On February 18, 2015, the Company issued 15.3 million Tranche B Equity Units to certain Members at a purchase price of $3.25 per unit for gross proceeds of $49.6 million. The Tranche B Equity Unit holders were granted certain rights in Holdings’ limited liability company agreement. Included was a right to exchange the Tranche B Equity Units for new equity units at a price of $3.25 per unit if the Company issues any equity units with rights, preferences or obligations different form the Tranche B Units on or prior to May 14, 2015.
On March 10, 2015, the Company issued 32.5 million Tranche C Equity Units to certain new and existing Members at a purchase price of $3.25 per unit for gross proceeds of $105.7 million and each Tranche B Equity Unit was reclassified as a Tranche C Equity Unit, such that no Tranche B Equity Units remain outstanding. The Tranche C Equity Unit holders were granted certain rights in Holdings’ limited liability company agreement. Included with these rights were, (1) the right to receive their invested capital prior to any distribution to any other unit holders, (2) the right to receive additional tranche C units under specified circumstances contingent upon an initial public offering or certain change of control events and (3) the right to approve the issue of equity units with any rights or preferences that are senior to the rights and preferences of the Tranche C Equity Units.
On September 24, 2015, the Company issued 22.9 million Tranche C Equity Units to Members at a purchase price of $3.25 per unit for gross proceeds of $74.3 million.
On October 13, 2015, the Company issued 7.9 million Tranche C Equity Units to new and existing Members at a purchase price of $3.25 per unit for gross proceeds of $25.7 million.
The Company incurred equity issuance costs of $4.6 million and $9.8 million for the years ended December 31, 2015 and 2014, respectively. These equity issuance costs were recorded as a reduction to Members’ Equity.
Restricted Stock Units (“RSUs”)
Under the Holdings LLC Agreement, the Company can grant RSUs to employees, non-employee managers and consultants. RSUs are nonvoting membership interests in the Company and are subject to certain vesting and forfeiture conditions, but have equal rights and preferences to the Tranche A Equity Units in all other regards. See Note 10—Unit-Based Compensation for additional information.
EXTRACTION OIL & GAS HOLDINGS, LLC
NOTES TO CONSOLIDATED FINANCIAL STATEMENTS (Continued)
Promissory Notes
In May 2014, the Company received full recourse promissory notes from two officers under which the Company advanced $5.4 million to the employees to meet their capital contributions. The promissory notes are due on May 29, 2021, or earlier in the event of termination or certain change in control events as stipulated in the individual promissory notes and any distributions of capital contributions are considered mandatory prepayments. The promissory notes have a stated interest rate of LIBOR plus 1% per annum. The promissory notes are recorded as a reduction of members’ equity.
Note 10—Unit-Based Compensation
Holdings’ RSU’s
On May 29, 2014, the Company adopted the 2014 Membership Unit Incentive Plan (“2014 Plan”). The 2014 Plan provides for the compensation of employees, non-employee managers and consultants of the Company and its affiliates through grants of restricted stock units (“Holdings’ RSUs”) and incentive units. As of December 31, 2015, 1.3 million Holdings’ RSUs remained available for issuance under the 2014 Plan.
At the Reorganization through December 31, 2015, the following Holdings’ RSU activity occurred related to the Company’s employees and non-employee consultants:
· 3.4 million Holdings’ RSUs were granted to each holder of PRL RSUs as part of the Reorganization, (as defined below under the heading “PRL RSUs”);
· 3.5 million Holdings’ RSUs were granted to certain Company employees and consultants to keep their equity ownership whole as part of the Reorganization; and,
· 1.4 million Holdings’ RSUs were granted to certain members of Extraction management who participated in Extraction’s Net Profits Interest Bonus Plan, which was terminated on May 29, 2014 as part of the Reorganization.
· 1.9 million Holdings’ RSUs were granted to certain Company employees that were hired subsequent to the Reorganization.
Holdings’ RSUs vest over a three-year service period, with 25%, 25% and 50% of the units vesting in year one, two and three, respectively. The vesting period for the 3.4 million Holdings’ RSUs granted to holders of PRL RSUs was carried over from the original PRE RSU grants; as such, 0.2 million Holdings’ RSUs were vested on May 29, 2014. The vesting period for all other Holdings’ RSUs begins on the grant date. The Company estimates fair value of the RSU’s on their grant date based upon estimated volatility, market comparable risk free rate, estimated forfeiture rate and a discount for lack of marketability. Grant date fair value was determined based on the value of the Company’s Equity Units on the date of the grant. Due to a lack of historical data, the Company uses the experience of other entities in the same industry to estimate a forfeiture rate. Expected forfeitures are then included as part of the grant date estimate of compensation cost.
The Company recorded $5.3 million and $3.7 million of unit-based compensation costs related to Holding’ RSU grants for the years ended December 31, 2015 and 2014, respectively. No tax benefit related to unit-based compensation was recognized in the consolidated statements of operations and no unit-based compensation was capitalized for the years ended December 31, 2015 and 2014. As of December 31, 2015, there was $5.5 million of total unrecognized compensation cost related to unvested Holdings’ RSUs granted to employees that is expected to be recognized over a weighted-average period of 1.3 years and $0.4 million of total unrecognized compensation cost related to unvested Holdings’ RSUs granted to non-employee consultants that is expected to be recognized over a weighted-average period of 1.1 years.
Of the 3.4 million Holdings’ RSUs granted to holders of PRL RSUs in connection with the Reorganization, 1.3 were granted to PRL employees or consultants. The Company does not record any unit-based compensation expense related to these awards because PRL employees or consultants do not provide services to the Company.
EXTRACTION OIL & GAS HOLDINGS, LLC
NOTES TO CONSOLIDATED FINANCIAL STATEMENTS (Continued)
Of the 3.5 million Holdings’ RSUs granted to certain employees and consultants to keep their equity ownership whole as part of the Reorganization, 1.3 were granted to PRL employees or consultants. The Company does not record any unit-based compensation expense related to these awards because PRL employees or consultants do not provide services to the Company.
The following table summarizes the Holdings’ RSU activity from the Reorganization through December 31, 2015 and provides information for Holdings’ RSU’s outstanding at the dates indicated:
|
|
|
Number of |
|
Weighted |
| |
|
Non-vested RSUs at May 29, 2014 |
|
8,353,616 |
|
$ |
2.21 |
|
|
Granted |
|
1,705,000 |
|
$ |
2.25 |
|
|
Forfeited |
|
(21,826 |
) |
$ |
2.21 |
|
|
Vested |
|
(670,894 |
) |
$ |
2.21 |
|
|
Non-vested RSUs at January 1, 2015 |
|
9,365,896 |
|
$ |
2.22 |
|
|
Granted |
|
196,047 |
|
$ |
2.68 |
|
|
Forfeited |
|
(53,063 |
) |
$ |
2.21 |
|
|
Vested |
|
(3,197,638 |
) |
$ |
2.22 |
|
|
Non-vested RSUs at December 31, 2015 |
|
6,311,242 |
|
$ |
2.23 |
|
PRL RSU’s
Prior to the Reorganization, PRL granted RSU’s to certain employees, including Extraction employees (“PRL RSUs”). Subsequent to the Reorganization, Extraction’s employees retained the PRL RSU’s. PRL RSUs vest over a three-year service period, with 25%, 25% and 50% of the units vesting in year one, two and three, respectively. Grant date fair value was determined based on the value of PRL’s Equity Units on the date of the grant. PRL uses its past experience to estimate a forfeiture rate and expected forfeitures are included as part of the grant date estimate of compensation cost.
The Company recorded $0.8 million and $0.8 million of unit-based compensation costs related to PRL RSU grants for the years ended December 31, 2015 and 2014, respectively. As of December 31, 2015, there was $0.5 million of total unrecognized compensation cost related to unvested PRL RSUs granted to employees that is expected to be recognized over a weighted-average period of 0.4 years.
Holdings’ Incentive Units
In accordance with the 2014 Plan and the Holdings LLC Agreement, Holdings issued incentive units to certain members of management in 2015. As of December 31, 2015, 3.0 million of incentive units had been issued. No incentive units were issued prior to 2015.
All of the incentive units are non-voting and subject to certain vesting and performance conditions. The incentive units vest over a three year service period, with 25%, 25% and 50% of the units vesting in year 1, year 2 and year 3, respectively, and in full upon a change of control, as defined in the Holdings LLC Agreement. The incentive units are accounted for as liability awards under ASC 718, Compensation—Stock Compensation, with compensation expense based on period-end fair value. No incentive compensation expense was recorded during the year ended December 31, 2015, because it was not probable that the performance criterion would be met.
Note 11—Earnings (Loss) Per Unit
As discussed in Note 9—Members’ Equity, the Company has Tranche A and Tranche C Equity Units. Additionally, the Company’s RSUs are classified as Tranche A non-voting units upon vesting. In a distribution of capital in excess of contributed capital, the Company’s two types of Equity Units, Tranche A and Tranche C, participate in distributions proportionally based on their respective share of the total number of equity units outstanding. The Tranche C Equity Units receive their contributed capital prior to Tranche A only in a liquidation event. The Company assumes liquidation in excess of capital contributions, thus the Tranche C and A Units are considered in the same class for the purpose of computing earnings (loss) per unit.
EXTRACTION OIL & GAS HOLDINGS, LLC
NOTES TO CONSOLIDATED FINANCIAL STATEMENTS (Continued)
Basic earnings (loss) per unit is computed by dividing income (loss) attributable to unitholders by the weighted average number of units outstanding during each period. Diluted earnings per unit reflects the potential dilutive impact from unvested RSUs. As of December 31, 2015 and 2014, there were 6.3 million and 9.5 million unvested RSUs, respectively. In periods of net loss, as was the case for the year-ended December 31, 2015, potentially dilutive units are excluded from the calculation because they are anti-dilutive.
The table below sets forth the computations of basic and diluted net income (loss) per unit for the years ended December 31, 2015 and 2014 (in thousands, except per unit data):
|
|
|
For the Years Ended |
| ||||
|
|
|
2015 |
|
2014 |
| ||
|
Net income (loss) allocable to Equity Units |
|
$ |
(47,264 |
) |
$ |
49,842 |
|
|
Weighted average basic Equity Units outstanding |
|
277,322 |
|
180,429 |
| ||
|
Basic income (loss) per Equity Unit |
|
$ |
(0.17 |
) |
$ |
0.28 |
|
|
Weighted average diluted Equity Units outstanding |
|
277,322 |
|
189,938 |
| ||
|
Diluted income (loss) per Equity Unit(1) |
|
$ |
(0.17 |
) |
$ |
0.26 |
|
(1) For the year ended December 31, 2015, the anti-dilutive RSUs were excluded from the if-converted method of calculating diluted earnings per unit.
Note 12—Commitments and Contingencies
Leases
The Company leases two office spaces in Denver, Colorado, one office space in Greeley, Colorado and one office space in Houston, Texas under separate operating lease agreements. The Denver, Colorado leases expire on February 29, 2020 and May 31, 2026, respectively. The Greeley and Houston leases expire on March 31, 2019 and October 31, 2017, respectively. Total rental commitments under non-cancelable leases for office space were $22.7 million at December 31, 2015. The future minimum lease payments under these non-cancelable leases are as follows: $1.7 million in 2016, $2.5 million in 2017, $2.5 million in 2018, $2.3 million in 2019, $2.1 million in 2020 and $11.6 million thereafter. Rent expense was $1.1 million and $0.4 million for the years ended December 31, 2015 and 2014, respectively.
On June 4, 2015, the Company subleased the remaining term of one of its Denver office leases that expires February 29, 2020. The sublease will decrease the Company’s future lease payments by $0.9 million.
Drilling Rigs
As of December 31, 2015, the Company was subject to commitments on two drilling rigs. In the event of early termination of these contracts, the Company would be obligated to pay an aggregate amount of approximately $3.0 million as of December 31, 2015, as required under the terms of the contracts. In March 2015, the Company early terminated one of its drilling rig contracts for approximately $1.7 million, which was recorded in the consolidated statements of operations within the other operating expenses line item. In February 2016, the Company provided notice to terminate one of its drilling rigs that was subject to commitment at December 31, 2015. As part of this termination, the Company will be obligated to pay $1.0 million in the second quarter of 2016.
Delivery Commitments
As of December 31, 2015, the Company had long-term crude oil delivery commitments of 40,000 barrels per day (“Bpd”) for a term of ten years and 20,000 Bpd for a term of five years. Both commitments have an expected commencement date of November 30, 2016. The aggregate amount of estimated payments under these agreements was $759.2 million. Neither of these commitments require the Company to deliver oil produced specifically from any of the Company’s properties.
In March 2016, the Company terminated the five year 20,000 Bpd commitment and amended and restated the 40,000 Bpd commitment for new terms including a ten year duration. The commencement date remained unchanged. The Company currently has a fixed monthly delivery commitment of 40,000 Bpd in year one, 52,000
EXTRACTION OIL & GAS HOLDINGS, LLC
NOTES TO CONSOLIDATED FINANCIAL STATEMENTS (Continued)
Bpd in year two, and 58,000 Bpd in years three through ten at a price of $3.95 per barrel which is subject to standard FERC escalation rates. The aggregate amount of estimated payments under the new amended and restated agreement is $887.3 million over the ten years.
None of the Company’s reserves are subject to any priorities or curtailments that may affect quantities delivered to its customers. The Company believes that its future production is adequate to meet its commitments. If for some reason the Company’s production is not sufficient to satisfy its commitments, the Company expects to be able to purchase volumes in the market or make other arrangements to satisfy its commitments.
General
The Company is subject to contingent liabilities with respect to existing or potential claims, lawsuits, and other proceedings, including those involving environmental, tax, and other matters, certain of which are discussed more specifically below. The Company accrues liabilities when it is probable that future costs will be incurred and such costs can be reasonably estimated. Such accruals are based on developments to date and the Company’s estimates of the outcomes of these matters and its experience in contesting, litigating, and settling other matters. As the scope of the liabilities becomes better defined, there will be changes in the estimates of future costs, which management currently believes will not have a material effect on the Company’s financial position, results of operations, or cash flows.
As is customary in the oil and gas industry, the Company may at times have commitments in place to reserve or earn certain acreage positions or wells. If the Company does not meet such commitments, the acreage positions or wells may be lost or the Company may be required to pay damages if certain performance conditions are not met.
Legal Matters
In the first quarter of 2016, the Company received two invoices related to a terminated firm natural gas transportation service agreement. The natural gas transportation provider has demanded payment under this terminated agreement. The Company has delivered written notice disputing any and all amounts due related to this terminated agreement. The Company intends to vigorously defend itself against any and all demands, if legal proceedings relating to this matter are initiated; we may incur material legal expenses if this dispute results in litigation. The Company is unable to estimate a reasonable possible loss. In the event there is an adverse outcome, the Company currently estimates that its future loss would range between $0 million to $37.2 million that would be paid over the 10 year term of transportation service agreement.
In September 2014, the Company was named as a third party defendant in State of Colorado, Acting by and Through the State Board of Land Commissioners v. R.K. Pinson & Associates, LLC, et al., Case Number 2014-CV-032148 in the Denver District Court. On July 10, 2015 the State of Colorado, acting by and through its State Board of Land Commissioners (the “State”), R.K. Pinson & Associates (“Pinson”), and the Company reached a Settlement Agreement and Mutual Release. As part of the Settlement and Release, the Company or a wholly-owned subsidiary of Holdings was required to stand behind its original authorized bid of $2,000 per acre at auction, which occurred in August 2015. At the August 2015 auction, a wholly-owned subsidiary of Holdings bid and won the tract of land for $2,000 per acre and has since paid the State approximately $1.3 million for the parcel of land. No punitive fees are to be paid by the Company.
In the ordinary course of business, the Company may at times be subject to claims and legal actions. Management believes it is remote that the impact of such matters will have a material adverse effect on the Company’s financial position, results of operations or cash flows. Management is unaware of any pending litigation brought against the Company requiring the reserve of a contingent liability as of the date of these financial statements.
EXTRACTION OIL & GAS HOLDINGS, LLC
NOTES TO CONSOLIDATED FINANCIAL STATEMENTS (Continued)
Note 13—Related Party Transactions
Payment for Certain Services to a Related Affiliate
In 2014, the Company entered into an agreement for certain services provided in connection with obtaining debt. A member of our board of managers is an independent contractor for the company that provided these services. The services were completed in 2014 in connection with facilitating the borrowings under the Second Lien Notes. The Company agreed to make aggregate payments of approximately $2.1 million for these services and the amount was recorded in debt issuance costs and will be amortized using the effective interest method. As of December 31, 2015, the entire amount of $2.1 million was paid.
Due to Related Party
For the years ended December 31, 2013 and 2014, PRL paid for certain general and administrative expenses, which included salary and related benefits, office rent, insurance premiums and other general and administrative costs of $1.1 million and $2.0 million, respectively. The Company repaid $2.9 million during the year ended December 31, 2014 and recorded a payable due to related party in the amounts of $0.2 million at December 31, 2014. The remaining $0.2 million was repaid in April 2015. For the year ended December 31, 2015, PRL did not pay for any of the Company’s general and administrative expenses and there was no remaining payable due to related party.
Office Lease with Related Affiliate
In April 2016, the Company subleased office space to Star Peak Capital, LLC, of which a member of the board of managers is an owner, for $1,400 per month. The sublease is set to commence on May 1, 2016 and expires on February 28, 2020.
Related Party—Note Payable
In connection with the Reorganization, the balance of Extraction’s Related Party—Note Payable, including accrued interest, was converted into equity of $62.4 million in May 2014. Interest expense incurred on the Related Party—Note Payable was $0.3 million for the year ended December 31, 2014.
Convertible Notes
In April and May 2014, certain members were issued $39.0 million of convertible notes, with an interest rate of 6% per annum. In connection with the Reorganization, Extraction’s convertible notes were converted into equity in May 2014. For the year ended December 31, 2014, the Company incurred interest expense of $0.2 million on the convertible notes.
Promissory Notes
In May 2014, the Company received full recourse promissory notes from two officers under which the Company advanced $5.4 million to the employees to meet their capital contributions. The promissory notes are due on May 29, 2021, or earlier in the event of termination or certain change in control events as stipulated in the individual promissory notes and any distributions of capital contributions are considered mandatory prepayments. The promissory notes have a stated interest rate of LIBOR plus 1% per annum. The promissory notes are recorded as a reduction of members’ equity.
Note 14—Supplemental Oil, Natural Gas and NGL Reserve Information (Unaudited)
Oil, Natural Gas and NGL Quantities
The reserves at December 31, 2015 and 2014 presented below were prepared by the independent engineering firm Ryder Scott Company, L.P. All reserves are located within the DJ Basin. Proved oil, natural gas and NGL reserves are the estimated quantities of oil, natural gas and NGLs which geological and engineering data demonstrate, with reasonable certainty, to be recoverable in future years from known reservoirs under economic and
EXTRACTION OIL & GAS HOLDINGS, LLC
NOTES TO CONSOLIDATED FINANCIAL STATEMENTS (Continued)
operating conditions (i.e., prices and costs) existing at the time the estimate is made. Proved developed oil, natural gas and NGL reserves are proved reserves that can be expected to be recovered through existing wells and equipment in place and under operating methods being utilized at the time the estimates were made. A variety of methodologies are used to determine our proved reserve estimates. The principal methodologies employed are decline curve analysis, advance production type curve matching, petro physics/log analysis and analogy. Some combination of these methods is used to determine reserve estimates in substantially all of our fields. The Company emphasizes that reserve estimates are inherently imprecise and that estimates of new discoveries and undeveloped locations are more imprecise than estimates of established proved producing oil and gas properties. Accordingly, these estimates are expected to change as future information becomes available.
The following table sets forth information for the years ended December 31, 2015 and 2014 with respect to changes in the Company’s proved (i.e. proved developed and undeveloped) reserves:
|
|
|
Crude Oil |
|
Natural Gas |
|
NGL Mbbls |
|
|
December 31, 2013 |
|
123.9 |
|
673.0 |
|
88.8 |
|
|
Revisions of previous estimates |
|
(300.3 |
) |
3,493.9 |
|
755.9 |
|
|
Purchase of reserves |
|
17,968.1 |
|
82,051.7 |
|
9,219.1 |
|
|
Extensions, discoveries, and other additions |
|
28,395.4 |
|
82,861.5 |
|
9,712.5 |
|
|
Sale of reserves |
|
— |
|
— |
|
— |
|
|
Production |
|
(1,022.2 |
) |
(2,664.0 |
) |
(325.3 |
) |
|
December 31, 2014 |
|
45,164.9 |
|
166,416.1 |
|
19,451.0 |
|
|
Revisions of previous estimates |
|
(2,961.0 |
) |
(2,825.8 |
) |
2,281.9 |
|
|
Purchase of reserves |
|
11,831.7 |
|
64,392.7 |
|
7,533.3 |
|
|
Extensions, discoveries, and other additions |
|
23,098.7 |
|
85,781.0 |
|
11,663.4 |
|
|
Sale of reserves |
|
(1,688.5 |
) |
(10,357.1 |
) |
(1,212.1 |
) |
|
Production |
|
(3,945.6 |
) |
(10,823.0 |
) |
(1,334.6 |
) |
|
December 31, 2015 |
|
71,500.3 |
|
292,583.9 |
|
38,382.9 |
|
|
Proved Developed Reserves, included above |
|
|
|
|
|
|
|
|
Balance as of December 31, 2013 |
|
123.9 |
|
673.0 |
|
88.8 |
|
|
Balance as of December 31, 2014 |
|
9,755.6 |
|
35,580.1 |
|
4,158.8 |
|
|
Balance as of December 31, 2015 |
|
14,248.6 |
|
53,011.7 |
|
7,058.3 |
|
|
Proved Undeveloped Reserves, included above |
|
|
|
|
|
|
|
|
Balance as of December 31, 2013 |
|
— |
|
— |
|
— |
|
|
Balance as of December 31, 2014 |
|
35,409.3 |
|
130,836.0 |
|
15,292.2 |
|
|
Balance as of December 31, 2015 |
|
57,251.5 |
|
239,572.2 |
|
31,324.6 |
|
· The values for the 2015 oil, natural gas and NGL reserves are based on the 12-month arithmetic average of the first day of the month prices for the period from January through December 31, 2015. The unweighted arithmetic average first-day-of-the-month prices for the prior twelve months were $50.28 per barrel (West Texas Intermediate price) for crude oil and NGLs and $2.58 per MMBtu (Henry Hub price) for natural gas. All prices are then further adjusted for transportation, quality and basis differentials. The average resulting price used as of December 31, 2015 was $43.28 per barrel for oil, $2.11 per Mcf for natural gas and $10.65 per barrel for NGLs.
· The values for the 2014 oil, natural gas and NGL reserves are based on the 12 month arithmetic average of the first day of the month prices for the period from January through December 31, 2014. The unweighted arithmetic average first-day-of-month prices for the prior twelve months were $94.99 per barrel (West Texas Intermediate price) for crude oil and NGLs and $4.35 per MMBtu (Henry Hub price) for natural gas. All prices are then further adjusted for transportation, quality and basis differentials. The average resulting price used as of December 31, 2014 was $84.99 per barrel for oil, $3.97 per Mcf for natural gas and $28.39 per barrel for NGLs.
For the year ended December 31, 2015, the Company had downward revisions of previous estimates of 1,150.1 MBOE. As a result of ongoing drilling and completion activities during 2015, the Company reported extensions, discoveries, and other additions of 49,058.9 MBOE. Additionally, during 2015 the Company purchased reserves of 30,097.1 MBOE.
EXTRACTION OIL & GAS HOLDINGS, LLC
NOTES TO CONSOLIDATED FINANCIAL STATEMENTS (Continued)
For the year ended December 31, 2014, the Company had upward revisions of previous estimates of 1,037.9 MBOE. These revisions are primarily the result of well performance exceeding previous estimates. As a result of ongoing drilling and completion activities during 2014, the Company reported extensions, discoveries, and other additions of 51,918.2 MBOE. Additionally, during 2014 the Company purchased reserves of 40,862.5 MBOE.
Standardized Measure of Discounted Future Net Cash Flows Relating to Proved Oil, Natural Gas and NGL Reserves
The Company follows the guidelines prescribed in ASC Topic 932, Extractive Activities—Oil and Gas for computing a standardized measure of future net cash flows and changes therein relating to estimated proved reserves. The following summarizes the policies used in the preparation of the accompanying oil, natural gas and NGL reserve disclosures, standardized measures of discounted future net cash flows from proved oil, natural gas and NGL reserves and the reconciliations of standardized measures from year to year.
The information is based on estimates of proved reserves attributable to the Company’s interest in oil and gas properties as of December 31 of the years presented. These estimates were prepared by Ryder Scott Company L.P., independent petroleum engineers.
The standardized measure of discounted future net cash flows from production of proved reserves was developed as follows: (1) Estimates are made of quantities of proved reserves and future periods during which they are expected to be produced based on year-end economic conditions. (2) The estimated future cash flows are compiled by applying the twelve month average of the first of the month prices of crude oil and natural gas relating to the Company’s proved reserves to the year-end quantities of those reserves for reserves. (3) The future cash flows are reduced by estimated production costs, costs to develop and produce the proved reserves and abandonment costs, all based on year-end economic conditions, plus Company overhead incurred. (4) Future net cash flows are discounted to present value by applying a discount rate of 10%.
The assumptions used to compute the standardized measure are those prescribed by the FASB and the SEC. These assumptions do not necessarily reflect the Company’s expectations of actual revenues to be derived from those reserves, nor their present value. The limitations inherent in the reserve quantity estimation process, as discussed previously, are equally applicable to the standardized measure computations, since these reserve quantity estimates are the basis for the valuation process. The Company emphasizes that reserve estimates are inherently imprecise and that estimates of new discoveries and undeveloped locations are more imprecise than estimates of established proved producing oil and gas properties. The standardized measure of discounted future net cash flows does not purport, nor should it be interpreted, to present the fair value of the Company’s oil and natural gas reserves. An estimate of fair value would also take into account, among other things, the recovery of reserves not presently classified as proved, anticipated future changes in prices and costs and a discount factor more representative of the time value of money and the risks inherent in reserve estimates.
The following summary sets forth the Company’s future net cash flows relating to proved oil, natural gas and NGL reserves based on the standardized measure prescribed in ASC Topic 932 (in thousands):
|
|
|
For the Years Ended |
| ||||
|
|
|
2015 |
|
2014 |
| ||
|
Future crude oil, natural gas and NGL sales |
|
$ |
4,119,888 |
|
$ |
5,051,640 |
|
|
Future production costs |
|
(1,193,560 |
) |
(1,173,237 |
) | ||
|
Future development costs |
|
(1,141,330 |
) |
(1,017,668 |
) | ||
|
Future income tax expense |
|
— |
|
— |
| ||
|
Future net cash flows |
|
$ |
1,784,998 |
|
$ |
2,860,735 |
|
|
10% annual discount |
|
(949,115 |
) |
(1,473,263 |
) | ||
|
Standardized measure of discounted future net cash flows(1) |
|
$ |
835,883 |
|
$ |
1,387,472 |
|
(1) The Company’s calculations of the standardized measure of discounted future net cash flows does not include the effect of estimated future income tax expenses for all years reported as the Company is a limited liability company and not subject to income taxes. For purposes of the standardized measure calculation, it was assumed that all of the Company’s operations are attributable to our oil and gas assets.
EXTRACTION OIL & GAS HOLDINGS, LLC
NOTES TO CONSOLIDATED FINANCIAL STATEMENTS (Continued)
The following are the principal sources of change in the standardized measure (in thousands):
|
|
|
For the Years Ended |
| ||||
|
|
|
2015 |
|
2014 |
| ||
|
Balance at beginning of period |
|
$ |
1,387,472 |
|
$ |
7,816 |
|
|
Sales of crude oil, natural gas and NGL, net |
|
(150,087 |
) |
(78,030 |
) | ||
|
Net change in prices and production costs |
|
(1,292,364 |
) |
(94,884 |
) | ||
|
Net change in future development costs |
|
175,944 |
|
14,149 |
| ||
|
Extensions and discoveries |
|
284,216 |
|
787,910 |
| ||
|
Acquisitions of reserves |
|
240,989 |
|
666,887 |
| ||
|
Sale of reserves |
|
(50,018 |
) |
— |
| ||
|
Revisions of previous quantity estimates |
|
(28,391 |
) |
19,606 |
| ||
|
Previously estimated development costs incurred |
|
102,060 |
|
42,100 |
| ||
|
Net changes in income taxes |
|
— |
|
— |
| ||
|
Accretion of discount |
|
156,723 |
|
28,995 |
| ||
|
Other |
|
9,339 |
|
(7,077 |
) | ||
|
Balance at end of period |
|
$ |
835,883 |
|
$ |
1,387,472 |
|

EXTRACTION OIL & GAS HOLDINGS, LLC
CONDENSED CONSOLIDATED BALANCE SHEETS
(In thousands, except unit data)
(Unaudited)
|
|
|
September 30, |
|
December 31, |
| ||
|
ASSETS |
|
|
|
|
| ||
|
Current Assets: |
|
|
|
|
| ||
|
Cash and cash equivalents |
|
$ |
1,386 |
|
$ |
97,106 |
|
|
Accounts receivable |
|
|
|
|
| ||
|
Trade |
|
19,011 |
|
27,927 |
| ||
|
Oil, natural gas and NGL sales |
|
24,444 |
|
15,938 |
| ||
|
Inventory and prepaid expenses |
|
5,695 |
|
7,938 |
| ||
|
Commodity derivative asset |
|
532 |
|
68,885 |
| ||
|
Total Current Assets |
|
51,068 |
|
217,794 |
| ||
|
Property and Equipment (successful efforts method), at cost: |
|
|
|
|
| ||
|
Proved oil and gas properties |
|
1,405,817 |
|
1,128,022 |
| ||
|
Unproved oil and gas properties |
|
318,267 |
|
374,194 |
| ||
|
Wells in progress |
|
61,064 |
|
59,416 |
| ||
|
Less: accumulated depletion, depreciation and amortization |
|
(341,050 |
) |
(181,382 |
) | ||
|
Net oil and gas properties |
|
1,444,098 |
|
1,380,250 |
| ||
|
Other property and equipment, net of accumulated depreciation (Note 2) |
|
29,346 |
|
30,402 |
| ||
|
Net Property and Equipment |
|
1,473,444 |
|
1,410,652 |
| ||
|
Non-Current Assets: |
|
|
|
|
| ||
|
Cash held in escrow |
|
42,000 |
|
— |
| ||
|
Deferred equity issuance costs |
|
5,126 |
|
942 |
| ||
|
Commodity derivative asset |
|
— |
|
2,906 |
| ||
|
Other non-current assets |
|
1,767 |
|
1,846 |
| ||
|
Total Non-Current Assets |
|
48,893 |
|
5,694 |
| ||
|
Total Assets |
|
$ |
1,573,405 |
|
$ |
1,634,140 |
|
|
LIABILITIES AND MEMBERS’ EQUITY |
|
|
|
|
| ||
|
Current Liabilities: |
|
|
|
|
| ||
|
Accounts payable and accrued liabilities |
|
$ |
76,982 |
|
$ |
111,127 |
|
|
Revenue payable |
|
48,980 |
|
38,752 |
| ||
|
Production taxes payable |
|
27,149 |
|
19,061 |
| ||
|
Commodity derivative liability |
|
21,776 |
|
— |
| ||
|
Accrued interest payable |
|
8,792 |
|
450 |
| ||
|
Asset retirement obligations |
|
3,742 |
|
952 |
| ||
|
Total Current Liabilities |
|
187,421 |
|
170,342 |
| ||
|
Non-Current Liabilities: |
|
|
|
|
| ||
|
Credit facility |
|
89,000 |
|
225,000 |
| ||
|
Second Lien Notes, net of unamortized debt discount and debt issuance costs (Note 4) |
|
— |
|
412,790 |
| ||
|
Senior Notes, net of unamortized debt issuance costs (Note 4) |
|
537,601 |
|
— |
| ||
|
Production taxes payable |
|
23,406 |
|
25,275 |
| ||
|
Commodity derivative liability |
|
6,727 |
|
— |
| ||
|
Other non-current liabilities |
|
3,523 |
|
3,086 |
| ||
|
Asset retirement obligations |
|
49,492 |
|
43,415 |
| ||
|
Total Non-Current Liabilities |
|
709,749 |
|
709,566 |
| ||
|
Commitments and Contingencies—Note 11 |
|
|
|
|
| ||
|
Total Liabilities |
|
897,170 |
|
879,908 |
| ||
|
Members’ Equity: |
|
|
|
|
| ||
|
Preferred tranche C units; unlimited units authorized; 115,706,938 units issued and outstanding |
|
370,418 |
|
250,338 |
| ||
|
Tranche A units; unlimited units authorized; 237,434,889 units issued and outstanding |
|
513,451 |
|
501,128 |
| ||
|
Retained earnings (deficit) |
|
(207,634 |
) |
2,766 |
| ||
|
Total Members’ Equity |
|
676,235 |
|
754,232 |
| ||
|
Total Liabilities and Members’ Equity |
|
$ |
1,573,405 |
|
$ |
1,634,140 |
|
EXTRACTION OIL & GAS HOLDINGS, LLC
CONDENSED CONSOLIDATED STATEMENTS OF OPERATIONS
(In thousands, except per unit data)
(Unaudited)
|
|
|
For the Three Months Ended |
|
For the Nine Months Ended |
| ||||||||
|
|
|
2016 |
|
2015 |
|
2016 |
|
2015 |
| ||||
|
Revenues: |
|
|
|
|
|
|
|
|
| ||||
|
Oil sales |
|
$ |
51,760 |
|
$ |
37,304 |
|
$ |
135,896 |
|
$ |
114,768 |
|
|
Natural gas sales |
|
12,792 |
|
7,472 |
|
27,730 |
|
17,707 |
| ||||
|
NGL sales |
|
8,350 |
|
4,070 |
|
19,773 |
|
9,153 |
| ||||
|
Total Revenues |
|
72,902 |
|
48,846 |
|
183,399 |
|
141,628 |
| ||||
|
Operating Expenses: |
|
|
|
|
|
|
|
|
| ||||
|
Lease operating expenses |
|
15,480 |
|
7,493 |
|
40,819 |
|
18,806 |
| ||||
|
Production taxes |
|
6,186 |
|
4,874 |
|
16,935 |
|
12,798 |
| ||||
|
Exploration expenses |
|
5,985 |
|
1,911 |
|
14,735 |
|
6,763 |
| ||||
|
Depletion, depreciation, amortization and accretion |
|
46,680 |
|
40,880 |
|
141,317 |
|
100,170 |
| ||||
|
Impairment of long lived assets |
|
467 |
|
— |
|
23,350 |
|
9,525 |
| ||||
|
Other operating expenses |
|
— |
|
696 |
|
891 |
|
2,353 |
| ||||
|
Acquisition transaction expenses |
|
345 |
|
— |
|
345 |
|
6,000 |
| ||||
|
General and administrative expenses |
|
20,071 |
|
8,568 |
|
35,189 |
|
25,437 |
| ||||
|
Total Operating Expenses |
|
95,214 |
|
64,422 |
|
273,581 |
|
181,852 |
| ||||
|
Operating Loss |
|
(22,312 |
) |
(15,576 |
) |
(90,182 |
) |
(40,224 |
) | ||||
|
Other Income (Expense): |
|
|
|
|
|
|
|
|
| ||||
|
Commodity derivatives gain (loss) |
|
16,225 |
|
46,886 |
|
(62,424 |
) |
38,478 |
| ||||
|
Interest expense |
|
(31,216 |
) |
(12,682 |
) |
(57,914 |
) |
(36,350 |
) | ||||
|
Other income |
|
36 |
|
22 |
|
120 |
|
36 |
| ||||
|
Other Income (Expense) |
|
(14,955 |
) |
34,226 |
|
(120,218 |
) |
2,164 |
| ||||
|
Net Income (Loss) |
|
(37,267 |
) |
18,650 |
|
(210,400 |
) |
$ |
(38,060 |
) | |||
|
Income (Loss) per Unit |
|
|
|
|
|
|
|
|
| ||||
|
Basic |
|
$ |
(0.11 |
) |
$ |
0.07 |
|
$ |
(0.63 |
) |
$ |
(0.14 |
) |
|
Diluted |
|
$ |
(0.11 |
) |
$ |
0.07 |
|
$ |
(0.63 |
) |
$ |
(0.14 |
) |
|
Weighted Average Units Outstanding |
|
|
|
|
|
|
|
|
| ||||
|
Basic |
|
349,014 |
|
279,896 |
|
332,377 |
|
266,844 |
| ||||
|
Diluted |
|
349,014 |
|
286,891 |
|
332,377 |
|
266,844 |
| ||||
|
Pro Forma Information (unaudited): |
|
|
|
|
|
|
|
|
| ||||
|
Pro forma income (loss) |
|
$ |
(37,267 |
) |
$ |
18,650 |
|
$ |
(210,400 |
) |
$ |
(38,060 |
) |
|
Pro forma provision for income tax (expense) benefit |
|
14,161 |
|
(7,087 |
) |
79,952 |
|
14,463 |
| ||||
|
Pro forma net income (loss) |
|
$ |
(23,106 |
) |
$ |
11,563 |
|
$ |
(130,448 |
) |
$ |
(23,597 |
) |
|
Pro forma net income (loss) per unit |
|
|
|
|
|
|
|
|
| ||||
|
Basic |
|
$ |
(0.07 |
) |
$ |
0.04 |
|
$ |
(0.39 |
) |
$ |
(0.09 |
) |
|
Diluted |
|
$ |
(0.07 |
) |
$ |
0.04 |
|
$ |
(0.39 |
) |
$ |
(0.09 |
) |
|
Weighted average pro forma units outstanding |
|
|
|
|
|
|
|
|
| ||||
|
Basic |
|
349,014 |
|
279,896 |
|
332,377 |
|
266,844 |
| ||||
|
Diluted |
|
349,014 |
|
286,891 |
|
332,377 |
|
266,844 |
| ||||
EXTRACTION OIL & GAS HOLDINGS, LLC
CONDENSED CONSOLIDATED STATEMENTS OF CHANGES IN MEMBERS’ EQUITY
(In thousands)
(Unaudited)
|
|
|
Trance A |
|
Preferred |
|
Amount |
|
(Accumulated |
|
Total |
| |||
|
Balance at January 1, 2015 |
|
227,903 |
|
— |
|
$ |
495,158 |
|
$ |
50,030 |
|
$ |
545,188 |
|
|
Units issued |
|
— |
|
68,723 |
|
223,350 |
|
— |
|
223,350 |
| |||
|
Units repurchased |
|
— |
|
— |
|
— |
|
— |
|
— |
| |||
|
Unit issuance costs |
|
— |
|
— |
|
(4,649 |
) |
— |
|
(4,649 |
) | |||
|
Restricted stock units issued |
|
2,514 |
|
— |
|
— |
|
— |
|
— |
| |||
|
Unit-based compensation |
|
— |
|
— |
|
4,583 |
|
— |
|
4,583 |
| |||
|
Net loss |
|
— |
|
— |
|
— |
|
(38,060 |
) |
(38,060 |
) | |||
|
Balance at September 30, 2015 |
|
230,417 |
|
68,723 |
|
$ |
718,442 |
|
$ |
11,970 |
|
$ |
730,412 |
|
|
Balance at January 1, 2016 |
|
231,101 |
|
78,444 |
|
$ |
751,466 |
|
$ |
2,766 |
|
$ |
754,232 |
|
|
Units issued |
|
— |
|
37,345 |
|
121,370 |
|
— |
|
121,370 |
| |||
|
Units repurchased |
|
(1,327 |
) |
(82 |
) |
(8,429 |
) |
— |
|
(8,429 |
) | |||
|
Settlement of promissory notes issued to officers |
|
— |
|
— |
|
5,562 |
|
— |
|
5,562 |
| |||
|
Unit issuance costs |
|
— |
|
— |
|
(1,022 |
) |
— |
|
(1,022 |
) | |||
|
Restricted stock units issued |
|
7,661 |
|
— |
|
— |
|
— |
|
— |
| |||
|
Unit-based compensation |
|
— |
|
|
|
14,922 |
|
— |
|
14,922 |
| |||
|
Net loss |
|
— |
|
— |
|
— |
|
(210,400 |
) |
(210,400 |
) | |||
|
Balance at September 30, 2016 |
|
237,435 |
|
115,707 |
|
$ |
883,869 |
|
$ |
(207,634 |
) |
$ |
676,235 |
|
EXTRACTION OIL & GAS HOLDINGS, LLC
CONDENSED CONSOLIDATED STATEMENTS OF CASH FLOWS
(In thousands)
(Unaudited)
|
|
|
For the Nine Months Ended |
| ||||
|
|
|
2016 |
|
2015 |
| ||
|
Cash flows from operating activities: |
|
|
|
|
| ||
|
Net loss |
|
$ |
(210,400 |
) |
$ |
(38,060 |
) |
|
Reconciliation of net loss to net cash provided by operating activities: |
|
|
|
|
| ||
|
Depletion, depreciation, amortization and accretion |
|
141,317 |
|
100,170 |
| ||
|
Abandonment and impairment of unproved properties |
|
3,331 |
|
6,214 |
| ||
|
Impairment of long lived assets |
|
23,350 |
|
9,525 |
| ||
|
Non-cash acquisition transaction expenses |
|
— |
|
6,000 |
| ||
|
Amortization of debt issuance costs and debt discount |
|
18,330 |
|
3,081 |
| ||
|
Deferred rent |
|
600 |
|
212 |
| ||
|
Commodity derivatives (gain) loss |
|
62,424 |
|
(38,478 |
) | ||
|
Settlements on commodity derivatives |
|
43,015 |
|
39,929 |
| ||
|
Premiums paid on commodity derivatives |
|
(611 |
) |
(2,350 |
) | ||
|
Unit-based compensation |
|
14,922 |
|
4,583 |
| ||
|
Changes in current assets and liabilities: |
|
|
|
|
| ||
|
Accounts receivable—trade |
|
3,889 |
|
(2,813 |
) | ||
|
Accounts receivable—oil, natural gas and NGL sales |
|
(8,506 |
) |
(8,352 |
) | ||
|
Prepaid expenses |
|
(273 |
) |
(281 |
) | ||
|
Accounts payable and accrued liabilities |
|
(18,242 |
) |
33,585 |
| ||
|
Revenue payable |
|
10,228 |
|
10,888 |
| ||
|
Production taxes payable |
|
6,219 |
|
11,774 |
| ||
|
Accrued interest payable |
|
8,342 |
|
11,704 |
| ||
|
Asset retirement expenditures |
|
(372 |
) |
(1,770 |
) | ||
|
Net cash provided by operating activities |
|
97,563 |
|
145,561 |
| ||
|
Cash flows from investing activities: |
|
|
|
|
| ||
|
Oil and gas property additions |
|
(223,684 |
) |
(288,060 |
) | ||
|
Acquired oil and gas properties |
|
(13,674 |
) |
(120,524 |
) | ||
|
Sale of property and equipment |
|
2,148 |
|
— |
| ||
|
Other property and equipment additions |
|
(3,336 |
) |
(20,086 |
) | ||
|
Cash held in escrow |
|
(42,000 |
) |
10,071 |
| ||
|
Net cash used in investing activities |
|
(280,546 |
) |
(418,599 |
) | ||
|
Cash flows from financing activities: |
|
|
|
|
| ||
|
Borrowings under credit facility |
|
60,000 |
|
100,000 |
| ||
|
Repayments under credit facility |
|
(196,000 |
) |
— |
| ||
|
Proceeds from the issuance of Senior Notes |
|
550,000 |
|
— |
| ||
|
Repayments of Second Lien Notes |
|
(430,000 |
) |
— |
| ||
|
Proceeds from the issuance of units |
|
121,370 |
|
223,350 |
| ||
|
Repurchase of units |
|
(2,867 |
) |
— |
| ||
|
Debt issuance costs |
|
(13,189 |
) |
(1,874 |
) | ||
|
Unit and deferred equity issuance costs |
|
(2,051 |
) |
(4,524 |
) | ||
|
Net cash provided by financing activities |
|
87,263 |
|
316,952 |
| ||
|
Increase (decrease) in cash and cash equivalents |
|
(95,720 |
) |
43,914 |
| ||
|
Cash and cash equivalents at beginning of period |
|
97,106 |
|
79,025 |
| ||
|
Cash and cash equivalents at end of the period |
|
$ |
1,386 |
|
$ |
122,939 |
|
|
Supplemental cash flow information: |
|
|
|
|
| ||
|
Property and equipment included in accounts payable and accrued liabilities |
|
$ |
53,371 |
|
$ |
81,444 |
|
|
Acquisition transaction expenses paid through oil and gas properties |
|
$ |
— |
|
$ |
6,000 |
|
|
Cash paid for interest |
|
$ |
30,531 |
|
$ |
25,677 |
|
|
Cash paid for Second Lien Notes prepayment penalty |
|
$ |
4,300 |
|
$ |
— |
|
|
Noncash settlement of promissory notes issued to officers |
|
$ |
5,562 |
|
$ |
— |
|
EXTRACTION OIL & GAS HOLDINGS, LLC
NOTES TO UNAUDITED CONDENSED CONSOLIDATED FINANCIAL STATEMENTS
Note 1—Organization
Description of Operations
Extraction Oil & Gas Holdings, LLC, a Delaware limited liability company was formed on May 29, 2014 by PRE Resources, LLC (“PRL”) as a holding company with no independent operations apart from its ownership of the subsidiaries described below. PRL was formed in May 2012 to invest in oil and gas properties in Michigan, California, Wyoming, North Dakota and Colorado.
Extraction Oil & Gas, LLC (“Extraction”), formerly a wholly owned subsidiary of PRL, was a wholly owned subsidiary of Holdings. Extraction was formed on November 14, 2012, as a Delaware limited liability company and is focused on the acquisition, development and production of oil, natural gas and natural gas liquids (“NGL”) reserves in the Rocky Mountains, primarily in the Wattenberg Field of the Denver Julesburg Basin (the “DJ Basin”) of Colorado.
Concurrent with the formation of Holdings, PRL contributed all of its membership interests in Extraction, to Holdings and distributed all of its interests in Holdings to its members in a pro rata distribution (the “Reorganization”). As all power and authority to control the core functions of Holdings and Extraction were controlled by PRL, the Reorganization was accounted for as a reorganization of entities under common control and the assets and liabilities of Extraction were recorded at Extraction’s historical costs.
At the Reorganization, Yorktown Energy Partners (“Yorktown”) controlled Holdings through ownership of 76.1% of its membership interests. The remaining 23.9% of Holdings’ membership interests was owned by certain members of management and other third party investors. Immediately after the Reorganization, Holdings completed an offering of its membership units (see Note 8—Members’ Equity). Following the membership offering, Yorktown controlled 51.8% of Holdings through three funds: Yorktown Energy Fund IX, LP, Yorktown Energy Fund X, LP, and Yorktown Extraction Co Investment Partners, LP. Yorktown Energy Fund XI, LP invested in the April and June 2016 equity offering.
Subsequent to the membership offering described above, the Company issued additional membership interests (see Note 8—Members’ Equity). As a result, Yorktown owned 52.0% and certain members of management and other third party investors owned 48.0% of Holdings’ at September 30, 2016.
In connection with the Company’s initial public offering (the “IPO” or the “Offering”), Extraction converted from a Delaware limited liability company to XOG, a Delaware corporation. In connection with the closing of the IPO on October 17, 2016, Holdings was merged with and into XOG, and XOG was the surviving entity to the merger. The merger was treated as a reorganization of entities under common control. As part of Holdings’ merger with and into XOG, all of Holdings’ other subsidiaries became direct or indirect subsidiaries of XOG. XOG is a public company listed for trading on the NASDAQ Global Select Market (“NASDAQ”) under the symbol “XOG”. Please refer to Note 8 — Members’ Equity for further information on the IPO.
XTR Midstream, LLC (“XTR”) was a wholly owned subsidiary of Holdings and is now a wholly-owned subsidiary of XOG. XTR was formed on September 10, 2014, as a Delaware limited liability company and is designing midstream assets to gather and process crude oil and gas production in the DJ Basin of Colorado.
7N, LLC (“7N”) was also a wholly owned subsidiary of Holdings and now is a wholly-owned subsidiary of XOG. 7N, LLC was formed on September 10, 2014, as a Delaware limited liability company to acquire certain real property and rights of way to support the build out of XTR’s gathering and processing system.
Mountaintop Minerals, LLC (“Mountaintop”) was also a wholly owned subsidiary of Holdings and is now a wholly-owned subsidiary of XOG. Mountaintop was formed on March 10, 2015, as a Delaware limited liability company to engage in the acquisition of minerals, primarily in the DJ Basin of Colorado.
EXTRACTION OIL & GAS HOLDINGS, LLC
NOTES TO UNAUDITED CONDENSED CONSOLIDATED FINANCIAL STATEMENTS (Continued)
8 North, LLC (“8 North”) was also a wholly owned subsidiary of Holdings and is now a wholly-owned subsidiary of XOG. 8 North was formed on April 29, 2015, as a Delaware limited liability company and was assigned certain leases in Boulder and Weld Counties previously owned by Extraction Oil and Gas, LLC. 8 North, LLC was formed to engage in the development of oil and gas leases currently categorized as unproved with a specific focus on Northern Colorado.
XOG Services, LLC was also a wholly owned subsidiary of Holdings and now is a wholly-owned subsidiary of XOG. XOG Services, LLC was formed on November 13, 2015, as a Delaware limited liability company to administer payroll and other general and administrative functions beginning in 2016 for all Holdings’ subsidiaries.
Extraction Finance Corp. was also a wholly owned subsidiary of Holdings and is now a wholly-owned subsidiary of XOG. Extraction Finance Corp. was formed on June 20, 2016, as a Delaware corporation to facilitate the Company’s Senior Notes Offering. For additional discussion on the Senior Notes Offering please refer to Note 4—Long Term Debt.
Note 2—Basis of Presentation and Significant Accounting Policies
Basis of Presentation
The unaudited condensed consolidated financial statements include the accounts of the Company, including its wholly owned subsidiaries. All significant intercompany balances and transactions have been eliminated in consolidation. The financial statements included herein were prepared from the records of the Company in accordance with generally accepted accounting principles in the United States (“GAAP”). In the opinion of management, all adjustments, consisting primarily of normal recurring accruals that are considered necessary for a fair statement of the consolidated financial information, have been included. However, operating results for the period presented are not necessarily indicative of the results that may be expected for a full year. These unaudited financial statements should be read in conjunction with our audited financial statements and notes for the year ended December 31, 2015, presented in our final prospectus, dated October 11, 2016 and filed with the Securities and Exchange Commission (“SEC”) pursuant to Rule 424(b)(4) of the Securities Act of 1933, as amended, on October 13, 2016.
Use of Estimates in the Preparation of Financial Statements
The preparation of the consolidated financial statements in conformity with GAAP requires management to make estimates and assumptions that affect the reported amounts of oil and gas reserves, assets and liabilities and disclosure of contingent assets and liabilities at the date of the financial statements and the reported amounts of revenues and expenses during the reporting period. Significant areas requiring the use of assumptions, judgments and estimates include (1) oil and gas reserves; (2) cash flow estimates used in impairment testing of oil and gas properties; (3) depreciation, depletion and amortization; (4) asset retirement obligations; (5) assigning fair value and allocating purchase price in connection with business combinations; (6) accrued revenue and related receivables; (7) valuation of commodity derivative instruments; (8) accrued liabilities; and (9) valuation of unit based payments. Although management believes these estimates are reasonable, actual results could differ from these estimates. The Company evaluates its estimates on an on going basis and bases its estimates on historical experience and on various other assumptions the Company believes to be reasonable under the circumstances. Although actual results may differ from these estimates under different assumptions or conditions, the Company believes its estimates are reasonable.
Cash and Cash Equivalents
Cash and cash equivalents consist of all highly liquid investments that are readily convertible into cash and have original maturities of three months or less when purchased.
EXTRACTION OIL & GAS HOLDINGS, LLC
NOTES TO UNAUDITED CONDENSED CONSOLIDATED FINANCIAL STATEMENTS (Continued)
Cash Held in Escrow
Cash held in escrow includes a deposit for the purchase of certain oil and gas properties as required under the related purchase and sale agreements. In October 2016, the $42.0 million of cash held in escrow as of September 30, 2016 was released at the closing of the acquisition. Please refer to Note 3—Acquisitions for further information.
Accounts Receivable
The Company records estimated oil and gas revenue receivable from third parties at its net revenue interest. The Company also reflects costs incurred on behalf of joint interest partners in accounts receivable. The Company generally has the ability to withhold future revenue disbursements to recover non payment of joint interest billings. On an on going basis, management reviews accounts receivable amounts for collectability and records its allowance for uncollectible receivables under the specific identification method. The Company did not record any allowance for uncollectible receivables as of or for the nine months ended September 30, 2016 and 2015.
Credit Risk and Other Concentrations
The Company’s cash and cash equivalents are exposed to concentrations of credit risk. The Company manages and controls this risk by investing these funds with major financial institutions. The Company often has balances in excess of the federally insured limits.
The Company sells oil, natural gas and natural gas liquids to various types of customers, including pipelines and refineries. Credit is extended based on an evaluation of the customer’s financial conditions and historical payment record. The future availability of a ready market for oil, natural gas and NGL depends on numerous factors outside the Company’s control, none of which can be predicted with certainty. For the three and nine months ended September 30, 2016 and 2015, the Company had the following major customers that exceeded 10% of total oil, natural gas and NGL revenues. The Company does not believe the loss of any single purchaser would materially impact its operating results because crude oil, natural gas and NGLs are fungible products with well established markets and numerous purchasers.
|
|
|
For the Three Months Ended |
|
For the Nine Months Ended |
| ||||
|
|
|
2016 |
|
2015 |
|
2016 |
|
2015 |
|
|
Customer A |
|
28 |
% |
29 |
% |
34 |
% |
30 |
% |
|
Customer B |
|
20 |
% |
21 |
% |
25 |
% |
15 |
% |
|
Customer C |
|
19 |
% |
19 |
% |
17 |
% |
16 |
% |
|
Customer D |
|
— |
% |
17 |
% |
2 |
% |
29 |
% |
|
Customer E |
|
19 |
% |
— |
% |
8 |
% |
— |
% |
At September 30, 2016, the Company had commodity derivative contracts with six counterparties. The Company does not require collateral or other security from counterparties to support derivative instruments; however, to minimize the credit risk in derivative instruments, it is the Company’s policy to enter into derivative contracts only with counterparties that are credit worthy financial institutions deemed by management as competent and competitive market makers. Additionally, the Company uses master netting agreements to minimize credit risk exposure. The credit worthiness of the Company’s counterparties is subject to periodic review. Three of the six counterparties to the derivative instruments are highly rated entities with corporate ratings at A3 classifications or above by Moody’s. The other three counterparties had a corporate rating of Baa1 by Moody’s. For the three and nine months ended September 30, 2016 and 2015, the Company did not incur any losses with respect to counterparty contracts. None of the Company’s existing derivative instrument contracts contains credit risk related contingent features.
Inventory and Prepaid Expenses
The Company records well equipment inventory at the lower of cost or market value. Prepaid expenses are recorded at cost. Inventory and prepaid expenses are comprised of the following (in thousands):
EXTRACTION OIL & GAS HOLDINGS, LLC
NOTES TO UNAUDITED CONDENSED CONSOLIDATED FINANCIAL STATEMENTS (Continued)
|
|
|
September 30, |
|
December 31, |
| ||
|
Well equipment inventory |
|
$ |
3,950 |
|
$ |
6,238 |
|
|
Prepaid expenses |
|
1,745 |
|
1,700 |
| ||
|
|
|
$ |
5,695 |
|
$ |
7,938 |
|
Oil and Gas Properties
The Company follows the successful efforts method of accounting for oil and gas properties. Under this method of accounting, all property acquisition costs and development costs are capitalized when incurred and depleted on a units of production basis over the remaining life of proved reserves and proved developed reserves, respectively. At September 30, 2016 and 2015, the Company excluded $61.1 million and $67.8 million of capitalized costs from depletion related to wells in progress, respectively. For the three and nine months ended September 30, 2016, the Company recorded depletion expense on capitalized oil and gas properties of $44.8 million and $135.6 million, respectively, as compared to $38.9 million and $95.9 million for the three and the nine months ended September 30, 2015, respectively.
The costs of exploratory wells are initially capitalized pending a determination of whether proved reserves have been found. At the completion of drilling activities, the costs of exploratory wells remain capitalized if a determination is made that proved reserves have been found. If no proved reserves have been found, the costs of exploratory wells are charged to expense. In some cases, a determination of proved reserves cannot be made at the completion of drilling, requiring additional testing and evaluation of the wells. Costs incurred for exploratory wells that find reserves that cannot yet be classified as proved are capitalized if (a) the well has found a sufficient quantity of reserves to justify its completion as a producing well and (b) sufficient progress in assessing the reserves and the economic and operating viability of the project has been made. The status of suspended well costs is monitored continuously and reviewed at each period end. Due to the capital intensive nature and the geological characteristics of certain projects, it may take an extended period of time to evaluate the future potential of an exploration project and the economics associated with making a determination of its commercial viability. As of December 31, 2015, the Company had approximately $17.3 million in suspended well costs recorded, all capitalized less than one year, related to four exploratory wells in the Northern field. The suspended well costs were included in wells in progress at December 31, 2015. These exploratory well costs were pending further engineering evaluation and analysis to determine if economic quantities of oil and gas reserves have been discovered. At June 30, 2016, the Company completed its evaluation and moved $21.8 million of these suspended well costs to proved oil and gas properties based on the determination of proved reserves. As of September 30, 2016, the Company did not have any suspended well costs as the analysis on economic and operating viability of the project was complete.
Geological and geophysical costs are expensed as incurred. Costs of seismic studies that are utilized in development drilling within an area of proved reserves are capitalized as development costs. Amounts of seismic costs capitalized are based on only those blocks of data used in determining development well locations. To the extent that a seismic project covers areas of both developmental and exploratory drilling, those seismic costs are proportionately allocated between development costs and exploration expense.
The Company capitalizes interest, if debt is outstanding, during drilling operations in its exploration and development activities. For the three and nine months ended September 30, 2016, the Company capitalized interest of $1.2 million and $3.6 million, respectively, as compared to $1.4 million and $4.1 million for the three and nine months ended September 30, 2015, respectively.
Impairment of Oil and Gas Properties
Proved oil and gas properties are reviewed for impairment annually or when events and circumstances indicate a possible decline in the recoverability of the carrying amount of such property. For each of our fields, the Company estimates the expected future cash flows of its oil and gas properties and compares these undiscounted cash flows to the carrying amount of the oil and gas properties to determine if the carrying amount is recoverable. If the carrying amount exceeds the estimated undiscounted future cash flows, the Company will write down the carrying amount of the oil and gas properties to fair value. The factors used to determine fair value include, but are not limited to, estimates of reserves, future commodity prices, future production estimates, estimated future capital expenditures
EXTRACTION OIL & GAS HOLDINGS, LLC
NOTES TO UNAUDITED CONDENSED CONSOLIDATED FINANCIAL STATEMENTS (Continued)
and discount rates commensurate with the risk associated with realizing the projected cash flows. Impairment expense for proved oil and gas properties is reported in impairment of long lived assets in the consolidated statements of operations, which increased accumulated depletion, depreciation and amortization. No impairment expense was recognized for the three months ended September 30, 2016 on proved oil and gas properties. For the nine months ended September 30, 2016, the Company recognized $22.5 million in impairment expense on proved oil and gas properties. No impairment expense was recognized for the three months ended September 30, 2015 on proved oil and gas properties. For the nine months ended September 30, 2015, the Company recognized $9.5 million in impairment expense on proved oil and gas properties. The impairment expense for the nine months ended September 30, 2016 and 2015 is related to impairment of the assets in the Company’s Northern field. The future undiscounted cash flows did not exceed its carrying amount associated with its proved oil and gas properties in its Northern field and it was determined that the proved oil and gas properties had no remaining fair value. Therefore, the full net book value of these proved oil and gas properties were impaired at June 30, 2016 and 2015.
Unproved oil and gas properties consist of costs to acquire unevaluated leases as well as costs to acquire unproved reserves. The Company evaluates significant unproved oil and gas properties for impairment based on remaining lease term, drilling results, reservoir performance, seismic interpretation or future plans to develop acreage. When successful wells are drilled on undeveloped leaseholds, unproved property costs are reclassified to proved properties and depleted on a unit of production basis. Impairment expense and lease extension payments for unproved properties is reported in exploration expenses in the consolidated statements of operations. As a result of the abandonment and impairment of unproved properties, the Company recognized $0.4 million and $3.3 million in impairment expense for the three and nine months ended September 30, 2016, respectively, as compared to $1.7 million and $6.2 million for the three and nine months ended September 30, 2015, respectively. As result of lease extension payments, the Company recognized $5.6 and $11.4 million of expense for the three and nine months ended September 30, 2016, respectively, as compared to $0.2 million and $0.6 million for the three and nine months ended September 30, 2015, respectively.
Other Property and Equipment
Other property and equipment consists of (i) XTR assets such as rights of way, pipelines, equipment and engineering costs, (ii) compressors used in Extraction’s oil and gas operations, (iii) land to be used in the future development of the Company’s gas plant, compressor stations, central tank batteries, and disposal well facilities and (iv) other property and equipment including, office furniture and fixtures, leasehold improvements and computer hardware and software. Impairment expense for other property and equipment is reported in impairment of long lived assets in the consolidated statements of operations. The Company recognized $0.4 million in impairment expense related to midstream facilities for the nine months ended September 30, 2016, which increased accumulated depreciation recognized in other property and equipment, net of accumulated depreciation. The Company recognized this impairment expense as the result of contraction in the local oil and gas industry’s near term growth profile, therefore decreasing the need and support for a specifically proposed gas processing facility. No impairment expense for other property and equipment was recorded for the three months ended September 30, 2016. No impairment expense for other property and equipment was recorded for the three and nine months ended September 30, 2015. Other property and equipment is recorded at cost and depreciated using the straight line method over their estimated useful lives ranging from three to 25 years. Other property and equipment is comprised of the following (in thousands):
|
|
|
September 30, |
|
December 31, |
| ||
|
Rental equipment |
|
$ |
2,910 |
|
$ |
2,910 |
|
|
Land |
|
12,978 |
|
14,778 |
| ||
|
Midstream facilities |
|
12,623 |
|
10,783 |
| ||
|
Office leasehold improvements |
|
4,360 |
|
3,967 |
| ||
|
Other |
|
4,722 |
|
4,073 |
| ||
|
Less: accumulated depreciation |
|
(8,247 |
) |
(6,109 |
) | ||
|
|
|
$ |
29,346 |
|
$ |
30,402 |
|
EXTRACTION OIL & GAS HOLDINGS, LLC
NOTES TO UNAUDITED CONDENSED CONSOLIDATED FINANCIAL STATEMENTS (Continued)
Deferred Lease Incentives
All incentives received from landlords for office leasehold improvements are recorded as deferred lease incentives and amortized over the term of the respective lease on a straight line basis as a reduction of rental expense.
Debt Discount Costs
The $430.0 million in Second Lien Notes issued in May of 2014 were issued at a 1.5% original issue discount (“OID”) and the debt discount of $6.5 million has been recorded as a reduction of the Second Lien Notes. The debt discount costs related to Second Lien Notes are amortized to interest expense using the effective interest method over the term of the debt.
Debt Issuance Costs
Debt issuance costs include origination, legal, engineering, and other fees incurred to issue the debt in connection with the Company’s credit facility, Second Lien Notes and Senior Notes. Debt issuance costs related to the credit facility are amortized to interest expense on a straight line basis over the respective borrowing term. Debt issuance costs related to the Second Lien Notes and Senior Notes are amortized to interest expense using the effective interest method over the term of the debt.
Deferred Equity Issuance Costs
In conjunction with the IPO, costs incurred related to the IPO are capitalized as deferred equity issuance costs until the common shares are issued or the potential offering is terminated. Upon issuance of common shares, these costs will be offset against the proceeds received. Offering costs include direct and incremental costs related to the offering, such as legal fees and related costs associated with the executed IPO.
Commodity Derivative Instruments
The Company has entered into commodity derivative instruments to reduce the effect of price changes on a portion of the Company’s future oil and natural gas production. The commodity derivative instruments are measured at fair value and are included in the accompanying balance sheets as commodity derivative assets and commodity derivative liabilities. The Company has not designated any of the derivative contracts as fair value or cash flow hedges. Therefore, the Company does not apply hedge accounting to the commodity derivative instruments. Net gains and losses on commodity derivative instruments are recorded based on the changes in the fair values of the derivative instruments. Net gains and losses on commodity derivative instruments are recorded in the commodity derivative gain (loss) line on the consolidated statements of operations. The Company’s cash flow is only impacted when the actual settlements under the commodity derivative contracts result in making or receiving a payment to or from the counterparty. These settlements under the commodity derivative contracts are reflected as operating activities in the Company’s consolidated statements of cash flows.
The Company’s valuation estimate takes into consideration the counterparties’ credit worthiness, the Company’s credit worthiness, and the time value of money. The consideration of these factors result in an estimated exit price for each derivative asset or liability under a market place participant’s view. Management believes that this approach provides a reasonable, non biased, verifiable, and consistent methodology for valuing commodity derivative instruments. Please refer to Note 5—Commodity Derivative Instruments for additional discussion on commodity derivative instruments.
Fair Value of Financial Instruments
The Company’s financial instruments consist primarily of cash and cash equivalents, accounts receivable, accounts payable, commodity derivative instruments (discussed above) and long term debt. The carrying values of cash and cash equivalents, accounts receivable and accounts payable are representative of their fair values due to their short term maturities. The carrying amount of the Company’s credit facility approximates fair value as it bears interest at variable rates over the term of the loan. The Company’s Second Lien Notes and Senior Notes are recorded at cost and the fair value is disclosed in Note 7—Fair Value Measurements. Considerable judgment is required to
EXTRACTION OIL & GAS HOLDINGS, LLC
NOTES TO UNAUDITED CONDENSED CONSOLIDATED FINANCIAL STATEMENTS (Continued)
develop estimates of fair value. The estimates provided are not necessarily indicative of the amounts the Company would realize upon the sale or refinancing of such instruments.
Asset Retirement Obligation
The Company recognizes estimated liabilities for future costs associated with the abandonment of its oil and gas properties. A liability for the fair value of an asset retirement obligation and corresponding increase to the carrying value of the related long lived asset are recorded at the time the Company makes the decision to complete the well or a well is acquired. For additional discussion on asset retirement obligations please refer to Note 6—Asset Retirement Obligations.
Environmental Liabilities
The Company is subject to federal, state and local environmental laws and regulations. These laws regulate the discharge of materials into the environment and may require the Company to remove or mitigate the environmental effects of the disposal or release of petroleum substances at various sites. Environmental expenditures are expensed or capitalized depending on their future economic benefit. Expenditures that relate to an existing condition caused by past operations and that have no future economic benefit are expensed.
Liabilities for expenditures of a non capital nature are recorded when environmental assessments and/or remediation is probable, and the costs can be reasonably estimated. Such liabilities are generally undiscounted values unless the timing of cash payments for the liability or component is fixed or determinable. Management has determined that no environmental liabilities existed as of September 30, 2016.
Revenue Recognition
Revenues from the sale of oil, natural gas and NGLs are recognized when the product is delivered at a fixed or determinable price, title has transferred, and collectability is reasonably assured and evidenced by a contract. The Company recognizes revenues from the sale of oil, natural gas and NGLs using the sales method of accounting, whereby revenue is recorded based on the Company’s share of volume sold, regardless of whether the Company has taken its proportional share of volume produced. A receivable or liability is recognized only to the extent that the Company has an imbalance on a specific property greater than the expected remaining proved reserves. There were no material imbalances at September 30, 2016 and September 30, 2015.
Unit Based Payments
The Company has granted restricted unit awards (“RUAs”) to certain employees and nonemployee consultants of the Company, which therefore required the Company to recognize the expense in its financial statements. All unit based payments to employees are measured at fair value on the grant date and expensed over the relevant service period. Unit based payments to nonemployees are measured at fair value at each financial reporting date and expensed over the period of performance, such that aggregate expense recognized is equal to the fair value of the restricted units on the date performance is completed. All unit based payment expense is recognized using the straight line method and is included within general and administrative expenses in the consolidated statements of operations. Please refer to Note 9—Unit Based Compensation for additional discussion on unit based payments.
Income Taxes
As of September 30, 2016, the Company was organized as a Delaware limited liability company and is treated as a flow through entity for U.S. federal and state income tax purposes. As a result, the Company’s net taxable income and any related tax credits are passed through to the members and are included in their tax returns even though such net taxable income or tax credits may not have actually been distributed.
Unaudited Pro Forma Income Taxes
In October 2016, the Company completed its IPO and the financial statements have been prepared to present unaudited pro forma entity level income tax expense. In connection with the IPO, Extraction converted from a Delaware limited liability company into XOG, a Delaware corporation, which will be taxed as a corporation under
EXTRACTION OIL & GAS HOLDINGS, LLC
NOTES TO UNAUDITED CONDENSED CONSOLIDATED FINANCIAL STATEMENTS (Continued)
the Internal Revenue Code of 1986, as amended, and Holdings merged with and into XOG. Accordingly, a pro forma income tax provision has been disclosed as if the Company was a taxable corporation for all periods presented. The Company has computed pro forma entity level income tax expense using an estimated effective rate of 38%, inclusive of all applicable U.S. federal, state and local income taxes.
Unaudited Pro Forma Earnings Per Unit
The Company has presented pro forma earnings per unit for the most recent period. Pro forma basic and diluted income (loss) per unit was computed by dividing pro forma net income (loss) attributable to the Company by the number of units attributable issued and outstanding for the periods ended September 30, 2016.
Segment Reporting
The Company operates in only one industry segment, which is the exploration and production of oil, natural gas and NGLs and related midstream activities. The Company’s wholly owned subsidiary, XTR, is currently in the design phase and no revenue generating activities have commenced. All of the Company’s operations are conducted in one geographic area of the United States. All revenues are derived from customers located in the United States.
Recent Accounting Pronouncements
The accounting standard setting organizations frequently issue new or revised accounting rules. The Company regularly reviews new pronouncements to determine their impact, if any, on its financial statements.
In August 2016, the Financial Accounting Standards Board (“FASB”) issued Accounting Standards Update (“ASU”) No. 2016 15, which addresses eight specific cash flow issues, including presentation of debt prepayments or debt extinguishment costs, with the objective of reducing the existing diversity in practice. For public entities, the new guidance is effective for fiscal years beginning after December 15, 2017, and interim periods within those fiscal years. Early adoption is permitted, including an adoption in an interim period, with a required retrospective application to each period presented. The Company is currently evaluating this new standard to determine the potential impact to its financial statements and related disclosures.
In March 2016, the FASB issued ASU No. 2016 09, which simplifies the accounting for share based payment award transactions, including: (a) income tax consequences; (b) classification of awards as either equity or liabilities; and (c) classification on the consolidated statements of cash flows. ASU 2016 09 is effective for public companies for annual reporting periods beginning after December 15, 2016, including interim periods within those fiscal years. Early adoption is permitted in any interim period or annual period with any adjustment reflected as of the beginning of the fiscal year of adoption. The Company is currently evaluating this new standard to determine the potential impact to its financial statements and related disclosures.
In March 2016, the FASB issued ASU No. 2016 06, which clarifies the requirements to assess whether an embedded put or call option is clearly and closely related to the debt host, solely in accordance with the four step decision sequence in FASB ASC Topic 815, Derivatives and Hedging, as amended by ASU 2016 06. This standard is effective for fiscal years, and interim periods within those fiscal years, beginning after December 15, 2016 and should be applied using a modified retrospective approach. Early adoption is permitted. The Company is currently evaluating the impact of adopting ASU 2016 06, however the standard is not expected to have a significant effect on its consolidated financial statements.
In February 2016, the FASB issued ASU No. 2016 02, which requires lessee recognition on the balance sheet of a right of use asset and a lease liability, initially measured at the present value of the lease payments. It further requires recognition in the income statement of a single lease cost, calculated so that the cost of the lease is allocated over the lease term on a generally straight line basis. Finally, it requires classification of all cash payments within operating activities in the statements of cash flows. It is effective for fiscal years commencing after December 15, 2018 and early adoption is permitted. The Company is currently evaluating the impact this new standard will have on its financial statements.
EXTRACTION OIL & GAS HOLDINGS, LLC
NOTES TO UNAUDITED CONDENSED CONSOLIDATED FINANCIAL STATEMENTS (Continued)
In September 2015, the FASB issued ASU No. 2015 16. This ASU eliminates the requirement to retrospectively apply measurement period adjustments made to provisional amounts recognized in a business combination. The accounting update also requires an entity to present separately on the face of the income statement, or disclose in the notes, the portion of the amount recorded in current period earnings, by line item, that would have been recorded in previous reporting periods if the adjustment to the estimated amounts had been recognized as of the acquisition date. ASU 2015 16 is effective for fiscal years, and interim periods within those fiscal years, beginning after December 15, 2015. This standard should be applied prospectively, and early adoption is permitted. The Company elected for early adoption for its year end December 31, 2015 financial statements. The adoption of this standard did not have a significant impact on the Company’s financial statements.
In July 2015, the FASB issued ASU No. 2015 11, which updates the authoritative guidance for inventory, specifically that inventory should be valued at each reporting period at the lower of cost or net realizable value. This guidance is effective for the annual period beginning after December 15, 2016; early adoption is permitted. The Company is currently evaluating the impact of this new standard; however, the Company does not expect adoption to have a material impact on its financial statements.
In April 2015, the FASB issued ASU No. 2015 03, with an objective to simplify the presentation of debt issuance costs in financial statements by presenting such costs in the balance sheet as a direct deduction from the related debt liability rather than as an asset. Effective January 1, 2016, the Company adopted ASU No. 2015 03 on a retrospective basis. FASB ASU No. 2015 03 should be applied retrospectively and represent a change in accounting principle.
In August 2015, the FASB issued ASU No. 2015 15, which amends ASU 2015 03 which had not addressed the balance sheet presentation of debt issuance costs incurred in connection with line of credit arrangements. Under ASU 2015 15, a Company may defer debt issuance costs associated with line of credit arrangements and present such costs as an asset, subsequently amortizing the deferred debt issuance costs ratably over the term of the line of credit arrangement, regardless of whether there are any outstanding borrowings. ASU 2015 15 is consistent with how the Company currently accounts for debt issuance costs related to the Company’s credit facility.
In November 2014, the FASB issued ASU No. 2014 16, which updates authoritative guidance for derivatives and hedging instruments, specifically in determining whether the host contract in a hybrid financial instrument issued in the form of a share is more akin to debt or to equity. This guidance is effective for the annual period beginning after December 15, 2015; early adoption is permitted. The Company is currently evaluating the impact of this new standard; however, the Company does not expect adoption to have a material impact on its financial statements.
In August 2014, the FASB issued ASU No. 2014 15, with an objective to provide guidance on management’s responsibility to evaluate whether there is substantial doubt about a company’s ability to continue as a going concern and to provide related footnote disclosures. ASU 2014 15 is effective for fiscal years ending after December 15, 2016, and annual and interim periods thereafter. This standard is not expected to have an impact on the Company’s financial statements.
In May 2014, the FASB issued ASU No. 2014 09, which establishes a comprehensive new revenue recognition model designed to depict the transfer of goods or services to a customer in an amount that reflects the consideration the entity expects to receive in exchange for those goods or services. The ASU allows for the use of either the full or modified retrospective transition method. In August 2015, the FASB issued ASU No. 2015 14, which deferred ASU No. 2014 09 for one year, and is effective for annual reporting periods beginning after December 15, 2017, including interim reporting periods within that reporting period. Earlier application is permitted only as of reporting periods beginning after December 15, 2016. The FASB subsequent issued ASU 2016-08, ASU 2016-10, ASU 2016-11 and ASU 2016-12, which provided additional implementation guidance. The Company is currently evaluating the level of effort necessary to implement the standards, evaluating the provisions of each of these standards, and assessing their potential impact on the Company’s financial statements and disclosures, as well as determining whether to use the full retrospective method or the modified retrospective method.
EXTRACTION OIL & GAS HOLDINGS, LLC
NOTES TO UNAUDITED CONDENSED CONSOLIDATED FINANCIAL STATEMENTS (Continued)
There are no other accounting standards applicable to the Company that have been issued but not yet adopted by the Company as of September 30, 2016, and through the date the financial statements were available to be issued that would have a material impact on the Company’s financial statements.
Note 3—Acquisitions
October 2016 Acquisition
On October 3, 2016, the Company acquired an unaffiliated oil and gas company’s interests in approximately 6,100 net acres of leasehold, and related producing and non producing properties located primarily in Weld County, Colorado, along with various other related rights, permits, contracts, equipment, rights of way, gathering systems and other assets (the “Bayswater Assets” and the acquisition, the “October 2016 Acquisition” or the “Bayswater Acquisition”). The seller received aggregate consideration of approximately $419.0 million in cash. The effective date for the acquisition was July 1, 2016, with purchase price adjustments calculated as of the closing date on October 3, 2016. The acquisition provides new development opportunities in the DJ Basin as well as increases the Company’s existing working interest, as the majority of the locations are located on acreage in which the Company already owns a majority working interest and operates. The acquired producing properties contributed no revenue for the three and nine months ended September 30, 2016 and 2015, respectively. The Company incurred $0.3 million and $0.3 million of transaction costs related to the acquisition for the three and nine months ended September 30, 2016, respectively. These transaction costs are recorded in the consolidated statements of operations within the acquisition transaction expenses line item. The Company will also incur $2.0 million in transaction costs associated with a finder’s fee to an unaffiliated third party. The fee was contingent on the transaction closing and will be expensed in the fourth quarter of 2016. No transaction costs related to the acquisition were incurred for the three and nine months ended September 30, 2015. The Company also made a $42.0 million deposit in July 2016 in conjunction with October 2016 Acquisition, which has been reflected in the September 30, 2016 consolidated balance sheet within the cash held in escrow line item.
The acquisition is accounted for using the acquisition method under ASC 805, Business Combinations, which requires the acquired assets and liabilities to be recorded at fair value as of the acquisition date of October 3, 2016. The Company has not completed the transaction’s post-closing settlement, which is scheduled to occur in April 2017. As the post-close has not occurred, management has not had the opportunity to complete its assessment of the fair values of assets acquired and liabilities assumed. Accordingly, the below allocation will change as additional information becomes available and is assessed by the Company, and the impact of such changes may be material. The following table summarizes the preliminary purchase price and the preliminary estimated values of assets acquired and liabilities assumed (in thousands):
|
Preliminary Purchase Price |
|
October 3, 2016 |
| |
|
Consideration given |
|
|
| |
|
Cash |
|
$ |
419,044 |
|
|
Total consideration given |
|
$ |
419,044 |
|
|
Preliminary Allocation of Purchase Price |
|
|
| |
|
Proved oil and gas properties |
|
$ |
255,105 |
|
|
Unproved oil and gas properties |
|
109,900 |
| |
|
Total fair value of oil and gas properties acquired |
|
365,005 |
| |
|
Goodwill |
|
$ |
63,866 |
|
|
Working capital |
|
(6,122 |
) | |
|
Asset retirement obligations |
|
(3,705 |
) | |
|
Fair value of net assets acquired |
|
$ |
419,044 |
|
|
Working capital acquired was estimated as follows: |
|
|
| |
|
Revenue payable |
|
$ |
(1,888 |
) |
|
Production taxes payable |
|
(3,350 |
) | |
|
Accrued liabilities |
|
(884 |
) | |
|
Total working capital |
|
$ |
(6,122 |
) |
(1) Goodwill is estimated to be approximately $63.9 million based on the preliminary allocation of purchase price. Goodwill is primarily attributable to a decrease in commodity prices from the time the acquisition was negotiated and commodity prices on October 3, 2016 and the operational and financial synergies expected to be realized from the acquisition.
EXTRACTION OIL & GAS HOLDINGS, LLC
NOTES TO UNAUDITED CONDENSED CONSOLIDATED FINANCIAL STATEMENTS (Continued)
Option to Acquire Additional Assets from October 2016 Acquisition
Upon the closing of the October 2016 Acquisition, the Company made a $10.0 million non refundable payment for an option to purchase additional assets from the seller of the October 2016 Acquisition (the “Additional Assets”) for an additional $190.0 million, for a total purchase price for the Additional Assets of $200.0 million. The option may be exercised at any time until March 31, 2017. If the Company does not exercise the option to acquire the Additional Assets, the seller will have the right until April 30, 2017 to elect to sell those assets to the Company for an additional $120.0 million, for a total purchase price for the Additional Assets of $130.0 million. The Additional Assets include approximately 9,100 net acres of leasehold and related producing and non producing properties located primarily in Weld County, and to a lesser extent Adams and Arapahoe Counties, Colorado, along with various other related rights, permits, contracts, equipment, rights of way, gathering systems and other assets. The Additional Assets would provide new development opportunities in the DJ Basin.
August 2016 Acquisition
On August 23, 2016, the Company acquired an unaffiliated oil and gas company’s interests in approximately 850 net acres of leasehold located primarily in Weld County, Colorado, along with various other related rights, permits, contracts, equipment, rights of way and other assets (the “August 2016 Acquisition”). The seller received aggregate consideration of approximately $13.7 million in cash. The effective date for the acquisition was August 31, 2016, with purchase price adjustments calculated as of the closing date on August 23, 2016. The acquisition provided new development opportunities in the DJ Basin as well as additions adjacent to the Company’s core project area. The acquired producing properties contributed de minimis revenue or earnings for the three and nine months ended September 30, 2016. The acquired producing properties contributed no revenue for the three and nine months ended September 30, 2015. The Company incurred $0.1 million and $0.1 million of transaction costs related to the acquisition for the three and nine months ended September 30, 2016, respectively. No transaction costs related to the acquisition were incurred for the three and nine months ended September 30, 2015. These transaction costs are recorded in the consolidated statements of operations within the acquisition transaction expenses line item.
The acquisition is accounted for using the acquisition method under ASC 805, Business Combinations, which requires the acquired assets and liabilities to be recorded at fair value as of the acquisition date of August 23, 2016. The Company has not completed the transaction’s post-closing settlement, which is scheduled to occur in February 2017. As the post-close has not occurred, management has not had the opportunity to complete its assessment of the fair values of assets acquired and liabilities assumed. Accordingly, the below allocation will change as additional information becomes available and is assessed by the Company, and the impact of such changes may be material. The following table summarizes the preliminary purchase price and the preliminary estimated values of assets acquired and liabilities assumed (in thousands):
|
Preliminary Purchase Price |
|
August 23, 2016 |
| |
|
Consideration given |
|
|
| |
|
Cash |
|
$ |
13,674 |
|
|
Total consideration given |
|
$ |
13,674 |
|
|
Preliminary Allocation of Purchase Price |
|
|
| |
|
Proved oil and gas properties |
|
$ |
9,824 |
|
|
Unproved oil and gas properties |
|
6,872 |
| |
|
Total fair value of oil and gas properties acquired |
|
16,696 |
| |
|
Working capital |
|
$ |
— |
|
|
Asset retirement obligations |
|
(3,022 |
) | |
|
Fair value of net assets acquired |
|
$ |
13,674 |
|
|
Working capital acquired was estimated as follows (1): |
|
|
| |
|
Accounts receivable |
|
$ |
— |
|
|
Revenue payable |
|
— |
| |
|
Production taxes payable |
|
— |
| |
|
Total working capital |
|
$ |
— |
|
(1) The Company anticipates acquiring various working capital items such as accounts receivable, revenue payable and production taxes payable liabilities. These working capital adjustments will result in an adjustment to the purchase price at closing. At this time, the working capital adjustments could not be estimated.
EXTRACTION OIL & GAS HOLDINGS, LLC
NOTES TO UNAUDITED CONDENSED CONSOLIDATED FINANCIAL STATEMENTS (Continued)
March 2015 Acquisition
On March 10, 2015, the Company acquired an unaffiliated oil and gas company’s interests in approximately 39,000 net acres of leasehold, and related producing properties located primarily in Adams, Broomfield, Boulder and Weld Counties, Colorado, along with various other related rights, permits, contracts, equipment, rights of way, gathering systems and other assets (the “March 2015 Acquisition”). The seller received aggregate consideration of approximately $120.5 million in cash. The effective date for the acquisition was January 1, 2014, with purchase price adjustments calculated as of the closing date on March 10, 2015. The acquisition provided new development opportunities in the DJ Basin as well as additions adjacent to the Company’s core project area and the acquired producing properties contributed revenue of $2.1 million and $6.8 million to the Company for the three and nine months ended September 30, 2016 respectively, and $2.8 million and $6.8 million to the Company for the three and nine months ended September 30 2015, respectively. The Company determined that it is not practical to calculate net income associated with March 2015 Acquisition. The Company incurred $0.5 million of transaction costs related to the acquisition for the nine months ended September 30, 2015. These transaction costs are recorded in the consolidated statements of operations within the general and administrative expense line item. No transaction costs related to the acquisition were incurred for the three months ended September 30, 2015. No transaction costs related to the acquisition were incurred for the three months ended September 30, 2016. Additionally, the Company incurred $6.0 million of non cash transaction costs associated with a finder’s fee to an unaffiliated third party. The Company assigned an over riding royalty interest in the proved and unproved oil and gas properties acquired in the March 2015 Acquisition, which had a fair value of $6.0 million on the measurement date. These transaction costs are recorded in the consolidated statements of operations within the acquisition transaction expense line item.
The acquisition is accounted for using the acquisition method under ASC 805, Business Combinations, which requires the acquired assets and liabilities to be recorded at fair value as of the acquisition date of March 10, 2015. In November 2015, the Company completed the transaction’s post closing settlement. The following table summarizes the purchase price and the final allocation of the fair values of assets acquired and liabilities assumed (in thousands):
|
Purchase Price |
|
March 10, 2015 |
| |
|
Consideration given |
|
|
| |
|
Cash |
|
$ |
120,524 |
|
|
Total consideration given |
|
$ |
120,524 |
|
|
Allocation of Purchase Price |
|
|
| |
|
Proved oil and gas properties |
|
$ |
80,952 |
|
|
Unproved oil and gas properties |
|
69,450 |
| |
|
Total fair value of oil and gas properties acquired |
|
150,402 |
| |
|
Working capital |
|
$ |
(1,996 |
) |
|
Asset retirement obligations |
|
(27,882 |
) | |
|
Fair value of net assets acquired |
|
$ |
120,524 |
|
|
Working capital acquired was estimated as follows: |
|
|
| |
|
Accounts receivable |
|
$ |
462 |
|
|
Revenue payable |
|
(718 |
) | |
|
Production taxes payable |
|
(1,740 |
) | |
|
Total working capital |
|
$ |
(1,996 |
) |
Pro Forma Financial Information
For the three and nine months ended September 30, 2016 and 2015, the following pro forma financial information represents the combined results for the Company and the properties acquired in the March 2015 Acquisition as if the acquisition and related financing had occurred on January 1, 2015. For purposes of the pro forma financial information, it was assumed that the Company issued equity to finance the March 2015 Acquisition. The pro forma financial information includes the effects of adjustments for depletion, depreciation, amortization and accretion expense of $1.5 million for the nine months ended September 30, 2015. The pro forma financial information includes the effects of a decrease in non recurring transaction costs that are included in general and administrative expenses and acquisition transaction expenses of $6.4 million for the nine months ended September 30, 2015. The pro forma financial information excludes the effects of the October 2016 Acquisition as the
EXTRACTION OIL & GAS HOLDINGS, LLC
NOTES TO UNAUDITED CONDENSED CONSOLIDATED FINANCIAL STATEMENTS (Continued)
information needed for the pro forma financial information was not available. Additionally, the pro forma financial information excludes the effects the August 2016 Acquisition as these pro forma adjustments were de minimis.
The following pro forma results (in thousands) do not include any cost savings or other synergies that may result from the acquisition or any estimated costs that have been or will be incurred by the Company to integrate the properties acquired. The pro forma results are not necessarily indicative of what actually would have occurred if the acquisition had been completed as of the beginning of the period, nor are they necessarily indicative of future results.
|
|
|
For the Three Months Ended |
|
For the Nine Months Ended |
| ||||||||
|
|
|
2016 |
|
2015 |
|
2016 |
|
2015 |
| ||||
|
Revenues |
|
$ |
72,902 |
|
$ |
48,846 |
|
$ |
183,399 |
|
$ |
143,624 |
|
|
Operating expenses |
|
$ |
95,214 |
|
$ |
64,422 |
|
$ |
273,581 |
|
$ |
178,658 |
|
|
Net income (loss) |
|
$ |
(37,267 |
) |
$ |
18,650 |
|
$ |
(210,400 |
) |
$ |
(32,870 |
) |
|
Income (loss) per unit |
|
|
|
|
|
|
|
|
| ||||
|
Basic |
|
$ |
(0.11 |
) |
$ |
0.07 |
|
$ |
(0.63 |
) |
$ |
(0.12 |
) |
|
Diluted |
|
$ |
(0.11 |
) |
$ |
0.07 |
|
$ |
(0.63 |
) |
$ |
(0.12 |
) |
Note 4—Long Term Debt
As of the dates indicated the Company’s long term debt consisted of the following (in thousands):
|
|
|
September 30, |
|
December 31, |
| ||
|
Credit facility due November 29, 2018 |
|
$ |
89,000 |
|
$ |
225,000 |
|
|
Second Lien Notes due May 29, 2019 |
|
— |
|
430,000 |
| ||
|
Senior Notes due July 15, 2021 |
|
550,000 |
|
— |
| ||
|
Unamortized debt discount and debt issuance costs on Second Lien Notes and Senior Notes |
|
(12,399 |
) |
(17,210 |
) | ||
|
Total long-term debt |
|
626,601 |
|
637,790 |
| ||
|
Less: current portion of long-term debt |
|
— |
|
— |
| ||
|
Total long-term debt, net of current portion |
|
$ |
626,601 |
|
$ |
637,790 |
|
Credit Facility
On September 4, 2014, Holdings entered into a $500.0 million credit facility with a syndicate of banks, which is subject to a borrowing base. In connection with the IPO and the merger of Holdings into the Company, the Company assumed all of the obligations of Holdings under the credit facility and became the borrower thereunder. The credit facility matures on November 29, 2018. As of September 30, 2016, the credit facility was subject to a borrowing base of $350.0 million. As of September 30, 2016 and December 31, 2015, the Company had outstanding borrowings of $89.0 million and $225.0 million, respectively. As of September 30, 2016 and December 31, 2015, the Company had standby letters of credit of $0.6 million and $0.7 million, respectively. At September 30, 2016, the available credit under the credit facility was $260.4 million. As of the date of this filing, the Company has no balance outstanding under the credit facility.
Redetermination of the borrowing base occurred initially quarterly (on February 1, 2015, May 1, 2015, August 1, 2015, November 1, 2015 and February 1, 2016) and semiannually thereafter on May 1 and November 1. Additionally, the Company and the administrative agent under the credit facility may each elect a redetermination of the borrowing base between any two scheduled redeterminations, and the Company may elect a redetermination of the borrowing base on February 1, 2017 and August 1, 2017.
In September 2016, the Company elected an unscheduled borrowing base redetermination. As a result of this redetermination, the borrowing base increased to $350.0 million and would increase to $450.0 million upon the consummation of the October 2016 Acquisition. The October 2016 Acquisition was completed on October 3, 2016, increasing the borrowing base to $450.0 million.
Interest on the credit facility is payable at one of the following two variable rates as selected by the Company: a base rate based on the Prime Rate or the Eurodollar rate, based on LIBOR. Either rate is adjusted upward by an
EXTRACTION OIL & GAS HOLDINGS, LLC
NOTES TO UNAUDITED CONDENSED CONSOLIDATED FINANCIAL STATEMENTS (Continued)
applicable margin, based on the utilization percentage of the facility as outlined in the Pricing Grid. Additionally, the credit facility provides for a commitment fee of 0.375% to 0.50%, depending on borrowing base usage. The grid below shows the Base Rate Margin and Eurodollar Margin depending on the applicable Borrowing Base Utilization Percentage (as defined in the credit facility) as of the date of this filing:
Borrowing Base Utilization Grid
|
Borrowing Base Utilization Percentage |
|
Utilization |
|
LIBOR |
|
Base Rate |
|
Commitment |
|
|
Level 1 |
|
< 25% |
|
2.00 |
% |
1.00 |
% |
0.375 |
% |
|
Level 2 |
|
> 25% < 50% |
|
2.25 |
% |
1.25 |
% |
0.375 |
% |
|
Level 3 |
|
> 50% < 75% |
|
2.50 |
% |
1.50 |
% |
0.500 |
% |
|
Level 4 |
|
> 75% < 90% |
|
2.75 |
% |
1.75 |
% |
0.500 |
% |
|
Level 5 |
|
> 90% |
|
3.00 |
% |
2.00 |
% |
0.500 |
% |
The credit facility contains representations, warranties, covenants, conditions and defaults customary for transactions of this type, including but not limited to: (i) limitations on liens and incurrence of debt covenants; (ii) limitations on dividends, distributions, redemptions and restricted payments covenants; (iii) limitations on investments, loans and advances covenants; (iv) limitations on the sale of property, mergers, consolidations and other similar transactions covenants; and (v) holding cash balances in excess of certain thresholds while carrying a balance on the credit facility. Additionally, the credit facility limits the Company from hedging in excess of 85% of its anticipated production volumes.
The credit facility also contains financial covenants requiring the Company to comply with a current ratio of our consolidated current assets (includes unused commitments under our revolving credit facility and unrestricted cash and excludes derivative assets) to our consolidated current liabilities (excludes obligations under our revolving credit facility, the second lien notes and certain derivative assets), of not less than 1.0 to 1.0 and to maintain, on the last day of each quarter, a ratio of consolidated debt less cash balances in excess of certain thresholds to our consolidated EBITDAX (EBITDAX is defined as net income adjusted for certain cash and non cash items including depreciation, depletion, amortization and accretion, exploration expense, gains/losses on derivative instruments, amortization of certain debt issuance costs, non cash compensation expense, interest expense and prepayment premiums on extinguishment of debt) for the four fiscal quarter period most recently ended, of not greater than 4.0:1.0. For the quarters ending between December 31, 2016 through December 31, 2017, annualized EBITDAX will be based on the last six months’ consolidated EBITDAX multiplied by 2, and for the quarter ending March 31, 2018, annualized EBITDAX will be based on the last nine months’ consolidated EBITDAX multiplied by 4/3. For the quarters ending on or after June 30, 2018, annualized EBITDAX will be based on the last twelve months’ consolidated EBITDAX. The Company was in compliance with all financial covenants under the credit facility as of September 30, 2016.
Any borrowings under the credit facility are collateralized by substantially all of the assets of the Company and its subsidiaries, including oil and gas properties, personal property and the equity interests of the subsidiaries of the Company. The Company has entered into oil and natural gas hedging transactions with several counterparties that are also lenders under the credit facility. The Company’s obligations under these hedging contracts are secured by the collateral securing the credit facility.
Second Lien Notes
On May 29, 2014, Holdings entered in to a 5 year, $430.0 million term loan facility with a syndicate of lenders (the “Second Lien Notes”). The Second Lien Notes would have matured on May 29, 2019. Holdings had drawn the full $430.0 million under the Second Lien Notes and no further commitments remained. The loan was drawn in four tranches: $230.0 million in May 2014 that bore an interest rate of 11.0%, $75.0 million in July 2014 that bore an interest rate of 11.0%; $75.0 million in August 2014 that bore an interest rate of 10.0%, and $50.0 million in October 2014 that bore an interest rate of 10.0%. The interest rates were fixed and interest was payable semi annually.
In July 2016, the Second Lien Notes were repaid and terminated in conjunction with the Senior Notes Offering. The Company used the proceeds from the Senior Notes (as discussed below) to repay the outstanding $430.0 million
EXTRACTION OIL & GAS HOLDINGS, LLC
NOTES TO UNAUDITED CONDENSED CONSOLIDATED FINANCIAL STATEMENTS (Continued)
of principal and a $4.3 million prepayment penalty. The prepayment penalty was expensed in the third quarter of 2016 in the consolidated statements of operations within the interest expense line item. Additionally, in the third quarter of 2016, the Company wrote off approximately $15.1 million of unamortized debt discount and debt issuance costs that were related to the Second Lien Notes. The write off of the unamortized debt discount and debt issuance costs were recorded in the consolidated statements of operations within the interest expense line item.
Several lenders of Second Lien Notes were also members of Holdings. Of the $430.0 million formerly outstanding principal balance on the Second Lien Notes, members held approximately $311.7 million. These members were paid $314.8 million upon repayment and termination of the Second Lien Notes, including the prepayment penalty.
Senior Notes
In July 2016, the Company issued at par $550.0 million principal amount of 7.875% Senior Notes due July 15, 2021 (the “Senior Notes” and the offering, the Senior Notes Offering). The Senior Notes bear an annual interest rate of 7.875%. The interest on the Senior Notes is payable on January 15 and July 15 of each year commencing on January 15, 2017. The Company received net proceeds of approximately $537.5 million after deducting discounts and fees. All of the net proceeds from the Senior Notes were used to repay all of the outstanding borrowings and related premium, fees and expenses on the Second Lien Notes (which were terminated concurrently with such repayment), and the remaining proceeds were used to repay borrowings under the credit facility and for general business purposes.
Several lenders on the initial issuance of the Senior Notes were also members of Holdings. As of the date of the initial issuance of the $550.0 million principal amount on the Senior Notes, members held approximately $168.5 million.
The Senior Notes also contain affirmative and negative covenants that, among other things, limit the Company’s and the Guarantors’ ability to make investments; declare or pay any dividend or make any other payment to holders of the Company’s or any of its Guarantors’ equity interests; repurchase or redeem any equity interests of the Company; repurchase or redeem subordinated indebtedness; incur additional indebtedness or issue preferred stock; create liens; sell assets; enter into agreements that restrict dividends or other payments by restricted subsidiaries; consolidate, merge or transfer all or substantially all of the assets of the Company; engage in transactions with the Company’s affiliates; engage in any business other than the oil and gas business; and create unrestricted subsidiaries. The Indenture also contains customary events of default. Upon the occurrence of events of default arising from certain events of bankruptcy or insolvency, the Senior Notes shall become due and payable immediately without any declaration or other act of the trustee or the holders of the Senior Notes. Upon the occurrence of certain other events of default, the trustee or the holders of at least 25% in aggregate principal amount of the then outstanding Senior Notes may declare all outstanding Senior Notes to be due and payable immediately. The Company was in compliance with all financial covenants under the Indenture as of September 30, 2016, and through the filing of this report.
Series A Preferred Units
On October 3, 2016, the Company issued $75.0 million in Series A Preferred Units (the “Series A Preferred Units”) to fund a portion of the purchase price for the October 2016 Acquisition. The Series A Preferred Units were entitled to receive a cash dividend of 10% per year, payable quarterly in arrears. All holders of Series A Preferred Units are also members of Holdings. The Company used $90.0 million of the net proceeds from its IPO to redeem the Series A Preferred Units in full on October 17, 2016, which included a premium of $15.0 million. For further discussion on the October 2016 Acquisition and IPO, please refer to Note 3—Acquisitions and Note 8—Members’ Equity, respectively.
Debt Discount Costs on Second Lien Notes
The Company’s Second Lien Notes were issued with an original issue discount (OID) of $6.5 million. In July 2016, the Company repaid the Second Lien Notes in full and accelerated the remaining unamortized balance of $4.3
EXTRACTION OIL & GAS HOLDINGS, LLC
NOTES TO UNAUDITED CONDENSED CONSOLIDATED FINANCIAL STATEMENTS (Continued)
million. This expense was recorded in the consolidated statements of operations within the interest expense line item. As of September 30, 2016, there was no remaining balance on the OID.
Debt Issuance Costs
As of September 30, 2016, the Company had debt issuance costs net of accumulated amortization of $1.8 million related to its credit facility which has been reflected on the Company’s balance sheet within the line item other non current assets. As of September 30, 2016, the Company had debt issuance costs of $12.4 million related to its Senior Notes which has been reflected on the Company’s balance sheet within the line item Senior Notes, net of unamortized debt issuance costs. Upon the repayment of the Company’s Second Lien Notes, the company accelerated the amortization of the remaining $10.8 million of unamortized debt issuance costs. This expense was recorded in the consolidated statement of operations within the interest expense line item. As of September 30, 2016, there was no remaining balance on debt issuance costs associated with the Second Lien Notes. Debt issuance costs include origination, legal, engineering, and other fees incurred in connection with the Company’s credit facility, Second Lien Notes and Senior Notes. For the three and nine months ended September 30, 2016, the Company recorded amortization expense related to the debt issuance costs of $11.6 million and $13.5 million, respectively, as compared to $0.8 million and $2.3 million for the three and nine months ended September 30, 2015, respectively.
Interest Incurred On Long Term Debt
For the three and nine months ended September 30, 2016, the Company incurred interest expense on long term debt of $12.2 million and $38.9 million, respectively, as compared to $12.9 million and $37.4 million for the three and nine months ended September 30, 2015, respectively. For the three and nine months ended September 30, 2016, the Company capitalized interest expense on long term debt of $1.2 million and $3.6 million, respectively, as compared to $1.4 million and $4.1 million for the three and nine months ended September 30, 2015, respectively, which has been reflected in the Company’s financial statements. Also included in interest expense for the three and nine months ended September 30, 2016 is a prepayment penalty of $4.3 million related to the Company’s repayment of its Second Lien Notes in July 2016.
Note 5—Commodity Derivative Instruments
The Company has entered into commodity derivative instruments, as described below. The Company has utilized swaps, put options, and call options to reduce the effect of price changes on a portion of the Company’s future oil and natural gas production.
A swap has an established fixed price. When the settlement price is below the fixed price, the counterparty pays the Company an amount equal to the difference between the settlement price and the fixed price multiplied by the hedged contract volume. When the settlement price is above the fixed price, the Company pays its counterparty an amount equal to the difference between the settlement price and the fixed price multiplied by the hedged contract volume.
A put option has an established floor price. The buyer of the put option pays the seller a premium to enter into the put option. When the settlement price is below the floor price, the seller pays the buyer an amount equal to the difference between the settlement price and the strike price multiplied by the hedged contract volume. When the settlement price is above the floor price, the put option expires worthless. Some of the Company’s purchased put options have deferred premiums. For the deferred premium puts, the Company agrees to pay a premium to the counterparty at the time of settlement.
A call option has an established ceiling price. The buyer of the call option pays the seller a premium to enter into the call option. When the settlement price is above the ceiling price, the seller pays the buyer an amount equal to the difference between the settlement price and the strike price multiplied by the hedged contract volume. When the settlement price is below the ceiling price, the call option expires worthless.
The Company combines swaps, purchased put options, purchased call options, sold put options, and sold call options in order to achieve various hedging strategies. Some examples of the Company’s hedging strategies are
EXTRACTION OIL & GAS HOLDINGS, LLC
NOTES TO UNAUDITED CONDENSED CONSOLIDATED FINANCIAL STATEMENTS (Continued)
collars which include purchased put options and sold call options, three way collars which include purchased put options, sold put options, and sold call options, and enhanced swaps, which include either sold put options or sold call options with the associated premiums rolled into an enhanced fixed price swap.
The objective of the Company’s use of commodity derivative instruments is to achieve more predictable cash flows in an environment of volatile oil and gas prices and to manage its exposure to commodity price risk. While the use of these commodity derivative instruments limits the downside risk of adverse price movements, such use may also limit the Company’s ability to benefit from favorable price movements. The Company may, from time to time, add incremental derivatives to hedge additional production, restructure existing derivative contracts or enter into new transactions to modify the terms of current contracts in order to realize the current value of the Company’s existing positions. The Company does not enter into derivative contracts for speculative purposes.
The use of derivatives involves the risk that the counterparties to such instruments will be unable to meet the financial terms of such contracts. The Company’s derivative contracts are currently with six counterparties. The Company has netting arrangements with the counterparties that provide for the offset of payables against receivables from separate derivative arrangements with the counterparties in the event of contract termination. The derivative contracts may be terminated by a non defaulting party in the event of default by one of the parties to the agreement. There are no credit risk related contingent features or circumstances in which the features could be triggered in derivative instruments that are in a net liability position at the end of the reporting period.
The Company’s commodity derivative contracts as of September 30, 2016 are summarized below:
|
|
|
2016 |
|
2017 |
|
2018 |
| |||
|
NYMEX WTI(1) Crude Swaps: |
|
|
|
|
|
|
| |||
|
Notional volume (Bbl) |
|
525,000 |
|
1,950,000 |
|
— |
| |||
|
Weighted average fixed price ($/Bbl) |
|
$ |
38.70 |
|
$ |
43.91 |
|
|
| |
|
NYMEX WTI(1) Crude Sold Calls: |
|
|
|
|
|
|
| |||
|
Notional volume (Bbl) |
|
839,000 |
|
4,000,000 |
|
100,000 |
| |||
|
Weighted average fixed price ($/Bbl) |
|
$ |
55.15 |
|
$ |
53.59 |
|
$ |
55.00 |
|
|
NYMEX WTI(1) Crude Sold Puts: |
|
|
|
|
|
|
| |||
|
Notional volume (Bbl) |
|
750,000 |
|
3,800,000 |
|
— |
| |||
|
Weighted average fixed price ($/Bbl) |
|
$ |
45.00 |
|
36.41 |
|
|
| ||
|
NYMEX WTI(1) Crude Purchased Puts: |
|
|
|
|
|
|
| |||
|
Notional volume (Bbl) |
|
1,125,000 |
|
4,000,000 |
|
— |
| |||
|
Weighted average purchased put price ($/Bbl) |
|
$ |
51.44 |
|
$ |
46.15 |
|
|
| |
|
NYMEX HH(2) Natural Gas Swaps: |
|
|
|
|
|
|
| |||
|
Notional volume (MMBtu) |
|
3,315,000 |
|
20,620,000 |
|
1,200,000 |
| |||
|
Weighted average fixed price ($/MMBtu) |
|
$ |
3.09 |
|
$ |
3.02 |
|
$ |
3.03 |
|
|
CIG(3) Basis Gas Swaps: |
|
|
|
|
|
|
| |||
|
Notional volume (MMBtu) |
|
990,000 |
|
990,000 |
|
— |
| |||
|
Weighted average fixed price ($/MMBtu) |
|
$ |
(0.19 |
) |
$ |
(0.19 |
) |
|
| |
(1) NYMEX WTI refers to West Texas Intermediate crude oil price on the New York Mercantile Exchange
(2) NYMEX HH refers to the Henry Hub natural gas price on the New York Mercantile Exchange
(3) CIG refers to the NYMEX HH settlement price less the fixed basis price, the Rocky Mountains (CIGC) Inside FERC settlement price.
The following tables detail the fair value of the Company’s derivative instruments, including the gross amounts and adjustments made to net the derivative instruments for the presentation in the balance sheets (in thousands):
|
|
|
As of September 30, 2016 |
| |||||||||||||
|
Location on Balance Sheet |
|
Gross |
|
Gross |
|
Net Amounts |
|
Gross |
|
Net |
| |||||
|
Current assets |
|
$ |
16,761 |
|
$ |
(16,229 |
) |
$ |
532 |
|
$ |
(11 |
) |
$ |
521 |
|
|
Non-current assets |
|
$ |
5,284 |
|
$ |
(5,284 |
) |
$ |
— |
|
$ |
— |
|
$ |
— |
|
EXTRACTION OIL & GAS HOLDINGS, LLC
NOTES TO UNAUDITED CONDENSED CONSOLIDATED FINANCIAL STATEMENTS (Continued)
|
|
|
As of September 30, 2016 |
| |||||||||||||
|
Location on Balance Sheet |
|
Gross |
|
Gross |
|
Net Amounts |
|
Gross |
|
Net |
| |||||
|
Current liabilities |
|
$ |
(38,005 |
) |
$ |
16,229 |
|
$ |
(21,776 |
) |
$ |
11 |
|
$ |
(28,492 |
) |
|
Non-current liabilities |
|
$ |
(12,011 |
) |
$ |
5,284 |
|
$ |
(6,727 |
) |
$ |
— |
|
$ |
— |
|
|
|
|
As of December 31, 2015 |
| |||||||||||||
|
Location on Balance Sheet |
|
Gross |
|
Gross |
|
Net Amounts |
|
Gross |
|
Net |
| |||||
|
Current assets |
|
$ |
89,746 |
|
$ |
(20,861 |
) |
$ |
68,885 |
|
$ |
— |
|
$ |
71,791 |
|
|
Non-current assets |
|
$ |
5,916 |
|
$ |
(3,010 |
) |
$ |
2,906 |
|
$ |
— |
|
$ |
— |
|
|
Current liabilities |
|
$ |
(20,861 |
) |
$ |
20,861 |
|
$ |
— |
|
$ |
— |
|
$ |
— |
|
|
Non-current liabilities |
|
$ |
(3,010 |
) |
$ |
3,010 |
|
$ |
— |
|
$ |
— |
|
$ |
— |
|
(1) Agreements are in place with all of the Company’s financial trading counterparties that allow for the financial right of offset for derivative assets and derivative liabilities at settlement or in the event of a default under the agreements.
(2) Netting for balance sheet presentation is performed by current and non current classification. This adjustment represents amounts subject to an enforceable master netting arrangement, which are not netted on the balance sheet. There are no amounts of related financial collateral received or pledged.
(3) Net amounts are not split by current and non current. All counterparties in a net asset position are shown in the current asset line item and all counterparties in a net liability position are shown in the current liability line item.
The table below sets forth the commodity derivatives gain (loss) for the three and nine months ended September 30, 2016 and 2015. Commodity derivatives gain (loss) are included under other income (expense).
|
|
|
For the Three Months Ended |
|
For the Nine Months Ended |
| ||||||||
|
|
|
2016 |
|
2015 |
|
2016 |
|
2015 |
| ||||
|
Commodity derivatives gain (loss) |
|
$ |
16,225 |
|
$ |
46,886 |
|
$ |
(62,424 |
) |
$ |
38,478 |
|
Note 6—Asset Retirement Obligations
The Company follows accounting for asset retirement obligations in accordance with ASC 410, Asset Retirement and Environmental Obligations, which requires that the fair value of a liability for an asset retirement obligation be recognized in the period in which it was incurred if a reasonable estimate of fair value could be made. The Company’s asset retirement obligations primarily represent the estimated present value of the amounts expected to be incurred to plug, abandon and remediate producing and shut in wells at the end of their productive lives in accordance with applicable state and federal laws. The Company determines the estimated fair value of its asset retirement obligations by calculating the present value of estimated cash flows related to plugging and abandonment liabilities. The significant inputs used to calculate such liabilities include estimates of costs to be incurred; the Company’s credit adjusted discount rates, inflation rates and estimated dates of abandonment. The asset retirement liability is accreted to its present value each period and the capitalized asset retirement costs are depleted with proved oil and gas properties using the unit of production method.
The following table summarizes the activities of the Company’s asset retirement obligations for the nine months ended September 30, 2016 and the year ended December 31, 2015 (in thousands):
|
|
|
For the Nine |
|
For the Year |
| ||
|
Balance beginning of period |
|
$ |
44,367 |
|
$ |
6,450 |
|
|
Liabilities incurred or acquired |
|
4,037 |
|
35,624 |
| ||
EXTRACTION OIL & GAS HOLDINGS, LLC
NOTES TO UNAUDITED CONDENSED CONSOLIDATED FINANCIAL STATEMENTS (Continued)
|
|
|
For the Nine |
|
For the Year |
| ||
|
Liabilities settled |
|
(840 |
) |
(1,742 |
) | ||
|
Revisions in estimated cash flows |
|
1,608 |
|
— |
| ||
|
Accretion expense |
|
4,062 |
|
4,035 |
| ||
|
Balance end of period |
|
$ |
53,234 |
|
$ |
44,367 |
|
Note 7—Fair Value Measurements
ASC Topic 820, Fair Value Measurement and Disclosure, establishes a hierarchy for inputs used in measuring fair value that maximizes the use of observable inputs and minimizes the use of unobservable inputs by requiring that the most observable inputs be used when available. Observable inputs are inputs that market participants would use in pricing the asset or liability developed based on market data obtained from sources independent of the Company. Unobservable inputs are inputs that reflect the Company’s assumptions of what market participants would use in pricing the asset or liability developed based on the best information available in the circumstances. The hierarchy is broken down into three levels based on the reliability of the inputs as follows:
· Level 1: Quoted prices are available in active markets for identical assets or liabilities;
· Level 2: Quoted prices in active markets for similar assets and liabilities that are observable for the asset or liability;
· Level 3: Unobservable pricing inputs that are generally less observable from objective sources, such as discounted cash flow models or valuations.
The financial assets and liabilities are classified based on the lowest level of input that is significant to the fair value measurement. The Company’s assessment of the significance of a particular input to the fair value measurement requires judgment, and may affect the valuation of the fair value of assets and liabilities and their placement within the fair value hierarchy levels. There were no transfers between levels during any periods presented below.
The following table presents the Company’s financial assets and liabilities that were accounted for at fair value on a recurring basis as of September 30, 2016 and December 31, 2015 by level within the fair value hierarchy (in thousands):
|
|
|
Fair Value Measurements at September 30, 2016 Using |
| ||||||||||
|
|
|
Level 1 |
|
Level 2 |
|
Level 3 |
|
Total |
| ||||
|
Financial Assets: |
|
|
|
|
|
|
|
|
| ||||
|
Commodity derivative assets |
|
$ |
— |
|
$ |
532 |
|
$ |
— |
|
$ |
532 |
|
|
Financial Liabilities: |
|
|
|
|
|
|
|
|
| ||||
|
Commodity derivative liabilities |
|
$ |
— |
|
$ |
28,503 |
|
$ |
— |
|
$ |
28,503 |
|
|
|
|
Fair Value Measurements at December 31, 2015 Using |
| ||||||||||
|
|
|
Level 1 |
|
Level 2 |
|
Level 3 |
|
Total |
| ||||
|
Financial Assets: |
|
|
|
|
|
|
|
|
| ||||
|
Commodity derivative assets |
|
$ |
— |
|
$ |
71,791 |
|
$ |
— |
|
$ |
71,791 |
|
|
Financial Liabilities: |
|
|
|
|
|
|
|
|
| ||||
|
Commodity derivative liabilities |
|
$ |
— |
|
$ |
— |
|
$ |
— |
|
$ |
— |
|
The following methods and assumptions were used to estimate the fair value of the assets and liabilities in the table above:
Commodity Derivative Instruments
The Company determines its estimate of the fair value of derivative instruments using a market based approach that takes into account several factors, including quoted market prices in active markets, implied market volatility
EXTRACTION OIL & GAS HOLDINGS, LLC
NOTES TO UNAUDITED CONDENSED CONSOLIDATED FINANCIAL STATEMENTS (Continued)
factors, quotes from third parties, the credit rating of each counterparty, and the Company’s own credit rating. In consideration of counterparty credit risk, the Company assessed the possibility of whether each counterparty to the derivative would default by failing to make any contractually required payments. Additionally, the Company considers that it is of substantial credit quality and has the financial resources and willingness to meet its potential repayment obligations associated with the derivative transactions. Derivative instruments utilized by the Company consist of swaps, put options, and call options. The oil and natural gas derivative markets are highly active. Although the Company’s derivative instruments are valued using public indices, the instruments themselves are traded with third party counterparties and are not openly traded on an exchange. As such, the Company has classified these instruments as Level 2.
Fair Value of Financial Instruments
The Company’s financial instruments consist primarily of cash and cash equivalents, accounts receivable, accounts payable, commodity derivative instruments (discussed above) and long term debt. The carrying values of cash and cash equivalents, accounts receivable and accounts payable are representative of their fair values due to their short term maturities. The carrying amount of the Company’s credit facility approximated fair value as it bears interest at variable rates over the term of the loan. The fair value of the Second Lien Notes and Senior Notes was derived from available market data. As such, the Company has classified the Second Lien Notes and Senior Notes as Level 2. Please refer to Note 4—Long Term Debt for further information. The Company’s policy is to recognize transfers between levels at the end of the period. This disclosure (in thousands) does not impact the Company’s financial position, results of operations or cash flows.
|
|
|
At September 30, 2016 |
|
At December 31, 2015 |
| ||||||||
|
|
|
Carrying |
|
Fair Value |
|
Carrying |
|
Fair Value |
| ||||
|
Credit facility |
|
$ |
89,000 |
|
$ |
89,000 |
|
$ |
225,000 |
|
$ |
225,000 |
|
|
Second Lien Notes(1) |
|
$ |
— |
|
$ |
— |
|
$ |
412,790 |
|
$ |
433,196 |
|
|
Senior Notes(2) |
|
$ |
537,601 |
|
$ |
573,375 |
|
$ |
— |
|
$ |
— |
|
(1) The carrying amount of the Second Lien Notes includes unamortized debt discount and debt issuance costs of $17.2 million as of December 31, 2015.
(2) The carrying amount of the Senior Notes includes unamortized debt issuance costs of $12.4 million as of September 30, 2016.
Non Recurring Fair Value Measurements
The Company applies the provisions of the fair value measurement standard on a non recurring basis to its non financial assets and liabilities, including proved property. These assets and liabilities are not measured at fair value on a recurring basis, but are subject to fair value adjustments when facts are circumstances arise that indicate a need for measurement.
The Company utilizes fair value on a non recurring basis to review its proved oil and gas properties for potential impairment when events and circumstances indicate a possible decline in the recoverability of the carrying value of such property. The Company uses an income approach analysis based on the net discounted future cash flows of producing property. The future cash flows are based on Management’s estimates for the future. Unobservable inputs included estimates of oil and gas production, as the case may be, from the Company’s reserve reports, commodity prices based on the sales contract terms or forward price curves, operating and development costs, and a discount rate based on the Company’s weighted average cost of capital (all of which are Level 3 inputs within the fair value hierarchy). No impairment expense was recognized for the three months ended September 30, 2016 on proved oil and gas properties. For the nine months ended September 30, 2016, the Company recognized $22.5 million in impairment expense on proved oil and gas properties. No impairment expense was recognized for the three months ended September 30, 2015 on proved oil and gas properties. For the nine months ended September 30, 2015, the Company recognized $9.5 million in impairment expense on proved oil and gas properties. The impairment expense for the nine months ended September 30, 2016 and 2015 is related to impairment of the assets in the Company’s Northern field. The future undiscounted cash flows did not exceed its carrying amount associated with its proved oil and gas properties in its Northern field and it was determined that the proved oil and gas properties had no
EXTRACTION OIL & GAS HOLDINGS, LLC
NOTES TO UNAUDITED CONDENSED CONSOLIDATED FINANCIAL STATEMENTS (Continued)
remaining fair value. Therefore, the full net book value of these proved oil and gas properties were impaired at June 30, 2016 and 2015, respectively.
The Company’s other non recurring fair value measurements include the purchase price allocations for the fair value of assets and liabilities acquired through business combinations, please refer to Note 3—Acquisitions. The fair value of assets and liabilities acquired through business combinations is calculated using a discounted cash flow approach using level 3 inputs. Cash flow estimates require forecasts and assumptions for many years into the future for a variety of factors, including risk adjusted oil and gas reserves, commodity prices and operating costs, based on market participant assumptions. The fair value of assets or liabilities associated with purchase price allocations is on a non recurring basis and is not measured in periods after initial recognition.
Note 8—Members’ Equity
Tranche A, Tranche B and Preferred Tranche C Unit Issuance
At September 30, 2016, the Company’s operations were governed by the provisions of the Amended and Restated Limited Liability Company Agreement effective March 10, 2015 (“Holdings LLC Agreement”) and the Company had two classes of voting membership interests outstanding, the Tranche A Equity Units and the Tranche C Equity Units. In connection with the Reorganization, on May 29, 2014, the following Tranche A Equity Units were issued:
· 62.4 million Tranche A Equity Units were issued to certain members that had made historical capital contributions to Extraction through PRL at a price of $1.02 per unit for gross proceeds of $63.4 million; and,
· 14.5 million Tranche A Equity Units were issued to certain members to settle $39.0 million of Extraction convertible notes at a price of $2.68 per unit for gross proceeds of $39.0 million.
Additionally, on May 29, 2014, 75.6 million Tranche A Equity Units were issued to new and existing members in exchange for additional capital contributions at a price of $2.68 per unit for gross proceeds of $202.9 million.
On August 20, 2014, the Company issued an additional 74.5 million Tranche A Equity Units to new and existing members in exchange for additional capital contributions at a price of $2.68 per unit for gross proceeds of $199.9 million.
On February 18, 2015, the Company issued 15.3 million Tranche B Equity Units to certain Members at a purchase price of $3.25 per unit for gross proceeds of $49.5 million. The Tranche B Equity Unit holders were granted certain rights in Holdings’ LLC Agreement. Included was a right to exchange the Tranche B Equity Units for new equity units at a price of $3.25 per unit if the Company issues any equity units with rights, preferences or obligations different from the Tranche B Units on or prior to May 14, 2015.
On March 10, 2015, the Company issued 32.5 million Tranche C Equity Units to certain new and existing Members at a purchase price of $3.25 per unit for gross proceeds of $105.7 million and each Tranche B Equity Unit was reclassified as a Tranche C Equity Unit, such that no Tranche B Equity Units remain outstanding. The Tranche C Equity Unit holders were granted certain rights in Holdings’ LLC Agreement. Included with these rights were, (1) the right to receive their invested capital prior to any distribution to any other unit holders, (2) the right to receive additional Tranche C units under specified circumstances contingent upon an initial public offering or certain change of control events and (3) the right to approve the issue of equity units with any rights or preferences that are senior to the rights and preferences of the Tranche C Equity Units.
On September 24, 2015, the Company issued 22.9 million Tranche C Equity Units to Members at a purchase price of $3.25 per unit for gross proceeds of $74.3 million.
On October 13, 2015, the Company issued 7.9 million Tranche C Equity Units to new and existing Members at a purchase price of $3.25 per unit for gross proceeds of $25.7 million.
EXTRACTION OIL & GAS HOLDINGS, LLC
NOTES TO UNAUDITED CONDENSED CONSOLIDATED FINANCIAL STATEMENTS (Continued)
In April 2016 and June 2016, the Company issued 35.8 million Preferred Tranche C Equity Units to new and existing Members at a purchase price of $3.25 per unit for gross proceeds of $116.4 million. The proceeds of the April and June 2016 Offering were used for general business purposes, including to repay amounts borrowed under the Company’s credit facility.
In July 2016, the Company issued an additional 1.5 million Preferred Tranche C Equity Units to new and existing Members at a purchase price of $3.25 per unit for gross proceeds of $5.0 million. The proceeds of the July 2016 Offering were used for general business purposes, including to repay amounts borrowed under the Company’s credit facility.
The Company incurred equity issuance costs related to the aforementioned equity offerings of $15.5 million from inception through September 30, 2016. These equity issuance costs were recorded as a reduction to Members’ Equity.
Restricted Unit Awards (“RUAs”)
Under the Holdings LLC Agreement, the Company could grant RUAs to employees, non employee managers and consultants. RUAs are nonvoting membership interests in the Company and are subject to certain vesting and forfeiture conditions, but have equal rights and preferences to the Tranche A Equity Units in all other regards. See Note 9—Unit Based Compensation for additional information.
Promissory Notes
In May 2014, the Company received full recourse promissory notes from two officers under which the Company advanced $5.4 million to the employees to meet their capital contributions. The promissory notes were due on May 29, 2021, or earlier in the event of termination or certain change in control events as stipulated in the individual promissory notes and any distributions of capital contributions are considered mandatory prepayments. The promissory notes have a stated interest rate of LIBOR plus 1% per annum. The promissory notes are recorded as a reduction of members’ equity.
In September 2016, the Company redeemed 1.2 million units from two of its executive officers, for an aggregate purchase price of $7.8 million. On the same date, the executive officers used $5.6 million of the redemption value to settle in full and terminate their obligations under the promissory notes, including accrued interest thereon.
Initial Public Offering
In October 2016, the Company completed its initial public offering, issuing 38.3 million shares of common stock, par value $0.01 per share (“common stock”), which includes the full exercise of the underwriters over-allotment option of 5.0 million shares at a price of $19.00 per share. The estimated net proceeds of the offering were $683.7 million, after deducting underwriting discounts and commissions and offering expenses, of approximately $44.6 million. The proceeds from the Offering were used to (i) redeem in full the Series A Preferred Units for $90.0 million and (ii) to repay borrowings under the Company’s revolving credit facility for $291.6 million. The remaining net proceeds will be used for general corporate purposes, including to fund the 2016 and 2017 capital expenditures. The material terms of the Offering are described in the Company’s final prospectus, dated October 11, 2016 and filed with the SEC pursuant to Rule 424(b)(4) of the Securities Act of 1933, as amended, on October 13, 2016 (the “Final Prospectus”).
At the consummation of the IPO, Holdings merged with and into XOG and XOG was the surviving entity to the merger, with the equity holders in Holdings, other than the holders of the Series B Preferred Units (which were converted in connection with the closing of the Offering into shares of Series A Preferred Stock as defined below), but including the holders of RUAs and incentive units, receiving an aggregate of 108.5 million shares of common stock, with the allocation of such shares among Holdings’ equity holders determined by reference to the Company’s implied valuation based on the 10-day volume weighted average price of the common stock following the closing of the Offering, in accordance with the distribution mechanics set forth in the Holdings LLC Agreement. As a result of the Offering, there are 146.8 million common shares outstanding as of the date of this filing.
EXTRACTION OIL & GAS HOLDINGS, LLC
NOTES TO UNAUDITED CONDENSED CONSOLIDATED FINANCIAL STATEMENTS (Continued)
Series A Preferred Stock and Series B Preferred Units
On October 3, 2016, the Company issued $185.3 million in convertible preferred securities (“Series B Preferred Units”) to fund a portion of the purchase price for the October 2016 Acquisition. The Series B Preferred Units were entitled to receive a cash dividend of 10% per year, payable quarterly in arrears, and the Company had the ability to pay up to 50% of the quarterly dividend in kind. The Company did not make any payments in kind on the Series B Preferred Units from the date of issuance of the Series B Preferred Units through the Offering. The Series B Preferred Units converted in connection with the closing of the IPO into 185,280 shares of Series A Convertible Preferred Stock (the “Series A Preferred Stock”) that are entitled to receive a cash dividend of 5.875% per year, payable quarterly in arrears, and the Company has the ability to pay such quarterly dividends in kind at a dividend rate of 10% per year (decreased proportionately to the extent such quarterly dividends are paid in cash). Beginning on or after the later of (a) 90 days after the closing of the Offering and (b) the earlier of 120 days after the closing of the Offering and the expiration of the lock-up period contained in the underwriting agreement entered into in connection with the Offering (“Lock-Up Period End Date”), the Series A Preferred Stock will be convertible into shares of our common stock at the election of the holders of the Series A Preferred Stock (“Series A Preferred Holders”) at a conversion ratio per share of Series A Preferred Stock of 61.9195. Beginning on or after the Lock-Up Period End Date until the three year anniversary of the closing of the Offering, the Company may elect to convert the Series A Preferred Stock at a conversion ratio per share of Series A Preferred Stock of 61.9195, but only if the closing price of the Company’s common stock trades at or above a certain premium to the Company’s initial offering price, such premium to decrease with time. In certain situations, including a change of control, the Series A Preferred Stock may be redeemed for cash in an amount equal to the greater of (i) 135% of the liquidation preference of the Series A Preferred Stock and (ii) a 17.5% annualized internal rate of return on the liquidation preference of the Series A Preferred Stock. The Series A Preferred Stock mature on October 15, 2021, at which time they are mandatorily redeemable for cash at the liquidation preference. As of the initial issuance of the $185.3 million of Series B Preferred Units, members of Holdings held approximately $135.3 million. Upon closing of the Offering, members of Holdings held $185.3 million of the Series A Preferred Stock.
Note 9—Unit Based Compensation
Holdings’ RUAs
On May 29, 2014, the Company adopted the 2014 Membership Unit Incentive Plan (“2014 Plan”). The 2014 Plan provided for the compensation of employees, non employee managers and consultants of the Company and its affiliates through grants of restricted unit awards (“Holdings’ RUAs”) and incentive units (“Holdings’ Incentive Units”). As of September 30, 2016, no Holdings’ RUAs remained available for issuance under the 2014 Plan.
At the Reorganization through September 30, 2016, the following Holdings’ RUA activity occurred related to the Company’s employees and non employee consultants:
· 3.4 million Holdings’ RUAs were granted to each holder of PRL RUAs as part of the Reorganization, (as defined below under the heading “PRL RUAs”);
· 3.5 million Holdings’ RUAs were granted to certain Company employees and consultants to keep their equity ownership whole as part of the Reorganization;
· 1.4 million Holdings’ RUAs were granted to certain members of Extraction management who participated in Extraction’s Net Profits Interest Bonus Plan, which was terminated on May 29, 2014 as part of the Reorganization;
· 1.9 million Holdings’ RUAs were granted to certain Company employees that were hired subsequent to the Reorganization; and
· 1.5 million Holdings’ RUAs were granted to certain officers.
Holdings’ RUAs vested over a three year service period, with 25%, 25% and 50% of the units vesting in year one, two and three, respectively. The vesting period for the 3.4 million Holdings’ RUAs granted to holders of PRL
EXTRACTION OIL & GAS HOLDINGS, LLC
NOTES TO UNAUDITED CONDENSED CONSOLIDATED FINANCIAL STATEMENTS (Continued)
RUAs was carried over from the original PRE RUA grants; as such, 0.2 million Holdings’ RUAs were vested on May 29, 2014. The vesting period for all other Holdings’ RUAs begins on the grant date. During September 2016, vesting was accelerated on all of the Holdings’ RUAs, as such, as of September 30, 2016, all Holdings’ RUAs were fully vested. The Company estimated fair value of the RUAs on their grant date based upon estimated volatility, market comparable risk free rate, estimated forfeiture rate and a discount for lack of marketability. Grant date fair value was determined based on the value of the Company’s Equity Units on the date of the grant. Due to a lack of historical data, the Company used the experience of other entities in the same industry to estimate a forfeiture rate. Expected forfeitures are then included as part of the grant date estimate of compensation cost.
The Company recorded $12.2 million and $14.5 million of unit-based compensation costs related to Holdings’ RUA grants for the three and nine months ended September 30, 2016 , respectively, as compared to $1.3 million and $4.1 million for the three and nine months ended September 30, 2015, respectively. These costs are included in the consolidated statements of operations within the general and administrative expenses line item. No tax benefit related to unit based compensation was recognized in the consolidated statements of operations and no unit based compensation was capitalized for the three and nine months ended September 30, 2016 and 2015. As of September 30, 2016, there was no unrecognized compensation cost related to unvested Holdings’ RUAs granted to employees as all Holdings’ RUAs were fully vested at September 30, 2016.
Of the 3.4 million Holdings’ RUAs granted to holders of PRL RUAs in connection with the Reorganization, 1.3 were granted to PRL employees or consultants. The Company does not record any unit based compensation expense related to these awards because PRL employees or consultants do not provide services to the Company.
Of the 3.5 million Holdings’ RUAs granted to certain employees and consultants to keep their equity ownership whole as part of the Reorganization, 1.3 were granted to PRL employees or consultants. The Company does not record any unit based compensation expense related to these awards because PRL employees or consultants do not provide services to the Company.
The following table summarizes the Holdings’ RUA activity from the January 1, 2015 through September 30, 2016 and provides information for Holdings’ RUAs outstanding at the dates indicated:
|
|
|
Number of |
|
Weighted |
| |
|
Non-vested RUAs at January 1, 2015 |
|
9,365,896 |
|
$ |
2.22 |
|
|
Granted |
|
196,047 |
|
$ |
2.68 |
|
|
Forfeited |
|
(53,063 |
) |
$ |
2.21 |
|
|
Vested |
|
(3,197,638 |
) |
$ |
2.22 |
|
|
Non-vested RUAs at December 31, 2015 |
|
6,311,242 |
|
$ |
2.23 |
|
|
Granted |
|
1,531,542 |
|
$ |
5.84 |
|
|
Forfeited |
|
(181,817 |
) |
$ |
2.68 |
|
|
Vested |
|
(7,660,967 |
) |
$ |
2.94 |
|
|
Non-vested RUAs at September 30, 2016 |
|
— |
|
$ |
— |
|
PRL RUAs
Prior to the Reorganization, PRL granted RUAs to certain employees, including Extraction employees (“PRL RUAs”). Subsequent to the Reorganization, Extraction’s employees retained the PRL RUAs. PRL RUAs vest over a three year service period, with 25%, 25% and 50% of the units vesting in year one, two and three, respectively. Grant date fair value was determined based on the value of PRL’s Equity Units on the date of the grant. PRL uses its past experience to estimate a forfeiture rate and expected forfeitures are included as part of the grant date estimate of compensation cost.
The Company recorded $0.1 million and $0.4 million of unit- based compensation costs related to PRL RUA grants for the three and nine months ended September 30, 2016, respectively, as compared to $0.2 million and $0.6 million for the three and nine months ended September 30, 2015, respectively. These costs are included in the consolidated statements of operations within the general and administrative expenses line item. As of September 30,
EXTRACTION OIL & GAS HOLDINGS, LLC
NOTES TO UNAUDITED CONDENSED CONSOLIDATED FINANCIAL STATEMENTS (Continued)
2016, there was $0.1 million of total unrecognized compensation cost related to unvested PRL RUAs granted to employees that is expected to be recognized over a weighted average period of 0.2 years.
Holdings’ Incentive Units
In accordance with the 2014 Plan and the Holdings LLC Agreement, Holdings issued incentive units to certain members of management in the fourth quarter of 2015. As of September 30, 2016, 3.0 million Holdings’ Incentive Units have been issued. No Holdings’ Incentive Units were issued during 2016. All of Holdings’ Incentive Units are non voting and subject to certain vesting and performance conditions. The Holdings’ Incentive Units vested over a three year service period, with 25%, 25% and 50% of the units vesting in year 1, year 2 and year 3, respectively (with vesting between the first and third anniversaries occurring pro-rata based on the number of full months elapsed since the last vesting date), and in full upon a change of control, as defined in the Holdings LLC Agreement. The Holdings’ Incentive Units are accounted for as liability awards under ASC 718, Compensation—Stock Compensation, with compensation expense based on period end fair value. No incentive compensation expense was recorded for the three and nine months ended September 30, 2016 and 2015, because it was not probable that the performance criterion would be met.
In anticipation of the IPO, the Board of Managers of Holdings accelerated the vesting of the Holdings’ Incentive Units in September 2016. During the fourth quarter of 2016, the Company’s IPO and change of control triggered the conversion of these units into approximately 9.1 million common shares of the Company based on the 10-day volume weighted average price of the Company’s commons stock following its IPO as set forth in the 2014 Plan and the Holdings LLC Agreement. The Company will recognize approximately $172.1 million in non-cash, share-based compensation expense in the fourth quarter of 2016 in connection with the conversion of the Holdings’ Incentive Units into the Company’s common stock.
Long Term Incentive Plan
In October 2016, the Board of Managers adopted the Extraction Oil & Gas, Inc. 2016 Long Term Incentive Plan (the “2016 Plan” or “LTIP”), pursuant to which employees, consultants, and directors of the Company and its affiliates performing services for the Company are eligible to receive awards. The 2016 Plan provides for the grant of stock options, stock appreciation rights, restricted stock, restricted stock units, bonus stock, dividend equivalents, other stock-based awards, substitute awards, annual incentive awards, and performance awards intended to align the interests of participants with those of stockholders. In accordance with the terms of the LTIP, 20.2 million shares of common stock have been reserved for issuance pursuant to awards under the LTIP. In October 2016, and in connection with our Offering, XOG granted awards under the LTIP to certain directors and officers.
Note 10—Earnings (Loss) Per Unit
As discussed in Note 8—Members’ Equity, the Company had Tranche A and Tranche C Equity Units. Additionally, the Company’s RUAs are classified as Tranche A non voting units upon vesting. In a distribution of capital in excess of contributed capital, the Company’s two types of Equity Units, Tranche A and Tranche C, participated in distributions proportionally based on their respective share of the total number of equity units outstanding. The Tranche C Equity Units received their contributed capital prior to Tranche A only in a liquidation event. The Company assumed liquidation in excess of capital contributions, thus the Tranche C and A Units are considered in the same class for the purpose of computing earnings (loss) per unit. In connection with the IPO, the equity holders in Holdings, other than the holders of the Series B Preferred Units, but including the holders of RUAs and incentive units, received common stock in XOG.
Basic earnings (loss) per unit is computed by dividing income (loss) attributable to unitholders by the weighted average number of units outstanding during each period. Diluted earnings per unit reflects the potential dilutive impact from unvested RUAs. As of September 30, 2016, there were no remaining unvested RUAs available for grant under the 2014 Plan. As of September 30, 2015, there were 7.0 million unvested RUAs. In periods of net loss, as was the case for the three and nine months ended September 30, 2016 and 2015 and the three months ended September 30, 2016, potentially dilutive units are excluded from the calculation because they are anti dilutive.
EXTRACTION OIL & GAS HOLDINGS, LLC
NOTES TO UNAUDITED CONDENSED CONSOLIDATED FINANCIAL STATEMENTS (Continued)
The table below sets forth the computations of basic and diluted net income (loss) per unit for the three and nine months ended September 30, 2016 and 2015 (in thousands, except per unit data):
|
|
|
For the Three Months Ended |
|
For the Nine Months Ended |
| ||||||||
|
|
|
2016 |
|
2015 |
|
2016 |
|
2015 |
| ||||
|
Net income (loss) allocable to Equity Units |
|
$ |
(37,267 |
) |
$ |
18,650 |
|
$ |
(210,400 |
) |
$ |
(38,060 |
) |
|
Weighted-average shares: |
|
|
|
|
|
|
|
|
| ||||
|
Weighted average Equity Units outstanding - basic |
|
349,014 |
|
279,896 |
|
332,377 |
|
266,844 |
| ||||
|
Weighted average Equity Units outstanding - diluted |
|
349,014 |
|
286,891 |
|
332,377 |
|
266,844 |
| ||||
|
Income (loss) per Equity Unit(1): |
|
|
|
|
|
|
|
|
| ||||
|
Basic |
|
$ |
(0.11 |
) |
$ |
0.07 |
|
$ |
(0.63 |
) |
$ |
(0.14 |
) |
|
Diluted |
|
$ |
(0.11 |
) |
$ |
0.07 |
|
$ |
(0.63 |
) |
$ |
(0.14 |
) |
(1) For the nine months ended September 30, 2016 and 2015 and the three months ended September 30, 2016, the anti dilutive RUAs were excluded from the if converted method of calculating diluted earnings per unit. For the three months ended September 30, 2015, 7.0 million unvested RUAs were included in the if-converted method of calculating diluted earnings per unit.
Note 11—Commitments and Contingencies
Leases
The Company leases two office spaces in Denver, Colorado, one office space in Greeley, Colorado and one office space in Houston, Texas under separate operating lease agreements. The Denver, Colorado leases expire on February 29, 2020 and May 31, 2026, respectively. The Greeley and Houston leases expire on March 31, 2019 and October 31, 2017, respectively. Total rental commitments under non cancelable leases for office space were $21.6 million at September 30, 2016. The future minimum lease payments under these non cancelable leases are as follows: $0.6 million in 2016, $2.5 million in 2017, $2.5 million in 2018, $2.3 million in 2019, $2.1 million in 2020 and $11.6 million thereafter. Rent expense was $0.6 million and $1.3 million for the three and nine months ended September 30, 2016, respectively, as compared to $0.3 million and $0.7 million for the three and nine months ended September 30, 2015, respectively.
On June 4, 2015 and March 22, 2016, the Company subleased the remaining term of one of its Denver office leases that expires February 29, 2020. As of September 30, 2016, the sublease will decrease the Company’s future lease payments by $0.8 million.
Drilling Rigs
As of September 30, 2016, the Company had commitments on two drilling rigs. In the event of early termination, the Company would be obligated to pay approximately $1.9 million as of September 30, 2016, as required under the terms of the contract. In March 2015, the Company early terminated one of its drilling rig contracts for approximately $1.7 million, which was recorded in the consolidated statements of operations within the other operating expenses line item. In February 2016, the Company provided notice to terminate one of its drilling rigs for approximately $0.9 million that was subject to commitment at December 31, 2015. This amount was recorded in the consolidated statements of operations within the other operating expenses line item.
Delivery Commitments
As of September 30, 2016, the Company was subject to a long term crude oil delivery commitment over a term of 10 years with a commencement date of November 30, 2016. The terms have a fixed monthly delivery commitment of 40,000 Bpd in year one, 52,000 Bpd in year two, and 58,000 Bpd in years three through ten at a price of $3.95 per barrel which is subject to standard Federal Energy Regulatory Commission (“FERC”) escalation rates. The aggregate amount of estimated payments under the agreement is $887.3 million over the ten years.
Upon closing the October 2016 Acquisition, the Company is subject to two additional long-term crude oil delivery commitments. The first has a term of seven years with a commencement date of November 1, 2016, which has delivery commitment obligations of 5,000 Bpd in year one and 3,800 Bpd in year two through seven. The
EXTRACTION OIL & GAS HOLDINGS, LLC
NOTES TO UNAUDITED CONDENSED CONSOLIDATED FINANCIAL STATEMENTS (Continued)
aggregate amount of estimated payments under the agreement is $55.2 million over the seven years. The second has a term of five years with a commencement date of November 1, 2016, which has delivery commitments obligations of 5,000 Bpd in year one and 3,800 Bpd in year two through five. The aggregate amount of the estimate payments under the agreement is $10.4 million over the five years.
None of the Company’s reserves are subject to any priorities or curtailments that may affect quantities delivered to its customers. The Company believes that its future production is adequate to meet its commitments. If for some reason the Company’s production is not sufficient to satisfy its commitments, the Company expects to be able to purchase volumes in the market or make other arrangements to satisfy its commitments.
General
The Company is subject to contingent liabilities with respect to existing or potential claims, lawsuits, and other proceedings, including those involving environmental, tax, and other matters, certain of which are discussed more specifically below. The Company accrues liabilities when it is probable that future costs will be incurred and such costs can be reasonably estimated. Such accruals are based on developments to date and the Company’s estimates of the outcomes of these matters and its experience in contesting, litigating, and settling other matters. As the scope of the liabilities becomes better defined, there will be changes in the estimates of future costs, which management currently believes will not have a material effect on the Company’s financial position, results of operations, or cash flows.
As is customary in the oil and gas industry, the Company may at times have commitments in place to reserve or earn certain acreage positions or wells. If the Company does not meet such commitments, the acreage positions or wells may be lost or the Company may be required to pay damages if certain performance conditions are not met.
Legal Matters
In the first three quarters of 2016, the Company received nine invoices related to a terminated firm natural gas transportation service agreement. The natural gas transportation provider has demanded payment under this terminated agreement. The Company has delivered written notice disputing any and all amounts due related to this terminated agreement. The Company intends to vigorously defend itself against any and all demands, if legal proceedings relating to this matter are initiated; we may incur material legal expenses if this dispute results in litigation. The Company is unable to estimate a reasonable possible loss. In the event there is an adverse outcome, the Company currently estimates that its future loss would range between $0 million to $37.2 million that would be paid over the remainder of the original 10 year term of transportation service agreement.
In the ordinary course of business, the Company may at times be subject to claims and legal actions. Management believes it is remote that the impact of such matters will have a material adverse effect on the Company’s financial position, results of operations or cash flows. Management is unaware of any pending litigation brought against the Company requiring the reserve of a contingent liability as of the date of these financial statements.
Note 12—Related Party Transactions
Office Lease with Related Affiliate
In March 2016, the Company subleased office space to Star Peak Capital, LLC, of which a member of the board of managers is an owner, for $1,400 per month. The sublease commenced on May 1, 2016 and expires on February 29, 2020.
Units Repurchased from Officer
In May 2016, the Company repurchased 60,605 Tranche A Units and 82,578 Tranche C Units from its former Chief Accounting Officer, for $3.25 per unit for an aggregate purchase price of approximately $0.5 million.
EXTRACTION OIL & GAS HOLDINGS, LLC
NOTES TO UNAUDITED CONDENSED CONSOLIDATED FINANCIAL STATEMENTS (Continued)
Promissory Notes
In May 2014, the Company received full recourse promissory notes from two officers under which the Company advanced $5.4 million to the employees to meet their capital contributions. The promissory notes are due on May 29, 2021, or earlier in the event of termination or certain change in control events as stipulated in the individual promissory notes and any distributions of capital contributions are considered mandatory prepayments. The promissory notes have a stated interest rate of LIBOR plus 1% per annum. The promissory notes are recorded as a reduction of members’ equity.
In September 2016, the Company redeemed 1,195,472 units from two of its executive officers, with an aggregate value of $7.8 million. On the same date, the executive officers used $5.6 million of the redemption value to settle in full and terminate their obligations under the promissory notes, including interest thereon.
Second Lien Notes
Several lenders of Second Lien Notes were also members of Holdings. Of the $430.0 million formerly outstanding on the Second Lien Notes, members held approximately $311.7 million. These members were paid $314.8 million upon repayment and termination of the Second Lien Notes, including the prepayment penalty.
Senior Notes
Several lenders of Senior Notes are also members of Holdings. As of the initial issuance of the $550.0 million principal amount on the Senior Notes, members held approximately $168.5 million.
Series A Preferred Units
All holders of the $75.0 million of Series A Preferred Units as of September 30, 2016 were also members of Holdings. The Company used $90.0 million of the net proceeds from its IPO to redeem the Series A Preferred Units in full on October 17, 2016, which included a premium of $15.0 million.
Series A Preferred Stock and Series B Preferred Units
As of the initial issuance of the $185.3 million of Series B Preferred Units, members of Holdings held approximately $135.3 million. Upon closing of the IPO, members of Holdings held $185.3 million of the Series A Preferred Stock.
Due to Related Party
As of December 31, 2014, the Company had recorded a payable due to related party of $0.2 million with PRL for certain general and administrative expenses, which included salary and related benefits, office rent, insurance premiums and other general and administrative costs, which was repaid in April 2015.
To the Board of Managers of Extraction Oil & Gas, LLC
We have audited the accompanying special purpose statements of revenues and direct operating expenses of certain oil & gas properties of Tekton Windsor, LLC (the “May 2014 properties acquired,” as described in Note 1, collectively referred to as “the Company”) for the three-month period ended March 31, 2014 and for the year ended December 31, 2013.
Management’s Responsibility for the Special Purpose Statements of Revenues and Direct Operating Expenses
Management is responsible for the preparation and fair presentation of the special purpose statements of revenues and direct operating expenses in accordance with accounting principles generally accepted in the United States of America; this includes the design, implementation, and maintenance of internal control relevant to the preparation and fair presentation of the special purpose statements of revenues and direct operating expenses that are free from material misstatement, whether due to fraud or error.
Auditor’s Responsibility
Our responsibility is to express an opinion on the special purpose statements of revenues and direct operating expenses based on our audit. We conducted our audit in accordance with auditing standards generally accepted in the United States of America. Those standards require that we plan and perform the audit to obtain reasonable assurance about whether the special purpose statements of revenues and direct operating expenses are free from material misstatement.
An audit involves performing procedures to obtain audit evidence about the amounts and disclosures in the special purpose statements of revenues and direct operating expenses. The procedures selected depend on our judgment, including the assessment of the risks of material misstatement of the special purpose statements of revenues and direct operating expenses, whether due to fraud or error. In making those risk assessments, we consider internal control relevant to the Company’s preparation and fair presentation of the special purpose statements of revenues and direct operating expenses in order to design audit procedures that are appropriate in the circumstances, but not for the purpose of expressing an opinion on the effectiveness of the Company’s internal control. Accordingly, we express no such opinion. An audit also includes evaluating the appropriateness of accounting policies used and the reasonableness of significant accounting estimates made by management, as well as evaluating the overall presentation of the special purpose statements of revenues and direct operating expenses. We believe that the audit evidence we have obtained is sufficient and appropriate to provide a basis for our audit opinion.
Opinion
In our opinion, the special purpose statements of revenues and direct operating expenses referred to above present fairly, in all material respects, the revenues and direct operating expenses of the May 2014 properties acquired for the three-month period ended March 31, 2014 and for the year ended December 31, 2013 in accordance with accounting principles generally accepted in the United States of America.
Emphasis of Matter
The accompanying special purpose statements of revenues and direct operating expenses were prepared in connection with Extraction Oil & Gas, LLC’s purchase of the May 2014 properties acquired from Tekton Windsor, LLC, and as described in Note 1, were prepared in accordance with an SEC waiver received by Extraction Oil & Gas, LLC, for the purposes of Extraction Oil & Gas, LLC complying with Rule 3-05 of the Securities and Exchange Commission’s Regulation S-X. These special purpose statements of revenues and direct operating expenses are not intended to be a complete presentation of the financial position, results of operations or cash flows of the May 2014 properties acquired. Our opinion is not modified with respect to this matter.
Other Matter
The accompanying special purpose statement of revenues and direct operating expenses for the three-month period ended March 31, 2013 was not audited, reviewed, or compiled by us and, accordingly, we do not express an opinion or any other form of assurance on it.
/s/ PricewaterhouseCoopers LLP
Denver, Colorado
July 13, 2015
STATEMENTS OF REVENUES AND DIRECT OPERATING EXPENSES
OF MAY 2014 PROPERTIES ACQUIRED BY EXTRACTION OIL & GAS, LLC
|
|
|
For the |
|
For the Three-Month Periods Ended |
| |||||
|
|
|
Year Ended |
|
March 31, 2014 |
|
March 31, 2013 |
| |||
|
|
|
|
|
(in thousands) |
|
|
| |||
|
Revenues: |
|
|
|
|
|
|
| |||
|
Oil sales |
|
$ |
10,594 |
|
$ |
8,261 |
|
$ |
441 |
|
|
Natural gas sales |
|
1,054 |
|
559 |
|
37 |
| |||
|
NGL sales |
|
756 |
|
620 |
|
— |
| |||
|
Total revenues |
|
12,404 |
|
9,440 |
|
478 |
| |||
|
Direct Operating Expenses: |
|
|
|
|
|
|
| |||
|
Lease operating expense |
|
616 |
|
637 |
|
31 |
| |||
|
Production taxes |
|
1,378 |
|
1,075 |
|
43 |
| |||
|
Total direct operating expenses |
|
1,994 |
|
1,712 |
|
74 |
| |||
|
Revenues in Excess of Direct Operating Expenses |
|
$ |
10,410 |
|
$ |
7,728 |
|
$ |
404 |
|
See accompanying notes to the statements of revenues and direct operating expenses
NOTES TO THE STATEMENTS OF REVENUES AND DIRECT OPERATING EXPENSES
1. BASIS OF PRESENTATION:
On March 4, 2014, Extraction Oil & Gas, LLC (the “Company”), entered into a definitive purchase and sale agreement (the “Tekton Agreement”) with Tekton Windsor, LLC (the “Seller”), under which Extraction agreed to acquire interests in approximately 6,200 net acres of leaseholds, and related producing properties located primarily in Weld County, Colorado (the “May 2014 Properties Acquired”), along with various other related rights, permits, contracts, equipment and other assets. The seller received aggregate consideration of approximately $219.3 million in cash. The effective date for the acquisition was January 1, 2014, with purchase price adjustments calculated as of the closing date on May 29, 2014.
The accompanying Statements of Revenues and Direct Operating Expenses (the “Statements”) are presented on an accrual basis of accounting and relate to the operations of the May 2014 Properties Acquired and have been derived from the historical accounting records. Certain costs such as depreciation, depletion, and amortization, accretion of asset retirement obligations, general and administrative expenses, interest and corporate income taxes are omitted. As such, this financial information is not intended to be a complete presentation of the revenues and expenses of the May 2014 Properties Acquired. Furthermore, the information may not be representative of future operations due to changes in the business and the exclusion of the omitted information.
Historical financial statements reflecting financial position, results of operations and cash flows required by accounting principles generally accepted in the United States of America are not presented as such information is not available on an individual property basis, nor is it practicable to obtain such information in these circumstances. Accordingly, the statement of revenues and direct operating expenses is presented in lieu of the financial statements required under Rule 3-01 and Rule 3-02 of the Securities and Exchange Commission’s (“SEC”) Regulation S-X and prepared in accordance with a waiver received from the SEC. The results set forth in these statements of revenues and direct operating expenses may not be representative of future operations.
The accompanying statement of revenues and direct operating expenses for the three months ended March 31, 2013 are unaudited. The unaudited interim statement of revenues and direct operating expenses have been prepared on the same basis as the annual statement of revenues and direct operating expenses. In the opinion of management, such unaudited interim statement reflect all adjustments necessary for a fair presentation of the excess of revenues over direct operating expenses of the May 2014 Properties acquired for the three months ended March 31, 2013.
2. USE OF ESTIMATES IN PREPARATION OF THE STATEMENTS OF REVENUES AND DIRECT OPERATING EXPENSES:
The preparation of these Statements in conformity with accounting principles generally accepted in the United States requires management to make estimates and assumptions that affect the reported amounts of revenues and direct operating expenses during the respective reporting periods. Actual results may differ from the estimates and assumptions used in the preparation of the Statements.
3. COMMITMENTS AND CONTINGENCIES:
Pursuant to the terms of the Tekton Agreement, there are no known claims, litigation or disputes pending as of the effective date of the Tekton Agreement, or any matters arising in connection with indemnification, and the parties to the Tekton Agreement are not aware of any legal, environmental or other commitments or contingencies that would have a material adverse effect on the Statements.
4. REVENUE RECOGNITION:
Revenues from the sale of oil, natural gas and natural gas liquids (“NGLs”) are recognized when the product is delivered at a fixed or determinable price, title has transferred, and collectability is reasonably assured and evidenced by a contract. The Company recognizes revenues from the sale of oil, natural gas and NGL’s using the sales method of accounting, whereby revenue is recorded based on the Company’s share of volume sold, regardless of whether the Company has taken its proportional share of volume produced. A receivable or liability is recognized
NOTES TO THE STATEMENTS OF REVENUES AND DIRECT OPERATING EXPENSES (Continued)
only to the extent that the Company has an imbalance on a specific property greater than the expected remaining proved reserves. There were no gas imbalances at December 31, 2013 and March 31, 2014.
5. SUBSEQUENT EVENTS:
In accordance with Accounting Standards Codification (“ASC”) 855, we have evaluated subsequent events through June 13, 2015, the date of the accompanying statements of revenues and direct operating expenses were available to be issued. There were no material subsequent events that required recognition or additional disclosure in the accompanying statements of revenues and direct operating expenses.
6. SUPPLEMENTAL OIL AND GAS RESERVE INFORMATION (UNAUDITED):
Estimates of proved reserves are inherently imprecise and are continually subject to revision based on production history, results of additional exploration and development, price changes and other factors. All of the May 2014 Properties Acquired proved reserves are located in the continental United States.
Guidelines prescribed in Financial Accounting Standards Board’s (“FASB”) Accounting Standards Codification (“ASC”) Topic 932. Extractive Industries—Oil and Gas, have been followed for computing a standardized measure of future net cash flows and changes therein relating to estimated proved reserves. Future cash inflows and future production and development costs are determined by applying prices and costs, including transportation, quality, and basis differentials, to the year-end estimated quantities of oil and gas to be produced in the future. The resulting future net cash flows are reduced to present value amounts by applying a ten percent annual discount factor. Future operating costs are determined based on estimates of expenditures to be incurred in producing the proved oil and gas reserves in place at the end of the period using year-end costs and assuming continuation of existing economic conditions, plus overhead incurred. Future development costs are determined based on estimates of capital expenditures to be incurred in developing proved oil and gas reserves.
The assumptions used to compute the standardized measure are those prescribed by the FASB and the SEC. These assumptions do not necessarily reflect the Company’s expectations of actual revenues to be derived from those reserves, nor their present value. The limitations inherent in the reserve quantity estimation process, as discussed previously, are equally applicable to the standardized measure computations since these reserve quantity estimates are the basis for the valuation process. The Company emphasizes that reserve estimates are inherently imprecise and that estimates of new discoveries and undeveloped locations are more imprecise than estimates of established proved producing oil and gas properties. Accordingly, these estimates are expected to change as future information becomes available. The standardized measure excludes income taxes as the Company is a limited liability company and not subject to income taxes.
The changes in the May 2014 Properties Acquired proved (i.e., proved developed and undeveloped) reserves for the three months ended March 31, 2014 and the year ended December 31, 2013 are:
|
|
|
Crude Oil |
|
Natural Gas |
|
NGL |
|
|
January 1, 2013 |
|
108 |
|
140 |
|
16 |
|
|
Extensions, discoveries, and other additions |
|
2,262 |
|
4,847 |
|
545 |
|
|
Revisions |
|
114 |
|
361 |
|
30 |
|
|
Production |
|
(118 |
) |
(288 |
) |
(22 |
) |
|
December 31, 2013 |
|
2,366 |
|
5,060 |
|
569 |
|
|
Extensions, discoveries, and other additions |
|
2 |
|
1 |
|
— |
|
|
Revisions |
|
(8 |
) |
31 |
|
4 |
|
|
Production |
|
(96 |
) |
(140 |
) |
(17 |
) |
|
March 31, 2014 |
|
2,264 |
|
4,952 |
|
556 |
|
|
Proved developed reserves, included above |
|
|
|
|
|
|
|
|
December 31, 2013 |
|
994 |
|
2,588 |
|
291 |
|
|
March 31, 2014 |
|
2,264 |
|
4,952 |
|
556 |
|
|
Proved undeveloped reserves, included above |
|
|
|
|
|
|
|
|
December 31, 2013 |
|
1,372 |
|
2,472 |
|
278 |
|
|
March 31, 2014 |
|
— |
|
— |
|
— |
|
NOTES TO THE STATEMENTS OF REVENUES AND DIRECT OPERATING EXPENSES (Continued)
As of December 31, 2013, the May 2014 Properties Acquired had estimated proved reserves of 2,366 one thousand barrels (“Mbbl”) of crude oil, 5,060 one million cubic feet (“MMcf”) of natural gas and 569 Mbbl of NGLs with a standardized measure of $102.1 million. The May 2014 Properties Acquired reserves are comprised of 63% crude oil, 22% natural gas and 15% NGLs on an energy equivalent basis. The 2.3 million barrels of oil, 4.8 billion cubic feet of natural gas, and 0.5 million barrels of natural gas liquids of proved reserves added by extensions and discoveries for the year ended December 31, 2013 are due primarily due to drilling of new wells and from new proved undeveloped locations adding during the year.
The prices used for estimating proved reserves of December 31, 2013 crude oil, natural gas and NGLs reserves are $86.78 per one barrel (“bbl”), $3.50 per one thousand cubic feet (“MCF”) and $28.92 per bbl, respectively. These prices were based on the unweighted arithmetic average of the first-day-of-the-month price for the 12 months prior to December 31, 2013. The crude oil and NGL pricing was based off the West Texas Intermediate price and the natural gas pricing was based on the Henry Hub Natural Gas price. All prices have been adjusted for transportation, quality and basis differentials.
As of March 31, 2014, the May 2014 Properties Acquired had estimated proved reserves of 2,264 Mbbl of crude oil, 4,952 MMcf of natural gas and 556 Mbbl of NGLs with a standardized measure of $114.3 million. The May 2014 Properties Acquired reserves are comprised of 62% crude oil, 23% natural gas and 15% NGLs on an energy equivalent basis.
The prices used for estimating proved reserves of March 31, 2014 crude oil, natural gas and NGLs reserves are $88.30 per bbl, $3.81 per Mcf and $29.37 per bbl, respectively. These prices were based on the unweighted arithmetic average of the first-day-of-the-month price for the 12 months prior to March 31, 2014. The crude oil and NGL pricing was based off the West Texas Intermediate price and the natural gas pricing was based on the Henry Hub Natural Gas price. All prices have been adjusted for transportation, quality and basis differentials.
The May 2014 Properties Acquired future net cash flows relating to proved oil and gas reserves based on the standardized measure prescribed in ASC Topic 932 are:
|
|
|
December 31, |
|
March 31, |
| ||
|
|
|
(in thousands) |
| ||||
|
Future crude oil, natural gas and NGL sales |
|
$ |
239,528 |
|
$ |
235,140 |
|
|
Future production costs |
|
(50,633 |
) |
(51,795 |
) | ||
|
Future development costs |
|
(17,785 |
) |
— |
| ||
|
Future net cash flows |
|
171,110 |
|
183,345 |
| ||
|
10% annual discount |
|
(69,004 |
) |
(69,074 |
) | ||
|
Standardized measure of discounted future net cash flows |
|
$ |
102,106 |
|
$ |
114,271 |
|
The principal sources of change in the standardized measure of discounted future net cash flows are:
|
|
|
December 31, 2013 |
|
March 31, |
| ||
|
|
|
(in thousands) |
| ||||
|
Balance at beginning of period |
|
$ |
4,509 |
|
$ |
102,106 |
|
|
Sales of crude oil, natural gas and NGLs |
|
(10,410 |
) |
(7,728 |
) | ||
|
Net change in prices and production costs |
|
1,727 |
|
1,525 |
| ||
|
Extensions and discoveries |
|
97,794 |
|
130 |
| ||
|
Revisions of previous quantity estimates |
|
6,029 |
|
30 |
| ||
|
Previously estimated development costs incurred |
|
— |
|
17,785 |
| ||
|
Accretion of discount |
|
451 |
|
2,553 |
| ||
|
Other |
|
2,006 |
|
(2,130 |
) | ||
|
Balance at end of period |
|
$ |
102,106 |
|
$ |
114,271 |
|
REPORT OF INDEPENDENT REGISTERED PUBLIC ACCOUNTING FIRM
To the Board of Directors and Members
Extraction Oil & Gas, LLC
We have audited the accompanying statements of revenues and direct operating expenses of properties acquired by Extraction Oil & Gas, LLC for the years ended December 31, 2013 and 2012 (the “Statements”). The Statements are the responsibility of the Company’s management. Our responsibility is to express an opinion on the Statements based on our audit.
We conducted our audit in accordance with the standards of the Public Company Accounting Oversight Board (United States). Those standards require that we plan and perform the audit to obtain reasonable assurance about whether the Statements are free of material misstatement. An audit also includes examining, on a test basis, evidence supporting the amounts and disclosures in the Statements, assessing the accounting principles used and significant estimates made by management, as well as evaluating the overall Statements presentation. We believe that our audit provides a reasonable basis for our opinion.
The accompanying Statements were prepared for the purpose of complying with the rules and regulations of the Securities and Exchange Commission as described in Note 1 and is not intended to be a complete presentation of the properties’ revenues and expenses.
In our opinion, the Statements referred to above presents fairly, in all material respects, the revenues and direct operating expenses of properties acquired by Extraction Oil & Gas, LLC for the years ended December 31, 2013 and 2012 in conformity with accounting principles generally accepted in the United States of America.
Hein & Associates LLP
Denver, Colorado
June 4, 2015
STATEMENTS OF REVENUES AND DIRECT OPERATING
EXPENSES OF JULY 2014 PROPERTIES ACQUIRED BY EXTRACTION OIL & GAS, LLC
|
|
|
For the Years Ended |
|
For the Six-Month |
| ||||||||
|
|
|
December 31, |
|
December 31, |
|
June 30, |
|
June 30, |
| ||||
|
|
|
(in thousands) |
| ||||||||||
|
|
|
|
|
|
|
(unaudited) |
| ||||||
|
Revenues: |
|
|
|
|
|
|
|
|
| ||||
|
Oil sales |
|
$ |
11,426 |
|
$ |
4,291 |
|
$ |
7,132 |
|
$ |
4,635 |
|
|
Natural gas sales |
|
1,282 |
|
926 |
|
978 |
|
562 |
| ||||
|
NGL sales |
|
597 |
|
80 |
|
607 |
|
197 |
| ||||
|
Total revenues |
|
13,305 |
|
5,297 |
|
8,717 |
|
5,394 |
| ||||
|
Direct Operating Expenses: |
|
|
|
|
|
|
|
|
| ||||
|
Lease operating expense |
|
2,289 |
|
344 |
|
1,480 |
|
1,059 |
| ||||
|
Production taxes |
|
1,319 |
|
510 |
|
726 |
|
568 |
| ||||
|
Total direct operating expenses |
|
3,608 |
|
854 |
|
2,206 |
|
1,627 |
| ||||
|
Revenues in Excess of Direct Operating Expenses |
|
$ |
9,697 |
|
$ |
4,443 |
|
$ |
6,511 |
|
$ |
3,767 |
|
SEE THE ACCOMPANYING NOTES TO THE STATEMENT OF REVENUES AND DIRECT OPERATING EXPENSES
NOTES TO THE STATEMENTS OF REVENUES AND DIRECT OPERATING EXPENSES
1. BASIS OF PRESENTATION:
On May 23, 2014, Extraction Oil & Gas, LLC (the “Company”), entered into a definitive purchase and sale agreement (the “Sundance Agreement”) with Sundance Energy Inc. (the “Seller”), under which the Company agreed to acquire interests in approximately 9,000 net acres of leaseholds, and related producing properties located primarily in Weld County, Colorado (the “July 2014 Properties Acquired”), along with various other related rights, permits, contracts, equipment and other assets. The Seller received aggregate consideration of approximately $113.4 million in cash. The closing of the acquisition of the July 2014 Properties Acquired was on July 28, 2014.
The accompanying Statements of Revenues and Direct Operating Expenses (the “Statements”) are presented on an accrual basis of accounting and relate to the operations of the July 2014 Properties Acquired and have been derived from the historical accounting records. Certain costs such as depreciation, depletion, and amortization, accretion of asset retirement obligations, general and administrative expenses, interest and corporate income taxes are omitted. As such, this financial information is not intended to be a complete presentation of the revenues and expenses of the July 2014 Properties Acquired. Furthermore, the information may not be representative of future operations due to changes in the business and the exclusion of the omitted information.
The financial information for the six months ended June 30, 2014 and 2013 is unaudited. In the opinion of management, this information contains all adjustments, consisting only of normal recurring accruals necessary for fair statements of the revenues and direct operating expenses for the periods presented in accordance with the indicated basis of presentation. The revenues and direct operating expenses for interim periods are not necessarily indicative of the revenues and direct operating expenses for the full fiscal year.
2. USE OF ESTIMATES IN PREPARATION OF THE STATEMENTS OF REVENUES AND DIRECT OPERATING EXPENSES:
The preparation of these Statements in conformity with accounting principles generally accepted in the United States requires management to make estimates and assumptions that affect the reported amounts of revenues and direct operating expenses during the respective reporting periods. Actual results may differ from the estimates and assumptions used in the preparation of the Statements.
3. COMMITMENTS AND CONTINGENCIES:
Pursuant to the terms of the Sundance Agreement, there are no known claims, litigation or disputes pending as of the effective date of the Sundance Agreement, or any matters arising in connection with indemnification, and the parties to the Sundance Agreement are not aware of any legal, environmental or other commitments or contingencies that would have a material adverse effect on the Statements.
4. REVENUE RECOGNITION:
Revenues from the sale of oil, natural gas and natural gas liquids (“NGLs”) are recognized when the product is delivered at a fixed or determinable price, title has transferred, and collectability is reasonably assured and evidenced by a contract. The Company recognizes revenues from the sale of oil, natural gas and NGL’s using the sales method of accounting, whereby revenue is recorded based on the Company’s share of volume sold, regardless of whether the Company has taken its proportional share of volume produced. A receivable or liability is recognized only to the extent that the Company has an imbalance on a specific property greater than the expected remaining proved reserves. There were no gas imbalances at December 31, 2013 and 2012 and June 30, 2014 and 2013.
5. SUBSEQUENT EVENTS:
In accordance with Accounting Standards Codification (“ASC”) 855, we have evaluated subsequent events through June 4, 2015, the date of the accompanying statements of revenues and direct operating expenses were available to be issued. There were no material subsequent events that required recognition or additional disclosure in the accompanying statements of revenues and direct operating expenses.
NOTES TO THE STATEMENTS OF REVENUES AND DIRECT OPERATING EXPENSES (Continued)
6. SUPPLEMENTAL OIL AND GAS RESERVE INFORMATION (UNAUDITED):
Estimates of proved reserves are inherently imprecise and are continually subject to revision based on production history, results of additional exploration and development, price changes and other factors. All of the July 2014 Properties Acquired proved reserves are located in the continental United States.
Guidelines prescribed in Financial Accounting Standards Board’s (“FASB”) Accounting Standards Codification (“ASC”) Topic 932. Extractive Industries—Oil and Gas, have been followed for computing a standardized measure of future net cash flows and changes therein relating to estimated proved reserves. Future cash inflows and future production and development costs are determined by applying prices and costs, including transportation, quality, and basis differentials, to the year-end estimated quantities of oil and gas to be produced in the future. The resulting future net cash flows are reduced to present value amounts by applying a ten percent annual discount factor. Future operating costs are determined based on estimates of expenditures to be incurred in producing the proved oil and gas reserves in place at the end of the period using year-end costs and assuming continuation of existing economic conditions, plus overhead incurred. Future development costs are determined based on estimates of capital expenditures to be incurred in developing proved oil and gas reserves.
The assumptions used to compute the standardized measure are those prescribed by the FASB and the SEC. These assumptions do not necessarily reflect the Company’s expectations of actual revenues to be derived from those reserves, nor their present value. The limitations inherent in the reserve quantity estimation process, as discussed previously, are equally applicable to the standardized measure computations since these reserve quantity estimates are the basis for the valuation process. The Company emphasizes that reserve estimates are inherently imprecise and that estimates of new discoveries and undeveloped locations are more imprecise than estimates of established proved producing oil and gas properties. Accordingly, these estimates are expected to change as future information becomes available. The standardized measure excludes income taxes as the Company is a limited liability company and not subject to income taxes.
The changes in the July 2014 Properties Acquired proved (i.e., proved developed and undeveloped) reserves for the year ended December 31, 2013 and 2012 are:
|
|
|
Crude Oil |
|
Natural Gas |
|
NGL |
|
|
January 1, 2012 |
|
1,060 |
|
3,386 |
|
380 |
|
|
Revisions |
|
(17 |
) |
61 |
|
(19 |
) |
|
Production |
|
(50 |
) |
(255 |
) |
(2 |
) |
|
December 31, 2012 |
|
993 |
|
3,192 |
|
359 |
|
|
Revisions |
|
(94 |
) |
(9 |
) |
(21 |
) |
|
Production |
|
(126 |
) |
(313 |
) |
(16 |
) |
|
December 31, 2013 |
|
773 |
|
2,870 |
|
322 |
|
|
Proved developed reserves, included above |
|
|
|
|
|
|
|
|
December 31, 2012 |
|
308 |
|
1,552 |
|
175 |
|
|
December 31, 2013 |
|
401 |
|
1,634 |
|
184 |
|
|
Proved undeveloped reserves, included above |
|
|
|
|
|
|
|
|
December 31, 2012 |
|
685 |
|
1,640 |
|
184 |
|
|
December 31, 2013 |
|
372 |
|
1,236 |
|
138 |
|
As of December 31, 2012, the July 2014 Properties Acquired had estimated proved reserves of 993 one thousand barrels (“Mbbl”) of crude oil, 3,192 one million cubic feet (“MMcf”) of natural gas and 359 Mbbl of NGLs with a standardized measure of $26.8 million. The July 2014 Properties Acquired reserves are comprised of 53% crude oil, 28% natural gas and 19% NGLs on an energy equivalent basis.
The prices used for estimating proved reserves of December 31, 2012 crude oil, natural gas and NGLs reserves are $84.71 per one barrel (“bbl”), $2.63 per one thousand cubic feet (“Mcf”) and $28.30 per bbl, respectively. These prices were based on the unweighted arithmetic average of the first-day-of-the-month price for the 12 months prior to December 31, 2012. The crude oil and NGL pricing was based off the West Texas Intermediate price and the natural gas pricing was based on the Henry Hub Natural Gas price. All prices have been adjusted for transportation, quality and basis differentials.
NOTES TO THE STATEMENTS OF REVENUES AND DIRECT OPERATING EXPENSES (Continued)
As of December 31, 2013, the July 2014 Properties Acquired had estimated proved reserves of 773 Mbbl of crude oil, 2,870 MMcf of natural gas and 322 Mbbl of NGLs with a standardized measure of $27.9 million. The July 2014 Properties Acquired reserves are comprised of 50% crude oil, 30% natural gas and 20% NGLs on an energy equivalent basis.
The prices used for estimating proved reserves of December 31, 2013 crude oil, natural gas and NGLs reserves are $86.91 per bbl, $3.50 per Mcf and $28.96 per bbl, respectively. These prices were based on the unweighted arithmetic average of the first-day-of-the-month price for the 12 months prior to December 31, 2013. The crude oil and NGL pricing was based off the West Texas Intermediate price and the natural gas pricing was based on the Henry Hub Natural Gas price. All prices have been adjusted for transportation, quality and basis differentials.
The following summary sets forth the July 2014 Properties Acquired future net cash flows relating to proved oil and gas reserves based on the standardized measure prescribed in ASC Topic 932 are:
|
|
|
December 31, |
|
December 31, |
| ||
|
|
|
(in thousands) |
| ||||
|
Future crude oil, natural gas and NGL sales |
|
$ |
86,614 |
|
$ |
102,707 |
|
|
Future production costs |
|
(24,124 |
) |
(27,057 |
) | ||
|
Future development costs |
|
(12,834 |
) |
(22,446 |
) | ||
|
Future net cash flows |
|
49,656 |
|
53,204 |
| ||
|
10% annual discount |
|
(21,724 |
) |
(26,417 |
) | ||
|
Standardized measure of discounted future net cash flows |
|
$ |
27,932 |
|
$ |
26,787 |
|
The principal sources of change in the standardized measure of discounted future net cash flows are:
|
|
|
December 31, |
|
December 31, |
| ||
|
|
|
(in thousands) |
| ||||
|
Balance at beginning of period |
|
$ |
26,787 |
|
$ |
23,896 |
|
|
Sales of crude oil, natural gas and NGLs |
|
(9,697 |
) |
(4,443 |
) | ||
|
Net change in prices and production costs |
|
1,565 |
|
(2,390 |
) | ||
|
Net changes in future development costs |
|
1,774 |
|
1,159 |
| ||
|
Revisions of previous quantity estimates |
|
(1,656 |
) |
(309 |
) | ||
|
Previously estimated development costs incurred |
|
6,088 |
|
6,168 |
| ||
|
Accretion of discount |
|
2,679 |
|
2,390 |
| ||
|
Other |
|
392 |
|
316 |
| ||
|
Balance at end of period |
|
$ |
27,932 |
|
$ |
26,787 |
|
REPORT OF INDEPENDENT REGISTERED PUBLIC ACCOUNTING FIRM
To the Board of Directors and Members
Extraction Oil & Gas, LLC
We have audited the accompanying statements of revenues and direct operating expenses of properties acquired by Extraction Oil & Gas, LLC for the years ended December 31, 2013 and 2012 (the “Statements”). The Statements are the responsibility of the Company’s management. Our responsibility is to express an opinion on the Statements based on our audit.
We conducted our audit in accordance with the standards of the Public Company Accounting Oversight Board (United States). Those standards require that we plan and perform the audit to obtain reasonable assurance about whether the Statements are free of material misstatement. An audit also includes examining, on a test basis, evidence supporting the amounts and disclosures in the Statements, assessing the accounting principles used and significant estimates made by management, as well as evaluating the overall Statements presentation. We believe that our audit provides a reasonable basis for our opinion.
The accompanying Statements were prepared for the purpose of complying with the rules and regulations of the Securities and Exchange Commission as described in Note 1 and is not intended to be a complete presentation of the properties’ revenues and expenses.
In our opinion, the Statements referred to above presents fairly, in all material respects, the revenues and direct operating expenses of properties acquired by Extraction Oil & Gas, LLC for the years ended December 31, 2013 and 2012 in conformity with accounting principles generally accepted in the United States of America.
Hein & Associates LLP
Denver, Colorado
June 4, 2015
STATEMENTS OF REVENUES AND DIRECT OPERATING EXPENSES
OF AUGUST 2014 PROPERTIES ACQUIRED BY EXTRACTION OIL & GAS, LLC
|
|
|
For the Years Ended |
|
For the Six-Month Periods |
| ||||||||
|
|
|
December 31, |
|
December 31, |
|
June 30, |
|
June 30, |
| ||||
|
|
|
(in thousands) |
| ||||||||||
|
|
|
|
|
|
|
(unaudited) |
| ||||||
|
Revenues: |
|
|
|
|
|
|
|
|
| ||||
|
Oil sales |
|
$ |
11,483 |
|
$ |
4,682 |
|
$ |
7,337 |
|
$ |
6,135 |
|
|
Natural gas sales |
|
2,597 |
|
1,799 |
|
2,148 |
|
1,410 |
| ||||
|
NGL sales |
|
2,240 |
|
1,933 |
|
1,864 |
|
1,234 |
| ||||
|
Total revenues |
|
16,320 |
|
8,414 |
|
11,349 |
|
8,779 |
| ||||
|
Direct Operating Expenses: |
|
|
|
|
|
|
|
|
| ||||
|
Lease operating expense |
|
2,268 |
|
812 |
|
820 |
|
1,223 |
| ||||
|
Production taxes |
|
1,066 |
|
455 |
|
802 |
|
569 |
| ||||
|
Total direct operating expenses |
|
3,334 |
|
1,267 |
|
1,622 |
|
1,792 |
| ||||
|
Revenues in Excess of Direct Operating Expenses |
|
$ |
12,986 |
|
$ |
7,147 |
|
$ |
9,727 |
|
$ |
6,987 |
|
SEE THE ACCOMPANYING NOTES TO THE STATEMENTS OF REVENUES AND DIRECT OPERATING EXPENSES
NOTES TO THE STATEMENTS OF REVENUES AND DIRECT OPERATING EXPENSES
1. BASIS OF PRESENTATION:
On June 16, 2014, Extraction Oil & Gas, LLC (the “Company”), entered into a definitive purchase and sale agreement (the “Mineral Agreement”) with Mineral Resources, Inc. and Richmark Energy Partners, LLC (collectively, the “Seller”), under which the Company agreed to acquire interests in approximately 6,400 net acres of leaseholds, and related producing properties located primarily in Weld County, Colorado (the “August 2014 Properties Acquired”), along with various other related rights, permits, contracts, equipment and other assets. The Seller received aggregate consideration of approximately $297.1 million in cash. The effective date for the acquisition was March 1, 2014, with purchase price adjustments calculated as of the closing date on August 21, 2014.
The accompanying Statements of Revenues and Direct Operating Expenses (the “Statements”) are presented on an accrual basis of accounting and relate to the operations of the August 2014 Properties Acquired and have been derived from the historical accounting records. Certain costs such as depreciation, depletion, and amortization, accretion of asset retirement obligations, general and administrative expenses, interest and corporate income taxes are omitted. As such, this financial information is not intended to be a complete presentation of the revenues and expenses of the August 2014 Properties Acquired. Furthermore, the information may not be representative of future operations due to changes in the business and the exclusion of the omitted information.
The financial information for the six months ended June 30, 2014 and 2013 is unaudited. In the opinion of management, this information contains all adjustments, consisting only of normal recurring accruals necessary for fair statements of the revenues and direct operating expenses for the periods presented in accordance with the indicated basis of presentation. The revenues and direct operating expenses for interim periods are not necessarily indicative of the revenues and direct operating expenses for the full fiscal year.
2. USE OF ESTIMATES IN PREPARATION OF THE STATEMENTS OF REVENUES AND DIRECT OPERATING EXPENSES:
The preparation of these Statements in conformity with accounting principles generally accepted in the United States requires management to make estimates and assumptions that affect the reported amounts of revenues and direct operating expenses during the respective reporting periods. Actual results may differ from the estimates and assumptions used in the preparation of the Statements.
3. COMMITMENTS AND CONTINGENCIES:
Pursuant to the terms of the Mineral Agreement, there are no known claims, litigation or disputes pending as of the effective date of the Mineral Agreement, or any matters arising in connection with indemnification, and the parties to the Mineral Agreement are not aware of any legal, environmental or other commitments or contingencies that would have a material adverse effect on the Statements.
4. REVENUE RECOGNITION:
Revenues from the sale of oil, natural gas and natural gas liquids (“NGLs”) are recognized when the product is delivered at a fixed or determinable price, title has transferred, and collectability is reasonably assured and evidenced by a contract. The Company recognizes revenues from the sale of oil, natural gas and NGL’s using the sales method of accounting, whereby revenue is recorded based on the Company’s share of volume sold, regardless of whether the Company has taken its proportional share of volume produced. A receivable or liability is recognized only to the extent that the Company has an imbalance on a specific property greater than the expected remaining proved reserves. There were no gas imbalances at December 31, 2013 and 2012 and June 30, 2014 and 2013.
5. SUBSEQUENT EVENTS:
In accordance with Accounting Standards Codification (“ASC”) 855, we have evaluated subsequent events through June 4, 2015, the date of the accompanying statements of revenues and direct operating expenses were
NOTES TO THE STATEMENTS OF REVENUES AND DIRECT OPERATING EXPENSES (Continued)
available to be issued. There were no material subsequent events that required recognition or additional disclosure in the accompanying statements of revenues and direct operating expenses.
6. SUPPLEMENTAL OIL AND GAS RESERVE INFORMATION (UNAUDITED):
Estimates of proved reserves are inherently imprecise and are continually subject to revision based on production history, results of additional exploration and development, price changes and other factors. All of the August 2014 Properties Acquired proved reserves are located in the continental United States.
Guidelines prescribed in Financial Accounting Standards Board’s (“FASB”) Accounting Standards Codification (“ASC”) Topic 932. Extractive Industries—Oil and Gas, have been followed for computing a standardized measure of future net cash flows and changes therein relating to estimated proved reserves. Future cash inflows and future production and development costs are determined by applying prices and costs, including transportation, quality, and basis differentials, to the year-end estimated quantities of oil and gas to be produced in the future. The resulting future net cash flows are reduced to present value amounts by applying a ten percent annual discount factor. Future operating costs are determined based on estimates of expenditures to be incurred in producing the proved oil and gas reserves in place at the end of the period using year-end costs and assuming continuation of existing economic conditions, plus overhead incurred. Future development costs are determined based on estimates of capital expenditures to be incurred in developing proved oil and gas reserves.
The assumptions used to compute the standardized measure are those prescribed by the FASB and the SEC. These assumptions do not necessarily reflect the Company’s expectations of actual revenues to be derived from those reserves, nor their present value. The limitations inherent in the reserve quantity estimation process, as discussed previously, are equally applicable to the standardized measure computations since these reserve quantity estimates are the basis for the valuation process. The Company emphasizes that reserve estimates are inherently imprecise and that estimates of new discoveries and undeveloped locations are more imprecise than estimates of established proved producing oil and gas properties. Accordingly, these estimates are expected to change as future information becomes available. The standardized measure excludes income taxes as the Company is a limited liability company and not subject to income taxes.
The changes in the August 2014 Properties Acquired proved (i.e., proved developed and undeveloped) reserves for the year ended December 31, 2013 and 2012 are:
|
|
|
Crude Oil |
|
Natural Gas |
|
NGL |
|
|
January 1, 2012 |
|
1,522 |
|
11,262 |
|
1,265 |
|
|
Revisions |
|
(43 |
) |
(737 |
) |
(138 |
) |
|
Production |
|
(55 |
) |
(717 |
) |
(27 |
) |
|
December 31, 2012 |
|
1,424 |
|
9,808 |
|
1,100 |
|
|
Revisions |
|
(30 |
) |
(355 |
) |
(81 |
) |
|
Production |
|
(127 |
) |
(748 |
) |
(40 |
) |
|
December 31, 2013 |
|
1,267 |
|
8,705 |
|
979 |
|
|
Proved developed reserves, included above |
|
|
|
|
|
|
|
|
December 31, 2012 |
|
375 |
|
5,259 |
|
589 |
|
|
December 31, 2013 |
|
506 |
|
5,826 |
|
655 |
|
|
Proved undeveloped reserves, included above |
|
|
|
|
|
|
|
|
December 31, 2012 |
|
1,049 |
|
4,549 |
|
511 |
|
|
December 31, 2013 |
|
761 |
|
2,879 |
|
324 |
|
As of December 31, 2012, the August 2014 Properties Acquired had estimated proved reserves of 1,424 one thousand barrels (“Mbbl”) of crude oil, 9,808 one million cubic feet (“MMcf”) of natural gas and 1,100 Mbbl of NGLs with a standardized measure of $64.4 million. The August 2014 Properties Acquired reserves are comprised of 34% crude oil, 39% natural gas and 27% NGLs on an energy equivalent basis.
The prices used for estimating proved reserves of December 31, 2012 crude oil, natural gas and NGLs reserves are $84.71 per one barrel (“bbl”), $2.63 per one thousand cubic feet (“Mcf”) and $28.30 per bbl, respectively. These prices were based on the unweighted arithmetic average of the first-day-of-the-month price for the 12 months prior to December 31, 2012. The crude oil and NGL pricing was based off the West Texas Intermediate price and the
NOTES TO THE STATEMENTS OF REVENUES AND DIRECT OPERATING EXPENSES (Continued)
natural gas pricing was based on the Henry Hub Natural Gas price. All prices have been adjusted for transportation, quality and basis differentials.
As of December 31, 2013, the August 2014 Properties Acquired had estimated proved reserves of 1,267 Mbbl of crude oil, 8,705 MMcf of natural gas and 979 Mbbl of NGLs with a standardized measure of $68.1 million. The August 2014 Properties Acquired reserves are comprised of 34% crude oil, 39% natural gas and 27% NGLs on an energy equivalent basis.
The prices used for estimating proved reserves of December 31, 2013 crude oil, natural gas and NGLs reserves are $86.91 per bbl, $3.50 per Mcf and $28.96 per bbl, respectively. These prices were based on the unweighted arithmetic average of the first-day-of-the-month price for the 12 months prior to December 31, 2013. The crude oil and NGL pricing was based off the West Texas Intermediate price and the natural gas pricing was based on the Henry Hub Natural Gas price. All prices have been adjusted for transportation, quality and basis differentials.
The August 2014 Properties Acquired future net cash flows relating to proved oil and gas reserves based on the standardized measure prescribed in ASC Topic 932 are:
|
|
|
December 31, |
|
December 31, |
| ||
|
|
|
(in thousands) |
| ||||
|
Future crude oil, natural gas and NGLs sales |
|
$ |
168,953 |
|
$ |
177,628 |
|
|
Future production costs |
|
(38,169 |
) |
(39,166 |
) | ||
|
Future development costs |
|
(9,605 |
) |
(16,843 |
) | ||
|
Future net cash flows |
|
121,179 |
|
121,619 |
| ||
|
10% annual discount |
|
(53,067 |
) |
(57,219 |
) | ||
|
Standardized measure of discounted future net cash flows |
|
$ |
68,112 |
|
$ |
64,400 |
|
The principal sources of change in the standardized measure of discounted future net cash flows are:
|
|
|
December 31, |
|
December 31, |
| ||
|
|
|
(in thousands) |
| ||||
|
Balance at beginning of period |
|
$ |
64,400 |
|
$ |
72,836 |
|
|
Sales of crude oil, natural gas and NGLs |
|
(12,986 |
) |
(7,147 |
) | ||
|
Net change in prices and production costs |
|
7,364 |
|
(5,335 |
) | ||
|
Revisions of previous quantity estimates |
|
(2,648 |
) |
(4,747 |
) | ||
|
Previously estimated development costs incurred |
|
7,239 |
|
3,845 |
| ||
|
Accretion of discount |
|
6,440 |
|
7,284 |
| ||
|
Other |
|
(1,697 |
) |
(2,336 |
) | ||
|
Balance at end of period |
|
$ |
68,112 |
|
$ |
64,400 |
|
REPORT OF INDEPENDENT REGISTERED PUBLIC ACCOUNTING FIRM
To the Board of Directors and Members
Extraction Oil & Gas, LLC
We have audited the accompanying statements of revenues and direct operating expenses of properties acquired by Extraction Oil & Gas, LLC for the nine months ended September 30, 2014 and the year ended December 31, 2013 (the “Statements”). The Statements are the responsibility of the Company’s management. Our responsibility is to express an opinion on the Statements based on our audits.
We conducted our audits in accordance with the standards of the Public Company Accounting Oversight Board (United States). Those standards require that we plan and perform the audits to obtain reasonable assurance about whether the Statements are free of material misstatement. An audit also includes examining, on a test basis, evidence supporting the amounts and disclosures in the Statements, assessing the accounting principles used and significant estimates made by management, as well as evaluating the overall Statement presentation. We believe that our audits provide a reasonable basis for our opinion.
The accompanying Statements were prepared for the purpose of complying with the rules and regulations of the Securities and Exchange Commission as described in Note 1 and is not intended to be a complete presentation of the properties’ revenues and expenses.
In our opinion, the Statements referred to above present fairly, in all material respects, the revenues and direct operating expenses of properties acquired by Extraction Oil & Gas, LLC for the nine months ended September 30, 2014 and the year ended December 31, 2013 in conformity with accounting principles generally accepted in the United States of America.
Hein & Associates LLP
Denver, Colorado
June 4, 2015
STATEMENTS OF REVENUES AND DIRECT OPERATING EXPENSES
OF OCTOBER 2014 PROPERTIES ACQUIRED BY EXTRACTION OIL & GAS, LLC
|
|
|
For the Year |
|
For the Nine-Month Periods |
| |||||
|
|
|
December 31, |
|
September 30, |
|
September 30, |
| |||
|
|
|
|
|
|
|
(in thousands) |
| |||
|
|
|
|
|
|
|
(unaudited) |
| |||
|
Revenues: |
|
|
|
|
|
|
| |||
|
Oil sales |
|
$ |
585 |
|
$ |
746 |
|
$ |
394 |
|
|
Natural gas sales |
|
21 |
|
34 |
|
13 |
| |||
|
NGL sales |
|
2 |
|
1 |
|
1 |
| |||
|
Total revenues |
|
608 |
|
781 |
|
408 |
| |||
|
Direct Operating Expenses: |
|
|
|
|
|
|
| |||
|
Lease operating expense |
|
52 |
|
133 |
|
37 |
| |||
|
Production taxes |
|
54 |
|
68 |
|
36 |
| |||
|
Total direct operating expenses |
|
106 |
|
201 |
|
73 |
| |||
|
Revenues in Excess of Direct Operating Expenses |
|
$ |
502 |
|
$ |
580 |
|
$ |
335 |
|
SEE THE ACCOMPANYING NOTES TO THE STATEMENTS OF REVENUES AND DIRECT OPERATING EXPENSES
NOTES TO THE STATEMENTS OF REVENUES AND DIRECT OPERATING EXPENSES
1. BASIS OF PRESENTATION:
On August 20, 2014, Extraction Oil & Gas, LLC (the “Company”), entered into a definitive purchase and sale agreement (the “Bayswater Agreement”) with Bayswater Exploration &Production, LLC, Bayswater Blenheim Holdings, LLC and Bayswater Blenheim Holdings II, LLC (collectively, the “Seller”), under which the Company agreed to acquire interests in 29 producing properties located primarily in Weld County, Colorado (the “October 2014 Properties Acquired”), along with various other related rights, permits, contracts and equipment. The Seller received aggregate consideration of approximately $1.3 million in cash. Additionally, as part of the Bayswater Agreement, the Company acquired unproved acreage located primarily in Weld County, Colorado for approximately $76.5 million. The effective date for the acquisition was July 1, 2014, with purchase price adjustments calculated as of the closing date on October 15, 2014.
The accompanying Statements of Revenues and Direct Operating Expenses (the “Statements”) are presented on an accrual basis of accounting and relate to the operations of the October 2014 Properties Acquired and have been derived from the historical accounting records. Certain costs such as depreciation, depletion, and amortization, accretion of asset retirement obligations, general and administrative expenses, interest and corporate income taxes are omitted. As such, this financial information is not intended to be a complete presentation of the revenues and expenses of the October 2014 Properties Acquired. Furthermore, the information may not be representative of future operations due to changes in the business and the exclusion of the omitted information.
The financial information for the nine-month period ended September 30, 2013 is unaudited. In the opinion of management, this information contains all adjustments, consisting only of normal recurring accruals necessary for fair statements of the revenues and direct operating expenses for the periods presented in accordance with the indicated basis of presentation. The revenues and direct operating expenses for interim periods are not necessarily indicative of the revenues and direct operating expenses for the full fiscal year.
2. USE OF ESTIMATES IN PREPARATION OF THE STATEMENTS OF REVENUES AND DIRECT OPERATING EXPENSES:
The preparation of these Statements in conformity with accounting principles generally accepted in the United States requires management to make estimates and assumptions that affect the reported amounts of revenues and direct operating expenses during the respective reporting periods. Actual results may differ from the estimates and assumptions used in the preparation of the Statements.
3. COMMITMENTS AND CONTINGENCIES:
Pursuant to the terms of the Bayswater Agreement, there are no known claims, litigation or disputes pending as of the effective date of the Bayswater Agreement, or any matters arising in connection with indemnification, and the parties to the Bayswater Agreement are not aware of any legal, environmental or other commitments or contingencies that would have a material adverse effect on the Statements.
4. REVENUE RECOGNITION:
Revenues from the sale of oil, natural gas and natural gas liquids (“NGLs”) are recognized when the product is delivered at a fixed or determinable price, title has transferred, and collectability is reasonably assured and evidenced by a contract. The Company recognizes revenues from the sale of oil, natural gas and NGL’s using the sales method of accounting, whereby revenue is recorded based on the Company’s share of volume sold, regardless of whether the Company has taken its proportional share of volume produced. A receivable or liability is recognized only to the extent that the Company has an imbalance on a specific property greater than the expected remaining proved reserves. There were no gas imbalances at December 31, 2013 and September 30, 2014 and 2013.
5. SUBSEQUENT EVENTS:
In accordance with Accounting Standards Codification (“ASC”) 855, we have evaluated subsequent events through June 4, 2015, the date of the accompanying statements of revenues and direct operating expenses were
NOTES TO THE STATEMENTS OF REVENUES AND DIRECT OPERATING EXPENSES (Continued)
available to be issued. There were no material subsequent events that required recognition or additional disclosure in the accompanying statements of revenues and direct operating expenses.
6. SUPPLEMENTAL OIL AND GAS RESERVE INFORMATION (UNAUDITED):
Estimates of proved reserves are inherently imprecise and are continually subject to revision based on production history, results of additional exploration and development, price changes and other factors. All of the October 2014 Properties Acquired proved reserves are located in the continental United States.
Guidelines prescribed in Financial Accounting Standards Board’s (“FASB”) Accounting Standards Codification (“ASC”) Topic 932. Extractive Industries—Oil and Gas, have been followed for computing a standardized measure of future net cash flows and changes therein relating to estimated proved reserves. Future cash inflows and future production and development costs are determined by applying prices and costs, including transportation, quality, and basis differentials, to the year-end estimated quantities of oil and gas to be produced in the future. The resulting future net cash flows are reduced to present value amounts by applying a ten percent annual discount factor. Future operating costs are determined based on estimates of expenditures to be incurred in producing the proved oil and gas reserves in place at the end of the period using year-end costs and assuming continuation of existing economic conditions, plus overhead incurred. Future development costs are determined based on estimates of capital expenditures to be incurred in developing proved oil and gas reserves.
The assumptions used to compute the standardized measure are those prescribed by the FASB and the SEC. These assumptions do not necessarily reflect the Company’s expectations of actual revenues to be derived from those reserves, nor their present value. The limitations inherent in the reserve quantity estimation process, as discussed previously, are equally applicable to the standardized measure computations since these reserve quantity estimates are the basis for the valuation process. The Company emphasizes that reserve estimates are inherently imprecise and that estimates of new discoveries and undeveloped locations are more imprecise than estimates of established proved producing oil and gas properties. Accordingly, these estimates are expected to change as future information becomes available. The standardized measure excludes income taxes as the Company is a limited liability company and not subject to income taxes.
The changes in the October 2014 Properties Acquired proved (i.e., proved developed and undeveloped) reserves for the nine months ended September 30, 2014 and the year ended December 31, 2013 are:
|
|
|
Crude Oil |
|
Natural Gas |
|
NGL |
|
|
January 1, 2013 |
|
259 |
|
277 |
|
31 |
|
|
Revisions |
|
8 |
|
— |
|
(1 |
) |
|
Production |
|
(7 |
) |
(5 |
) |
— |
|
|
December 31, 2013 |
|
260 |
|
272 |
|
30 |
|
|
Extensions, discoveries, and other additions |
|
1,158 |
|
2,907 |
|
327 |
|
|
Revisions |
|
44 |
|
46 |
|
5 |
|
|
Production |
|
(8 |
) |
(7 |
) |
— |
|
|
September 30, 2014 |
|
1,454 |
|
3,218 |
|
362 |
|
|
Proved developed reserves, included above |
|
|
|
|
|
|
|
|
December 31, 2012 |
|
131 |
|
109 |
|
12 |
|
|
September 30, 2014 |
|
296 |
|
311 |
|
35 |
|
|
Proved undeveloped reserves, included above |
|
|
|
|
|
|
|
|
December 31, 2012 |
|
129 |
|
163 |
|
18 |
|
|
September 30, 2014 |
|
1,158 |
|
2,907 |
|
327 |
|
As of December 31, 2013, the October 2014 Properties Acquired had estimated proved reserves of 260 one thousand barrels (“Mbbl”) of crude oil, 272 one million cubic feet (“MMcf”) of natural gas and 30 Mbbl of NGLs with a standardized measure of $7.7 million. The October 2014 Properties Acquired reserves are comprised of 77% crude oil, 14% natural gas and 9% NGLs on an energy equivalent basis.
The prices used for estimating proved reserves of December 31, 2013 crude oil, natural gas and NGLs reserves are $83.42 per one barrel (“bbl”), $3.51 per one thousand cubic feet (“MCF”) and $27.93 per bbl, respectively.
NOTES TO THE STATEMENTS OF REVENUES AND DIRECT OPERATING EXPENSES (Continued)
These prices were based on the unweighted arithmetic average of the first-day-of-the-month price for the 12 months prior to December 31, 2013. The crude oil and NGL pricing was based off the West Texas Intermediate price and the natural gas pricing was based on the Henry Hub Natural Gas price. All prices have been adjusted for transportation, quality and basis differentials.
As of September 30, 2014, the October 2014 Properties Acquired had estimated proved reserves of 1,454 Mbbl of crude oil, 3,218 MMcf of natural gas and 362 Mbbl of NGLs with a standardized measure of $28.9 million. The October 2014 Properties Acquired reserves are comprised of 62% crude oil, 23% natural gas and 15% NGLs on an energy equivalent basis.
The prices used for estimating proved reserves of September 30, 2014 crude oil, natural gas and NGLs reserves are $89.08 per bbl, $4.05 per MCF and $29.63 per bbl, respectively. These prices were based on the unweighted arithmetic average of the first-day-of-the-month price for the 12 months prior to September 30, 2014. The crude oil and NGL pricing was based off the West Texas Intermediate price and the natural gas pricing was based on the Henry Hub Natural Gas price. All prices have been adjusted for transportation, quality and basis differentials.
The October 2014 Properties Acquired future net cash flows relating to proved oil and gas reserves based on the standardized measure prescribed in ASC Topic 932 are:
|
|
|
December 31, |
|
September 30, |
| ||
|
|
|
(in thousands) |
| ||||
|
Future crude oil, natural gas and NGLs sales |
|
$ |
23,554 |
|
$ |
153,245 |
|
|
Future production costs |
|
(7,183 |
) |
(47,510 |
) | ||
|
Future development costs |
|
(2,619 |
) |
(46,298 |
) | ||
|
Future net cash flows |
|
13,752 |
|
59,437 |
| ||
|
10% annual discount |
|
(6,075 |
) |
(30,563 |
) | ||
|
Standardized measure of discounted future net cash flows |
|
$ |
7,677 |
|
$ |
28,874 |
|
The principal sources of change in the standardized measure of discounted future net cash flows are:
|
|
|
December 31, |
|
September 30, |
| ||
|
|
|
(in thousands) |
| ||||
|
Balance at beginning of period |
|
$ |
4,517 |
|
$ |
7,677 |
|
|
Sales of crude oil, natural gas and NGLs |
|
(502 |
) |
(580 |
) | ||
|
Net change in prices and production costs |
|
219 |
|
336 |
| ||
|
Extensions and discoveries |
|
— |
|
17,093 |
| ||
|
Revisions of previous quantity estimates |
|
185 |
|
689 |
| ||
|
Previously estimated development costs incurred |
|
3,274 |
|
2,619 |
| ||
|
Accretion of discount |
|
452 |
|
768 |
| ||
|
Other |
|
(468 |
) |
272 |
| ||
|
Balance at end of period |
|
$ |
7,677 |
|
$ |
28,874 |
|
REPORT OF INDEPENDENT REGISTERED PUBLIC ACCOUNTING FIRM
To the Board of Directors and Members
Extraction Oil & Gas, LLC
We have audited the accompanying statement of revenues and direct operating expenses of properties acquired by Extraction Oil & Gas, LLC for the year ended December 31, 2014 (the “Statement”). The Statement is the responsibility of the Company’s management. Our responsibility is to express an opinion on the Statement based on our audit.
We conducted our audit in accordance with the standards of the Public Company Accounting Oversight Board (United States). Those standards require that we plan and perform the audit to obtain reasonable assurance about whether the Statement is free of material misstatement. An audit also includes examining, on a test basis, evidence supporting the amounts and disclosures in the Statement, assessing the accounting principles used and significant estimates made by management, as well as evaluating the overall presentation of the Statement. We believe that our audit provides a reasonable basis for our opinion.
The accompanying Statement was prepared for the purpose of complying with the rules and regulations of the Securities and Exchange Commission as described in Note 1 and is not intended to be a complete presentation of the properties’ revenues and expenses.
In our opinion, the Statement referred to above presents fairly, in all material respects, the revenues and direct operating expenses of properties acquired by Extraction Oil & Gas, LLC for the year ended December 31, 2014 in conformity with accounting principles generally accepted in the United States of America.
Hein & Associates LLP
Denver, Colorado
August 17, 2015
STATEMENT OF REVENUES AND DIRECT OPERATING EXPENSES
OF MARCH 2015 PROPERTIES ACQUIRED BY EXTRACTION OIL & GAS, LLC
|
|
|
For the Year Ended |
| |
|
|
|
(in thousands) |
| |
|
Revenues: |
|
|
| |
|
Oil sales |
|
$ |
20,050 |
|
|
Natural gas sales |
|
7,141 |
| |
|
NGL sales |
|
275 |
| |
|
Total revenues |
|
27,466 |
| |
|
Direct Operating Expenses: |
|
|
| |
|
Lease operating expense |
|
9,965 |
| |
|
Production taxes |
|
1,976 |
| |
|
Total direct operating expenses |
|
11,941 |
| |
|
Revenues in Excess of Direct Operating Expenses |
|
$ |
15,525 |
|
SEE THE ACCOMPANYING NOTES TO THE STATEMENTS OF REVENUES AND DIRECT OPERATING EXPENSES
NOTES TO THE STATEMENT OF REVENUES AND DIRECT OPERATING EXPENSES
1. BASIS OF PRESENTATION:
On October 22, 2014, Extraction Oil & Gas, LLC (the “Company”), entered into a definitive purchase and sale agreement (the “Noble Agreement”) with Noble Energy Inc. (the “Seller”), under which the Company agreed to acquire interests in approximately 39,000 net acres of leaseholds, and related producing properties located primarily in Adams, Broomfield, Boulder and Weld Counties, Colorado (the “March 2015 Properties Acquired”), along with various other related rights, permits, contracts, equipment, rights of way, gathering systems and other assets from an unrelated third-party for aggregate cash consideration of approximately $125.0 million. The effective date for the acquisition was January 1, 2014 with purchase price adjustments calculated as of the close date on March 10, 2015.
The accompanying Statement of Revenues and Direct Operating Expenses (the “Statement”) is presented on the accrual basis of accounting and relates to the operations of the March 2015 Properties Acquired and has been derived from the historical accounting records. Certain costs such as depreciation, depletion, and amortization, accretion of asset retirement obligations, general and administrative expenses, interest and corporate income taxes are omitted. As such, this financial information is not intended to be a complete presentation of the revenues and expenses of the March 2015 Properties Acquired. Furthermore, the information may not be representative of future operations due to changes in the business and the exclusion of the omitted information.
In the opinion of management, this information contains all adjustments, consisting only of normal recurring accruals necessary for fair statement of the revenues and direct operating expenses for the period presented in accordance with the indicated basis of presentation.
2. USE OF ESTIMATES IN PREPARATION OF THE STATEMENT OF REVENUES AND DIRECT OPERATING EXPENSES:
The preparation of this Statement in conformity with accounting principles generally accepted in the United States requires management to make estimates and assumptions that affect the reported amounts of revenues and direct operating expenses during the respective reporting periods. Actual results may differ from the estimates and assumptions used in the preparation of the Statement.
3. COMMITMENTS AND CONTINGENCIES:
Pursuant to the terms of the Noble Agreement, there are no known claims, litigation or disputes pending as of the effective date of the Noble Agreement, or any matters arising in connection with indemnification, and the parties to the Noble Agreement are not aware of any legal, environmental or other commitments or contingencies that would have a material adverse effect on the Statements.
4. REVENUE RECOGNITION:
Revenues from the sale of oil, natural gas and natural gas liquids (“NGLs”) are recognized when the product is delivered at a fixed or determinable price, title has transferred, and collectability is reasonably assured and evidenced by a contract. The Company recognizes revenues from the sale of oil, natural gas and NGL’s using the sales method of accounting, whereby revenue is recorded based on the Company’s share of volume sold, regardless of whether the Company has taken its proportional share of volume produced. A receivable or liability is recognized only to the extent that the Company has an imbalance on a specific property greater than the expected remaining proved reserves. There were no gas imbalances at December 31, 2014.
5. SUBSEQUENT EVENTS:
In accordance with Accounting Standards Codification (“ASC”) 855, we have evaluated subsequent events through August 3, 2015, the date of the accompanying statements of revenues and direct operating expenses were available to be issued. There were no material subsequent events that required recognition or additional disclosure in the accompanying statements of revenues and direct operating expenses.
NOTES TO THE STATEMENTS OF REVENUES AND DIRECT OPERATING EXPENSES (Continued)
6. SUPPLEMENTAL OIL AND GAS RESERVE INFORMATION (unaudited):
Estimates of proved reserves are inherently imprecise and are continually subject to revision based on production history, results of additional exploration and development, price changes and other factors. All of the March 2015 Properties Acquired proved reserves are located in the continental United States.
Guidelines prescribed in Financial Accounting Standards Board’s (“FASB”) Accounting Standards Codification (“ASC”) Topic 932. Extractive Industries—Oil and Gas, have been followed for computing a standardized measure of future net cash flows and changes therein relating to estimated proved reserves. Future cash inflows and future production and development costs are determined by applying prices and costs, including transportation, quality, and basis differentials, to the year-end estimated quantities of oil and gas to be produced in the future. The resulting future net cash flows are reduced to present value amounts by applying a ten percent annual discount factor. Future operating costs are determined based on estimates of expenditures to be incurred in producing the proved oil and gas reserves in place at the end of the period using year-end costs and assuming continuation of existing economic conditions, plus overhead incurred. Future development costs are determined based on estimates of capital expenditures to be incurred in developing proved oil and gas reserves.
The assumptions used to compute the standardized measure are those prescribed by the FASB and the SEC. These assumptions do not necessarily reflect the Company’s expectations of actual revenues to be derived from those reserves, nor their present value. The limitations inherent in the reserve quantity estimation process, as discussed previously, are equally applicable to the standardized measure computations since these reserve quantity estimates are the basis for the valuation process. The Company emphasizes that reserve estimates are inherently imprecise and that estimates of new discoveries and undeveloped locations are more imprecise than estimates of established proved producing oil and gas properties. Accordingly, these estimates are expected to change as future information becomes available. The standardized measure excludes income taxes as the Company is a limited liability company and not subject to income taxes.
The changes in the March 2015 Properties Acquired proved (i.e., proved developed and undeveloped) reserves for the year ended December 31, 2014 are:
|
|
|
Crude Oil |
|
Natural Gas |
|
NGL |
|
|
December 31, 2013 |
|
905 |
|
9,551 |
|
1,116 |
|
|
Extensions, discoveries, and other additions |
|
187 |
|
654 |
|
76 |
|
|
Revisions |
|
55 |
|
588 |
|
(113 |
) |
|
Production |
|
(228 |
) |
(1,605 |
) |
(5 |
) |
|
December 31, 2014 |
|
919 |
|
9,188 |
|
1,074 |
|
|
Proved developed reserves, included above |
|
|
|
|
|
|
|
|
December 31, 2013 |
|
905 |
|
9,551 |
|
1,116 |
|
|
December 31, 2014 |
|
919 |
|
9,188 |
|
1,074 |
|
|
Proved undeveloped reserves, included above |
|
|
|
|
|
|
|
|
December 31, 2013 |
|
— |
|
— |
|
— |
|
|
December 31, 2014 |
|
— |
|
— |
|
— |
|
As of December 31, 2014, the March 2015 Properties Acquired had estimated proved reserves of 919 one thousand barrels (“Mbbl”) of crude oil, 9,188 one million cubic feet (“MMcf”) of natural gas and 1,074 Mbbl of NGLs with a standardized measure of $58.1 million. The March 2015 Properties Acquired reserves are comprised of 26% crude oil, 43% natural gas and 31% NGLs on an energy equivalent basis.
The following values for the crude oil, natural gas and NGLs reserves are $84.99 per one barrel (“bbl”), $4.26 per one thousand cubic feet (“Mcf”) and $33.47 per bbl, respectively. These prices were based on the 12 month arithmetic average first of month price January through December 31, 2014. The crude oil and NGL pricing was based off the West Texas Intermediate price and the natural gas pricing was based on the Henry Hub Natural Gas price. All prices have been adjusted for transportation, quality and basis differentials.
The March 2015 Properties Acquired future net cash flows relating to proved oil and gas reserves based on the standardized measure prescribed in ASC Topic 932 are:
NOTES TO THE STATEMENTS OF REVENUES AND DIRECT OPERATING EXPENSES (Continued)
|
|
|
December 31, |
| |
|
|
|
(in thousands) |
| |
|
Future crude oil, natural gas and NGLs sales |
|
$ |
153,173 |
|
|
Future production costs |
|
(59,225 |
) | |
|
Future net cash flows |
|
93,948 |
| |
|
10% annual discount |
|
(35,894 |
) | |
|
Standardized measure of discounted future net cash flows |
|
$ |
58,054 |
|
The principal sources of change in the standardized measure of discounted future net cash flows are:
|
|
|
December 31, |
| |
|
|
|
(in thousands) |
| |
|
Balance at beginning of period |
|
$ |
57,563 |
|
|
Sales of crude oil, natural gas and NGLs |
|
(15,525 |
) | |
|
Net change in prices and production costs |
|
1,078 |
| |
|
Extensions and discoveries |
|
9,904 |
| |
|
Revisions of previous quantity estimates |
|
658 |
| |
|
Accretion of discount |
|
5,756 |
| |
|
Other |
|
(1,380 |
) | |
|
Balance at end of period |
|
$ |
58,054 |
|
Bayswater Properties Acquired by Extraction Oil & Gas, LLC
Statements of Operating Revenues
and Direct Operating Expenses
For the Year Ended December 31, 2015 and
the Nine-Month Periods Ended September 30, 2016 and 2015
The Board of Directors
Elgin Energy, LLC:
We have audited the accompanying Statement of Operating Revenues and Direct Operating Expenses (the “Financial Statement”) of Bayswater Properties Acquired by Extraction Oil & Gas, LLC for the year ended December 31, 2015, and the related notes.
Management’s Responsibility for the Financial Statement
Management is responsible for the preparation and fair presentation of the Financial Statement in accordance with U.S. generally accepted accounting principles; this includes the design, implementation, and maintenance of internal control relevant to the preparation and fair presentation of the Financial Statements that is free from material misstatement, whether due to fraud or error.
Auditors’ Responsibility
Our responsibility is to express an opinion on the Financial Statement based on our audit. We conducted our audit in accordance with auditing standards generally accepted in the United States of America. Those standards require that we plan and perform the audit to obtain reasonable assurance about whether the Financial Statement is free from material misstatement.
An audit involves performing procedures to obtain audit evidence about the amounts and disclosures in the Financial Statement. The procedures selected depend on the auditors’ judgment, including the assessment of the risks of material misstatement of the Financial Statement, whether due to fraud or error. In making those risk assessments, the auditor considers internal control relevant to the entity’s preparation and fair presentation of the Financial Statement in order to design audit procedures that are appropriate in the circumstances, but not for the purpose of expressing an opinion on the effectiveness of the entity’s internal control. Accordingly, we express no such opinion. An audit also includes evaluating the appropriateness of accounting policies used and the reasonableness of significant accounting estimates made by management, as well as evaluating the overall presentation of the Financial Statement.
We believe that the audit evidence we have obtained is sufficient and appropriate to provide a basis for our audit opinion.
Opinion
In our opinion, the Financial Statement referred to above presents fairly, in all material respects, the Statement of Operating Revenues and Direct Operating Expenses of Bayswater Properties Acquired by Extraction Oil & Gas, LLC for the year ended December 31, 2015, in accordance with U.S. generally accepted accounting principles.
Emphasis of Matter
We draw attention to the basis of presentation in the Financial Statement, which describes that the accompanying Statement of Operating Revenues and Direct Operating Expenses was prepared for the purpose of complying with the rules and regulations of the Securities and Exchange Commission for inclusion in the filing of Form S-1 of Extraction Oil & Gas, LLC and is not intended to be a complete presentation of the Company’s revenues and expenses. Our opinion is not modified with respect to this matter.
(signed) KPMG LLP
Denver, Colorado
August 29, 2016
Independent Auditors’ Review Report
The Board of Directors
Elgin Energy, LLC:
Report on the Financial Statements
We have reviewed the accompanying Statements of Operating Revenues and Direct Operating Expenses of Bayswater Properties Acquired by Extraction Oil & Gas, LLC for the nine-month periods ended September 30, 2016 and 2015.
Management’s Responsibility
Management is responsible for the preparation and fair presentation of the interim financial information in accordance with U.S. generally accepted accounting principles; this responsibility includes the design, implementation, and maintenance of internal control sufficient to provide a reasonable basis for the preparation and fair presentation of interim financial information in accordance with U.S. generally accepted accounting principles.
Auditors’ Responsibility
Our responsibility is to conduct our reviews in accordance with auditing standards generally accepted in the United States of America applicable to reviews of interim financial information. A review of interim financial information consists principally of applying analytical procedures and making inquiries of persons responsible for financial and accounting matters. It is substantially less in scope than an audit conducted in accordance with auditing standards generally accepted in the United States of America, the objective of which is the expression of an opinion regarding the financial information. Accordingly, we do not express such an opinion.
Conclusion
Based on our reviews, we are not aware of any material modifications that should be made to the accompanying interim financial information for it to be in accordance with U.S. generally accepted accounting principles.
Emphasis of Matter
We draw attention to the basis of presentation in the interim financial information, which describes that the accompanying Statements of Operating Revenues and Direct Operating Expenses were prepared for the purpose of complying with the rules and regulations of the Securities and Exchange Commission for inclusion in the filing of Form S-1 of Extraction Oil & Gas, Inc. and are not intended to be a complete presentation of the Company’s revenues and expenses.
(signed) KPMG LLP
Denver, Colorado
November 30, 2016
BAYSWATER PROPERTIES ACQUIRED BY EXTRACTION OIL & GAS, LLC
STATEMENTS OF OPERATING REVENUES AND DIRECT OPERATING EXPENSES
|
|
|
For the Year Ended |
|
For the Nine-Month Period Ended |
| |||||
|
|
|
December 31, 2015 |
|
September 30, 2016 |
|
September 30, 2015 |
| |||
|
|
|
|
|
(unaudited) |
|
(unaudited) |
| |||
|
Operating Revenues: |
|
|
|
|
|
|
| |||
|
Oil sales |
|
$ |
10,933,927 |
|
$ |
37,376,297 |
|
$ |
6,892,630 |
|
|
Natural gas sales |
|
3,579,531 |
|
9,890,042 |
|
2,016,365 |
| |||
|
Total operating revenues |
|
14,513,458 |
|
47,266,339 |
|
8,908,995 |
| |||
|
Direct Operating Expenses: |
|
|
|
|
|
|
| |||
|
Lease operating expenses |
|
4,014,066 |
|
4,914,883 |
|
2,423,693 |
| |||
|
Production taxes |
|
864,906 |
|
3,347,364 |
|
779,142 |
| |||
|
Total direct operating expenses |
|
4,878,972 |
|
8,262,247 |
|
3,202,835 |
| |||
|
Operating Revenues in Excess of Direct Operating Expenses |
|
$ |
9,634,486 |
|
$ |
39,004,092 |
|
$ |
5,706,160 |
|
SEE THE ACCOMPANYING NOTES TO THE STATEMENTS OF OPERATING REVENUES AND DIRECT OPERATING EXPENSES
BAYSWATER PROPERTIES ACQUIRED BY EXTRACTION OIL & GAS, LLC
NOTES TO STATEMENTS OF OPERATING REVENUES AND DIRECT OPERATING EXPENSES
1. BASIS OF PRESENTATION:
On July 29, 2016 Extraction Oil & Gas, LLC (the “Company”), entered into a definitive purchase and sale agreement (the “Bayswater Agreement”) with Bayswater Exploration & Production, LLC, Bayswater Blenheim Holdings, LLC and Bayswater Blenheim Holdings II, LLC (collectively, “Bayswater” or the “Seller”), under which the Company agreed to acquire certain oil and gas leaseholds, overriding royalty interests and producing properties located primarily in the State of Colorado (the “Acquired Properties”), and various other related rights, permits, contracts, equipment and other assets. The Seller received aggregate consideration of approximately $419.0 million in cash. The effective date for the acquisition was July 1, 2016, with purchase price adjustments calculated as of the closing date on October 3, 2016.
The accompanying Statements of Operating Revenues and Direct Operating Expenses of the Bayswater Properties Acquired by Extraction Oil & Gas, LLC (the “Statements”) were prepared by the Company based on carved-out financial information and other data from the Seller’s historical accounting records. Because the Acquired Properties are not separate legal entities, the accompanying Statements vary from a complete income statement in accordance with accounting principles generally accepted in the United States of America in that they do not reflect certain expenses that were incurred in connection with the ownership and operation of the Acquired Properties including, but not limited to, depreciation, depletion, and amortization, accretion of asset retirement obligations, general and administrative expenses and interest as these cost are not directly involved in the revenue producing activity and would be difficult to relate directly to the Acquired Properties. As such, this financial information is not intended to be a complete presentation of the operating revenues and expenses of the Acquired Properties. The information may not be representative of future operations due to changes in the business and the exclusion of the omitted information. Furthermore, no balance sheet has been presented for the Acquired Properties because not all of the historical cost and related working capital balances are segregated or easily obtainable, nor has information about the Acquired Properties’ operating, investing and financing cash flows been provided for similar reasons. Accordingly, the accompanying Statements are presented in lieu of the financial statements required under Rule 3-05 of Securities and Exchange Commission (“SEC”) Regulation S-X.
2. USE OF ESTIMATES IN PREPARATION OF STATEMENTS:
The preparation of the statements of operating revenues and direct operating expenses of the Acquired Properties in conformity with accounting principles generally accepted in the United States requires management to make estimates and assumptions that affect the reported amounts of operating revenues and direct operating expenses during the respective reporting periods. Actual results may differ from the estimates and assumptions used in the preparation of the statements of operating revenues and direct operating expenses of the Acquired Properties.
3. COMMITMENTS AND CONTINGENCIES:
Pursuant to the terms of the Bayswater Agreement, there are no known claims, litigation or disputes pending as of the effective date of the Bayswater Agreement, or any matters arising in connection with indemnification, and the parties to the Bayswater Agreement are not aware of any legal, environmental or other commitments or contingencies that would have a material adverse effect on the statements of operating revenues and direct operating expenses of the Acquired Properties.
4. REVENUE RECOGNITION:
Revenues from the sale of oil and natural gas are recognized when the product is delivered at a fixed or determinable price, title has transferred, and collectability is reasonably assured and evidenced by a contract. The Seller recognizes revenues from the sale of oil and natural gas using the sales method of accounting, whereby revenue is recorded based on the Seller’s share of volume sold, regardless of whether it has taken its proportional share of volume produced. A receivable or liability is recognized only to the extent that an
BAYSWATER PROPERTIES ACQUIRED BY EXTRACTION OIL & GAS, LLC
NOTES TO STATEMENTS OF OPERATING REVENUES AND DIRECT OPERATING EXPENSES (Continued)
imbalance on a specific property is greater than the expected remaining proved reserves. There were no material gas imbalances at September 30, 2016 or December 31, 2015.
5. SUBSEQUENT EVENTS:
In accordance with Accounting Standards Codification (“ASC”) 855, the Company has evaluated subsequent events for the year ended December 31, 2015, through August 29, 2016, the date of the accompanying statements of operating revenues and direct operating expenses were available to be issued. There were no material subsequent events that required recognition or additional disclosure in the accompanying statements of operating revenues and direct operating expenses.
In accordance with ASC 855, the Company has evaluated subsequent events for the nine-month period ended September 30, 2016, through November 30, 2016, the date of the accompanying statements of operating revenues and direct operating expenses were available to be issued. There were no material subsequent events that required recognition or additional disclosure in the accompanying statements of operating revenues and direct operating expenses.
6. SUPPLEMENTAL OIL AND GAS RESERVE INFORMATION (UNAUDITED):
Estimated quantities of proved oil and gas reserves of the Acquired Properties were derived from reserve estimates prepared by Bayswater as of December 31, 2015 based on the estimates of Bayswater’s internal reserve engineers. Estimates of proved reserves are inherently imprecise and are continually subject to revision based on production history, results of additional exploration and development, price changes and other factors. All of the Acquired Properties’ proved reserves are located in the continental United States.
Guidelines prescribed in Financial Accounting Standards Board’s (“FASB”) Accounting Standards Codification (“ASC”) Topic 932 Extractive Industries — Oil and Gas, have been followed for computing a standardized measure of future net cash flows and changes therein relating to estimated proved reserves. Future cash inflows and future production and development costs are determined by applying prices and costs, including transportation, quality, and basis differentials, to the year-end estimated quantities of oil and gas to be produced in the future. The resulting future net cash flows are reduced to present value amounts by applying a ten percent annual discount factor. Future operating costs are determined based on estimates of expenditures to be incurred in producing the proved oil and gas reserves in place at the end of the period using year-end costs and assuming continuation of existing economic conditions, plus overhead incurred. Future development costs are determined based on estimates of capital expenditures to be incurred in developing proved oil and gas reserves.
The assumptions used to compute the standardized measure are those prescribed by the FASB and the SEC. These assumptions do not necessarily reflect the Company’s expectations of actual revenues to be derived from those reserves, nor their present value. The limitations inherent in the reserve quantity estimation process, as discussed previously, are equally applicable to the standardized measure computations since these reserve quantity estimates are the basis for the valuation process. Reserve estimates are inherently imprecise and estimates of new discoveries and undeveloped locations are more imprecise than estimates of established proved producing oil and gas properties. Accordingly, these estimates are expected to change as future information becomes available. The standardized measure excludes income taxes as the Company was a limited liability company and not subject to income taxes at December 31, 2015.
The following table sets forth information as of and for the year ended December 31, 2015 with respect to changes in the Acquired Properties’ proved reserves:
|
|
|
(Mbbl) |
|
(MMcf) |
|
|
January 1, 2015 |
|
7,840.3 |
|
70,931.1 |
|
|
Extensions, discoveries, and other additions |
|
3,026.4 |
|
26,934.9 |
|
|
Acquisitions |
|
619.8 |
|
6,200.4 |
|
|
Revisions |
|
(376.5 |
) |
(8,469.2 |
) |
|
Production |
|
(282.7 |
) |
(1,390.4 |
) |
BAYSWATER PROPERTIES ACQUIRED BY EXTRACTION OIL & GAS, LLC
NOTES TO STATEMENTS OF OPERATING REVENUES AND DIRECT OPERATING EXPENSES (Continued)
|
|
|
(Mbbl) |
|
(MMcf) |
|
|
December 31, 2015 |
|
10,827.3 |
|
94,206.8 |
|
|
Proved developed reserves, included above: |
|
|
|
|
|
|
December 31, 2015 |
|
4,298.4 |
|
38,071.8 |
|
|
Proved undeveloped reserves, included above (1): |
|
|
|
|
|
|
December 31, 2015 |
|
6,528.9 |
|
56,135.0 |
|
(1) Proved undeveloped reserves as of December 31, 2015 include only those properties that were eligible to be recorded as a proved undeveloped location and that Bayswater had developed (either (i) drilled and completed or (ii) drilled and uncompleted) subsequent to December 31, 2015 through the effective date of the Bayswater Agreement.
As of December 31, 2015, the Acquired Properties’ reserves are comprised of 40.8% crude oil and 59.2% natural gas, on an energy equivalent basis. The following values for the 2015 proved reserves were derived based on prices of $43.78 per Bbl of crude oil and $2.79 per Mcf of natural gas. The following values for the 2014 proved reserves were derived based on prices of $88.49 per Bbl of crude oil and $4.85 per Mcf of natural gas. These prices were based on the 12-month arithmetic average first-of-month price for January 2015 through December 2015 and January 2014 through December 2014, respectively. The crude oil pricing was based on the West Texas Intermediate price and the natural gas pricing was based on the Henry Hub price. All prices have been adjusted for transportation, quality and basis differentials.
The following summary sets forth the Acquired Properties’ future net cash flows relating to proved oil and gas reserves based on the standardized measure prescribed in ASC Topic 932:
|
|
|
December 31, 2015 |
| |
|
|
|
(in thousands) |
| |
|
Future crude oil and natural gas |
|
$ |
735,986 |
|
|
Future production costs |
|
(217,901 |
) | |
|
Future development costs |
|
(82,411 |
) | |
|
Future net cash flows |
|
435,674 |
| |
|
10% annual discount |
|
(184,526 |
) | |
|
Standardized measure of discounted future net cash flows |
|
$ |
251,148 |
|
The principal sources of change in the standardized measure of discounted future net cash flows are:
|
|
|
December 31, 2015 |
| |
|
|
|
(in thousands) |
| |
|
Balance at beginning of period |
|
$ |
293,571 |
|
|
Sales of crude oil and natural gas |
|
(9,634 |
) | |
|
Net change in prices and production costs |
|
(219,981 |
) | |
|
Net changes in future development costs |
|
19,840 |
| |
|
Extensions, discoveries, and other additions |
|
84,613 |
| |
|
Acquisition of reserves |
|
13,882 |
| |
|
Revisions of previous quantity estimates |
|
(38,445 |
) | |
|
Previously estimated development costs incurred |
|
72,594 |
| |
|
Accretion of discount |
|
29,357 |
| |
|
Other |
|
5,351 |
| |
|
Balance at end of period |
|
$ |
251,148 |
|
GLOSSARY OF OIL AND GAS TERMS
The terms defined in this section are used throughout this prospectus:
“Bbl” means one stock tank barrel, or 42 U.S. gallons liquid volume, used in reference to oil or other liquid hydrocarbons.
“Bbl/d” means Bbl per day.
“BBtu” One billion Btus.
“Bcf” is an abbreviation for “one billion cubic feet,” which is a unit of measurement of volume for natural gas.
“BOE” means barrels of oil equivalent. Oil equivalents are determined using the ratio of six Mcf of gas (including gas liquids) to one Bbl of oil.
“BOE/d” means BOE per day.
“Btu” means one British thermal unit—a measure of the amount of energy required to raise the temperature of a one-pound mass of water one degree Fahrenheit at sea level.
“CIG” means Colorado Interstate Gas.
“Completion” means the installation of permanent equipment for the production of oil or natural gas.
“Developed acreage” means the number of acres that are allocated or assignable to producing wells or wells capable of production.
“Development well” means a well drilled to a known producing formation in a previously discovered field, usually offsetting a producing well on the same or an adjacent oil and natural gas lease.
“Dry hole” means a well found to be incapable of producing either oil or gas in sufficient quantities to justify completion as an oil or gas well.
“Exploratory well” means a well drilled either (a) in search of a new and as yet undiscovered pool of oil or gas or (b) with the hope of significantly extending the limits of a pool already developed (also known as a “wildcat well”).
“Field” means an area consisting of a single reservoir or multiple reservoirs all grouped on or related to the same individual geological structural feature or stratigraphic condition.
“Fracturing” means mechanically inducing a crack or surface of breakage within rock not related to foliation or cleavage in metamorphic rock in order to enhance the permeability of rocks greatly by connecting pores together.
“Gas” or “Natural gas” means the lighter hydrocarbons and associated non-hydrocarbon substances occurring naturally in an underground reservoir, which under atmospheric conditions are essentially gases but which may contain liquids.
“Gross Acres” or “Gross Wells” means the total acres or wells, as the case may be, in which we have a working interest.
“Hydraulic fracturing” means a procedure to stimulate production by forcing a mixture of fluid and proppant (usually sand) into the formation under high pressure. This creates artificial fractures in the reservoir rock, which increases 1 permeability and porosity.
“Horizontal drilling” means a wellbore that is drilled laterally.
“Landowner royalty” means that interest retained by the holder of a mineral interest upon the execution of an oil and natural gas lease which usually amounts to 1/8 of all gross revenues from oil and natural gas production unencumbered with any expenses of operation, development, or maintenance.
“Leases” means full or partial interests in oil or gas properties authorizing the owner of the lease to drill for, produce and sell oil and natural gas in exchange for any or all of rental, bonus and royalty payments. Leases are generally acquired from private landowners (fee leases) and from federal and state governments on acreage held by them.
“MBbl” One thousand barrels of oil, condensate or NGLs.
“MBoe” One thousand barrels of oil equivalent. Oil equivalents are determined using the ratio of six Mcf of gas (including gas liquids) to one Bbl of oil.
“Mcf” is an abbreviation for “1,000 cubic feet,” which is a unit of measurement of volume for natural gas.
“MMBbl” One million barrels of oil, condensate or NGLs.
“MMBtu” One million Btus.
“MMcf” is an abbreviation for “1,000,000 cubic feet,” which is a unit of measurement of volume for natural gas.
“Net Acres” or “Net Wells” is the sum of the fractional working interests owned in gross acres or wells, as the case may be, expressed as whole numbers and fractions thereof.
“Net revenue interest” means all of the working interests less all royalties, overriding royalties, non-participating royalties, net profits interest or similar burdens on or measured by production from oil and natural gas.
“NGL” means natural gas liquids.
“NYMEX” means New York Mercantile Exchange.
“Overriding royalty” means an interest in the gross revenues or production over and above the landowner’s royalty carved out of the working interest and also unencumbered with any expenses of operation, development or maintenance.
“Operator” means the individual or company responsible to the working interest owners for the exploration, development and production of an oil or natural gas well or lease.
“Play” means a regionally distributed oil and natural gas accumulation as opposed to conventional plays which are more limited in their area extent. Resource plays are characterized by continuous, aerially extensive hydrocarbon accumulations in tight sand, shale and coal reservoirs.
“Prospect” means a geological area which is believed to have the potential for oil and natural gas production.
“Productive well” means a well that is producing oil or gas or that is capable of production.
“Proved developed reserves” means reserves that can be expected to be recovered through existing wells with existing equipment and operating methods.
“Proved reserves” means the estimated quantities of oil, gas and gas liquids which geological and engineering data demonstrate with reasonable certainty to be recoverable in future years from known reservoirs under existing economic and operating conditions.
“Proved undeveloped reserves” means reserves that are expected to be recovered from new wells on undrilled acreage, or from existing wells where a relatively major expenditure is required for recompletion.
“PV-10 value” means the present value of estimated future gross revenue to be generated from the production of estimated net proved reserves, net of estimated production and future development costs, using prices and costs in effect as of the date indicated (unless such prices or costs are subject to change pursuant to contractual provisions), without giving effect to non-property related expenses such as general and administrative expenses, debt service and future income tax expenses or to depreciation, depletion and amortization, discounted using an annual discount rate of 10 percent. While this measure does not include the effect of income taxes as it would in the use of the standardized measure calculation, it does provide an indicative representation of the relative value of the Company on a comparative basis to other companies and from period to period.
“Recompletion” means the completion for production from an existing wellbore in a formation other than that in which the well has previously been completed.
“Reserve life” represents the estimated net proved reserves at a specified date divided by actual production for the preceding 12-month period.
“Reservoir” means a porous and permeable underground formation containing a natural accumulation of producible natural gas and/or oil that is confined by impermeable rock or water barriers and is individual and separate from other reservoirs.
“Royalty” means the share paid to the owner of mineral rights, expressed as a percentage of gross income from oil and natural gas produced and sold unencumbered by expenses relating to the drilling, completing and operating of the affected well.
“Royalty interest” means an interest in an oil and natural gas property entitling the owner to shares of oil and natural gas production, free of costs of exploration, development and production operations.
“SEC pricing” means the price per Bbl for oil or per MMBtu for natural gas as calculated from the unweighted arithmetic average first-day-of-the-month prices for the prior 12 months, as adjusted by lease for quality, transportation fees, geographical differentials, marketing bonuses or deductions and other factors affecting the price received at the wellhead.
“Section” means 640 acres.
“Seismic Data” means an exploration method of sending energy waves or sound waves into the earth and recording the wave reflections to indicate the type, size, shape and depth of a subsurface rock formation. 2-D seismic provides two-dimensional information and 3-D seismic provides three-dimensional views.
“Spacing” means the distance between wells producing from the same reservoir. Spacing is often expressed in terms of acres, e.g., 40-acre spacing, and is often established by regulatory agencies.
“Undeveloped acreage” means lease acres on which wells have not been drilled or completed to a point that would permit the production of commercial quantities of oil and gas regardless of whether or not such acreage contains proved reserves.
“Undeveloped leasehold acreage” means the leased acreage on which wells have not been drilled or completed to a point that would permit the production of commercial quantities of oil and natural gas, regardless of whether such acreage contains estimated net proved reserves.
“Unit” means the joining of all or substantially all interests in a reservoir or field, rather than a single tract, to provide for development and operation without regard to separate property interests. Also, the area covered by a unitization agreement.
“Working interest” means an interest in an oil and natural gas lease entitling the holder at its expense to conduct drilling and production operations on the leased property and to receive the net revenues attributable to such interest, after deducting the landowner’s royalty, any overriding royalties, production costs, taxes and other costs.
“WTI” means the price of West Texas Intermediate oil on the NYMEX
Part II
INFORMATION NOT REQUIRED IN PROSPECTUS
Item 13. Other expenses of issuance and distribution
The following table sets forth an itemized statement of the amounts of all expenses (excluding underwriting discounts and commissions) payable by us in connection with the registration of the common stock offered hereby. With the exception of the SEC registration fee, the amounts set forth below are estimates.
|
SEC registration fee |
|
$ |
43,947 |
|
|
Accountants’ fees and expenses |
|
150,000 |
| |
|
Legal fees and expenses |
|
100,000 |
| |
|
Miscellaneous |
|
20,000 |
| |
|
|
|
|
| |
|
Total |
|
$ |
327,894 |
|
Item 14. Indemnification of Directors and Officers
Our bylaws provide that a director will not be liable to the corporation or its stockholders for monetary damages to the fullest extent permitted by the DGCL. In addition, if the DGCL is amended to authorize the further elimination or limitation of the liability of directors, then the liability of a director of the corporation, in addition to the limitation on personal liability provided for in our certificate of incorporation, will be limited to the fullest extent permitted by the amended DGCL. Our bylaws provide that the corporation will indemnify, and advance expenses to, any officer or director to the fullest extent authorized by the DGCL.
Section 145 of the DGCL provides that a corporation may indemnify directors and officers as well as other employees and individuals against expenses, including attorneys’ fees, judgments, fines and amounts paid in settlement in connection with specified actions, suits and proceedings whether civil, criminal, administrative, or investigative, other than a derivative action by or in the right of the corporation, if they acted in good faith and in a manner they reasonably believed to be in or not opposed to the best interests of the corporation and, with respect to any criminal action or proceeding, had no reasonable cause to believe their conduct was unlawful. A similar standard is applicable in the case of derivative actions, except that indemnification extends only to expenses, including attorneys’ fees, incurred in connection with the defense or settlement of such action and the statute requires court approval before there can be any indemnification where the person seeking indemnification has been found liable to the corporation. The statute provides that it is not exclusive of other indemnification that may be granted by a corporation’s certificate of incorporation, bylaws, disinterested director vote, stockholder vote, agreement or otherwise.
Our bylaws also contain indemnification rights for our directors and our officers. Specifically, our bylaws provide that we shall indemnify our officers and directors to the fullest extent authorized by the DGCL. Further, we may maintain insurance on behalf of our officers and directors against expense, liability or loss asserted incurred by them in their capacities as officers and directors.
We have obtained directors’ and officers’ insurance to cover our directors, officers and some of our employees for certain liabilities.
We have entered into written indemnification agreements with our directors and executive officers. Under these proposed agreements, if an officer or director makes a claim of indemnification to us, either a majority of the independent directors or independent legal counsel selected by the independent directors must review the relevant facts and make a determination whether the officer or director has met the standards of conduct under Delaware law that would permit (under Delaware law) and require (under the indemnification agreement) us to indemnify the officer or director.
Item 15. Recent Sales of Unregistered Securities
In connection with the completion of the IPO, Extraction Oil & Gas Holdings, LLC merged with and into us and we were the surviving entity to such merger, with the equity holders in Extraction Oil & Gas Holdings, LLC, including the holders of restricted units and incentive units, receiving membership interests in us using an implied equity valuation for us prior to the offering based on the initial public offering price to the public for our common stock set forth on the cover page of the IPO registration statement and the relative levels of ownership in Extraction Oil & Gas Holdings, LLC immediately prior to the consummation of the IPO, pursuant to the terms of the limited liability company agreement of Extraction Oil & Gas Holdings, LLC.
The issuance of such membership interests did not involve any underwriters, underwriting discounts or commissions or a public offering, and we believe that such issuance was exempt from registration requirements pursuant to Section 4(a)(2) of the Securities Act of 1933, as amended.
On December 12, 2016, we entered into the Subscription Agreement, pursuant to which we agreed to issue 25,041,041 shares of common stock, at a price of $18.25 per share. The Private Placement resulted in approximately $457.0 million of gross proceeds and approximately $441.8 million of net proceeds (after deducting placement agent commissions and our expenses). The issuance of such common stock did not involve any underwriters, underwriting discounts or commissions or a public offering, and we believe that such issuance was exempt from registration requirements pursuant to Section 4(a)(2) of the Securities Act of 1933, as amended.
Item 16. Exhibits and financial statement schedules
See the Exhibit Index immediately following the signature page hereto, which is incorporated by reference as if fully set forth herein.
Item 17. Undertakings
Insofar as indemnification for liabilities arising under the Securities Act may be permitted to directors, officers and controlling persons of the registrant pursuant to the foregoing provisions, or otherwise, the registrant has been advised that in the opinion of the Securities and Exchange Commission such indemnification is against public policy as expressed in the Securities Act and is, therefore, unenforceable. In the event that a claim for indemnification against such liabilities (other than the payment by the registrant of expenses incurred or paid by a director, officer or controlling person of the registrant in the successful defense of any action, suit or proceeding) is asserted by such director, officer or controlling person in connection with the securities being registered, the registrant will, unless in the opinion of its counsel the matter has been settled by controlling precedent, submit to a court of appropriate jurisdiction the question whether such indemnification by it is against public policy as expressed in the Securities Act and will be governed by the final adjudication of such issue.
The undersigned registrant hereby undertakes that:
(1) For purposes of determining any liability under the Securities Act, the information omitted from the form of prospectus filed as part of this registration statement in reliance upon Rule 430A and contained in a form of prospectus filed by the registrant pursuant to Rule 424(b)(1) or (4) or 497(h) under the Securities Act shall be deemed to be part of this registration statement as of the time it was declared effective.
(2) For the purpose of determining any liability under the Securities Act, each post-effective amendment that contains a form of prospectus shall be deemed to be a new registration statement relating to the securities offered therein, and the offering of such securities at that time shall be deemed to be the initial bona fide offering thereof.
SIGNATURES
Pursuant to the requirements of the Securities Act of 1933, the registrant has duly caused this registration statement to be signed on its behalf by the undersigned, thereunto duly authorized, in the City of Denver, State of Colorado, on January 6, 2017.
|
|
Extraction Oil & Gas, Inc. | |
|
|
|
|
|
|
By: |
/s/ Russell T. Kelley, Jr. |
|
|
|
Russell T. Kelley, Jr. |
|
|
|
Chief Financial Officer |
Pursuant to the requirements of the Securities Act of 1933, as amended, this Registration Statement has been signed below by the following persons in the capacities indicated on January 6, 2017.
|
|
|
|
|
|
Name |
|
Title | |
|
|
|
| |
|
* |
|
Chief Executive Officer and Chairman (Principal Executive Officer) | |
|
Mark A. Erickson |
|
| |
|
|
|
| |
|
* |
|
Director and President | |
|
Matthew R. Owens |
|
| |
|
|
|
| |
|
/s/ Russell T. Kelley, Jr. |
|
Chief Financial Officer (Principal Financial Officer) | |
|
Russell T. Kelley, Jr. |
|
| |
|
|
|
| |
|
* |
|
Vice President, Chief Accounting Officer (Principal Accounting Officer) | |
|
Tom L. Brock |
|
| |
|
|
|
| |
|
* |
|
Director | |
|
John S. Gaensbauer |
|
| |
|
|
|
| |
|
* |
|
Director | |
|
Peter A. Leidel |
|
| |
|
* |
|
Director |
|
Marvin M. Chronister |
|
|
|
|
|
|
|
* |
|
Director |
|
Patrick D. O’Brien |
|
|
|
|
|
|
|
* |
|
Director |
|
Wayne W. Murdy |
|
|
|
|
|
|
|
* |
|
Director |
|
Donald L. Evans |
|
|
|
* By: |
/s/ Russell T. Kelley, Jr. |
|
|
|
|
Russell T. Kelley, Jr. |
|
|
|
|
Attorney-in-fact |
|
|
INDEX TO EXHIBITS
|
Exhibit |
|
Description | |
|
**2.1 |
|
|
Form of Stakeholders’ Agreement by and among Extraction Oil & Gas Holdings, LLC, Extraction Oil & Gas, LLC, and the other signatories thereto (incorporated by reference to Exhibit 2.1 to the Company’s Registration Statement on Form S-1 (File No. 333-213634) filed with the commission on September 26, 2016) |
|
|
|
|
|
|
**2.2 |
|
|
Agreement and Plan of Merger, dated October 17, 2016, by and between Extraction Oil & Gas, Inc. and Extraction Oil & Gas Holdings, LLC. (incorporated by reference to Exhibit 2.1 to the Company’s Current Report on Form 8-K (File No. 001-37907) filed with the Commission on October 21, 2016). |
|
|
|
|
|
|
**3.1 |
|
|
Certificate of Incorporation of Extraction Oil & Gas, Inc., dated October 11, 2016 (incorporated by reference to Exhibit 3.1 to the Company’s Current Report on Form 8-K (File No. 001-37907) filed with the Commission on October 14, 2016) |
|
|
|
|
|
|
**3.2 |
|
|
Certificate of Designations of Series A Preferred Stock of Extraction Oil & Gas, Inc., filed with the Secretary of State of the State of Delaware on October 17, 2016 (incorporated by reference to Exhibit 3.1 to the Company’s Current Report on Form 8-K (File No. 001-37907) filed with the Commission on October 21, 2016). |
|
|
|
|
|
|
**3.3 |
|
|
Bylaws of Extraction Oil & Gas, Inc., dated October 11, 2016 (incorporated by reference to Exhibit 3.2 to the Company’s Current Report on Form 8-K (File No. 001-37907) filed with the Commission on October 14, 2016). |
|
|
|
|
|
|
**4.1 |
|
|
Amended and Restated Registration Rights Agreement, dated October 17, 2016, by and among Extraction Oil & Gas, Inc. and the other persons named therein (incorporated by reference to Exhibit 4.1 to the Company’s Current Report on Form 8-K (File No. 001-37907) filed with the Commission on October 21, 2016). |
|
|
|
|
|
|
**4.2 |
|
|
Registration Rights Agreement, dated October 3, 2016, by and among Extraction Oil & Gas, LLC, Extraction Oil & Gas Holdings, LLC and the other persons named therein (incorporated by reference to Exhibit 4.2 to the Company’s Current Report on Form 8-K (File No. 001-37907) filed with the Commission on October 21, 2016). |
|
|
|
|
|
|
**4.3 |
|
|
Supplemental Indenture, dated October 17, 2016, by and among Extraction Oil & Gas, Inc., Extraction Finance Corp., the guarantors party thereto and Wells Fargo Bank, National Association, as trustee (incorporated by reference to Exhibit 10.1 to the Company’s Current Report on Form 8-K (File No. 001-37907) filed with the Commission on October 21, 2016). |
|
|
|
|
|
|
**5.1 |
|
|
Opinion of Vinson & Elkins L.L.P. as to the legality of the securities being registered |
|
|
|
|
|
|
**10.1 |
|
|
Credit Agreement, dated as of September 4, 2014, by and among Extraction Oil & Gas Holdings, LLC, as borrower, Wells Fargo Bank, National Association, as administrative agent, and the lenders party thereto (incorporated by reference to Exhibit 10.1 to the Company’s Registration Statement on Form S-1 (File No. 333-213634) filed with the commission on September 14, 2016) |
|
|
|
|
|
|
**10.2 |
|
|
Amendment No. 1 to the Credit Agreement, dated as of September 24, 2014, by and among Extraction Oil & Gas Holdings, LLC, as borrower, Wells Fargo Bank, National Association, as administrative agent, and the lenders party thereto (incorporated by reference to Exhibit 10.2 to the Company’s Registration Statement on Form S-1 (File No. 333-213634) filed with the commission on September 14, 2016) |
|
|
|
|
|
|
**10.3 |
|
|
Amendment No. 2 to the Credit Agreement, dated as of November 10, 2014, by and among Extraction Oil & Gas Holdings, LLC, as borrower, Wells Fargo Bank, National Association, as administrative agent, and the lenders party thereto (incorporated by reference to Exhibit 10.3 to the Company’s Registration Statement on Form S-1 (File No. 333-213634) filed with the commission on September 14, 2016) |
|
Exhibit |
|
Description | |
|
**10.4 |
|
|
Amendment No. 3 to the Credit Agreement, dated as of December 30, 2014, by and among Extraction Oil & Gas Holdings, LLC, as borrower, Wells Fargo Bank, National Association, as administrative agent, and the lenders party thereto (incorporated by reference to Exhibit 10.4 to the Company’s Registration Statement on Form S-1 (File No. 333-213634) filed with the commission on September 14, 2016) |
|
|
|
|
|
|
**10.5 |
|
|
Amendment No. 4 to the Credit Agreement, dated as of May 27, 2015, by and among Extraction Oil & Gas Holdings, LLC, as borrower, Wells Fargo Bank, National Association, as administrative agent, and the lenders party thereto (incorporated by reference to Exhibit 10.5 to the Company’s Registration Statement on Form S-1 (File No. 333-213634) filed with the commission on September 14, 2016) |
|
|
|
|
|
|
**10.6 |
|
|
Amendment No. 5 to the Credit Agreement, dated as of September 1, 2015, by and among Extraction Oil & Gas Holdings, LLC, as borrower, Wells Fargo Bank, National Association, as administrative agent, and the lenders party thereto (incorporated by reference to Exhibit 10.6 to the Company’s Registration Statement on Form S-1 (File No. 333-213634) filed with the commission on September 14, 2016) |
|
|
|
|
|
|
**10.7 |
|
|
Amendment No. 6 to the Credit Agreement, dated as of September 10, 2015, by and among Extraction Oil & Gas Holdings, LLC, as borrower, Wells Fargo Bank, National Association, as administrative agent, and the lenders party thereto (incorporated by reference to Exhibit 10.7 to the Company’s Registration Statement on Form S-1 (File No. 333-213634) filed with the commission on September 14, 2016) |
|
|
|
|
|
|
**10.8 |
|
|
Amendment No. 7 to the Credit Agreement, dated as of December 15, 2015, by and among Extraction Oil & Gas Holdings, LLC, as borrower, Wells Fargo Bank, National Association, as administrative agent, and the lenders party thereto (incorporated by reference to Exhibit 10.8 to the Company’s Registration Statement on Form S-1 (File No. 333-213634) filed with the commission on September 14, 2016) |
|
|
|
|
|
|
**10.9 |
|
|
Amendment No. 8 to the Credit Agreement, dated as of June 13, 2016, by and among Extraction Oil & Gas Holdings, LLC, as borrower, Wells Fargo Bank, National Association, as administrative agent, and the lenders party thereto (incorporated by reference to Exhibit 10.9 to the Company’s Registration Statement on Form S-1 (File No. 333-213634) filed with the commission on September 14, 2016) |
|
|
|
|
|
|
**10.10 |
|
|
Amendment No. 9 to the Credit Agreement, dated as of August 12, 2016, by and among Extraction Oil & Gas Holdings, LLC, as borrower, Wells Fargo Bank, National Association, as administrative agent, and the lenders party thereto (incorporated by reference to Exhibit 10.10 to the Company’s Registration Statement on Form S-1 (File No. 333-213634) filed with the commission on September 14, 2016) |
|
|
|
|
|
|
**10.11 |
|
|
Amendment No. 10 to the Credit Agreement, dated as of September 14, 2016, by and among Extraction Oil & Gas Holdings, LLC, as borrower, Wells Fargo Bank, National Association, as administrative agent, and the lenders party thereto (incorporated by reference to Exhibit 10.11 to the Company’s Registration Statement on Form S-1 (File No. 333-213634) filed with the commission on September 26, 2016) |
|
|
|
|
|
|
**10.12 |
|
|
Form of Indemnification Agreement (incorporated by reference to Exhibit 10.12 to the Company’s Registration Statement on Form S-1 (File No. 333-213634) filed with the commission on September 26, 2016) |
|
Exhibit |
|
Description | |
|
**10.13 |
|
|
Employment Agreement dated as of October 11, 2016 among the Company, XOG Services, LLC, and Mark A. Erickson (incorporated by reference to Exhibit 10.4 to the Company’s Current Report on Form 8-K (File No. 001-37907) filed with the Commission on October 14, 2016). |
|
|
|
|
|
|
**10.14 |
|
|
Employment Agreement dated as of October 11, 2016 among the Company, XOG Services, LLC, and Matthew R. Owens (incorporated by reference to Exhibit 10.5 to the Company’s Current Report on Form 8-K (File No. 001-37907) filed with the Commission on October 14, 2016). |
|
|
|
|
|
|
**10.15 |
|
|
Employment Agreement dated as of October 11, 2016 among the Company, XOG Services, LLC, and Russell T. Kelley, Jr. (incorporated by reference to Exhibit 10.6 to the Company’s Current Report on Form 8-K (File No. 001-37907) filed with the Commission on October 14, 2016). |
|
|
|
|
|
|
**10.16 |
|
|
Indemnification Agreement (Mark A. Erickson) (incorporated by reference to Exhibit 10.3 to the Company’s Current Report on Form 8-K (File No. 001-37907) filed with the Commission on October 21, 2016). |
|
|
|
|
|
|
**10.17 |
|
|
Indemnification Agreement (Matthew R. Owens) (incorporated by reference to Exhibit 10.4 to the Company’s Current Report on Form 8-K (File No. 001-37907) filed with the Commission on October 21, 2016). |
|
|
|
|
|
|
**10.18 |
|
|
Indemnification Agreement (Russell T. Kelley, Jr.) (incorporated by reference to Exhibit 10.5 to the Company’s Current Report on Form 8-K (File No. 001-37907) filed with the Commission on October 21, 2016). |
|
|
|
|
|
|
**10.19 |
|
|
Indemnification Agreement (John S. Gaensbauer) (incorporated by reference to Exhibit 10.6 to the Company’s Current Report on Form 8-K (File No. 001-37907) filed with the Commission on October 21, 2016). |
|
|
|
|
|
|
**10.20 |
|
|
Indemnification Agreement (Peter A. Leidel) (incorporated by reference to Exhibit 10.7 to the Company’s Current Report on Form 8-K (File No. 001-37907) filed with the Commission on October 21, 2016). |
|
|
|
|
|
|
**10.21 |
|
|
Indemnification Agreement (Marvin M. Chronister) (incorporated by reference to Exhibit 10.8 to the Company’s Current Report on Form 8-K (File No. 001-37907) filed with the Commission on October 21, 2016). |
|
|
|
|
|
|
**10.22 |
|
|
Indemnification Agreement (Patrick D. O’Brien) (incorporated by reference to Exhibit 10.9 to the Company’s Current Report on Form 8-K (File No. 001-37907) filed with the Commission on October 21, 2016). |
|
|
|
|
|
|
**10.23 |
|
|
Employment Agreement effective as of November 1, 2016 among the Company and Tom L. Brock (incorporated by reference to Exhibit 10.2 to the Company’s Current Report on Form 8-K (File No. 001-37907) filed with the Commission on October 31, 2016). |
|
|
|
|
|
|
**10.24 |
|
|
Indemnification Agreement (Tom L. Brock) (incorporated by reference to Exhibit 10.3 to the Company’s Current Report on Form 8-K (File No. 001-37907) filed with the Commission on October 31, 2016). |
|
|
|
|
|
|
**10.25 |
|
|
Indemnification Agreement (Donald L. Evans) (incorporated by reference to Exhibit 10.2 to the Company’s Current Report on Form 8-K (File No. 001-37907) filed with the Commission on December 16, 2016). |
|
|
|
|
|
|
**10.26 |
|
|
Indemnification Agreement (Wayne M. Murdy) (incorporated by reference to Exhibit 10.3 to the Company’s Current Report on Form 8-K (File No. 001-37907) filed with the Commission on December 16, 2016). |
|
Exhibit |
|
Description | |
|
**10.27 |
|
|
Extraction Oil & Gas, Inc. 2016 Long Term Incentive Plan (incorporated by reference to Exhibit 4.4 to the Company’s Registration Statement on Form S-8 (File No. 333-214089) filed with the Commission on October 13, 2016). |
|
|
|
|
|
|
**10.28 |
|
|
Form of Restricted Stock Unit Award Agreement (for Employees) (incorporated by reference to Exhibit 4.5 to the Company’s Registration Statement on Form S-8 (File No. 333-214089) filed with the Commission on October 13, 2016). |
|
|
|
|
|
|
**10.29 |
|
|
Form of Restricted Stock Unit Award Agreement (for Directors) (incorporated by reference to Exhibit 4.6 to the Company’s Registration Statement on Form S-8 (File No. 333-214089) filed with the Commission on October 13, 2016). |
|
|
|
|
|
|
**10.30 |
|
|
Form of Stock Option Award Agreement (incorporated by reference to Exhibit 4.7 to the Company’s Registration Statement on Form S-8 (File No. 333-214089) filed with the Commission on October 13, 2016). |
|
|
|
|
|
|
**10.31 |
|
|
Amended and Restated Employment Agreement effective as of November 1, 2016 among the Company and Tom L. Brock (incorporated by reference to Exhibit 10.1 to the Company’s Current Report on Form 8-K (File No. 001-37907) filed with the Commission on November 22, 2016). |
|
|
|
|
|
|
**10.32 |
|
|
Common Stock Subscription Agreement, dated as of December 12, 2016, by and among Extraction Oil & Gas, Inc. and the purchasers named therein (incorporated by reference to Exhibit 10.1 to the Company’s Current Report on Form 8-K (File No. 001-37907) filed with the Commission on December 12, 2016). |
|
|
|
|
|
|
**10.33 |
|
|
Registration Rights Agreement, dated as of December 15, 2016, by and among Extraction Oil & Gas, Inc. and the purchasers named therein (incorporated by reference to Exhibit 4.1 to the Company’s Current Report on Form 8-K (File No. 001-37907) filed with the Commission on December 16, 2016). |
|
|
|
|
|
|
***15.1 |
|
|
Letter of KPMG LLP. |
|
|
|
|
|
|
**21.1 |
|
|
List of subsidiaries of Extraction Oil & Gas, Inc. (incorporated by reference to Exhibit 21.1 to the Company’s Registration Statement on Form S-1 (File No. 333-213634) filed with the commission on September 26, 2016) |
|
|
|
|
|
|
***23.1 |
|
|
Consent of PricewaterhouseCoopers LLP |
|
|
|
|
|
|
***23.2 |
|
|
Consent of PricewaterhouseCoopers LLP |
|
|
|
|
|
|
***23.3 |
|
|
Consent of Hein & Associates LLP |
|
|
|
|
|
|
***23.4 |
|
|
Consent of Hein & Associates LLP |
|
|
|
|
|
|
***23.5 |
|
|
Consent of Hein & Associates LLP |
|
|
|
|
|
|
***23.6 |
|
|
Consent of Hein & Associates LLP |
|
|
|
|
|
|
***23.7 |
|
|
Consent of KPMG LLP |
|
|
|
|
|
|
***23.8 |
|
|
Consent of Ryder Scott Company, L.P. |
|
|
|
|
|
|
**23.9 |
|
|
Consent of Vinson & Elkins L.L.P. (included as part of Exhibit 5.1) |
|
|
|
|
|
|
**24.1 |
|
|
Power of Attorney |
|
|
|
|
|
|
**99.1 |
|
|
Ryder Scott Company, L.P. Summary of Reserves at December 31, 2014 for Extraction Oil & Gas, LLC (incorporated by reference to Exhibit 99.1 to the Company’s Registration Statement on Form S-1 (File No. 333-213634) filed with the commission on September 14, 2016) |
|
|
|
|
|
|
**99.2 |
|
|
Ryder Scott Company, L.P. Summary of Reserves at December 31, 2015 for Extraction Oil & Gas, LLC (incorporated by reference to Exhibit 99.2 to the Company’s Registration Statement on Form S-1 (File No. 333-213634) filed with the commission on September 14, 2016) |
|
Exhibit |
|
Description | |
|
**99.3 |
|
|
Ryder Scott Company, L.P. Summary of Reserves at December 31, 2015 for Mountaintop Minerals, LLC (incorporated by reference to Exhibit 99.3 to the Company’s Registration Statement on Form S-1 (File No. 333-213634) filed with the commission on September 14, 2016) |
|
|
|
|
|
|
**99.4 |
|
|
Ryder Scott Company, L.P. Summary of Reserves at December 31, 2015 for 8 North, LLC (incorporated by reference to Exhibit 99.4 to the Company’s Registration Statement on Form S-1 (File No. 333-213634) filed with the commission on September 14, 2016) |
|
|
|
|
|
|
**99.5 |
|
|
Ryder Scott Company, L.P. Summary of Reserves at June 30, 2016 for Extraction Oil & Gas, LLC (incorporated by reference to Exhibit 99.5 to the Company’s Registration Statement on Form S-1 (File No. 333-213634) filed with the commission on September 14, 2016) |
|
|
|
|
|
|
**99.6 |
|
|
Ryder Scott Company, L.P. Summary of Reserves at June 30, 2016 for Mountaintop Minerals, LLC (incorporated by reference to Exhibit 99.6 to the Company’s Registration Statement on Form S-1 (File No. 333-213634) filed with the commission on September 14, 2016) |
|
|
|
|
|
|
**99.7 |
|
|
Ryder Scott Company, L.P. Summary of Reserves at June 30, 2016 for 8 North, LLC (incorporated by reference to Exhibit 99.7 to the Company’s Registration Statement on Form S-1 (File No. 333-213634) filed with the commission on September 14, 2016) |
|
|
|
|
|
|
**99.8 |
|
|
Ryder Scott Company, L.P. Summary of Reserves at June 30, 2016 for the Bayswater Assets (incorporated by reference to Exhibit 99.8 to the Company’s Registration Statement on Form S-1 (File No. 333-213634) filed with the commission on September 14, 2016) |
** Previously filed.
*** Filed herewith.