Attached files
| file | filename |
|---|---|
| 8-K - FORM 8-K - Broadcom Pte. Ltd. | d328077d8k.htm |
Exhibit 99.1
REGULATION FD DISCLOSURE
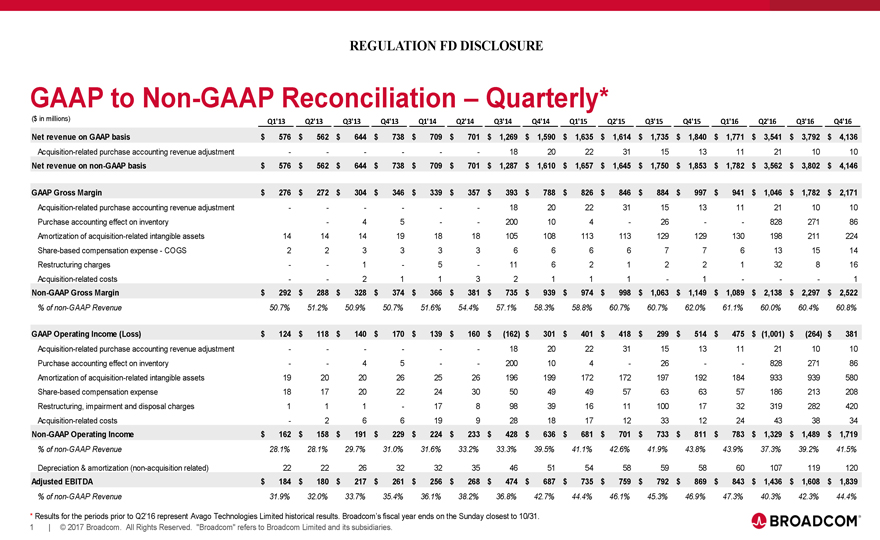
GAAP to Non-GAAP Reconciliation – Quarterly*
($ in millions) Q1’13 Q2’13 Q3’13 Q4’13 Q1’14 Q2’14 Q3’14 Q4’14 Q1’15 Q2’15 Q3’15 Q4’15 Q1’16 Q2’16 Q3’16
Q4’16
Net revenue on GAAP basis $576 $562 $644 $738 $709 $701 $1,269 $1,590 $1,635 $1,614 $1,735 $1,840 $1,771 $3,541 $3,792 $4,136
Acquisition-related purchase accounting revenue adjustment - - - - - - 18 20 22 31 15 13 11 21 10 10
Net revenue on non-GAAP basis $576 $562 $644 $738 $709 $701 $1,287 $1,610 $1,657 $1,645 $1,750 $1,853 $1,782 $3,562 $3,802 $4,146
GAAP Gross Margin $276 $272 $304 $346 $339 $357 $393 $788 $826 $846 $884 $997 $941 $1,046 $1,782 $2,171
Acquisition-related purchase accounting revenue adjustment - - - - - - 18 20 22 31 15 13 11 21 10 10
Purchase accounting effect on inventory - 4 5 - - 200 10 4 - 26 - - 828 271 86
Amortization of
acquisition-related intangible assets 14 14 14 19 18 18 105 108 113 113 129 129 130 198 211 224
Share-based compensation expense - COGS 2 2 3 3 3 3 6 6 6 6 7 7 6
13 15 14
Restructuring charges - - 1 - 5 - 11 6 2 1 2 2 1 32 8 16
Acquisition-related costs - - 2 1 1 3 2 1 1 1 - 1 - - - 1
Non-GAAP Gross Margin $292 $288 $328 $374 $366 $381 $735 $939 $974 $998 $1,063 $1,149 $1,089 $2,138 $2,297 $2,522
% of non-GAAP Revenue 50.7% 51.2% 50.9% 50.7% 51.6% 54.4% 57.1% 58.3% 58.8% 60.7% 60.7% 62.0% 61.1% 60.0% 60.4% 60.8%
GAAP Operating
Income (Loss) $124 $118 $140 $170 $139 $160 $(162) $301 $401 $418 $299 $514 $475 $(1,001) $(264) $381
Acquisition-related purchase accounting revenue adjustment -
- - - - - 18 20 22 31 15 13 11 21 10 10
Purchase accounting effect on inventory - - 4 5 - - 200 10 4 - 26 - - 828 271 86
Amortization of acquisition-related intangible assets 19 20 20 26 25 26 196 199 172 172 197 192 184 933 939 580
Share-based compensation expense 18 17 20 22 24 30 50 49 49 57 63 63 57 186 213 208
Restructuring, impairment and disposal charges 1 1 1 - 17 8 98 39 16 11 100 17 32 319 282 420
Acquisition-related costs - 2 6 6 19 9 28 18 17 12 33 12 24 43 38 34
Non-GAAP Operating Income $162 $158 $191 $229 $224 $233 $428 $636 $681 $701 $733 $811 $783 $1,329 $1,489 $1,719
% of non-GAAP Revenue 28.1% 28.1% 29.7% 31.0% 31.6% 33.2% 33.3% 39.5% 41.1% 42.6% 41.9% 43.8% 43.9% 37.3% 39.2% 41.5%
Depreciation & amortization (non-acquisition related) 22 22 26 32 32 35 46 51 54 58 59 58 60 107 119 120
Adjusted EBITDA $184 $180 $217 $261 $256 $268 $474 $687 $735 $759 $792 $869 $843 $1,436 $1,608 $1,839
% of non-GAAP Revenue 31.9% 32.0% 33.7% 35.4% 36.1% 38.2% 36.8% 42.7% 44.4% 46.1% 45.3% 46.9% 47.3% 40.3% 42.3% 44.4%
* Results for the periods prior to Q2’16 represent Avago Technologies Limited historical results. Broadcom’s fiscal year ends on the Sunday closest to 10/31.
1 | © 2017 Broadcom. All Rights Reserved. “Broadcom” refers to Broadcom Limited and its subsidiaries.
BROADCOM
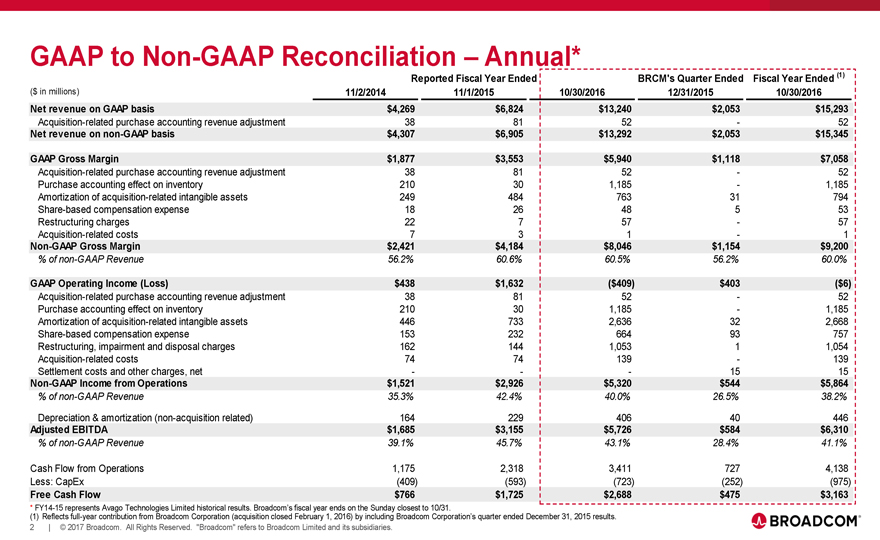
GAAP to Non-GAAP Reconciliation – Annual*
Reported Fiscal Year Ended BRCM’s Quarter Ended Fiscal Year Ended (1)
($ in millions)
11/2/2014 11/1/2015 10/30/2016 12/31/2015 10/30/2016
Net revenue on GAAP
basis $4,269 $6,824 $13,240 $2,053 $15,293
Acquisition-related purchase accounting revenue adjustment 38 81 52 - 52
Net revenue on non-GAAP basis $4,307 $6,905 $13,292 $2,053 $15,345
GAAP Gross Margin $1,877 $3,553 $5,940 $1,118 $7,058
Acquisition-related purchase accounting
revenue adjustment 38 81 52 - 52
Purchase accounting effect on inventory 210 30 1,185 - 1,185
Amortization of acquisition-related intangible assets 249 484 763 31 794
Share-based
compensation expense 18 26 48 5 53
Restructuring charges 22 7 57 - 57
Acquisition-related costs 7 3 1 - 1
Non-GAAP Gross Margin $2,421 $4,184 $8,046 $1,154 $9,200
% of non-GAAP Revenue 56.2% 60.6% 60.5% 56.2% 60.0%
GAAP Operating Income (Loss) $438 $1,632 ($409) $403 ($6)
Acquisition-related
purchase accounting revenue adjustment 38 81 52 - 52
Purchase accounting effect on inventory 210 30 1,185 - 1,185
Amortization of acquisition-related intangible assets 446 733 2,636 32 2,668
Share-based
compensation expense 153 232 664 93 757
Restructuring, impairment and disposal charges 162 144 1,053 1 1,054
Acquisition-related costs 74 74 139 - 139
Settlement costs and other charges, net - - - 15 15
Non-GAAP Income from Operations $1,521 $2,926 $5,320 $544 $5,864
% of non-GAAP Revenue 35.3% 42.4% 40.0% 26.5% 38.2%
Depreciation & amortization (non-acquisition related) 164 229 406 40 446
Adjusted EBITDA $1,685 $3,155 $5,726 $584 $6,310
% of
non-GAAP Revenue 39.1% 45.7% 43.1% 28.4% 41.1%
Cash Flow from Operations 1,175 2,318 3,411 727 4,138
Less: CapEx (409) (593) (723) (252) (975)
Free Cash Flow $766 $1,725 $2,688 $475 $3,163
* FY14-15 represents Avago Technologies Limited historical results. Broadcom’s fiscal year ends on the Sunday closest
to 10/31.
(1) Reflects full-year contribution from Broadcom Corporation (acquisition closed February 1, 2016) by including Broadcom Corporation’s quarter
ended December 31, 2015 results.
2 | © 2017 Broadcom. All Rights Reserved. “Broadcom” refers to Broadcom Limited and its subsidiaries.
BROADCOM