Attached files
| file | filename |
|---|---|
| EX-99.3 - EX-99.3 - Cboe Global Markets, Inc. | a2230591zex-99_3.htm |
| EX-99.2 - EX-99.2 - Cboe Global Markets, Inc. | a2230591zex-99_2.htm |
| EX-99.1 - EX-99.1 - Cboe Global Markets, Inc. | a2230591zex-99_1.htm |
| EX-23.1 - EX-23.1 - Cboe Global Markets, Inc. | a2230591zex-23_1.htm |
| 8-K - 8-K - Cboe Global Markets, Inc. | a2230591z8-k.htm |
Exhibit 99.4
Investor Presentation January 2017
Forward-Looking Statements This presentation contains or may contain “forward-looking statements” within the meaning of Section 27A of the Securities Act of 1933, as amended, and Section 21E of the Securities Exchange Act of 1934, as amended. We intend these forward-looking statements to be covered by the safe harbor provisions for such statements. These statements can sometimes be identified by forward-looking words such as “may,” “might,” “should,” “expect,” “plan,” “anticipate,” “believe,” “estimate,” “predict,” “potential” or “continue,” and the negative of these terms and other comparable terminology. All statements that reflect our expectations, assumptions or projections about the future other than statements of historical fact are forward-looking statements. These forward-looking statements, which are subject to known and unknown risks, uncertainties and assumptions, may include projections of our future financial performance based on our growth strategies and anticipated trends in our business. These statements are only predictions based on our current expectations and projections about future events. There are important factors that could cause our actual results, level of activity, performance or achievements to differ materially from that expressed or implied by the forward-looking statements. While we believe we have identified the risks that are material to us, these risks and uncertainties are not exhaustive. Moreover, we operate in a very competitive and rapidly changing environment. New risks and uncertainties emerge from time to time, and it is not possible to predict all risks and uncertainties, nor can we assess the impact of all factors on our business or the extent to which any factor, or combination of factors, may cause actual results to differ materially from those contained in any forward-looking statements. Some factors that could cause actual results to differ include the loss of our right to exclusively list and trade certain index options and futures products; economic, political and market conditions; compliance with legal and regulatory obligations, including our obligations under the consent order that certain of our subsidiaries entered into with the U.S. Securities and Exchange Commission (the “SEC”) on June 11, 2013; disruptions of our and Bats’ current plans, operations and relationships with market participants caused by the announcement and pendency of the Acquisition; potential difficulties in our and Bats’ ability to retain employees as a result of the announcement and pendency of the Acquisition; increasing price competition in our industry; decreases in trading volumes or a shift in the mix of products traded on our exchanges; legislative or regulatory changes; increasing competition by foreign and domestic entities; our dependence on third party service providers; our index providers’ ability to perform under our agreements; our ability to operate our business without violating the intellectual property rights of others and the costs associated with protecting our intellectual property rights; our ability to accommodate trading volume and transaction traffic, including significant increases, without failure or degradation of performance of our systems; our ability to protect our systems and communication networks from security risks, including cyber-attacks; the accuracy of our estimates and expectations; our ability to maintain access fee revenues; our ability to meet our compliance obligations, including managing potential conflicts between our regulatory responsibilities and our for-profit status; the ability of our compliance and risk management methods to effectively monitor and manage our risks; our ability to attract and retain skilled management and other personnel; our ability to manage our growth and strategic acquisitions or alliances effectively; risks relating to the value of our shares to be issued in the Acquisition; legal proceedings that may be instituted against us and Bats following announcement of the Acquisition; and other risks and uncertainties discussed in our reports filed with the SEC. In addition, if the Acquisition is consummated, the following factors may cause our actual results to differ materially from those in forward-looking statements unanticipated difficulties or expenditures relating to the Acquisition, including, without limitation, difficulties that result in the failure to realize expected synergies, efficiencies and cost savings from the Acquisition within the expected time period (if at all), whether in connection with integration, combining trading platforms, broadening distribution of product offerings or otherwise; a failure to integrate successfully or a material disruption in information technology systems; a decrease in our business flexibility in connection with the incurrence of indebtedness by us to finance the Acquisition; increases to our borrowing costs due to a deterioration in our credit profile; failure of the combined company to manage its growth; failure by the combined company to retain and motivate key employees; inability of the combined company to retain and recruit qualified employees in sufficient numbers; changes to the board of directors and management of the combined company that may affect the strategy of the combined company as compared to that of CBOE Holdings and Bats; failure by entities who are affiliates of Bats’ significant stockholders to continue to generate revenue or provide liquidity and other services at current levels after the completion of the Acquisition; the significant transaction and integration costs that we and Bats will incur in connection with the Acquisition; any impairment in the carrying value of goodwill or other intangibles; and negative effects on the market price of our common stock following the Acquisition if the Acquisition is not accretive and causes dilution to the combined company’s earnings per share. We caution you not to place undue reliance on the forward-looking statements, which speak only as of the date of this presentation. We undertake no obligation to update or revise any forward-looking statements, whether as a result of new information, future events or otherwise. If we do update or correct one or more of these statements, investors and others should not conclude that we will make additional updates or corrections.
Additional Information Additional Information Regarding the Transaction and Where to Find It This presentation does not constitute an offer to sell or the solicitation of an offer to buy any securities or a solicitation of any vote or approval. This presentation is being made in respect of the proposed merger transaction involving CBOE, Bats, CBOE Corporation and CBOE V, LLC. The issuance of shares of CBOE common stock in connection with the proposed merger will be submitted to the stockholders of CBOE for their consideration, and the proposed merger will be submitted to the stockholders of Bats for their consideration. In connection therewith, CBOE filed with the SEC on December 12, 2016 a definitive joint proxy statement/prospectus dated December 9, 2016, and each of the companies may be filing with the SEC other documents regarding the proposed transaction. CBOE and Bats commenced mailing of the definitive joint proxy statement/prospectus to CBOE stockholders and Bats stockholders on December 12, 2016. BEFORE MAKING ANY VOTING OR ANY INVESTMENT DECISION, INVESTORS AND SECURITY HOLDERS OF CBOE AND/OR BATS ARE URGED TO READ THE DEFINITIVE JOINT PROXY STATEMENT/PROSPECTUS REGARDING THE PROPOSED TRANSACTION AND ANY OTHER RELEVANT DOCUMENTS FILED OR TO BE FILED WITH THE SEC CAREFULLY AND IN THEIR ENTIRETY WHEN THEY BECOME AVAILABLE BECAUSE THEY WILL CONTAIN IMPORTANT INFORMATION ABOUT THE PROPOSED TRANSACTION. Investors and security holders may obtain free copies of the definitive joint proxy statement/prospectus, any amendments or supplements thereto and other documents containing important information about each of CBOE and Bats, as such documents are filed with the SEC, through the website maintained by the SEC at www.sec.gov. Copies of the documents filed with the SEC by CBOE will be available free of charge on CBOE’s website at http://ir.cboe.com/financial-information/sec-filings.aspx under the heading “SEC Filings” or by contacting CBOE’s Investor Relations Department at (312) 786-7136. Copies of the documents filed with the SEC by Bats will be available free of charge on Bats’ website at http://www.bats.com/investor_relations/financials/ under the heading “SEC Filings” or by contacting Bats’ Investor Relations Department at (913) 815-7132. Participants in the Solicitation CBOE, Bats, their respective directors and executive officers, certain other members of CBOE’s and Bats’ respective management and certain of CBOE’s and Bats’ respective employees may be deemed to be participants in the solicitation of proxies in connection with the proposed transaction. Information about the directors and executive officers of CBOE is set forth in its proxy statement for its 2016 annual meeting of stockholders, which was filed with the SEC on April 6, 2016, and its annual report on Form 10-K for the fiscal year ended December 31, 2015, which was filed with the SEC on February 19, 2016, and information about the directors and executive officers of Bats is set forth in its final prospectus in connection with its initial public offering, which was filed with the SEC on April 15, 2016. Each of these documents can be obtained free of charge from the sources indicated above. Other information regarding the participants in the proxy solicitation and a description of their direct and indirect interests, by security holdings or otherwise, is contained in the definitive joint proxy statement/prospectus and may be available in other relevant materials to be filed with the SEC when they become available. CBOE has filed a registration statement (including a prospectus) with the SEC with respect to which this presentation relates. Before you invest, you should read the prospectus in that registration statement and any prospectus supplement for any potential offering and the other documents CBOE has filed with the SEC for more complete information about CBOE and any potential offering. You may get these documents for free by visiting EDGAR on the SEC website at http://www.sec.gov. Alternatively, CBOE or any underwriter or any dealer participating in any offering will arrange to send you the prospectus and any related prospectus supplement if you request it.
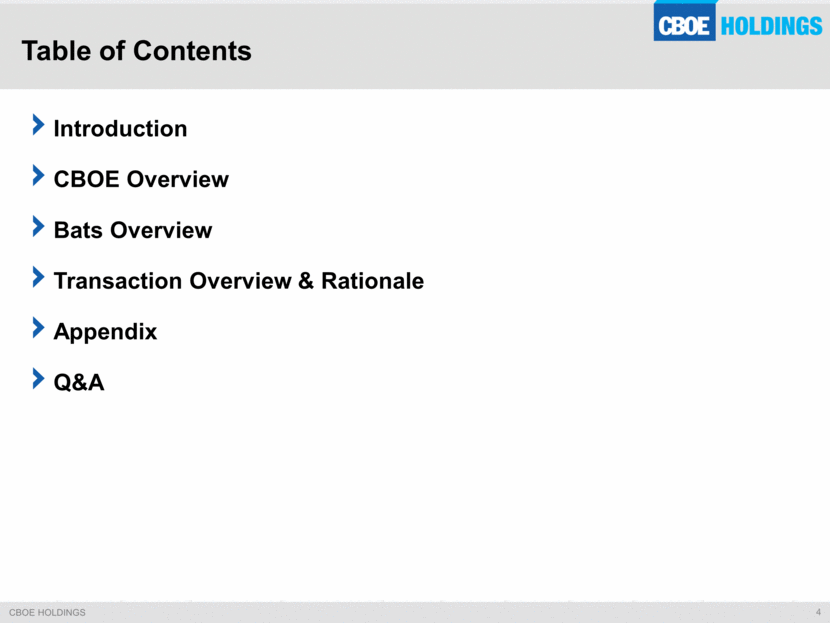
Table of Contents Introduction CBOE Overview Bats Overview Transaction Overview & Rationale Appendix Q&A
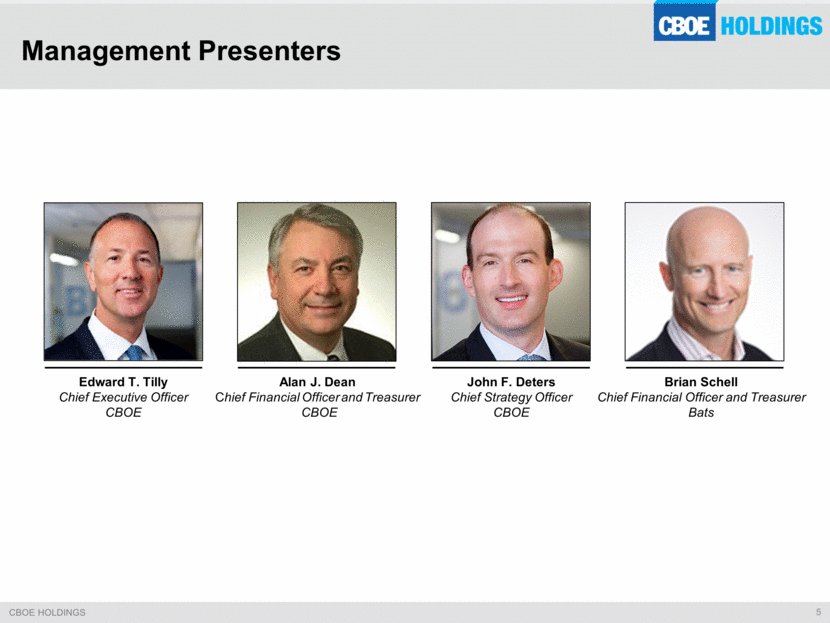
Management Presenters Alan J. Dean Chief Financial Officer and Treasurer CBOE Brian Schell Chief Financial Officer and Treasurer Bats Edward T. Tilly Chief Executive Officer CBOE John F. Deters Chief Strategy Officer CBOE
CBOE Overview

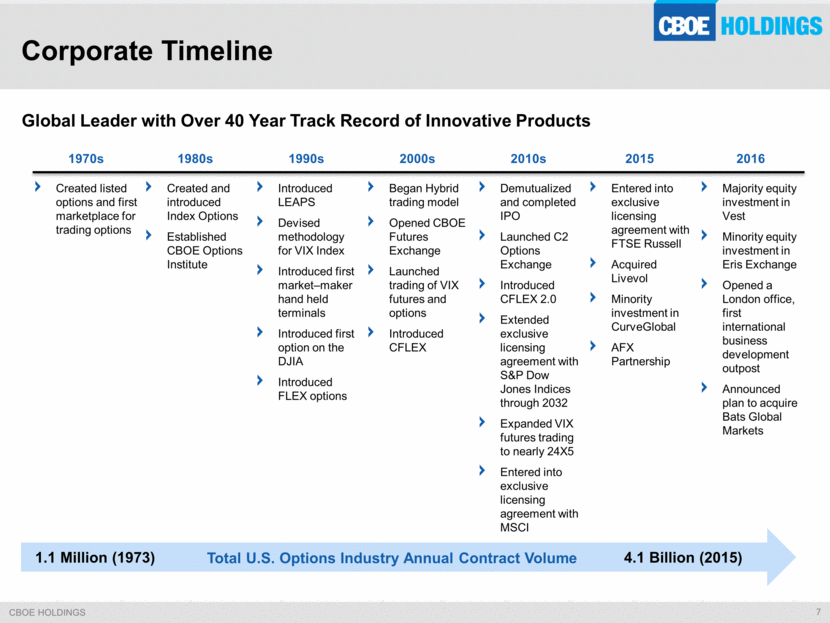
Corporate Timeline Created listed options and first marketplace for trading options Introduced LEAPS Devised methodology for VIX Index Introduced first market–maker hand held terminals Introduced first option on the DJIA Introduced FLEX options Began Hybrid trading model Opened CBOE Futures Exchange Launched trading of VIX futures and options Introduced CFLEX Created and introduced Index Options Established CBOE Options Institute Demutualized and completed IPO Launched C2 Options Exchange Introduced CFLEX 2.0 Extended exclusive licensing agreement with S&P Dow Jones Indices through 2032 Expanded VIX futures trading to nearly 24X5 Entered into exclusive licensing agreement with MSCI Entered into exclusive licensing agreement with FTSE Russell Acquired Livevol Minority investment in CurveGlobal AFX Partnership Majority equity investment in Vest Minority equity investment in Eris Exchange Opened a London office, first international business development outpost Announced plan to acquire Bats Global Markets 1970s 1980s 1990s 2000s 2010s 2015 2016 Total U.S. Options Industry Annual Contract Volume 1.1 Million (1973) 4.1 Billion (2015) Global Leader with Over 40 Year Track Record of Innovative Products
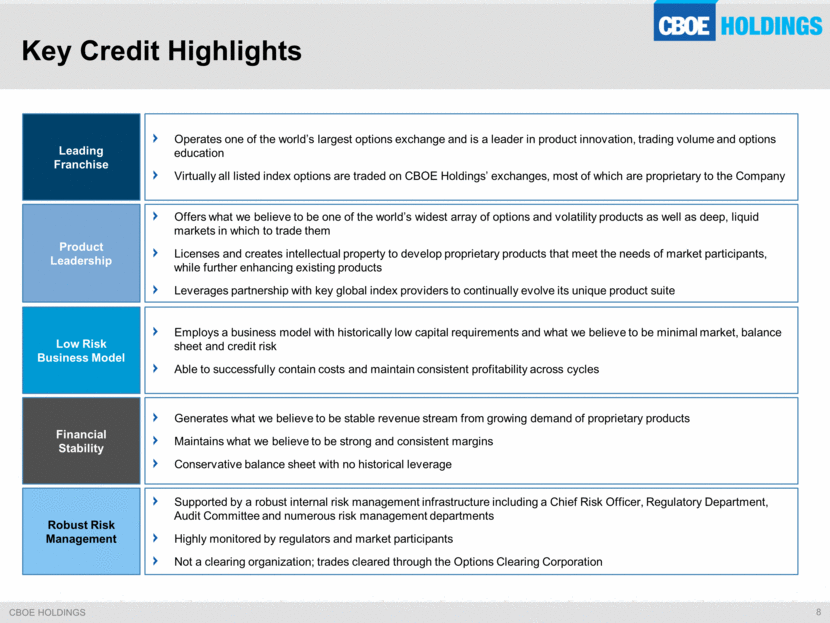
Key Credit Highlights Leading Franchise Operates one of the world’s largest options exchange and is a leader in product innovation, trading volume and options education Virtually all listed index options are traded on CBOE Holdings’ exchanges, most of which are proprietary to the Company Product Leadership Offers what we believe to be one of the world’s widest array of options and volatility products as well as deep, liquid markets in which to trade them Licenses and creates intellectual property to develop proprietary products that meet the needs of market participants, while further enhancing existing products Leverages partnership with key global index providers to continually evolve its unique product suite Low Risk Business Model Employs a business model with historically low capital requirements and what we believe to be minimal market, balance sheet and credit risk Able to successfully contain costs and maintain consistent profitability across cycles Financial Stability Generates what we believe to be stable revenue stream from growing demand of proprietary products Maintains what we believe to be strong and consistent margins Conservative balance sheet with no historical leverage Supported by a robust internal risk management infrastructure including a Chief Risk Officer, Regulatory Department, Audit Committee and numerous risk management departments Highly monitored by regulators and market participants Not a clearing organization; trades cleared through the Options Clearing Corporation Robust Risk Management
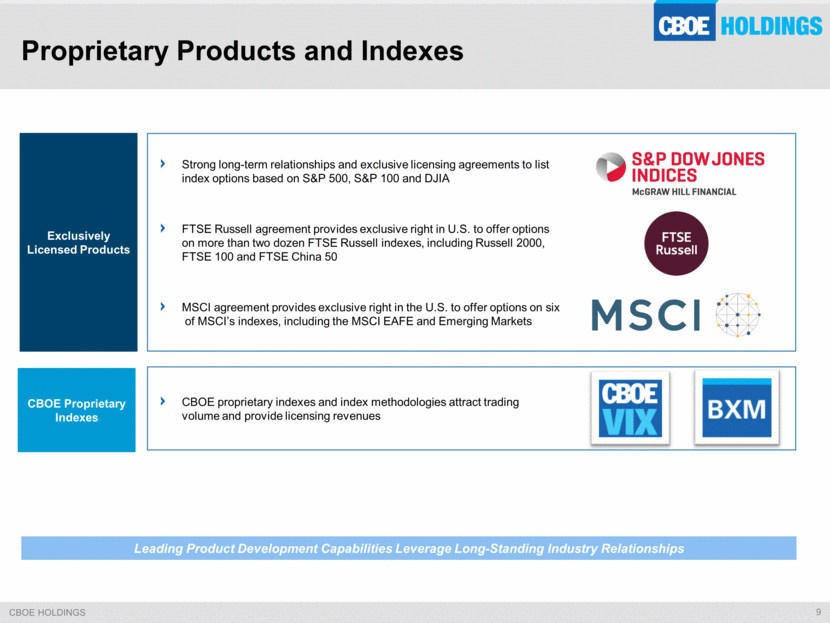
Proprietary Products and Indexes CBOE Proprietary Indexes Exclusively Licensed Products Strong long-term relationships and exclusive licensing agreements to list index options based on S&P 500, S&P 100 and DJIA FTSE Russell agreement provides exclusive right in U.S. to offer options on more than two dozen FTSE Russell indexes, including Russell 2000, FTSE 100 and FTSE China 50 MSCI agreement provides exclusive right in the U.S. to offer options on six of MSCI’s indexes, including the MSCI EAFE and Emerging Markets CBOE proprietary indexes and index methodologies attract trading volume and provide licensing revenues Leading Product Development Capabilities Leverage Long-Standing Industry Relationships
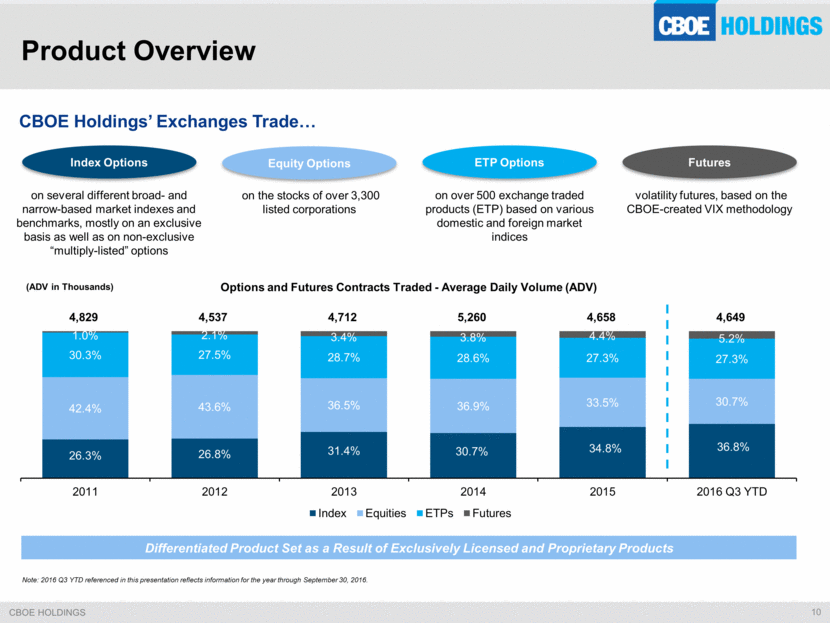
Product Overview CBOE Holdings’ Exchanges Trade Index Options on several different broad- and narrow-based market indexes and benchmarks, mostly on an exclusive basis as well as on non-exclusive “multiply-listed” options Futures volatility futures, based on the CBOE-created VIX methodology Equity Options on the stocks of over 3,300 listed corporations ETP Options on over 500 exchange traded products (ETP) based on various domestic and foreign market indices 4,829 4,537 4,712 5,260 4,658 4,649 Options and Futures Contracts Traded - Average Daily Volume (ADV) Differentiated Product Set as a Result of Exclusively Licensed and Proprietary Products (ADV in Thousands) Note: 2016 Q3 YTD referenced in this presentation reflects information for the year through September 30, 2016. 26.3% 26.8% 31.4% 30.7% 34.8% 36.8% 42.4% 43.6% 36.5% 36.9% 33.5% 30.7% 30.3% 27.5% 28.7% 28.6% 27.3% 27.3% 1.0% 2.1% 3.4% 3.8% 4.4% 5.2% 2011 2012 2013 2014 2015 2016 Q3 YTD Index Equities ETPs Futures
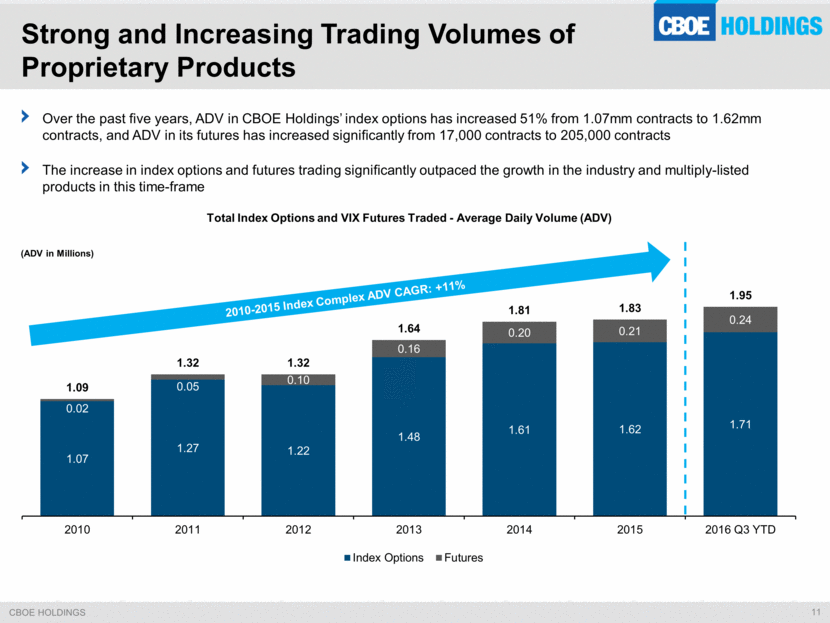
Strong and Increasing Trading Volumes of Proprietary Products Over the past five years, ADV in CBOE Holdings’ index options has increased 51% from 1.07mm contracts to 1.62mm contracts, and ADV in its futures has increased significantly from 17,000 contracts to 205,000 contracts The increase in index options and futures trading significantly outpaced the growth in the industry and multiply-listed products in this time-frame Total Index Options and VIX Futures Traded - Average Daily Volume (ADV) (ADV in Millions) 2010-2015 Index Complex ADV CAGR: +11% 1.07 1.27 1.22 1.48 1.61 1.62 1.71 0.02 0.05 0.10 0.16 0.20 0.21 0.24 1.09 1.32 1.32 1.64 1.81 1.83 1.95 2010 2011 2012 2013 2014 2015 2016 Q3 YTD Index Options Futures
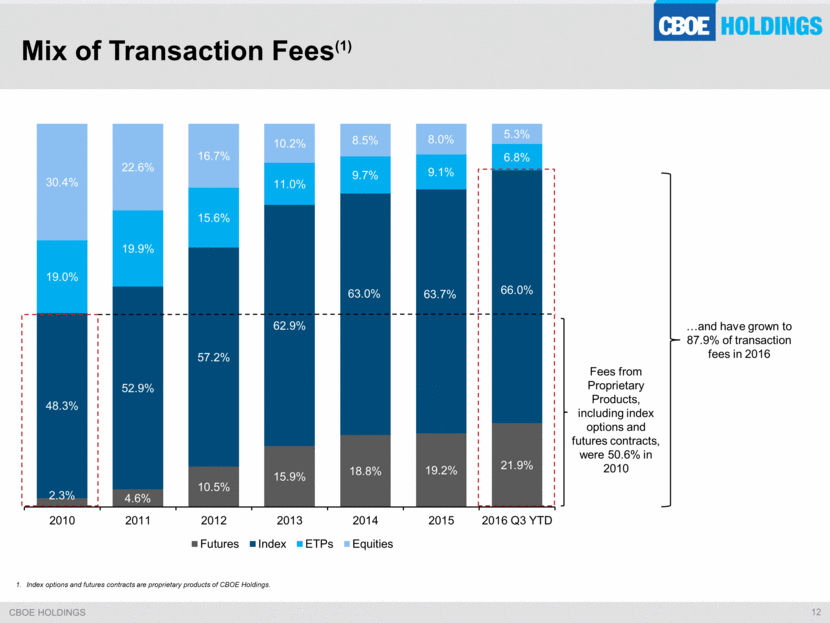
Mix of Transaction Fees(1) Index options and futures contracts are proprietary products of CBOE Holdings. Fees from Proprietary Products, including index options and futures contracts, were 50.6% in 2010 and have grown to 87.9% of transaction fees in 2016 2.3% 4.6% 10.5% 15.9% 18.8% 19.2% 21.9% 48.3% 52.9% 57.2% 62.9% 63.0% 63.7% 66.0% 19.0% 19.9% 15.6% 11.0% 9.7% 9.1% 6.8% 30.4% 22.6% 16.7% 10.2% 8.5% 8.0% 5.3% 2010 2011 2012 2013 2014 2015 2016 Q3 YTD Futures Index ETPs Equities
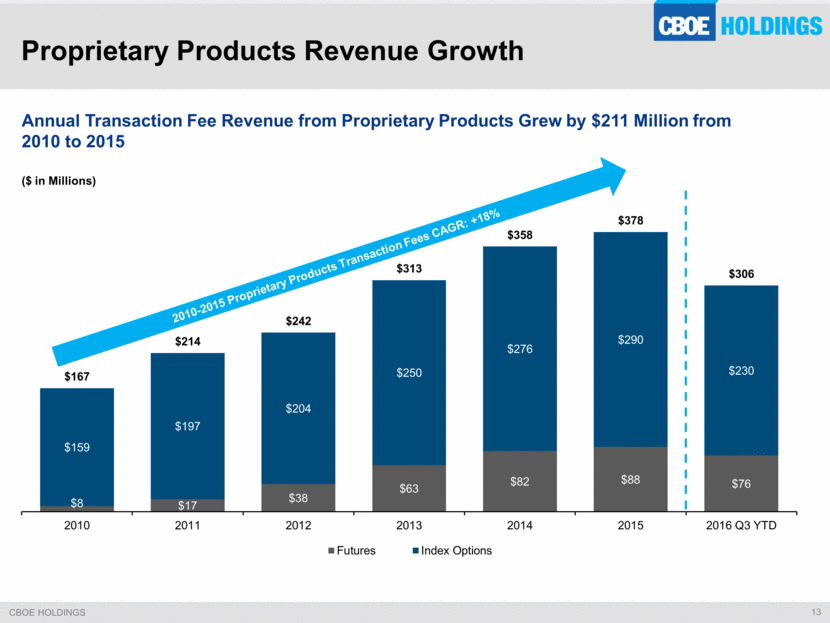
Proprietary Products Revenue Growth Annual Transaction Fee Revenue from Proprietary Products Grew by $211 Million from 2010 to 2015 2010-2015 Proprietary Products Transaction Fees CAGR: +18% ($ in Millions) $8 $17 $38 $63 $82 $88 $76 $159 $197 $204 $250 $276 $290 $230 $167 $214 $242 $313 $358 $378 $306 2010 2011 2012 2013 2014 2015 2016 Q3 YTD Futures Index Options
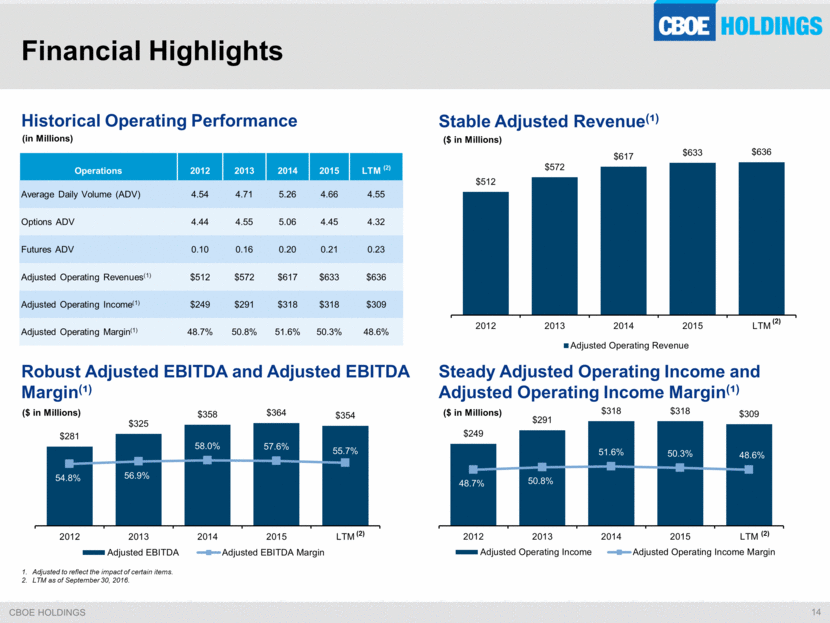
Financial Highlights Adjusted to reflect the impact of certain items. LTM as of September 30, 2016. Historical Operating Performance Stable Adjusted Revenue(¹) Robust Adjusted EBITDA and Adjusted EBITDA Margin(¹) Steady Adjusted Operating Income and Adjusted Operating Income Margin(¹) Operations 2012 2013 2014 2015 LTM (2) Average Daily Volume (ADV) 4.54 4.71 5.26 4.66 4.55 Options ADV 4.44 4.55 5.06 4.45 4.32 Futures ADV 0.10 0.16 0.20 0.21 0.23 Adjusted Operating Revenues(1) $512 $572 $617 $633 $636 Adjusted Operating Income(1) $249 $291 $318 $318 $309 Adjusted Operating Margin(1) 48.7% 50.8% 51.6% 50.3% 48.6% (in Millions) ($ in Millions) ($ in Millions) ($ in Millions) (2) (2) (2) $512 $ 572 $617 $633 $636 2012 2013 2014 2015 LTM Adjusted Operating Revenue $281 $325 $358 $364 $354 54.8% 56.9% 58.0% 57.6% 55.7% 2012 2013 2014 2015 LTM Adjusted EBITDA Adjusted EBITDA Margin $249 $291 $318 $318 $309 48.7% 50.8% 51.6% 50.3% 48.6% 2012 2013 2014 2015 LTM Adjusted Operating Income Adjusted Operating Income Margin
Bats Overview
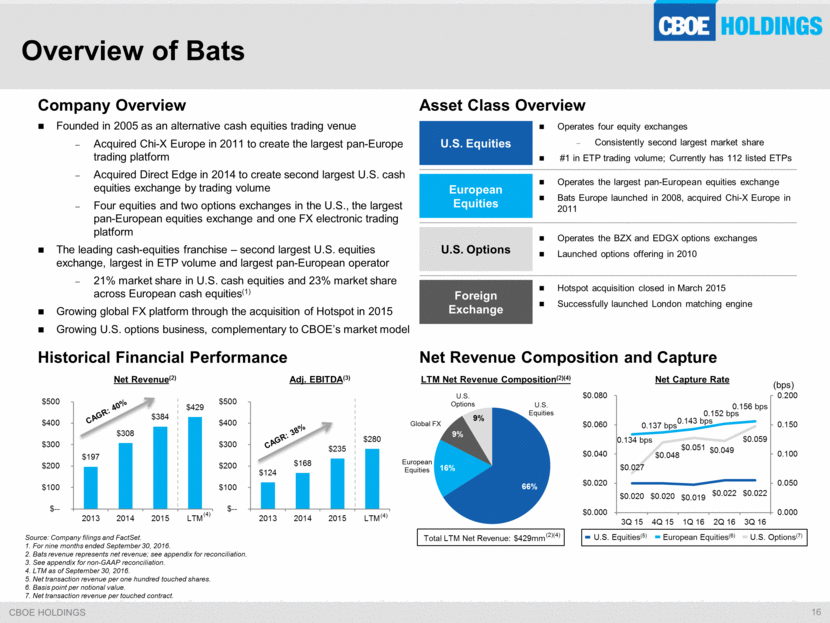
Source: Company filings and FactSet. 1. For nine months ended September 30, 2016. 2. Bats revenue represents net revenue; see appendix for reconciliation. 3. See appendix for non-GAAP reconciliation. 4. LTM as of September 30, 2016. 5. Net transaction revenue per one hundred touched shares. 6. Basis point per notional value. 7. Net transaction revenue per touched contract. Company Overview Founded in 2005 as an alternative cash equities trading venue Acquired Chi-X Europe in 2011 to create the largest pan-Europe trading platform Acquired Direct Edge in 2014 to create second largest U.S. cash equities exchange by trading volume Four equities and two options exchanges in the U.S., the largest pan-European equities exchange and one FX electronic trading platform The leading cash-equities franchise – second largest U.S. equities exchange, largest in ETP volume and largest pan-European operator 21% market share in U.S. cash equities and 23% market share across European cash equities(1) Growing global FX platform through the acquisition of Hotspot in 2015 Growing U.S. options business, complementary to CBOE’s market model Asset Class Overview U.S. Equities European Equities U.S. Options Foreign Exchange Historical Financial Performance Net Revenue Composition and Capture Operates four equity exchanges Consistently second largest market share #1 in ETP trading volume; Currently has 112 listed ETPs Operates the largest pan-European equities exchange Bats Europe launched in 2008, acquired Chi-X Europe in 2011 Operates the BZX and EDGX options exchanges Launched options offering in 2010 Hotspot acquisition closed in March 2015 Successfully launched London matching engine (bps) LTM Net Revenue Composition(2)(4) Net Capture Rate European Equities(6) U.S. Options(7) U.S. Equities(5) Net Revenue(2) Adj. EBITDA(3) CAGR: 40% CAGR: 38% Total LTM Net Revenue: $429mm (4) (4) (2)(4) Overview of Bats $0.020 $0.020 $0.019 $0.022 $0.022 $0.027 $0.048 $0.051 $0.049 $0.059 0.134 bps 0.137 bps 0.143 bps 0.152 bps 0.156 bps 0.000 0.050 0.100 0.150 0.200 $0.000 $0.020 $0.040 $0.060 $0.080 3Q 15 4Q 15 1Q 16 2Q 16 3Q 16 66% 16% 9% 9% U.S. Equities European Equities Global FX U.S. Options $197 $308 $384 $429 $-- $100 $200 $300 $400 $500 2013 2014 2015 LTM $124 $168 $235 $280 $-- $100 $200 $300 $400 $500 2013 2014 2015 LTM
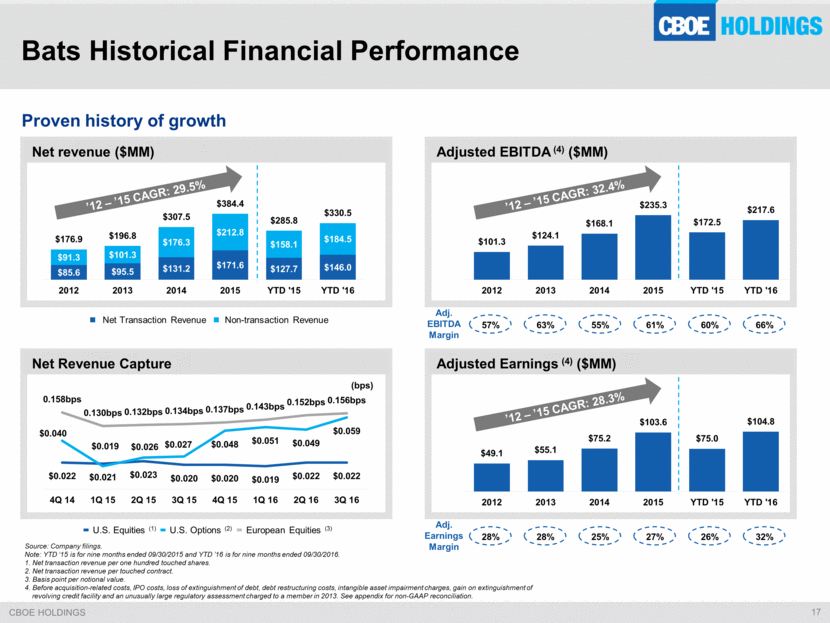
Bats Historical Financial Performance Source: Company filings. Note: YTD ‘15 is for nine months ended 09/30/2015 and YTD ’16 is for nine months ended 09/30/2016. 1. Net transaction revenue per one hundred touched shares. 2. Net transaction revenue per touched contract. 3. Basis point per notional value. 4. Before acquisition-related costs, IPO costs, loss of extinguishment of debt, debt restructuring costs, intangible asset impairment charges, gain on extinguishment of revolving credit facility and an unusually large regulatory assessment charged to a member in 2013. See appendix for non-GAAP reconciliation. Net Transaction Revenue Non-transaction Revenue ’12 – ’15 CAGR: 29.5% ’12 – ’15 CAGR: 32.4% Adj. EBITDA Margin 57% 63% 55% 66% 61% 60% ’12 – ’15 CAGR: 28.3% Adj. Earnings Margin 28% 28% 25% 32% 27% 26% (bps) European Equities (3) U.S. Options (2) U.S. Equities (1) Proven history of growth $85.6 $95.5 $131.2 $171.6 $127.7 $146.0 $91.3 $101.3 $176.3 $212.8 $158.1 $184.5 $176.9 $196.8 $307.5 $384.4 $285.8 $330.5 2012 2013 2014 2015 YTD '15 YTD '16 Net revenue ($MM) $101.3 $124.1 $168.1 $235.3 $172.5 $217.6 2012 2013 2014 2015 YTD '15 YTD '16 Adjusted EBITDA (4) ($MM) $0.022 $0.021 $0.023 $0.020 $0.020 $0.019 $0.022 $0.022 $0.040 $0.019 $0.026 $0.027 $0.048 $0.051 $0.049 $0.059 0.158bps 0.130bps 0.132bps 0.134bps 0.137bps 0.143bps 0.152bps 0.156bps 4Q 14 1Q 15 2Q 15 3Q 15 4Q 15 1Q 16 2Q 16 3Q 16 Net Revenue Capture $49.1 $55.1 $75.2 $103.6 $75.0 $104.8 2012 2013 2014 2015 YTD '15 YTD '16 Adjusted Earnings (4) ($MM)
Transaction Overview and Rationale
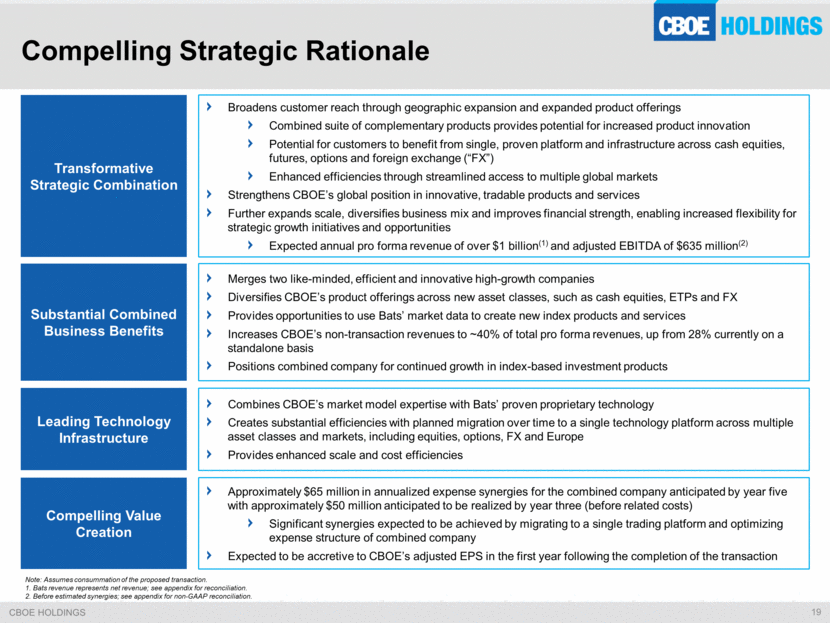
Compelling Strategic Rationale Compelling Value Creation Approximately $65 million in annualized expense synergies for the combined company anticipated by year five with approximately $50 million anticipated to be realized by year three (before related costs) Significant synergies expected to be achieved by migrating to a single trading platform and optimizing expense structure of combined company Expected to be accretive to CBOE’s adjusted EPS in the first year following the completion of the transaction Substantial Combined Business Benefits Merges two like-minded, efficient and innovative high-growth companies Diversifies CBOE’s product offerings across new asset classes, such as cash equities, ETPs and FX Provides opportunities to use Bats’ market data to create new index products and services Increases CBOE’s non-transaction revenues to ~40% of total pro forma revenues, up from 28% currently on a standalone basis Positions combined company for continued growth in index-based investment products Transformative Strategic Combination Broadens customer reach through geographic expansion and expanded product offerings Combined suite of complementary products provides potential for increased product innovation Potential for customers to benefit from single, proven platform and infrastructure across cash equities, futures, options and foreign exchange (“FX”) Enhanced efficiencies through streamlined access to multiple global markets Strengthens CBOE’s global position in innovative, tradable products and services Further expands scale, diversifies business mix and improves financial strength, enabling increased flexibility for strategic growth initiatives and opportunities Expected annual pro forma revenue of over $1 billion(1) and adjusted EBITDA of $635 million(2) Combines CBOE’s market model expertise with Bats’ proven proprietary technology Creates substantial efficiencies with planned migration over time to a single technology platform across multiple asset classes and markets, including equities, options, FX and Europe Provides enhanced scale and cost efficiencies Leading Technology Infrastructure Note: Assumes consummation of the proposed transaction. 1. Bats revenue represents net revenue; see appendix for reconciliation. 2. Before estimated synergies; see appendix for non-GAAP reconciliation.
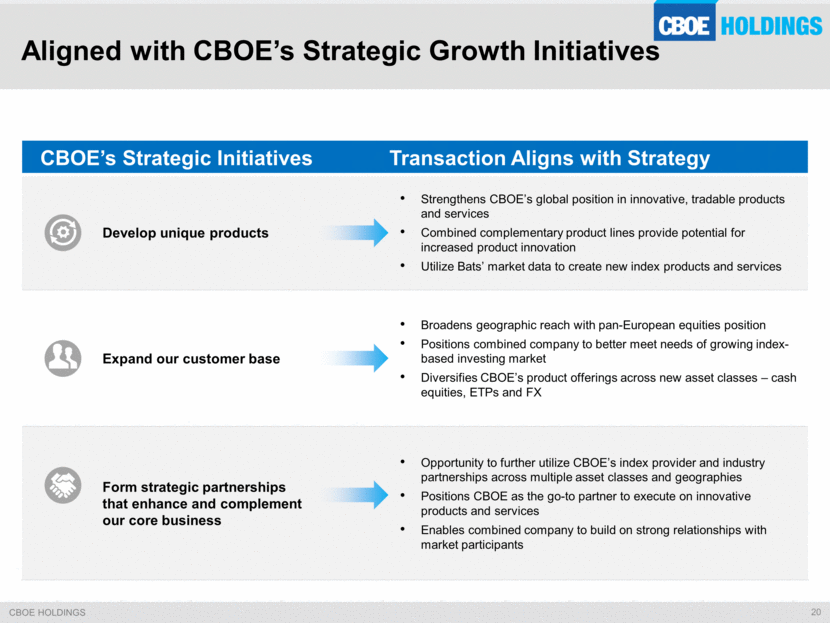
CBOE’s Strategic Initiatives Transaction Aligns with Strategy Develop unique products Strengthens CBOE’s global position in innovative, tradable products and services Combined complementary product lines provide potential for increased product innovation Utilize Bats’ market data to create new index products and services Expand our customer base Broadens geographic reach with pan-European equities position Positions combined company to better meet needs of growing index-based investing market Diversifies CBOE’s product offerings across new asset classes – cash equities, ETPs and FX Form strategic partnerships that enhance and complement our core business Opportunity to further utilize CBOE’s index provider and industry partnerships across multiple asset classes and geographies Positions CBOE as the go-to partner to execute on innovative products and services Enables combined company to build on strong relationships with market participants Aligned with CBOE’s Strategic Growth Initiatives
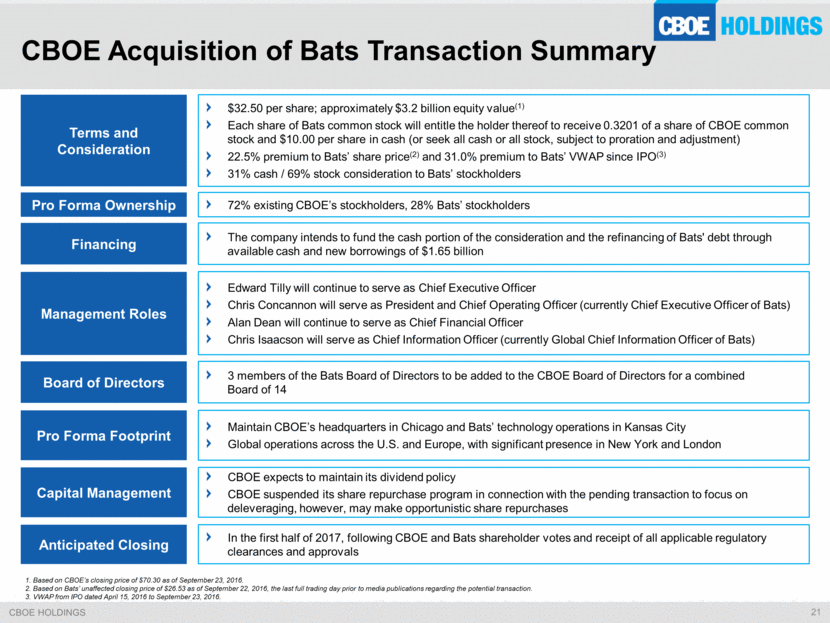
CBOE Acquisition of Bats Transaction Summary Terms and Consideration $32.50 per share; approximately $3.2 billion equity value(1) Each share of Bats common stock will entitle the holder thereof to receive 0.3201 of a share of CBOE common stock and $10.00 per share in cash (or seek all cash or all stock, subject to proration and adjustment) 22.5% premium to Bats’ share price(2) and 31.0% premium to Bats’ VWAP since IPO(3) 31% cash / 69% stock consideration to Bats’ stockholders Pro Forma Ownership 72% existing CBOE’s stockholders, 28% Bats’ stockholders Financing The company intends to fund the cash portion of the consideration and the refinancing of Bats' debt through available cash and new borrowings of $1.65 billion Capital Management CBOE expects to maintain its dividend policy CBOE suspended its share repurchase program in connection with the pending transaction to focus on deleveraging, however, may make opportunistic share repurchases Anticipated Closing In the first half of 2017, following CBOE and Bats shareholder votes and receipt of all applicable regulatory clearances and approvals 1. Based on CBOE’s closing price of $70.30 as of September 23, 2016. 2. Based on Bats’ unaffected closing price of $26.53 as of September 22, 2016, the last full trading day prior to media publications regarding the potential transaction. 3. VWAP from IPO dated April 15, 2016 to September 23, 2016. Pro Forma Footprint Maintain CBOE’s headquarters in Chicago and Bats’ technology operations in Kansas City Global operations across the U.S. and Europe, with significant presence in New York and London Board of Directors 3 members of the Bats Board of Directors to be added to the CBOE Board of Directors for a combined Board of 14 Management Roles Edward Tilly will continue to serve as Chief Executive Officer Chris Concannon will serve as President and Chief Operating Officer (currently Chief Executive Officer of Bats) Alan Dean will continue to serve as Chief Financial Officer Chris Isaacson will serve as Chief Information Officer (currently Global Chief Information Officer of Bats)
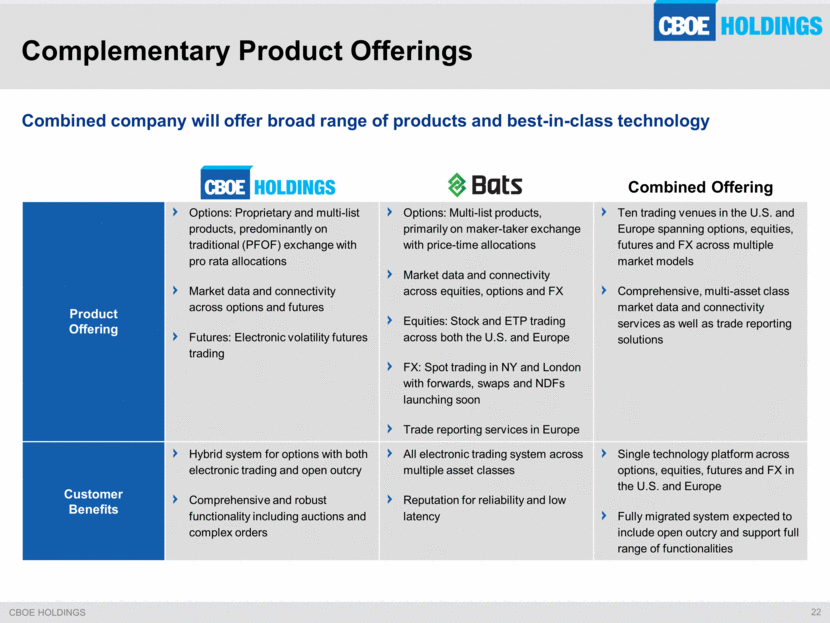
Complementary Product Offerings Combined Offering Product Offering Options: Proprietary and multi-list products, predominantly on traditional (PFOF) exchange with pro rata allocations Market data and connectivity across options and futures Futures: Electronic volatility futures trading Options: Multi-list products, primarily on maker-taker exchange with price-time allocations Market data and connectivity across equities, options and FX Equities: Stock and ETP trading across both the U.S. and Europe FX: Spot trading in NY and London with forwards, swaps and NDFs launching soon Trade reporting services in Europe Ten trading venues in the U.S. and Europe spanning options, equities, futures and FX across multiple market models Comprehensive, multi-asset class market data and connectivity services as well as trade reporting solutions Customer Benefits Hybrid system for options with both electronic trading and open outcry Comprehensive and robust functionality including auctions and complex orders All electronic trading system across multiple asset classes Reputation for reliability and low latency Single technology platform across options, equities, futures and FX in the U.S. and Europe Fully migrated system expected to include open outcry and support full range of functionalities Combined company will offer broad range of products and best-in-class technology
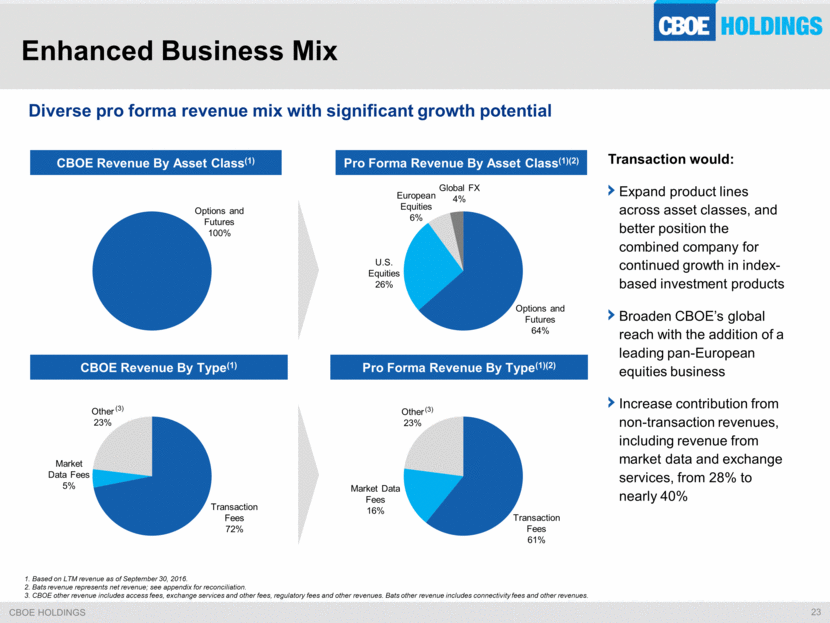
Diverse pro forma revenue mix with significant growth potential Enhanced Business Mix CBOE Revenue By Type(1) CBOE Revenue By Asset Class(1) Pro Forma Revenue By Asset Class(1)(2) Pro Forma Revenue By Type(1)(2) Options and Futures 100% Global FX 4% U.S. Equities 26% European Equities 6% Options and Futures 64% Other 23% Market Data Fees 5% Transaction Fees 72% Transaction Fees 61% Other 23% Market Data Fees 16% 1. Based on LTM revenue as of September 30, 2016. 2. Bats revenue represents net revenue; see appendix for reconciliation. 3. CBOE other revenue includes access fees, exchange services and other fees, regulatory fees and other revenues. Bats other revenue includes connectivity fees and other revenues. Transaction would: Expand product lines across asset classes, and better position the combined company for continued growth in index-based investment products Broaden CBOE’s global reach with the addition of a leading pan-European equities business Increase contribution from non-transaction revenues, including revenue from market data and exchange services, from 28% to nearly 40% (3) (3)
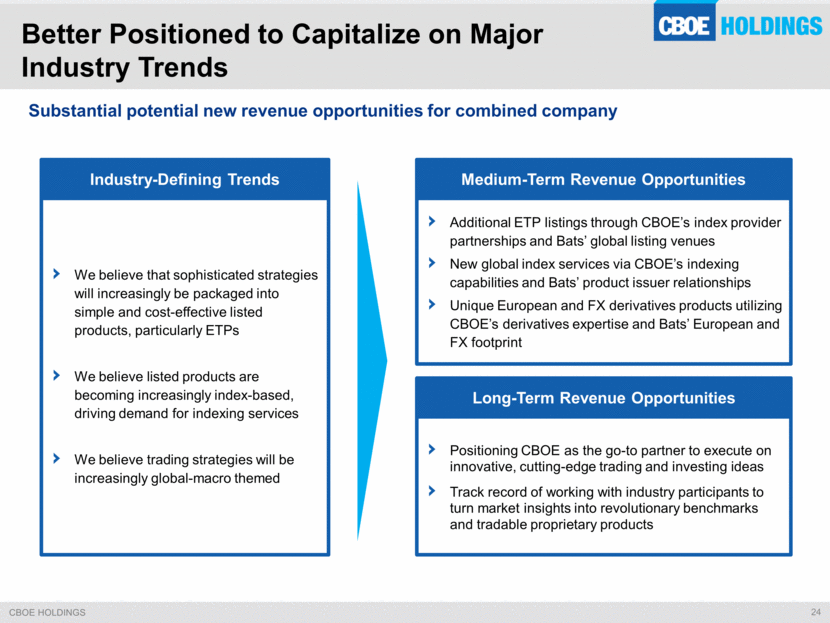
We believe that sophisticated strategies will increasingly be packaged into simple and cost-effective listed products, particularly ETPs We believe listed products are becoming increasingly index-based, driving demand for indexing services We believe trading strategies will be increasingly global-macro themed Better Positioned to Capitalize on Major Industry Trends Industry-Defining Trends Additional ETP listings through CBOE’s index provider partnerships and Bats’ global listing venues New global index services via CBOE’s indexing capabilities and Bats’ product issuer relationships Unique European and FX derivatives products utilizing CBOE’s derivatives expertise and Bats’ European and FX footprint Medium-Term Revenue Opportunities Positioning CBOE as the go-to partner to execute on innovative, cutting-edge trading and investing ideas Track record of working with industry participants to turn market insights into revolutionary benchmarks and tradable proprietary products Long-Term Revenue Opportunities Substantial potential new revenue opportunities for combined company
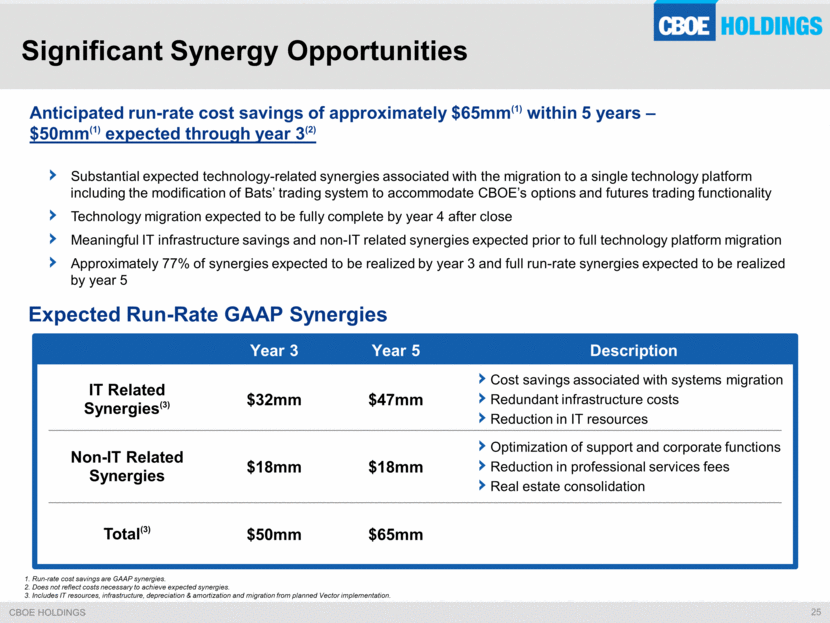
Significant Synergy Opportunities Substantial expected technology-related synergies associated with the migration to a single technology platform including the modification of Bats’ trading system to accommodate CBOE’s options and futures trading functionality Technology migration expected to be fully complete by year 4 after close Meaningful IT infrastructure savings and non-IT related synergies expected prior to full technology platform migration Approximately 77% of synergies expected to be realized by year 3 and full run-rate synergies expected to be realized by year 5 Expected Run-Rate GAAP Synergies Description Optimization of support and corporate functions Reduction in professional services fees Real estate consolidation IT Related Synergies(3) $47mm Total(3) Non-IT Related Synergies $18mm $65mm Cost savings associated with systems migration Redundant infrastructure costs Reduction in IT resources 1. Run-rate cost savings are GAAP synergies. 2. Does not reflect costs necessary to achieve expected synergies. 3. Includes IT resources, infrastructure, depreciation & amortization and migration from planned Vector implementation. $32mm $18mm $50mm Year 5 Year 3 Anticipated run-rate cost savings of approximately $65mm(1) within 5 years – $50mm(1) expected through year 3(2)
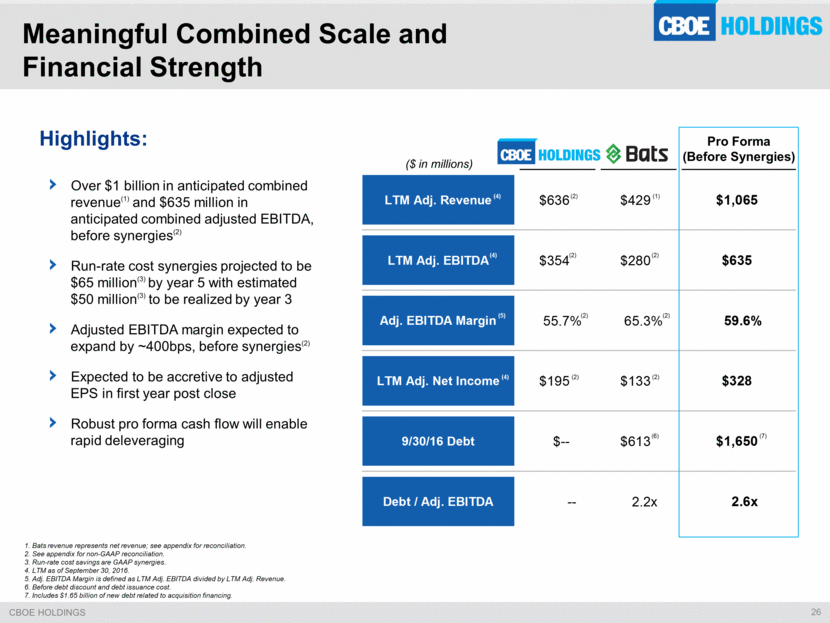
Meaningful Combined Scale and Financial Strength Highlights: Over $1 billion in anticipated combined revenue(1) and $635 million in anticipated combined adjusted EBITDA, before synergies(2) Run-rate cost synergies projected to be $65 million(3) by year 5 with estimated $50 million(3) to be realized by year 3 Adjusted EBITDA margin expected to expand by ~400bps, before synergies(2) Expected to be accretive to adjusted EPS in first year post close Robust pro forma cash flow will enable rapid deleveraging 1. Bats revenue represents net revenue; see appendix for reconciliation. 2. See appendix for non-GAAP reconciliation. 3. Run-rate cost savings are GAAP synergies. 4. LTM as of September 30, 2016. 5. Adj. EBITDA Margin is defined as LTM Adj. EBITDA divided by LTM Adj. Revenue. 6. Before debt discount and debt issuance cost. 7. Includes $1.65 billion of new debt related to acquisition financing. Pro Forma (Before Synergies) ($ in millions) (7) (4) (4) (4) (5) (6) (2) (2) (2) (2) (2) (1) (2) (2) LTM Adj. Revenue $636 $429 $1,065 LTM Adj. EBITDA $354 $280 $635 Adj. EBITDA Margin 55.7% 65.3% 59.6% LTM Adj. Net Income $195 $133 $328 9/30/16 Debt $-- $613 $1,650 Debt / Adj. EBITDA -- 2.2x 2.6x
Appendix
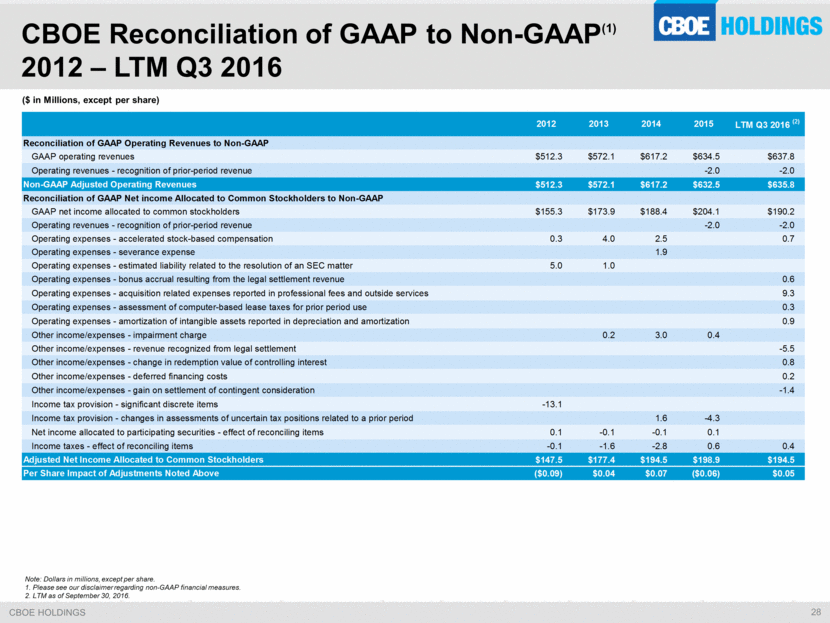
CBOE Reconciliation of GAAP to Non-GAAP(1) 2012 – LTM Q3 2016 ($ in Millions, except per share) Note: Dollars in millions, except per share. 1. Please see our disclaimer regarding non-GAAP financial measures. 2. LTM as of September 30, 2016. 2012 2013 2014 2015 LTM Q3 2016 (2) Reconciliation of GAAP Operating Revenues to Non-GAAP GAAP operating revenues $512.3 $572.1 $617.2 $634.5 $637.8 Operating revenues - recognition of prior-period revenue -2.0 -2.0 Non-GAAP Adjusted Operating Revenues $512.3 $572.1 $617.2 $632.5 $635.8 Reconciliation of GAAP Net income Allocated to Common Stockholders to Non-GAAP GAAP net income allocated to common stockholders $155.3 $173.9 $188.4 $204.1 $190.2 Operating revenues - recognition of prior-period revenue -2.0 -2.0 Operating expenses - accelerated stock-based compensation 0.3 4.0 2.5 0.7 Operating expenses - severance expense 1.9 Operating expenses - estimated liability related to the resolution of an SEC matter 5.0 1.0 Operating expenses - bonus accrual resulting from the legal settlement revenue 0.6 Operating expenses - acquisition related expenses reported in professional fees and outside services 9.3 Operating expenses - assessment of computer-based lease taxes for prior period use 0.3 Operating expenses - amortization of intangible assets reported in depreciation and amortization 0.9 Other income/expenses - impairment charge 0.2 3.0 0.4 Other income/expenses - revenue recognized from legal settlement -5.5 Other income/expenses - change in redemption value of controlling interest 0.8 Other income/expenses - deferred financing costs 0.2 Other income/expenses - gain on settlement of contingent consideration -1.4 Income tax provision - significant discrete items -13.1 Income tax provision - changes in assessments of uncertain tax positions related to a prior period 1.6 -4.3 Net income allocated to participating securities - effect of reconciling items 0.1 -0.1 -0.1 0.1 Income taxes - effect of reconciling items -0.1 -1.6 -2.8 0.6 0.4 Adjusted Net Income Allocated to Common Stockholders $147.5 $177.4 $194.5 $198.9 $194.5 Per Share Impact of Adjustments Noted Above ($0.09) $0.04 $0.07 ($0.06) $0.05
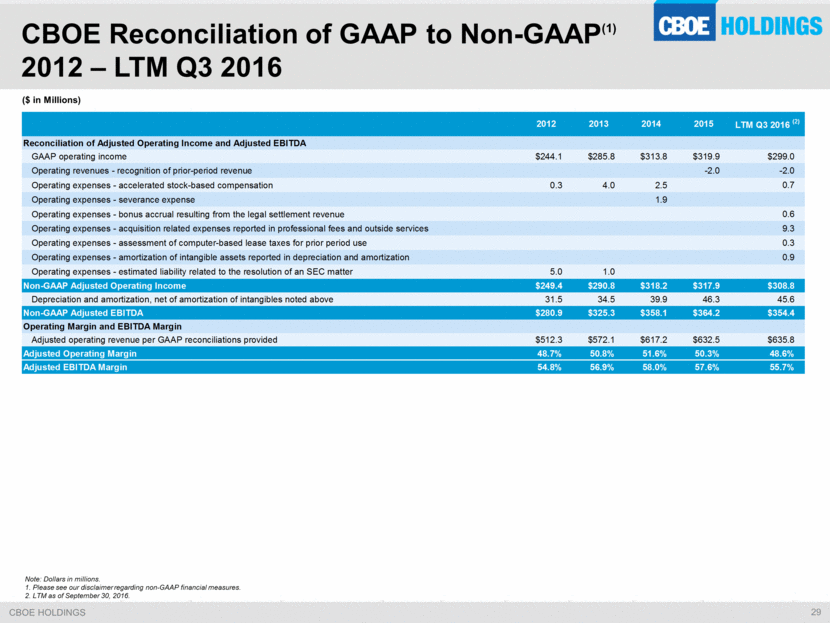
CBOE Reconciliation of GAAP to Non-GAAP(1) 2012 – LTM Q3 2016 Note: Dollars in millions. 1. Please see our disclaimer regarding non-GAAP financial measures. 2. LTM as of September 30, 2016. ($ in Millions) 2012 2013 2014 2015 LTM Q3 2016 (2) Reconciliation of Adjusted Operating Income and Adjusted EBITDA GAAP operating income $244.1 $285.8 $313.8 $319.9 $299.0 Operating revenues - recognition of prior-period revenue -2.0 -2.0 Operating expenses - accelerated stock-based compensation 0.3 4.0 2.5 0.7 Operating expenses - severance expense 1.9 Operating expenses - bonus accrual resulting from the legal settlement revenue 0.6 Operating expenses - acquisition related expenses reported in professional fees and outside services 9.3 Operating expenses - assessment of computer-based lease taxes for prior period use 0.3 Operating expenses - amortization of intangible assets reported in depreciation and amortization 0.9 Operating expenses - estimated liability related to the resolution of an SEC matter 5.0 1.0 Non-GAAP Adjusted Operating Income $249.4 $290.8 $318.2 $317.9 $308.8 Depreciation and amortization, net of amortization of intangibles noted above 31.5 34.5 39.9 46.3 45.6 Non-GAAP Adjusted EBITDA $280.9 $325.3 $358.1 $364.2 $354.4 Operating Margin and EBITDA Margin Adjusted operating revenue per GAAP reconciliations provided $512.3 $572.1 $617.2 $632.5 $635.8 Adjusted Operating Margin 48.7% 50.8% 51.6% 50.3% 48.6% Adjusted EBITDA Margin 54.8% 56.9% 58.0% 57.6% 55.7%
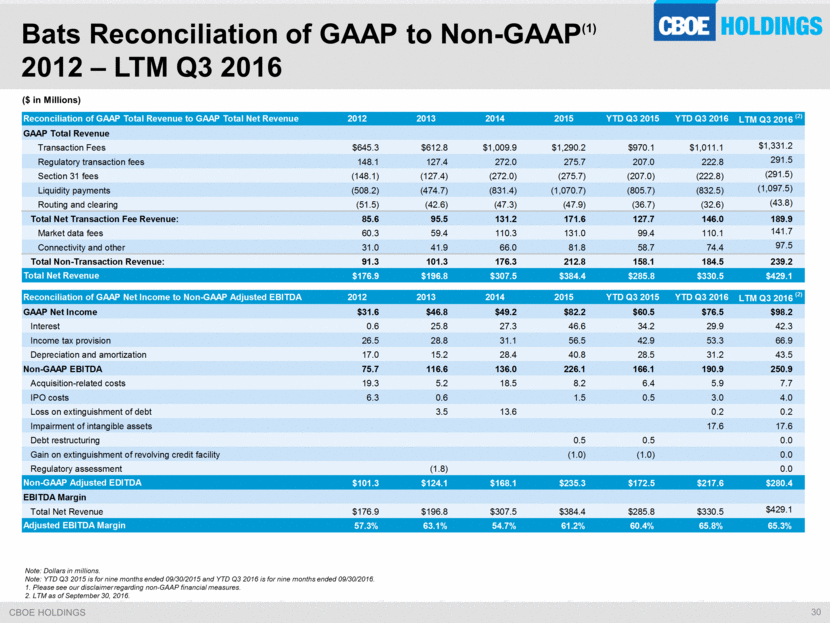
Bats Reconciliation of GAAP to Non-GAAP(1) 2012 – LTM Q3 2016 Note: Dollars in millions. Note: YTD Q3 2015 is for nine months ended 09/30/2015 and YTD Q3 2016 is for nine months ended 09/30/2016. 1. Please see our disclaimer regarding non-GAAP financial measures. 2. LTM as of September 30, 2016. ($ in Millions) Reconciliation of GAAP Total Revenue to GAAP Total Net Revenue 2012 2013 2014 2015 YTD Q3 2015 YTD Q3 2016 LTM Q3 2016 (2) GAAP Total Revenue Transaction Fees $645.3 $612.8 $1,009.9 $1,290.2 $970.1 $1,011.1 $1,331.2 Regulatory transaction fees 148.1 127.4 272.0 275.7 207.0 222.8 291.5 Section 31 fees (148.1) (127.4) (272.0) (275.7) (207.0) (222.8) (291.5) Liquidity payments (508.2) (474.7) (831.4) (1,070.7) (805.7) (832.5) (1,097.5) Routing and clearing (51.5) (42.6) (47.3) (47.9) (36.7) (32.6) (43.8) Total Net Transaction Fee Revenue: 85.6 95.5 131.2 171.6 127.7 146.0 189.9 Market data fees 60.3 59.4 110.3 131.0 99.4 110.1 141.7 Connectivity and other 31.0 41.9 66.0 81.8 58.7 74.4 97.5 Total Non-Transaction Revenue: 91.3 101.3 176.3 212.8 158.1 184.5 239.2 Total Net Revenue $176.9 $196.8 $307.5 $384.4 $285.8 $330.5 $429.1 Reconciliation of GAAP Net Income to Non-GAAP Adjusted EBITDA 2012 2013 2014 2015 YTD Q3 2015 YTD Q3 2016 LTM Q3 2016 (2) GAAP Net Income $31.6 $46.8 $49.2 $82.2 $60.5 $76.5 $98.2 Interest 0.6 25.8 27.3 46.6 34.2 29.9 42.3 Income tax provision 26.5 28.8 31.1 56.5 42.9 53.3 66.9 Depreciation and amortization 17.0 15.2 28.4 40.8 28.5 31.2 43.5 Non-GAAP EBITDA 75.7 116.6 136.0 226.1 166.1 190.9 250.9 Acquisition-related costs 19.3 5.2 18.5 8.2 6.4 5.9 7.7 IPO costs 6.3 0.6 1.5 0.5 3.0 4.0 Loss on extinguishment of debt 3.5 13.6 0.2 0.2 Impairment of intangible assets 17.6 17.6 Debt restructuring 0.5 0.5 0.0 Gain on extinguishment of revolving credit facility (1.0) (1.0) 0.0 Regulatory assessment (1.8) 0.0 Non-GAAP Adjusted EDITDA $101.3 $124.1 $168.1 $235.3 $172.5 $217.6 $280.4 EBITDA Margin Total Net Revenue $176.9 $196.8 $307.5 $384.4 $285.8 $330.5 $429.1 Adjusted EBITDA Margin 57.3% 63.1% 54.7% 61.2% 60.4% 65.8% 65.3%
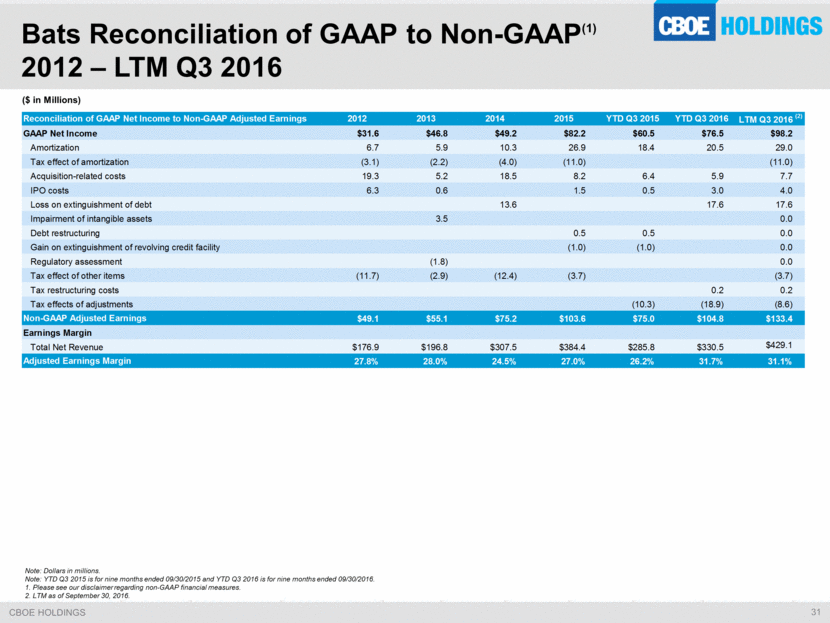
Note: Dollars in millions. Note: YTD Q3 2015 is for nine months ended 09/30/2015 and YTD Q3 2016 is for nine months ended 09/30/2016. 1. Please see our disclaimer regarding non-GAAP financial measures. 2. LTM as of September 30, 2016. Bats Reconciliation of GAAP to Non-GAAP(1) 2012 – LTM Q3 2016 ($ in Millions) Reconciliation of GAAP Net Income to Non-GAAP Adjusted Earnings 2012 2013 2014 2015 YTD Q3 2015 YTD Q3 2016 LTM Q3 2016 (2) GAAP Net Income $31.6 $46.8 $49.2 $82.2 $60.5 $76.5 $98.2 Amortization 6.7 5.9 10.3 26.9 18.4 20.5 29.0 Tax effect of amortization (3.1) (2.2) (4.0) (11.0) (11.0) Acquisition-related costs 19.3 5.2 18.5 8.2 6.4 5.9 7.7 IPO costs 6.3 0.6 1.5 0.5 3.0 4.0 Loss on extinguishment of debt 13.6 17.6 17.6 Impairment of intangible assets 3.5 0.0 Debt restructuring 0.5 0.5 0.0 Gain on extinguishment of revolving credit facility (1.0) (1.0) 0.0 Regulatory assessment (1.8) 0.0 Tax effect of other items (11.7) (2.9) (12.4) (3.7) (3.7) Tax restructuring costs 0.2 0.2 Tax effects of adjustments (10.3) (18.9) (8.6) Non-GAAP Adjusted Earnings $49.1 $55.1 $75.2 $103.6 $75.0 $104.8 $133.4 Earnings Margin Total Net Revenue $176.9 $196.8 $307.5 $384.4 $285.8 $330.5 $429.1 Adjusted Earnings Margin 27.8% 28.0% 24.5% 27.0% 26.2% 31.7% 31.1%
Non-GAAP Information In addition to disclosing results determined in accordance with GAAP, CBOE has disclosed certain non-GAAP measures of operating performance and liquidity. These measures are not in accordance with, or a substitute for, GAAP, and may be different from or inconsistent with non-GAAP financial measures used by other companies. The non-GAAP measures provided in this presentation include adjusted operating revenue, adjusted operating income, adjusted operating margin, adjusted EBITDA and adjusted EBITDA margin. Management believes that the non-GAAP financial measures in this presentation provide useful and comparative information to assess trends in our core operations and a means to evaluate period-to-period comparisons. Non-GAAP financial measures and pro forma non-GAAP measures disclosed by management are provided as additional information to investors in order to provide them with an alternative method for assessing our financial condition and operating results, and that of the combined company.
CBOE 400 South LaSalle Street Chicago, Illinois 60605 www.cboe.com