Attached files
UNITED STATES
SECURITIES AND EXCHANGE COMMISSION
Washington, D.C. 20549
Form 10-K
[X] Annual report pursuant to section 13 or 15(d) of the Securities Exchange Act of 1934
For the fiscal year ended October 1, 2016 or
[ ] Transition report pursuant to section 13 or 15(d) of the Securities Exchange Act of 1934
For the transition period from _______ to _______.
Commission file number 0-11392
| SPAN-AMERICA MEDICAL SYSTEMS, INC. | |
| (Exact name of registrant as specified in its charter) | |
|
South Carolina |
57-0525804 |
|
(State or other jurisdiction of incorporation or organization) |
(I.R.S. Employer Identification No.) |
| 70 Commerce Center, Greenville, South Carolina | 29615 |
| (Address of principal executive offices) | (Zip Code) |
Registrant’s telephone number, including area code (864) 288-8877
Securities registered pursuant to section 12(b) of the Act:
|
Title of each class |
Name of each exchange on which registered |
|
None |
None |
Securities registered pursuant to section 12(g) of the Act:
|
Common stock, no par value | |
|
(Title of class) |
Indicate by check mark if the registrant is a well-known seasoned issuer, as defined in Rule 405 of the Securities Act. Yes . No X .
Indicate by check mark if the registrant is not required to file reports pursuant to Section 13 or Section 15(d) of the Act. Yes . No X .
Indicate by check mark whether the registrant (1) has filed all reports required to be filed by Section 13 or 15(d) of the Securities Exchange Act of 1934 during the preceding 12 months (or for such shorter period that the registrant was required to file such reports), and (2) has been subject to such filing requirements for the past 90 days. Yes X . No ___.
Indicate by check mark whether the registrant has submitted electronically and posted on its corporate Website, if any, every Interactive Data File required to be submitted and posted pursuant to Rule 405 of Regulation S-T (§232.405 of this chapter) during the preceding 12 months (or for such shorter period that the registrant was required to submit and post such files). Yes X . No ___.
Indicate by check mark if disclosure of delinquent filers pursuant to Item 405 of Regulation S-K (§229.405 of this chapter) is not contained herein, and will not be contained, to the best of the registrant’s knowledge, in definitive proxy or information statements incorporated by reference in Part III of this Form 10-K or any amendment to this Form 10-K. [ ]
Indicate by check mark whether the registrant is a large accelerated filer, an accelerated filer, a non-accelerated filer or a smaller reporting company. See the definitions of “large accelerated filer,” “accelerated filer” and “smaller reporting company” in Rule 12b-2 of the Exchange Act. (Check one):
|
Large Accelerated Filer____ |
Accelerated Filer____ | |
|
|
| |
|
Non-Accelerated Filer X |
Smaller Reporting Company ____ | |
| (Do not check if a smaller reporting company) |
Indicate by check mark whether the registrant is a shell company (as defined in Rule 12b-2 of the Act). Yes . No X .
The aggregate market value of the voting and non-voting common equity held by non-affiliates computed by reference to the price at which the common equity was last sold as of the last business day of the registrant’s most recently completed second fiscal quarter was $43,493,647.
The number of shares of the registrant’s common stock, no par value, outstanding as of December 21, 2016 was 2,755,625.
Documents Incorporated By Reference
Portions of the Company’s Definitive Proxy Statement for the annual shareholders’ meeting to be held February 22, 2017 are incorporated by reference into Part III.
PART I
Item 1. Business
Forward-Looking Statements
This annual report on Form 10-K includes forward-looking statements that describe anticipated results for Span-America Medical Systems, Inc. (the “Company,” “Span-America” or “we”). These statements are estimates or forecasts about Span-America and its markets based on our beliefs, assumptions and expectations. These forward-looking statements therefore involve numerous risks and uncertainties. We wish to caution the reader that these forward-looking statements, such as, but not limited to, our expectations for future sales or future expenses, are only predictions. These forward-looking statements may be generally identified by the use of forward-looking words and phrases, such as “will,” “intends,” “would,” “estimates,” “continues,” “may,” “believes,” “anticipates,” “should,” “optimistic” and “expects,” and are based on the Company’s current expectations or beliefs concerning future events that involve risks and uncertainties. Actual events or results may differ materially as a result of risks and uncertainties in our business. Such risks include, but are not limited to, the “Risk Factors” described in Item 1A. below, other risks referenced from time to time in our other Securities and Exchange Commission (“SEC”) filings, or other unanticipated risks. We disclaim any obligation to update any forward-looking statement, whether as a result of new information, future events or otherwise.
Background
Span-America was incorporated under the laws of the state of South Carolina on September 21, 1970. We manufacture therapeutic support surfaces, medical bed frames, patient positioners, mattress overlays and wheelchair cushions for the medical market. We sell but do not manufacture skin care products, fall protection products and in-room furniture used mainly in the long-term care portion of the medical market. We also manufacture foam mattress pads and pillows for the consumer bedding market as well as a variety of custom designed foam products for the industrial market.
We began operations in 1975 as a manufacturer of polyurethane foam patient positioners and later expanded our product lines to include foam mattress overlays for the wound care market primarily in acute care hospitals. Wound care products aid in the treatment or prevention of pressure ulcers. In the late 1970s, we also began producing foam products for industrial applications. In 1985, we introduced the patented Geo-Matt® therapeutic mattress overlay in the health care market, which became one of our leading products. During the same time period, we began selling convoluted foam mattress overlay products to consumer bedding retailers throughout the United States.
We entered the replacement mattress segment of the medical market in 1992 by acquiring certain assets of Healthflex, Inc., including its PressureGuard® II therapeutic support surface. We have since significantly expanded the PressureGuard product line and have added the Geo-Mattress® product line to provide a broad line of therapeutic support surfaces that we sell direct and through distributors primarily to long-term care facilities and, to a lesser extent, acute care hospitals and home health care dealers throughout the United States and Canada.
In December 2011, a newly-formed, wholly-owned subsidiary of the Company, Span Medical Products Canada Inc., a British Columbia corporation (“Span-Canada”), acquired substantially all of the assets of M.C. Healthcare Products Inc., an Ontario corporation with its principal place of business in Beamsville, Ontario. Span-America operates Span-Canada under the registered business name M.C. Healthcare Products (“M.C. Healthcare” or “MCHP”), a division of Span Medical Products Canada Inc. M.C. Healthcare manufactures and markets medical bed frames and related products for the long-term care market and sells them throughout Canada and the United States. We report Span-Canada’s operations as part of our medical segment.
Our primary long-term strategy is to become a leading health care manufacturer and marketer specializing in medical beds, therapeutic support surfaces and other related products used in the prevention and treatment of pressure ulcers. We are actively seeking to develop or acquire new products in this market segment. We also seek to further develop consumer and industrial applications of our medical products.
Our products are distributed primarily in the United States and Canada and, to a lesser degree, in several countries outside North America. Total net sales during fiscal year 2016 were approximately $67.6 million. Total net sales outside the United States during fiscal 2016 were approximately $6.8 million, or 10% of our total net sales. The majority of our sales outside the United States occurred in Canada. However, during fiscal year 2016, we began selling certain of our medical products in Australia through an independent Australian distributor. Our sales in Australia during fiscal year 2016 were approximately $710,000. See Note 18 – Operations and Industry Segments and Geographic Areas in the Notes to Consolidated Financial Statements included in Item 8 of this report. For risks related to our foreign operations, see the risk factors set forth below in Item 1A of this report, which risk factors are incorporated herein by reference.
We maintain a website at http://www.spanamerica.com. Our reports and other filings made with the SEC are available free of charge on our website, which includes a link to the Company’s filings in the SEC’s Electronic Data Gathering Analysis and Retrieval (EDGAR) filing database. For more information about M.C. Healthcare and its products, see http://www.mchealthcare.com.
Industry Segment Data
Please See Note 18 – Operations and Industry Segments and Geographic Areas in the Notes to Consolidated Financial Statements included in Item 8 of this report for additional information on industry segment data and revenues from foreign sales. The table below sets forth sales of each of our product lines and segments as a percentage of our total sales for fiscal years 2016, 2015 and 2014.
|
Percentage of Total Sales |
||||||||||||
|
Medical Segment |
2016 |
2015 |
2014 |
|||||||||
|
Therapeutic support surfaces |
39 | % | 39 | % | 40 | % | ||||||
|
Medical bed frames |
14 | % | 17 | % | 15 | % | ||||||
|
Patient positioners (Span-Aids) |
4 | % | 5 | % | 6 | % | ||||||
|
Mattress overlays |
4 | % | 4 | % | 5 | % | ||||||
|
Seating products |
3 | % | 3 | % | 4 | % | ||||||
|
Skin care products |
2 | % | 2 | % | 2 | % | ||||||
|
In-room furnishings |
1 | % | 2 | % | 1 | % | ||||||
|
Fall protection products |
1 | % | 1 | % | 2 | % | ||||||
|
Other medical products |
1 | % | 1 | % | 1 | % | ||||||
|
Medical total |
69 | % | 74 | % | 76 | % | ||||||
|
Custom Products Segment |
||||||||||||
|
Consumer bedding |
25 | % | 20 | % | 18 | % | ||||||
|
Industrial products |
6 | % | 6 | % | 6 | % | ||||||
|
Custom Products total |
31 | % | 26 | % | 24 | % | ||||||
Medical Segment
Span-America’s principal medical products consist of therapeutic support surfaces (which consist of non-powered and powered therapeutic support surfaces), medical bed frames, patient positioners, polyurethane foam mattress overlays, seating products, Selan® skin care and fall protection products. We also sell tables and related in-room furnishings for use in long-term care facilities. We sell these products primarily in North America to customers in the major segments of the health care market, including long-term care facilities, acute care hospitals and home health care providers. We rely on our own sales force to sell and market our medical products in North America. Our sales force consists of approximately 30 employees and five independent representatives located in key market areas throughout the U.S. and Canada. They call primarily on end-user customers and medical products distributors within our markets to promote the use of Span-America’s products to meet the needs of patients and customers.
Therapeutic Support Surfaces. For classification purposes, we divide our lines of therapeutic support surfaces into two groups, non-powered and powered, and we have various sub-categories within those two groups. Our non-powered therapeutic support surfaces fall into two main sub-categories: the Geo-Mattress® all-foam products and the non-powered portion of the PressureGuard® product line. Geo-Mattress® products are single-density or multi-layered foam therapeutic support surfaces topped with the same patented Geo-Matt surface used in our overlays.
Non-powered Therapeutic Support Surfaces. In 1997, we introduced the Geo-Mattress Max, Plus, and Pro models of foam therapeutic support surfaces. In early 1999, we extended the product line with the release of the Geo-Mattress with Wings®, which has been a contributor to overall Geo-Mattress sales. The Wings support surfaces feature raised bolsters on each side designed to reduce the chances of patients rolling out of bed or becoming entrapped between the edge of the therapeutic support surface and the bed’s side rails. We added a second line extension, the Geo-Mattress Atlas®, in December 2000 to address the needs of heavier patients. In 2010, the Company launched the Geo-Mattress® UltraMax™, our most highly engineered Geo-Mattress model to date. Developed primarily for the acute care market, the UltraMax incorporates several proprietary design features, including three-dimensional zoning, an ultra-resilient torso section, and a shear-reducing, bi-directional stretch cover. Together, these premium features allow the UltraMax to deliver a level of support, comfort, and effectiveness that meets the rigorous challenges of the acute care environment.
Span-America’s more complex non-powered support surfaces consist of products from the PressureGuard® series. We acquired the PressureGuard design through the acquisition of Healthflex, Inc. in February 1992. The original design combined a polyurethane foam shell and static air cylinders to form a support surface that incorporated the comfort and pressure relieving features of both mattress overlays and more sophisticated therapeutic support surfaces. This original design, which we later used as the basis for powered versions, was further refined and enhanced multiple times as described below.
In addition to the non-powered, static PressureGuard Renew®, we offer the PressureGuard CFT®. This model incorporates a patented design featuring the principles of constant force technology. The PressureGuard CFT is most appreciated for its dynamic, self-adjusting support surface feature that rivals more expensive powered surfaces, yet it requires no power source. Long-term care facilities are the end users for most of our non-powered therapeutic support surfaces, which we primarily sell to our medical distributors for resale to the end user. To a lesser extent, we also sell these products to medical distributors for resale to acute care hospitals and to home health care equipment dealers.
Powered Therapeutic Support Surfaces. Span-America’s powered therapeutic support surfaces constitute the remaining models in the PressureGuard Series. In November 1993, we received Food and Drug Administration (“FDA”) 510(k) marketing approval for the PressureGuard IV therapeutic support surface. Building on the comfort and support of the original PressureGuard design, PressureGuard IV was designed as a sophisticated, powered system for providing pressure reduction and patient comfort, with the added ability to turn the patient. The system was designed to automatically sense the patient’s weight and position and to continually adjust the pressures appropriately while slowly and quietly repositioning the patient at angles up to 30 degrees in cycles of up to two hours. The upgraded version, renamed the PressureGuard Turn Select®, incorporates all of these capabilities, as well as several additional features. Of particular note is a pendant-operated, microprocessor-controlled motion system, which is built into the support surface rather than being suspended from the bed frame as a separate unit.
Another powered system in the PressureGuard line is the PressureGuard APM®, a simpler but effective alternating pressure therapeutic support surface. The APM is targeted primarily at the long-term care and home care markets. In 2000, we added a more feature-rich version of this product called the PressureGuard APM2. In 2003, we further upgraded the APM2 products with new features such as the addition of the Deluxe control unit. The APM2 gives caregivers the flexibility to offer either alternating pressure or a basic lateral rotation modality by activating a toggle switch on the control panel.
In late 2001, Span-America introduced the PressureGuard Easy Air®, our first offering in the category of low-air-loss therapeutic support surfaces. The Easy Air incorporates several patented design innovations, which we believe allow it to overcome common performance compromises inherent in competitive low-air-loss products. Additionally, the Easy Air is very effective at controlling excess skin moisture, a key performance advantage in the competitive support surfaces marketplace.
In late 2010, we introduced the PressureGuard® Custom Care® series, which consists of three distinct product offerings aimed in large part at the acute care marketplace. Two of the models, Custom Care and Custom Care Convertible, incorporate the Company’s proprietary new Shear Transfer Zone® cover design. This patented design helps eliminate the damaging effects of micro shearing, macro shearing, and rotational shearing on vulnerable skin and tissue caused when bony prominences “dig” into a support surface. Like the PressureGuard CFT, the Custom Care model provides air therapy without the need for a powered control unit. It is designed to provide superior comfort and skin protection while requiring minimal maintenance for five years.
The PressureGuard Custom Care Convertible and Custom Care Convertible low-air-loss models represent our first product offerings in the “convertible” category, a class of support surfaces that has become a popular option in today’s acute care market. In their non-powered mode, Custom Care Convertible models operate as effective tissue load management surfaces for both prevention and treatment of pressure ulcers. Both allow the addition of a powered control unit where more aggressive, dynamic therapy is desired. When the add-on, ruggedized Custom Care Convertible control unit is clicked into position on the support surface, the caregiver is provided the option of either alternating pressure or lateral rotation. On the low-air-loss model, the caregiver can select either of these options while also providing a third treatment modality: microclimate management. This proprietary, patented air delivery design, which has demonstrated long-standing clinical success on the Company’s PressureGuard Easy Air low-air-loss surface, controls excess moisture and heat at the interface between the patient’s skin and the support surface. Both models also incorporate another Span-America feature, the Star Chamber™ air cylinder design. The Star Chamber cylinders maximize the amount of air available within the therapeutic support surface for pressure management, patient support and effective therapy.
In 2014, we introduced the PressureGuard Protocol® therapeutic support surface, which provides customers with an attractive combination of microclimate management, pressure redistribution, ease of use and patient/caregiver safety. Protocol’s proprietary air delivery cover design supplies a gentle flow of air directly to the underside of its highly vapor permeable coverlet, carrying away excess moisture vapor to help protect vulnerable skin. In addition, the Protocol’s efficient control unit generates substantially less heat and noise than traditional, high-output low-air-loss blowers while consuming less power. Caregivers can also select subtle alternating pressure or powered flotation treatment modes.
We introduced The Topper MicroEnvironment Manager® in 2015 as the company’s first completely reusable powered air coverlet for management of excess heat and moisture within the microenvironment surrounding the patient. The Topper is powered by the same, patented Air Diffusion Matrix technology first pioneered in our microclimate management support surfaces, including the PressureGuard Easy Air, Custom Care and Protocol products. The system provides a gentle flow of air directly to the underside of its highly vapor permeable top layer, carrying away excess moisture vapor to help protect vulnerable skin. The Topper is fluid resistant, anti-fungal and bacteriostatically treated. It is designed to be easily wiped clean and disinfected in place using standard hospital-grade solutions. Alternatively, the top layer can be unzipped and machine washed, and the inner air delivery layer can be accessed for wipe-down cleaning and disinfecting if desired.
We sell most of the powered products in the PressureGuard product line to long-term care facilities, usually through our distributors, and to home health care equipment dealers for daily rental in the home care market. We also sell the PressureGuard products in the acute care market, but in smaller quantities than in the long-term care and home care markets.
Bed Frames and Furniture. Through our M.C. Healthcare subsidiary, we manufacture and market the Advantage and Rexx series medical bed frames and related products. These medical beds, collectively branded as the “Q Series,” are designed primarily for the long-term care market and incorporate various industry-leading features, options and accessories that can be configured to meet individual customer needs. In addition, we serve as a distributor of bedside furniture, chairs, tables and over-bed tables for use in long-term care facilities. Approximately 75% of M.C. Healthcare sales for fiscal year 2016 were exported to the U.S., and the remaining 25% were sold in Canada and Australia.
During the latter part of 2013, we introduced a new, premium bed for long-term and sub-acute care settings called the Encore® resident care bed. The Encore is outfitted with a variety of advanced performance features for enhanced patient and caregiver safety and ergonomics. Chief among these is GlideAlign® retractable deck technology, which helps maintain users’ relative positioning to bedside furniture when the head of the bed is elevated. Encore also includes ReadyWide® integrated expansion, which allows tool-less, pin-less expandability to 42” wide, a platform that is in demand among care providers. Encore also features Smart Stop® low position auto pause, which is designed to help reduce the risk of patient falls and other hazards.
Patient Positioners. We sell our specialty line of patient positioners primarily under the trademark Span-Aids. This is our original product line and consists of over 300 different foam items that aid in relieving the basic patient positioning problems of elevation, immobilization, muscle contracture, foot drop, and foot or leg rotation. Span-Aids patient positioners hold a patient’s body in prescribed positions, provide greater patient comfort, and generally are used to aid long-term comatose patients or those in a weakened or immobilized condition. The positioners also help in the prevention of pressure ulcers by promoting more effective dispersion of pressure, heat and moisture. Span-Aids are intended for single-patient use throughout a patient’s entire treatment program. Among the Span-Aids products that we presently market are abduction pillows, body aligners, head supports, limb elevators and various foot and wrist positioners. We sell patient positioners primarily to acute care hospitals and long-term care facilities through several national medical products distributors.
Mattress Overlays. Span-America produces a variety of foam mattress overlays, including convoluted foam pads and its patented Geo-Matt® overlay. Span-America’s overlay products are mattress pads rather than complete mattresses and are marketed as less expensive alternatives to more complex therapeutic support surfaces. Our mattress overlays disperse body heat, increase air circulation beneath the patient and reduce moisture accumulation to aid in the prevention and treatment of pressure ulcers. Their convoluted or geometrically contoured construction also reduces shear forces and more evenly distributes the patient’s body weight, thereby reducing the localized pressure that can cause pressure ulcers. The Geo-Matt design includes numerous individual foam cells that are cut to exacting tolerances on computer-controlled equipment to create a clinically effective mattress surface. These products are designed to provide patients with greater comfort and to assist in treating patients who have developed or are susceptible to developing pressure ulcers. The mattress overlays are designed for single patient use. The primary markets for our mattress overlays are long-term care and acute care facilities in North America.
Seating Products. Another product category in our medical segment consists of seat cushions and related seating products for wheelchairs, geri-chairs (typically used in long-term care facilities) and other health care seating needs. Our offerings in this category can be subdivided into three main groups:
|
● |
wound healing aids, |
|
● |
patient positioning and general pressure management products, and |
|
● |
pressure management products without patient positioning features. |
Seating products made specifically as an aid to wound healing include the Isch-Dish® and Sacral Dish® pressure relief cushions. Seating products made for patient positioning and general pressure management include the Isch-Dish Thin, the Geo-Matt® Contour® cushion, the Equalizer®, and the EZ-Dish®. The Equalizer contoured positioning cushion has a multi-component design that includes a viscoelastic foam top, proprietary soft polymer inserts, and a contoured base. This makes it an attractive option for durable medical equipment suppliers and rehab seating specialists. The EZ-Dish pressure relief cushion, which uses some of the features of the original Isch-Dish design, offers a simpler, more affordable solution to the seating problems of nursing home patients. The Geo-Wave® Cushion assists with positioning and pressure reduction for patients using specialty recliners and geri-chairs. The Short-Wave® seat and back cushion reduces shear and assists with patient positioning in standard wheelchairs.
Seating products designed to address pressure management without additional positioning benefits include the Gel-T® cushion and the Geo-Matt and Geo-Matt PRT® wheelchair cushions. The Gel-T is a gel/foam combination cushion that is especially popular with elderly patients. The Geo-Matt and Geo-Matt PRT cushions incorporate our proprietary Geo-Matt anti-shearing surface.
Skin Care Products. We also market the Selan® line of skin care creams and lotions under a license agreement with Trividia Manufacturing Solutions, Inc. formerly Nipro Consumer Healthcare, Inc., DBA P.J. Noyes Company. The products, which are manufactured by P.J. Noyes, are used for cleaning, moisturizing and protecting patients’ skin and are sold primarily in long-term care and acute care settings. The term of our license agreement with Trividia Manufacturing Solutions has been extended through December 31, 2020.
Fall Protection Products. In December 2008, we began marketing the Risk Manager® bedside safety mat, which was a new product category for Span-America. The Risk Manager is manufactured outside the United States, using an elastomeric gel compound and is designed to cushion the force of impact and reduce the chance of injury to a patient who falls at the bedside. The Risk Manager is sold primarily in the long-term care market.
Availability of our Medical Products from Durable Medical Equipment Distributors. Although our medical products are most commonly used in long-term care facilities and, to a lesser extent, in acute care facilities, all of our medical products described above are also available for sale to retail customers through durable medical equipment distributors specializing in the sale of medical products to the general public at retail for individual use.
Distributor Relationships. We sell our medical products to many customers of varying sizes. We also sell our branded medical products to several medical products distributors which resell our products to acute care hospitals and long-term care facilities throughout North America and, to a lesser extent, in Australia. We believe our relationships with these distributors are good. However, the loss of one or more of these distributors could have a material adverse effect on our business. Sales to our largest medical distributor, McKesson, made up approximately 24% of net sales in the medical segment during fiscal 2016. See Item 1A. “Risk Factors” below for more information regarding our relationships with large customers.
Custom Products Segment
Span-America’s custom products segment includes two major product lines: consumer bedding products and various engineered industrial products. Our consumer product line consists primarily of convoluted and contour-cut mattress overlays and specially designed pillows for the consumer bedding market. We have a distribution agreement for consumer products with Hollander Home Fashions (“Hollander”) which expires in December 2018. The agreement automatically renews for successive three-year terms unless either party provides notice of its intent not to renew at least 60 days prior to the expiration date.
Our industrial product line consists of custom engineered foam products used in a variety of markets, including the automotive, packaging, durable goods, electronics and water sports equipment industries. Our largest industrial customers manufacture automobiles and specialty packaging products. Most of our industrial products are made to order according to customer specifications and are sold primarily in the southeastern United States.
In fiscal 2016, approximately 57% of our total custom products sales were distributed through Hollander. Also in fiscal 2016, approximately 19% of our total custom products sales were distributed through another consumer distributor, Sinomax USA Inc. (“Sinomax”), but that distributor relationship ended in May 2016. The loss of the Hollander relationship could have a material adverse effect on our business. See Item 1A. “Risk Factors” below for more information regarding our relationships with large customers.
Research and Development
Span-America’s expenditures for research and development were $1,135,000, $1,137,000 and $1,072,000 for fiscal years 2016, 2015 and 2014, respectively. We incur almost all of our research and development expenses in the medical segment for the development of new products, new features of existing products and product design improvements.
Please see information under the heading “Results of Operations Fiscal 2016 vs. 2015,” “Selling, Research & Development and Administrative Expenses” in Item 7. “Management’s Discussion and Analysis of Financial Condition and Results of Operations” for more information on research and development expenses.
Competition
Medical. In the medical market segment, we face significant competition for sales of the three main categories of therapeutic support surfaces. These are powered air therapy support surfaces, non-powered air therapy support surfaces and therapeutic foam support surfaces.
Competition in the therapeutic support surface market is based on a variety of factors including product performance, ease of use, patient safety features, price and durability. Customers often select a product based on these criteria after conducting a formal clinical evaluation.
Chief competitors include Joerns Healthcare, Inc., Medline Industries, Inc., Drive DeVilbiss Healthcare, Inc., Invacare Corporation, GF Health Products, Inc. (Graham-Field), Hill-Rom Holdings, Inc. (Hill-Rom), Sizewise Worldwide and Stryker. These competitors use combinations of their own sales representatives and manufacturer’s representatives to sell nationwide directly to hospitals, distributors, long-term care facilities and original equipment manufacturers.
These competitors are larger and have greater resources than Span-America. We believe our competitive advantages in the medical segment include innovative and patented product designs, product quality, manufacturing capabilities, distribution relationships, rapid delivery capabilities and responsiveness to customer requirements. Many smaller national and regional competitors also participate in this segment, with varying marketing strategies and resources.
Span Medical Products Canada. Created through the December 2011 acquisition of M.C. Healthcare Products in Beamsville, Ontario, Canada, this division faces competition for sales in the long-term care market both from manufacturers and national distributors of long-term care beds and related furniture. Price as well as product features and performance, quality, delivery and brand recognition all play a part in selection of a particular product. Additionally, the ability to offer packages that include a variety of products as well as financing can also influence the buying decision. The purchase decision may also be based on a mixture of the preceding factors.
Several of the primary competitors in the long-term care market for medical beds and related in-room furniture are the same as those in the support surfaces segment. These include Joerns Healthcare, Inc., Medline Industries, Inc., Drive DeVilbiss Healthcare, Inc., Invacare Corporation and GF Health Products, Inc. (Graham-Field). These competitors are larger than Span Medical Products Canada and use their own sales forces, manufacturer's representatives, distributors, durable medical equipment dealers or a combination thereof to sell their products to acute care facilities, long-term care facilities or to the general public at retail for individual use. While our medical bed and in-room furniture business has historically been smaller than its major competitors, we believe the product line has a reputation for high quality, innovative features and excellent customer service.
Custom Products. In the custom products segment, we routinely encounter significant competition for our mattress pad and pillow products. The competition for traditional polyurethane foam products is principally based on price, which is largely determined by foam density and thickness. However, competition also exists due to variations in product design and packaging. There are presently a number of companies with the manufacturing capability to produce similar bedding products. Our primary competitors in this market are Sleep Innovations, Inc., E.R. Carpenter Company and Sinomax, all of which are larger and have greater resources than Span-America.
We also have a number of competitors in the market for our industrial products, including Hibco Plastics, CelloFoam North America, Inc. and Foam-Tech. These competitors are larger and have greater resources than Span-America, including large, nationwide sales forces. The competition for industrial foam products is largely based on price. In many instances, however, design, product quality and delivery capabilities are also important.
We believe that our competitive advantages in the custom products segment include our distribution relationship with Hollander, innovative product designs, manufacturing and foam fabrication capabilities, low cost manufacturing processes and responsiveness to customer requirements.
During recent years, we have encountered increasing competition in the consumer bedding market from visco foam products manufactured both in the United States and China. Visco foam, also known as visco-elastic foam or memory foam, has greater density and different properties than traditional polyurethane foam products. It responds to body temperature, conforms to the shape of the body, and generally has slower recovery time compared with traditional polyurethane foam. Memory foam is also significantly more expensive than traditional foam and is more difficult to handle and fabricate. Because memory foam is more difficult to cut and shape than traditional foam, the memory foam mattress pads currently on the market, including our own, tend to be somewhat undifferentiated without unique surface designs. Consequently, it is more difficult for us to differentiate our memory foam products from those of our competitors. In addition, since memory foam is more expensive and more dense than traditional foam, it is more cost effective for overseas competitors (from China for example) to ship the products into the U.S. market. This is generally because retail prices of memory foam products are significantly higher than comparable traditional foam products, which generates much higher revenue per square foot of retail shelf space and lowers shipping costs as a percent of sales value.
Major Customers
Sales to McKesson Corporation, one of our medical distributors, during fiscal 2016 made up approximately 17% of our total net sales and approximately 24% of sales in the medical products segment. Sales to the United States Department of Veterans Affairs made up approximately 8% of our total net sales and approximately 11% of net sales in the medical products segment during fiscal 2016.
During fiscal 2016, we had significant relationships with two distributors for our consumer foam products. Sales to Hollander during fiscal 2016 made up approximately 18% of our total net sales and approximately 57% of sales in the custom products segment. Sales to Sinomax during fiscal 2016 made up approximately 6% of our total net sales and approximately 19% of sales in the custom products segment, but that distributor relationship ended in May 2016.
See “Industry Segment Data – Medical Segment – Distributor Relationships” above and Note 17 – Major Customers and Note 18 – Operations and Industry Segments and Geographic Areas in the Notes to Consolidated Financial Statements below for more information on major customers. The loss of any of these major customers could have a material adverse effect on our business.
Seasonal Trends
Seasonal trends within our medical segment are generally not material to our operations. However, we periodically have significant seasonal fluctuations within our custom products segment. The custom products segment consists of our consumer and industrial product lines. We occasionally experience significant fluctuations within our consumer bedding products due to seasonal promotions with our retail customers. Historically, these consumer promotions have commonly occurred during our first and fourth fiscal quarters, ending in December and September, respectively. The consumer products promotions are arranged on a case-by-case basis with our retail customers and our marketing partner, Hollander. Consequently, it is possible to have multiple promotions within a fiscal year or none at all, depending on market and competitive conditions. We have not experienced significant seasonal fluctuations in our industrial product line.
Patents and Trademarks
Span-America holds 18 United States patents and four foreign patents relating to various components of our beds, therapeutic support surfaces and seating products for the medical segment. We also have filed eight additional patent applications, which are currently pending. We believe that these patents are important to our business. However, while we have a number of products covered by patents, there are competitive alternatives available, sales of which are not restricted by our patents. Therefore, we do not rely solely on our patents to maintain our competitive position in our various markets.
Our principal patents include those on our PressureGuard and seating products. The PressureGuard patents have remaining lives ranging from one to 12 years with additional patents pending. The seating patents have remaining lives ranging from one to two years. We believe the expiration of these principal patents would not have a material adverse effect on our business.
We hold 39 federally registered trademarks and 19 foreign trademark registrations primarily within our medical segment, including Span-America, Span-Aids, Geo-Matt, Geo-Mattress, PressureGuard, Custom Care and Encore. We also have 11 trademark registration applications presently pending. We believe that these trademarks are readily identifiable in their respective markets and add value to our product lines.
Raw Materials and Backlog
Approximately 85% of our raw materials consist of polyurethane foam, nylon/vinyl mattress covers and tubes, motors, pneumatic pumps, blowers, bed actuators, steel and metal stampings. In addition, we use corrugated shipping containers, polyethylene plastic packaging material and hook and loop fasteners. We believe that our basic raw materials are in adequate supply and are available from many suppliers at competitive prices.
See Item 1A. “Risk Factors” and Item 7. “Management’s Discussion and Analysis of Financial Condition and Results of Operations” for more information on price increases for polyurethane foam.
As of October 1, 2016, we had unshipped (or open) orders of approximately $4.1 million, which represented a 43% decrease compared with our open orders of $7.2 million at fiscal year-end 2015. Our open orders were much higher at fiscal year-end 2015 because of a large seasonal promotion for consumer products that was completed in November 2015. We expect to fill all orders open as of October 1, 2016 in the 2017 fiscal year.
Employees
We had 238 full-time employees as of October 1, 2016 (170 in the United States and 68 in Canada). Of these employees, 150 were manufacturing personnel. Span-America is not a party to any collective bargaining agreement in the United States and has never experienced an interruption or curtailment of operations due to labor controversy.
The manufacturing employees of M.C. Healthcare, located in Beamsville, Ontario (42 employees at October 1, 2016) are members of the Sheet Metal Workers’ International Association, Local Union #540 (the “Union”), whose employment is governed by a Collective Agreement with the Union that was assumed by operation of Canadian labor law by our Canadian subsidiary in connection with the asset acquisition. This Collective Agreement will expire by its terms on October 31, 2018. We believe that our relations with our employees are good in both the United States and Canada.
Supervision and Regulation
The Federal Food, Drug and Cosmetic Act, and regulations issued or proposed thereunder, provide for regulation by the FDA of the marketing, manufacture, labeling, packaging and distribution of medical devices, including some of our medical products. These regulations require, among other things, that medical device manufacturers register with the FDA, list devices manufactured by them, and file various reports. In addition, our manufacturing facilities are subject to periodic inspections by regulatory authorities and must comply with “good manufacturing practices” as required by the FDA and state regulatory authorities. We believe that we are in substantial compliance with applicable regulations and do not anticipate having to make any material expenditures as a result of FDA or other regulatory requirements.
We are certified as an ISO 9001 and ISO 13485 supplier for our PressureGuard therapeutic support surface products from our Greenville, South Carolina plant. ISO (the International Organization for Standardization) is a worldwide federation of national standards bodies dealing with quality-system requirements that can be used by a supplier to demonstrate its capability and for the assessment of the capability of a supplier by external parties. Compliance with ISO standard 13485 is required by Health Canada for all Class II medical devices sold there. All of our powered therapeutic support surfaces for the health care market are considered Class II medical devices. The certification is subject to reassessment at six-month intervals. We have maintained our certification based on the results of ISO audits conducted during fiscal year 2016.
The Canadian Food and Drugs Act, and the Medical Devices Regulations issued thereunder, provide for regulation by Health Canada of the manufacture, labeling, packaging, distribution, sale and advertisement of medical devices, including non-powered and powered therapeutic support surfaces and bed frames made through Span Medical Products Canada Inc., Span-America's wholly-owned subsidiary, which are considered Class I medical devices in Canada. The Medical Devices Regulations require, among other things, that Class I and II medical device manufacturers selling medical devices hold a medical device establishment license and file various reports. In addition, manufacturing facilities are subject to periodic inspections by regulatory authorities and must comply with device safety and effectiveness requirements as required by the Medical Devices Regulations and Health Canada. We believe that we are in substantial compliance with applicable regulations and do not anticipate having to make any material expenditures as a result of Health Canada or other currently applicable regulatory requirements.
The Therapeutic Goods Administration (TGA) is part of the Australian Government Department of Health, and is responsible for regulating therapeutic goods. The Therapeutic Goods Act 1989 (the Act) outlines a risk based regulatory framework for therapeutic goods, with the level of regulation reflecting the assessed risk of the product. Therapeutic goods on the market in Australia are required to be manufactured to an appropriate quality, and while no therapeutic good can be considered risk free, when used as intended the benefits of any product should outweigh the risks associated with its use. Our beds, as well as foam and powered mattresses, are considered Class I (low risk) under this regulation and are all registered using Emergo Group as our Australian Sponsor. We believe that we are in substantial compliance with applicable regulations and do not anticipate having to make any material expenditures as a result of TGA or other currently applicable regulatory requirements.
Environmental Matters
Our manufacturing operations in the U.S. and Canada are subject to various government regulations pertaining to the discharge of materials into the environment. We believe that we are in substantial compliance with currently applicable regulations. We do not anticipate that continued compliance will have a material effect on our capital expenditures, earnings or competitive position.
Item 1A. Risk Factors
The loss of a key distributor or customer in the Company’s medical or custom products segments could cause a rapid and significant sales decline, which would likely result in a material decline in earnings. Many of our medical products are sold through large national distributors in the United States and Canada. We do not maintain long-term distribution agreements with most of these distributors. Instead, we supply them based on purchase orders that are issued by the customers on a daily or weekly basis. With minimal notice, either party can generally end these supplier-customer relationships. It is also possible that a non-participating distributor may acquire one or more distributors with whom we have a relationship, at which time the survivor distributor may decide to terminate the relationship. If a large customer or distributor decided to discontinue purchasing our products, our sales and earnings could quickly decline. Our largest customer in the medical segment is McKesson Corporation, which represented approximately 17% of our total net sales and 24% of our sales in the medical segment during fiscal 2016.
Historically, our consumer bedding products have been sold through our distributor, Hollander, under a marketing and distribution agreement that originally would have expired in December 2015. The agreement automatically renews for successive three-year terms unless either party provides notice of its intent not to renew at least 60 days prior to the expiration date. Neither party provided the other with the requisite notice of intent not to renew the marketing and distribution agreement in 2015. The next renewal anniversary is December 2018. Sales to Hollander accounted for approximately 18% of our total net sales during fiscal 2016 and 57% of our sales in the custom products segment. The loss of the Hollander relationship could have a material adverse effect on our business.
Through May 2016, we shipped consumer products to a major consumer retailer through a different distributor, Sinomax. Hollander verbally consented to the separate distribution channel for this retailer. Sales to Sinomax accounted for approximately 6% of our total net sales during fiscal 2016 and 19% of our sales in the custom products segment, but that distributor relationship ended in May 2016.
For more information on major customers and information on our business segments, see the discussions under Item 1. “Business – Industry Segment Data – Medical Segment – Distributor Relationships,” Item 1. “Business – Industry Segment Data – Custom Products Segment,” Item 1. “Business – Major Customers,” Note 17 – Major Customers and Note 18 – Operations and Industry Segments and Geographic Areas in the Notes to Consolidated Financial Statements.
Our sales and earnings performance can be volatile when compared from quarter-to-quarter or year-to-year because of the effect of (1) large, infrequently recurring orders of therapeutic support surfaces or medical beds in our medical segment and (2) limited-time or seasonal promotions that occur on an irregular basis in our custom products segment. Within our medical segment, our two largest volume product lines are therapeutic support surfaces and medical beds, which are sold primarily in the long-term care market. Since these products are sometimes purchased as part of capital improvement projects, the purchases can occur in large-volume quantities at irregular intervals. These large orders can cause volatility in our quarter-to-quarter and year-to-year sales and earnings comparisons.
Within our custom products segment, we have from time to time participated in several limited time, seasonal promotions of our consumer products. These promotions had the effect of temporarily increasing our sales and earnings during the periods the promotions took place. The promotions are conducted primarily at the sole discretion of our retail customers and therefore may or may not recur in future periods. While we benefit from these promotions when they take place, if similar promotions do not recur in future comparative periods, or if the quantities ordered or prices accepted are less than the comparable prior-year period, it creates an unfavorable sales and earnings comparison with prior-year periods. This situation might obscure or overshadow more gradual favorable changes, or less dramatic unfavorable changes, in our ordinary course of business, which we believe more accurately reflect the long-term financial health of our business.
Possible downturns in the U.S. economy combined with uncertainties about health care reform and tax policy could cause our sales to decline, which in turn could have a material negative effect on our earnings. The largest volume product lines within our medical segment are our lines of therapeutic support surfaces, which consist of our PressureGuard and Geo-Mattress products as well as our private-label support surfaces, and our lines of medical beds for the long-term care market. These products are generally considered by us and our customers to be capital purchase items instead of consumable supplies. We believe that purchases of these capital goods are more easily postponed during business downturns than purchases of consumables. Consequently, sales of our support surfaces and medical beds are likely to be more sensitive to general economic weakness than other medical product lines in our business. Also, uncertainties about federal and state tax policy, interest rate projections and the implementation or repeal of health care reform could cause our customers to delay, reduce or cancel capital expenditure plans, which could slow sales particularly within our support surface and medical bed product lines. Therapeutic support surface sales made up 39% of total Company sales during fiscal 2016 and increased 3% during the year compared with fiscal 2015. Sales of medical beds made up 14% of total Company sales during fiscal 2016. Sales of therapeutic support surfaces and medical beds could decline if economic conditions worsen or if health care reform and changes in tax policy result in reduced demand from our customers.
In addition, our industrial products are sold primarily to the automotive, packaging and water sports industries, as well as various other manufacturers. Our industrial business has historically been more affected by general economic trends than other Span-America product lines. Therefore an economic downturn is likely to have a greater effect on sales of industrial products than on other product lines in our business. Sales of industrial products could decline if economic conditions worsen.
Since many of our operating costs are fixed within a normal monthly range of sales and production activity, sales declines could result in proportionally greater declines in earnings performance. We would attempt to reduce expenses in response to lower sales levels, but we cannot give assurance that we would be able to fully offset the effect of a decline in sales volume. As a result, our business could be materially adversely affected by an economic downturn or weakness in the economy.
Downturns in the U.S. and global economies could also have a material adverse effect on the business or financial condition of one or more of our key customers or distributors or on several customers and distributors that, in the aggregate, account for a material portion of our sales. Such an adverse effect on our customers or distributors could, in turn, have a material adverse effect on our own business and/or financial condition as a result of a loss or material reduction in our sales to such customers or distributors and also, potentially, our inability to collect a material amount of accounts receivable (which accounts receivable are unsecured) owed to us by such customers or distributors if they become unable to pay their debts.
Since our therapeutic support surfaces and medical bed products are considered to be capital purchases by our customers, some customers may have to borrow all or a portion of the funds necessary to purchase our products. In this event, the current and projected levels of interest rates may, if such rates are increasing or are projected to increase, have a material adverse effect on the customers’ order quantities and our resulting sales to those customers.
If some or all of our medical products were determined to be subject to the medical device excise tax imposed by the Affordable Care Act, there could be a material adverse effect on our net income. Beginning January 1, 2013, the Affordable Care Act imposed a 2.3% excise tax on sales of products defined as “medical devices” by the regulations of the U.S. Food & Drug Administration (the “FDA”) unless the products fit within certain exemptions enumerated in the Affordable Care Act. Subsequently, the Consolidated Appropriations Act of 2016 imposed a two-year moratorium on the medical device excise tax on medical device sales from January 1, 2016 through December 31, 2017. We believe that all of our medical products except for Selan® skin care products are “medical devices” within the meaning of the FDA regulations. We also believe that our medical products are exempt from the excise tax because our interpretation is that they meet the definition that is commonly referred to as the “Retail Exemption.” The Retail Exemption provision allows an exemption for medical devices of a type that can be purchased by the general public at retail for individual use if (1) the device is regularly available for purchase and use by individual consumers who are not medical professionals, and (2) the device’s design demonstrates that it is not primarily intended for use in a medical institution or office or by medical professionals. While we believe all of our medical products are exempt, the Retail Exemption is based on a facts-and-circumstances inquiry into numerous factors listed in the Affordable Care Act rather than a “bright line” standard. If some or all of our medical products were found to be medical devices subject to the excise tax, we could incur material tax expenses on our sales of medical devices which could have a material adverse effect on our sales, earnings and financial condition. Our medical sales excluding Selan totaled $11.1 million from October 2015 through December 2015 (when the moratorium took effect), $46.6 million in fiscal 2015, $41.1 million in fiscal year 2014 and $35.6 million in the nine-month period from January 2013 (when the tax became effective) through our fiscal year ended in September 2013. If the excise tax were found to apply to all of our medical products (other than Selan products), our additional tax expense (excluding interest and penalties) would be approximately $255,000 for fiscal 2016, $1,071,000 for fiscal year 2015, $945,000 for fiscal year 2014 and approximately $819,000 for the nine-month period from January 2013 through September 2013. Of course, actual future sales levels and the amount of any applicable excise tax would vary.
Our acquisition of M.C. Healthcare in December 2011 has introduced different risks for the Company, including those related to international operations, foreign exchange, a unionized workforce and impairment of goodwill or other intangible assets. M.C. Healthcare’s manufacturing facility is located in Beamsville, Ontario, Canada. We are leasing the current facility under a five-year lease agreement as described elsewhere in this report. As a result, we have been operating in a foreign country under different laws, regulations and customs, all of which have added potential new risks and costs to the Company.
Prior to the acquisition, Span-America had no material foreign exchange risk. As a result of the acquisition, we now manufacture and sell products in both the U.S. and Canada. Revenues and costs are incurred in both U.S. and Canadian dollars. We are therefore subject to realized and unrealized gains or losses on foreign currency translation activities related to our operations. These foreign exchange gains or losses could have a material effect on our results of operations. See Item 7. “Management's Discussion and Analysis of Financial Condition and Results of Operations – Foreign Currency Exchange” and Item 7A. “Quantitative and Qualitative Disclosures About Market Risk” for more information on foreign exchange risk.
Span-America had no material experience in managing a unionized workforce prior to the M.C. Healthcare acquisition. Most of the manufacturing employees at our Beamsville, Ontario plant are members of a union. We are therefore subject to risks related to the management of union employees such as work slowdowns or stoppages, compliance with the terms of the union agreement and periodic contract negotiations. However, we believe that our relations with our employees are good.
The M.C. Healthcare acquisition resulted in additional goodwill of approximately $2.5 million. We evaluate this goodwill at least annually for possible impairment. If the goodwill became impaired and not recoverable, it could result in a material non-cash charge to earnings, which could have a material adverse effect on our financial condition. See Item 7. “Management's Discussion and Analysis of Financial Condition and Results of Operations – Critical Accounting Policies – Impairment of Goodwill” and Note 5 – Goodwill in the Notes to Consolidated Financial Statements for more information on goodwill impairment.
Our medical business could lose sales volume or could have a lower sales growth rate as a result of government reimbursement changes in the medical market. Most of our end-user customers in the long term care and acute care markets are eligible for reimbursement by the Centers for Medicare and Medicaid Services (“CMS”) for patient care and treatment. The reimbursement in these markets is done generally on a per diem basis, depending on the condition and needs of each patient. We receive no direct reimbursements from CMS, but our end-user customers often submit reimbursement requests to CMS. For example, we sell therapeutic support surfaces to long-term care facilities, which, in many cases, receive per-diem-based reimbursements from CMS for the care and treatment of the patients in these facilities. If the CMS reimbursement rates are reduced, the demand for our medical products could decrease, because a reduction in CMS reimbursement rates reduces the revenue of the affected facilities. The potential decrease in demand for our medical products would depend on the size of the CMS rate reduction. A significant rate reduction could have a material adverse impact on our sales and earnings.
Our earnings could be negatively affected by raw material cost increases that we are unable to recover through sales price increases. The cost of polyurethane foam represented approximately 36% of our total cost of goods sold in fiscal 2016. An increase in foam raw material costs that we are not able to pass through to our customers by increasing prices could have a significant negative effect on our profitability. Besides polyurethane foam, our other major raw material categories include therapeutic support surface covers made of various water-proof fabrics, vinyl bags, vinyl air cylinders, electronic components for medical beds and support surfaces, motors, pneumatic pumps, blowers, corrugated boxes, bed positioning actuators, steel and metal stampings. Raw materials are our single largest cost category, representing approximately 73% of our total cost of goods sold in fiscal 2016. Cost increases in these raw materials could have a significant adverse effect on earnings if we are unable to recover the higher costs through sales price increases or operating expense reductions.
Changes in applicable laws or increased government regulations to limit carbon dioxide and other greenhouse gas emissions, as a result of concern over climate change, may result in increased raw material costs or other costs, which would negatively affect our profitability.
Our sales volume could decline as a result of competition from low-cost foreign imports. During the last several years, we have experienced increased competition in our medical and custom products segments from low-cost foreign imports. In the medical segment, the number of low-cost, imported mattress and bed products has increased, but it has not yet had a significant impact on our medical business. We believe that we have potentially greater exposure to low-cost imports in our consumer bedding product lines because those products have more commodity-like characteristics than our medical products. Also, our customers in the consumer market, which are usually national retailers, are generally more likely to change suppliers to buy lower-cost products than our customers in the medical market. Therefore, we could lose significant sales volume in our consumer bedding business and some portion of our medical sales volume if we are unable to compete effectively with low-cost imports.
Substantially all of our medical products are classified as medical devices and are regulated by the FDA and Health Canada. These regulations require, among other things, that medical device manufacturers register with the FDA and Health Canada, list devices manufactured by them, and file various reports. In addition, our manufacturing facilities are subject to periodic inspections by regulatory authorities and must comply with “good manufacturing practices” as required by the FDA, state and Canadian regulatory authorities. Although we believe that we are in substantial compliance with currently applicable regulations, the existence of the regulations creates the risk of a product recall and related expenses as well as the risk of additional expenses required to meet new regulatory requirements.
Loss of key personnel, and/or our inability to attract qualified personnel including qualified hourly production personnel, may limit our ability to grow and reduce our ability to compete. We are committed to the idea that the people engaged in working for the Company are our strongest and best resource. Most recently, it has been difficult to find and retain qualified production personnel in Greenville. If we are unable to attract and retain production personnel, then production of our products could be compromised. We believe that our relationship with our employees is good, but in the event of a significant work slowdown or work stoppage, our sales and profitability would be materially adversely affected.
Our sales volume could decline in the event other devices or pharmaceuticals are determined to be more effective than our products for the prevention and treatment of pressure ulcers. Our therapeutic support surfaces are designed and indicated for the prevention and treatment of pressure ulcers. In the event that other devices or pharmaceuticals are demonstrated to be superior to our therapeutic support surfaces in the prevention and treatment of pressure ulcers, and if we are unable to respond to the challenge with our own new products of a superior type, then we could experience a material sales and profitability decline.
Our ability to compete effectively in the medical market is dependent on a continuous stream of innovation in the form of new, more medically effective and more cost effective new products. Our product development results are very important in maintaining and expanding our competitive position in the medical marketplace. If for whatever reason, including loss of key personnel, regulatory setbacks or delays, lack of adequate financial resources, the inability to access needed technologies due to such technologies being subject to intellectual property ownership by others, a key product development not meeting performance requirements, premature product obsolescence and other factors, we are unable to keep up the rate of new product design and development, our competitive position in the marketplace could be compromised resulting in a decrease in sales and earnings.
One of the key strengths of our Company is its sales organization, including field sales representatives and specialists, and such strength is dependent on the continuity of our sales organization. Loss of a significant portion of our sales organization, be it to our direct competition, other medical device companies, our inability to provide competitive compensation, illnesses, retirement or other factors, could have a material adverse effect on our sales level or our rate of sales increase.
We are dependent on our suppliers, particularly our foam suppliers, to have the ability to meet our needs on a timely basis for raw materials used in our products. In the event our suppliers, particularly our foam suppliers, cannot respond on time to our orders for raw materials, or in the event one or more key suppliers go out of the business, we may incur backorders and in turn may not be able to produce our products in time to fill orders from our customers. If this situation occurred, our customers may cancel their orders with us and seek substitute products from our competition, in which case we could lose market share and experience a decrease in sales, or a decrease in the rate of sales growth.
A shortage of one or more chemicals used in the production of foam could result in a reduction in the supply of foam and an increase in the price. As noted above, various types of foam represent the most prevalent raw material in many of our products. In turn, foam is comprised of various chemicals purchased by our foam suppliers for the production of their foam products. In the event of a shortage of any of the key chemicals, the foam suppliers may not be able to produce the foam we order and/or the price could be higher to reflect the chemical shortage, in which case we may not be able to produce our products at planned costs, we may not be able to increase the price sufficiently to cover the cost, we may incur backorders and we may suffer reduced profitability.
Adverse product liability settlements could have a material impact on our reputation, sales and profitability. While we believe our products are safe, efficacious and reliable, and we believe our products meet all known regulatory requirements in the markets in which they are sold, customers and/or patients may take a different position. The Company maintains insurance coverage that would mitigate costs related to products liability claims. However, a material adverse products liability settlement or judgment could damage our reputation, require the payment of costs, fines and legal expenses, result in the loss of one or more customers and potentially risk a reduction in sales or the rate of sales increase.
Larger, well-established competitors dominate the markets in which we compete. Virtually all of our competitors for our therapeutic surfaces, medical beds and custom products range from somewhat larger to substantially larger than the Company. While we believe we are holding or gaining market share in our largest product lines, depending on the particular market, larger, well-financed competitors present a formidable challenge. If we are unable to compete effectively with these larger competitors, we could lose market share, and sales could decrease.
Our growth has been fueled by a combination of organic growth from product development interspersed with occasional acquisitions. Product development risks are discussed above. In the event suitable acquisitions are not available, are too expensive, are too complex, or if available, are unreasonable in price, are not straightforward, are a distraction to management, are difficult to integrate, or result in distributor dislocations, among other problems, our growth component related to acquisitions could be hindered, resulting in a reduction in the rate of sales increase at best, and Company management and customer distraction could result at worst, and ultimately, the acquisition could fail to be additive to the Company. In addition, if capital to fund acquisitions is not available or too expensive, then our ability to grow through acquisitions could be limited to those that could be funded internally.
While we are not solely dependent on our intellectual property and trade secrets to protect our products, to a certain extent these protections provide a deterrent to the competition. If for whatever reason we are unable to protect our intellectual property in the form of patent claims, trade secrets including know-how, and trademarks, then new or more aggressive competition would be anticipated with the result that our sales and profitability could be materially adversely affected.
A successful cyber-attack on our computer system and network could seriously disrupt our operations and compromise Company and customer information. While we have purchased and installed software designed to ward off hostile cyber-attacks, we are not immune from a focused cyber-attack. A successful cyber-attack could make it impossible to enter orders from customers, place orders with suppliers, conduct supply chain operations, invoice customers, meet payroll and conduct other day to day operational tasks using our computer system. Such an event could lead to our inability to supply customers on time, large and lengthy backorders, a sharp decline in customer service levels, and as a result, a decrease in sales and profitability.
Storms, fires, floods, and the like could interrupt our operations and prevent a rapid return to operating status, which could compromise our ability to supply our customers and result in a loss of sales and a reduction in profitability. With the exception of a few “purchased” products for resale, we manufacture all of our products in one of only two locations. Medical beds are produced in our Beamsville, Ontario, Canada location but not in our Greenville location, and our therapeutic support surfaces are primarily produced in Greenville but not in Beamsville. In the event of a damaging hurricane, tornado, fire or flood in Greenville, or a damaging blizzard, fire or flood in Beamsville, the ability to produce certain products could be seriously compromised for a lengthy period of time. To the extent products may not be available to satisfy customer orders, our sales and profitability could be materially adversely affected.
Span-America is a microcap public company with a limited outstanding common stock float, limited analyst coverage, and relatively light daily trading volume, all of which may constrain buy and sell transactions to small quantities over an extended period of time. Existing and prospective shareholders may find it difficult to buy or sell the desired quantities of our common stock without impacting the stock price either negatively or positively depending on the desired transaction. As such, it may be necessary to achieve the desired total transaction in several smaller quantity steps, with the result that transaction costs to the shareholder could be more than transaction costs for a single transaction. While we believe our repurchase of common stock in October 2015 was in the best interest of the shareholders, the common stock repurchased by the Company was retired, resulting in a further reduction in the float.
If, for any of the reasons noted above, or other factors within or beyond our control, our free cash flow is materially constrained in any quarterly period or for any longer period of time, we may not be able to continue to pay all or a portion of our current dividend to shareholders. While our management and Board are proud of the Company’s record in creating value for shareholders and in returning a portion of such value to shareholders periodically in the form of regular quarterly dividends and special dividends, management and the Board acknowledge that the future payment of such dividends is dependent upon many factors including the avoidance of the material negative impact of any of the risk factors noted above, or any other risk factors not so noted above that are beyond reasonable expectations at this time.
During fiscal year 2016, we began distributing certain of our medical products through a local distributor in Australia. As we expand the distribution of our products beyond North America, the company will be subject to increased risks related to various anti-corruption laws in the countries where we do business. The laws of most countries make the payment or offer of payment or receipt of a bribe, kickback or other corrupt payment a crime, subjecting both the company and individual employees to criminal and civil penalties, including fines and prison sentences. These anti-corruption laws include, but are not limited to, the U.S. Foreign Corrupt Practices Act (the “FCPA”). If our employees or representatives fail to comply with these anti-corruption laws, including the FCPA, the company could be subject to penalties and fines, which could disrupt our business and have negative financial and legal consequences.
Item 1B. Unresolved Staff Comments
None.
Item 2. Properties
We own our principal office and manufacturing facility, which is located in Greenville, South Carolina. This facility contains approximately 188,000 square feet used by the medical and custom products segments and is located on a 13-acre site. We believe that our current manufacturing and storage space is adequate to support our operations during the next several years, based on projected sales growth rates.
We lease 15,000 square feet of warehouse space in Salt Lake City, Utah for use as a distribution center for our medical products segment. We lease this facility on a month-by-month basis at a rate of $7,500 per month.
We also have a five-year commitment to lease a 50,000 square foot manufacturing and showroom facility in Beamsville, Ontario, Canada at CAD $278,000 for the first two years increasing ratably to CAD $295,000 for the final year ending in December 2021. We use this facility in our medical segment.
We consider the South Carolina, Ontario and Utah facilities to be suitable and adequate for their intended purposes.
Item 3. Legal Proceedings
From time to time we are a party to various legal actions arising in the normal course of business. We believe that as a result of legal defenses and insurance arrangements with parties we believe to be financially capable, there currently are no proceedings threatened or pending against us that, if determined adversely, would have a material adverse effect on our financial condition or results of operations.
Item 4. Mine Safety Disclosures
Not applicable.
PART II
Item 5. Market for the Registrant's Common Equity, Related Stockholder Matters and Issuer Purchases of Equity Securities
The common stock of Span-America Medical Systems, Inc. trades on The NASDAQ Global Market® under the symbol SPAN. As of December 21, 2016, there were 2,755,625 common shares outstanding, 127 shareholders of record and approximately 1,929 beneficial shareholders. The closing price of Span-America’s stock on December 21, 2016 was $18.24 per share.
The high and low sales prices for the Company’s common stock in each of the last eight fiscal quarters are shown on the following table.
| Quarterly Stock Price Data | ||||||||||||||||||||
|
First |
Second |
Third |
Fourth |
Year |
||||||||||||||||
|
For Fiscal 2016 |
||||||||||||||||||||
|
High |
$ | 20.00 | $ | 19.88 | $ | 19.69 | $ | 19.28 | $ | 20.00 | ||||||||||
|
Low |
17.24 | 18.30 | 16.92 | 17.05 | 16.92 | |||||||||||||||
|
For Fiscal 2015 |
||||||||||||||||||||
|
High |
$ | 20.16 | $ | 19.55 | $ | 21.62 | $ | 20.00 | $ | 21.62 | ||||||||||
|
Low |
16.57 | 16.57 | 17.20 | 16.44 | 16.44 | |||||||||||||||
On November 12, 2014, the Company’s Board of Directors (the “Board”) declared a special cash dividend of $1.00 per share and a regular quarterly cash dividend of 15 cents ($0.15) per share. The regular quarterly dividend was paid on December 11, 2014 to shareholders of record on November 25, 2014. The special dividend was paid on January 7, 2015, to shareholders of record on December 17, 2014.
The Company has paid a regular quarterly cash dividend since January 1990. The Board increased the quarterly dividend to $0.15 per share in July 2014 and $0.16 per share in July 2015. We expect the Company to continue to pay quarterly dividends for the foreseeable future, although the Board may discontinue paying dividends at any time. Future dividend payments will depend upon the Company’s earnings and liquidity position. The Company’s credit facility does not have any covenants directly restricting the Company’s ability to pay dividends; however, it has financial covenants that we believe are customary relating to tangible net worth and leverage ratios that may indirectly restrict our ability to pay dividends.
The information regarding equity compensation plans set forth under Item 12 below is incorporated herein by reference.
We announced on November 28, 2007 that the Board authorized the Company to repurchase up to 138,772 shares of its common stock. On February 11, 2009, the Board expanded the repurchase program by 100,000 shares, bringing the total number of authorized shares to 238,772. In September 2015, the Board authorized the repurchase of 261,310 shares of common stock from former director Robert Johnston and his affiliate, The Jerry Zucker Revocable Trust (the “Johnston/Zucker shares”). Immediately prior to the repurchase of the Johnston/Zucker shares, the Company had a total of 66,489 remaining shares available to be repurchased under the plans authorized in 2007 and 2009. The Board therefore used the remaining previously authorized shares and authorized an additional 194,821 shares (261,310 – 66,489) to complete the Johnston/Zucker share repurchase. After the completion of the Johnston/Zucker share repurchase, there were no remaining shares available to be repurchased under the previously authorized plans.
The Johnston/Zucker share repurchase was completed in two transactions on two different dates. The first transaction for 249,310 shares was completed on October 1, 2015, which occurred during our 2015 fiscal year that ended on October 3, 2015. The second transaction for 12,000 shares was completed on October 9, 2015 and was part of our first quarter of fiscal year 2016. Including the Johnston/Zucker repurchases and prior stock repurchases under the existing repurchase program, the Company has repurchased a total of 433,593 shares of its common stock since beginning the repurchase program in November 2007, or 15.6% of the outstanding shares at the beginning of the repurchase program.
The Company did not repurchase any shares of its common stock during the fourth quarter of fiscal year 2016.
See Note 10 – Revolving Credit Facility in the Notes to Consolidated Financial Statements for information on financial covenants, which could restrict our ability to repurchase shares of Company common stock without bank approval.
PERFORMANCE GRAPH
Notwithstanding any statement in any of the Company’s previous or future filings under the Securities Act of 1933, as amended, or the Securities Exchange Act of 1934, as amended, incorporating future or past filings, including this Annual Report on Form 10-K, in whole or in part, the following Performance Graph shall not be incorporated by reference into any such filing unless the incorporation specifically lists the following Performance Graph.
The following graph sets forth the performance of the Company’s common stock for the five-year period from October 1, 2011 through October 1, 2016, compared to the Russell MicroCap Index and a peer group index. The peer group index was prepared by an unaffiliated third party and is comprised of all exchange-listed companies that had the standard industry classification code 3842 (which relates to medical products and supplies) as of October 1, 2016. The companies included in the peer group index are shown below. All stock prices reflect the reinvestment of cash dividends.
COMPARISON OF CUMULATIVE TOTAL RETURN AMONG
SPAN-AMERICA MEDICAL SYSTEMS, INC.,
THE RUSSELL MICROCAP INDEX
AND A PEER GROUP
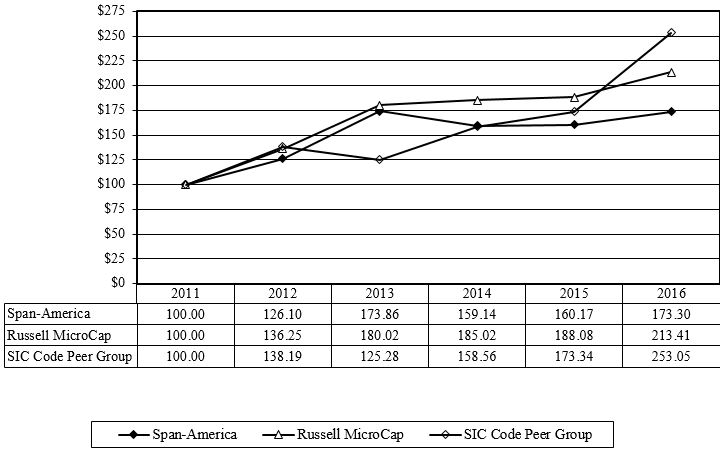 |
Assumes $100 invested on October 1, 2011.
Assumes dividends reinvested. Fiscal year ended October 1, 2016.
COMPANIES INCLUDED IN PEER GROUP INDEX
Standard Industry Classification Code 3842 at October 1, 2016
|
Align Technology, Inc. |
Allied Healthcare Products, Inc. |
Creative Learning Corp. |
|
Edwards Lifesciences Corp. |
Exactech, Inc. |
Glaukos Corp. |
|
Halyard Health, Inc. |
Intuitive Surgical, Inc. |
Invacare Corporation |
|
Lakeland Industries, Inc. |
Medical Solutions Management, Inc. |
Milestone Scientific Inc. |
|
MSA Safety Incorporated |
Nemaura Medical, Inc. |
Pathfinder Cell Therapy |
|
PC Group Incorporated |
PowerMedChairs |
ReWalk Robotics, Inc. |
|
RTI Surgical, Inc. |
Sientra, Inc. |
Span-America Medical Systems, Inc. |
|
Steris PLC |
United Health Products, Inc. |
Wound Management Technologies, Inc. |
|
Zimmer Biomet Holdings, Inc. |
Item 6. Selected Financial Data
Selected Financial Data for the Company’s last five fiscal years is shown in the table below.
| Five-Year Financial Summary | ||||||||||||||||||||
|
(Amounts in thousands, except per share and employee data) |
||||||||||||||||||||
|
2016 |
2015 |
2014 |
2013 |
2012 | (1) | |||||||||||||||
|
For the year: |
||||||||||||||||||||
|
Net sales |
$ | 67,627 | $ | 64,315 | $ | 55,857 | $ | 73,834 | $ | 76,146 | ||||||||||
|
Gross profit |
22,281 | 21,636 | 18,790 | 23,564 | 23,522 | |||||||||||||||
|
Operating income |
6,082 | 5,257 | 3,611 | 7,294 | 7,510 | |||||||||||||||
|
Net income |
4,247 | 3,993 | 2,591 | 5,067 | 5,215 | |||||||||||||||
|
Cash flow from operations |
4,826 | 4,262 | 3,657 | 8,219 | 6,865 | |||||||||||||||
|
Capital expenditures for continuing operations |
440 | 655 | 671 | 558 | 684 | |||||||||||||||
|
Per share: |
||||||||||||||||||||
|
Net income: |
||||||||||||||||||||
|
Basic |
$ | 1.55 | $ | 1.34 | $ | 0.88 | $ | 1.72 | $ | 1.80 | ||||||||||
|
Diluted |
1.54 | 1.33 | 0.87 | 1.69 | 1.77 | |||||||||||||||
|
Cash dividends declared (2) |
0.640 | 1.610 | 0.570 | 1.515 | 0.470 | |||||||||||||||
|
At end of year: |
||||||||||||||||||||
|
Working capital |
$ | 14,614 | $ | 11,391 | $ | 16,618 | $ | 15,172 | $ | 14,530 | ||||||||||
|
Property and equipment - net |
4,116 | 4,536 | 4,888 | 5,137 | 5,391 | |||||||||||||||
|
Total assets |
33,562 | 32,182 | 35,847 | 36,377 | 37,648 | |||||||||||||||
|
Shareholders' equity |
27,012 | 24,302 | 30,700 | 30,114 | 30,080 | |||||||||||||||
|
Book value per share |
9.80 | 8.88 | 10.36 | 10.29 | 10.30 | |||||||||||||||
|
Number of employees |
238 | 261 | 253 | 275 | 344 | |||||||||||||||
|
Key ratios: |
||||||||||||||||||||
|
Return on net sales |
6.3 | % | 6.2 | % | 4.6 | % | 6.9 | % | 6.8 | % | ||||||||||
|
Return on average shareholders' equity |
16.6 | % | 14.5 | % | 8.5 | % | 16.8 | % | 19.2 | % | ||||||||||
|
Return on average total assets |
12.9 | % | 11.7 | % | 7.2 | % | 13.7 | % | 15.3 | % | ||||||||||
|
Current ratio |
3.4 | 2.6 | 4.7 | 3.7 | 3.2 | |||||||||||||||
|
(1) See Note 2 in Notes to 2012 Consolidated Financial Statements for information regarding the acquisition of M.C. Healthcare Products Inc. |
|
(2) Cash dividends declared include special dividends of $1.00 per share in fiscal years 2015 and 2013. |
Item 7. Management's Discussion and Analysis of Financial Condition and Results of Operations
OVERVIEW
Span-America’s operations are divided into two primary business units or segments: medical and custom products. Our revenues, profits and cash flows are derived from the development, manufacture and sale of products for these two market segments. In the medical segment, we manufacture and market a comprehensive selection of pressure management products, including Geo-Matt®, PressureGuard®, Geo-Mattress®, Span-Aids®, Custom Care® and Isch-Dish® products. We manufacture and market medical bed frames including the Rexx, Advantage and Encore® series bed frames as well as related bedside furniture, tables and seating products for the long-term care market. We also market the Risk Manager® bedside safety mat, which is manufactured to our specifications by a third-party supplier. We license and market, but do not manufacture, Selan® skin care products. Our medical products are marketed by our network of sales representatives located in key market areas throughout North America. Many of our medical products are resold to end-user customers by our medical products distributors who work with our sales force to meet customer needs. In the custom products segment, we manufacture consumer mattress pads and pillows for the retail bedding market and various engineered foam products for the industrial market. Our consumer mattress pads and pillows are marketed primarily by our distributor, Hollander. We sell the industrial product line directly to our customers through our own sales force instead of using distributors.
Our primary strategic focus is on the medical business. Our medical segment is generally more profitable than our custom products segment, and we invest the large majority of our resources in maintaining and growing our medical business. Our secondary focus is on the custom products segment. We seek to use our available manufacturing and operational core competencies to pursue consumer and industrial business when we believe it will provide opportunities for growth and an attractive return on our investment of capital and resources. We expect that our long-term growth opportunities will come primarily from our medical segment. We also expect growth opportunities in the custom products segment, but the long-term sales and earnings performance of the custom products segment will likely be more volatile than that of the medical segment.
RESULTS OF OPERATIONS FISCAL 2016 VS. 2015
Summary
Net sales for fiscal year 2016 rose 5% to $67.6 million compared with $64.3 million in fiscal 2015. Net income for fiscal 2016 rose 6% to $4.2 million, or $1.54 per diluted share, from $4.0 million, or $1.33 per diluted share, in fiscal 2015. The sales increase was due to higher sales in the custom products segment that benefited from a seasonal promotion of consumer bedding products that took place in the first quarter of fiscal 2016.
Sales
Sales in the medical segment decreased 3%, or $1.5 million, to $46.3 million in fiscal 2016 compared with $47.8 million in fiscal 2015. All of the medical sales decrease came from Span-Canada, where sales of our medical beds and related products were down by 14% to $10.3 million compared with a record $12.0 million in fiscal 2015. Our Span-Canada sales decreased in fiscal 2016 primarily because we received fewer large orders related to construction of new facilities and major refurbishments of older buildings. Among our pressure management product lines, sales increased by 1% to $36.0 million in fiscal 2016, up from $35.8 million in fiscal 2015. Within this product group, sales of therapeutic support surfaces increased by 3%, but that increase was partly offset by sales decreases among our other pressure management product lines.
Product line leaders within the therapeutic support surface group during fiscal 2016 included our Geo-Mattress® Plus and Pro products as well as our PressureGuard® Custom Care® series and the PressureGuard APM2 surfaces. The growth in sales of therapeutic support surfaces during fiscal 2016 came primarily from our Geo-Mattress, PressureGuard APM® and Protocol® product lines. Therapeutic support surfaces made up 56% of our medical segment sales in fiscal 2016 compared with 53% in fiscal 2015.
Sales volumes in our other medical product lines were down during fiscal 2016 compared with fiscal 2015 due to sluggish demand from many of our customers. This is the continuation of a trend we have seen for several years, which we believe is related to gradual changes in market preferences and in selling, marketing and distribution tactics for these products. If the trend continues, we expect that sales decreases among these product lines will be partially or fully offset by sales increases from our therapeutic support surfaces and medical beds. Sales of mattress overlays declined by 3%. Patient positioner sales were down by less than 1%. Sales of seating and skin care products decreased by 4% and 14%, respectively. Finally, sales of the Risk Manager bedside safety mat were down by 12% during fiscal 2016 because of increasing product and price competition in the market for bedside safety products. Medical sales accounted for 69% of total net sales in fiscal year 2016 compared with 74% in fiscal year 2015.
Our custom products segment consists of mattress pads and pillows for the consumer bedding market and specialty foam products for the industrial market. Sales in the custom products segment rose 29% in fiscal 2016 to $21.3 million compared with $16.5 million in fiscal 2015.
Within the custom products segment, consumer bedding sales increased 37% to $17.2 million compared with $12.6 million in fiscal 2015. The growth in consumer sales came from a seasonal promotion of bedding products in the first quarter of fiscal 2016, the addition of a new customer for bedding products that began in May 2016, and an increase in online sales. The consumer sales growth described above was partially offset by our loss of the Sinomax business in May 2016 after Sinomax opened its first manufacturing facility in the U.S. and in-sourced the manufacturing of these products.
Industrial sales, which represent the remaining part of the custom products segment, increased 3% to $4.0 million in fiscal 2016 compared with $3.9 million in fiscal 2015 due to increased demand from customers in the automotive and packaging markets.
Gross Profit
Our gross profit increased 3% during fiscal 2016 to $22.3 million compared with $21.6 million in fiscal 2015. However, our gross margin decreased to 32.9% for fiscal 2016 compared with 33.6% for fiscal 2015 in spite of significant sales growth during fiscal 2016 because our overall sales mix in fiscal 2016 shifted toward our lower-margin custom products segment where sales grew at a faster rate during fiscal 2016 than in the medical segment. Custom products sales made up 31% of total sales in fiscal 2016 compared with only 26% in fiscal 2015. Our product lines within the custom products segment have historically had much lower gross margins than our medical product lines.
Selling, Research & Development and Administrative Expenses
Selling and marketing expenses decreased 3% to $10.5 million (15.5% of net sales) in fiscal 2016 compared with $10.8 million (16.8% of net sales) in fiscal 2015. The decrease was the result of lower selling expenses related to lower sales volumes of our Span-Canada products and lower marketing expenses in our custom products segment caused by the termination of a consumer marketing project in late fiscal 2015. In addition, most of our sales growth in fiscal 2016 came from our consumer product lines, which have little incremental sales and marketing costs associated with higher sales volumes.
Total research and development expenses remained level at $1.1 million in fiscal 2016 compared with fiscal 2015. We invest almost all of our research and development resources in the medical segment for the development of new products, new features of existing products and design improvements. Our research and development expenses will likely fluctuate from quarter to quarter and from year to year, depending on the nature of the development projects being pursued.
General and administrative expenses increased 2% to $4.6 million in fiscal 2016 from $4.5 million in fiscal 2015. The increases in general and administrative expenses were due to higher costs in the categories of incentive and other compensation, which was partly offset by higher income from cash value of life insurance.
Operating Income
Total operating income increased 16% in fiscal 2016 to $6.1 million compared with $5.3 million in fiscal 2015. Growth in sales volume and margin improvements within the custom products segment were the primary drivers for the increase in fiscal 2016 operating income. In the medical segment, operating income for fiscal 2016 decreased by 5% to $6.0 million compared with $6.3 million in fiscal 2015 due to the 3% decrease in medical sales volume. In the custom products segment, operating income increased 441% to $802,000 in fiscal 2016 compared with an operating loss of $235,000 in fiscal 2015 due to the $4.8 million, or 29%, sales increase in custom products sales during the year as well as margin improvements among our consumer product lines.
Non-Operating Income and Expenses
We generated net non-operating expense of $8,000 in fiscal 2016 compared with a net non-operating gain of $408,000 in fiscal 2015. The decline was caused mostly by lower foreign currency exchange gains as a result of relatively stable US-Canadian dollar exchange rates during fiscal 2016 compared with the weakening of the Canadian dollar vs. the US dollar during fiscal year 2015.
See “Liquidity and Capital Resources” below for further discussion about our revolving credit facility and “Foreign Currency Exchange” below for more information about foreign exchange risks.
Net Income and Dividends
Net income for fiscal 2016 rose 6% to $4.2 million compared with $4.0 million in fiscal 2015. Earnings per share increased by 16% in fiscal 2016 to $1.54 per diluted share compared with $1.33 per diluted share in fiscal 2015. The increase in net income for fiscal 2016 was due primarily to strong sales growth and margin improvements within our custom products segment. The growth rate in earnings per share during fiscal 2016 was higher than the growth rate in net income because we had fewer shares outstanding during fiscal 2016 as a result of stock repurchases in October 2015. See “Liquidity and Capital Resources” below for more information on the Company’s stock repurchases.
During fiscal 2016, we paid dividends of $1.8 million, or 41% of net income for the year. This amount consisted of four quarterly dividends of $0.16 per share.
Outlook
We believe sales for the first quarter of fiscal 2017 will be lower than they were in the first quarter of fiscal 2016 due mainly to a decrease in sales of consumer bedding products. However, we believe our quarterly comparisons will be more favorable for the remainder of fiscal 2017 after the first fiscal quarter. As we reported in fiscal 2016, our consumer sales will be down in fiscal 2017 because of the loss of the Sinomax business, and because the seasonal promotion of consumer products that took place in the first quarter of fiscal 2016 will not be repeated in the first quarter of fiscal 2017. However, we expect that our medical sales levels in the first quarter of fiscal 2017 will be higher than they were in the first quarter of fiscal 2016, which should partly offset the expected decrease in consumer sales.
We believe our earnings for the first quarter of fiscal 2017 will be slightly lower than those of the first quarter of fiscal 2016. We expect that our sales mix during the first quarter of fiscal 2017 will be more profitable than it was in the first quarter of fiscal 2016, which we believe will partly offset the decline in profitability associated with lower consumer sales volume during the quarter.
RESULTS OF OPERATIONS FISCAL 2015 VS. 2014
Summary
Net sales for fiscal year 2015 rose 15% to $64.3 million compared with $55.9 million in fiscal 2014. Net income for fiscal 2015 rose 54% to $4.0 million, or $1.33 per diluted share, from $2.6 million, or $0.87 per diluted share, in fiscal 2014. The increases in sales and earnings in fiscal 2015 occurred primarily in our medical segment and were due to significant growth in sales of our medical beds and related products from Span-Canada as well as strong growth in sales of therapeutic support surfaces, our largest medical product line. We also had increased sales volumes in our consumer and industrial product lines, which are part of the custom products segment.
Sales
Sales in the medical segment increased 13%, or $5.5 million, to a record $47.8 million in fiscal 2015 compared with $42.3 million in fiscal 2014 due to increased sales from our Span-Canada medical beds and related products and our Span-America pressure management products. Span-Canada product line sales were up 30%, or $2.8 million, to $12.0 million in fiscal 2015 compared with $9.3 million in fiscal 2014 as a result of broad-based growth in sales of our beds and related products, led by higher volume of our new Encore bed.
Sales in our pressure management medical product lines increased by 8% during fiscal 2015 to $35.8 million compared with $33.0 million in fiscal 2014. The growth in sales of pressure management products came almost entirely from our line of therapeutic support surfaces where sales increased by 14% to $25.3 million in fiscal 2015 compared with $22.2 million in fiscal 2014. Product leaders within the therapeutic support surface group included the GeoMattress® Ultramax® as well as our PressureGuard® APM2 and Custom Care® support surfaces. Therapeutic support surfaces made up 53% of our medical segment sales in fiscal 2015 and 52% in fiscal 2014.
Sales volumes in our other medical product lines were generally down during fiscal 2015 compared with fiscal 2014 due to sluggish demand from many of our customers for mattress overlays, patient positioners and skin care products, which declined by 1%, 5% and 2%, respectively. The exception occurred in our line of wheelchair cushions and related seating products, where sales increased by 1% during fiscal 2015 compared with fiscal 2014. Sales of the Risk Manager bedside safety mat decreased by 20% during fiscal 2015 due to increasing product and price competition in the market for bedside safety products. Medical sales accounted for 74% of total net sales in fiscal year 2015 and 76% in fiscal year 2014.
Sales in the custom products segment rose 22% in fiscal 2015 to $16.5 million compared with $13.5 million in fiscal 2014. Within the custom products segment, consumer bedding sales increased 26% to $12.6 million compared with $10.0 million in fiscal 2014 due primarily to regaining the business of a large retail customer through our distributor, Sinomax, which was lost for a period of time during fiscal 2014 as previously reported.
Industrial sales, which make up the other part of the custom products segment, increased 10% to $3.9 million in fiscal 2015 compared with $3.5 million in fiscal 2014. The industrial sales growth during fiscal 2015 was broad-based, coming from new and existing customers in the major parts of our industrial market, including the automotive, packaging and water sports industries.
Gross Profit
Our gross profit increased 15% during fiscal 2015 to $21.6 million compared with $18.8 million in fiscal 2014. The increase in gross profit resulted from higher sales volume in the medical segment, particularly among our Span-Canada beds and related products. Our gross margin remained level at 33.6% for fiscal 2015 and fiscal 2014 in spite of significant sales growth during fiscal 2015 because our overall sales mix in fiscal 2015 shifted slightly toward our lower-margin custom products segment where sales grew at a faster rate during fiscal 2015 than in the medical segment.
Selling, Research & Development and Administrative Expenses
Selling and marketing expenses increased 7% to $10.8 million (16.8% of net sales) in fiscal 2015 compared with $10.1 million (18.1% of net sales) in fiscal 2014. The increase occurred primarily in the medical segment and was the result of increases in commissions, other incentive compensation, shipping costs and other expenses related to higher sales volume during fiscal 2015.
Total research and development expenses increased 6% to $1.1 million in fiscal 2015 compared with fiscal 2014 due to new-product development projects in the medical segment.
General and administrative expenses increased 11% to $4.5 million in fiscal 2015 from $4.0 million in fiscal 2014. The increases in general and administrative expenses were due to higher costs in the categories of incentive and other compensation and property/casualty insurance combined with lower income from cash value of life insurance.
Operating Income
Total operating income increased 46% in fiscal 2015 to $5.3 million compared with $3.6 million in fiscal 2014 mostly as a result of higher sales volumes among our medical products. In the medical segment, operating income for fiscal 2015 increased by 60% to $6.3 million compared with $4.0 million in fiscal 2014 due to the 13% increase in medical sales volume. In the custom products segment, operating income decreased 191% to an operating loss of $235,000 in fiscal 2015 compared with operating income of $258,000 in fiscal 2014 due to lower margins on custom products sales during the year.
Non-Operating Income and Expenses
We generated net non-operating income of $408,000 in fiscal 2015 compared with $18,000 in fiscal 2014. The fiscal 2015 non-operating income consisted primarily of realized foreign currency gains of $401,000 resulting from the strengthening of the U.S. dollar versus the Canadian dollar during the fiscal year. See “Liquidity and Capital Resources” below for further discussion about our revolving credit facility and “Foreign Currency Exchange” below for more information about foreign exchange risks.
Net Income and Dividends
Net income for fiscal 2015 rose 54% to $4.0 million, or $1.33 per diluted share, from $2.6 million, or $0.87 per diluted share, in fiscal 2014. The earnings increase for fiscal 2015 was the result of higher sales volume in the medical segment, particularly from our Span-Canada business, a comparatively lower rate of growth in overall operating expenses and an increase in non-operating income as previously described above.
During fiscal 2015, we paid dividends of $4.8 million, or 120% of net income for the year. This amount consisted of three quarterly dividends of $0.15 per share, one quarterly dividend of $0.16 per share and one special dividend of $1.00 per share.
LIQUIDITY AND CAPITAL RESOURCES
We generated cash flow from operations of $4.8 million during fiscal 2016, which represented an increase of 13% compared with cash flow of $4.3 million during fiscal 2015. The increase in cash flow during fiscal 2016 was caused by higher net income for the year, a smaller increase in accounts receivable in fiscal 2016 compared with 2015 and a decrease in inventory during fiscal 2016. These increases in cash flow were partially offset by a decrease in accounts payable during the year. The reductions in inventory and accounts payable levels during fiscal year 2016 compared with 2015 were primarily caused by the working capital requirements of the seasonal promotion of consumer products that was in process at fiscal year-end 2015 but not at fiscal year-end 2016.
Our primary uses of cash provided by operations during fiscal 2016 were dividend payments of $1.8 million, equipment purchases of $440,000 and stock repurchases of $210,000.
Working capital increased by $3.2 million, or 28%, to $14.6 million at fiscal year-end 2016 compared with $11.4 million at fiscal year-end 2015. In addition, our current ratio increased to 3.4 at fiscal year-end 2016 from 2.6 at fiscal year-end 2015. The increases in working capital and current ratio during fiscal 2016 were the result of increases in cash and prepaid expenses combined with a reduction in accounts payable during fiscal 2016. These changes were partly offset by a decrease in inventory during fiscal 2016. The decreases in inventory and accounts payable were related to the seasonal promotion of consumer products as described above.
Accounts receivable, net of allowances, increased 3%, or $266,000, to $8.1 million at the end of fiscal 2016 compared with $7.8 million at the end of fiscal 2015. The days sales outstanding (or average collection time), calculated using a 12-month average for trade accounts receivable balances, remained stable at 40.9 days in 2016 compared with 41.0 days in 2015. Approximately $1.8 million included in accounts receivable at fiscal year-end 2016 were for sales made by Span-Canada. All of Span-America’s accounts receivable are unsecured. Certain receivables of Span-Canada are insured under the terms of an insurance policy.
Inventory, net of reserves, decreased by $1.3 million, or 15%, to $7.4 million at fiscal year-end 2016 compared with $8.7 million at fiscal year-end 2015. The decrease occurred primarily in the category of consumer finished goods and was related to the seasonal promotional order that shipped during the first quarter of fiscal 2016. At fiscal year-end 2016 our inventory included approximately $2.4 million of inventory related to Span-Canada. The work-in-process inventory shown in Note 3 in the Notes to Consolidated Financial Statements is entirely associated with Span-Canada. Inventory turns increased to 5.6 times per year in fiscal 2016 compared with 5.3 times in fiscal 2015.
Goodwill remained stable at $3.9 million at fiscal year-end 2016 compared with fiscal year-end 2015.
Net intangibles decreased by $225,000, or 10%, to $2.0 million during fiscal 2016. The decrease was primarily due to $295,000 of amortization expense.
From the end of fiscal year 2015 to the end of fiscal 2016:
|
● |
Our deferred income tax asset increased by 31%, or $108,000, to $459,000 from $351,000 primarily due to incentive compensation expense accrued during fiscal 2016 that will not be deductible for tax purposes until fiscal year 2017. |
|
● |
Prepaid expenses increased by $468,000, or 114%, to $879,000 primarily as a result of the payment of a refundable deposit on a performance bond related to a bid to provide beds and therapeutic support surfaces to a government customer in Canada. |
|
● |
Net property and equipment decreased by $420,000, or 9%, during fiscal 2016. The decrease was made up of $855,000 in depreciation expense, partially offset by approximately $440,000 in equipment purchases. |
|
● |
Other assets decreased 1% to $2.9 million at fiscal year-end 2016 compared with $3.0 million at fiscal year-end 2015 mainly as a result of decreases in deposits for raw material and equipment purchases, partially offset by an increase in the cash surrender of life insurance policies. |
|
● |
Our accounts payable decreased by $1.6 million, or 40%, to $2.4 million at fiscal year-end 2016 compared with $4.0 million at fiscal year-end 2015 due to a decrease in raw material purchases in September 2016 compared with September 2015. Our accounts payable balance was unusually high at fiscal year-end 2015 because of raw material purchases related to the seasonal promotion that was in process at the time. By fiscal year-end 2016, our accounts payable balance had returned to a more normal level. |
|
● |
Accrued and sundry liabilities increased by 15% during the year to $3.6 million compared with $3.1 million last year due mainly to increases in accruals for incentive compensation expense and rebates owed to customers. The increase in accrued rebates during fiscal 2016 was related to an order from a large customer in the medical segment that shipped during the last three months of fiscal 2016. See Note 8 in the Notes to Consolidated Financial Statements below for more information. |
|
● |
Accumulated other comprehensive loss remained stable at $2.5 million. |
We have a revolving credit facility from a bank which expires on April 30, 2018. The maximum principal amount we can borrow at any one time is $5.0 million. There is no unused commitment fee charged for the credit facility. The credit facility is unsecured and accrues interest at a variable rate equal to 30-day LIBOR plus a margin ranging from 85 to 165 basis points, depending on our leverage ratio (as defined in the agreement). The interest rate, including the margin of 85 basis points, was 1.2795% in January 2016, the last time we had borrowings outstanding. Interest-only payments are required monthly. We have pledged to grant the bank a security interest in our accounts, instruments, and chattel paper upon its request in the event of a default as defined in the credit agreement. Our obligations under the credit agreement are guaranteed by our subsidiary, Span Medical Products Canada Inc.
The credit facility includes financial covenants relating to tangible net worth and leverage ratios, and restricts mergers and acquisitions, asset sales, indebtedness, liens and capital expenditures. Violation of loan covenants could result in acceleration of the term of the agreement. The lending bank waived any event of default in connection with (1) our regular quarterly dividend payments of $1.8 million during fiscal year 2015, which represented 46% of our net income for the fiscal year, (2) the special dividend of $1.00 per share declared in November 2014 and paid on January 7, 2015 and (3) the Johnston/Zucker stock repurchase described below and elsewhere in this report. We believe that we were in compliance with all other loan covenants in the credit facility as of October 1, 2016. There were no borrowings under this credit facility as of October 1, 2016. See Note 10 – Revolving Credit Facility in the Notes to Consolidated Financial Statements below for more information on the credit facility.
The Company announced on November 28, 2007 that the Board authorized the Company to repurchase up to 138,772 shares of its common stock. On February 11, 2009, the Board expanded the repurchase program by 100,000 shares, bringing the total number of authorized shares for repurchase to 238,772. Prior to our announcement on October 2, 2015 of a large stock repurchase in a private transaction, we had repurchased a total of 172,283 shares under our existing repurchase program. On October 2, 2015, we announced that the Company had agreed to repurchase an additional 261,310 shares of common stock from former director Robert B. Johnston and his affiliate, The Jerry Zucker Revocable Trust. Including the Johnston/Zucker repurchase and prior stock repurchases under the existing repurchase program, the Company has repurchased a total of 433,593 shares of its common stock since the start of the repurchase program in November 2007, or 15.6% of the outstanding shares at the beginning of the repurchase program.
We believe that funds on hand, funds generated from operations and funds available under our revolving credit facility will be adequate to finance our operations and expected capital requirements during fiscal year 2017 and for the foreseeable future.
OFF-BALANCE-SHEET ARRANGEMENTS
We have no off-balance-sheet arrangements.
CONTRACTUAL OBLIGATIONS
The following table summarizes our significant contractual obligations and commercial commitments at October 1, 2016 and the future periods in which such obligations are expected to be settled in cash. For additional information regarding these obligations, see the referenced footnotes in the Notes to Consolidated Financial Statements under Item 8 below.
| Payments Due by Period | ||||||||||||||||||||
|
Contractual Obligations |
Less Than |
More Than |
||||||||||||||||||
|
(dollars in thousands) |
Total |
1 Year |
1-3 Years |
3-5 Years |
5 Years |
|||||||||||||||
|
Operating lease obligations - Note 19 |
$ | 1,098 | $ | 206 | $ | 419 | $ | 436 | $ | 37 | ||||||||||
|
Purchase obligations - Note 20 |
2,920 | 730 | 1,460 | 730 | - | |||||||||||||||
|
Deferred compensation - Note 11 |
568 | 114 | 227 | 227 | - | |||||||||||||||
|
Total contractual obligations |
$ | 4,586 | $ | 1,050 | $ | 2,106 | $ | 1,393 | $ | 37 | ||||||||||
IMPACT OF INFLATION AND COST OF RAW MATERIALS
Fiscal 2014: General market inflation was low in the United States and Canada during fiscal year 2014 and consequently had minimal impact on our sales and earnings. Prices for polyurethane foam, our primary raw material in the U.S., were relatively stable during fiscal year 2014. We incurred small foam price increases during the first half of the fiscal year that were rolled back later in the fiscal year. Prices for our primary raw materials in Canada were also relatively stable during fiscal year 2014. For the full year of fiscal 2014, inflation had a minimal impact on our sales prices and a small negative impact on our earnings.
Fiscal 2015: General market inflation was low in the United States and Canada during fiscal year 2015 and consequently had minimal impact on our sales and earnings. Prices for polyurethane foam, our primary raw material in the U.S., were relatively stable during fiscal year 2015. However, near the end of fiscal year 2015, we received small decreases in the prices of several of our polyurethane foam raw materials. Prices for our primary raw materials used in Canada were relatively stable during fiscal year 2015. For the full fiscal year 2015, inflation had a minimal impact on our sales prices and earnings.
Fiscal 2016: General market inflation was low in the United States and Canada during fiscal year 2016 and consequently had minimal impact on our sales and earnings. Prices for polyurethane foam, our primary raw material in the U.S., were relatively stable during fiscal year 2016. The price of polyurethane foam, our primary raw material, can sometimes be affected by the price of crude oil. While oil prices have been volatile during fiscal 2016, we have seen minimal changes in the prices of polyurethane foam, and we do not have any current indication as to whether future changes in oil prices will impact the future price of polyurethane foam. See Item 7A “Quantitative and Qualitative Disclosures about Market Risk” below for more information on the cost of polyurethane foam. Prices for our primary raw materials in Canada were also relatively stable during fiscal year 2016. For the full fiscal year 2016, inflation had a minimal impact on our sales prices and earnings.
Based on current conditions in the markets for our primary raw materials, we expect inflation to be a minimal factor for our operations during fiscal 2017. If the rate of inflation were to accelerate, the largest effect on the Company would likely be increases in cost of goods sold, primarily in the cost of raw materials, which is our single largest cost category. If unemployment rates remain low and the economy continues to grow, we could experience wage inflation, which would increase our payroll costs. We would attempt to mitigate any such higher costs, but we can give no assurance that higher costs could be fully offset by sales price increases, expense reductions or other operational changes.
FOREIGN CURRENCY EXCHANGE
Span-Canada, operating under the name “M.C. Healthcare Products,” uses the Canadian dollar as its functional currency. However, all transactions originally denominated in Canadian dollars are converted to U.S. dollars for financial reporting purposes. We are subject to exchange rate fluctuations, which vary based on volume and currency market conditions. These exchange rate fluctuations will cause foreign exchange gains and losses, which could be material to our results of operations, depending on currency market conditions and the timing and levels of our business activities in the U.S. and Canada. For fiscal year 2016, our net realized foreign currency exchange gain was $5,000 compared with a net realized foreign currency exchange gain of $401,000 in fiscal 2015.
CRITICAL ACCOUNTING POLICIES
This discussion and analysis of financial condition and results of operations is based on our financial statements that we prepare in conformity with accounting principles generally accepted in the United States of America (GAAP). The preparation of our financial statements requires us to make estimates and assumptions that affect the reported amounts of assets, liabilities, revenues and expenses. These estimates and assumptions are based on historical experience and on various other factors that we believe are reasonable under the circumstances, the results of which form the basis for making judgments about the carrying values of assets and liabilities that are not readily apparent from other sources. These estimates and assumptions also require the application of certain accounting policies, many of which require us to make forecasts about future events and their estimated impact on amounts reported in our financial statements and related notes. We periodically review our accounting policies and estimates and make adjustments when facts and circumstances dictate.
Actual results may differ from these estimates under different assumptions or conditions. Any differences could have a material impact on our financial condition and results of operations.
In addition to the accounting policies more fully described in the Notes to Consolidated Financial Statements included in this report, we have identified the following critical accounting policies used in the preparation of our financial statements.
Allowance for Doubtful Accounts
Credit evaluations are undertaken to set credit limits for most of our customers. We regularly evaluate past-due accounts included in our accounts receivable and provide what we estimate to be adequate reserves for doubtful accounts. Customer financial conditions may change and increase the risk of non-collectability and may require additional provisions, which could negatively impact our operating results. As of October 1, 2016 and October 3, 2015, our provision for doubtful accounts was approximately $140,000 and $148,000, respectively. This represented approximately 1.7% of total accounts receivable at fiscal year-end 2016 compared with 1.9% of total accounts receivable at fiscal year-end 2015.
Reserve for Obsolete and Excess Inventories
We regularly review inventory quantities on hand and adjust for excess and obsolete inventory based primarily on historical usage rates and our estimates of future product demand and production. Actual demand may differ from our estimates, in which case we may have understated or overstated the provision required for obsolete and excess inventory, which would have an impact on our operating results. As of October 1, 2016, our provision for excess and obsolete inventory represented approximately 7.1% of total inventories, or approximately $525,000. This compares with $570,000, or 6.5%, of total inventories at fiscal year-end 2015.
Warranty Obligations
We warrant certain of our products for specific periods of time against manufacturing or performance defects. We provide for the estimated future cost of warranty obligations in cost of goods sold when the related revenue is recognized. The accrued warranty cost represents our best estimate at the time of sale of the total cost that we will incur to repair or replace covered products or parts. The amount of accrued estimated warranty cost is primarily based on historical experience as well as current information on repair costs. Actual warranty cost could differ from these estimated amounts. In addition, we receive warranties from certain suppliers of key components of our products, and we rely on these suppliers to replace or provide credit for their defective goods that might be used in our products. Such replacements or credits reduce our direct warranty costs. If our suppliers failed to honor their warranties, our warranty cost could increase. We review the accrued balances on a quarterly basis and update the historical warranty cost trends. If our estimated warranty costs were too low, we would be required to accrue additional warranty cost in the future, which would negatively affect our operating results. Our actual warranty expenses were approximately $194,000 in fiscal 2016, $223,000 in fiscal 2015, and $215,000 in fiscal 2014. Our accrued warranty costs at October 1, 2016 were $306,000. See Note 9 in the Notes to Consolidated Financial Statements for more information on product warranties.
Impairment of Long-Lived Assets
“Impairment” is the condition that exists when the carrying amount of a long-lived asset or asset group is greater than its fair value. We evaluate long-lived assets for potential impairment whenever events occur or circumstances indicate that the carrying amount of the assets may not be recoverable. The carrying amount of a long-lived asset is not recoverable if it exceeds the sum of the undiscounted cash flows expected to result from the use and eventual disposition of the asset. If the carrying amount of a long-lived asset is not recoverable and is greater than its fair value, the asset is impaired, and an impairment loss must be recognized.
Impairment of Goodwill
The assets of our medical segment as of fiscal year-end 2016 included goodwill of $3.9 million. We evaluate this goodwill for impairment at least annually in September, or more frequently if events occur or circumstances change that could reduce the fair value of our medical segment. In assessing the value of goodwill, we must make assumptions regarding estimated future cash flows and other factors to determine the fair value of the medical segment. If our estimates or our related assumptions change in the future, we may be required to record impairment charges, which would negatively impact operating results. As of October 1, 2016, our test date, we determined that the fair value of the medical segment exceeded its carrying value and thus no impairment charge was required.
We also identify reporting units for goodwill impairment testing in accordance with ASC 350-20-35 Intangibles – Goodwill and Other (ASC 350). We combine reporting units, which are a component of an operating segment, when they have similar economic characteristics, products, types of customers, distribution methods and regulatory environments. For the year ended October 1, 2016, we had three reporting units that we tested for goodwill impairment. We determined that none of the reporting units was at risk of failing step one in the goodwill impairment test required under ASC 350, and therefore none of the reporting units was impaired. See Note 5 - Goodwill in the Notes to Consolidated Financial Statements later in this report for more information on goodwill impairment testing.
Present Value of Deferred Compensation
We are obligated under the terms of a retirement agreement to make fixed payments for the remaining lives of Span-America’s founder and his ex-wife as discussed in Note 11 - Deferred Compensation in the Notes to Consolidated Financial Statements. This obligation can be funded from internally generated cash or from the cash value of Company-owned life insurance policies, which had a value of $2.7 million at October 1, 2016. See Item 7A below and Notes 7 and 11 in the Notes to Consolidated Financial Statements for more information on deferred compensation and the cash value of life insurance. We have fully accrued the present value of the expected payments due over the combined estimated life expectancy of our founder and his ex-wife. In calculating this present value, we used a discount rate of 6%, which was an estimate of the effective long-term rate of return on the portfolio of investments related to the life insurance policies (see Item 7A below). If the actual rate of return was significantly lower than our estimate and we were required to accrue additional deferred compensation costs in the future, it would negatively affect our operating results. As of October 1, 2016, we had recorded a deferred compensation liability of approximately $403,000, including current and long-term portions. If we reduced the discount rate by 1%, the deferred compensation liability would be increased by approximately $8,000, and pre-tax income would be reduced by the same amount.
Item 7A. Quantitative and Qualitative Disclosures About Market Risk
We are exposed to financial market risk in four areas: commodity price risk, cash value of life insurance, our credit facility and foreign currency exchange. Commodity price risk could affect our operations primarily through our purchase of raw materials used in our manufacturing processes. The cost of polyurethane foam, our primary raw material, is indirectly influenced by oil prices. However, other market factors also affect foam prices, including the available supply of component chemicals, demand for related products from domestic and international manufacturers, competition among domestic suppliers, our purchase volumes and regulatory requirements. Consequently, it is difficult for us to accurately predict the impact that future inflation and other factors might have on the cost of polyurethane foam, our largest-volume raw material. If the cost of polyurethane foam increased significantly, and if we were unable to offset the cost increase through sales price increases or other expense reductions, our earnings could be materially negatively affected. If we experienced a 1% across-the-board increase in the cost of polyurethane foam, and if we were unable to offset the increase, our pre-tax earnings would be reduced by approximately $112,000. See the discussion above under “Impact of Inflation and Cost of Raw Materials” for more information.
Other assets at October 1, 2016 included $2.7 million in cash value of life insurance, which is subject to market risk related to equity pricing and interest rate changes. The cash value is generated from life insurance policies that are being used as the funding vehicle for a retirement program for Span-America’s founder and former chairman and his ex-wife. See “Present Value of Deferred Compensation” under “Critical Accounting Policies” above. The cash value is invested in a combination of fixed income life insurance contracts and a portfolio of mutual funds managed by an insurance company. The fixed income contracts are similar to fixed income bond funds and are therefore subject to interest rate and company risk. The mutual fund portfolios invest in common stocks and bonds in accordance with their individual investment objectives. These portfolios are exposed to stock market, company and interest rate risks similar to comparable mutual funds. We believe that substantial fluctuations in equity markets and interest rates and the resulting changes in cash value of life insurance would not have a material adverse effect on our financial position. During the fiscal year ended October 1, 2016, cash value of life insurance increased by 6%, creating after-tax income of approximately $147,000. During the fiscal year ended October 3, 2015, cash value of life insurance increased by 2%, creating after-tax income of approximately $43,000. The reason the cash value of life insurance increased more in fiscal year 2016 than it did in fiscal year 2015 is because the values of the underlying investments in the life insurance policies increased more during fiscal 2016 than they did during fiscal 2015, reflecting the general performance in equity and fixed income markets in fiscal 2016 compared with fiscal 2015.
Our credit facility accrues interest at a variable rate equal to 30-day LIBOR plus a margin ranging from 85 to 165 basis points depending on our then-applicable leverage ratio (as defined in the credit facility). Interest is payable monthly. The interest rate, including the margin of 85 basis points, was 1.2795% in January 2016, the last time we incurred interest. A material increase in interest rates could have a negative impact on our financial condition and earnings to the extent that we had significant outstanding borrowings under the facility. The degree of impact would vary depending on the level of the borrowings. We had no outstanding balance under our credit facility as of October 1, 2016. Assuming a constant level of debt of $1.0 million for an entire fiscal year, a 100 basis point increase in the interest rate on the outstanding loan balance would increase our interest expense by $10,000 per year.
As a result of the M.C. Healthcare asset acquisition, we own assets in Canada and manufacture and sell products in Canada in addition to the U.S. We are therefore subject to realized and unrealized gains or losses on foreign currency translation activities related to our operations. Foreign exchange gains or losses have not had a material effect on our results of operations since the M.C. Healthcare acquisition. We do not currently hedge our foreign exchange risks because our foreign exchange transactions occur infrequently and in relatively small amounts since our revenues and costs are incurred in both U.S. and Canadian dollars. Our foreign exchange risk could increase if the exchange rates between the U.S. and Canadian dollars became more volatile.
Most of our M.C. Healthcare operating costs and liabilities are denominated in Canadian dollars. Sales are denominated in the currency of the country in which they occur. Accordingly, material changes in the Canadian-U.S. dollar exchange rate may significantly impact our revenues and costs and the value of our assets and liabilities. The magnitude and direction of this impact primarily depends on our production and sales volume, the proportion of our production and sales that occur in Canada, the proportion of our financial liabilities denominated in Canadian dollars and the magnitude, direction and duration of changes in the Canadian-U.S. dollar exchange rate. Increases in the value of the Canadian dollar versus the U.S. dollar reduce our earnings, which are reported in U.S. dollar terms. Assets and liabilities are translated into U.S. dollars at the quarter-end exchange rate. Revenues and expenses are translated at weighted average exchange rates. Based on our levels of assets and liabilities in Canada as of October 1, 2016, for every 1% increase in the value of a Canadian dollar compared to a U.S. dollar our total assets would have increased by approximately $109,000, and our total liabilities would have increased by approximately $10,000 for a net change of approximately $99,000. For fiscal year 2016, our net realized foreign currency exchange gain was $5,000 compared with $401,000 in fiscal 2015. The decrease in foreign currency exchange gain in fiscal 2016 was the result of relative stability in the exchange rates between the U.S. and Canadian dollars during fiscal 2016 compared with a weakening of the Canadian dollar versus the U.S. dollar during fiscal 2015.
Item 8. Consolidated Financial Statements and Supplementary Data
Span-America Medical Systems, Inc.
Consolidated Financial Statements
October 1, 2016
|
Contents |
|
|
|
|
|
Report of Independent Registered Public Accounting Firm |
44 |
| Consolidated Financial Statements | |
| Consolidated Statements of Comprehensive Income | 45 |
| Consolidated Balance Sheets | 46 |
| Consolidated Statements of Cash Flows | 47 |
| Consolidated Statements of Changes in Shareholders’ Equity | 48 |
| Notes to Consolidated Financial Statements | 49 |
Report of Independent Registered Public Accounting Firm
To the Board of Directors and Shareholders
Span-America Medical Systems, Inc.
Greenville, South Carolina
We have audited the accompanying consolidated balance sheets of Span-America Medical Systems, Inc. as of October 1, 2016, and October 3, 2015, and the related consolidated statements of comprehensive income, changes in shareholders' equity, and cash flows for each of the years in the three year period ended October 1, 2016. Our audits also include the financial statement schedule of Span-America Medical Systems, Inc. listed in Item 15(c). These financial statements and financial statement schedule are the responsibility of the Company's management. Our responsibility is to express an opinion on these financial statements and schedule based on our audits.
We conducted our audits in accordance with the standards of the Public Company Accounting Oversight Board (United States). Those standards require that we plan and perform the audit to obtain reasonable assurance about whether the financial statements are free of material misstatement. The Company is not required to have, nor were we engaged to perform, an audit of its internal control over financial reporting. Our audits included consideration of internal control over financial reporting as a basis for designing audit procedures that are appropriate in the circumstances, but not for the purpose of expressing an opinion on the effectiveness of the Company’s internal control over financial reporting. Accordingly, we express no such opinion. An audit also includes examining, on a test basis, evidence supporting the amounts and disclosures in the financial statements, assessing the accounting principles used and significant estimates made by management, as well as evaluating the overall financial statement presentation. We believe that our audits provide a reasonable basis for our opinion.
In our opinion, the consolidated financial statements referred to above present fairly, in all material respects, the financial position of Span-America Medical Systems, Inc. as of October 1, 2016, and October 3, 2015, and the results of its operations and its cash flows for each of the years in the three year period ended October 1, 2016, in conformity with U.S. generally accepted accounting principles. Also, in our opinion, the related financial statement schedule, when considered in relation to the basic consolidated financial statements taken as a whole, presents fairly in all material aspects the information set forth therein.
/s/ ELLIOTT DAVIS DECOSIMO, LLC
Greenville, South Carolina
December 23, 2016
|
Consolidated Statements of Comprehensive Income |
||||||||||||
|
Years Ended |
||||||||||||
|
October 1, |
October 3, |
September 27, |
||||||||||
|
2016 |
2015 |
2014 |
||||||||||
|
Net sales |
$ | 67,627,170 | $ | 64,314,996 | $ | 55,857,375 | ||||||
|
Cost of goods sold |
45,345,994 | 42,679,013 | 37,067,737 | |||||||||
|
Gross profit |
22,281,176 | 21,635,983 | 18,789,638 | |||||||||
|
Selling and marketing expenses |
10,504,813 | 10,789,150 | 10,088,400 | |||||||||
|
Research and development expenses |
1,134,547 | 1,137,334 | 1,071,583 | |||||||||
|
General and administrative expenses |
4,559,552 | 4,452,047 | 4,019,075 | |||||||||
| 16,198,912 | 16,378,531 | 15,179,058 | ||||||||||
|
Operating income |
6,082,264 | 5,257,452 | 3,610,580 | |||||||||
|
Non-operating income (expense): |
||||||||||||
|
Foreign currency gain |
4,508 | 401,000 | 29,868 | |||||||||
|
Interest expense |
(5,144 | ) | (6,285 | ) | (12,639 | ) | ||||||
|
Other |
(7,297 | ) | 13,231 | 958 | ||||||||
|
Net non-operating (expense) income |
(7,933 | ) | 407,946 | 18,187 | ||||||||
|
Income before income taxes |
6,074,331 | 5,665,398 | 3,628,767 | |||||||||
|
Provision for income taxes - Note 13 |
1,827,000 | 1,672,000 | 1,038,000 | |||||||||
|
Net income |
4,247,331 | 3,993,398 | 2,590,767 | |||||||||
|
Other comprehensive income (loss), after tax: |
||||||||||||
|
Foreign currency translation gain (loss) |
44,562 | (1,539,111 | ) | (794,177 | ) | |||||||
|
Comprehensive income |
$ | 4,291,893 | $ | 2,454,287 | $ | 1,796,590 | ||||||
|
Net income per share of common stock - Note 14: |
||||||||||||
|
Basic |
$ | 1.55 | $ | 1.34 | $ | 0.88 | ||||||
|
Diluted |
$ | 1.54 | $ | 1.33 | $ | 0.87 | ||||||
|
Dividends per common share (1) |
$ | 0.64 | $ | 1.61 | $ | 0.57 | ||||||
|
Weighted average shares outstanding: |
||||||||||||
|
Basic |
2,734,862 | 2,978,107 | 2,948,992 | |||||||||
|
Diluted |
2,758,119 | 3,006,082 | 2,993,333 | |||||||||
|
The accompanying notes are an integral part of these consolidated financial statements. |
|
(1) Dividends per share for fiscal year 2015 include a special dividend of $1.00 per share paid on January 7, 2015. |
|
Consolidated Balance Sheets |
||||||||
|
October 1, |
October 3, |
|||||||
|
2016 |
2015 |
|||||||
|
ASSETS |
||||||||
|
Current assets: |
||||||||
|
Cash and cash equivalents |
$ | 3,752,945 | $ | 1,224,026 | ||||
|
Accounts receivable, net of allowances of $140,000 (2016) and $148,000 (2015) |
8,079,500 | 7,813,773 | ||||||
|
Inventories - Note 3 |
7,437,442 | 8,746,039 | ||||||
|
Deferred income taxes - Note 13 |
459,159 | 351,452 | ||||||
|
Prepaid expenses |
879,108 | 411,528 | ||||||
|
Total current assets |
20,608,154 | 18,546,818 | ||||||
|
Property and equipment, net - Note 4 |
4,116,070 | 4,536,104 | ||||||
|
Goodwill - Note 5 |
3,937,676 | 3,930,282 | ||||||
|
Intangibles, net - Note 6 |
1,989,899 | 2,214,762 | ||||||
|
Other assets - Note 7 |
2,909,740 | 2,953,656 | ||||||
| $ | 33,561,539 | $ | 32,181,622 | |||||
|
LIABILITIES AND SHAREHOLDERS' EQUITY |
||||||||
|
Current liabilities: |
||||||||
|
Accounts payable |
$ | 2,410,376 | $ | 4,035,333 | ||||
|
Accrued and sundry liabilities - Note 8 |
3,583,457 | 3,120,111 | ||||||
|
Total current liabilities |
5,993,833 | 7,155,444 | ||||||
|
Deferred income taxes - Note 13 |
266,715 | 348,479 | ||||||
|
Deferred compensation - Note 11 |
289,394 | 375,939 | ||||||
|
Total long-term liabilities |
556,109 | 724,418 | ||||||
|
Total liabilities |
6,549,942 | 7,879,862 | ||||||
|
Commitments and contingencies - Notes 19 and 20 |
||||||||
|
Shareholders' equity - Note 12 |
||||||||
|
Common stock, no par value, 20,000,000 shares authorized; issued and outstanding shares 2,755,625 (2016) and 2,737,468 (2015) |
373,803 | - | ||||||
|
Additional paid-in capital |
6,025 | - | ||||||
|
Retained earnings |
29,133,746 | 26,848,299 | ||||||
|
Accumulated other comprehensive loss |
(2,501,977 | ) | (2,546,539 | ) | ||||
|
Total shareholders' equity |
27,011,597 | 24,301,760 | ||||||
| $ | 33,561,539 | $ | 32,181,622 | |||||
|
The accompanying notes are an integral part of these consolidated financial statements. |
|
Consolidated Statements of Cash Flows |
||||||||||||
| Years Ended | ||||||||||||
|
October 1, |
October 3, |
September 27, |
||||||||||
|
2016 |
2015 |
2014 |
||||||||||
|
OPERATING ACTIVITIES: |
||||||||||||
|
Net income |
$ | 4,247,331 | $ | 3,993,398 | $ | 2,590,767 | ||||||
|
Adjustments to reconcile net income to net cash provided by operating activities: |
||||||||||||
|
Depreciation |
854,940 | 865,003 | 864,356 | |||||||||
|
Amortization |
325,092 | 356,775 | 424,169 | |||||||||
|
Provision for losses on accounts receivable |
(9,007 | ) | 38,776 | 128,925 | ||||||||
|
Provision for deferred income taxes |
(182,934 | ) | 123,435 | 50,703 | ||||||||
|
Loss (Gain) on sale and disposal of property and equipment |
7,704 | (13,591 | ) | (73 | ) | |||||||
|
Loss on disposal of other assets |
3,863 | - | - | |||||||||
|
Increase in cash value of life insurance |
(154,273 | ) | (49,528 | ) | (174,943 | ) | ||||||
|
Deferred compensation |
(86,545 | ) | (81,517 | ) | (76,783 | ) | ||||||
|
Stock compensation expense |
- | 9,041 | 26,637 | |||||||||
|
Changes in operating assets and liabilities: |
||||||||||||
|
Accounts receivable |
(247,145 | ) | (2,255,207 | ) | 1,692,566 | |||||||
|
Inventories |
1,321,441 | (1,703,567 | ) | (1,106,616 | ) | |||||||
|
Prepaid expenses and other assets |
(97,928 | ) | 199,486 | 164,708 | ||||||||
|
Accounts payable and accrued and sundry liabilities |
(1,156,563 | ) | 2,779,176 | (927,407 | ) | |||||||
|
Net cash provided by operating activities |
4,825,976 | 4,261,680 | 3,657,009 | |||||||||
|
INVESTING ACTIVITIES: |
||||||||||||
|
Purchases of property and equipment |
(439,693 | ) | (654,865 | ) | (670,845 | ) | ||||||
|
Proceeds from sale of property and equipment |
- | 47,745 | 914 | |||||||||
|
Payments for other assets |
(99,074 | ) | (82,280 | ) | (80,593 | ) | ||||||
|
Net cash used for investing activities |
(538,767 | ) | (689,400 | ) | (750,524 | ) | ||||||
|
FINANCING ACTIVITIES: |
||||||||||||
|
Dividends paid |
(1,752,004 | ) | (4,780,572 | ) | (1,683,011 | ) | ||||||
|
Proceeds of long-term debt |
2,900,000 | - | - | |||||||||
|
Repayment of long-term debt |
(2,900,000 | ) | - | - | ||||||||
|
Purchase and retirement of common stock |
(209,880 | ) | (4,437,251 | ) | - | |||||||
|
Proceeds from exercise of options for common stock |
204,423 | 180,708 | 273,397 | |||||||||
|
Net cash used for financing activities |
(1,757,461 | ) | (9,037,115 | ) | (1,409,614 | ) | ||||||
|
Effect of exchange rates on cash |
(829 | ) | (177,070 | ) | (55,461 | ) | ||||||
|
Increase (Decrease) in cash and cash equivalents |
2,528,919 | (5,641,905 | ) | 1,441,410 | ||||||||
|
Cash and cash equivalents at beginning of year |
1,224,026 | 6,865,931 | 5,424,521 | |||||||||
|
Cash and cash equivalents at end of year |
$ | 3,752,945 | $ | 1,224,026 | $ | 6,865,931 | ||||||
|
The accompanying notes are an integral part of these consolidated financial statements. |
|
Consolidated Statements of Changes in Shareholders' Equity |
||||||||||||||||||||||||
|
Accumulated |
||||||||||||||||||||||||
|
Additional |
Other |
|||||||||||||||||||||||
|
Common Stock |
Paid-in |
Retained |
Comprehensive |
|||||||||||||||||||||
|
Shares |
Amount |
Capital |
Earnings |
Income/(Loss) |
Total |
|||||||||||||||||||
|
Balance at September 28, 2013 |
2,927,416 | $ | 2,626,526 | $ | 872,494 | $ | 26,828,012 | $ | (213,251 | ) | $ | 30,113,781 | ||||||||||||
|
Net income for the 2014 fiscal year |
2,590,767 | 2,590,767 | ||||||||||||||||||||||
|
Foreign currency translation loss |
(794,177 | ) | (794,177 | ) | ||||||||||||||||||||
|
Common stock issued to Directors |
8,500 | 164,735 | 164,735 | |||||||||||||||||||||
|
Common stock issued on exercise of stock options |
26,091 | 273,397 | 273,397 | |||||||||||||||||||||
|
Stock option compensation expense |
26,637 | 26,637 | ||||||||||||||||||||||
|
Tax benefits for stock options exercised |
7,703 | 7,703 | ||||||||||||||||||||||
|
Cash dividends paid or declared ($0.57 per share) |
(1,683,011 | ) | (1,683,011 | ) | ||||||||||||||||||||
|
Balance at September 27, 2014 |
2,962,007 | 3,064,658 | 906,834 | 27,735,768 | (1,007,428 | ) | 30,699,832 | |||||||||||||||||
|
Net income for the 2015 fiscal year |
3,993,398 | 3,993,398 | ||||||||||||||||||||||
|
Foreign currency translation loss |
(1,539,111 | ) | (1,539,111 | ) | ||||||||||||||||||||
|
Common stock issued to Directors |
9,500 | 175,715 | 175,715 | |||||||||||||||||||||
|
Common stock issued on exercise of stock options |
19,685 | 180,708 | 180,708 | |||||||||||||||||||||
|
Stock repurchases |
(253,724 | ) | (3,421,081 | ) | (915,875 | ) | (100,295 | ) | (4,437,251 | ) | ||||||||||||||
|
Stock option compensation expense |
9,041 | 9,041 | ||||||||||||||||||||||
|
Cash dividends paid or declared ($1.61 per share) (1) |
(4,780,572 | ) | (4,780,572 | ) | ||||||||||||||||||||
|
Balance at October 3, 2015 |
2,737,468 | - | - | 26,848,299 | (2,546,539 | ) | 24,301,760 | |||||||||||||||||
|
Net income for the 2016 fiscal year |
4,247,331 | 4,247,331 | ||||||||||||||||||||||
|
Foreign currency translation gain |
44,562 | 44,562 | ||||||||||||||||||||||
|
Common stock issued to Directors |
9,000 | 169,380 | 169,380 | |||||||||||||||||||||
|
Common stock issued on exercise of stock options |
21,157 | 204,423 | 204,423 | |||||||||||||||||||||
|
Stock repurchases |
(12,000 | ) | (209,880 | ) | (209,880 | ) | ||||||||||||||||||
|
Tax benefits for stock options exercised |
6,025 | 6,025 | ||||||||||||||||||||||
|
Cash dividends paid or declared ($0.64 per share) |
(1,752,004 | ) | (1,752,004 | ) | ||||||||||||||||||||
|
Balance at October 1, 2016 |
2,755,625 | $ | 373,803 | $ | 6,025 | $ | 29,133,746 | $ | (2,501,977 | ) | $ | 27,011,597 | ||||||||||||
|
The accompanying notes are an integral part of these consolidated financial statements. |
|
(1) Dividends per share for fiscal year 2015 include a special dividend of $1.00 per share paid on January 7, 2015. |
NOTES TO CONSOLIDATED FINANCIAL STATEMENTS
October 1, 2016
1. SIGNIFICANT ACCOUNTING POLICIES
Description of Business
Span-America Medical Systems, Inc. (the “Company,” “we,” or “Span-America”), located in Greenville, SC, manufactures and distributes therapeutic support surfaces, mattress overlays, patient positioners, seating cushions, skin care products and fall prevention products for the medical market and pillows, mattress pads and various foam products for the custom products market throughout the United States and Canada. Our wholly-owned subsidiary, Span Medical Products Canada Inc. (“Span-Canada”), located in Beamsville, Ontario, Canada, manufactures and sells medical bed frames and distributes related in-room furnishing products, including bedside furniture, chairs, tables and over-bed tables for use in the long-term care market. We are operating Span-Canada under the registered business name M.C. Healthcare Products (“M.C. Healthcare”).
Principles of Consolidation
The consolidated financial statements include the accounts of the Company and Span-Canada, its wholly-owned subsidiary. Significant inter-entity accounts and transactions have been eliminated.
Cash and Cash Equivalents
We consider all highly liquid investments with a maturity when purchased of three months or less to be cash equivalents. Depending on market conditions, we may maintain a centralized cash management program whereby our excess cash balances are invested in commercial paper and are considered cash equivalents. Cash balances in our accounts usually exceed federally insured limits.
Accounts Receivable
We provide credit in the normal course of business and perform ongoing credit evaluations on certain of our customers, but we generally do not require collateral to support these receivables. We also establish an allowance for doubtful accounts based upon factors surrounding the credit risk of specific customers, historical trends and other information. Account balances are charged against the allowance after all collection efforts have been exhausted and the potential for recovery is considered remote.
Inventories
Our inventories are valued at the lower of cost (first-in, first-out method) or market.
Property and Equipment
Property and equipment is stated at cost. Maintenance, repairs and minor replacements that do not improve or extend the useful lives of assets are expensed when incurred. Depreciation is computed using the straight-line method. Estimated useful lives for buildings and land improvements range from 5 to 35 years. The estimated useful lives of all other property and equipment range from 3 to 10 years. For income tax purposes, substantially all depreciation is computed using accelerated methods.
Goodwill and Intangibles
Intangible assets are amortized using the straight-line method. Costs of patents are amortized over 17 years, and trademarks are amortized over 10 years. Trade names, non-competition agreements and customer relationships associated with the asset acquisition of M.C. Healthcare are being amortized over periods of 2.0 to 11.8 years, which represent the estimated remaining useful lives of the identifiable intangible assets at the time of the acquisition. Goodwill, or costs in excess of the fair value of net assets, was acquired from three separate acquisitions. Annually as of the end of our fiscal year, we review goodwill for impairment. We also review long-lived assets and the related intangible assets for impairment whenever events or changes in circumstances indicate the carrying amount of such assets may not be recoverable. See Note 5 - Goodwill and Note 6 - Intangibles.
Foreign Currency Translation
Span-Canada uses the Canadian dollar as its functional currency. The assets and liabilities of Span-Canada are translated into U.S. dollars at the year-end exchange rate. Revenues and expenses are translated at weighted average exchange rates. The resulting translation adjustments are recorded as a separate component of shareholders' equity in “Accumulated Other Comprehensive Loss.”
Revenue Recognition
We recognize revenue when title and risk of loss pass to the customer and collection is reasonably assured. Our sales prices are fixed at the time revenue is recognized. There are no customer acceptance provisions, and the right to return exists only in cases of damaged product, non-compliance with customer specifications or warranty claims. Taxes collected from customers and remitted to government authorities are recorded on a net basis (excluded from revenues).
We have applied the accounting and disclosure requirements of Securities and Exchange Commission Staff Accounting Bulletin (“SAB”) No. 104.
Advertising Costs
Advertising costs are expensed as incurred.
Shipping and Handling Costs
Shipping and handling costs that are not reimbursed by customers are charged to selling and marketing expenses and were approximately $2,215,000 in fiscal 2016, $2,113,000 in fiscal 2015, and $2,123,000 in fiscal 2014.
Customer Rebates
We offer rebates to our distributors based on predetermined sales targets. These rebates vary by the type of product sold and by distributor and are based on a percentage of the applicable sales target. The rebate expense is charged as a reduction of gross sales. Rebate expense and the associated liability are calculated and recorded as the rebate-related revenue is recognized.
Earnings Per Share of Common Stock
Earnings per share of common stock are computed based on the weighted average number of shares outstanding during each period.
Stock-Based Compensation
We measure and recognize compensation expense for all stock-based payments at fair value. Stock-based payments include stock option grants. We grant options to purchase common stock to some of our employees under various plans at prices equal to the market value of the stock on the dates the options are granted. New shares of stock are issued upon share option exercise. We do not have treasury stock.
The fair value of each option grant is estimated on the date of grant using the Black-Scholes option pricing model with the following weighted average assumptions for grants made in fiscal 2011: risk-free interest rate of 2.54%; dividend yield of 2.50%; volatility factor of the expected market price of our common stock of 43.02%; and a weighted average expected life of the options of 9.0 years. We have not made any stock option grants since fiscal year 2011.
Fiscal Year
Our fiscal year ends on the Saturday nearest to September 30. Fiscal year 2016 was a 52-week year. Fiscal years 2015 and 2014 were 53-week and 52-week years, respectively. Fiscal year 2017 will be a 52-week year.
Income Taxes
The liability method is used in accounting for federal and state income taxes. Under this method, deferred tax assets and liabilities are determined based on differences between financial reporting and tax bases of assets and liabilities and are measured using the enacted tax rates and laws that are projected to be in effect when the differences are expected to reverse. The Company’s practice is to recognize interest and penalties, if any, related to income tax matters as part of income tax expense.
Use of Estimates
The preparation of financial statements in conformity with accounting principles generally accepted in the United States of America requires us to make estimates and assumptions that affect the amounts reported in the consolidated financial statements and accompanying notes and the disclosure of contingent assets and liabilities. Although these estimates are based on our knowledge of current events and actions planned for the future, the estimates may ultimately differ from actual results.
Recently Issued Accounting Standards
In May 2014, the Financial Accounting Standards Board (“FASB”) issued a standard on revenue recognition that supersedes previously issued revenue recognition guidance. This standard provides a five-step approach to be applied to all contracts with customers and requires expanded disclosures about the nature, amount, timing and uncertainty of revenue (and the related cash flows) arising from customer contracts, significant judgments and changes in judgments used in applying the revenue model and the assets recognized from costs incurred to obtain or fulfill a contract. In August 2015, the FASB issued a standard to delay the effective date by one year. In accordance with this delay, the new standard is effective for us beginning in the first quarter of fiscal 2019. Early adoption is permitted, but not before the original effective date of the standard. The new standard is required to be applied retrospectively to each prior reporting period presented or retrospectively with the cumulative effect of initially applying it recognized at the date of initial application. We are currently assessing the impact this standard will have on our consolidated financial statements as well as the method by which we will adopt the new standard.
In July 2015, the FASB issued a new standard regarding the measurement of inventory. Under this standard, inventory that is measured using the first-in, first-out ("FIFO") or average cost methods is required to be measured at the lower of cost or net realizable value. Net realizable value is the estimated selling price in the ordinary course of business, less reasonably predictable costs of completion, disposal and transportation. This standard does not impact inventory measured on a last-in, last-out ("LIFO") method. It will be effective for us beginning in fiscal 2017. We are currently assessing the impact this standard will have on our consolidated financial statements.
In November 2015, the FASB issued Accounting Standards Update ("ASU") 2015-07, "Balance Sheet Classification of Deferred Taxes (Topic 740)." Current guidance requires an entity to separate deferred income tax liabilities and assets into current and noncurrent amounts in a classified statement of financial position; however, the new guidance requires that deferred tax liabilities and assets be classified as noncurrent in a classified statement of financial position. This guidance is effective for annual reporting periods beginning after December 15, 2016, including interim periods within that reporting period. Early adoption is permitted. We are currently assessing the potential impact of this new accounting pronouncement on the Company's statement of financial position.
In January 2016, the FASB issued ASU 2016-01, “Financial Instruments — Overall (Subtopic 825-10): Recognition and Measurement of Financial Assets and Financial Liabilities.” This standard modifies how entities measure equity investments and present changes in the fair value of financial liabilities; simplifies the impairment assessment of equity investments without readily determinable fair values by requiring a qualitative assessment to identify impairment; changes presentation and disclosure requirements, and clarifies that an entity should evaluate the need for a valuation allowance on a deferred tax asset related to available-for-sale securities in combination with the entity’s other deferred tax assets. ASU 2016-01 is effective for fiscal years beginning after December 15, 2017, including interim periods within those fiscal years. Early application is permitted. We do not expect that the adoption of this ASU will have any impact on the Company’s statement of operations.
In February 2016, the FASB issued ASU 2016-02, Leases (Topic 842). ASU 2016-02 requires the lessee to recognize assets and liabilities for leases with lease terms of more than twelve months. For leases with a term of twelve months or less, the Company is permitted to make an accounting policy election by class of underlying asset not to recognize lease assets and lease liabilities. Further, the standard also requires a finance lease to recognize both an interest expense and an amortization of the associated expense. Operating leases generally recognize the associated expense on a straight line basis. ASU 2016-02 requires the Company to adopt the standard using a modified retrospective approach and adoption for reporting periods beginning after December 15, 2018. We are currently evaluating the impact that ASU 2016-02 will have on the Company’s financial position, results of operations and cash flows.
In March 2016, the FASB issued ASU 2016-09 that changes the accounting for certain aspects of share-based payments to employees. The new guidance requires all income tax effects of awards to be recognized in the income statement when the awards vest or are settled. It also allows an employer to repurchase more of an employee’s shares than it can today for tax withholding purposes without triggering liability accounting and to make a policy election for forfeitures as they occur. The guidance is effective for public business entities for fiscal years beginning after December 15, 2016, and interim periods within those years. Early adoption is permitted. We are currently evaluating the impact ASU 2016-09 will have on our consolidated financial statements and related disclosures.
In June 2016, the FASB issued ASU 2016-13, “Financial Instruments — Credit Losses (Topic 326): Measurement of Credit Losses on Financial Instruments,” which provides guidance for the accounting for credit losses on instruments within its scope. The amendments provide guidance on reporting credit losses for assets held at amortized cost basis and available-for-sale debt securities. The amendments require a financial asset measured at amortized cost basis to be presented at the net amount expected to be collected. The amendments also require that credit losses on available-for-sale debt securities be presented as an allowance. The amendments should be applied on either a prospective transition or modified-retrospective approach depending on the subtopic. The amendments in this update are effective for fiscal years beginning after December 15, 2019, including interim periods within those annual periods. We are currently evaluating the impact of the adoption of this standard on our consolidated financial statements.
In August 2016, the FASB issued ASU 2016-15, “Statement of Cash Flows (Topic 230): Classification of Certain Cash Receipts and Cash Payments (a consensus of the Emerging Issues Task Force),” which is intended to reduce diversity in practice in how certain transactions are classified in the statement of cash flows. The amendments in this update are effective for public entities for fiscal years, and interim periods within those fiscal years, beginning after December 15, 2017. Early adoption is permitted, including adoption in an interim period. We are currently assessing the impact of the future adoption of this standard on our consolidated Statements of Cash Flows.
Other accounting standards that have been issued or proposed by the FASB or other standards-setting bodies that do not require adoption until a future date are not expected to have a material impact on our financial statements upon adoption.
Subsequent Events
In preparing these consolidated financial statements, we have evaluated events and transactions for potential recognition or disclosure through the issuance of the financial statements.
2. FAIR VALUE OF FINANCIAL INSTRUMENTS
The Company accounts for the fair value measurements for financial assets and liabilities measured on a recurring basis as required by the Fair Value Measurements and Disclosures topic of the Financial Accounting Standards Board Accounting Standards Codification (“ASC”). This guidance establishes a framework for measuring fair value and expands disclosure about fair value measurements. That framework provides a fair value hierarchy that prioritizes the inputs to valuation techniques used to measure fair value. The hierarchy gives the highest priority to unadjusted quoted prices in active markets for identical assets or liabilities (Level 1 measurements) and the lowest priority to unobservable inputs (Level 3 measurements).
Following is a brief description of these three levels:
Level 1 – Unadjusted quoted prices in active markets that are accessible at the measurement date for identical, unrestricted assets or liabilities;
Level 2 – Quoted prices in markets that are not active, or inputs which are observable, either directly or indirectly, for substantially the full term of the asset or liability;
Level 3 – Prices or valuation techniques that require inputs that are both significant to the fair value measurement and unobservable (i.e., supported by little or no market activity).
The asset’s or liability’s fair value measurement level within the fair value hierarchy is based on the lowest level (with “3” being the lowest) of any input that is significant to the fair value measurement. Valuation techniques used need to maximize the use of observable inputs and minimize the use of unobservable inputs.
Following is a description of the valuation methodologies used for assets measured at fair value.
Cash value of life insurance policy: Valued at the cash surrender value of the life insurance policy as of the last business day of the fiscal year, as determined by the issuer of the insurance policy, which approximates fair value.
The method described above may produce a fair value calculation that may not be indicative of net realizable value or reflective of future fair values. Furthermore, although we believe our valuation method is appropriate and consistent with methods used by other market participants, the use of different methodologies or assumptions to determine fair value of certain financial instruments could result in a different fair value measurement at the reporting date.
The following table summarizes information on the fair value measurement of the Company’s assets as of October 1, 2016 and October 3, 2015, grouped by the categories described above:
|
Total |
Quoted prices in active markets (Level 1) |
Significant other observable inputs (Level 2) |
Significant unobservable inputs (Level 3) |
||||||||||||||
|
Cash value of life insurance policies |
2016 |
$ | 2,697,465 | - | $ | 2,697,465 | - | ||||||||||
|
2015 |
$ | 2,543,192 | - | $ | 2,543,192 | - | |||||||||||
3. INVENTORIES
|
2016 |
2015 |
|||||||
|
Raw materials |
$ | 5,476,393 | $ | 5,455,942 | ||||
|
Work in process |
678,753 | 338,296 | ||||||
|
Finished goods |
1,807,296 | 3,521,801 | ||||||
|
Reserve for obsolescence |
(525,000 | ) | (570,000 | ) | ||||
| $ | 7,437,442 | $ | 8,746,039 | |||||
4. PROPERTY AND EQUIPMENT
|
2016 |
2015 |
|||||||
|
Land |
$ | 469,718 | $ | 469,718 | ||||
|
Land improvements |
486,698 | 486,698 | ||||||
|
Buildings |
7,003,652 | 6,941,084 | ||||||
|
Machinery and equipment |
9,563,061 | 9,241,581 | ||||||
|
Furniture and fixtures |
506,277 | 487,856 | ||||||
|
Construction in process |
36,637 | 85,329 | ||||||
|
Automobiles |
23,853 | 9,520 | ||||||
| 18,089,896 | 17,721,786 | |||||||
|
Less accumulated depreciation |
13,973,826 | 13,185,682 | ||||||
| $ | 4,116,070 | $ | 4,536,104 | |||||
5. GOODWILL
As of October 1, 2016 and October 3, 2015, we had goodwill of $3,937,676 and $3,930,282, respectively. These amounts include goodwill from three reporting units, all of which are part of our medical segment.
On December 9, 2011, we acquired, through Span Medical Products Canada Inc., our wholly-owned subsidiary, substantially all of the assets of M.C. Healthcare Products Inc. (“old M.C. Healthcare”). The carrying value of goodwill was increased by $7,394 for fiscal 2016 and reduced by $361,561 and $195,703 for fiscal 2015 and 2014, respectively, as a result of changes in the foreign currency exchange rate. Under Canadian tax law, a portion of goodwill acquired in connection with an asset acquisition may be amortized for tax purposes. We expect 75%, or approximately $2,000,000, of the goodwill associated with Span-Canada to be amortizable and deductible for tax purposes.
For the fiscal year ended October 1, 2016, we tested each of our three reporting units for goodwill impairment in accordance with ASC 350-20-35 Intangibles – Goodwill and Other. We determined that the fair value of each of our reporting units was greater than its respective carrying value, and therefore no impairment charges were recognized in fiscal 2016.
We calculate the estimated fair value of our reporting units by using an income approach, which includes internally developed discounted cash flow models. To determine fair value, we make assumptions about a number of internal and external factors. Significant assumptions used in the impairment analysis include financial projections of sales, expenses, profit margins, working capital requirements, capital expenditures, tax rates and discount rates. These assumptions are based on our historical operating results for each of our reporting units, our detailed operating plan for fiscal year 2017 and our financial forecasts for fiscal years 2018 through 2021. There is significant uncertainty about the various assumptions made in the analysis. Our estimates of cash flows may differ from actual cash flows due to, among other things, changes in our estimated sales and expense growth rates, other changes in our financial forecasting models, economic conditions in the U.S. and Canadian medical markets, Medicare reimbursement changes, government budget changes in the Canadian healthcare market and other risks referenced from time to time in our Securities and Exchange Commission filings. See Part 1, Item 1A. “Risk Factors” earlier in this report for more information on factors that could affect our assumptions used in the impairment analysis. These factors increase the risk of differences between projected and actual performance that could impact future estimates of the fair values of all reporting units. Significant differences between these estimates and actual cash flows could result in impairment charges in future periods.
6. INTANGIBLES
|
2016 |
2015 |
|||||||
|
Patents and trademarks |
$ | 2,268,402 | $ | 2,203,673 | ||||
|
Trade names |
343,678 | 342,416 | ||||||
|
Non-competition agreements |
150,601 | 150,048 | ||||||
|
Customer relationships |
2,526,230 | 2,516,952 | ||||||
| 5,288,911 | 5,213,089 | |||||||
|
Less accumulated amortization |
(3,299,012 | ) | (2,998,327 | ) | ||||
|
Net intangibles |
$ | 1,989,899 | $ | 2,214,762 | ||||
On December 9, 2011, we acquired, through a new wholly-owned subsidiary, substantially all of the assets of old M.C. Healthcare and acquired intangibles of approximately $3,980,000. At October 1, 2016 and October 3, 2015 we had intangibles associated with the asset acquisition of M.C. Healthcare of trade names, non-competition agreements and customer relationships (net of accumulated amortization of $1,367,399 and $1,115,246, respectively) of $1,653,110 and $1,894,170, respectively. Changes in the balances shown for trade names, non-competition agreements and customer relationships result solely from foreign currency fluctuations.
In addition, we had patents and trademarks (net of accumulated amortization) of $336,789 as of October 1, 2016 and $320,592 as of October 3, 2015. We reviewed the useful lives of individual patents and trademarks and determined that the useful lives did not require any material changes. The intangibles and the patents and trademarks are primarily associated with the medical segment.
Amortization expense for intangibles, patents and trademarks during fiscal years 2016, 2015 and 2014 was $295,092, $326,775 and $394,169, respectively. Estimated amortization expense for the next five fiscal years based on existing intangibles is as follows:
|
Estimated |
||||
|
Amortization |
||||
|
Fiscal Years |
Expense |
|||
|
2017 |
$ | 285,000 | ||
|
2018 |
278,000 | |||
|
2019 |
276,000 | |||
|
2020 |
276,000 | |||
|
2021 |
273,000 | |||
7. OTHER ASSETS
|
2016 |
2015 |
|||||||
|
Cash value of life insurance policies - Note 2 |
$ | 2,697,465 | $ | 2,543,192 | ||||
|
Other |
212,275 | 410,464 | ||||||
| $ | 2,909,740 | $ | 2,953,656 | |||||
8. ACCRUED AND SUNDRY LIABILITIES
|
2016 |
2015 |
|||||||
|
Salaries and other compensation |
$ | 1,805,557 | $ | 1,448,935 | ||||
|
Federal and state income taxes and sales taxes |
301,045 | 567,295 | ||||||
|
Payroll taxes accrued and withheld |
129,562 | 98,184 | ||||||
|
Property taxes |
176,139 | 172,337 | ||||||
|
Medical insurance |
249,245 | 273,403 | ||||||
|
Warranty reserve - Note 9 |
306,488 | 291,980 | ||||||
|
Customer rebates |
601,876 | 247,137 | ||||||
|
Other |
13,545 | 20,840 | ||||||
| $ | 3,583,457 | $ | 3,120,111 | |||||
9. PRODUCT WARRANTIES
We offer warranties of various lengths to our customers, depending on the specific product sold. The warranties require us to repair or replace non-performing products during the warranty period at no cost to the customer. At the time revenue is recognized for products covered by warranties, we record a liability for estimated costs that may be incurred under our warranties. The costs are estimated based on historical experience, any specific warranty problems that have been identified and recovery of secondary warranty cost from component suppliers. The amounts shown below are presented net of any expected cost recovery from suppliers. Although historical warranty costs have been within our expectations, there can be no assurance that future warranty costs will not exceed historical amounts. We regularly evaluate the adequacy of the warranty liability and adjust the balance as necessary.
Changes in our product warranty liability for the years ended October 1, 2016 and October 3, 2015 are as follows:
|
2016 |
2015 |
|||||||
|
Accrued liability at beginning of year |
$ | 291,980 | $ | 257,860 | ||||
|
Increase in reserve |
208,615 | 256,754 | ||||||
|
Expenses |
(194,107 | ) | (222,634 | ) | ||||
|
Accrued liability at end of year |
$ | 306,488 | $ | 291,980 | ||||
10. REVOLVING CREDIT FACILITY
In May 2015, we renewed our revolving credit facility from a bank. As part of the renewal, we extended the line for three years until April 30, 2018. At our request, the maximum principal amount we can borrow at any one time was reduced to $5.0 million. There is no longer an unused commitment fee charged for the credit facility. The previously included covenant that restricted dividend payments to 50% of net income was eliminated.
The credit agreement is unsecured and accrues interest at a variable rate equal to 30-day LIBOR plus a margin ranging from 85 to 165 basis points, depending on our leverage ratio (as defined in the credit agreement). The interest rate, including the margin of 85 basis points, was 1.2795% in January 2016, which was the last time we had an outstanding balance due on the line of credit. Interest-only payments are required monthly. We have pledged to grant the bank a security interest in our accounts, instruments, and chattel paper upon its request in the event of a default as defined in the credit agreement. Our obligations under the credit agreement are guaranteed by Span-Canada.
The credit facility includes financial covenants relating to tangible net worth and leverage ratios, and restricts mergers and acquisitions, assets sales, indebtedness, liens and capital expenditures without prior written consent of or waiver by the lending bank. Also, our subsidiary is not restricted in its ability to pay dividends or make distributions to us. Violation of loan covenants could result in the acceleration of the term of the credit agreement. The lending bank waived any event of default in connection with (1) our regular quarterly dividend payments of $1.8 million during fiscal year 2015, which represented 46% of our net income for the fiscal year and (2) the special dividend of $1.00 per share declared in November 2014 and paid on January 7, 2015. The bank also granted a consent dated September 29, 2015 to our repurchase of an aggregate of 261,310 shares of Company common stock at a price of $17.49 per share from Robert Johnston, a former director of the Company, and his affiliate, The Jerry Zucker Revocable Trust.
We paid approximately $5,000, $6,000 and $13,000 of interest expense in 2016, 2015 and 2014, respectively. No amounts were outstanding under the credit facility at October 1, 2016.
11. DEFERRED COMPENSATION
We are obligated to make fixed payments of approximately $114,000 per year to our founder and former chief executive officer and his ex-wife pursuant to a retirement agreement. The payments will be made for the longer of the executive’s remaining life or his ex-wife’s remaining life, if she survives him. We have fully accrued the present value of the expected payments due over the combined life expectancy of the executive and his ex-wife. We recognized expenses of approximately $27,000 in 2016, $32,000 in 2015 and $37,000 in 2014, related to this agreement.
12. EQUITY COMPENSATION
In January 2007, the Board adopted the 2007 Equity Incentive Plan (“2007 Plan”), which was approved by our shareholders in February 2007. The 2007 Plan authorizes the Board to grant stock-based compensation awards to our officers, directors and key employees for up to 250,000 shares of Company common stock. Awards may be in the form of restricted stock, non-restricted stock, restricted stock units, options or stock appreciation rights (SARs). Total awards under the 2007 Plan may not exceed 250,000 shares, of which no more than 75,000 shares may be in the form of restricted stock, non-restricted stock or restricted stock units. The per share exercise prices of options or SARs granted under the 2007 Plan must be no less than the fair market value of a share on the grant date. The terms and conditions of each award may be set by the Board or a committee of the Board. The 2007 Plan will expire on December 31, 2016 unless terminated earlier in accordance with the 2007 Plan.
In March 1997, the Board adopted the 1997 Stock Option Plan (“1997 Plan”). The 1997 Plan authorized the Board to grant options to our key officers and employees for up to 200,000 shares of our common stock. Options granted under the 1997 Plan were generally granted at the fair market value on the date of grant. These options become exercisable and vest at the greater of 1,000 shares per year or 20% of the grant. Options expire 10 years from the date of grant for continuing employees, or three months after termination of employment for employees who leave the Company. The 1997 Plan expired by its terms on October 20, 2007. The expiration of the 1997 Plan does not affect options outstanding under the 1997 Plan, but no further options can be granted under the 1997 Plan.
Shown below is a summary of activity under the Company’s two stock option plans.
|
Outstanding |
Exercisable |
|||||||||||||||||||
|
Weighted |
Weighted |
|||||||||||||||||||
|
Average |
Average |
|||||||||||||||||||
|
Shares |
Number of |
Ex. Price |
Number of |
Ex. Price |
||||||||||||||||
|
Available |
Shares |
Per Share |
Shares |
Per Share |
||||||||||||||||
|
Balance at 9/28/13 |
190,500 | 119,405 | $ | 11.30 | 107,605 | $ | 10.90 | |||||||||||||
|
Fiscal Year 2014 |
||||||||||||||||||||
|
Granted |
||||||||||||||||||||
|
Exercised |
(26,091 | ) | ||||||||||||||||||
|
Forfeited |
||||||||||||||||||||
|
Expired Unexercised |
(322 | ) | ||||||||||||||||||
|
Balance at 9/27/14 |
190,500 | 92,992 | 11.53 | 89,592 | 11.40 | |||||||||||||||
|
Fiscal Year 2015 |
||||||||||||||||||||
|
Granted |
||||||||||||||||||||
|
Exercised |
(19,685 | ) | ||||||||||||||||||
|
Forfeited |
||||||||||||||||||||
|
Balance at 10/3/15 |
190,500 | 73,307 | 12.16 | 73,307 | 12.16 | |||||||||||||||
|
Fiscal Year 2016 |
||||||||||||||||||||
|
Granted |
||||||||||||||||||||
|
Exercised |
(21,157 | ) | ||||||||||||||||||
|
Forfeited |
||||||||||||||||||||
|
Balance at 10/1/16 |
190,500 | 52,150 | $ | 13.18 | 52,150 | $ | 13.18 | |||||||||||||
Shown below is a summary of stock options outstanding and exercisable at fiscal year-end 2016.
|
Outstanding |
Exercisable |
||||||||||||||||||||||
|
Weighted |
|||||||||||||||||||||||
|
Weighted |
Average |
Weighted |
|||||||||||||||||||||
|
Average |
Remaining |
Average |
|||||||||||||||||||||
|
Ranges of Exercise |
Number of |
Ex. Price |
Contract |
Number of |
Ex. Price |
||||||||||||||||||
|
Prices |
Shares |
Per Share |
Life (yrs) |
Shares |
Per Share |
||||||||||||||||||
| $9.34 | - | $ 9.34 | 16,150 | $ | 9.34 | 2.4 | 16,150 | $ | 9.34 | ||||||||||||||
| 14.90 | - | 14.90 | 36,000 | 14.90 | 4.1 | 36,000 | 14.90 | ||||||||||||||||
| $9.34 | - | $14.90 | 52,150 | $ | 13.18 | 3.6 | 52,150 | $ | 13.18 | ||||||||||||||
13. INCOME TAXES
Deferred income taxes reflect the net tax effects of temporary differences between the carrying amounts of assets and liabilities for financial reporting purposes and the amounts used for income tax purposes. Significant components of our deferred tax liabilities and assets as of October 1, 2016 and October 3, 2015 are as follows:
|
2016 |
2015 |
|||||||
|
Deferred tax liabilities: |
||||||||
|
Depreciation |
$ | (280,000 | ) | $ | (383,000 | ) | ||
|
Amortization |
(88,000 | ) | (99,000 | ) | ||||
|
Total deferred tax liabilities |
(368,000 | ) | (482,000 | ) | ||||
|
Deferred tax assets: |
||||||||
|
Deferred compensation |
101,000 | 131,000 | ||||||
|
Accrued expenses |
364,000 | 302,000 | ||||||
|
Inventory |
74,000 | 62,000 | ||||||
|
Other |
21,000 | (10,000 | ) | |||||
|
Total deferred tax assets |
560,000 | 485,000 | ||||||
|
Net deferred tax assets |
$ | 192,000 | $ | 3,000 | ||||
We made cash income tax payments, net of refunds, of approximately $2,267,000, $524,000 and $1,904,000 in fiscal years 2016, 2015 and 2014, respectively.
Federal, state and foreign income tax provisions consist of the following:
|
2016 |
2015 |
2014 |
||||||||||
|
Current: |
||||||||||||
|
Federal |
$ | 1,706,000 | $ | 1,166,000 | $ | 1,125,000 | ||||||
|
State |
99,000 | 34,000 | 20,000 | |||||||||
|
Foreign |
210,000 | 349,000 | (150,000 | ) | ||||||||
| 2,015,000 | 1,549,000 | 995,000 | ||||||||||
|
Deferred: |
||||||||||||
|
Federal |
(132,000 | ) | 102,000 | (11,000 | ) | |||||||
|
State |
(6,000 | ) | 8,000 | 1,000 | ||||||||
|
Foreign |
(50,000 | ) | 13,000 | 53,000 | ||||||||
| (188,000 | ) | 123,000 | 43,000 | |||||||||
|
Income tax expense |
$ | 1,827,000 | $ | 1,672,000 | $ | 1,038,000 | ||||||
Income tax expense differs from the amounts computed by applying the statutory U.S. federal tax rate to income before income taxes as follows:
|
2016 |
2015 |
2014 |
||||||||||
|
Computed tax at the U.S. statutory rate |
$ | 2,065,000 | $ | 1,926,000 | $ | 1,234,000 | ||||||
|
Increases (decreases): |
||||||||||||
|
State income taxes, net of federal tax benefit |
61,000 | 27,000 | 13,000 | |||||||||
|
Differences between U.S. and foreign tax rates |
(98,000 | ) | (191,000 | ) | (27,000 | ) | ||||||
|
Officer's life insurance |
(50,000 | ) | (15,000 | ) | (57,000 | ) | ||||||
|
Domestic production deduction |
(168,000 | ) | (115,000 | ) | (116,000 | ) | ||||||
|
Other, net |
17,000 | 40,000 | (9,000 | ) | ||||||||
|
Income tax expense |
$ | 1,827,000 | $ | 1,672,000 | $ | 1,038,000 | ||||||
We have adopted the provisions under ASC Topic 740, “Income Taxes” (“ASC 740”) which require that a position taken or expected to be taken in a tax return be recognized in the consolidated financial statements when it is more likely than not (i.e., a likelihood of more than fifty percent) that the position would be sustained upon examination by tax authorities. A recognized tax position is then measured at the largest amount of benefit that is greater than fifty percent likely of being realized upon settlement. We recognize accrued interest and penalties related to uncertain tax positions as a component of income tax expense in our consolidated financial statements. We are not aware of any uncertain tax positions as of October 1, 2016 and October 3, 2015. In the normal course of business, we are subject to examination by taxing authorities. We do not expect to be subject to U.S. federal, state or local income tax examinations by tax authorities in filing jurisdictions for the years before tax year 2012 and Canadian tax examinations before the tax year 2012.
Span-America files income tax returns in the U.S. and various state and local jurisdictions. Span-Canada files separate income tax returns in Canada on an annual basis. The resulting foreign income taxes and any applicable U.S. or foreign tax implications of intercompany transactions will be accounted for within the consolidated financial reporting of income taxes, per the requirements of ASC Topic 740.
A provision has not been made for U.S. or additional foreign taxes on $2,718,000 of undistributed earnings of our foreign subsidiary. Those earnings have been and will continue to be reinvested. These earnings could become subject to additional tax if they were remitted as dividends, if foreign earnings were loaned to Span-America or a U.S. affiliate, or if we sold our stock in the Span-Canada subsidiary. It is not practicable to estimate the amount of additional tax that might be payable on the foreign earnings.
14. EARNINGS PER SHARE OF COMMON STOCK
The following table sets forth the computation of basic and diluted earnings per share of common stock.
|
2016 |
2015 |
2014 |
||||||||||
|
Numerator for basic and diluted earnings per share: |
||||||||||||
|
Net income |
$ | 4,247,331 | $ | 3,993,398 | $ | 2,590,767 | ||||||
|
Denominator: |
||||||||||||
|
Denominator for basic earnings per share: |
||||||||||||
|
Weighted average shares |
2,734,862 | 2,978,107 | 2,948,992 | |||||||||
|
Effect of dilutive securities: |
||||||||||||
|
Employee stock options |
23,257 | 27,975 | 44,341 | |||||||||
|
Denominator for diluted earnings per share: |
||||||||||||
|
Adjusted weighted average shares and assumed conversions |
2,758,119 | 3,006,082 | 2,993,333 | |||||||||
|
Net income per share: |
||||||||||||
|
Basic |
$ | 1.55 | $ | 1.34 | $ | 0.88 | ||||||
|
Diluted |
$ | 1.54 | $ | 1.33 | $ | 0.87 | ||||||
15. EMPLOYEE BENEFITS AND INCENTIVE PLANS
We have a 401(k) plan available to employees meeting eligibility requirements. We match a percentage of employee contributions, with certain limitations. Our 401(k) matching contributions amounted to approximately $205,000, $188,000 and $184,000, for the 2016, 2015 and 2014 fiscal years, respectively.
16. RELATED-PARTY TRANSACTIONS
The company repurchased 249,310 shares of its common stock for approximately $4.36 million on October 1, 2015 from The Jerry Zucker Revocable Trust, an affiliate of former director Robert B. Johnston. On October 9, 2015, in fiscal year 2016, we repurchased 12,000 shares of our common stock for approximately $210,000 from former director Robert B. Johnston. The total repurchase of 261,310 shares represented approximately 9% of the outstanding shares prior to the transaction. Our lending bank granted a consent dated September 29, 2015 to these repurchases.
17. MAJOR CUSTOMERS
The largest of our medical customers are distributors who sell our products to acute care hospitals and long-term care facilities throughout the United States and Canada. Sales to one customer were 17% of total net sales in fiscal 2016 and 2014 and 18% of total net sales in fiscal 2015.
We have a business relationship with other customers to distribute certain of our consumer products, which are part of our custom products segment. Sales to a former customer amounted to 6% of total net sales in 2016 and 10% of total net sales in fiscal 2015. Sales to another consumer customer amounted to 18%, 7% and 16% of total net sales in fiscal 2016, 2015 and 2014, respectively.
See Note 18 for further information about sales to major customers.
18. OPERATIONS AND INDUSTRY SEGMENTS AND GEOGRAPHIC AREAS
For management and reporting purposes, we divide our business into two segments: medical and custom products. This industry segment information corresponds to the markets in the United States, Canada and other countries for which we manufacture and distribute our various products. The following table summarizes certain information on industry segments:
|
2016 |
2015 |
2014 |
||||||||||
|
Net sales: |
||||||||||||
|
Medical |
$ | 46,345,525 | $ | 47,810,988 | $ | 42,334,896 | ||||||
|
Custom products |
21,281,645 | 16,504,008 | 13,522,479 | |||||||||
| $ | 67,627,170 | $ | 64,314,996 | $ | 55,857,375 | |||||||
|
Operating profit: |
||||||||||||
|
Medical |
$ | 6,040,202 | $ | 6,342,253 | $ | 3,966,605 | ||||||
|
Custom products |
801,548 | (234,948 | ) | 257,997 | ||||||||
| 6,841,750 | 6,107,305 | 4,224,602 | ||||||||||
|
Corporate expense |
(759,486 | ) | (849,853 | ) | (614,022 | ) | ||||||
|
Other income (expense) |
(7,933 | ) | 407,946 | 18,187 | ||||||||
|
Income before income taxes |
$ | 6,074,331 | $ | 5,665,398 | $ | 3,628,767 | ||||||
|
Identifiable assets: |
||||||||||||
|
Medical |
$ | 22,299,011 | $ | 20,886,470 | $ | 22,221,526 | ||||||
|
Custom products |
4,344,914 | 7,172,290 | 3,991,467 | |||||||||
|
Corporate |
6,917,614 | 4,122,862 | 9,633,841 | |||||||||
| $ | 33,561,539 | $ | 32,181,622 | $ | 35,846,834 | |||||||
|
Depreciation and amortization expenses: |
||||||||||||
|
Operating: |
||||||||||||
|
Medical |
$ | 909,972 | $ | 977,922 | $ | 1,069,882 | ||||||
|
Custom products |
269,405 | 243,342 | 218,234 | |||||||||
|
Corporate |
655 | 514 | 409 | |||||||||
| $ | 1,180,032 | $ | 1,221,778 | $ | 1,288,525 | |||||||
|
Capital expenditures: |
||||||||||||
|
Medical |
$ | 322,310 | $ | 428,206 | $ | 595,002 | ||||||
|
Custom products |
117,383 | 226,659 | 75,843 | |||||||||
| $ | 439,693 | $ | 654,865 | $ | 670,845 | |||||||
|
Geographic Areas: |
2016 | 2015 | 2014 | |||||||||
|
Net sales: |
||||||||||||
|
United States |
$ | 60,850,466 | $ | 56,470,245 | $ | 49,804,659 | ||||||
|
Canada |
5,798,244 | 7,704,410 | 5,922,543 | |||||||||
|
Other |
978,460 | 140,341 | 130,173 | |||||||||
| $ | 67,627,170 | $ | 64,314,996 | $ | 55,857,375 | |||||||
|
Property and equipment, net: |
||||||||||||
|
United States |
$ | 3,541,623 | $ | 3,927,018 | $ | 4,181,361 | ||||||
|
Canada |
574,447 | 609,086 | 706,735 | |||||||||
| $ | 4,116,070 | $ | 4,536,104 | $ | 4,888,096 | |||||||
|
Goodwill: |
||||||||||||
|
United States |
$ | 1,924,131 | $ | 1,924,131 | $ | 1,924,131 | ||||||
|
Canada |
2,013,545 | 2,006,151 | 2,367,712 | |||||||||
| $ | 3,937,676 | $ | 3,930,282 | $ | 4,291,843 | |||||||
|
Intangibles, net: |
||||||||||||
|
United States |
$ | 308,710 | $ | 309,164 | $ | 303,456 | ||||||
|
Canada |
1,681,189 | 1,905,598 | 2,556,804 | |||||||||
| $ | 1,989,899 | $ | 2,214,762 | $ | 2,860,260 | |||||||
Total sales by industry segment include sales to unaffiliated customers as reported in our statements of income. In calculating operating profit, non-allocable general corporate expenses, interest expense, other income and income taxes are not included, but certain corporate operating expenses incurred for the benefit of all segments are included on an allocated basis.
Identifiable assets are those assets that are used in the operations of each segment on an allocated basis. Amounts shown for corporate assets consist primarily of cash and cash surrender value of life insurance.
Included in the consolidated balance sheet at October 1, 2016 and October 3, 2015, are the net assets of Span-Canada’s operations located in a single facility in Canada, which totaled approximately $11,000,000 and $10,000,000, respectively. See Item 1A. “Risk Factors” above for more information on risks involved in our international operations.
We have several customers whose sales represent significant portions of sales in their respective business segments. Sales to one of our medical customers were 24% of net medical sales in fiscal 2016 and fiscal 2015 and 22% of net medical sales in fiscal 2014. Sales to another medical customer accounted for 11% of net medical sales in fiscal years 2016, 2015 and 2014. In the custom products segment, sales to one customer accounted for 57% of net custom products sales in fiscal 2016, 29% in fiscal 2015 and 66% in fiscal 2014. Sales to a former custom products customer were 19% of net custom products sales in fiscal 2016 and 40% of net custom products sales in fiscal 2015.
The manufacturing employees of our Span-Canada subsidiary, representing 18% of our workforce, are subject to a Collective Agreement with a union that expires October 31, 2018.
19. OPERATING LEASES
We lease truck equipment in South Carolina. In addition, we lease a 15,000 square foot distribution facility in Utah for $7,500 a month. The Utah facility lease is cancellable by either party with 60 days’ notice. Both leases require us to pay certain insurance and maintenance costs.
Rental expense for all operating leases was $404,000 in fiscal 2016, $373,000 in fiscal 2015, and $375,000 in fiscal 2014.
We have a five-year commitment to lease old M.C. Healthcare’s 50,000 square foot manufacturing and showroom facility in Beamsville, Ontario at CAD $278,000 for the first two years and then increasing ratably to CAD $295,000 for the final year ending in December 2021.
20. COMMITMENTS AND CONTINGENCIES
We are committed to minimum purchases of $700,000 of Selan® skin care products per calendar year for each calendar year through 2020. For the fiscal years ended 2016, 2015, and 2014, purchases under this commitment were $829,000, $823,000 and $898,000, respectively. In addition to the minimum purchase requirements, we are required to pay a fee of $30,000 per year to license the Selan products.
From time to time we are defendants in legal actions involving claims arising in the normal course of business. We believe that, as a result of legal defenses and insurance arrangements with parties we believe to be financially capable, none of these actions, if determined adversely, should have a material adverse effect on our operations or financial condition.
21. QUARTERLY FINANCIAL DATA (Unaudited)
|
Quarterly Financial Data (Unaudited) |
|
(Amounts in thousands, except per share data) |
|
First |
Second |
Third |
Fourth |
Year |
||||||||||||||||
|
For Fiscal 2016 |
||||||||||||||||||||
|
Net sales |
$ | 21,452 | $ | 14,853 | $ | 15,347 | $ | 15,975 | $ | 67,627 | ||||||||||
|
Gross profit |
5,483 | 5,191 | 5,654 | 5,953 | 22,281 | |||||||||||||||
|
Operating income |
1,556 | 1,160 | 1,486 | 1,879 | 6,082 | |||||||||||||||
|
Net income |
1,143 | 758 | 935 | 1,412 | 4,247 | |||||||||||||||
|
Earnings per share |
||||||||||||||||||||
|
Basic |
0.42 | 0.28 | 0.34 | 0.51 | 1.55 | |||||||||||||||
|
Diluted |
0.42 | 0.28 | 0.34 | 0.51 | 1.54 | |||||||||||||||
|
For Fiscal 2015 |
||||||||||||||||||||
|
Net sales |
$ | 15,721 | $ | 15,034 | $ | 15,813 | $ | 17,747 | $ | 64,315 | ||||||||||
|
Gross profit |
5,449 | 4,982 | 5,441 | 5,765 | 21,636 | |||||||||||||||
|
Operating income |
1,344 | 925 | 1,318 | 1,670 | 5,257 | |||||||||||||||
|
Net income |
970 | 773 | 963 | 1,287 | 3,993 | |||||||||||||||
|
Earnings per share |
||||||||||||||||||||
|
Basic |
0.33 | 0.26 | 0.32 | 0.43 | 1.34 | |||||||||||||||
|
Diluted |
0.32 | 0.26 | 0.32 | 0.43 | 1.33 | |||||||||||||||
Item 9. Changes in and Disagreements With Accountants on Accounting and Financial Disclosure
None.
Item 9A. Controls and Procedures
Evaluation of Disclosure Controls and Procedures
Our management has evaluated, with the participation of our Chief Executive Officer and Chief Financial Officer, the effectiveness of our disclosure controls and procedures as of the end of the period covered by this annual report (the “Evaluation Date”), and, based on this evaluation, our Chief Executive Officer and Chief Financial Officer have concluded that these controls and procedures were effective at the Evaluation Date. There were no changes in our internal controls over financial reporting during the last quarter of fiscal 2016 that have materially affected or are reasonably likely to materially affect our internal control over financial reporting.
Disclosure controls and procedures are the Company’s controls and other procedures that are designed to ensure that information required to be disclosed by us in the reports that we file or submit under the Exchange Act is recorded, processed, summarized and reported within the time periods specified in the Securities and Exchange Commission’s rules and forms. Disclosure controls and procedures include, without limitation, controls and procedures designed to ensure that information required to be disclosed by the Company in the reports that it files or submits under the Exchange Act is accumulated and communicated to our management, including our Chief Executive Officer and Chief Financial Officer, as appropriate to allow for timely decisions regarding required disclosure.
Management’s Report on Internal Control over Financial Reporting
The management of Span-America is responsible for establishing and maintaining adequate internal control over financial reporting, as such term is defined in Exchange Act Rules 13a-15(f) and 15d-15(f). Span-America’s internal control system was designed to provide reasonable assurance regarding the reliability of financial reporting and the preparation of financial statements for external purposes in accordance with generally accepted accounting principles and includes those policies and procedures that:
|
1. |
pertain to the maintenance of records that in reasonable detail accurately and fairly reflect the transactions and dispositions of the assets of Span-America; |
|
2. |
provide reasonable assurance that transactions are recorded as necessary to permit preparation of financial statements in accordance with generally accepted accounting principles, and that receipts and expenditures of Span-America are being made only in accordance with authorizations of management and directors of Span-America; and |
|
3. |
provide reasonable assurance regarding prevention or timely detection of unauthorized acquisition, use or disposition of Span-America’s assets that could have a material adverse effect on the financial statements. |
All internal control systems, no matter how well designed, have inherent limitations. Therefore, even those systems determined to be effective can provide only reasonable assurance with respect to financial statement preparation and presentation.
We have assessed the effectiveness of our internal control over financial reporting as of October 1, 2016. In making this assessment, we used the 2013 framework set forth by the Committee of Sponsoring Organizations of the Treadway Commission (COSO) in Internal Control-Integrated Framework. Based on that assessment, we believe that as of October 1, 2016, our internal control over financial reporting is effective.
This annual report does not include an attestation report of our independent registered public accounting firm regarding internal control over financial reporting. Our report on internal control was not subject to attestation by our independent registered public accounting firm pursuant to an exemption for non-accelerated filers that permits us to provide only management’s report in this annual report.
Item 9B. Other Information
None.
PART III
Item 10. Directors, Executive Officers and Corporate Governance
Information required under Item 10 of Part III is incorporated herein by reference to portions of the definitive Proxy Statement filed or to be filed with the Securities and Exchange Commission on or prior to 120 days following the end of our 2016 fiscal year under the headings “Proposals to be Voted Upon – Election of Directors,” “Corporate Governance,” “Executive Officers” and “Section 16(a) Beneficial Ownership Reporting Compliance.”
Item 11. Executive Compensation
Information required under Item 11 of Part III is incorporated herein by reference to portions of the definitive Proxy Statement filed or to be filed with the Securities and Exchange Commission on or prior to 120 days following the end of our 2016 fiscal year under the headings “Compensation of Executive Officers,” “Corporate Governance – Director Compensation” and “Corporate Governance – Compensation Committee Interlocks and Insider Participation.”
Item 12. Security Ownership of Certain Beneficial Owners and Management and Related Stockholder Matters
The information under the heading “Security Ownership of Certain Beneficial Owners and Management” set forth in our definitive Proxy Statement filed or to be filed with the Securities and Exchange Commission on or prior to 120 days following the end of our 2016 fiscal year is incorporated herein by reference.
The following table summarizes information regarding our equity compensation plans as of October 1, 2016:
|
Plan category |
Number of securities to be issued upon exercise of outstanding options, warrants and rights |
Weighted-average exercise price of outstanding options, warrants and rights |
Number of securities remaining available for future issuance under equity compensation plans (excluding securities reflected in column (a)) |
|||||||||
|
(a) |
(b) |
(c) |
||||||||||
|
Equity compensation plans approved by security holders |
52,150 | $ | 13.18 | 190,500 | ||||||||
|
Equity compensation plans not approved by security holders |
0 | 0 | 0 | |||||||||
|
Total |
52,150 | $ | 13.18 | 190,500 | ||||||||
For additional information on our stock option plans, see Note 12 in the Notes to Consolidated Financial Statements for the year ended October 1, 2016.
Item 13. Certain Relationships and Related Transactions and Director Independence
The information required under Item 13 of Part III is incorporated herein by reference to portions of our definitive Proxy Statement filed or to be filed with the Securities and Exchange Commission on or prior to 120 days following the end of our 2016 fiscal year under the headings “Certain Relationships and Related Transactions” and “Corporate Governance – Director Independence.”
Item 14. Principal Accountant Fees and Services
The information required under Item 14 of Part III is incorporated herein by reference to portions of our definitive Proxy Statement filed or to be filed with the Securities and Exchange Commission on or prior to 120 days following the end of our 2016 fiscal year under the headings “Audit Fees,” “Audit-Related Fees,” “Tax Fees” and “All Other Fees.”
PART IV
Item 15. Exhibits and Financial Statement Schedules
(a) (1) Financial Statements
The response to this portion of Item 15 is submitted under Item 8, Consolidated Financial Statements and Supplementary Data, beginning on page 43.
(2) Financial Statement Schedules
The response to this portion of Item 15 is submitted below under Item 15(c).
(3) Listing of Exhibits
|
2.1 |
Asset Purchase Agreement dated December 9, 2011 by and among the Company, Span Medical Products Canada Inc., M.C. Healthcare Products Inc., Thompson Contract Supply Company Limited and Ralph Thompson: Incorporated by reference to Exhibit 2.1 to the Company’s report on Form 8-K dated December 9, 2011, Commission File No. 0-11392. Schedules and exhibits have been omitted in accordance with Item 601(b)(2) of Regulation S-K. A list of schedules and exhibits is set forth at the end of the table of contents in the Asset Purchase Agreement. The Company will furnish the Commission with a copy of any such schedule or exhibit supplementally upon request. |
|
3.1 |
Restated Articles of Incorporation: Incorporated by reference to Exhibit 3(a) to the Company’s Registration Statement on Form S-18, Commission File No. 0-11392. |
|
3.1.1 |
Articles of Amendment filed with the South Carolina Secretary of State on February 6, 1989: Incorporated by reference to Exhibit 3.1.1 to the Company’s Annual Report on Form 10-K for the fiscal year ended September 28, 1991 (the “1991 10-K”), Commission File No. 0-11392. |
|
3.1.2 |
Articles of Amendment filed with the South Carolina Secretary of State on March 5, 1992: Incorporated by reference to Exhibit 4.4 to the Company’s Registration Statement on Form S-2 dated May 11, 1992, Commission File No. 33-47670. |
|
3.1.3 |
Articles of Amendment filed with the South Carolina Secretary of State on April 22, 1993: Incorporated by reference to Exhibit 4.1 to the Company’s Quarterly Report on Form 10-Q for the quarter ended April 3, 1993. |
|
3.2 |
Amended and Restated By-Laws dated February 4, 1997: Incorporated by reference to Exhibit 3.0 to the Company’s Quarterly Report on Form 10-Q for the quarter ended March 29, 1997. |
|
3.2.1 |
Amendment to the Company's By-laws dated March 13, 2003: Incorporated by reference to Exhibit 3.2 to the Company's report on Form 8-K dated March 13, 2003, Commission File No. 0-11392. |
|
3.2.2 |
Amendment to the Company's By-laws dated November 7, 2003: Incorporated by reference to Exhibit 3.2.2 to the Company’s Annual Report on Form 10-K for the fiscal year ended September 27, 2003, Commission File No. 0-11392. |
|
3.2.3 |
Amendment to the Company's By-laws dated November 12, 2014: Incorporated by reference to Exhibit 3.2.3 to the Company's report on Form 8-K dated November 18, 2014, Commission File No. 0-11392. |
|
4.1 |
Specimen of Common Stock certificate: Incorporated by reference to Exhibit 1 to the Form S-8 filed on January 8, 1990, Commission File No. 33-32896. |
|
4.2 |
Amended & Restated Standstill Agreement dated September 28, 2015 between the Company, Anita G. Zucker, as Trustee of The Jerry Zucker Revocable Trust dated March 20, 2007 and as successor-in-interest to Jerry Zucker, deceased, Robert B. Johnston and The InterTech Group, Inc. Incorporated by reference to Exhibit 4.1 to the Company’s Current Report on Form 8-K dated September 28, 2015, Commission File No. 0-11392. |
|
4.3 |
Exhibits 3.1 through 3.2.3 are incorporated herein by reference. |
|
10.1* |
Retirement Agreement dated February 6, 1991 between the Company and Donald C. Spann: Incorporated by reference to Exhibit 10.7 to the 1991 10-K. |
|
10.2* |
Voluntary Resignation Agreement dated July 30, 1993 between the Company and Donald C. Spann: Incorporated by reference to Exhibit 10.1 to the Company's Quarterly Report on Form 10-Q for the quarter ended July 3, 1993, Commission File No. 0-11392. |
|
10.3* |
1997 Stock Option Plan: Incorporated by reference to Exhibit 10.14 to the Company’s Annual Report on Form 10-K for the fiscal year ended September 27, 1997 (the “1997 10-K”), Commission File No. 0-11392. |
|
10.3.1* |
Amendment No. 1 to the 1997 Stock Option Plan: Incorporated by reference to Exhibit 10.14.2 to the Company’s Annual Report on Form 10-K for the fiscal year ended October 3, 1998 (the “1998 10-K”), Commission File No. 0-11392. |
|
10.4* |
1997 Long Term Incentive Stock Option Plan: Incorporated by reference to Exhibit 10.15 to the 1997 10-K. |
|
10.5* |
Span-America Medical Systems, Inc. 2007 Equity Incentive Plan: Incorporated by reference to Appendix A to the Company’s Definitive Proxy Statement for its 2007 Annual Meeting of Shareholders filed with the Commission on January 8, 2007, Commission File No. 0-11392. |
|
10.6* |
Severance Protection Agreement between the Company and James D. Ferguson dated July 25, 2002: Incorporated by reference to Exhibit 10.20 of the Company’s Annual Report on Form 10-K for the fiscal year ended September 28, 2002 (the “2002 10-K”), Commission File No. 000-11392. |
|
10.7* |
Severance Protection Agreement between the Company and Robert E. Ackley dated July 25, 2002: Incorporated by reference to Exhibit 10.21 of the 2002 10-K. |
|
10.8* |
Severance Protection Agreement between the Company and Richard C. Coggins dated July 25, 2002: Incorporated by reference to Exhibit 10.22 of the 2002 10-K. |
|
10.9* |
Severance Protection Agreement between the Company and James R. O’Reagan dated July 25, 2002: Incorporated by reference to Exhibit 10.23 of the 2002 10-K. |
|
10.10* |
Severance Protection Agreement between the Company and Clyde A. Shew dated July 25, 2002: Incorporated by reference to Exhibit 10.24 of the 2002 10-K. |
|
10.11* |
Severance Protection Agreement between the Company and Erick C. Herlong dated December 1, 2008: Incorporated by reference to Exhibit 10.16 to the Company’s Annual Report on Form 10-K for the fiscal year ended October 3, 2009 (the “2009 10-K”), Commission File No. 0-11392. |
|
10.12* |
Severance Protection Agreement between the Company and Marie Sitter dated December 1, 2008: Incorporated by reference to Exhibit 10.17 of the 2009 10-K. |
|
10.13 |
Distribution Agreement dated March 1, 1999 between the Company and Louisville Bedding Corporation: Incorporated by reference to Exhibit 10.16 to the Company’s Annual Report on Form 10-K for the fiscal year ended September 30, 2000, Commission File No. 0-11392. |
|
10.13.1 |
Addendum to Distribution Agreement between Louisville Bedding Company and Span-America Medical Systems, Inc. dated January 1, 2002: Incorporated by reference to Exhibit 10.17 to the Company’s Quarterly Report on Form 10-Q for the quarter ended March 30, 2002, Commission File No. 0-11392. |
|
10.13.2 |
Assignment & Assumption of Distribution Agreement dated May 23, 2013 among the Company, Louisville Bedding Company and Hollander Home Fashions, LLC: Incorporated by reference to Exhibit 10.1 to the Company’s report on Form 8-K dated May 29, 2013, Commission File No. 0-11392. |
|
10.14 |
Amended & Restated Loan Agreement dated December 9, 2011 by and between the Company and TD Bank: Incorporated by reference to Exhibit 10.1.1 to the Company’s report on Form 8-K dated December 9, 2011, Commission File No. 0-11392. |
|
10.14.1 |
Amended & Restated Revolving Note (Increase with Stepdown) dated December 9, 2011 with the Company as Borrower and TD Bank as Lender: Incorporated by reference to Exhibit 10.1.2 to the Company’s report on Form 8-K dated December 9, 2011, Commission File No. 0-11392. |
|
10.14.2 |
Unlimited Guaranty dated December 9, 2011 of Span Medical Products Canada Inc. to TD Bank: Incorporated by reference to Exhibit 10.1.3 to the Company’s report on Form 8-K dated December 9, 2011, Commission File No. 0-11392. |
|
10.14.3 |
Negative Pledge Agreement dated December 9, 2011 of the Company to TD Bank: Incorporated by reference to Exhibit 10.1.4 to the Company’s report on Form 8-K dated December 9, 2011, Commission File No. 0-11392. |
|
10.14.4 |
Letter Agreement dated April 30, 2015 by and among TD Bank, N.A. and Span-America Medical Systems, Inc. Incorporated by reference to Exhibit 10.1 to the Company’s Current Report on Form 8-K dated April 30, 2015, Commission File No. 0-11392. |
|
10.14.5 |
First Amendment to Loan Documents dated May 27, 2015 by and between TD Bank, N.A. and Span-America Medical Systems, Inc. Incorporated by reference to Exhibit 10.1 to the Company’s Current Report on Form 8-K dated May 27, 2015, Commission File No. 0-11392. |
|
10.15.1 |
Lease dated December 9, 2011 between Span Medical Products Canada Inc. and Thompson Contract Supply Company Limited: Incorporated by reference to Exhibit 10.2 to the Company’s report on Form 8-K dated December 9, 2011, Commission File No. 0-11392. |
|
10.15.2 |
Lease Amendment and Extension dated November 4, 2016 between Span Medical Products Canada Inc. and Thompson Contract Supply Company Limited. |
|
10.16 |
Final Collective Agreement effective November 1, 2012 to October 31, 2018 between Span Medical Products Canada Inc. (operating under the registered business name M.C. Healthcare Products) and Sheet Metal Workers’ International Association, Local Union 540: Incorporated by reference to Exhibit 10.21 to the Company’s Quarterly Report on Form 10-Q for the fiscal quarter ended March 29, 2014, Commission File No. 0-11392. |
|
10.17.1 |
License and Distribution Agreement with P.J. Noyes Company, Inc. Confidential treatment has been requested for this exhibit. Incorporated by reference to Exhibit 10.4 to the Company’s Quarterly Report on Form 10-Q for the fiscal quarter ended April 2, 2011, Commission File No. 0-11392. Portions of this exhibit have been redacted, and the redacted portions have been separately filed with the Securities and Exchange Commission. |
|
10.17.2 |
Amendment No. 1 to License and Distribution Agreement effective February 1, 2016 by and between Nipro Consumer Healthcare, Inc., d/b/a P.J. Noyes Company and Span-America Medical Systems, Inc. Incorporated by reference to Exhibit 10.1 to the Company’s Current Report on Form 8-K dated February 2, 2016 and filed with the Commission on February 8, 2016, Commission File No. 0-11392. |
|
10.17.3 |
Confirmation of Amendment No. 1 to License and Distribution Agreement dated December 21, 2016 by Trividia Manufacturing Solutions, Inc., f/k/a Nipro Consumer Healthcare, Inc. |
|
21.1 |
Subsidiaries |
|
23.1 |
Consent of Elliott Davis Decosimo, LLC. |
|
31.1 |
Officer Certifications Pursuant to Section 302. |
|
32.1 |
Officer Certifications Pursuant to Section 906. |
|
101.INS** |
XBRL Instance |
|
101.SCH** |
XBRL Taxonomy Extension Schema |
|
101.CAL** |
XBRL Taxonomy Extension Calculation |
|
101.DEF** |
XBRL Taxonomy Extension Definition |
|
101.LAB** |
XBRL Taxonomy Extension Labels |
|
101.PRE** |
XBRL Taxonomy Extension Presentation |
|
* |
Management contract or compensatory plan or arrangement. |
|
** |
XBRL information is furnished and not filed or a part of a registration statement or prospectus for purposes of sections 11 or 12 of the Securities Act of 1933, as amended, is deemed not filed for purposes of section 18 of the Securities Exchange Act of 1934, as amended, and otherwise is not subject to liability under these sections. |
(b) Exhibits
The exhibits required by this section of Item 15 are attached hereto or incorporated by reference.
Financial Statement Schedules
|
Schedule VIII Valuation and Qualifying Accounts |
||||||||||||||||||||
|
Balance at |
Charged to |
Balance at |
||||||||||||||||||
|
Beginning of |
Costs and |
Deductions- |
( c ) |
End of |
||||||||||||||||
|
Description |
Period |
Expenses |
Describe |
Adjustments |
Period |
|||||||||||||||
|
Fiscal Year Ended October 1, 2016 |
||||||||||||||||||||
|
Deducted from asset accounts: |
||||||||||||||||||||
|
Reserve for uncollectible accounts |
$ | 148,000 | $ | (9,007 | ) | $ | - | $ | 1,007 | $ | 140,000 | |||||||||
|
Reserve for obsolete inventory |
$ | 570,000 | $ | 22,200 | $ | 35,200 | (b) | $ | (32,000 | ) | $ | 525,000 | ||||||||
|
Fiscal Year Ended October 3, 2015 |
||||||||||||||||||||
|
Deducted from asset accounts: |
||||||||||||||||||||
|
Reserve for uncollectible accounts |
$ | 302,000 | $ | 38,776 | $ | 192,776 | (a) | $ | - | $ | 148,000 | |||||||||
|
Reserve for obsolete inventory |
$ | 497,000 | $ | 73,000 | $ | - | $ | - | $ | 570,000 | ||||||||||
|
Fiscal Year Ended September 27, 2014 |
||||||||||||||||||||
|
Deducted from asset accounts: |
||||||||||||||||||||
|
Reserve for uncollectible accounts |
$ | 263,000 | $ | 128,925 | $ | 89,925 | (a) | $ | - | $ | 302,000 | |||||||||
|
Reserve for obsolete inventory |
$ | 720,000 | $ | 90,803 | $ | 313,803 | (b) | $ | - | $ | 497,000 | |||||||||
|
(a) Uncollectible accounts written off |
|
(b) Inventory disposed of |
All other schedules for which provision is made in the applicable accounting regulations of the Securities and Exchange Commission are not required under the related instructions or are inapplicable, and therefore have been omitted.
SIGNATURES
Pursuant to the requirements of Section 13 or 15(d) of the Securities Exchange Act of 1934, the registrant has duly caused this report to be signed on its behalf by the undersigned, thereunto duly authorized.
SPAN-AMERICA MEDICAL SYSTEMS, INC.
|
By: /s/ Thomas D. Henrion |
December 23, 2016 | |
|
Thomas D. Henrion |
| |
|
Chairman of the Board |
|
Pursuant to the requirements of the Securities Exchange Act of 1934, this report has been signed below by the following persons on behalf of the registrant and in the capacities on the date indicated.
|
/s/ James D. Ferguson |
President, Chief Executive Officer and Director | |
|
James D. Ferguson |
(Principal Executive Officer) | |
|
/s/ Richard C. Coggins |
Chief Financial Officer | |
|
Richard C. Coggins |
(Principal Financial Officer) | |
|
/s/ Gwendolyn L. Randolph |
Controller | |
|
Gwendolyn L. Randolph |
||
|
/s/ Robert H. Dick |
Director | |
|
Robert H. Dick |
||
|
/s/ Thomas F. Grady, Jr. |
Director | |
|
Thomas F. Grady, Jr. |
||
|
/s/ Thomas D. Henrion |
Director | |
|
Thomas D. Henrion |
||
|
/s/ Dan R. Lee |
Director | |
|
Dan R. Lee |
||
|
/s/ Linda D. Norman |
Director | |
|
Linda D. Norman |
||
|
/s/ Terry Allison Rappuhn |
Director | |
|
Terry Allison Rappuhn |
||
|
/s/ Thomas J. Sullivan |
Director | |
|
Thomas J. Sullivan |
|
|
December 23, 2016 |
77