Attached files
| file | filename |
|---|---|
| EX-32 - EX-32 - TORO CO | a2230524zex-32.htm |
| EX-31.2 - EX-31.2 - TORO CO | a2230524zex-31_2.htm |
| EX-31.1 - EX-31.1 - TORO CO | a2230524zex-31_1.htm |
| EX-23 - EX-23 - TORO CO | a2230524zex-23.htm |
| EX-21 - EX-21 - TORO CO | a2230524zex-21.htm |
| EX-12 - EX-12 - TORO CO | a2230524zex-12.htm |
| EX-10.21 - EX-10.21 - TORO CO | a2230524zex-10_21.htm |
| EX-10.19 - EX-10.19 - TORO CO | a2230524zex-10_19.htm |
| EX-10.18 - EX-10.18 - TORO CO | a2230524zex-10_18.htm |
| EX-10.17 - EX-10.17 - TORO CO | a2230524zex-10_17.htm |
| EX-10.14 - EX-10.14 - TORO CO | a2230524zex-10_14.htm |
| EX-10.11 - EX-10.11 - TORO CO | a2230524zex-10_11.htm |
| EX-10.1 - EX-10.1 - TORO CO | a2230524zex-10_1.htm |
Use these links to rapidly review the document
TABLE OF CONTENTS
UNITED STATES SECURITIES AND EXCHANGE COMMISSION
Washington, D.C. 20549
FORM 10-K
ý Annual Report Pursuant to Section 13 or 15(d) of the Securities Exchange Act of 1934
For the Fiscal Year Ended October 31, 2016
o Transition Report Pursuant to Section 13 or 15(d) of the Securities Exchange Act of
1934
For the Transition Period from to
THE TORO COMPANY
(Exact name of registrant as specified in its charter)
| Delaware | 1-8649 | 41-0580470 | ||
| (State of Incorporation) | (Commission File Number) | (I.R.S. Employer Identification Number) |
8111 Lyndale Avenue South
Bloomington, Minnesota 55420-1196
Telephone number: (952) 888-8801
(Address, including zip code, and telephone number, including area code, of registrant's principal executive offices)
Securities registered pursuant to Section 12(b) of the Act:
Title of Each Class
|
Name of Each Exchange on Which Registered
|
|
|---|---|---|
Common Stock, par value $1.00 per share |
New York Stock Exchange |
Securities
registered pursuant to Section 12(g) of the Act:
None
Indicate by check mark if the registrant is a well-known seasoned issuer, as defined in Rule 405 of the Securities Act. Yes ý No o
Indicate by check mark if the registrant is not required to file reports pursuant to Section 13 or Section 15(d) of the Act. Yes o No ý
Indicate by check mark whether the registrant (1) has filed all reports required to be filed by Section 13 or 15(d) of the Securities Exchange Act of 1934 during the preceding 12 months (or for such shorter period that the registrant was required to file such reports), and (2) has been subject to such filing requirements for the past 90 days. Yes ý No o
Indicate by check mark whether the registrant has submitted electronically and posted on its corporate Web site, if any, every Interactive Data File required to be submitted and posted pursuant to Rule 405 of Regulation S-T (§232.405 of this chapter) during the preceding 12 months (or for such shorter period that the registrant was required to submit and post such files). Yes ý No o
Indicate by check mark if disclosure of delinquent filers pursuant to Item 405 of Regulation S-K (§229.405 of this chapter) is not contained herein, and will not be contained, to the best of registrant's knowledge, in definitive proxy or information statements incorporated by reference in Part III of this Form 10-K or any amendment to this Form 10-K. o
Indicate by check mark whether the registrant is a large accelerated filer, an accelerated filer, a non-accelerated filer, or a smaller reporting company. See the definitions of "large accelerated filer," "accelerated filer," and "smaller reporting company" in Rule 12b-2 of the Exchange Act.
| Large accelerated filer ý | Accelerated filer o | Non-accelerated filer o | Smaller reporting company o |
Indicate by check mark whether the registrant is a shell company (as defined in Rule 12b-2 of the Act). Yes o No ý
The aggregate market value of the voting common stock held by non-affiliates of the registrant, based on the closing price of the common stock on April 29, 2016, the last business day of the registrant's most recently completed second fiscal quarter, as reported by the New York Stock Exchange, was approximately $4.0 billion.
The number of shares of common stock outstanding as of December 16, 2016 was 108,108,667.
Documents Incorporated by Reference: Portions of the registrant's Proxy Statement for the 2017 Annual Meeting of Shareholders expected to be held March 21, 2017 are incorporated by reference into Part III.
THE TORO COMPANY
FORM 10-K
TABLE OF CONTENTS
| Description | Page Number | |||
| | | | | |
2
The Toro Company was incorporated in Minnesota in 1935 as a successor to a business founded in 1914 and reincorporated in Delaware in 1983. Unless the context indicates otherwise, the terms "company," "Toro," "we," "us," and "our" refer to The Toro Company and its consolidated subsidiaries. Our executive offices are located at 8111 Lyndale Avenue South, Bloomington, Minnesota, 55420-1196, and our telephone number is (952) 888-8801. Our web site for corporate and investor information is www.thetorocompany.com, which also contains links to our branded product sites. The information contained on our web sites or connected to our web sites is not incorporated by reference into this Annual Report on Form 10-K and should not be considered part of this report.
We design, manufacture, and market professional turf maintenance equipment and services, turf irrigation systems, landscaping equipment and lighting products, snow and ice management products, agricultural micro-irrigation systems, rental and specialty construction equipment, and residential yard and snow thrower products. We produced our first mower for golf course use in 1921 when we mounted five reel mowers on a Toro tractor, and we introduced our first lawn mower for residential use in 1935. We have continued to enhance our product lines over the more than 100 years we have been in business. We classify our operations into three reportable business segments: Professional, Residential, and Distribution. Our Distribution segment, which consists of our company-owned domestic distributorship, has been combined with our corporate activities and is shown as "Other." Net sales of our three reportable segments accounted for the following percentages of our consolidated net sales for fiscal 2016: Professional, 71 percent; Residential, 28 percent; and Other, 1 percent.
Our products are advertised and sold at the retail level under the primary trademarks of Toro®, Exmark®, BOSS®, Irritrol®, Hayter®, Pope®, Unique Lighting Systems®, and Lawn-Boy® most of which are registered in the United States and/or in the primary countries outside the United States where we market such products. This report also contains trademarks, trade names, and service marks that are owned by other persons or entities, such as The Home Depot, Inc. ("The Home Depot").
We emphasize quality and innovation in our products, customer service, manufacturing, and marketing. We strive to provide well-built, dependable products supported by an extensive service network. We have committed funding for research, development, and engineering in order to improve and enhance existing products and develop new products. Through these efforts, we seek to be responsive to trends that may affect our target markets now and in the future. A significant portion of our revenues has historically been, and we expect will continue to be, attributable to new and enhanced products. We define new products as those introduced in the current and previous two fiscal years. We plan to continue to pursue targeted acquisitions using a disciplined approach that adds value while supplementing our existing brands and product portfolio.
Our purpose is to help our customers enrich the beauty, productivity, and sustainability of the land. Our vision is to be the most trusted leader in solutions for the outdoor environment. Every day. Everywhere. Our mission, or how we strive to make our vision a reality and what we intend to accomplish, is to deliver superior innovation and to deliver superior customer care.
We strive to be a leader in adapting advanced technologies to products and services that provide solutions for turf care maintenance, landscapes, agricultural fields, rental and specialty construction, snow and ice management, and residential demands. The following is a summary of our products, by market, for our Professional segment and our products for the Residential segment:
Professional Segment — We design professional turf, landscape and lighting, rental and specialty construction, snow and ice management, and agricultural products and market them worldwide through a network of distributors and dealers, as well as directly to government customers, rental companies, and large retailers. These channel partners then sell our products primarily to professional users engaged in creating, renovating, and illuminating landscapes; irrigating turf and agricultural fields; installing, repairing, and replacing underground utilities; managing snow and ice needs; maintaining turf, such as golf courses, sports fields, municipal properties, as well as residential and commercial landscapes.
Golf Market. Products for the golf course market include large reel and rotary riding products for fairway, rough, and trim cutting; riding and walking mowers for putting greens and specialty areas; greens rollers; turf sprayer equipment; utility vehicles; aeration equipment; and bunker maintenance equipment. In fiscal 2016, we introduced the Reelmaster® 3555-D and Reelmaster® 3575-D, fairway mowers with a lighter design that are engineered to be more productive and fuel efficient with reduced turf compaction. These mowers, as well as most other Reelmaster® and Greensmaster® models, include our new EdgeSeriesTM Reels introduced in fiscal 2016 that feature new reel material and geometry that are designed to facilitate a more accurate cut and improved after-cut appearance while reducing required maintenance.
3
We manufacture and market underground irrigation systems for the golf course market, including sprinkler heads, controllers, turf sensors, and electric, battery-operated, and hydraulic valves. These irrigation systems are designed to use computerized management systems and a variety of other technologies to help customers manage their consumption of water. Several of our golf course sprinklers are equipped with a unique TruJectory™ feature that provides an adjustable angle of nozzle trajectory, as well as enhanced water distribution control. Our Network VP® Satellite combines modular flexibility, ease of use, and increased control in a single controller with programming to the individual station level that supports station-based flow management. Our Turf Guard® wireless soil monitoring systems are designed to measure and communicate soil moisture, salinity, and temperature through sensors to a user's software. Our R Series™ conversion assemblies enable the upgrade of select competitive sprinklers to our technologies, such as the above-mentioned TruJectory™ or ratcheting riser. Our INFINITY® Series golf course sprinklers with the Smart Access® feature are designed to provide easy access to critical components of the sprinkler without needing to dig. Our popular Lynx® central control system allows superintendents to control the irrigation of their course from a web-enabled device, or via our National Support Network, which provides remote troubleshooting.
Additionally, we manufacture and market Twilight™ golf lighting products that include a collection of LED-powered cup lights and removable lighting fixtures designed to illuminate putting greens during club events or special functions.
Landscape Contractor Equipment Market. We market products to landscape contractors under the Toro and Exmark brands. Products for the landscape contractor market include zero-turn radius riding mowers, heavy-duty walk behind mowers, mid-size walk behind mowers, stand-on mowers, and turf renovation and tree care equipment. We offer some products with electronic fuel injection engine options, which are designed to provide improved fuel efficiency and lower emissions. In fiscal 2016, we introduced the TITAN® HD zero-turn radius riding mower which features the ability to attach tools and other accessories to the mower with tool-mounting brackets. We introduced the Exmark Radius™ zero-turn radius riding mower featuring a heavy-duty fabricated frame and improved control and handling in order to provide commercial durability, reliability, and comfort. We enhanced our line of Toro Z Master® mowers with a suspension system that provides a suspended operator platform and isolates the operator from the rest of the machine. Along with adjustable shocks, this design is intended to reduce impacts, bumps, and vibrations for a more comfortable ride. We introduced the next generation GrandStand® MULTI FORCE® stand-on mower in fiscal 2016, which features simplified hydraulic systems intended for easier maintenance, higher groundspeed for transport, and easier to use operator controls. The GrandStand® MULTI FORCE® is designed to provide year-long productivity by adding versatile attachments.
Sports Fields and Grounds Equipment Market. Products for the sports fields and grounds market include riding rotary and reel mowers and attachments, aerators, and debris management products, which include versatile debris vacuums, blowers, and sweepers. Other products include infield grooming equipment and multipurpose vehicles, such as the new Toro Workman® GTX introduced in fiscal 2016, that can be used for turf maintenance, towing, and industrial hauling. These products are sold through distributors, who then sell to owners and/or managers of sports fields, governmental properties, and residential and commercial landscapes, as well as directly to government customers.
Snow and Ice Management Market. Products for the snow and ice management market are marketed mainly in North America under the BOSS brand and include snowplows, salt and sand spreaders, and related parts and accessories for light and medium duty trucks, all-terrain vehicles ("ATVs"), utility task vehicles ("UTVs"), skid steers, and front-end loaders. These products are mainly sold through distributors and dealers, who then sell to end-users that in many cases are the same customers as those in our landscape contractor and grounds equipment markets, such as contractors, municipalities, and other governmental entities. In fiscal 2016, we introduced the EXT Plow, with pitched-forward wings that extend the plow width from eight feet to ten feet to enhance productivity. In addition, in fiscal 2016, we began offering the HTX V-Plow designed for light-duty and half-ton trucks that combines strength with less weight. Both are equipped with our new SmartLightTM 3 LED headlight system, which features our Ice Shield TechnologyTM designed to prevent snow and ice build-up.
Rental and Specialty Construction Market. Our compact utility loaders are the cornerstone products for our Toro Sitework Systems business, which are designed to improve the efficiency in creation and renovation of landscapes. Our Dingo® TX 1000 compact utility loader provides market leading operating capacity in a lightweight, maneuverable design. We offer over 35 attachments for our compact utility loaders, including trenchers, augers, vibratory plows, and backhoes.
Products for the rental and specialty construction market include compact utility loaders, walk-behind trenchers, stump grinders, and turf renovation products, many of which are also sold to landscape contractors. We also have a line of rental products that feature concrete and mortar mixers, material handlers, compaction equipment, and other concrete equipment.
Underground Construction Market. We manufacture a line of directional drills and riding trenchers used to install water, gas, electric, and telecommunication distribution systems. Our underground products are used by specialty contractors worldwide.
Residential/Commercial Irrigation and Lighting Market. Turf irrigation products marketed under the Toro and Irritrol brands
4
include rotors; sprinkler bodies and nozzles; plastic, brass, and hydraulic valves; drip tubing and subsurface irrigation; electric control devices; and wired and wireless rain, freeze, climate, and soil sensors. These products are designed for use in residential and commercial turf irrigation applications and can be installed into new systems or used to replace or retrofit existing systems. Most of the product lines are designed for professionally installed, underground automatic irrigation. Electric controllers activate valves and sprinklers in a typical irrigation system. Both the Toro and Irritrol brands have achieved Environmental Protection Agency ("EPA") WaterSense certification for numerous irrigation controller families and models. Our Irritrol Climate Logic® smart device automatically adjusts irrigation system watering times based on real-time weather data from an on-site sensor combined with historical averages, while our award-winning Toro Precision™ Soil Sensor wirelessly transmits soil moisture content to an irrigation controller and signals whether or not watering is needed. Our Precision™ Spray Nozzles & Precision™ Soil Sensor are intended to deliver an optimum precipitation rate and superior distribution uniformity, resulting in the use of less water without affecting the health of landscapes. The EVOLUTION® controller is an intuitive, menu-based controller family that offers computer programming, lighting control, multiple soil sensors, smart add-ons, and downloadable updates through a USB device. The T5 Rotor with RapidSet® technology allows convenient arc adjustment with no tools, and the new stainless steel model introduced in fiscal 2016 is designed for areas subject to heavy foot traffic and sandy soil conditions.
Our retail irrigation products are designed for homeowner installation and include sprinkler heads, valves, timers, sensors, and drip irrigation systems. The XTRA SMART® ECXTRA™ sprinkler timer and its intuitive, online Scheduling Advisor™ are designed to recommend the proper watering schedule based on the local weather, plant type, and sprinkler type.
We manufacture and market lighting products under the Unique Lighting Systems® brand name consisting of a line of high quality, professionally installed lighting fixtures and transformers for residential and commercial landscapes. Our lighting product line is offered through distributors and landscape contractors that also purchase our irrigation products. The Light Logic™ remote control system provides operators with wireless scene control for landscape lighting and can upgrade existing systems with expanded control.
In fiscal 2016, we introduced two cloud-based landscape control solutions. SMRT LogicTM under the Toro and Irritrol brands and Light LogicTM Plus under the Unique Lighting Systems brand are our first landscape solutions using our SMRTscapeTM mobile app or website to control irrigation and lighting anywhere with an internet connection.
Micro-Irrigation Market. Products for the micro-irrigation market include products that are designed to apply water precisely, including Aqua-Traxx® PBX drip tape, Neptune® flat emitter dripline, Blue Stripe® polyethylene tubing, BlueLine® drip line, and NGE® emitters, all used in agriculture, mining, and landscape applications. Global food demand and increased water use restrictions have continued to drive the need for more efficient irrigation solutions for agriculture, including our Aqua-Traxx® FC (flow control) drip tape that is designed to allow growers to achieve water uniformity while retaining flexibility to adjust system flow rates when needed. In addition to these core products, we offer a full complement of control devices and connection options to complete the system, including a software package used to help design drip irrigation systems. These products are sold mainly through dealers and distributors who then sell to end-users for use primarily in vegetable fields, fruit and nut orchards, vineyards, landscapes, and mines.
Residential Segment — We market our Residential segment products to homeowners through a variety of distribution channels, including outdoor power equipment distributors and dealers, hardware retailers, home centers, mass retailers, and over the Internet. We also license our trademark on certain home solutions products as a means of expanding our brand presence.
Walk Power Mower Products. We manufacture and market numerous walk power mower models under our Toro and Lawn-Boy brand names, as well as the Hayter brand in the United Kingdom. Models differ as to cutting width, type of starter mechanism, method of grass clipping discharge, deck type, operational controls, and power sources, and are either self-propelled or push mowers. We offer a line of rear-roller walk power mowers, a design that provides a striped finish, for the United Kingdom market. In fiscal 2016, we extended our SmartStow® technology that allows the mower to be stored vertically, thereby reducing space needed for storage, to walk power motors with our Personal Pace® self-propel system. We introduced the new Lawn-Boy all-wheel drive lawnmower that delivers power to all four wheels, which is designed to make it easier to climb hills and power through rough terrain.
Riding Products. We manufacture and market riding products under the Toro brand name. Riding products primarily consist of zero-turn radius mowers that are designed to save homeowners time by using superior maneuverability to cut around obstacles more quickly and easily than tractor technology. Our TimeCutter® SS and TimeCutter® MX zero-turn radius riding mowers are equipped with our Smart Speed® control system, which is designed to allow the operator to choose different ground speed ranges with the flip of a lever without changing the blade or engine speed. We sell direct-collect riding mowers that are manufactured and sold in the European market. Many models of our riding products are available with a variety of engines, decks, transmissions, and accessories.
5
Home Solutions Products. We design and market home solutions products under the Toro and Pope brand names. Our Toro brand name products include yard tools such as electric, gas, and cordless grass trimmers; electric and cordless hedge trimmers; and electric, gas, and cordless blower-vacuums. In Australia, we design and market garden product offerings, such as underground, hose and hose-end retail irrigation products under the Pope brand name.
Snow Thrower Products. We manufacture and market a range of gas-powered single-stage and two-stage snow thrower models, as well as a range of electric snow thrower models. Single-stage snow throwers are walk behind units with lightweight four-cycle gasoline engines. Most single-stage snow thrower models include Power Curve® snow thrower technology, and some feature our Quick Shoot™ control system that is designed to enable operators to quickly change snow-throwing direction. Our pivoting scraper is designed to keep the rotor in constant contact with the pavement. Our two-stage snow throwers are generally designed for relatively large areas of deep and heavy snow. Our two-stage snow throwers include a line of models featuring our patented Anti-Clogging System and Quick Stick® chute control technology. Our electric snow throwers are lightweight and ideal for clearing up to six inches of snow from decks, steps, sidewalks, and small driveways. The Toro SnowMaster® snow thrower combines the power of a two-stage snow thrower to handle deep snow with the handling and maneuverability of a lightweight, single-stage snow thrower in a design intended to increase efficiency by clearing more snow per minute.
Financial Information about International Operations and Business Segments
We currently manufacture our products in the United States ("U.S."), Mexico, Australia, the United Kingdom, Italy, Romania, and China for sale throughout the world. We maintain sales offices in the U.S., Belgium, the United Kingdom, Australia, Singapore, Japan, China, Italy, South Korea, and Germany. New product development is pursued primarily in the U.S. Our net sales outside the U.S. were 24.2 percent, 25.5 percent, and 28.7 percent of total consolidated net sales for fiscal 2016, 2015, and 2014, respectively.
A portion of our cash flow is derived from sales and purchases denominated in foreign currencies. To reduce the uncertainty of foreign currency exchange rate movements on these sales and purchase commitments, we enter into foreign currency exchange contracts for select transactions. For additional information regarding our foreign currency exchange contracts, see Part II, Item 7A, "Quantitative and Qualitative Disclosures about Market Risk" of this report. For additional financial information regarding our international operations and geographical areas, and each of our three reportable business segments, see Note 12 of the Notes to Consolidated Financial Statements, in the section entitled "Segment Data," included in Part II, Item 8, "Financial Statements and Supplementary Data" of this report.
We are committed to an ongoing engineering program dedicated to developing innovative new products and improvements in the quality and performance of existing products. However, a focus on innovation also carries certain risks that new technology could be slow to be accepted or not accepted by the marketplace. We attempt to mitigate these risks through our focus on and commitment to understanding our customers' needs and requirements. We invest time upfront with customers, using "Voice of the Customer" tools, to help us develop innovative products that are intended to meet or exceed customer expectations. We use Design for Manufacturing and Assembly ("DFM/A") tools to ensure early manufacturing involvement in new product designs intended to reduce production costs. DFM/A focuses on reducing the number of parts required to assemble new products, as well as designing products to move more efficiently through the manufacturing process. We strive to make improvements to our new product development system as part of our continuing focus on Lean methods to shorten development time, reduce costs, and improve quality.
Our engineering expenses are primarily incurred in connection with the development of new products that may have additional applications or represent extensions of existing product lines, improvements to existing products, and cost reduction efforts. Our expenditures for engineering and research were $77.4 million (3.2 percent of net sales) in fiscal 2016, $73.6 million (3.1 percent of net sales) in fiscal 2015, and $69.7 million (3.2 percent of net sales) in fiscal 2014.
We have strategically identified specific core manufacturing competencies for vertical integration, such as injection molding, extrusion, welding, stamping, fabrication, laser cutting, painting, machining, and aluminum die casting, and have chosen outside vendors to provide other services. We design component parts in cooperation with our vendors, contract with them for the development of tooling, and then enter into agreements with these vendors to purchase component parts manufactured using the tooling. In addition, our vendors regularly test new technologies to be applied in the design and production of component parts. Manufacturing operations include robotic and computer-automated equipment intended to speed production, reduce costs, and improve the quality, fit, and finish of our products. Operations are also designed to be flexible enough to accommodate product design changes that are necessary to respond to market conditions and changing customer requirements.
In order to utilize our manufacturing facilities and technology more effectively, we pursue continuous improvements in our
6
manufacturing processes with the use of Lean methods that are intended to streamline work and eliminate waste. We spend considerable effort to reduce manufacturing costs through Lean methods and process improvement, product and platform design, application of advanced technologies, enhanced environmental management systems, safety improvements, and improved supply-chain management. We also have some agreements with other third party manufacturers to manufacture products on our behalf.
Our Professional segment products are manufactured throughout the year. Our Residential segment lawn and garden products are also generally manufactured throughout the year. However, our Residential segment snow thrower products are manufactured in the summer and fall months but may be extended into the winter months, depending upon demand. Our products are tested in conditions and locations similar to those in which they are used. We use computer-aided design and manufacturing systems to shorten the time between initial concept and final production. DFM/A principles are used throughout the product development process to optimize product quality and cost.
Our production levels and inventory management goals are based on estimates of retail demand for our products, taking into account production capacity, timing of shipments, and field inventory levels. Our production system utilizes Kanban, supplier pull, and build-to-order methodologies in our manufacturing facilities, as appropriate, for the business units they support in order to better align the production of our products to meet customer demand. We believe this has resulted in improved service levels for our participating suppliers, distributors, and dealers.
We periodically shut down production at our manufacturing facilities in order to allow for maintenance, rearrangement, capital equipment installation, and as needed, to adjust for market demand. Capital expenditures for fiscal 2017 are planned to be approximately $65 million as we continue to invest in tooling and technology, as well as the renovation of our corporate facilities located in Bloomington, Minnesota. Additionally, we plan to invest in production processes and equipment, replacement production equipment, and investments in new and existing facilities.
We purchase raw materials such as steel, aluminum, petroleum and natural gas-based resins, linerboard, and other commodities, and components, such as engines, transmissions, transaxles, hydraulics, and electric motors, for use in our products. In addition, we are a purchaser of components and parts containing various commodities, including steel, aluminum, copper, lead, rubber, and others that are integrated into our end products. During fiscal 2016, we experienced lower average commodity prices compared to the average prices paid for commodities in fiscal 2015. We anticipate commodity prices in fiscal 2017 to be slightly higher than average prices paid for commodities during fiscal 2016. Historically, we have mitigated, and we currently expect that we would mitigate, commodity cost increases, if any, in part, by collaborating with suppliers, reviewing alternative sourcing options, substituting materials, engaging in internal cost reduction efforts, and increasing prices on some of our products, all as appropriate.
Most of the raw materials and components used in our products are affected by commodity cost pressures, are commercially available from a number of sources, and are in adequate supply. However, certain components are sourced from single suppliers. In fiscal 2016, we experienced no significant work stoppages because of shortages of raw materials or commodities. The largest spend for raw materials and components are generally for steel, engines, hydraulic components, transmissions, resin, and electric motors, all of which we purchase from several suppliers around the world.
Our products are warranted to ensure customer confidence in design, workmanship, and overall quality. Warranty coverage is generally for specified periods of time and on select products' hours of usage, and generally covers parts, labor, and other expenses for non-maintenance repairs. Warranty coverage generally does not cover operator abuse or improper use. An authorized company distributor or dealer must perform warranty work. Distributors and dealers submit claims for warranty reimbursement and are credited for the cost of repairs, labor, and other expenses as long as the repairs meet our prescribed standards. Warranty expense is accrued at the time of sale based on the estimated number of products under warranty, historical average costs incurred to service warranty claims, the trend in the historical ratio of claims to sales, the historical length of time between the sale and resulting warranty claim, and other minor factors. Special warranty reserves are also accrued for major rework campaigns. Service support outside of the warranty period is provided by authorized distributors and dealers at the customer's expense. We sell extended warranty coverage on select products for a prescribed period after the original warranty period expires.
7
We have rigorous product safety standards and continually work to improve the safety and reliability of our products. We monitor for accidents and possible claims and establish liability estimates based on internal evaluations of the merits of individual claims. We purchase insurance coverage for catastrophic product liability claims for incidents that exceed our self-insured retention levels.
We own patents, trademarks, and trade secrets related to our products in the U.S. and certain countries outside the U.S. in which we conduct business. We expect to apply for future patents and trademarks, as appropriate, in connection with the development of innovative new products, services, and enhancements. Although we believe that, in the aggregate, our patents are valuable, and patent protection is beneficial to our business and competitive positioning, our patent protection will not necessarily deter or prevent competitors from attempting to develop similar products. We are not materially dependent on any one or more of our patents. However, certain Toro trademarks that contribute to our identity and the recognition of our products and services, including the Toro® name and logo, are an integral part of our business.
We regularly review certain patents issued by the United States Patent and Trademark Office ("USPTO") and international patent offices to help avoid potential liability with respect to others' patents. Additionally, we periodically review competitors' products to prevent possible infringement of our patents by others. We believe these activities help us minimize our risk of being a defendant in patent infringement litigation. We are currently involved in patent litigation cases where we are asserting our patents against competitors and defending against patent infringement assertions by others. Such cases are at varying stages in the litigation process.
Similarly, we periodically monitor various trademark registers and the market to prevent infringement of and damage to our trademarks by others. From time to time, we are involved in trademark oppositions where we are asserting our trademarks against third parties who are attempting to establish rights in trademarks that are confusingly similar to ours. We believe these activities help minimize risk of harm to our trademarks, and help maintain distinct products and services that we believe are well regarded in the marketplace.
Shipments of our Residential segment products, which accounted for 28 percent of total consolidated net sales in fiscal 2016, are seasonal, with shipments of lawn and garden products occurring primarily between February and June, depending upon seasonal weather conditions and demand for our products. Shipments of snow thrower products occur primarily between July and January, depending upon in-season snowfalls, pre-season demand, and product availability. Opposite seasons in global markets in which we sell our products somewhat moderate this seasonality of our Residential segment product sales. Seasonality of Professional segment product sales also exists, but is tempered because the selling season in the Southern U.S. and our markets in the Southern hemisphere continue for a longer portion of the year than in Northern regions of the world. The BOSS business offers a portfolio of counter-seasonal products in our Professional segment with our shipments of snowplows and salt and sand spreaders occurring primarily between April and December, which also results in a greater variability of shipment volumes due to dependency on snowfalls for these products.
Overall, our worldwide shipment levels are historically highest in our fiscal second quarter and retail demand is generally highest in our fiscal third quarter. Typically, our accounts receivable balances increase between January and April because of higher shipment volumes and extended payment terms made available to our customers. Accounts receivable balances typically decrease between May and December when payments are received. Our financing requirements are subject to variations due to seasonal changes in working capital levels, which typically increase in the first half of our fiscal year and decrease in the second half of our fiscal year. Seasonal cash requirements of our business are financed from a combination of cash balances, cash flows from operations, and short-term borrowings under our credit facilities.
The following table shows total consolidated net sales and net earnings for each fiscal quarter as a percentage of the total fiscal year.
| | | | | | | | | | | | | | |
|
Fiscal 2016 | Fiscal 2015 |
|||||||||||
| | | | | | | | | | | | | | |
Quarter |
Net Sales |
Net Earnings |
Net Sales |
Net Earnings |
|||||||||
| | | | | | | | | | | | | | |
First |
| 20% | | 17% | | 20% | | 15% | |||||
Second |
35 | 46 | 35 | 47 | |||||||||
Third |
| 25 | | 24 | | 25 | | 26 | |||||
Fourth |
20 | 13 | 20 | 12 | |||||||||
| | | | | | | | | | | | | | |
From time to time, weather conditions in particular geographic regions or markets may adversely or positively affect sales of some of our products and field inventory levels and result in a negative or positive impact on our future net sales. If the percentage of our net sales from outside the U.S. increases, our dependency on weather in any one part of the world decreases. Nonetheless, weather conditions could materially affect our future net sales.
8
Our businesses are seasonally working capital intensive and require funding for purchases of raw materials used in production; replacement parts inventory; payroll and other administrative costs; capital expenditures; establishment of new facilities; expansion, renovation, and upgrading of existing facilities; as well as for financing receivables from customers that are not financed with Red Iron Acceptance, LLC ("Red Iron"), our joint venture with TCF Inventory Finance, Inc. ("TCFIF"). We fund our operations through a combination of cash and cash equivalents, cash flows from operations, short-term borrowings under our credit facilities, and long-term debt. Cash management is centralized, and intercompany financing is used, wherever possible, to provide working capital to wholly owned subsidiaries as needed. In addition, our credit facilities are available for additional working capital needs, acquisitions, or other investment opportunities.
We market the majority of our products through 36 domestic and 110 international distributors, as well as a large number of equipment dealers, irrigation dealers and distributors, hardware retailers, home centers, mass retailers, and online in more than 90 countries worldwide.
Professional segment products are sold to distributors and dealers primarily for resale to golf courses, sports fields, industrial facilities, contractors, and government customers, and in some markets for resale to dealers. We sell some Professional segment products directly to government customers, rental companies, and agricultural irrigation dealers, as well as to end-users in certain international markets. Select residential/commercial irrigation and lighting products are sold to professional irrigation and lighting distributors and dealers, and certain retail irrigation products are sold directly to home centers. Products for the rental and specialty construction market are sold directly to dealers and rental companies. Toro and Exmark landscape contractor products are also sold directly to dealers in certain regions of North America. BOSS snow and ice management products are sold to distributors and dealers for resale to contractors.
Residential segment products, such as walk power mowers, zero-turn radius riding mowers, and snow throwers, are generally sold directly to home centers, dealers, hardware retailers, and mass retailers. In certain markets, these same products are sold to distributors for resale to hardware retailers and dealers. Home solutions products are primarily sold directly to home centers, mass retailers, and hardware retailers. We also sell select Residential segment products over the Internet. Internationally, Residential segment products are sold directly to dealers and mass merchandisers in Australia, Canada, and select countries in Europe. In most other countries, Residential segment products are mainly sold to distributors for resale to dealers and mass retailers.
On November 27, 2015, in our first quarter of fiscal 2016, we completed the sale of our Northwestern U.S. distribution company. During the remainder of fiscal 2016, we owned one domestic distribution company. Our primary purpose for continuing to own a domestic distributorship is to improve operations, as well as to test and deploy new strategies and business practices that could be replicated by our independent distributors.
Our distribution systems are intended to assure quality of sales and market presence, as well as to provide effective after-purchase service and support. We believe our distribution network provides a competitive advantage as it is focused on selling and marketing our products, as well as having long-term established relationships with experienced personnel to deliver high levels of customer satisfaction.
Our current marketing strategy is to maintain distinct brands and brand identification for Toro®, Exmark®, BOSS®, Irritrol®, Hayter®, Pope®, Unique Lighting Systems®, and Lawn-Boy® products.
Across our brands, we market our Professional segment and Residential segment products during the appropriate season through multiple channels, including television, radio, print, direct mail, email, digital and online media, and social media. Most of our advertising and marketing efforts emphasize our brands, products, features, and other valuable trademarks. Advertising is purchased by us, through our agency partners, as well as through cooperative programs with distributors, dealers, and retailers.
Overall, we believe that in the long-term we are not dependent on any single customer; however, the Residential segment of our business is dependent on The Home Depot as a customer, which accounted for approximately 11 percent of our total consolidated gross sales in fiscal 2016 and 2015. While the loss of any substantial customer, including The Home Depot, could have a material adverse short-term impact on our business, we believe that our diverse distribution channels and customer base should reduce the long-term impact of any such loss.
Our backlog of orders is dependent upon when customers place orders and is not necessarily an indicator of our expected results for our fiscal 2017 net sales. The approximate backlog of orders as of October 31, 2016 and 2015 was $92.4 million and $106.7 million, respectively, a decrease of 13.4 percent. The decrease was mainly driven by low snowfall totals in the 2015/2016 winter season which decreased pre-season demand of our snow products; this decrease was partially offset by increased orders of new products. We expect the existing backlog of orders will be filled in early fiscal 2017.
9
Our products are sold in highly competitive markets throughout the world. The principal competitive factors in our markets are product innovation, quality and reliability, pricing, product support and customer service, warranty, brand awareness, reputation, distribution, shelf space, and financing options. We believe we offer total solutions and full service packages with high quality products that have the latest technology and design innovations. In addition, by selling our products through a network of distributors, dealers, hardware retailers, home centers, and mass retailers, we offer comprehensive service support during and after the warranty period. We compete in many product lines with numerous manufacturers, some of which have substantially larger operations and financial resources than us. We believe that we have a competitive advantage because we manufacture a broad range of product lines, we are committed to product innovation and customer service, we have a strong history in and focus on irrigation and maintaining turf and landscapes, and our distribution channels position us well to compete in various markets.
Internationally, our Residential segment products face more competition because many foreign competitors design, manufacture, and market products in their respective countries. We experience this competition primarily in Europe. In addition, fluctuations in the value of the U.S. dollar affect the price of our products in foreign markets, thereby impacting their competitiveness. We provide pricing support, as needed, to foreign customers to remain competitive in international markets.
Environmental Matters and Other Governmental Regulation
We are subject to numerous international, federal, state, and other governmental laws, rules, and regulations relating to, among others, climate change; emissions to air, including Tier 4 or similar engine emission regulations; discharges to water; restrictions placed on water usage and water availability; product and associated packaging; use of certain chemicals; restricted substances, including "conflict minerals" disclosure rules; import and export compliance, including country of origin certification requirements; worker and product user health and safety; energy efficiency; product life-cycles; outdoor noise laws; and the generation, use, handling, labeling, collection, management, storage, transportation, treatment, and disposal of hazardous substances, wastes, and other regulated materials. For example:
- •
- The United States EPA, the California Air Resources Board, and similar regulators in other U.S. states and foreign jurisdictions in which we sell our products have phased in, or are phasing in, emission regulations setting maximum emission standards for certain equipment. Specifically, these agencies from time to time adopt increasingly stringent engine emission regulations. Following the EPA implementation of Tier 4 emission requirements applicable to diesel engines several years ago, China and the European Union ("EU") also have adopted similar regulations, and similar emission regulations are also being considered in other markets in which we sell our products.
- •
- The United States federal government, several U.S. states, and certain international jurisdictions in which we sell our products, including the EU and each of its member states, have implemented one or more of the following: (i) product life-cycle laws, rules, or regulations, which are intended to reduce waste and environmental and human health impact, and require manufacturers to label, collect, dispose, and recycle certain products, including some of our products, at the end of their useful life, including the Waste Electrical and Electronic Equipment ("WEEE") directive, which mandates the labeling, collection, and disposal of specified waste electrical and electronic equipment; (ii) the Restriction on the use of Hazardous Substances ("RoHS") directive or similar substance level laws, rules, or regulations, which restrict the use of several specified hazardous materials in the manufacture of specific types of electrical and electronic equipment; (iii) the Registration, Evaluation, Authorization and Restriction of Chemicals ("REACH") directive or similar substance level laws, rules, or regulations that require notification of use of certain chemicals, or ban or restrict the use of certain chemicals; (iv) country of origin laws, rules, or regulations, which require certification of the geographic origin of our finished goods products and/or components used in our products through documentation and/or physical markings, as applicable; (v) energy efficiency laws, rules, or regulations, which are intended to reduce the use and inefficiencies associated with energy and natural resource consumption and require specified efficiency ratings and capabilities for certain products; (vi) outdoor noise laws, which are intended to reduce noise emissions in the environment from outdoor equipment; and (vii) conflict minerals laws, such as the Dodd-Frank Wall Street Reform and Consumer Protection Act and the rules promulgated by the Securities and Exchange Commission, which require specific procedures for the determination and disclosure of the use of certain minerals, known as "conflict minerals," which are mined from the Democratic Republic of the Congo and adjoining countries.
- •
- Our products, when used by residential customers, may be subject to various federal, state, and international laws, rules, and regulations that are designed to protect consumers, including rules and regulations of the United States Consumer Product Safety Commission.
Although we believe that we are in substantial compliance with currently applicable laws, rules, and regulations, we are unable to predict the ultimate impact of adopted or future laws, rules, and regulations on our business, properties or products. Such laws, rules, or regulations may cause us to incur significant expenses to achieve or maintain compliance, may require us to modify our products, may adversely affect the price of or demand for some of our products, and may ultimately affect the way we conduct
10
our operations. Failure to comply with these current or future laws, rules, or regulations could result in harm to our reputation and/or could lead to fines and other penalties, including restrictions on the importation of our products into, or the sale of our products in, one or more jurisdictions until compliance is achieved.
We are also involved in the evaluation and clean-up of a limited number of properties currently and previously owned. We do not expect that these matters will have a material adverse effect on our consolidated financial position or results of operations.
Wholesale Financing. We are party to a joint venture with TCFIF, a subsidiary of TCF National Bank, established as Red Iron. The primary purpose of Red Iron is to provide inventory financing to certain distributors and dealers of our products in the U.S. Under a separate arrangement, TCF Commercial Finance Canada, Inc. ("TCFCFC") provides inventory financing to dealers of our products in Canada. Under these financing arrangements, down payments are not required, and depending on the finance program for each product line, finance charges are incurred by us, shared between us and the distributor and/or the dealer, or paid by the distributor or dealer. Red Iron retains a security interest in the distributors' and dealers' financed inventories, and those inventories are monitored regularly. Floor plan terms to the distributors and dealers require payment as the equipment, which secures the indebtedness, is sold to customers or when payment terms become due, whichever occurs first. Rates are generally indexed to LIBOR plus a fixed percentage that differs based on whether the financing is for a distributor or dealer. Rates may also vary based on the product that is financed.
We continue to provide financing in the form of open account terms directly to home centers and mass retailers; general line irrigation dealers; international distributors and dealers other than the Canadian distributors and dealers to whom Red Iron provides financing arrangements; micro-irrigation dealers and distributors; government customers; rental companies; and a limited number of BOSS dealers. Some independent international dealers continue to finance their products with third party sources.
End-User Financing. We have agreements with third party financing companies to provide lease-financing options to golf course and sports fields and grounds equipment customers in the U.S and select countries in Europe. The purpose of these agreements is to increase sales by giving buyers of our products alternative financing options when purchasing our products.
We have agreements with third party financing companies to provide financing programs under both generic and private label programs in the U.S. and Canada. These programs, offered primarily to Toro and Exmark dealers, provide end-user customers revolving and installment lines of credit for Toro and Exmark products, parts, and services.
Distributor Financing. Occasionally, we enter into long-term loan agreements with some distributors. These transactions are used for expansion of the distributors' businesses, acquisitions, refinancing working capital agreements, or ownership transitions.
During fiscal 2016, we employed an average of 6,834 employees. The total number of employees as of October 31, 2016 was 6,329. We consider our employee relations to be good. As of October 31, 2016, we had four collective bargaining agreements that expire in October 2017, March 2018, May 2018, and October 2019, and cover approximately 17 percent of our total employees.
We are a U.S. public reporting company under the Securities Exchange Act of 1934, as amended ("Exchange Act"), and file reports, proxy statements, and other information with the Securities and Exchange Commission ("SEC"). Copies of these reports, proxy statements, and other information can be inspected and copied at the SEC's Public Reference Room at 100 F Street N.E., Washington, D.C. 20549. You may obtain information on the operation of the Public Reference Room by calling the SEC at 1-800-SEC-0330. Because we make filings to the SEC electronically, you may also access this information from the SEC's home page on the Internet at http://www.sec.gov.
We make available, free of charge on our web site www.thetorocompany.com (select the "Investor Information" link and then the "Financials" link), our Annual Reports on Form 10-K, Quarterly Reports on Form 10-Q, Current Reports on Form 8-K, Proxy Statements on Schedule 14A, Section 16 reports, amendments to those reports, and other documents filed or furnished pursuant to Section 13(a) or 15(d) of the Exchange Act as soon as reasonably practicable after we electronically file such material with, or furnish it to, the SEC. The information contained on our web site or connected to our web site is not incorporated by reference into this Annual Report on Form 10-K and should not be considered part of this report.
This Annual Report on Form 10-K contains, or incorporates by reference, not only historical information, but also forward-looking statements within the meaning of Section 27A of the Securities Act of 1933, as amended ("Securities Act"), and Section 21E of the Exchange Act and that are subject to the safe harbor created by those sections. In addition, we or others on our behalf may make forward-looking statements from time to time in oral presentations, including telephone conferences and/or web casts
11
open to the public, in press releases or reports, on our web sites or otherwise. Statements that are not historical are forward-looking and reflect expectations and assumptions. Forward-looking statements are based on our current expectations of future events, and often can be identified in this report and elsewhere by using words such as "expect," "strive," "looking ahead," "outlook," "guidance," "forecast," "goal," "optimistic," "anticipate," "continue," "plan," "estimate," "project," "believe," "should," "could," "can," "will," "would," "possible," "may," "likely," "intend," "seek," "potential," "pro forma," or the negative thereof and similar expressions or future dates. Our forward-looking statements generally relate to our future performance, including our anticipated operating results, liquidity requirements, and financial condition; our business strategies and goals; and the effect of laws, rules, regulations, new accounting pronouncements, and outstanding litigation on our business and future performance.
Forward-looking statements involve risks and uncertainties that could cause actual results to differ materially from those projected or implied. The most significant factors known to us that could materially adversely affect our business, reputation, operations, industry, financial position, or future financial performance are described below in Part I, Item 1A, "Risk Factors." We caution readers not to place undue reliance on any forward-looking statement which speaks only as of the date made and to recognize that forward-looking statements are predictions of future results, which may not occur as anticipated. Actual results could differ materially from those anticipated in the forward-looking statements and from historical results, due to the risks and uncertainties described elsewhere in this report, including in Part I, Item 1A, "Risk Factors," as well as others that we may consider immaterial or do not anticipate at this time. The risks and uncertainties described in this report, including in Part I, Item 1A, "Risk Factors," are not exclusive and further information concerning our company and our businesses, including factors that potentially could materially affect our operating results or financial condition, may emerge from time to time.
We make no commitment to revise or update any forward-looking statements in order to reflect actual results, events or circumstances occurring or existing after the date any forward-looking statement is made, or changes in factors or assumptions affecting such forward-looking statements. We advise you, however, to consult any further disclosures we make on related subjects in our future Quarterly Reports on Form 10-Q and Current Reports on Form 8-K that we file with or furnish to the SEC.
The following are significant factors known to us that could materially adversely affect our business, reputation, operating results, industry, financial position, or future financial performance.
Our net sales and earnings could be adversely affected by economic conditions and outlook in the United States and in other countries in which we conduct business.
Adverse economic conditions and outlook in the U.S. and in other countries in which we conduct business can impact demand for our products and, ultimately, our net sales and earnings. These include, but are not limited to, recessionary conditions; slow or negative economic growth rates; the impact of U.S. federal debt, state debt, and sovereign debt defaults and austerity measures by certain European countries; slow down or reductions in levels of golf course development, renovation, and improvement; golf course closures; reduced levels of home ownership, construction, and sales; home foreclosures; negative consumer confidence; reduced consumer spending levels resulting from tax increases or other factors; prolonged high unemployment rates; higher commodity and components costs and fuel prices; inflationary or deflationary pressures; reduced credit availability or unfavorable credit terms for our distributors, dealers, and end-user customers; higher short-term, mortgage, and other interest rates; and general economic and political conditions and expectations. In the past, some of these factors have caused our distributors, dealers, and end-user customers to reduce spending and delay or forego purchases of our products, which have had an adverse effect on our net sales and earnings. Our net sales and earnings could be adversely impacted by economic conditions and outlook in the U.S. and in other countries in which we conduct business.
Weather conditions may reduce demand for some of our products and adversely affect our net sales or otherwise adversely affect our operating results.
From time to time, weather conditions in a particular geographic region may adversely affect sales, demand, and field inventory levels of some of our products. For example, in the past, drought conditions have had an adverse effect on sales of certain mowing equipment products, unusually rainy weather or severe drought conditions that result in watering bans have had an adverse effect on sales of our irrigation products, and lower snowfall accumulations in key markets have had an adverse effect on sales of our snow thrower products and sales of products of our BOSS professional snow and ice management business. Similarly, adverse weather conditions in one season may negatively impact customer purchasing patterns and our net sales for some of our products in another season. For example, lower snowfall accumulations may result in lower winter season revenues for landscape contractor professionals, causing such customers to forego or postpone spring purchases of our mowing products. To the extent that unfavorable weather conditions are exacerbated by global climate change or otherwise, our sales and operating results may be affected to a greater degree than we have previously experienced.
12
Fluctuations in foreign currency exchange rates have in the past affected our operating results and could continue to result in declines in our reported net sales and net earnings.
Because the functional currency of most of our foreign operations is the applicable local currency, and because our financial reporting currency is the U.S. dollar, preparation of our consolidated financial statements requires that we translate the assets, liabilities, expenses, and revenues of our foreign operations into U.S. dollars at applicable exchange rates. Accordingly, we are exposed to foreign currency exchange rate risk arising from transactions in the normal course of business, such as sales and loans to wholly owned subsidiaries, as well as sales to third party customers, purchases from suppliers, and bank lines of credit with creditors denominated in foreign currencies. Our reported net sales and net earnings are subject to fluctuations in foreign currency exchange rates that have in the past affected our operating results and could continue to result in declines in our reported net sales and net earnings. Because our products are manufactured or sourced primarily from the U.S. and Mexico, a stronger U.S. dollar and Mexican peso generally have a negative impact on our operating results, while a weaker U.S. dollar and Mexican peso generally have a positive effect. In addition, currency exchange rate fluctuations may affect the comparative prices between products we sell and products our foreign competitors sell in the same market, which may adversely affect demand for our products. Substantial exchange rate fluctuations as a result of the strengthening of the U.S. dollar or otherwise, may have an adverse effect on our operating results, financial condition, and cash flows, as well as the comparability of our consolidated financial statements between reporting periods. Our primary foreign currency exchange rate exposure is with the Euro, the Australian dollar, the Canadian dollar, the British pound, the Mexican peso, the Japanese yen, the Chinese Renminbi, and the Romanian New Leu against the U.S. dollar, as well as the Romanian New Leu against the Euro including exposure as a result of the volatility and uncertainty that may arise as a result of the United Kingdom's vote to exit the European Union. While we actively manage the exposure of our foreign currency market risk in the normal course of business by entering into various foreign exchange contracts, these instruments involve risks and may not effectively limit our underlying exposure from foreign currency exchange rate fluctuations or minimize our net earnings and cash volatility associated with foreign currency exchange rate changes. Further, the failure of one or more counterparties to our foreign currency exchange rate contracts to fulfill their obligations to us could adversely affect our operating results.
Increases in the cost of raw materials and components that we purchase and/or increases in our other costs of doing business, may adversely affect our profit margins and businesses.
We purchase raw materials such as steel, aluminum, petroleum and natural gas-based resins, linerboard, and other commodities, and components, such as engines, transmissions, transaxles, hydraulics, and electric motors, for use in our products. In addition, we are a purchaser of components and parts containing various commodities, including steel, aluminum, copper, lead, rubber, and others that are integrated into our end products. To the extent that commodity prices increase and we do not have firm pricing from our suppliers, or our suppliers are not able to honor such prices, increases in the cost of such raw materials and components and parts may adversely affect our profit margins. In addition, increases in other costs of doing business may also adversely affect our profit margins and businesses. For example, an increase in fuel costs may result in an increase in our transportation costs, which also could adversely affect our operating results and businesses. In addition, changes to international trade agreements could result in additional tariffs, duties or other charges on raw materials or components we import into the U.S.
Historically, we have mitigated cost increases, in part, by collaborating with suppliers, reviewing alternative sourcing options, substituting materials, engaging in internal cost reduction efforts, and increasing prices on some of our products, all as appropriate. However, we may not be able to fully offset such increased costs in the future. Further, if our price increases are not accepted by our customers and the market, our net sales, profit margins, earnings, and market share could be adversely affected.
Disruption in the availability of raw materials and components used in our products may adversely affect our business.
Although most of the raw materials and components used in our products are generally commercially available from a number of sources and in adequate supply, certain components are sourced from single suppliers. Any disruption in the availability of raw materials and components used in our products, our inability to timely or otherwise obtain substitutes for such items, or any deterioration in our relationships with, the financial viability or quality of, or the personnel relationships at our suppliers, could adversely affect our business.
Our Professional segment net sales are dependent upon certain factors, including golf course revenues and the amount of investment in golf course renovations and improvements; the level of new golf course development and golf course closures; the level of property owners who outsource their lawn care and snow and ice removal activities; the level of residential and commercial construction; continued acceptance of and demand for micro-irrigation solutions for agricultural markets; the timing and occurrence of winter weather conditions; the demand for our products in the rental and specialty construction market; the availability of cash or credit to Professional segment customers on acceptable terms to finance new product purchases; and the amount of government revenues, budget, and spending levels for grounds maintenance equipment.
Our Professional segment products are sold by distributors or dealers, or directly to government customers, rental companies, and professional users engaged in maintaining and creating properties and landscapes, such as golf courses, sports fields,
13
residential and commercial properties and landscapes, and governmental and municipal properties. Accordingly, our professional segment net sales are impacted by golf course revenues and the amount of investment in golf course renovations and improvements; the level of new golf course development and golf course closures; the level of property owners who outsource their lawn care and snow and ice removal activities; continued acceptance of and demand for micro-irrigation solutions for agricultural markets; the timing and occurrence of winter weather conditions; the demand for our products in the rental and specialty construction market; the level of residential and commercial construction; availability of cash or credit on acceptable terms to finance new product purchases; and the amount of government spending for new grounds maintenance equipment. Among other things, any one or a combination of the following factors could have an adverse effect on our Professional segment net sales:
- •
- reduced levels of investment in golf course renovations and improvements and new golf course development; reduced number of golf rounds played at public and private golf courses resulting in reduced revenue for such golf courses; decreased membership at private golf courses resulting in reduced revenue and, in certain cases, financial difficulties for such golf courses; and increased number of golf course closures, any one of which or any combination of which could result in a decrease in spending and demand for our products;
- •
- reduced consumer and business spending on property maintenance and/or unfavorable weather conditions, causing property owners, including homeowners, and landscape contractor professionals to forego or postpone purchases of our products;
- •
- low or reduced levels of commercial and residential construction, resulting in a decrease in demand for our products;
- •
- a decline in acceptance of and demand for micro-irrigation solutions for agricultural markets and our products in the rental and specialty construction market; and
- •
- reduced tax revenue, increased governmental expenses in other areas, tighter government budgets and government deficits, generally resulting in reduced government spending for grounds maintenance equipment.
Our Residential segment net sales are dependent upon consumers buying our Residential segment products at dealers, mass retailers, and home centers, such as The Home Depot, Inc.; the amount of product placement at mass retailers and home centers; consumer confidence and spending levels; and changing buying patterns of customers.
The elimination or reduction of shelf space assigned to our residential products or other changes to the placement of our products by mass retailers and home centers, such as The Home Depot, could adversely affect our Residential segment net sales. Our Residential segment net sales also are dependent upon buying patterns of customers. For example, as consumers purchase products at home centers and mass retailers that offer broader and lower price points than dealers, we have experienced increased demand and sales of our Residential segment products purchased at mass retailers and home centers. The Home Depot is a substantial customer of ours, which accounted for approximately 11 percent of our total consolidated gross sales in each of fiscal 2016, 2015, and 2014. We believe that our diverse distribution channels and customer base should reduce the long-term impact on us if we were to lose The Home Depot or any other substantial customer. However, the loss of any substantial customer, a significant reduction in sales to The Home Depot or other customers, or our inability to maintain adequate product placement at retailers and home centers or our inability to respond to future changes in buying patterns of customers or new distribution channels could have a material adverse impact on our business and operating results. Changing buying patterns of customers could also result in reduced sales of one or more of our Residential segment products, resulting in increased inventory levels.
Changes in our product mix impact our financial performance, including profit margins and net earnings.
Our Professional segment products generally have higher profit margins than our Residential segment products. Our financial performance, including our profit margins and net earnings, can be impacted depending on the mix of products we sell during a given period. For example, if we experience lower sales of our Professional segment products that generally carry higher profit margins than our Residential segment products, our financial performance, including profit margins and net earnings, could be negatively impacted.
We intend to grow our business in part through acquisitions and alliances, strong customer relations, and new joint ventures and partnerships, which could be risky and may harm our business, reputation, financial condition, and operating results.
One of our growth strategies is to drive growth in our businesses and accelerate opportunities to expand our global presence through targeted acquisitions and alliances, strong customer relations, and new joint ventures and partnerships that add value while supplementing our existing brands and product portfolio. Our ability to grow through acquisitions will depend, in part, on the availability of suitable candidates at acceptable prices, terms, and conditions, our ability to compete effectively for acquisition candidates, and the availability of capital and personnel to complete such acquisitions and run the acquired business effectively. Any acquisition, alliance, joint venture, or partnership could impair our business, financial condition, reputation, and operating results. The benefits of an acquisition, or new alliance, joint venture, or partnership may take more time than expected to develop or integrate into our operations, and we cannot guarantee that previous or future acquisitions, alliances, joint ventures, or partnerships will, in fact, produce any benefits. Acquisitions, alliances, joint ventures, and partnerships may involve a number of risks, including:
- •
- diversion of management's attention;
14
- •
- disruption to our existing operations and plans;
- •
- inability to effectively manage our expanded operations;
- •
- difficulties or delays in integrating and assimilating information and financial systems, operations, and products of an acquired business or other business venture or in realizing projected efficiencies, growth prospects, cost savings, and synergies;
- •
- inability to successfully integrate or develop a distribution channel for acquired product lines;
- •
- potential loss of key employees, customers, distributors, or dealers of the acquired businesses or adverse effects on existing business relationships with suppliers, customers, distributors, and dealers;
- •
- delays or challenges in transitioning distributors and dealers of acquired businesses to using our Red Iron financing joint venture with TCFIF;
- •
- violation of any non-compete agreement by any key employee of an acquired business;
- •
- adverse impact on overall profitability if our expanded operations do not achieve the financial results projected in our valuation models;
- •
- reallocation of amounts of capital from other operating initiatives and/or an increase in our leverage and debt service requirements to pay acquisition purchase prices or other business venture investment costs, which could in turn restrict our ability to access additional capital when needed or pursue other important elements of our business strategy;
- •
- failure by acquired businesses or other business ventures to comply with applicable international, federal, and state product safety or other regulatory standards;
- •
- infringement by acquired businesses or other business ventures of intellectual property rights of others;
- •
- inaccurate assessment of additional post-acquisition or business venture investments, undisclosed, contingent or other liabilities or problems, unanticipated costs associated with an acquisition or other business venture, and an inability to recover or manage such liabilities and costs; and
- •
- incorrect estimates made in the accounting for acquisitions, incurrence of non-recurring charges, and write-off of significant amounts of goodwill or other assets that could adversely affect our operating results.
In addition, effective internal controls are necessary for us to provide reliable and accurate financial reports and to effectively prevent fraud. The integration of acquired businesses may result in our systems and controls becoming increasingly complex and more difficult to manage. We devote significant resources and time to comply with the internal control over financial reporting requirements of the Sarbanes-Oxley Act of 2002. However, we cannot be certain that these measures will ensure that we design, implement, and maintain adequate control over our financial processes and reporting in the future, especially in the context of acquisitions of other businesses. Any difficulties in the assimilation of acquired businesses into our control system could harm our operating results or cause us to fail to meet our financial reporting obligations. Also, some acquisitions may require the consent of the lenders under our credit agreements. We cannot predict whether such approvals would be forthcoming or the terms on which the lenders would approve such acquisitions. These risks, among others, could be heightened if we complete a large acquisition or other business venture or multiple transactions within a relatively short period of time.
If we underestimate or overestimate demand for our products and do not maintain appropriate inventory levels, our net sales and/or working capital could be negatively impacted.
Our ability to manage our inventory levels to meet our customers' demand for our products is important for our business. For example, our residential lawn and garden products are generally manufactured throughout the year and our residential snow thrower products are manufactured in the summer and fall months but may be extended into the winter months, depending upon demand. However, our production levels and inventory management goals for our Residential segment products are based on estimates of retail demand for our products, taking into account production capacity, timing of shipments, and field inventory levels. If we overestimate or underestimate demand for any of our products during a given season, we may not maintain appropriate inventory levels, which could negatively impact our net sales or working capital, hinder our ability to meet customer demand, or cause us to incur excess and obsolete inventory charges.
Our business and operating results are subject to the inventory management decisions of our distribution channel customers.
We sell many of our products through various distribution channels and are subject to risks relating to their inventory management decisions and operational and sourcing practices. Our distribution channel customers carry inventories of our products as part of their ongoing operations and adjust those inventories based on their assessments of future needs. Such adjustments may impact our inventory management and working capital goals as well as operating results. If the inventory levels of our distribution channel customers are higher than they desire, they may postpone product purchases from us, which could cause our sales to be lower than the end-user demand for our products and negatively impact our inventory management and working capital goals as well as our operating results. Similarly, our results could be negatively impacted through the loss of sales if our distribution channel customers do not maintain field inventory levels sufficient to meet end-user demand.
We face intense competition in all of our product lines with numerous manufacturers, including some that have larger operations and financial resources than us. We may not be able to compete effectively against competitors' actions, which could harm our business and operating results.
Our products are sold in highly competitive markets throughout the world. Principal competitive factors in our markets include
15
product innovation, quality and reliability, pricing, product support and customer service, warranty, brand awareness, reputation, distribution, product placement and shelf space, and financing options. We compete in many product lines with numerous manufacturers, some of which have substantially larger operations and financial resources than us. As a result, they may be able to adapt more quickly to new or emerging technologies and changes in customer preferences, or devote greater resources to the development, promotion, and sale of their products than we can. In addition, competition could increase if new companies enter the market, existing competitors consolidate their operations or if existing competitors expand their product lines or intensify efforts within existing product lines. Our current products, products under development, and our ability to develop new and improved products may be insufficient to enable us to compete effectively with our competitors. Internationally, our Residential segment products typically face more competition because many foreign competitors design, manufacture, and market products in their respective countries. We experience this competition primarily in Europe. In addition, fluctuations in the value of the U.S. dollar may affect the price of our products in foreign markets, thereby impacting their competitiveness. We may not be able to compete effectively against competitors' actions, which may include the movement by competitors with manufacturing operations to low cost countries for significant cost and price reductions, and could harm our business and operating results.
A significant percentage of our consolidated net sales are generated outside of the United States, a portion of which are financed by third parties, and we intend to continue to expand our international operations. Our international operations require significant management attention and financial resources, expose us to difficulties presented by international economic, political, legal, regulatory, accounting, and business factors, and may not be successful or produce desired levels of net sales.
We currently manufacture our products in the U.S., Mexico, Australia, the United Kingdom, Italy, Romania, and China for sale throughout the world. We maintain sales offices in the United States, Belgium, the United Kingdom, Australia, Singapore, Japan, China, Italy, South Korea, and Germany. Our net sales outside the U.S. were 24.2 percent, 25.5 percent, and 28.7 percent of our total consolidated net sales for fiscal 2016, 2015, and 2014, respectively. International markets have been, and will continue to be, a focus for us for revenue growth, both organically and through acquisitions. We believe many opportunities exist in the international markets, and over time, we intend for international net sales to comprise a larger percentage of our total consolidated net sales. Several factors, including the implications of the United Kingdom's vote to exit the European Union, implications of withdrawal by the U.S. from, or revision to, international trade agreements, foreign policy changes between the U.S. and other countries, weakened international economic conditions or the impact of sovereign debt defaults by certain European countries, could adversely affect our international net sales. Additionally, the expansion of our existing international operations and entry into additional international markets require significant management attention and financial resources. Many of the countries in which we manufacture or sell our products, or otherwise have an international presence are, to some degree, subject to political, economic, and/or social instability, including drug cartel-related violence, which may disrupt our production activities and maquiladora operations based in Juarez, Mexico. Our international operations expose us and our representatives, agents, and distributors to risks inherent in operating in foreign jurisdictions. These risks include:
- •
- increased costs of customizing products for foreign countries;
- •
- difficulties in managing and staffing international operations and increases in infrastructure costs including legal, tax, accounting, and information technology;
- •
- the imposition of additional U.S. and foreign governmental controls or regulations; new or enhanced trade restrictions and restrictions on the activities of foreign agents, representatives, and distributors; withdrawal from or revision to international trade agreements and the imposition or increases in import and export licensing and other compliance requirements, customs duties and tariffs, import and export quotas and other trade restrictions, license obligations, and other non-tariff barriers to trade;
- •
- the imposition of U.S. and/or international sanctions against a country, company, person, or entity with whom we do business that would restrict or prohibit our business with the sanctioned country, company, person, or entity;
- •
- international pricing pressures;
- •
- laws and business practices favoring local companies;
- •
- adverse currency exchange rate fluctuations;
- •
- longer payment cycles and difficulties in enforcing agreements and collecting receivables through certain foreign legal systems;
- •
- higher tax rates and potentially adverse tax consequences, including restrictions on repatriating cash and/or earnings to the U.S.;
- •
- fluctuations in our operating performance based on our geographic mix of sales;
- •
- transportation delays and interruptions;
- •
- national and international conflicts, including foreign policy changes or terrorist acts;
- •
- difficulties in protecting, enforcing or defending intellectual property rights; and
- •
- multiple, changing, and often inconsistent enforcement of laws, rules, and regulations, including rules relating to environmental, health, and safety matters.
Our international operations may not produce desired levels of net sales or, among other things one or more of the factors listed above may harm our business and operating results. Any material decrease in our international sales or profitability could also adversely impact our operating results.
16
In addition, a portion of our international net sales are financed by third parties. The termination of our agreements with these third parties, any material change to the terms of our agreements with these third parties or in the availability or terms of credit offered to our international customers by these third parties, or any delay in securing replacement credit sources, could adversely affect our sales and operating results.
If we are unable to continue to enhance existing products, as well as develop and market new products, that respond to customer needs and preferences and achieve market acceptance, we may experience a decrease in demand for our products, and our net sales, which have historically benefited from sales of new products, may be adversely affected.
One of our growth strategies is to develop innovative, customer-valued products to generate revenue growth. In the past, our sales from new products, which we define as those introduced in the current and previous two fiscal years, have represented a significant component of our net sales and are expected to continue to represent a significant component of our future net sales. We may not be able to compete as effectively with our competitors, and ultimately satisfy the needs and preferences of our customers, unless we can continue to enhance existing products and develop new innovative products for the markets in which we compete. Product development requires significant financial, technological, and other resources. Product improvements and new product introductions also require significant research, planning, design, development, engineering, and testing at the technological, product, and manufacturing process levels and we may not be able to timely develop and introduce product improvements or new products. Our competitors' new products may beat our products to market, be higher quality or more reliable, be more effective with more features and/or less expensive than our products, obtain better market acceptance, or render our products obsolete. Any new products that we develop may not receive market acceptance or otherwise generate any meaningful net sales or profits for us relative to our expectations based on, among other things, existing and anticipated investments in manufacturing capacity and commitments to fund advertising, marketing, promotional programs, and research and development.
We manufacture our products at, and distribute our products from, several locations in the U.S. and internationally. Any disruption at any of these facilities or our inability to cost-effectively expand existing, open and manage new, and/or move production between manufacturing facilities could adversely affect our business and operating results.
We currently manufacture most of our products at ten locations in the U.S., two locations in Mexico, and one location in each of Australia, Italy, the United Kingdom, Romania, and China. We have several locations that serve as distribution centers, warehouses, test labs, and corporate offices. In addition, we have agreements with other third-party manufacturers to manufacture products on our behalf. These facilities may be affected by natural or man-made disasters and other external events, including drug cartel-related violence that may disrupt our production activities and maquiladora operations based in Juarez, Mexico. In the event that one of our manufacturing facilities was affected by a disaster or other event, we could be forced to shift production to one of our other manufacturing facilities. Although we maintain insurance for damage to our property and disruption of our business from casualties, such insurance may not be sufficient to cover all of our potential losses. Furthermore, from time to time, we may decide to open new manufacturing or distribution facilities or move production between our facilities to align production capacity with production goals, which could result in disruption and/or additional expense. Any disruption in our manufacturing capacity could have an adverse impact on our ability to produce sufficient inventory of our products or may require us to incur additional expenses in order to produce sufficient inventory, and therefore, may adversely affect our net sales and operating results. Any disruption or delay at our manufacturing facilities, including a work slowdown, strike, or similar action at any one of our facilities operating under a collective bargaining agreement, or the failure to renew or enter into new collective bargaining agreements, could impair our ability to meet the demands of our customers, and our customers may cancel orders or purchase products from our competitors, which could adversely affect our business and operating results.
Our production labor needs fluctuate throughout the year. During periods of peak production, it is necessary to sharply increase the number of production staff. Such production staff may be new to our manufacturing processes and safety protocols. Any failure by our production labor force to adequately and safely perform their jobs could adversely affect our business, operating results, and reputation.
Our production labor needs fluctuate throughout the year. During periods of peak manufacturing activity it is necessary to sharply increase the number of production staff by utilizing new hires and temporary labor. Production staff that we hire during such periods of peak manufacturing activity may not have the same level of training, competency, experience, or commitment as our regular production employees. In addition, from time to time, we may not have available to us a sufficient pool of experienced and competent individuals to fulfill our production labor requirements on a cost-effective basis. If we are unable to adequately staff our manufacturing operations, particularly during periods of peak manufacturing activity, or if our production staff are not adequately trained or do not adhere to protocols we have established to create a safe workplace, our business, operating results, and reputation could suffer.
Management information systems are critical to our business. If our management information systems or those of our business partners or third party service providers fail to adequately perform, or if we, our business partners, or third party service providers experience an interruption in their operation, our business, reputation, financial condition, and operating results could be adversely affected.
We have many management information systems that are critical to our business, some of which are managed by third parties.
17
These management information systems are used to record, process, summarize, transmit, and store electronic information, and to manage or support a variety of business processes and activities, including, among other things, our accounting and financial functions, including maintaining our internal controls; our manufacturing and supply chain processes; and the data related to our research and development efforts. The failure of our management information systems or those of our business partners or third party service providers to perform properly, or difficulties encountered in the development of new systems or the upgrade of existing systems, could disrupt our business and harm our reputation, which may result in decreased sales, increased overhead costs, excess or obsolete inventory, and product shortages, causing our business, reputation, financial condition, and operating results to suffer. Although we take steps to secure our management information systems and any access provided by our business partners or third party service providers, including our computer systems, intranet and internet sites, email and other telecommunications and data networks, the security measures we have implemented may not be effective and our systems may be vulnerable to theft, loss, damage, and interruption from a number of potential sources and events, including unauthorized access or security breaches, natural or man-made disasters, cyber attacks, computer viruses, phishing, power loss, or other disruptive events. Information technology security threats are increasing in frequency and sophistication. Cyber attacks may be random, coordinated, or targeted, including sophisticated computer crime threats. These threats pose a risk to the security of our systems and networks, and those of our business partners and third party service providers, and to the confidentiality, availability, and integrity of our data. Our business, reputation, operating results, and financial condition could be adversely affected if, as a result of a significant cyber event or otherwise, our operations are disrupted or shutdown; our confidential, proprietary information is stolen or disclosed; our intranet and internet sites are compromised; data is manipulated or destroyed; we incur costs or are required to pay fines in connection with stolen customer, employee, or other confidential information; we must dedicate significant resources to system repairs or increase cyber security protection; or we otherwise incur significant litigation or other costs.
Our reliance upon patents, trademark laws, and contractual provisions to protect our proprietary rights may not be sufficient to protect our intellectual property from others who may sell similar products. Our products may infringe the proprietary rights of others.
We hold patents relating to various aspects of our products and believe that proprietary technical know-how is important to our business and their loss could have a material adverse effect on our business and operating results. Proprietary rights relating to our products are protected from unauthorized use by third parties only to the extent that they are covered by valid and enforceable patents or are maintained in confidence as trade secrets. We cannot be certain that we will be issued any patents from any pending or future patent applications owned by or licensed to us, or that the claims allowed under any issued patents will be sufficiently broad to protect our technology. In the absence of enforceable patent protection, we may be vulnerable to competitors who attempt to copy our products or gain access to our trade secrets and know-how. Others may initiate litigation to challenge the validity of our patents, or allege that we infringe their patents, or they may use their resources to design comparable products that do not infringe our patents. We may incur substantial costs if our competitors or others initiate litigation to challenge the validity of our patents, or allege that we infringe their patents, or if we initiate any proceedings to protect our proprietary rights. If the outcome of any such litigation is unfavorable to us, our business, operating results, and financial condition could be adversely affected. We also cannot be certain that our products or technologies have not infringed or will not infringe the proprietary rights of others. Any such infringement could cause third parties, including our competitors, to bring claims against us, resulting in significant costs, possible damages and substantial uncertainty. We could also be forced to develop an alternative that could be costly and time-consuming, or acquire a license, which we might not be able to do on terms favorable to us, or at all.
We rely on trade secrets and proprietary know-how that we seek to protect, in part, by confidentiality agreements with our employees, suppliers, consultants, and others. These agreements may be breached, and we may not have adequate remedies for any such breach. Even if these confidentiality agreements are not breached, our trade secrets may otherwise become known or be independently developed by competitors.
Our business, properties, and products are subject to governmental regulation with which compliance may require us to incur expenses, or modify our products or operations, and non-compliance may result in harm to our reputation and/or expose us to penalties. Governmental regulation may also adversely affect the demand for some of our products and our operating results.
Our business, properties, and products are subject to numerous international, federal, state, and other governmental laws, rules, and regulations relating to, among other things; climate change; emissions to air, including Tier 4 or similar engine emission requirements; discharges to water; restrictions placed on water usage and water availability; product and associated packaging; use of certain chemicals; restricted substances, including "conflict minerals" disclosure rules; import and export compliance, including country of origin certification requirements; worker and product user health and safety; energy efficiency; product life-cycles; outdoor noise laws; and the generation, use, handling, labeling, collection, management, storage, transportation, treatment, and disposal of hazardous substances, wastes, and other regulated materials. In addition, our business is subject to numerous international, federal, state, and other governmental laws, rules, and regulations that may adversely affect our operating results, including, (i) taxation and tax policy changes, tax rate changes, new tax laws, or revised tax law interpretations, which individually or in combination may cause our effective tax rate to increase, (ii) new, recently enacted, or revised healthcare laws or
18
regulations or, (iii) changes to international trade agreements that could result in additional tariffs, duties or other charges on raw materials, whole goods or components that we import. Although we believe that we are in substantial compliance with currently applicable laws, rules, and regulations, we are unable to predict the ultimate impact of adopted or future laws, rules, and regulations on our business, properties, or products. Any of these laws, rules, or regulations may cause us to incur significant expenses to achieve or maintain compliance, require us to modify our products, adversely affect the price of or demand for some of our products, and ultimately affect the way we conduct our operations. Failure to comply with any of these laws, rules, or regulations could result in harm to our reputation and/or could lead to fines and other penalties, including restrictions on the importation of our products into, and the sale of our products in, one or more jurisdictions until compliance is achieved. In addition, our competitors may adopt strategies with respect to regulatory compliance that differ significantly from our strategies. This may have the effect of changing customer preferences and our markets in ways that we did not anticipate which may adversely affect market demand for our products and, ultimately, our net sales and financial results.
Climate change and climate change regulations may adversely impact our operations.
There is growing concern from members of the scientific community and the general public that an increase in global average temperatures due to emissions of greenhouse gases ("GHG") and other human activities have or will cause significant changes in weather patterns and increase the frequency and severity of natural disasters. We are currently subject to rules limiting emissions and other climate related rules and regulations in certain jurisdictions where we operate. In addition, we may become subject to additional legislation and regulation regarding climate change, and compliance with any new rules could be difficult and costly. Concerned parties, such as legislators, regulators, and non-governmental organizations, are considering ways to reduce GHG emissions. Foreign, federal, state, and local regulatory and legislative bodies have proposed various legislative and regulatory measures relating to climate change, regulating GHG emissions, and energy policies. If such legislation is enacted, we could incur increased energy, environmental, and other costs and capital expenditures to comply with the limitations. Due to uncertainty in the regulatory and legislative processes, as well as the scope of such requirements and initiatives, we cannot currently determine the effect such legislation and regulation may have on our products and operations.
The costs of complying with the various environmental laws related to our ownership and/or lease of real property, such as clean-up costs and liability that may be associated with certain hazardous waste disposal activities, could adversely affect our financial condition and operating results.
Because we own and lease real property, various environmental laws may impose liability on us for the costs of cleaning up and responding to hazardous substances that may have been released on our property, including releases unknown to us. These environmental laws and regulations could also require us to pay for environmental remediation and response costs at third-party locations where we disposed of or recycled hazardous substances. We are currently involved in the evaluation and clean-up of a limited number of properties we either currently or previously owned. Although we do not expect that these current matters will have a material adverse effect on our financial position or operating results, our future costs of complying with the various environmental requirements, as they now exist or may be altered in the future, could adversely affect our financial condition and operating results.
Legislative enactments could impact the competitive landscape within our markets and affect demand for our products.
Various legislative proposals, if enacted, could put us in a competitively advantaged or disadvantaged position and affect customer demand for our products relative to the product offerings of our competitors. For example, any fiscal-stimulus or other legislative enactment that inordinately impacts the lawn and garden, outdoor power equipment, or irrigation industries generally by promoting the purchase, such as through customer rebate or other incentive programs, of certain types of mowing, snow and ice management or irrigation equipment or other products that we sell, could impact us positively or negatively, depending on whether we manufacture products that meet the specified legislative criteria, including in areas such as fuel efficiency, alternative energy or water usage, or if, as a result of such legislation, customers perceive our product offerings to be relatively more or less attractive than our competitors' product offerings. We cannot currently predict whether any such legislation will be enacted, what any such legislation's specific terms and conditions would encompass, how any such legislation would impact the competitive landscape within our markets, or how, if at all, any such legislation might ultimately affect customer demand for our products or our operating results.
We operate in many different jurisdictions and we could be adversely affected by violations of the U.S. Foreign Corrupt Practices Act and similar worldwide anti-corruption laws.
The U.S. Foreign Corrupt Practices Act and similar worldwide anti-corruption laws generally prohibit companies and their intermediaries from making certain improper payments for the purpose of obtaining or retaining business. The continued expansion of our international operations could increase the risk of violations of these laws in the future. Significant violations of these laws, or allegations of such violations, could harm our reputation, could disrupt our business, and could result in significant fines and penalties that could have a material adverse effect on our results of operations or financial condition.
19
We are required to comply with the "conflict minerals" rules promulgated by the SEC, which impose costs on us and could raise reputational and other risks.
As required under the Dodd-Frank Wall Street Reform and Consumer Protection Act, the SEC adopted rules regarding disclosure of the use of certain minerals, known as "conflict minerals," which are mined from the Democratic Republic of the Congo and adjoining countries, as well as procedures regarding manufacturers' efforts to discover the origin of such minerals and metals produced from those minerals. These conflict minerals are commonly referred to as "3TG" and include tin, tantalum, tungsten, and gold. We have, and we expect that we will continue to, incur additional costs and expenses, which may be significant in order to comply with these rules, including for (i) due diligence to determine whether conflict minerals are necessary to the functionality or production of any of our products and, if so, verify the sources of such conflict minerals; and (ii) any changes that we may desire to make to our products, processes, or sources of supply as a result of such diligence and verification activities. Since our supply chain is complex, ultimately we may not be able to sufficiently verify the origin of the conflict minerals used in our products through the due diligence procedures that we implement, which may adversely affect our reputation with our customers, shareholders, and other stakeholders. In such event, we may also face difficulties in satisfying customers who require that all of our products are certified as conflict mineral free. If we are not able to meet such requirements, customers may choose not to purchase our products, which could adversely affect our sales and the value of portions of our inventory. Further, there may be only a limited number of suppliers offering conflict free minerals and, as a result, we cannot be sure that we will be able to obtain metals, if necessary, from such suppliers in sufficient quantities or at competitive prices. Any one or a combination of these various factors could harm our business, reduce market demand for our products, and adversely affect our profit margins, net sales, and overall financial results.
We are subject to product liability claims, product quality issues, and other litigation from time to time that could adversely affect our business, reputation, operating results or financial condition.
The manufacture, sale, and use of our products expose us to significant risks associated with product liability claims. If a product liability claim or series of claims is brought against us for uninsured liabilities or in excess of our insurance coverage, and it is ultimately determined that we are liable, our business could suffer. While we believe that we appropriately instruct our customers on the proper usage of our products, we cannot ensure that they will implement our instructions accurately or completely. If our products are defective or used incorrectly by our customers, injury may result and this could give rise to product liability claims against us or adversely affect our brand image or reputation. Any losses that we may suffer from any liability claims, and the effect that any product liability litigation may have upon the reputation and marketability of our products, may have a negative impact on our business, reputation, and operating results. Product defects can occur through our own product development, design, and manufacturing processes or through our reliance on third parties for certain component design and manufacturing activities. Some of our products or product improvements were developed relatively recently and defects or risks that we have not yet identified, such as unanticipated use of our products, may give rise to product liability claims. Additionally, we could experience a material design, testing, or manufacturing failure in our products, a quality system failure, failures in our products and other challenges that are associated with our inability to properly manage changes in the suppliers and components that we use in our products, insufficient testing procedures, other safety issues, or heightened regulatory scrutiny that could warrant a recall of some of our products. A recall of some of our products could also result in increased product liability claims. Unforeseen product quality problems in the development and production of new and existing products could also result in loss of market share, reduced sales, rework costs, and higher warranty expense.
We are also subject to other litigation from time to time that could adversely affect our business, reputation, operating results or financial condition.
If we are unable to retain our executive officers or other key employees, attract and retain other qualified personnel, or successfully implement executive officer, key employee or other personnel transitions, we may not be able to meet strategic objectives and our business could suffer.
Our ability to meet our strategic objectives and otherwise grow our business will depend to a significant extent on the continued contributions of our leadership team. Our future success will also depend in large part on our ability to identify, attract, and retain other highly qualified managerial, technical, sales and marketing, operations, and customer service personnel. Competition for these individuals is intense, and we may not succeed in identifying, attracting, or retaining qualified personnel. The loss or interruption of services of any of our executive officers or other key employees, the inability to identify, attract, or retain qualified personnel in the future, the inability to successfully implement executive officer, key employee or other personnel transitions, delays in hiring qualified personnel, or any employee work slowdowns, strikes, or similar actions could make it difficult for us to conduct and manage our business and meet key objectives, which could harm our business, financial condition, and operating results.
20
As a result of our Red Iron financing joint venture with TCFIF, we are dependent upon the joint venture to provide competitive inventory financing programs to certain distributors and dealers of our products. Any material change in the availability or terms of credit offered to our customers by the joint venture, challenges or delays in transferring new distributors and dealers from any business we might acquire or otherwise to this financing platform, any termination or disruption of our joint venture relationship or any delay in securing replacement credit sources could adversely affect our net sales and operating results.
We are a party to a financing joint venture with TCFIF for the primary purpose of providing reliable, competitive financing to certain of our distributors and dealers in the U.S. to support their businesses and increase our net sales, as well as to free up our working capital for our other strategic purposes. As a result, we are dependent upon the joint venture for our inventory financing programs. Additionally, we are dependent upon TCFCFC to provide inventory financing to dealers of our products in Canada.
The availability of financing from our joint venture or otherwise will be affected by many factors, including, among others, the overall credit markets, the credit worthiness of our dealers and distributors, and regulations that may affect TCFIF, as the majority owner of the joint venture and a subsidiary of TCF National Bank, a national banking association. Any material change in the availability or terms of credit offered to our customers by the joint venture, challenges or delays in transferring new distributors and dealers from any business we might acquire or otherwise to this financing platform, any termination or disruption of our joint venture relationship or any delay in securing replacement credit sources could adversely affect our sales and operating results.
The terms of our credit arrangements and the indentures governing our senior notes and debentures could limit our ability to conduct our business, take advantage of business opportunities and respond to changing business, market, and economic conditions. Additionally, we are subject to counterparty risk in our credit arrangements.
Our credit arrangements and the indentures governing our 6.625% senior notes and 7.800% debentures include a number of financial and operating restrictions. For example, our credit arrangements contain financial covenants that, among other things, require us to maintain a minimum interest coverage ratio and a maximum debt to earnings ratio. Our credit arrangements and/or indentures also contain provisions that restrict our ability, subject to specified exceptions, to, among other things:
- •
- make loans and investments, including acquisitions and transactions with affiliates;
- •
- create liens or other encumbrances on our assets;
- •
- dispose of assets;
- •
- enter into contingent obligations;
- •
- engage in mergers or consolidations; and
- •
- pay dividends that are significantly higher than those currently being paid, make other distributions to our shareholders, or redeem shares of our common stock.
These provisions may limit our ability to conduct our business, take advantage of business opportunities, and respond to changing business, market, and economic conditions. In addition, they may place us at a competitive disadvantage relative to other companies that may be subject to fewer, if any, restrictions or may otherwise adversely affect our business. Transactions that we may view as important opportunities, such as significant acquisitions, may be subject to the consent of the lenders under our credit arrangements, which consent may be withheld or granted subject to conditions specified at the time that may affect the attractiveness or viability of the transaction.
Although we have in place a $150 million revolving credit facility that does not expire until October 2019, market deterioration or other factors could jeopardize the counterparty obligations of one or more of the banks participating in our revolving credit facility, which could have an adverse effect on our business if we are not able to replace such revolving credit facility or find other sources of liquidity on acceptable terms.
If we are unable to comply with the terms of our credit arrangements and indentures, especially the financial covenants, our credit arrangements could be terminated and our senior notes, debentures, term loan, and any amounts outstanding under our revolving credit facility could become due and payable.
We cannot assure you that we will be able to comply with all of the terms of our credit arrangements and indentures, especially the financial covenants. Our ability to comply with such terms depends on the success of our business and our operating results. Various risks, uncertainties, and events beyond our control could affect our ability to comply with the terms of our credit arrangements and/or indentures. If we were out of compliance with any covenant required by our credit arrangements following any applicable cure periods, the banks could terminate their commitments unless we could negotiate a covenant waiver. The banks could condition such waiver on amendments to the terms of our credit arrangements that may be unfavorable to us. In addition, our 6.625% senior notes, 7.800% debentures, term loan, and any amounts outstanding under our revolving credit facility could become due and payable if we were unable to obtain a covenant waiver or refinance our medium-term debt under our credit arrangements. If our credit rating falls below investment grade and/or our debt to earnings before interest, tax, depreciation, and amortization ("EBITDA") ratio rises above 1.50, the interest rate we currently pay on outstanding debt under our credit arrangements would increase, which could adversely affect our operating results.
We are expanding and renovating our corporate facilities and could experience disruptions to our operations in connection with such efforts.
We are expanding and renovating our corporate facilities, driven by our need to expand the space available for our product
21
development and test capacities, as well as our need for additional information technology and office space. These expansion efforts included the construction of a new corporate facility that was completed in fiscal 2014, and we are renovating our corporate facilities located in Bloomington, Minnesota to accommodate expansion needs of our product development, test, and business capacities. We financed, and expect to continue to finance, such efforts with cash on hand and cash from operating activities. The expansion and renovation of our corporate facilities entail risks that could cause disruption in the operations of our business. Such risks include potential interruption in data flow; unforeseen construction, scheduling, engineering, environmental, or geological problems; and unanticipated cost increases.
Our business is subject to a number of other miscellaneous risks that may adversely affect our operating results, financial condition, or business.
Other miscellaneous risks that could affect our operating results, financial condition, or business include:
- •
- our ability to achieve the revenue growth, operating earnings, and working capital goals of our "Destination PRIME" initiative or any quarterly financial guidance;
- •
- natural or man-made disasters or global pandemics, which may result in shortages of raw materials and components, higher fuel and commodity costs, delays in shipments to customers, and increases in insurance premiums;
- •
- financial viability of distributors and dealers, changes in distributor ownership, changes in channel distribution of our products, relationships with our distribution channel partners, our success in partnering with new dealers and our customers' ability to pay amounts owed to us;
- •
- a decline in retail sales or financial difficulties of our distributors or dealers, which could cause us to repurchase financed product;
- •
- new or revised accounting standards; and
- •
- the threat of terrorist acts and war, which may result in heightened security and higher costs for import and export shipments of components or finished goods, reduced leisure travel, and contraction of the U.S. and worldwide economies.
ITEM 1B. UNRESOLVED STAFF COMMENTS
None.
22
As of October 31, 2016, we utilized manufacturing, distribution, warehouse, and office facilities totaling approximately 6.3 million square feet of space worldwide. We had approximately 72 acres of excess land in Wisconsin adjacent to a distribution center, 70 acres of land in Minnesota utilized as a testing and storage facility, and 21 acres of land in California used as a testing site. Plant utilization varies during the year depending on the production cycle. We consider each of our current facilities to be in good operating condition. Management believes we have sufficient manufacturing capacity for fiscal 2017, although strategies for future operational growth are currently being assessed. We are expanding and renovating our corporate facilities located in Bloomington, Minnesota, which included the construction of a 75,000 square foot facility that was completed in fiscal 2014, renovation of a portion of our original corporate facility that was completed in fiscal 2016 to accommodate additional expansion needs for our product development and test capacities, and future planned renovations in fiscal 2017. Our significant facilities are listed below by location, ownership, and function as of October 31, 2016:
| | | | | |
| Location |
Ownership |
Products Manufactured / Use |
||
|---|---|---|---|---|
| | | | | |
| Bloomington, MN | Owned/Leased | Corporate headquarters, warehouse, and test lab | ||
| El Paso, TX | Owned/Leased | Components for professional and residential products, warehouse and distribution center | ||
| Ankeny, IA | Leased | Residential and professional distribution center | ||
| Juarez, Mexico | Leased | Professional and residential products | ||
| Plymouth, WI | Owned | Professional and residential parts distribution center | ||
| Tomah, WI | Owned/Leased | Professional products and distribution center | ||
| Windom, MN | Owned/Leased | Residential and professional products and warehouse | ||
| Beatrice, NE | Owned/Leased | Professional products, test facility, and office | ||
| Iron Mountain, MI | Owned | Professional products, distribution facility, and office | ||
| Riverside, CA | Owned/Leased | Professional products, test facility, distribution center, and office | ||
| Xiamen City, China | Leased | Professional products, distribution center, and office | ||
| Braeside, Australia | Leased | Distribution center, service area, and office | ||
| Hertfordshire, United Kingdom | Owned | Professional and residential products, distribution center, test lab, and office | ||
| Ploiesti, Romania | Owned | Professional products, distribution center, test lab, and office | ||
| Shakopee, MN | Owned | Components for professional and residential products | ||
| Beverley, Australia | Owned | Professional products, distribution center, service area, and office | ||
| Baraboo, WI | Leased | Professional and residential distribution center | ||
| El Cajon, CA | Owned | Professional and residential products, distribution center, test lab, and office | ||
| Brooklyn Center, MN | Leased | Distribution facility, service area, and office | ||
| Capena, Italy | Leased | Distribution center | ||
| Fresno, CA | Leased | Professional products warehouse | ||
| Sanford, FL | Leased | Professional products and distribution center | ||
| Fiano Romano, Italy | Owned/Leased | Professional products, distribution center, and office | ||
| St. Louis, MO | Leased | Distribution facility, service area, and office | ||
| Oevel, Belgium | Owned | Distribution center, service area, and office | ||
| Abilene, TX | Leased | Office, professional products, and service center | ||
| | | | | |
We are a party to litigation in the ordinary course of business. Litigation occasionally involves claims for punitive, as well as compensatory, damages arising out of the use of our products. Although we are self-insured to some extent, we maintain insurance against certain product liability losses. We are also subject to litigation, administrative, and judicial proceedings with respect to claims involving asbestos and the discharge of hazardous substances into the environment. Some of these claims assert damages and liability for personal injury, remedial investigations or clean-up, and other costs and damages. We are also typically involved in commercial disputes, employment disputes, and patent litigation cases in the ordinary course of business. To prevent possible infringement of our patents by others, we periodically review competitors' products. To avoid potential liability with respect to others' patents, we regularly review certain patents issued by the USPTO and foreign patent offices. We believe these activities help us minimize our risk of being a defendant in patent infringement litigation. We are currently involved in patent litigation cases, including cases by or against competitors, where we are asserting and defending against claims of patent infringement. Such cases are at varying stages in the litigation process.
For a description of our material legal proceedings, see Note 13 of the Notes to Consolidated Financial Statements under the heading "Commitments and Contingent Liabilities – Litigation" included in Item 8, Financial Statements and Supplementary Data of this Annual Report on Form 10-K, which is incorporated into this Item 3 by reference.
23
ITEM 4. MINE SAFETY DISCLOSURES
Not applicable
EXECUTIVE OFFICERS OF THE REGISTRANT
The list below identifies those persons designated by our Board of Directors as executive officers of the company. The list sets forth each such person's age and position with the company as of December 16, 2016, as well as other positions held by him or her for at least the last five years. There are no family relationships between any director, executive officer, or person nominated to become a director or executive officer of the company. There are no arrangements or understandings between any executive officer and any other person pursuant to which he or she was selected as an officer of the company.
| | | |
| Name, Age, and Position |
Business Experience during the Last Five or More Years |
|
|---|---|---|
| | | |
| Richard M. Olson 52, President and Chief Executive Officer |
President and Chief Executive Officer since November 2016. From September 2015 through October 2016, he served as President and Chief Operating Officer. From June 2014 through August 2015, he served as Group Vice President, International Business, Global Micro-Irrigation Business, and Distributor Development. From March 2013 through May 2014, he served as Vice President, International Business. From March 2012 to March 2013, he served as Vice President, Exmark. From September 2010 to March 2012, he served as General Manager, Exmark. | |
| | | |
| Michael J. Hoffman 61, Chairman of the Board |
Chairman of the Board since March 2006. From March 2005 through October 2016, he served as Chief Executive Officer. He served as President from October 2004 through August 2015. | |
| | | |
| David H. Alkire 54, Vice President, Residential and Landscape Contractor Businesses |
Vice President, Residential and Landscape Contractor Businesses since November 2014. From June 2012 through October 2014, he served as General Manager, Residential and Landscape Contractor Businesses. From March 2011 through May 2012, he served as Director, Sourcing. | |
| | | |
| Judy L. Altmaier 55, Vice President, Exmark |
Vice President, Exmark since June 2013. From October 2011 to June 2013, she served as Vice President, Operations and Quality Management. From October 2009 to October 2011, she served as Vice President, Operations. | |
| | | |
| William E. Brown, Jr. 55, Group Vice President, Residential and Contractor Businesses |
Group Vice President, Residential and Contractor Businesses since February 2016. From March 2013 through January 2016, he served as Group Vice President, Commercial and Irrigation Businesses. From March 2012 to March 2013, he served as Group Vice President, International and Commercial Businesses. From August 2010 to March 2012, he served as Vice President, International Business. | |
| | | |
| Philip A. Burkart 54, Vice President, Irrigation and Lighting Businesses |
Vice President, Irrigation and Lighting Businesses since January 2011. | |
| | | |
| Amy E. Dahl 42, Vice President, Human Resources |
Vice President, Human Resources since April 2015. From June 2013 through March 2015, she served as Managing Director, Corporate Communications and Investor Relations. From July 2012 to June 2013, she served as Assistant General Counsel and Assistant Secretary. From November 2008 to July 2012, she served as Director, Corporate Counsel. | |
| | | |
| Timothy P. Dordell 54, Vice President, Secretary and General Counsel |
Vice President, Secretary and General Counsel since May 2007. | |
| | | |
| Blake M. Grams 49, Vice President, Global Operations |
Vice President, Global Operations since June 2013. From December 2008 to June 2013, he served as Vice President, Corporate Controller. | |
| | | |
| Bradley A. Hamilton 52, Vice President, Commercial Business |
Vice President, Commercial since October 2016. From April 2015 to October 2016, he served as General Manager, Commercial. From June 2014 through March 2015, he served as Managing Director, Distributor Development and Financial Services. From March 2012 through May 2014, he served as Director, Distributor Development. From December 2006 to March 2012, he served as Director, Marketing. | |
| | | |
| Thomas J. Larson 59, Vice President, Corporate Controller |
Vice President, Corporate Controller since June 2013. From December 2008 to June 2013, he served as Vice President, Treasurer. He retained the office of Treasurer until July 2013. | |
| | | |
| Renee J. Peterson 55, Vice President, Treasurer and Chief Financial Officer |
Vice President, Treasurer and Chief Financial Officer since July 2013. From August 2011 to July 2013, she served as Vice President, Finance and Chief Financial Officer. In March 2012, she also assumed responsibility for our Information Services function. From July 2009 to August 2011, she served as Vice President – Finance and Planning for the Truck and Automotive Segments of Eaton Corporation, a diversified industrial manufacturer. | |
| | | |
| Darren L. Redetzke 52, Vice President, International Business |
Vice President, International Business since April 2015. From August 2010 to April 2015, he served as Vice President, Commercial Business. | |
| | | |
| Richard W. Rodier 56, Vice President, Sitework Systems Business |
Vice President, Sitework Systems since October 2016. From February 2009 to October 2016, he served as General Manager, Sitework Systems. | |
| | | |
| Kurt D. Svendsen 50, Vice President, Information Services |
Vice President, Information Services since June 2013. From September 2011 to June 2013, he served as Managing Director, Corporate Communications and Investor Relations. | |
| | | |
24
ITEM 5. MARKET FOR REGISTRANT'S COMMON EQUITY, RELATED STOCKHOLDER MATTERS, AND ISSUER PURCHASES OF EQUITY SECURITIES
Our common stock is listed for trading on the New York Stock Exchange and trades under the symbol "TTC." The high, low, and last sales prices for our common stock and cash dividends paid for each of the quarterly periods for fiscal 2016 and 2015 were as follows:
| | | | | | | | | |
| Fiscal year ended October 31, 2016 |
First | Second | Third | Fourth |
||||
| | | | | | | | | |
| Market price per share of common stock1 | ||||||||
High sales price |
$ 39.24 | $ 44.71 | $ 46.50 | $ 49.50 | ||||
Low sales price |
32.35 | 34.79 | 40.42 | 44.90 | ||||
Last sales price |
37.26 | 43.23 | 45.98 | 47.88 | ||||
| Cash dividends per share of common stock1,2 | 0.15 | 0.15 | 0.15 | 0.15 | ||||
| | | | | | | | | |
| | | | | | | | | |
| Fiscal year ended October 31, 2015 |
First | Second | Third | Fourth |
||||
| | | | | | | | | |
| Market price per share of common stock1 | ||||||||
High sales price |
$ 33.74 | $ 35.14 | $ 35.30 | $ 37.91 | ||||
Low sales price |
30.10 | 32.31 | 33.02 | 33.28 | ||||
Last sales price |
32.46 | 33.95 | 34.16 | 37.64 | ||||
| Cash dividends per share of common stock1,2 | 0.125 | 0.125 | 0.125 | 0.125 | ||||
| | | | | | | | | |
- 1
- Per share data and sales prices have been adjusted for all periods presented to reflect the impact of the company's two-for-one stock
split effective September 16, 2016.
- 2
- Future cash dividends will depend upon our financial condition, capital requirements, results of operations, and other factors deemed relevant by our Board of Directors. Restrictions on our ability to pay dividends are disclosed in Item 7, "Management's Discussion and Analysis of Financial Condition and Results of Operations" and Note 6 of the Notes to Consolidated Financial Statements included in Item 8, "Financial Statements and Supplementary Data."
Common Stock – 175,000,000 shares authorized, $1.00 par value, as of October 31, 2016 and 2015. 108,427,393 and 109,301,832 shares outstanding as of October 31, 2016 and 2015, respectively.
Preferred Stock - 1,000,000 voting shares and 850,000 non-voting shares authorized, $1.00 par value, no shares outstanding.
Shareholders - As of December 15, 2016, we had approximately 3,225 shareholders of record.
Purchases of Equity Securities - The following table sets forth information with respect to shares of our common stock purchased by the company during each of the three fiscal months in our fourth quarter ended October 31, 2016.
| | | | | | | | | | | | | | |
| Period | Total Number of Shares Purchased1,2,3,4 |
Average Price Paid per Share1 |
Total Number of Shares Purchased As Part of Publicly Announced Plans or Programs1,2 |
Maximum Number of Shares that May Yet Be Purchased Under the Plans or Programs1,2 |
|||||||||
| | | | | | | | | | | | | | |
| July 30, 2016 through August 26, 2016 | | – | $ | – | | – | | 8,593,922 | |||||
| August 27, 2016 through September 30, 2016 | 532,400 | 47.87 | 532,400 | 8,061,522 | |||||||||
| October 1, 2016 through October, 31 2016 | | 370,502 | | 46.97 | | 368,807 | | 7,692,715 | |||||
| | | | | | | | | | | | | | |
| Total | 902,902 | $ | 47.50 | 901,207 | |||||||||
| | | | | | | | | | | | | | |
| | | | | | | | | | | | | | |
| | | | | | | | | | | | | | |
- 1
- Shares and per share data have been adjusted for all periods presented to reflect the impact of the company's two-for-one stock
split effective September 16, 2016.
- 2
- On
December 11, 2012, the company's Board of Directors authorized the repurchase of 10,000,000 shares of our common stock in open-market or in privately negotiated
transactions. This program has no expiration date but may be terminated by our Board of Directors at any time. The company repurchased 593,922 shares during the period indicated above under this
program and no shares remain available to repurchase under this program.
- 3
- On
December 3, 2015, the company's Board of Directors authorized the repurchase of an additional 8,000,000 shares of the company's common stock in open-market or in
privately negotiated transactions. This program has no expiration date but may be terminated by the company's Board of Directors at any time. The company repurchased 307,285 shares during the period
indicated above under this program and 7,692,715 shares remain available to repurchase under this program.
- 4
- Includes 1,695 units (shares) of our common stock purchased in open-market transactions at an average price of $47.59 per share on behalf of a rabbi trust formed to pay benefit obligations to participants in deferred compensation plans. These 1,695 shares were not repurchased under our repurchase program, described in footnotes 2 and 3 above.
25
The Toro Company Common Stock Comparative Performance Graph
The information contained in The Toro Company Common Stock Comparative Performance Graph section shall not be deemed to be "soliciting material" or "filed" or incorporated by reference in future filings with the SEC, or subject to the liabilities of Section 18 of the Exchange Act, except to the extent that we specifically request that it be treated as soliciting material or incorporate it by reference into a document filed under the Securities Act or the Exchange Act.
The following graph and table depict the cumulative total shareholder return (assuming reinvestment of dividends) on $100 invested in each of Toro common stock, the S&P 500 Index, and an industry peer group for the five-year period from October 31, 2011 through October 31, 2016. Data has been adjusted for all periods presented to reflect the impact of the company's two-for-one stock split effective September 16, 2016.
COMPARISON OF 5 YEAR CUMULATIVE TOTAL RETURN*
Among The Toro Company, the S&P 500 Index,
and Peer Group
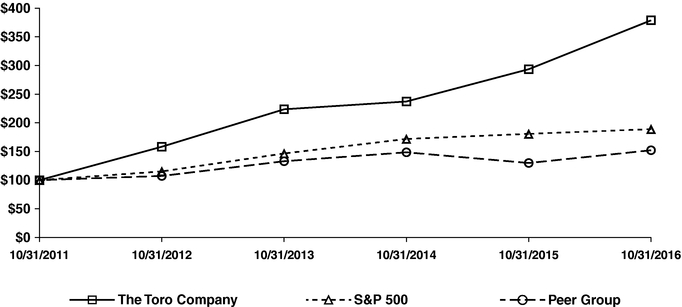
*$100 invested on 10/31/11 in stock or index, including reinvestment of dividends.
Fiscal years ending October 31.
| | | | | | | | | | | | | | | | | | | | |
Fiscal year ending October 31 |
2011 | 2012 | 2013 | 2014 | 2015 | 2016 |
|||||||||||||
| | | | | | | | | | | | | | | | | | | | |
The Toro Company |
$ | 100.00 | $ | 158.25 | $ | 223.57 | $ | 237.16 | $ | 293.49 | $ | 378.74 | |||||||
S&P 500 |
100.00 | 115.21 | 146.52 | 171.82 | 180.75 | 188.90 | |||||||||||||
Peer Group |
| 100.00 | | 107.27 | | 132.98 | | 148.53 | | 129.87 | | 152.10 | |||||||
| | | | | | | | | | | | | | | | | | | | |
The industry peer group is based on companies previously included in the Fortune 500 Industrial and Farm Equipment Index, which was discontinued after 2002 and currently includes: AGCO Corporation, The Alpine Group, Briggs & Stratton Corporation, Caterpillar Inc., Crane Co., Cummins Inc., Deere & Company, Dover Corporation, Flowserve Corporation, General Cable Corporation, Harsco Corporation, Illinois Tool Works Inc., International Game Technology Plc, ITT Inc., Kennametal Inc., Lennox International Inc., NACCO Industries, Inc., Parker-Hannifin Corporation, Pentair Plc, Snap-On Inc., Teleflex Inc., Terex Corporation, The Timken Company, and Walter Energy Inc.
26
ITEM 6. SELECTED FINANCIAL DATA
The following table presents our selected financial data for each of the fiscal years in the five-year period ended October 31, 2016. The table should be read in conjunction with Item 7, "Management's Discussion and Analysis of Financial Condition and Results of Operations," and Item 8, "Financial Statements and Supplementary Data," of this Annual Report on Form 10-K.
| | | | | | | | | | | | | | | | | |
| (Dollars in thousands, except per share data) Fiscal years ended October 31 |
20161 | 20151 | 2014 | 2013 | 2012 | |||||||||||
| | | | | | | | | | | | | | | | | |
| OPERATING RESULTS: | | | | | | |||||||||||
Net sales |
$ | 2,392,175 | $ | 2,390,875 | $ | 2,172,691 | $ | 2,041,431 | $ | 1,958,690 | ||||||
Net sales growth from prior year |
| 0.1% | | 10.0% | | 6.4% | | 4.2% | | 4.0% | ||||||
Gross profit as a percentage of net sales |
36.6% | 35.0% | 35.6% | 35.5% | 34.4% | |||||||||||
Selling, general, and administrative expense as a percentage of net sales |
| 22.6% | | 22.5% | | 23.5% | | 24.2% | | 23.9% | ||||||
Operating earnings |
$ | 334,396 | $ | 299,114 | $ | 263,157 | $ | 230,662 | $ | 205,613 | ||||||
As a percentage of net sales |
| 14.0% | | 12.5% | | 12.1% | | 11.3% | | 10.5% | ||||||
Net earnings |
$ | 230,994 | $ | 201,591 | $ | 173,870 | $ | 154,845 | $ | 129,541 | ||||||
As a percentage of net sales |
| 9.7% | | 8.4% | | 8.0% | | 7.6% | | 6.6% | ||||||
Basic net earnings per share2 |
$ | 2.10 | $ | 1.81 | $ | 1.54 | $ | 1.34 | $ | 1.09 | ||||||
Diluted net earnings per share2 |
$ | 2.06 | $ | 1.78 | $ | 1.51 | $ | 1.31 | $ | 1.07 | ||||||
Return on average stockholders' equity |
43.0% | 44.7% | 45.3% | 46.1% | 44.7% | |||||||||||
| SUMMARY OF FINANCIAL POSITION: | | | | | | |||||||||||
Total assets |
$ | 1,387,518 | $ | 1,303,658 | $ | 1,192,415 | $ | 1,002,748 | $ | 935,199 | ||||||
Average net working capital as a percentage of net sales3 |
| 15.9% | | 16.0% | | 15.1% | | 16.6% | | 15.2% | ||||||
Long-term debt, including current portion |
$ | 353,907 | $ | 377,952 | $ | 353,956 | $ | 223,544 | $ | 225,340 | ||||||
Stockholders' equity |
$ | 550,035 | $ | 462,165 | $ | 408,727 | $ | 358,738 | $ | 312,402 | ||||||
Debt-to-capitalization ratio |
39.2% | 45.0% | 47.8% | 38.4% | 41.9% | |||||||||||
| CASH FLOW DATA: | | | | | | |||||||||||
Cash provided by operating activities |
$ | 361,942 | $ | 236,869 | $ | 182,365 | $ | 221,876 | $ | 185,798 | ||||||
Repurchases of Toro common stock |
$ | 111,999 | $ | 106,964 | $ | 103,039 | $ | 99,587 | $ | 93,395 | ||||||
Cash dividends per share of Toro common stock2 |
$ | 0.60 | $ | 0.50 | $ | 0.40 | $ | 0.28 | $ | 0.22 | ||||||
| OTHER STATISTICAL DATA: | | | | | | |||||||||||
Market price range: |
||||||||||||||||
High sales price2 |
$ | 49.50 | $ | 37.91 | $ | 33.68 | $ | 29.75 | $ | 21.18 | ||||||
Low sales price2 |
$ | 32.35 | $ | 30.10 | $ | 27.88 | $ | 20.12 | $ | 12.94 | ||||||
Average number of employees |
| 6,834 | | 6,682 | | 5,979 | | 5,002 | | 5,066 | ||||||
| | | | | | | | | | | | | | | | | |
- 1
- The
company's consolidated financial statements include results of the BOSS business from November 14, 2014, the date of acquisition.
- 2
- Per
share data and sales prices have been adjusted for all periods presented to reflect the impact of the company's two-for-one stock splits
effective September 16, 2016 and June 29, 2012.
- 3
- Average net working capital is defined as monthly average net accounts receivable plus net inventory less accounts payable.
ITEM 7. MANAGEMENT'S DISCUSSION AND ANALYSIS OF FINANCIAL CONDITION AND RESULTS OF OPERATIONS
This Management's Discussion and Analysis of Financial Condition and Results of Operations ("MD&A") is intended to provide a reader of our financial statements with a narrative from the perspective of management on our financial condition, results of operations, liquidity and certain other factors that may affect our future results. Unless expressly stated otherwise, the comparisons presented in this MD&A refer to the prior fiscal year. Statements that are not historical are forward-looking and involve risks and uncertainties, including those discussed in Part I, Item 1A, "Risk Factors" and elsewhere in this report. These risks could cause our actual results to differ materially from any future performance suggested below.
OVERVIEW
The Toro Company is in the business of designing, manufacturing, and marketing professional turf maintenance equipment and services, turf irrigation systems, landscaping equipment and lighting products, snow and ice management products, agricultural micro-irrigation systems, rental and specialty construction equipment, and residential yard and snow thrower products. We sell our products worldwide through a network of distributors, dealers, hardware retailers, home centers, mass retailers, and online. Our businesses are organized into three reportable business segments: Professional, Residential, and Distribution. Our Distribution segment, which consists of our company-owned domestic distributorship, has been combined with our corporate activities and is shown as "Other." We strive to provide innovative, well-built, and dependable products supported by an extensive
27
service network. A significant portion of our net sales has historically been, and we expect will continue to be, attributable to new and enhanced products. We define new products as those introduced in the current and previous two fiscal years. Shares and per share data have been adjusted for all periods presented to reflect the impact of our two-for-one stock split effective September 16, 2016.
Summary of Fiscal 2016 Results
In fiscal 2016, we achieved net sales of $2,392.2 million and net earnings growth of 14.6 percent. Our fiscal 2016 results included the following items of significance:
- •
- Net sales for fiscal 2016 increased by 0.1 percent compared to fiscal 2015 to $2,392.2 million. Foreign currency exchange rate fluctuations negatively impacted our net sales growth by 1.3 percent. The sales increase was primarily attributable to strong demand of our Professional segment products including the successful introduction of new innovative products, primarily offset by lower Residential segment sales driven mainly by decreased pre-season snow products demand.
- •
- Professional segment net sales grew 4.0 percent in fiscal 2016 compared to fiscal 2015. Sales increased primarily from strong demand for our golf and landscape contractor equipment, increased product placement of our micro-irrigation products, along with continued growth in our rental and specialty construction businesses.
- •
- Residential segment net sales decreased 7.8 percent in fiscal 2016 compared to fiscal 2015, primarily due to lower sales of snow products and decreased shipments of zero-turn radius riding mowers, partially offset by increased shipments of walk power mowers.
- •
- International net sales for fiscal 2016 decreased by 5.1 percent compared to fiscal 2015 mainly due to changes in foreign currency exchange rates that reduced our total net sales by approximately $30.6 million in fiscal 2016. International net sales comprised 24.2 percent of our total consolidated net sales in fiscal 2016 compared to 25.5 percent in fiscal 2015 and 28.7 percent in fiscal 2014. These declines were primarily the result of foreign currency exchange rate changes.
- •
- Fiscal 2016 net earnings of $231.0 million increased 14.6 percent compared to fiscal 2015, and diluted net earnings per share increased 15.7 percent to $2.06 in fiscal 2016 compared to $1.78 in fiscal 2015.
- •
- Gross margin was 36.6 percent in fiscal 2016, an increase of 160 basis points from 35.0 percent in fiscal 2015. This increase was primarily the result of favorable commodity costs and enhanced productivity, as well as favorable segment mix.
- •
- Selling, general, and administrative ("SG&A") expense was up 0.6 percent in fiscal 2016 compared to fiscal 2015, or up 10 basis points to 22.6 percent.
- •
- Receivables decreased by 7.8 percent as of the end of fiscal 2016 compared to the end of fiscal 2015 primarily as a result of more receivables financed through Red Iron. Our inventory levels were down by 8.2 percent as of the end of fiscal 2016 compared to the end of fiscal 2015 primarily due to focused production planning in the latter half of fiscal 2016. Average net working capital (net accounts receivable plus net inventory less trade payables) as a percent of net sales was 15.9 percent as of the end of fiscal 2016 compared to 16.0 percent as of the end of fiscal 2015. Our domestic field inventory levels were up as of the end of fiscal 2016 compared to the end of fiscal 2015, primarily due to higher levels in the Professional segment with higher retail demand and anticipated strong retail of new products in fiscal 2017.
- •
- We continued our history of paying quarterly cash dividends in fiscal 2016. We increased our fiscal 2016 quarterly cash dividend by 20 percent to $0.15 per share compared to our quarterly cash dividend in fiscal 2015 of $0.125 per share.
- •
- Our stock repurchase program returned $112.0 million to our shareholders during fiscal 2016, which reduced our number of shares outstanding. This reduction resulted in a benefit to our diluted net earnings per share of $0.03 per share in fiscal 2016 compared to fiscal 2015.
Our current multi-year initiative, "Destination PRIME," began our journey into our second century. Similar to our previous Destination 2014 initiative, this three-year initiative is intended to help us drive revenue and earnings growth and further improve productivity, while also continuing our century-long commitment to innovation, relationships, and excellence. Through our Destination PRIME initiative, we will strive to achieve our goals by pursuing a progression of milestones for organic revenue growth, operating earnings, and working capital.
Organic Revenue Growth. We intend to pursue strategic growth of our existing businesses and product categories with an annual organic revenue growth goal. The organic revenue growth goal of our Destination PRIME initiative is to achieve at least five percent organic revenue growth each fiscal year of this initiative. We define organic revenue growth as the increase in net sales, less net sales from acquisitions that occurred in the prior twelve-month period. In both fiscal 2016 and fiscal 2015, we fell short of this goal by achieving 0.1 percent and 4.1 percent organic revenue growth, respectively.
Operating Earnings. The operating earnings goal is to raise operating earnings as a percentage of net sales to 13 percent or higher by the end of fiscal 2017. In fiscal 2016, we achieved this goal as we realized 14.0 percent of operating earnings as a percentage of net sales. In fiscal 2015, we realized 12.5 percent of operating earnings as a percentage of net sales.
Working Capital. The working capital goal of our Destination PRIME initiative is to drive down average net working capital as
28
a percentage of net sales to 13 percent or lower by the end of fiscal 2017. In fiscal 2016 and fiscal 2015, our average net working capital as a percentage of net sales was 15.9 percent and 16.0 percent, respectively.
RESULTS OF OPERATIONS
Fiscal 2016 net earnings were $231.0 million compared to $201.6 million in fiscal 2015, an increase of 14.6 percent. Fiscal 2016 diluted net earnings per share were $2.06, an increase of 15.7 percent from $1.78 per share in fiscal 2015. The primary factors contributing to the net earnings increase were gross margin improvement and a decrease in our effective tax rate. However, these improvements were partially offset by an increase in our SG&A expense. Our net earnings per diluted share were also benefited by $0.03 per share in fiscal 2016 compared to fiscal 2015 as a result of reduced shares outstanding from repurchases of our common stock.
Fiscal 2015 net earnings were $201.6 million compared to $173.9 million in fiscal 2014, an increase of 15.9 percent. Fiscal 2015 diluted net earnings per share were $1.78, an increase of 17.5 percent from $1.51 per share in fiscal 2014. The primary factors contributing to the net earnings improvement were higher net sales, leveraging fixed SG&A costs over higher sales volumes, and a decrease in our effective tax rate. However, these improvements were partially offset by a decline in our gross margin rate and an increase in interest expense. Our net earnings per diluted share were also benefited by $0.03 per share in fiscal 2015 compared to fiscal 2014 as a result of reduced shares outstanding from repurchases of our common stock.
The following table summarizes our results of operations as a percentage of our consolidated net sales.
| | | | | | | | | | |
Fiscal years ended October 31 |
2016 | 2015 | 2014 | ||||||
| | | | | | | | | | |
Net sales |
| 100.0% | | 100.0% | | 100.0% | |||
Cost of sales |
(63.4) | (65.0) | (64.4) | ||||||
| | | | | | | | | | |
Gross margin |
| 36.6 | | 35.0 | | 35.6 | |||
SG&A expense |
(22.6) | (22.5) | (23.5) | ||||||
| | | | | | | | | | |
Operating earnings |
| 14.0 | | 12.5 | | 12.1 | |||
Interest expense |
(0.8) | (0.8) | (0.7) | ||||||
Other income, net |
| 0.6 | | 0.4 | | 0.4 | |||
Provision for income taxes |
(4.1) | (3.7) | (3.8) | ||||||
| | | | | | | | | | |
Net earnings |
| 9.7% | | 8.4% | | 8.0% | |||
| | | | | | | | | | |
Fiscal 2016 Compared with Fiscal 2015
Net Sales. Worldwide net sales in fiscal 2016 were $2,392.2 million compared to $2,390.9 million in fiscal 2015, an increase of 0.1 percent. This net sales change was attributable to the following factors:
- •
- Increased sales of Professional segment products were driven by higher shipments and demand of golf, landscape contractor, and rental and specialty equipment products primarily due to continued market growth and increased demand for our innovative product offerings and the successful introduction of new products. Micro-irrigation and irrigation product sales also increased mainly due to improved product placement and higher project sales. However, sales of snow and ice management products were down primarily due to decreased pre-season demand.
- •
- Decreased sales of Residential segment products were mainly driven by lower sales and pre-season retail demand of snow thrower products, decreased shipments of zero-turn radius riding mowers, and unfavorable weather conditions in many of our markets. However, sales of our walk power mowers increased mainly due to strong shipments driven by our innovative product offerings and favorable growing season weather in key markets.
- •
- Our overall net sales in international markets decreased by 5.1 percent in fiscal 2016 compared to fiscal 2015 due to unfavorable foreign currency exchange rate fluctuations that reduced our total net sales by approximately $30.6 million in fiscal 2016.
Gross Margin. Gross margin represents gross profit (net sales less cost of sales) as a percentage of net sales. See Note 1 of the Notes to Consolidated Financial Statements, in the section entitled "Cost of Sales," for a description of expenses included in cost of sales. Gross margin increased by 160 basis points to 36.6 percent in fiscal 2016 from 35.0 percent in fiscal 2015. This increase was mainly the result of the following factors:
- •
- Lower costs to purchase commodities, primarily steel and resin, and productivity improvements.
- •
- Segment mix from a higher mix of Professional segment product sales.
Somewhat offsetting those positive factors were unfavorable foreign currency exchange rate fluctuations.
Selling, General, and Administrative Expense. SG&A expense increased $3.4 million, or 0.6 percent, in fiscal 2016 compared to fiscal 2015. See Note 1 of the Notes to Consolidated Financial Statements, in the section entitled "Selling, General, and Administrative Expense," for a description of expenses included in SG&A expense. SG&A expense rate represents SG&A expense as a percentage of net sales. SG&A expense rate in fiscal 2016 increased 10 basis points to 22.6 percent compared to 22.5 percent in fiscal 2015. The increase in SG&A expense was driven primarily by the following factors:
- •
- Continued investments in engineering and new product development that resulted in higher expense of $3.8 million.
- •
- Increased warranty expense of $3.1 million driven by higher claims experience for the year.
- •
- Higher direct marketing expense of $2.2 million mainly due to increased media spend and paid commissions.
29
Somewhat offsetting those increases were:
- •
- Decreased administrative expense of $3.4 million.
- •
- Decreased incentive expense of $3.3 million due to actual performance against specified goals.
Interest Expense. Interest expense for fiscal 2016 increased $0.6 million compared to fiscal 2015.
Other Income, Net. Other income, net consists mainly of our proportionate share of income or losses from equity investments (affiliates), currency exchange rate gains and losses, litigation settlements and recoveries, interest income, and retail financing revenue. Other income for fiscal 2016 was $15.4 million compared to $10.7 million in fiscal 2015, an increase of $4.7 million. The increase in other income, net was primarily due to foreign currency contract exchange gains of $1.8 million, a fiscal 2016 litigation recovery of $1.3 million, and higher earnings from our equity investment in Red Iron of $1.2 million.
Provision for Income Taxes. The effective tax rate for fiscal 2016 was 30.1 percent compared to 30.7 percent in fiscal 2015. The decrease was primarily the result of more favorable one-time adjustments related to prior years, and the permanent extension of the federal research credit.
Fiscal 2015 Compared with Fiscal 2014
Net Sales. Worldwide net sales in fiscal 2015 were $2,390.9 million compared to $2,172.7 million in fiscal 2014, an increase of 10.0 percent. This net sales change was attributable to the following factors:
- •
- Increased sales of Professional segment products driven by the acquisition of the BOSS business which resulted in incremental net sales of $128.5 million for fiscal 2015. In addition, our Professional segment net sales were positively impacted by higher shipments of landscape contractor and rental and specialty equipment products due to continued market growth and increased demand for our innovative product offerings and newly introduced products. However, sales of irrigation products were down primarily due to unfavorable weather conditions in key markets, and sales of micro-irrigation products were lower due to unfavorable foreign currency exchange rates and continued adverse political and economic conditions in key international markets.
- •
- Increased sales of Residential segment products due to strong shipments and demand for our newly introduced zero-turn radius riding and walk power mower products and expanded product placement. However, Residential segment net sales in Australia were down due to unfavorable foreign currency exchange rate changes.
- •
- Our overall net sales in international markets slightly decreased by 1.9 percent in fiscal 2015 compared to fiscal 2014 due to unfavorable foreign currency exchange rate fluctuations that reduced our total net sales by approximately $47 million in fiscal 2015.
Gross Margin. Gross margin decreased by 60 basis points to 35.0 percent in fiscal 2015 from 35.6 percent in fiscal 2014. This decline was mainly the result of the following factors:
- •
- Unfavorable foreign currency exchange rate movements.
- •
- Purchase accounting impact of the incremental charge for the sale of inventory that was written-up to fair value as a result of the acquisition of the BOSS business.
Somewhat offsetting those negative factors were:
- •
- Improved price realization.
- •
- Costs for a supplier component rework issue that impacted certain walk power mowers in fiscal 2014 that was not repeated in fiscal 2015.
Selling, General, and Administrative Expense. SG&A expense increased $26.7 million, or 5.2 percent, in fiscal 2015 compared to fiscal 2014. SG&A expense rate in fiscal 2015 decreased 100 basis points to 22.5 percent compared to 23.5 percent in fiscal 2014 due to fixed SG&A costs spread over higher sales volumes. However, the increase in SG&A expense of $26.7 million was driven mainly by the following factors:
- •
- Incremental SG&A expense of $19 million from the BOSS business.
- •
- Increased administrative expenses of $7 million.
- •
- Investments in engineering and new product development that resulted in higher expense of $2 million.
Interest Expense. Interest expense for fiscal 2015 increased $3.3 million compared to fiscal 2014 due to higher levels of debt as a result of borrowings that were used to pay the purchase price for the BOSS business.
Other Income, Net. Other income for fiscal 2015 was $10.7 million compared to $8.7 million in fiscal 2014, an increase of $2.0 million. This increase in other income, net was primarily due to higher earnings from our equity investment in Red Iron of $1.1 million and lower foreign currency exchange rate losses of $0.7 million in fiscal 2015 compared to fiscal 2014.
Provision for Income Taxes. The effective tax rate for fiscal 2015 was 30.7 percent compared to 32.2 percent in fiscal 2014. The decrease in the effective tax rate was attributable to the benefit in the first quarter of fiscal 2015 for the retroactive re-enactment of the federal research credit for calendar 2014 and higher earnings in lower tax jurisdictions.
30
PERFORMANCE BY BUSINESS SEGMENT
As more fully described in Note 12 of the Notes to Consolidated Financial Statements, we operate in three reportable business segments: Professional, Residential, and Distribution. Our Distribution segment, which consists of our company-owned domestic distributorship, has been combined with our corporate activities and is shown as "Other." Operating earnings for our Professional and Residential segments are defined as earnings from operations plus other income, net. Operating loss for the Other segment includes earnings (loss) from our wholly owned domestic distribution companies, corporate activities, other income, and interest expense. The following information provides perspective on our business segments' net sales and operating results.
Professional segment net sales represented 71 percent of consolidated net sales for fiscal 2016, 69 percent for fiscal 2015, and 68 percent for fiscal 2014. The following table shows the Professional segment net sales, operating earnings, and operating earnings as a percent of net sales.
| | | | | | | | | | |
(Dollars in millions) |
2016 | 2015 | 2014 | ||||||
| | | | | | | | | | |
Net sales |
$ | 1,705.3 | $ | 1,639.7 | $ | 1,477.6 | |||
% change from prior year |
4.0% | 11.0% | 3.7% | ||||||
Operating earnings |
$ | 352.1 | $ | 308.0 | $ | 276.3 | |||
As a percent of net sales |
20.6% | 18.8% | 18.7% | ||||||
| | | | | | | | | | |
Net Sales. Worldwide net sales for the Professional segment in fiscal 2016 were up by 4.0 percent compared to fiscal 2015 primarily as a result of the following factors:
- •
- Higher shipments of golf equipment and irrigation products, mainly due to demand for our innovative product offerings, the successful introduction of new products, increased golf irrigation projects, and favorable weather conditions.
- •
- Increased sales of landscape contractor equipment driven by strong demand of our riding and stand-on mower product lines.
- •
- Higher sales of micro-irrigation products which were mainly driven by improved product placement.
- •
- Increased sales driven by strong demand and market growth for rental and specialty construction equipment, as well as positive customer response for new products.
Somewhat offsetting those positive factors were:
- •
- Unfavorable foreign currency exchange rate fluctuations.
- •
- A decline in sales of snow and ice management products which was driven mainly from decreased pre-season demand.
Our domestic field inventory levels of our Professional segment products were higher as of the end of fiscal 2016 compared to the end of fiscal 2015 due, primarily to anticipated strong shipments of new product introductions and higher retail demand.
Worldwide net sales for the Professional segment in fiscal 2015 were up by 11.0 percent compared to fiscal 2014 primarily as a result of the following factors:
- •
- Incremental sales from the acquisition of the BOSS business of $128.5 million.
- •
- Higher shipments of landscape contractor equipment, including new and enhanced products, as contractors continued to invest in turf maintenance equipment.
- •
- Increased sales driven by strong demand and market growth for rental and specialty construction equipment, as well as positive customer response for new products we introduced in that market.
Somewhat offsetting those positive factors were:
- •
- Unfavorable foreign currency exchange rate fluctuations.
- •
- A decline in sales of irrigation products due to unfavorable weather conditions in key markets.
- •
- Lower sales of micro-irrigation products due to unfavorable foreign currency exchange rate fluctuations and continued adverse political and economic conditions in key international markets.
Operating Earnings. Operating earnings for the Professional segment in fiscal 2016 increased 14.3 percent compared to fiscal 2015, primarily due to higher sales volumes, higher gross margin, and lower SG&A expense. Expressed as a percentage of net sales, Professional segment operating margins increased by 180 basis points to 20.6 percent in fiscal 2016 compared to 18.8 percent in fiscal 2015. The following factors impacted Professional segment operating earnings as a percentage of net sales for fiscal 2016:
- •
- Higher gross margin in fiscal 2016 compared to fiscal 2015 mainly due to lower commodity costs and productivity improvements, as well as favorable product mix, partially offset by unfavorable foreign currency exchange rate fluctuations.
- •
- A decline in SG&A expense rate in fiscal 2016 compared to fiscal 2015 due to lower administration costs.
Operating earnings for the Professional segment in fiscal 2015 increased 11.5 percent compared to fiscal 2014 primarily due to higher sales volumes. Expressed as a percentage of net sales, Professional segment operating margins slightly increased by 10 basis points to 18.8 percent in fiscal 2015 compared to 18.7 percent in fiscal 2014. The following factors impacted Professional segment operating earnings as a percentage of net sales for fiscal 2015:
- •
- Lower gross margin in fiscal 2015 compared to fiscal 2014 mainly due to unfavorable foreign currency exchange rate movements and the purchase accounting impact for the acquisition of the BOSS business, as previously discussed.
- •
- A decline in SG&A expense rate in fiscal 2015 compared to fiscal 2014 due to further leveraging fixed SG&A costs over higher sales volumes.
31
Residential segment net sales represented 28 percent of consolidated net sales for fiscal 2016, 30 percent for fiscal 2015, and 31 percent for fiscal 2014.
The following table shows the Residential segment net sales, operating earnings, and operating earnings as a percent of net sales.
| | | | | | | | | | |
(Dollars in millions) |
2016 | 2015 | 2014 | ||||||
| | | | | | | | | | |
Net sales |
$ | 669.1 | $ | 725.7 | $ | 672.4 | |||
% change from prior year |
(7.8)% | 7.9% | 13.1% | ||||||
Operating earnings |
$ | 73.7 | $ | 85.0 | $ | 76.9 | |||
As a percent of net sales |
11.0% | 11.7% | 11.4% | ||||||
| | | | | | | | | | |
Net Sales. Worldwide net sales for the Residential segment in fiscal 2016 were down by 7.8 percent compared to fiscal 2015 primarily as a result of the following factors:
- •
- Decreased shipments and lower retail demand of snow products due to low snowfall totals in the 2015/2016 season.
- •
- Lower sales of zero-turn radius riding mowers primarily driven by variable weather conditions throughout the year and a slight reduction in retail placement.
- •
- Unfavorable weather conditions in many of our markets.
Somewhat offsetting the decrease in Residential segment net sales were higher sales of walk power mowers driven by increased demand for our product offerings and strong customer response for our innovative models, including our SMARTSTOW® and all-wheel drive models.
Our domestic field inventory levels of our Residential segment products were lower as of the end of fiscal 2016 compared to the end of fiscal 2015 primarily due to decreased pre-season snow thrower product channel demand for the 2016-2017 winter season and inventory sell-through of walk power mowers from a strong fall growing season.
Worldwide net sales for the Residential segment in fiscal 2015 were up by 7.9 percent compared to fiscal 2014 primarily as a result of the following factors:
- •
- Increased shipments driven by strong retail demand and additional product placement for our new platform of zero-turn radius riding mowers.
- •
- Higher sales of walk power mowers due to enhanced product placement and increased demand for our product offerings, including our new all-wheel drive model.
Somewhat offsetting the increase in Residential segment net sales was a decline in sales in Australia from unfavorable foreign currency exchange rate fluctuations.
Operating Earnings. Operating earnings for the Residential segment in fiscal 2016 decreased 13.3 percent compared to fiscal 2015. Expressed as a percentage of net sales, Residential segment operating margins decreased 70 basis points to 11.0 percent in fiscal 2016 compared to 11.7 percent in fiscal 2015. The following factors impacted Residential segment operating earnings:
- •
- Higher gross margin in fiscal 2016 compared to fiscal 2015 mainly due to lower commodity costs and freight expense, partially offset by unfavorable foreign currency exchange rate fluctuations.
- •
- Increased SG&A expense rate attributable to lower sales as well as increased engineering, marketing and warehousing expenses.
Operating earnings for the Residential segment in fiscal 2015 increased 10.5 percent compared to fiscal 2014. Expressed as a percentage of net sales, Residential segment operating margins increased 30 basis points to 11.7 percent in fiscal 2015 compared to 11.4 percent in fiscal 2014. The following factors impacted Residential segment operating earnings:
- •
- Lower gross margins primarily from unfavorable foreign currency exchange rate fluctuations and increased manufacturing expenses.
- •
- Lower SG&A expense rate attributable to further leveraging of fixed SG&A costs over higher sales volumes.
Other segment net sales, which includes our company-owned domestic distributors, represented 1 percent of consolidated net sales for each of fiscal 2016, 2015, and 2014. During the first quarter of fiscal 2016, we sold our Northwestern U.S. distribution company. The following table shows the other segment net sales and operating losses.
| | | | | | | | | | |
(Dollars in millions) |
2016 | 2015 | 2014 |
||||||
| | | | | | | | | | |
Net sales |
$ | 17.7 | $ | 25.5 | $ | 22.7 | |||
% change from prior year |
(30.6)% | 12.6% | 4.2% | ||||||
Operating losses |
$ | (95.3) | $ | (101.9) | $ | (96.8) | |||
| | | | | | | | | | |
Net Sales. Net sales for the Other segment includes sales from our wholly owned domestic distribution companies less sales from the Professional and Residential segments to those distribution companies. The Other segment net sales in fiscal 2016 were down $7.8 million compared to fiscal 2015, primarily due to the sale of our Northwestern U.S. distribution company.
The Other segment net sales in fiscal 2015 were up by $2.8 million compared to fiscal 2014 due to higher sales volumes driven by strong demand for golf and grounds equipment at our company-owned distribution companies.
Operating Loss. Operating loss for the Other segment in fiscal 2016 decreased by 6.5 percent compared to fiscal 2015. This loss
32
decrease was primarily attributable to increased income from our investment in Red Iron and a fiscal 2016 litigation settlement recovery.
Operating loss for the Other segment in fiscal 2015 increased by 5.3 percent compared to fiscal 2014. This loss increase was primarily attributable to an increase in interest expense and higher administrative expenses.
FINANCIAL CONDITION
During fiscal 2016, our average net working capital (net accounts receivable plus net inventory less accounts payable) as a percentage of net sales decreased slightly mainly due to lower average net receivables and higher average accounts payable levels. As of the end of fiscal 2016, our average net working capital decreased to 15.9 percent compared to 16.0 percent as of the end of fiscal 2015.
The following table highlights several key measures of our working capital performance.
| | | | | | | |
| (Dollars in millions) Fiscal years ended October 31 |
2016 | 2015 |
||||
| | | | | | | |
| Average cash and cash equivalents | $ | 194.3 | $ | 108.7 | ||
| Average receivables, net | $ | 205.7 | $ | 219.9 | ||
| Average inventories, net | $ | 375.0 | $ | 356.2 | ||
| Average accounts payable | $ | 199.4 | $ | 193.9 | ||
| Average days outstanding for receivables | | 31.4 | | 33.6 | ||
| Average inventory turnover (times) | 4.05 | 4.36 | ||||
| | | | | | | |
The following factors impacted our working capital:
- •
- Average net receivables decreased by 6.5 percent in fiscal 2016 compared to fiscal 2015 as more receivables were financed through Red Iron. Our average days outstanding for receivables decreased to 31.4 days in fiscal 2016 compared to 33.6 days in fiscal 2015.
- •
- Average inventories increased by 5.3 percent in fiscal 2016 compared to fiscal 2015. Inventory levels as of the end of fiscal 2016 compared to the end of fiscal 2015 were down by $27.5 million, or 8.2 percent, primarily due to efforts to reduce high inventory levels in early fiscal 2016 through focused production planning in the latter half of fiscal 2016.
- •
- Average accounts payable increased by 2.9 percent in fiscal 2016 compared to fiscal 2015, mainly due to initiatives to increase days payables outstanding, which included extending payment terms with suppliers.
In fiscal 2017, we plan to place increased emphasis on improving asset utilization with a focus on reducing the amount of working capital in the supply chain, adjusting production plans, and maintaining or improving order replenishment and service levels to end users. We anticipate our average net working capital as a percentage of net sales in fiscal 2017 to decrease as compared to fiscal 2016. We plan to place continued importance on managing our average receivables and payables. Additionally, we expect improvements in our average inventory levels primarily driven by increased focus and coordination between our businesses and operations.
Capital Expenditures and Other Long-Term Assets
Fiscal 2016 capital expenditures of $50.7 million were lower by $5.7 million compared to fiscal 2015. This decrease was primarily attributable to the fiscal 2015 renovation of a portion of our original corporate facility to accommodate additional expansion needs for our product development and test capacities. Capital expenditures for fiscal 2017 are planned to be approximately $65 million as we plan to invest in new product tooling, new technology in production processes and equipment, replacement of production equipment, and investments in new and existing facilities.
Long-term assets as of October 31, 2016 were $608.5 million compared to $631.1 million as of October 31, 2015, a decrease of $22.6 million. This decrease was driven mainly by amortization expense of intangible assets and decreases in deferred tax assets. Included in long-term assets as of October 31, 2016 was goodwill in the amount of $194.8 million. Based on our annual impairment analysis, we determined there was no goodwill impairment for any of our reporting units as their related fair values were substantially in excess of their carrying values.
Cash flows provided by/(used in) operating, investing, and financing activities during the past three fiscal years are shown in the following table.
| | | | | | | | | | |
| (Dollars in millions) | Cash Provided by (/Used in) | ||||||||
| Fiscal years ended October 31 | 2016 | 2015 | 2014 |
||||||
| | | | | | | | | | |
| Operating activities | $ | 361.9 | $ | 236.9 | $ | 182.4 | |||
| Investing activities | (39.1) | (250.3) | (65.7) | ||||||
| Financing activities | | (170.4) | | (173.4) | | 17.0 | |||
| Effect of exchange rates on cash | (5.1) | (1.8) | (1.8) | ||||||
| | | | | | | | | | |
| Net cash (decrease) increase | $ | 147.3 | $ | (188.6) | $ | 131.9 | |||
| | | | | | | | | | |
| Cash and cash equivalents as of fiscal year end | $ | 273.6 | $ | 126.3 | $ | 314.9 | |||
| | | | | | | | | | |
Cash Flows from Operating Activities. Our primary source of funds is cash generated from operations. In fiscal 2016, cash provided by operating activities increased $125.1 million, or 52.8 percent, from fiscal 2015. This increase was mainly due to lower net receivables as more net receivables were financed through Red Iron and favorable movement in net inventories from focused production planning in the latter half of fiscal 2016.
In fiscal 2015, cash provided by operating activities increased $54.5 million, or 29.9 percent, from fiscal 2014. This increase was mainly due to higher net earnings and a smaller increase in working capital needs, as well as higher accounts payable and accrued liabilities.
33
Cash Flows from Investing Activities. Capital expenditures and acquisitions are a significant use of our capital resources. These investments are intended to enable sales growth in new and expanding markets, help us to meet product demand, and increase our manufacturing efficiencies and capacity. Cash used in investing activities in fiscal 2016 decreased $211.2 million from fiscal 2015 due to cash utilized in fiscal 2015 for the acquisition of the BOSS business and lower purchases of property, plant, and equipment, partially offset by increased distributions from our joint venture with Red Iron and proceeds from the sale of our Northwestern distribution company in fiscal 2016.
Cash used in investing activities in fiscal 2015 increased $184.6 million from fiscal 2014 due to cash utilized for the acquisition of the BOSS business, partially offset by lower purchases of property, plant, and equipment.
Cash Flows from Financing Activities. Cash used in financing activities in fiscal 2016 was $170.4 million compared $173.4 million in fiscal 2015. The decrease in cash used in financing activities was mainly due to favorable benefits from stock-based compensation and less cash utilized for repayments of debt in fiscal 2016 compared fiscal 2015. Partially offsetting this decrease was an increase in cash dividends paid on our common stock and higher amounts of cash utilized for common stock repurchases in fiscal 2016 compared to fiscal 2015.
Cash used in financing activities in fiscal 2015 was $173.4 million compared to cash provided by financing activities of $17.0 million in fiscal 2014. The increase in cash used in financing activities was mainly due to repayments of debt in fiscal 2015 compared to cash received from borrowings of debt in fiscal 2014. Additionally, an increase in cash dividends paid on our common stock and higher amounts of cash utilized for stock repurchases in fiscal 2015 compared to fiscal 2014 contributed to the increase in cash used in financing activities.
Cash and Cash Equivalents. Cash and cash equivalents as of the end of fiscal 2016 were higher by $147.3 million compared to the end of fiscal 2015.
Liquidity and Capital Resources
Our businesses are seasonally working capital intensive and require funding for purchases of raw materials used in production, replacement parts inventory, payroll and other administrative costs, capital expenditures, establishment of new facilities, expansion and renovation of existing facilities, as well as for financing receivables from customers that are not financed with Red Iron. Our accounts receivable balances historically increase between January and April as a result of typically higher sales volumes and extended payment terms made available to our customers, and typically decrease between May and December when payments are received. We believe that the funds available through existing financing arrangements and forecasted cash flows will be sufficient to provide the necessary capital resources for our anticipated working capital needs, capital expenditures, investments, debt repayments, quarterly cash dividend payments, and common stock repurchases for at least the next twelve months. As of October 31, 2016, cash and short-term investments held by our foreign subsidiaries that are not available to fund domestic operations unless repatriated were $105.5 million. We currently do not intend to repatriate this cash held by our foreign subsidiaries; however, if circumstances changed and these funds were needed for our U.S. operations, we would be required to accrue and pay U.S. taxes to repatriate these funds. Determination of the unrecognized deferred tax liability related to these earnings is not practicable because of the complexities with its hypothetical calculation.
Seasonal cash requirements are financed from operations, cash on hand, and with short-term financing arrangements, including our $150.0 million unsecured senior five-year revolving credit facility that expires in October 2019. Included in our $150.0 million revolving credit facility is a $20.0 million sublimit for standby letters of credit and a $20.0 million sublimit for swingline loans. At our election, and with the approval of the named borrowers on the revolving credit facility and the election of the lenders to fund such increase, the aggregate maximum principal amount available under the facility may be increased by an amount up to $100.0 million in aggregate. Funds are available under the revolving credit facility for working capital, capital expenditures, and other lawful purposes, including, but not limited to, acquisitions and stock repurchases. Interest expense on this credit line is determined based on a LIBOR rate (or other rates quoted by the Administrative Agent, Bank of America, N.A.) plus a basis point spread defined in the credit agreement. In addition, our non-U.S. operations maintain unsecured short-term lines of credit in the aggregate amount of $9.1 million. These facilities bear interest at various rates depending on the rates in their respective countries of operation. As of October 31, 2016 and October 31, 2015 we had no outstanding short-term debt under these lines of credit. As of October 31, 2016, we had $9.0 million of outstanding letters of credit and $150.8 million of unutilized availability under our credit agreements.
Additionally, as of October 31, 2016, we had $353.9 million outstanding in long-term debt that includes $100.0 million of 7.8% debentures due June 15, 2027, $123.7 million of 6.625% senior notes due May 1, 2037, $19.7 million due to the former owners of the BOSS business, and $110.5 million in an outstanding term loan. The term loan bears interest based on a LIBOR rate (or other rates quoted by the Administrative Agent, Bank of America, N.A.) plus a basis point spread defined in the credit agreement. The term loan can be repaid in part or in full at any time without penalty, but in any event must be paid in full by October 2019.
34
Our revolving and term loan credit facility contains standard covenants, including, without limitation, financial covenants, such as the maintenance of minimum interest coverage and maximum debt to earnings before interest, tax, depreciation, and amortization ("EBITDA") ratios; and negative covenants, which among other things, limit loans and investments, disposition of assets, consolidations and mergers, transactions with affiliates, restricted payments, contingent obligations, liens, and other matters customarily restricted in such agreements. Most of these restrictions are subject to certain minimum thresholds and exceptions. Under the revolving credit facility, we are not limited in the amount for payments of cash dividends and common stock repurchases as long as our debt to EBITDA ratio from the previous quarter compliance certificate is less than or equal to 3.25, provided that immediately after giving effect of any such proposed action, no default or event of default would exist. As of October 31, 2016, we were not limited in the amount for payments of cash dividends and stock repurchases. We were in compliance with all covenants related to our credit agreement for our revolving credit facility as of October 31, 2016, and we expect to be in compliance with all covenants during fiscal 2017. If we were out of compliance with any covenant required by this credit agreement following the applicable cure period, the banks could terminate their commitments unless we could negotiate a covenant waiver from the banks. In addition, our long-term senior notes, debentures, term loan, and any amounts outstanding under the revolving credit facility could become due and payable if we were unable to obtain a covenant waiver or refinance our short-term debt under our credit agreement. If our credit rating falls below and our debt to EBITDA ratio rises above 1.50, the basis point spread over LIBOR (or other rates quoted by the Administrative Agent, Bank of America, N.A.) we currently pay on outstanding debt under the credit agreement would increase. However, the credit commitment could not be cancelled by the banks based solely on a ratings downgrade. Our debt rating for long-term unsecured senior, non-credit enhanced debt was unchanged during fiscal 2016 by Standard and Poor's Ratings Group at BBB and by Moody's Investors Service at Baa3.
The following table details the components of our total capitalization and debt-to-capitalization ratio.
| | | | | | | |
(Dollars in millions) |
2016 | 2015 |
||||
| | | | | | | |
Short-term debt |
$ | — | $ | 0.2 | ||
Long-term debt, including current portion |
353.9 | 378.0 | ||||
Stockholders' equity |
| 550.0 | | 462.2 | ||
Debt-to-capitalization ratio |
39.2% | 45.0% | ||||
| | | | | | | |
Our debt-to-capitalization ratio decreased in fiscal 2016 compared to fiscal 2015 primarily due to an increase in stockholders' equity from higher net earnings and repayments of our long-term debt, partially offset by an increase in dividends paid and repurchases of our common stock in fiscal 2016 as compared to fiscal 2015.
Each quarter in fiscal 2016, our Board of Directors declared a cash dividend of $0.15 per share, which was a 20 percent increase over our cash dividend of $0.125 per share paid each quarter in fiscal 2015. As announced on December 8, 2016, our Board of Directors increased our fiscal 2017 first quarter cash dividend by 16.7 percent to $0.175 per share from the quarterly cash dividend paid in the first quarter of fiscal 2016.
On August 18, 2016, we announced that our Board of Directors declared a two-for-one stock split of our common stock, effected in the form of a 100 percent stock dividend. The stock split dividend was distributed or paid on September 16, 2016, to stockholders of record as of September 1, 2016. As a result of this action, 54.5 million shares were issued to stockholders of record as of September 1, 2016. The par value of the common stock remains at $1.00 per share and, accordingly, approximately $54.5 million was transferred from retained earnings to common stock. Earnings and dividends declared per share and weighted average shares outstanding are presented in this report after the effect of the 100 percent stock dividend. The two-for-one stock split is reflected in the share amounts in all periods presented in this report.
During fiscal 2016, we continued repurchasing shares of our common stock in the open market, thereby reducing our shares outstanding. In addition, our repurchase program provided shares for use in connection with our equity compensation plans. As of October 31, 2016, 7,692,715 shares remained available for repurchase under our Board authorization. We expect to continue repurchasing shares of our common stock in fiscal 2017, depending upon market conditions.
35
The following table provides information with respect to repurchases of our common stock during the past three fiscal years.
| | | | | | | | | | | |
(Dollars in millions, except share and per share data) |
||||||||||
Fiscal years ended October 31 |
2016 | 2015 | 2014 |
|||||||
| | | | | | | | | | | |
Shares of common stock purchased1,2 |
| 2,560,567 | | 3,122,358 | | 3,245,138 | ||||
Cost to repurchase common stock1,2 |
$ | 107.5 | $ | 106.0 | $ | 101.7 | ||||
Average price paid per share1,2 |
$ | 41.99 | $ | 33.94 | $ | 31.33 | ||||
| | | | | | | | | | | |
- 1
- Share and per share data have been adjusted for all periods presented to reflect the impact of our two-for-one stock split effective
September 16, 2016.
- 2
- Does not include shares of our common stock surrendered by employees to satisfy minimum tax withholding obligations upon vesting of restricted stock granted under our stock-based compensation plans.
Customer Financing Arrangements
Wholesale Financing. We are party to a joint venture with TCFIF, established as Red Iron, the primary purpose of which is to provide inventory financing to certain distributors and dealers of our products in the U.S. that enables them to carry representative inventories of our products. Under a separate arrangement, TCFCFC provides inventory financing to dealers of our products in Canada. Under these financing arrangements, down payments are not required and, depending on the finance program for each product line, finance charges are incurred by us, shared between us and the distributor and/or the dealer, or paid by the distributor or dealer. Red Iron retains a security interest in the distributors' and dealers' financed inventories, and those inventories are monitored regularly. Financing terms to the distributors and dealers require payment as the equipment, which secures the indebtedness, is sold to customers or when payment terms become due, whichever occurs first. Rates are generally indexed to LIBOR plus a fixed percentage that differs based on whether the financing is for a distributor or dealer. Rates may also vary based on the product that is financed. Red Iron financed $1,713.6 million of new receivables for dealers and distributors during fiscal 2016, of which $371.1 million was outstanding as of October 31, 2016.
Some independent international dealers continue to finance their products with a third-party financing company. This third-party financing company purchased $28.9 million of receivables from us during fiscal 2016, of which $12.3 million was outstanding as of October 31, 2016.
We enter into limited inventory repurchase agreements with third party financing companies and Red Iron for receivables financed by them. As of October 31, 2016, we were contingently liable to repurchase up to a maximum amount of $10.4 million of inventory related to receivables under these financing arrangements. We have repurchased immaterial amounts of inventory from third party financing companies and Red Iron over the past three fiscal years. However, a decline in retail sales or financial difficulties of our distributors or dealers could cause this situation to change and thereby require us to repurchase financed product up to but not exceeding our limited obligation, which could have an adverse effect on our operating results.
We continue to provide financing in the form of open account terms to home centers and mass retailers; general line irrigation dealers; international distributors and dealers other than the Canadian distributors and dealers to whom Red Iron provides financing arrangements; micro-irrigation dealers and distributors; government customers; and rental companies.
End-User Financing. We have agreements with third party financing companies to provide lease-financing options to golf course and sports fields and grounds equipment customers in the U.S. and select countries in Europe. The purpose of these agreements is to increase sales by giving buyers of our products alternative financing options when purchasing our products. We have no contingent liabilities for residual value or credit collection risk under these agreements with third party financing companies.
From time to time, we enter into agreements where we provide recourse to third-party finance companies in the event of default by the customer for lease payments to the third-party finance company. Our maximum exposure for credit collection under those arrangements as of October 31, 2016 was $4.9 million.
Termination or any material change to the terms of our end-user financing arrangements, availability of credit for our customers, including any delay in securing replacement credit sources, or significant financed product repurchase requirements could have a material adverse impact on our future operating results.
Distributor Financing. From time to time, we enter into long-term loan agreements with some distributors. These transactions are used for expansion of the distributors' businesses, acquisitions, refinancing working capital agreements, or facilitation of ownership changes. As of October 31, 2016, we had an outstanding note receivable in the amount of $0.9 million, which is included in other current and long-term assets on our consolidated balance sheet.
36
Off-Balance Sheet Arrangements and Contractual
Obligations
The following table summarizes our contractual obligations as of October 31, 2016.
| | | | | | | | | | | |
| Payments Due by Period | ||||||||||
| | | | | | | | | | | |
| (Dollars in thousands) Contractual Obligations |
Less Than 1 Year |
1-3 Years |
3-5 Years |
More than 5 Years |
Total |
|||||
| | | | | | | | | | | |
| Long-term debt1 | $ 22,484 | $ 107,693 | $ — | $ 223,730 | $ 353,907 | |||||
| Interest payments2 | 18,990 | 37,236 | 32,163 | 172,210 | 260,599 | |||||
| Deferred compensation arrangements3 | 531 | 618 | — | — | 1,149 | |||||
| Purchase obligations4 | 5,140 | — | — | — | 5,140 | |||||
| Operating leases5 | 15,002 | 25,137 | 20,622 | 35,375 | 96,136 | |||||
| Other6 | 3,001 | 159 | — | — | 3,160 | |||||
| | | | | | | | | | | |
| Total | $ 65,148 | $ 170,843 | $ 52,785 | $ 431,315 | $ 720,091 | |||||
| | | | | | | | | | | |
- 1
- Principal payments in accordance with our credit facilities and long-term debt agreements.
- 2
- Interest
payments for outstanding long-term debt obligations. Interest on variable rate debt was calculated using the interest rate as of October 31, 2016.
- 3
- The
unfunded deferred compensation arrangements, covering certain current and retired management employees, consist primarily of salary and bonus deferrals under our
deferred compensation plans. Our estimated distributions in the contractual obligations table are based upon a number of assumptions including termination dates and participant elections.
- 4
- Purchase
obligations represent contracts or commitments for the purchase of raw materials.
- 5
- Operating
lease obligations do not include payments to property owners covering real estate taxes and common area maintenance.
- 6
- Payment obligations in connection with renovations of our corporate facilities located at Bloomington, Minnesota and corporate information technology payment obligations.
As of October 31, 2016, we also had $9.0 million in outstanding letters of credit issued, including standby letters of credit and import letters of credit, during the normal course of business, as required by some vendor contracts, as well as $4.9 million in surety bonds, which include workers compensation self-insured bonds. In addition to the contractual obligations described in the preceding table, we may be obligated for additional net cash outflows related to $5.1 million of unrecognized tax benefits, including interest and penalties. The payment and timing of any such payments is affected by the ultimate resolution of the tax years that are under audit or remain subject to examination by the relevant taxing authorities.
We have off-balance sheet arrangements with Red Iron, our joint venture with TCFIF, and TCFCFC in which inventory receivables for certain dealers and distributors are financed by Red Iron or TCFCFC. More information regarding the terms and our arrangements with Red Iron and TCFCFC are disclosed herein under Item 7, "Management's Discussion and Analysis of Financial Condition and Results of Operations" and Note 3 of the Notes to Consolidated Financial Statements included in Item 8, "Financial Statements and Supplementary Data."
Due to the nature and scope of our operations, we are subject to exposures that arise from fluctuations in interest rates, foreign currency exchange rates, and commodity prices. We are also exposed to equity market risk pertaining to the trading price of our common stock. Additional information is presented in Part II, Item 7A, "Quantitative and Qualitative Disclosures about Market Risk," and Note 14 of the Notes to Consolidated Financial Statements.
We are subject to the effects of inflation, deflation, and changing prices. During fiscal 2016, we experienced lower average commodity prices compared to the average prices paid for commodities in fiscal 2015. We intend to continue to closely follow prices of commodities and components that affect our product lines, and we anticipate average prices paid for some commodities and components to be slightly higher in fiscal 2017 as compared to fiscal 2016. Historically, we have mitigated, and we expect that we would continue to mitigate, commodity price increases, if any, in part, by collaborating with suppliers, reviewing alternative sourcing options, substituting materials, engaging in internal cost reduction efforts, and increasing prices on some of our products, all as appropriate.
CRITICAL ACCOUNTING POLICIES AND ESTIMATES
In preparing our consolidated financial statements in conformity with U.S. generally accepted accounting principles ("GAAP"), we must make decisions that impact the reported amounts of assets, liabilities, revenues and expenses, and related disclosures. Such decisions include the selection of the appropriate accounting principles to be applied and the assumptions on which to base accounting estimates. In reaching such decisions, we apply judgments based on our understanding and analysis of the relevant circumstances, historical experience, and actuarial valuations. Actual amounts could differ from those estimated at the time the consolidated financial statements are prepared.
Our significant accounting policies are described in Note 1 of the Notes to Consolidated Financial Statements. Some of those significant accounting policies require us to make difficult subjective or complex judgments or estimates. An accounting estimate is considered to be critical if it meets both of the following criteria: (i) the estimate requires assumptions about matters that are highly uncertain at the time the accounting estimate is made, and (ii) different estimates reasonably could have been used, or changes in the estimate that are reasonably likely to occur from period to period may have a material impact on the presentation of our financial condition, changes in financial condition, or results of operations. Our critical accounting estimates include the following:
Warranty Reserve. Warranty coverage on our products is generally for specified periods of time and on select products' hours of usage, and generally covers parts, labor, and other expenses for non-maintenance repairs. Warranty coverage generally does not cover operator abuse or improper use. At the time of sale, we
37
accrue a warranty reserve by product line for estimated costs in connection with future warranty claims. We also establish reserves for major rework campaigns. The amount of our warranty reserves is based primarily on the estimated number of products under warranty, historical average costs incurred to service warranty claims, the trend in the historical ratio of claims to sales, and the historical length of time between the sale and resulting warranty claim. We periodically assess the adequacy of our warranty reserves based on changes in these factors and record any necessary adjustments if actual claim experience indicates that adjustments are necessary. Actual claims could be higher or lower than amounts estimated, as the number and value of warranty claims can vary due to such factors as performance of new products, significant manufacturing or design defects not discovered until after the product is delivered to customers, product failure rates, and higher or lower than expected service costs for a repair. We believe that analysis of historical trends and knowledge of potential manufacturing or design problems provide sufficient information to establish a reasonable estimate for warranty claims at the time of sale. However, since we cannot predict with certainty future warranty claims or costs associated with servicing those claims, our actual warranty costs may differ from our estimates. An unexpected increase in warranty claims or in the costs associated with servicing those claims would result in an increase in our warranty accrual and a decrease in our net earnings.
Sales Promotions and Incentives. At the time of sale to a customer, we record an estimate for sales promotion and incentive costs that are classified as a reduction from gross sales or as a component of SG&A expense. Examples of sales promotion and incentive programs include off-invoice discounts, rebate programs, volume discounts, retail financing support, commissions, and other sales discounts and promotional programs. The estimates for sales promotion and incentive costs are based on the terms of the arrangements with customers, historical payment experience, field inventory levels, volume purchases, and expectations for changes in relevant trends in the future. Actual results may differ from these estimates if competitive factors dictate the need to enhance or reduce sales promotion and incentive accruals or if customer usage and field inventory levels vary from historical trends. Adjustments to sales promotions and incentive accruals are made from time to time as actual usage becomes known in order to properly estimate the amounts necessary to generate consumer demand based on market conditions as of the balance sheet date.
Goodwill and Other Intangibles. Identifiable intangible assets are amortized over their useful lives, unless the useful life is determined to be indefinite. The useful life of an identifiable intangible asset is based on an analysis of several factors, including contractual, regulatory or legal obligations, demand, competition, and industry trends. Goodwill and indefinite-life intangible assets are not amortized, but are tested at least annually for impairment and whenever events or changes in circumstances indicate that impairment may have occurred.
Our impairment testing for goodwill is performed separately from our impairment testing of indefinite-life intangible assets, and the income approach is utilized for both. We test goodwill for impairment at the reporting unit level. Under the income approach, we calculate the fair value of our reporting units and indefinite-life intangible assets using the present value of future cash flows. Individual indefinite-life intangible assets are tested by comparing the book values of each asset to the estimated fair value. Our estimate of fair value for indefinite-life intangible assets uses projected revenues from our forecasting process, assumed royalty rates, and a discount rate. Assumptions used in our impairment evaluations, such as forecasted growth rates and cost of capital, are consistent with internal projections and operating plans. Materially different assumptions regarding future performance of our businesses or a different weighted-average cost of capital could result in impairment losses or additional amortization expense.
In conducting the goodwill impairment test, we first perform a qualitative assessment to determine whether it is more likely than not the fair value of any reporting unit is less than its carrying amount. If we conclude that this is the case, a two-step quantitative test for goodwill impairment is performed. In conducting the initial qualitative assessment, we analyze actual and projected growth trends for net sales, gross margin, and earnings for each reporting unit, as well as historical versus planned performance. Additionally, each reporting unit assesses critical areas that may impact its business, including macroeconomic conditions, market-related exposures, competitive changes, new or discontinued products, changes in key personnel, or any other potential risks to projected financial results. All assumptions used in the qualitative assessment require significant judgment.
If performed due to impairment indicators or the amount of time since the last analysis, the quantitative goodwill impairment test is a two-step process. First, we compare the carrying value of a reporting unit, including goodwill, to its fair value. The fair value of each reporting unit is estimated using a discounted cash flow model. Where available, and as appropriate, comparable market multiples and our company's market capitalization are also used to corroborate the results of the discounted cash flow models. If the first step indicates the carrying value exceeds the fair value of the reporting unit, then a second step must be completed in order to determine the amount of goodwill impairment that should be recorded. In the second step, the implied fair value of the reporting unit's goodwill is determined by allocating the reporting unit's fair value to all of its assets and liabilities other than goodwill. The implied fair value of the goodwill that results from the application of this second step is then compared to the carrying amount of the goodwill and an impairment charge is recorded for the difference.
38
Inventory Valuation. We value our inventories at the lower of the cost of inventory or net realizable value, with cost determined by either the last-in, first-out ("LIFO") method for most U.S. inventories or the first-in, first-out ("FIFO") method for all other inventories. We establish reserves for excess, slow moving, and obsolete inventory based on inventory levels, expected product life, and forecasted sales demand. Valuation of inventory can also be affected by significant redesign of existing products or replacement of an existing product by an entirely new generation product. In assessing the ultimate realization of inventories, we are required to make judgments as to future demand requirements compared with inventory levels. Reserve requirements are developed according to our projected demand requirements based on historical demand, competitive factors, and technological and product life cycle changes. It is possible that an increase in our reserve may be required in the future if there is a significant decline in demand for our products and we do not adjust our production schedule accordingly.
We record a reserve for inventory shrinkage. Our inventory shrinkage reserve represents anticipated physical inventory losses that are recorded based on historical loss trends, ongoing cycle-count and periodic testing adjustments, and inventory levels.
Though management considers reserve balances adequate and proper, changes in economic conditions in specific markets in which we operate could have an effect on the reserve balances required for excess, slow moving and obsolete inventory.
New Accounting Pronouncements to be Adopted
In May 2014, the Financial Accounting Standards Board ("FASB") issued Accounting Standards Update ("ASU") No. 2014-09, Revenue from Contracts with Customers that updates the principles for recognizing revenue. The core principle of the guidance is that an entity should recognize revenue to depict the transfer of promised goods or services to customers in an amount that reflects the consideration to which the entity expects to be entitled to in exchange for those goods or services. The guidance provides a five-step analysis of transactions to determine when and how revenue is recognized. The guidance also requires enhanced disclosures regarding the nature, amount, timing, and uncertainty of revenue and cash flows arising from an entity's contracts with customers. In August 2015, the FASB issued ASU No. 2015-14, Revenue from Contracts with Customers (Topic 606), which deferred the effective date of this standard by one year. We expect to adopt this guidance on November 1, 2018, as required, based on the new effective date. The guidance permits the use of either a retrospective or cumulative effect transition method. We have not yet selected a transition method but plan to select a transition method no later than the fourth quarter of our fiscal 2017. We are currently assessing our contracts with customers and related financial disclosures to evaluate the impact of the amended guidance on our existing revenue recognition policies and procedures.
In April 2015, the FASB issued ASU No. 2015-03, Interest – Imputation of Interest (Subtopic 835-30): Simplifying the Presentation of Debt Issuance Costs. This guidance requires that debt issuance costs related to a recognized debt liability be presented in the balance sheet as a direct deduction from the carrying amount of the related debt liability. The amended guidance will become effective for us commencing in the first quarter of fiscal 2017. Early adoption is permitted. We anticipate the adoption of this guidance will not have a material impact on our consolidated financial position.
In April 2015, the FASB issued ASU No. 2015-05, Customer's Accounting for Fees Paid in a Cloud Computing Arrangement. This amended guidance requires customers to determine whether or not an arrangement contains a software license element. If the arrangement contains a software element, the related fees paid should be accounted for as an acquisition of a software license. If the arrangement does not contain a software license, it is accounted for as a service contract. The amended guidance will become effective for us commencing in the first quarter of fiscal 2017. Early adoption is permitted. We anticipate the adoption of this guidance will not have a material impact on our consolidated financial statements.
In July 2015, the FASB issued ASU No. 2015-11, Inventory (Topic 330): Simplifying the Measurement of Inventory. This amended guidance changes the measurement principle for inventory from the lower of cost or market to lower of cost and net realizable value. The amended guidance will become effective for us commencing in the first quarter of fiscal 2018. Early adoption is permitted. We are currently evaluating the impact of this amended guidance on our consolidated financial statements.
In February 2016, the FASB issued ASU 2016-02, Leases, which, among other things, requires lessees to recognize most leases on-balance sheet. The standard requires the recognition of lease assets and lease liabilities by lessees for those leases classified as operating leases under previous GAAP. The amended guidance will become effective for us commencing in the first quarter of fiscal 2020. Entities are required to use a modified retrospective approach, with early adoption permitted. We are reviewing the revised guidance and assessing the impact on our consolidated financial statements.
In March 2016, the FASB issued ASU No. 2016-09, Stock-based Compensation: Improvements to Employee Share-based Payment Accounting, which simplifies several aspects of the accounting for share-based payment transactions, including the accounting for income taxes, forfeitures, statutory tax withholding requirements, and statement of cash flow classification. The amended guidance will become effective for us commencing in the first quarter of fiscal 2018. Early adoption is permitted. We plan to early adopt this amended guidance in the first quarter of our fiscal 2017 and are currently evaluating the impact of this new standard on our
39
consolidated financial statements, including the impact on our provision for income taxes on our consolidated income statement. Adoption of this amended guidance will add increased volatility to our provision for income taxes mainly due to timing of stock option exercises, vesting of restricted stock units and common stock price.
In August 2016, the FASB issued ASU No. 2016-15, Statement of Cash Flows (Topic 230): Classification of Certain Cash Receipts and Cash Payments, which amends guidance on the classification of certain cash receipts and payments in the statement of cash flows. The amended guidance will become effective for us commencing in the first quarter of fiscal 2019. Early adoption is permitted. We are currently evaluating the impact of this new standard on our consolidated financial statements.
In October 2016, the FASB issued ASU No. 2016-16, Income Taxes (Topic 740): Intra-Entity Transfers of Assets Other Than Inventory, which removes the prohibition against the immediate recognition of the current and deferred tax effects of intra-entity transfers of assets other than inventory. The amended guidance will become effective for us commencing in the first quarter of fiscal 2019. Early adoption is permitted. We are currently evaluating the impact of this new standard on our consolidated financial statements.
In October 2016, the FASB issued ASU No. 2016-17, Consolidation (Topic 810): Interests Held through Related Parties That Are Under Common Control, which amends guidance on related parties that are under common control. The amended guidance will become effective for us commencing in the first quarter of fiscal 2017. Early adoption is permitted. We are currently evaluating the impact of this new standard on our consolidated financial statements.
No other new accounting pronouncement that has been issued but not yet effective for us during fiscal 2016 has had or is expected to have a material impact on our consolidated financial statements.
ITEM 7A. QUANTITATIVE AND QUALITATIVE DISCLOSURES ABOUT MARKET RISK
We are exposed to market risk stemming from changes in foreign currency exchange rates, interest rates, and commodity prices. We are also exposed to equity market risk pertaining to the trading price of our common stock. Changes in these factors could cause fluctuations in our earnings and cash flows. See further discussion on these market risks below.
Foreign Currency Exchange Rate Risk. In the normal course of business, we actively manage the exposure of our foreign currency exchange rate market risk by entering into various hedging instruments, authorized under company policies that place controls on these activities, with counterparties that are highly rated financial institutions. Our hedging activities involve primarily the use of forward currency contracts. We also may utilize cross currency swaps to offset intercompany loan exposures. We use derivative instruments only in an attempt to limit underlying exposure from currency fluctuations and to minimize earnings and cash flow volatility associated with foreign currency exchange rate changes and not for trading purposes. We are exposed to foreign currency exchange rate risk arising from transactions in the normal course of business, such as sales to third party customers, sales and loans to wholly owned foreign subsidiaries, foreign plant operations, and purchases from suppliers. Because our products are manufactured or sourced primarily from the U.S. and Mexico, a stronger U.S. dollar and Mexican peso generally have a negative impact on our results from operations, while a weaker dollar and peso generally have a positive effect. Our primary foreign currency exchange rate exposures are with the Euro, the Australian dollar, the Canadian dollar, the British pound, the Mexican peso, the Japanese yen, the Chinese Renminbi, and the Romanian New Leu against the U.S. dollar, and the Romanian New Leu against the Euro, including exposure as a result of the volatility and uncertainty that may arise as a result of the United Kingdom's vote to exit the European Union.
We enter into various contracts, primarily forward contracts that change in value as foreign currency exchange rates change, to protect the value of existing foreign currency assets, liabilities, anticipated sales, and probable commitments. Decisions on whether to use such contracts are made based on the amount of exposures to the currency involved and an assessment of the near-term market value for each currency. Worldwide foreign currency exchange rate exposures are reviewed monthly. The gains and losses on these contracts offset changes in values of the related exposures. Therefore, changes in values of these hedge instruments are highly correlated with changes in market values of underlying hedged items both at inception of the hedge and over the life of the hedge contract. Further information regarding gains and losses on our derivative instruments is presented in Note 14 of the Notes to Consolidated Financial Statements.
The following foreign currency exchange contracts held by us have maturity dates in fiscal 2017 and 2018. All items are non-trading and stated in U.S. dollars. Some derivative instruments we enter into do not meet cash flow hedge accounting criteria; therefore, changes in fair value are recorded in other income, net.
40
The average contracted rate, notional amount, pre-tax value of derivative instruments in accumulated other comprehensive loss ("AOCL"), and fair value impact of derivative instruments in other income, net as of and for the fiscal year ended October 31, 2016 were as follows:
| | | | | | | | | | | | | | |
| (Dollars in thousands, except average contracted rate) |
Average Contracted Rate |
Notional Amount |
Value in AOCL Income (Loss) |
Fair Value Impact (Loss) Gain |
|||||||||
| | | | | | | | | | | | | | |
| Buy US dollar/Sell Australian dollar | | 0.7367 | $ | 52,023.1 | $ | (818.9 | ) | $ | (1,195.9 | ) | |||
| Buy US dollar/Sell Canadian dollar | 1.3027 | 9,649.4 | 272.7 | 26.6 | |||||||||
| Buy US dollar/Sell Euro | | 1.1225 | | 60,805.6 | | 485.7 | | 1,310.5 | |||||
| Buy US dollar/Sell British pound | 1.3109 | 28,040.6 | 905.7 | 1,736.8 | |||||||||
| Buy Mexican peso/Sell US dollar | | 17.9613 | | 15,962.1 | | (1,038.9 | ) | | (2,596.5 | ) | |||
| | | | | | | | | | | | | | |
Our net investment in foreign subsidiaries translated into U.S. dollars is not hedged. Any changes in foreign currency exchange rates would be reflected as a foreign currency translation adjustment, a component of accumulated other comprehensive loss in stockholders' equity, and would not impact net earnings.
Interest Rate Risk. Our market risk on interest rates relates primarily to LIBOR-based short-term debt and a term loan from commercial banks, as well as the potential increase in fair value of our fixed-rate long-term debt resulting from a potential decrease in interest rates. We generally do not use interest rate swaps to mitigate the impact of fluctuations in interest rates. Included in long-term debt is $223.7 million of fixed-rate debt that is not subject to variable interest rate fluctuations, a fixed-rate promissory note for the principal amount of $19.7 million issued to the former owners of the BOSS business, and a $110.5 million LIBOR-based term loan, which is subject to market risk based on changes in LIBOR rates. We have no earnings or cash flow exposure due to market risks on our fixed-rate long-term debt obligations. As of October 31, 2016, the estimated fair value of long-term debt with fixed interest rates was $293.3 million compared to its carrying amount of $243.4 million. Market risk for fixed-rate, long-term debt is estimated as the potential increase in fair value, resulting from a hypothetical 10 percent decrease in interest rates, and amounts to approximately $14.1 million. The fair value is estimated by discounting the projected cash flows using the rate that similar amounts and terms of debt could currently be borrowed.
Commodity Risk. We are subject to market risk from fluctuating market prices of certain purchased commodity raw materials including steel, aluminum, petroleum and natural gas-based resins, and linerboard. In addition, we are a purchaser of components and parts containing various commodities, including steel, aluminum, copper, lead, rubber, and others that are integrated into our end products. While such materials are typically available from numerous suppliers, commodity raw materials are subject to price fluctuations. We generally buy these commodities and components based upon market prices that are established with the vendor as part of the purchase process. We generally attempt to obtain firm pricing from most of our suppliers for volumes consistent with planned production. To the extent that commodity prices increase and we do not have firm pricing from our suppliers, or our suppliers are not able to honor such prices, we may experience a decline in our gross margins to the extent we are not able to increase selling prices of our products or obtain manufacturing efficiencies to offset increases in commodity costs. Further information regarding rising prices for commodities is presented in Part II, Item 7, "Management's Discussion and Analysis of Financial Condition and Results of Operations" of this report in the section entitled "Inflation." We enter into fixed-price contracts for future purchases of natural gas in the normal course of operations as a means to manage natural gas price risks. In fiscal 2016, our manufacturing facilities entered into these fixed-price contracts for approximately 50 percent of their monthly-anticipated usage.
Equity Price Risk. The trading price volatility of our common stock impacts compensation expense related to our stock-based compensation plans. Further information is presented in Note 10 of the Notes to Consolidated Financial Statements regarding our stock-based compensation plans.
41
Item 8. Financial Statements and Supplementary Data
Management's Report on Internal Control over Financial Reporting
Management is responsible for establishing and maintaining an adequate system of internal control over financial reporting as defined in Rules 13a-15(f) and 15d-15(f) under the Securities Exchange Act of 1934, as amended, for The Toro Company and its subsidiaries. This system is designed to provide reasonable assurance regarding the reliability of financial reporting and the preparation of financial statements for external purposes in accordance with U.S. generally accepted accounting principles.
The company's internal control over financial reporting includes those policies and procedures that (i) pertain to the maintenance of records that, in reasonable detail, accurately and fairly reflect the transactions and dispositions of the assets of the company; (ii) provide reasonable assurance that transactions are recorded as necessary to permit preparation of financial statements in accordance with U.S. generally accepted accounting principles, and that receipts and expenditures of the company are being made only in accordance with authorizations of management and directors of the company; and (iii) provide reasonable assurance regarding prevention or timely detection of unauthorized acquisition, use, or disposition of the company's assets that could have a material effect on the financial statements.
Because of its inherent limitations, internal control over financial reporting may not prevent or detect misstatements, and even when determined to be effective, can only provide reasonable assurance with respect to financial statement preparation and presentation. In addition, projection of any evaluation of the effectiveness of internal control over financial reporting to future periods is subject to the risk that controls may become inadequate because of changes in conditions, or that the degree or compliance with the policies or procedures may deteriorate.
Management, with the participation of the company's President and Chief Executive Officer and Vice President, Treasurer and Chief Financial Officer, evaluated the effectiveness of the company's internal control over financial reporting as of October 31, 2016. In making this evaluation, management used the criteria set forth by the Committee of Sponsoring Organizations of the Treadway Commission in Internal Control – Integrated Framework (2013). Based on this assessment, management concluded that the company's internal control over financial reporting was effective as of October 31, 2016. Our internal control over financial reporting as of October 31, 2016, has been audited by KPMG LLP, an independent registered public accounting firm, as stated in their report, which is included herein.
/s/ Richard M. Olson President and Chief Executive Officer |
||
/s/ Renee J. Peterson Vice President, Treasurer and Chief Financial Officer |
||
December 22, 2016 |
Further discussion of the Company's internal controls and procedures is included in Part II, Item 9A, "Controls and Procedures" of this report.
42
Report of Independent Registered Public Accounting Firm
The
Board of Directors and Stockholders
The Toro Company:
We have audited the accompanying consolidated balance sheets of The Toro Company and subsidiaries (the Company) as of October 31, 2016 and 2015 and the related consolidated statements of earnings, comprehensive income, stockholders' equity, and cash flows for each of the fiscal years in the three-year period ended October 31, 2016. In connection with our audits of the consolidated financial statements, we have audited the financial statement schedule listed in Item 15(a) 2. We have also audited The Toro Company's internal control over financial reporting as of October 31, 2016 based on criteria established in Internal Control – Integrated Framework (2013) issued by the Committee of Sponsoring Organizations of the Treadway Commission (COSO). The Toro Company's management is responsible for these consolidated financial statements and the identified financial statement schedule, for maintaining effective internal control over financial reporting, and for its assessment of the effectiveness of internal control over financial reporting, included in the accompanying Management's Report on Internal Control over Financial Reporting. Our responsibility is to express an opinion on these consolidated financial statements and financial statement schedule and an opinion on the Company's internal control over financial reporting based on our audits.
We conducted our audits in accordance with the standards of the Public Company Accounting Oversight Board (United States). Those standards require that we plan and perform the audits to obtain reasonable assurance about whether the financial statements are free of material misstatement and whether effective internal control over financial reporting was maintained in all material respects. Our audits of the consolidated financial statements and financial statement schedule included examining, on a test basis, evidence supporting the amounts and disclosures in the financial statements, assessing the accounting principles used and significant estimates made by management, and evaluating the overall financial statement presentation. Our audit of internal control over financial reporting included obtaining an understanding of internal control over financial reporting, assessing the risk that a material weakness exists, and testing and evaluating the design and operating effectiveness of internal control based on the assessed risk. Our audits also included performing such other procedures as we considered necessary in the circumstances. We believe that our audits provide a reasonable basis for our opinions.
A company's internal control over financial reporting is a process designed to provide reasonable assurance regarding the reliability of financial reporting and the preparation of financial statements for external purposes in accordance with generally accepted accounting principles. A company's internal control over financial reporting includes those policies and procedures that (1) pertain to the maintenance of records that, in reasonable detail, accurately and fairly reflect the transactions and dispositions of the assets of the company; (2) provide reasonable assurance that transactions are recorded as necessary to permit preparation of financial statements in accordance with generally accepted accounting principles, and that receipts and expenditures of the company are being made only in accordance with authorizations of management and directors of the company; and (3) provide reasonable assurance regarding prevention or timely detection of unauthorized acquisition, use, or disposition of the company's assets that could have a material effect on the financial statements.
Because of its inherent limitations, internal control over financial reporting may not prevent or detect misstatements. Also, projections of any evaluation of effectiveness to future periods are subject to the risk that controls may become inadequate because of changes in conditions or that the degree of compliance with the policies or procedures may deteriorate.
In our opinion, the consolidated financial statements referred to above present fairly, in all material respects, the financial position of The Toro Company and subsidiaries as of October 31, 2016 and 2015 and the results of its operations and its cash flows for each of the fiscal years in the three-year period ended October 31, 2016, in conformity with U.S. generally accepted accounting principles. In our opinion, the identified financial statement schedule, when considered in relation to the basic consolidated financial statements taken as a whole, presents fairly, in all material respects, the information therein. Also in our opinion, The Toro Company maintained, in all material respects, effective internal control over financial reporting as of October 31, 2016 based on criteria established in Internal Control – Integrated Framework (2013) issued by the Committee of Sponsoring Organizations of the Treadway Commission.
/s/ KPMG LLP
Minneapolis,
Minnesota
December 22, 2016
43
THE TORO COMPANY AND SUBSIDIARIES
Consolidated Statements of Earnings
(Dollars and shares in thousands, except per share data)
| | | | | | | | | | | |
Fiscal Years Ended October 31 |
2016 | 2015 | 2014 |
|||||||
| | | | | | | | | | | |
Net sales |
$ | 2,392,175 | $ | 2,390,875 | $ | 2,172,691 | ||||
Cost of sales |
1,517,580 | 1,554,940 | 1,399,420 | |||||||
| | | | | | | | | | | |
Gross profit |
874,595 | 835,935 | 773,271 | |||||||
Selling, general, and administrative expense |
540,199 | 536,821 | 510,114 | |||||||
| | | | | | | | | | | |
Operating earnings |
334,396 | 299,114 | 263,157 | |||||||
Interest expense |
(19,336 | ) | (18,757 | ) | (15,426 | ) | ||||
Other income, net |
15,400 | 10,674 | 8,714 | |||||||
| | | | | | | | | | | |
Earnings before income taxes |
330,460 | 291,031 | 256,445 | |||||||
Provision for income taxes |
99,466 | 89,440 | 82,575 | |||||||
| | | | | | | | | | | |
Net earnings |
$ | 230,994 | $ | 201,591 | $ | 173,870 | ||||
| | | | | | | | | | | |
| | | | | | | | | | | |
| | | | | | | | | | | |
Basic net earnings per share of common stock |
$ | 2.10 | $ | 1.81 | $ | 1.54 | ||||
| | | | | | | | | | | |
Diluted net earnings per share of common stock |
$ | 2.06 | $ | 1.78 | $ | 1.51 | ||||
| | | | | | | | | | | |
Weighted-average number of shares of common stock outstanding – Basic |
109,834 | 111,130 | 112,718 | |||||||
Weighted-average number of shares of common stock outstanding – Diluted |
111,987 | 113,514 | 115,255 | |||||||
| | | | | | | | | | | |
Shares and per share data have been adjusted for all periods presented to reflect a two-for-one stock split effective September 16, 2016.
The financial statements should be read in conjunction with the Notes to Consolidated Financial Statements.
THE TORO COMPANY AND SUBSIDIARIES
Consolidated Statements of Comprehensive Income
(Dollars in thousands)
| | | | | | | | | | | |
Fiscal Years Ended October 31 |
2016 | 2015 | 2014 |
|||||||
| | | | | | | | | | | |
Net earnings |
$ | 230,994 | $ | 201,591 | $ | 173,870 | ||||
Other comprehensive (loss) income, net of tax: |
||||||||||
Foreign currency translation adjustments, net of tax of $(161), $(51), and $(34), respectively |
(7,102 | ) | (11,792 | ) | (4,758 | ) | ||||
Pension and retiree medical benefits, net of tax of $(1,294), $299, and $10, respectively |
(973 | ) | (120 | ) | (1,583 | ) | ||||
Derivative instruments, net of tax of $(605), $(933), and $2,350, respectively |
(518 | ) | (2,226 | ) | 3,206 | |||||
| | | | | | | | | | | |
Other comprehensive (loss) income |
(8,593 | ) | (14,138 | ) | (3,135 | ) | ||||
| | | | | | | | | | | |
Comprehensive income |
$ | 222,401 | $ | 187,453 | $ | 170,735 | ||||
| | | | | | | | | | | |
| | | | | | | | | | | |
| | | | | | | | | | | |
The financial statements should be read in conjunction with the Notes to Consolidated Financial Statements.
44
THE TORO COMPANY AND SUBSIDIARIES
Consolidated Balance Sheets
(Dollars in thousands, except per share data)
| | | | | | | | |
| October 31 | 2016 | 2015 |
|||||
| | | | | | | | |
| ASSETS | |||||||
| Cash and cash equivalents | $ | 273,555 | $ | 126,275 | |||
| Receivables, net: | |||||||
Customers, net of allowances (2016 - $1,609; 2015 - $1,378) |
157,908 | 171,172 | |||||
Other |
5,357 | 5,841 | |||||
| | | | | | | | |
Total receivables, net |
163,265 | 177,013 | |||||
| | | | | | | | |
| Inventories, net | 307,034 | 334,514 | |||||
| Prepaid expenses and other current assets | 35,155 | 34,782 | |||||
| | | | | | | | |
Total current assets |
779,009 | 672,584 | |||||
| | | | | | | | |
| Property, plant, and equipment, net | 222,038 | 224,995 | |||||
| Long-term deferred income taxes | 57,228 | 66,663 | |||||
| Goodwill | 194,782 | 195,533 | |||||
| Other intangible assets, net | 108,093 | 119,010 | |||||
| Other assets | 26,368 | 24,873 | |||||
| | | | | | | | |
Total assets |
$ | 1,387,518 | $ | 1,303,658 | |||
| | | | | | | | |
| | | | | | | | |
| | | | | | | | |
| LIABILITIES AND STOCKHOLDERS' EQUITY | |||||||
| Current portion of long-term debt | $ | 22,484 | $ | 23,134 | |||
| Short-term debt | — | 222 | |||||
| Accounts payable | 174,668 | 152,017 | |||||
| Accrued liabilities: | |||||||
Warranty |
72,158 | 70,734 | |||||
Advertising and marketing programs |
81,315 | 76,689 | |||||
Compensation and benefit costs |
52,139 | 56,269 | |||||
Insurance |
7,502 | 6,814 | |||||
Income taxes |
— | 4,275 | |||||
Other |
53,573 | 53,580 | |||||
| | | | | | | | |
Total current liabilities |
463,839 | 443,734 | |||||
| | | | | | | | |
| Long-term debt, less current portion | 331,423 | 354,818 | |||||
| Deferred revenue | 11,830 | 11,365 | |||||
| Deferred income taxes | — | 7 | |||||
| Other long-term liabilities | 30,391 | 31,569 | |||||
| Stockholders' equity: | |||||||
Preferred stock, par value $1.00 per share, authorized 1,000,000 voting and 850,000 non-voting shares, none issued and outstanding |
— | — | |||||
Common stock, par value $1.00 per share, authorized 175,000,000 shares; issued and outstanding 108,427,393 shares as of October 31, 2016 and 109,301,832 shares as of October 31, 2015 |
108,427 | 109,302 | |||||
| Retained earnings | 480,044 | 382,706 | |||||
| Accumulated other comprehensive loss | (38,436 | ) | (29,843 | ) | |||
| | | | | | | | |
Total stockholders' equity |
550,035 | 462,165 | |||||
| | | | | | | | |
Total liabilities and stockholders' equity |
$ | 1,387,518 | $ | 1,303,658 | |||
| | | | | | | | |
| | | | | | | | |
| | | | | | | | |
Shares and per share data have been adjusted for all periods presented to reflect a two-for-one stock split effective September 16, 2016.
The financial statements should be read in conjunction with the Notes to Consolidated Financial Statements.
45
THE TORO COMPANY AND SUBSIDIARIES
Consolidated Statements of Cash Flows
(Dollars in thousands)
| | | | | | | | | | | |
| Fiscal Years Ended October 31 | 2016 | 2015 | 2014 |
|||||||
| | | | | | | | | | | |
| Cash flows from operating activities: | ||||||||||
| Net earnings | $ | 230,994 | $ | 201,591 | $ | 173,870 | ||||
| Adjustments to reconcile net earnings to net cash provided by operating activities: | ||||||||||
| Provision for depreciation, amortization, and impairment loss | 64,097 | 63,143 | 53,138 | |||||||
| Non-cash income from finance affiliate | (9,588 | ) | (8,353 | ) | (7,262 | ) | ||||
| Stock-based compensation expense | 10,637 | 10,836 | 11,291 | |||||||
| Decrease/(increase) in deferred income taxes | 10,075 | 200 | (4,700 | ) | ||||||
| Other | (464 | ) | (128 | ) | 28 | |||||
| Changes in operating assets and liabilities, net of effect of acquisitions: | ||||||||||
Receivables, net |
15,785 | (25,647 | ) | (5,042 | ) | |||||
Inventories, net |
23,192 | (52,656 | ) | (37,183 | ) | |||||
Prepaid expenses and other assets |
(905 | ) | (607 | ) | (3,245 | ) | ||||
|
Accounts payable, accrued liabilities, deferred revenue, and other long-term liabilities |
18,119 | 48,490 | 1,470 | |||||||
| | | | | | | | | | | |
Net cash provided by/(used in) operating activities |
361,942 | 236,869 | 182,365 | |||||||
| | | | | | | | | | | |
| Cash flows from investing activities: | ||||||||||
Purchases of property, plant, and equipment |
(50,723 | ) | (56,374 | ) | (71,138 | ) | ||||
Proceeds from asset disposals |
310 | 179 | 479 | |||||||
Distributions from finance affiliate, net |
9,848 | 4,264 | 5,672 | |||||||
Proceeds from sale of a business |
1,500 | — | — | |||||||
Acquisitions, net of cash acquired |
— | (198,329 | ) | (715 | ) | |||||
| | | | | | | | | | | |
Net cash provided by/(used in) investing activities |
(39,065 | ) | (250,260 | ) | (65,702 | ) | ||||
| | | | | | | | | | | |
| Cash flows from financing activities: | ||||||||||
(Repayments of)/increase in short-term debt |
(1,161 | ) | (21,283 | ) | 19,498 | |||||
(Repayments of)/increase in long-term debt |
(24,107 | ) | (7,227 | ) | 129,557 | |||||
Excess tax benefits from stock-based awards |
12,495 | 8,459 | 8,857 | |||||||
Proceeds from exercise of stock options |
20,226 | 9,203 | 7,192 | |||||||
Purchases of Toro common stock |
(111,999 | ) | (106,964 | ) | (103,039 | ) | ||||
Dividends paid on Toro common stock |
(65,890 | ) | (55,549 | ) | (45,048 | ) | ||||
| | | | | | | | | | | |
Net cash provided by/(used in) financing activities |
(170,436 | ) | (173,361 | ) | 17,017 | |||||
| | | | | | | | | | | |
| Effect of exchange rates on cash and cash equivalents | (5,161 | ) | (1,846 | ) | (1,800 | ) | ||||
| | | | | | | | | | | |
| Net increase/(decrease) in cash and cash equivalents | 147,280 | (188,598 | ) | 131,880 | ||||||
| Cash and cash equivalents as of the beginning of the fiscal period | 126,275 | 314,873 | 182,993 | |||||||
| | | | | | | | | | | |
| Cash and cash equivalents as of the end of the fiscal period | $ | 273,555 | $ | 126,275 | $ | 314,873 | ||||
| | | | | | | | | | | |
| | | | | | | | | | | |
| | | | | | | | | | | |
| Supplemental disclosures of cash flow information: | ||||||||||
Cash paid during the fiscal year for: |
||||||||||
Interest |
$ | 19,883 | $ | 18,133 | $ | 16,925 | ||||
Income taxes |
82,225 | 77,043 | 76,325 | |||||||
Shares issued in connection with stock-based compensation plans |
6,985 | 7,705 | 6,619 | |||||||
Payment obligations issued in connection with acquisitions |
— | 31,161 | 420 | |||||||
| | | | | | | | | | | |
The financial statements should be read in conjunction with the Notes to Consolidated Financial Statements.
46
THE TORO COMPANY AND SUBSIDIARIES
Consolidated Statements of Stockholders' Equity
(Dollars in thousands, except per share data)
| | | | | | | | | | | | | | |
| Common Stock |
Retained Earnings |
Accumulated Other Comprehensive Loss |
Total Stockholders' Equity |
||||||||||
| | | | | | | | | | | | | | |
| Balance as of October 31, 2013 | $ | 113,578 | $ | 257,730 | $ | (12,570 | ) | $ | 358,738 | ||||
| | | | | | | | | | | | | | |
| Cash dividends paid on common stock - $0.40 per share | — | (45,048 | ) | — | (45,048 | ) | |||||||
| Issuance of 1,065,384 shares for stock options exercised and restricted stock units vested | 1,066 | 4,446 | — | 5,512 | |||||||||
| Stock-based compensation expense | — | 11,291 | — | 11,291 | |||||||||
| Contribution of stock to a deferred compensation trust | — | 1,681 | — | 1,681 | |||||||||
| Purchase of 3,288,460 shares of common stock | (3,288 | ) | (99,751 | ) | — | (103,039 | ) | ||||||
| Excess tax benefits from stock-based awards | — | 8,857 | — | 8,857 | |||||||||
| Other comprehensive loss | — | — | (3,135 | ) | (3,135 | ) | |||||||
| Net earnings | — | 173,870 | — | 173,870 | |||||||||
| | | | | | | | | | | | | | |
| Balance as of October 31, 2014 | $ | 111,356 | $ | 313,076 | $ | (15,705 | ) | $ | 408,727 | ||||
| | | | | | | | | | | | | | |
| Cash dividends paid on common stock - $0.50 per share | — | (55,549 | ) | — | (55,549 | ) | |||||||
| Issuance of 1,096,972 shares for stock options exercised and restricted stock units vested | 1,098 | 7,138 | — | 8,236 | |||||||||
| Stock-based compensation expense | — | 10,836 | — | 10,836 | |||||||||
| Contribution of stock to a deferred compensation trust | — | 967 | — | 967 | |||||||||
| Purchase of 3,151,978 shares of common stock | (3,152 | ) | (103,812 | ) | — | (106,964 | ) | ||||||
| Excess tax benefits from stock-based awards | — | 8,459 | — | 8,459 | |||||||||
| Other comprehensive loss | — | — | (14,138 | ) | (14,138 | ) | |||||||
| Net earnings | — | 201,591 | — | 201,591 | |||||||||
| | | | | | | | | | | | | | |
| Balance as of October 31, 2015 | $ | 109,302 | $ | 382,706 | $ | (29,843 | ) | $ | 462,165 | ||||
| | | | | | | | | | | | | | |
| Cash dividends paid on common stock - $0.60 per share | — | (65,890 | ) | — | (65,890 | ) | |||||||
| Issuance of 1,801,136 shares for stock options exercised and restricted stock units vested | 1,801 | 17,225 | — | 19,026 | |||||||||
| Stock-based compensation expense | — | 10,637 | — | 10,637 | |||||||||
| Contribution of stock to a deferred compensation trust | — | 1,200 | — | 1,200 | |||||||||
| Purchase of 2,675,575 shares of common stock | (2,676 | ) | (109,323 | ) | — | (111,999 | ) | ||||||
| Excess tax benefits from stock-based awards | — | 12,495 | — | 12,495 | |||||||||
| Other comprehensive loss | — | — | (8,593 | ) | (8,593 | ) | |||||||
| Net earnings | — | 230,994 | — | 230,994 | |||||||||
| | | | | | | | | | | | | | |
| Balance as of October 31, 2016 | $ | 108,427 | $ | 480,044 | $ | (38,436 | ) | $ | 550,035 | ||||
| | | | | | | | | | | | | | |
| | | | | | | | | | | | | | |
| | | | | | | | | | | | | | |
Shares and per share data have been adjusted for all periods presented to reflect a two-for-one stock split effective September 16, 2016.
The financial statements should be read in conjunction with the Notes to Consolidated Financial Statements.
47
NOTES TO CONSOLIDATED FINANCIAL STATEMENTS
• THE TORO COMPANY AND SUBSIDIARIES •
(Dollars
in thousands, except per share data)
| 1 | SUMMARY OF SIGNIFICANT ACCOUNTING POLICIES AND RELATED DATA |
Basis of Presentation and Consolidation
The accompanying consolidated financial statements include the accounts of the company and its wholly owned subsidiaries. The company uses the equity method to account for investments over which it has the ability to exercise significant influence over operating and financial policies. Consolidated net earnings include the company's share of the net earnings (losses) of these companies. The cost method is used to account for investments in companies that the company does not control and for which it does not have the ability to exercise significant influence over operating and financial policies. These investments are recorded at cost. All intercompany accounts and transactions have been eliminated from the consolidated financial statements.
On August 18, 2016, the company announced that its Board of Directors declared a two-for-one stock split of the company's common stock, effected in the form of a 100 percent stock dividend. The stock split dividend was distributed or paid on September 16, 2016, to stockholders of record as of September 1, 2016. Earnings and dividends declared per share and weighted average shares outstanding are presented in this report after the effect of the 100 percent stock dividend. The two-for-one stock split is reflected in the share amounts in all periods presented in this report.
In preparing the consolidated financial statements in conformity with United States generally accepted accounting principles ("GAAP"), management must make decisions that impact the reported amounts of assets, liabilities, revenues, expenses, and the related disclosures, including disclosures of contingent assets and liabilities. Such decisions include the selection of the appropriate accounting principles to be applied and the assumptions on which to base accounting estimates. Estimates are used in determining, among other items, sales promotions and incentives accruals, incentive compensation accruals, inventory valuation, warranty reserves, earnout liabilities, allowance for doubtful accounts, pension and postretirement accruals, self-insurance accruals, useful lives for tangible and intangible assets, and future cash flows associated with impairment testing for goodwill and other long-lived assets. These estimates and assumptions are based on management's best estimates and judgments at the time they are made. Management evaluates its estimates and assumptions on an ongoing basis using historical experience and other factors that management believes to be reasonable under the circumstances, including the current economic environment. Management adjusts such estimates and assumptions when facts and circumstances dictate. As future events and their effects cannot be determined with certainty, actual amounts could differ significantly from those estimated at the time the consolidated financial statements are prepared. Changes in those estimates will be reflected in the consolidated financial statements in future periods.
The company considers all highly liquid investments purchased with an original maturity of three months or less to be cash equivalents and are stated at cost, which approximates fair value. As of October 31, 2016, cash and short-term investments held by the company's foreign subsidiaries that are not available to fund domestic operations unless repatriated were $105,515.
The company's financial exposure to collection of accounts receivable is reduced due to its Red Iron Acceptance, LLC ("Red Iron") joint venture with TCF Inventory Finance, Inc. ("TCFIF"), as further discussed in Note 3. For receivables not serviced through Red Iron, the company grants credit to customers in the normal course of business and performs on-going credit evaluations of customers. Receivables are recorded at original carrying amount less reserves for estimated uncollectible accounts, as described below.
Allowance for Doubtful Accounts
The company estimates the balance of allowance for doubtful accounts by analyzing the age of accounts and notes receivable balances and applying historical write-off trend rates. The company also estimates separately specific customer balances when it is deemed probable that the balance is uncollectible. Account balances are charged off against the allowance when all collection efforts have been exhausted.
Inventories are valued at the lower of cost or net realizable value, with cost determined by the last-in, first-out ("LIFO") method for a majority of the company's inventories. The first-in, first-out ("FIFO") method is used for all other inventories, constituting 33 percent and 26 percent of total inventories as of October 31,
48
2016 and 2015, respectively. The company establishes a reserve for excess, slow-moving, and obsolete inventory that is equal to the difference between the cost and estimated net realizable value for that inventory. These reserves are based on a review and comparison of current inventory levels to planned production, as well as planned and historical sales of the inventory. During fiscal 2016 and 2015, LIFO layers were reduced, which resulted in charging lower inventory costs prevailing in previous years to cost of sales, thus reducing cost of sales by $60 and $1,348, respectively.
Inventories as of October 31 were as follows:
| | | | | | | | |
|
2016 | 2015 | |||||
| | | | | | | | |
Raw materials and work in process |
$ | 90,463 | $ | 107,086 | |||
Finished goods and service parts |
274,929 | 291,468 | |||||
| | | | | | | | |
Total FIFO value |
| 365,392 | | 398,554 | |||
Less: adjustment to LIFO value |
58,358 | 64,040 | |||||
| | | | | | | | |
Total inventories, net |
$ | 307,034 | $ | 334,514 | |||
| | | | | | | | |
| | | | | | | | |
| | | | | | | | |
Property, plant, and equipment are carried at cost. The company provides for depreciation of plant and equipment utilizing the straight-line method over the estimated useful lives of the assets. Buildings, including leasehold improvements, are generally depreciated over 10 to 40 years, and equipment over two to seven years. Tooling costs are generally depreciated over three to five years using the straight-line method. Software and website development costs are generally amortized over two to five years utilizing the straight-line method. Expenditures for major renewals and improvements, which substantially increase the useful lives of existing assets, are capitalized, and maintenance and repairs are charged to operating expenses as incurred. Interest is capitalized during the construction period for significant capital projects. During the fiscal years ended October 31, 2016, 2015, and 2014, the company capitalized $549, $897, and $1,710 of interest, respectively.
Property, plant, and equipment as of October 31 was as follows:
| | | | | | | | |
|
2016 | 2015 | |||||
| | | | | | | | |
Land and land improvements |
$ | 34,744 | $ | 34,240 | |||
Buildings and leasehold improvements |
182,121 | 170,342 | |||||
Machinery and equipment |
| 325,595 | | 315,884 | |||
Tooling |
200,842 | 187,652 | |||||
Computer hardware and software |
| 85,173 | | 81,131 | |||
Construction in process |
9,561 | 15,349 | |||||
| | | | | | | | |
Subtotal |
| 838,036 | | 804,598 | |||
Less: accumulated depreciation |
615,998 | 579,603 | |||||
| | | | | | | | |
Total property, plant, and equipment, net |
$ | 222,038 | $ | 224,995 | |||
| | | | | | | | |
| | | | | | | | |
| | | | | | | | |
During fiscal years 2016, 2015, and 2014, the company recorded depreciation expense of $53,355, $50,322, and $47,136, respectively.
Goodwill and Indefinite-Life Intangible Assets
Goodwill represents the cost of acquisitions in excess of the fair values assigned to identifiable net assets acquired. Goodwill is assigned to reporting units based upon the expected benefit of the synergies of the acquisition. Goodwill and some trade names, which are considered to have indefinite lives, are not amortized; however, the company reviews them for impairment annually during each fiscal fourth quarter or more frequently if changes in circumstances or occurrence of events suggest the fair value may not be recoverable.
The company reviewed the fair value of its reporting units that have goodwill on their respective balance sheets and compared these fair values to the respective carrying amounts during the fourth quarter of fiscal 2016. The company determined that it has nine reporting units, which are the same as its nine operating segments. Seven reporting units contain goodwill on their respective balance sheets. As of August 26, 2016, the company performed an analysis of qualitative factors to determine whether it is more likely than not that the fair value of a reporting unit is less than its carrying amount as a basis for determining whether it is necessary to perform a two-step goodwill impairment test. Based on the company's analysis of qualitative factors, the company determined that it was not necessary to perform a two-step goodwill impairment test for any of its reporting units.
As of August 26, 2016, the company also performed an assessment of its indefinite-life intangible assets, which consist of certain trade names. The company's estimate of the fair value of its trade names are based on a discounted cash flow model using inputs which included: projected revenues from the company's forecasting process; assumed royalty rates that could be payable if the company did not own the trade name; and a discount rate. Based on this analysis, which was also performed in prior fiscal years, the company concluded its indefinite-life intangible assets were not impaired during fiscal 2016, 2015, or 2014.
Other long-lived assets include property, plant, and equipment and definite-life intangible assets, which are identifiable assets that arose from purchase acquisitions consisting primarily of patents, non-compete agreements, customer relationships, trade names, and developed technology and are amortized on a straight-line basis over periods ranging from 1.5 to 20 years. The company reviews other long-lived assets for impairment whenever events or changes in circumstances indicate that the carrying amount of an asset (or asset group) may not be recoverable. An impairment loss is recognized when estimated undiscounted future cash flows from the operation or disposition of the asset group are less than the carrying amount of the asset group. Asset groups have identifiable cash flows and are largely independent of other asset groups. Measurement of an impairment loss is based on the excess of the carrying amount of the asset group
49
over its fair value. Fair value is measured using a discounted cash flow model or independent appraisals, as appropriate. For long-lived assets to be abandoned, the company tests for potential impairment. If the company commits to a plan to abandon a long-lived asset before the end of its previously estimated useful life, depreciation estimates are revised.
Based on the company's impairment analysis for definite-life intangible assets, the company did not have any impairment losses of other long-lived assets. For fiscal 2015, the company wrote down $1,383 of other long-lived assets. Additionally, based on the company's analysis of estimated useful lives of property, plant, and equipment, the company had $0, $531, and $0 of accelerated depreciation expense during fiscal 2016, 2015, and 2014, respectively.
The company has a customer-managed service agreement with a third party to provide a web-based platform that facilitates participating suppliers' ability to finance payment obligations from the company with a designated third party financial institution. Participating suppliers may, at their sole discretion, make offers to finance one or more payment obligations of the company prior to their scheduled due dates at a discounted price to a participating financial institution.
The company's obligations to its suppliers, including amounts due and scheduled payment dates, are not affected by suppliers' decisions to finance amounts under this arrangement. As of October 31, 2016 and 2015, $16,249 and $16,101, respectively, of the company's outstanding payment obligations had been placed on the accounts payable tracking system.
The company is self-insured for certain losses relating to medical, dental, and workers' compensation claims, and certain product liability occurrences. Specific stop loss coverages are provided for catastrophic claims in order to limit exposure to significant claims. Losses and claims are charged to operations when it is probable a loss has been incurred and the amount can be reasonably estimated. Self-insured liabilities are based on a number of factors, including historical claims experience, an estimate of claims incurred but not reported, demographic and severity factors, and utilizing valuations provided by independent third-party actuaries.
The company provides an accrual for estimated future warranty costs at the time of sale. The company also establishes accruals for major rework campaigns. The amount of warranty accruals is based primarily on the estimated number of products under warranty, historical average costs incurred to service warranty claims, the trend in the historical ratio of claims to sales, and the historical length of time between the sale and resulting warranty claim. The company periodically assesses the adequacy of its warranty accruals based on changes in these factors and records any necessary adjustments if actual claims experience indicates that adjustments are necessary.
The changes in accrued warranties were as follows:
| | | | | | | | |
Fiscal years ended October 31 |
2016 | 2015 | |||||
| | | | | | | | |
Beginning balance |
$ | 70,734 | $ | 71,080 | |||
Warranty provisions |
44,260 | 41,747 | |||||
Warranty claims |
| (41,102 | ) | | (39,730 | ) | |
Changes in estimates |
(1,734 | ) | (2,363 | ) | |||
| | | | | | | | |
Ending balance |
$ | 72,158 | $ | 70,734 | |||
| | | | | | | | |
| | | | | | | | |
| | | | | | | | |
Derivatives, consisting mainly of forward currency contracts, are used to hedge most foreign currency transactions, including forecasted sales and purchases denominated in foreign currencies. The company also in the past utilized and may in the future utilize cross currency swaps to offset foreign currency intercompany loan exposures. Derivatives are recognized on the consolidated balance sheet at fair value. If the derivative is designated as a cash flow hedge, the effective portion of the change in the fair value of the derivative is recorded as a component of other comprehensive income within the consolidated statements of comprehensive income and the consolidated statements of stockholders' equity, and recognized in earnings when the hedged item affects earnings. Derivatives that do not meet the requirements for hedge accounting are adjusted to fair value through other income, net in the consolidated statements of earnings.
Foreign Currency Translation and Transactions
The functional currency of the company's foreign operations is generally the applicable local currency. The functional currency is translated into U.S. dollars for balance sheet accounts using current exchange rates in effect as of the balance sheet date and for revenue and expense accounts using a weighted-average exchange rate during the fiscal year. The translation adjustments are deferred as a component of other comprehensive income (loss) within the consolidated statements of comprehensive income and the consolidated statements of stockholders' equity. Gains or losses resulting from transactions denominated in foreign currencies are included in other income, net in the consolidated statements of earnings.
Deferred tax assets and liabilities are recognized for the future tax consequences attributable to differences between the financial statement carrying amounts of existing assets and liabilities and their respective tax bases. Deferred tax assets and liabilities are measured using enacted tax rates expected to apply to taxable
50
income in the years that those temporary differences are expected to be recovered or settled. The effect on deferred tax assets and liabilities of a change in tax rates is recognized in income tax expense in the period that includes the enactment date. A valuation allowance is provided when, in management's judgment, it is more likely than not that some portion or all of the deferred tax asset will not be realized. The company has reflected the necessary deferred tax assets and liabilities in the accompanying consolidated balance sheets. Management believes the future tax deductions will be realized principally through carryback to taxable income in prior years, future reversals of existing taxable temporary differences, and future taxable income.
The company recognizes the effect of income tax positions only if those positions are more likely than not of being sustained. Recognized income tax positions are measured at the largest amount that is greater than 50 percent likely of being realized. Changes in recognition or measurement are reflected in the period in which the change in judgment occurs. The company also records interest and penalties related to unrecognized tax benefits in income tax expense.
The company recognizes revenue for product sales when persuasive evidence of an arrangement exists, title and risk of ownership passes to the customer, the sales price is fixed or determinable, and collectability is probable. These criteria are typically met at the time product is shipped, or in the case of certain agreements, when product is delivered. A provision is made at the time the related revenue is recognized for estimated product returns, floor plan costs, rebates, and other sales promotion expenses. Sales, use, value-added, and other excise taxes are not recognized in revenue. Freight revenue billed to customers is included in net sales.
The company ships some of its products to a key retailer's seasonal distribution centers on a consignment basis. The company retains title to its products stored at the seasonal distribution centers. As the company's products are removed from the seasonal distribution centers by the key retailer and shipped to the key retailer's stores, title passes from the company to the key retailer. At that time, the company invoices the key retailer and recognizes revenue for these consignment transactions. The company does not offer a right of return for products shipped to the key retailer's stores from the seasonal distribution centers. From time to time, the company also stores inventory on a consignment basis at other customers' locations. The amount of consignment inventory as of October 31, 2016 and 2015 was $22,443 and $23,566, respectively.
Revenue earned from service and maintenance contracts is recognized ratably over the contractual period. Revenue from extended warranty programs is deferred at the time the contract is sold and amortized into net sales using the straight-line method over the extended warranty period.
Sales Promotions and Incentives
At the time of sale, the company records an estimate for sales promotion and incentive costs. Examples of sales promotion and incentive programs include off-invoice discounts, rebate programs, volume discounts, retail financing support, commissions, and other sales discounts and promotional programs. The estimates of sales promotion and incentive costs are based on the terms of the arrangements with customers, historical payment experience, field inventory levels, volume purchases, and expectations for changes in relevant trends in the future. The expense of each program is classified as a reduction from gross sales or as a component of selling, general, and administrative expense.
Cost of sales primarily comprises direct materials and supplies consumed in the manufacture of product, as well as manufacturing labor, depreciation expense, and direct overhead expense necessary to convert purchased materials and supplies into finished product. Cost of sales also includes inbound freight costs, outbound freight costs for shipping products to customers, obsolescence expense, cost of services provided, and cash discounts on payments to vendors.
Selling, General, and Administrative Expense
Selling, general, and administrative expense primarily comprises payroll and benefit costs, occupancy and operating costs of distribution and corporate facilities, warranty expense, depreciation and amortization expense on non-manufacturing assets, advertising and marketing expenses, selling expenses, engineering and research costs, information systems costs, incentive and profit sharing expense, and other miscellaneous administrative costs, such as legal costs for internal and outside services that are expensed as incurred.
Cost of Financing Distributor / Dealer Inventory
The company enters into limited inventory repurchase agreements with a third-party financing company and Red Iron. The company has repurchased immaterial amounts of inventory under these repurchase agreements over the last three fiscal years. However, an adverse change in retail sales could cause this situation to change, and thereby require the company to repurchase a portion of financed product. See Note 13 for additional information regarding the company's repurchase arrangements.
Included as a reduction to net sales are costs associated with programs under which the company shares the expense of financing distributor and dealer inventories, referred to as floor plan expenses. This charge represents interest for a pre-established length of time based on a predefined rate from a contract with third party financing sources to finance distributor and dealer inventory purchases. These financing arrangements are used by the company as a marketing tool to assist customers to buy inventory. The financing costs for distributor and dealer inventories were $28,773, $24,130, and $21,080 for the fiscal years ended October 31, 2016, 2015, and 2014, respectively.
51
General advertising expenditures are expensed the first time advertising takes place. Production costs associated with advertising are expensed in the period incurred. Cooperative advertising represents expenditures for shared advertising costs that the company reimburses to customers and is classified as a component of selling, general, and administrative expense. These obligations are accrued and expensed when the related revenues are recognized in accordance with the programs established for various product lines. Advertising costs were $41,837, $42,843, and $43,590 for the fiscal years ended October 31, 2016, 2015, and 2014, respectively.
The company's stock-based compensation awards are generally granted to executive officers, other employees, and non-employee members of the company's Board of Directors, and include performance share awards that are contingent on the achievement of performance goals of the company, non-qualified stock options, restricted stock units, and restricted stock awards. Generally, compensation expense equal to the grant date fair value is recognized for these awards over the vesting period and is classified in selling, general and administrative expense. Stock options granted to executive officers and other employees are subject to accelerated expensing if the option holder meets the retirement definition set forth in The Toro Company Amended and Restated 2010 Equity and Incentive Plan, as amended and restated (the "2010 plan"). In that case, the fair value of the options is expensed in the fiscal year of grant because generally the option holder must be employed as of the end of the fiscal year in which the options are granted in order for the options to continue to vest following retirement. Similarly, if a non-employee director has served on the company's Board of Directors for ten full fiscal years or more, the awards vest immediately upon retirement; and therefore, the fair value of the options granted is fully expensed on the date of the grant. See Note 10 for additional information regarding stock-based compensation plans.
Basic net earnings per share is calculated using net earnings available to common stockholders divided by the weighted-average number of shares of common stock outstanding during the year plus the assumed issuance of contingent shares. Diluted net earnings per share is similar to basic net earnings per share except that the weighted-average number of shares of common stock outstanding plus the assumed issuance of contingent shares is increased to include the number of additional shares of common stock that would have been outstanding assuming the issuance of all potentially dilutive shares, such as common stock to be issued upon exercise of options, contingently issuable shares, and restricted stock units.
Reconciliations of basic and diluted weighted-average shares of common stock outstanding are as follows:
| | | | | | | | | | | |
| (Shares in thousands) | ||||||||||
| Basic | 2016 | 2015 | 2014 |
|||||||
| | | | | | | | | | | |
| Weighted-average number of shares of common stock | | 109,816 | | 111,107 | | 112,692 | ||||
| Assumed issuance of contingent shares | 18 | 23 | 26 | |||||||
| | | | | | | | | | | |
| Weighted-average number of shares of common stock and assumed issuance of contingent shares | | 109,834 | | 111,130 | | 112,718 | ||||
| | | | | | | | | | | |
| | | | | | | | | | | |
| | | | | | | | | | | |
Diluted |
||||||||||
| | | | | | | | | | | |
| Weighted-average number of shares of common stock and assumed issuance of contingent shares | | 109,834 | | 111,130 | | 112,718 | ||||
| Effect of dilutive securities | 2,153 | 2,384 | 2,537 | |||||||
| | | | | | | | | | | |
| Weighted-average number of shares of common stock, assumed issuance of contingent shares, and effect of dilutive securities | | 111,987 | | 113,514 | | 115,255 | ||||
| | | | | | | | | | | |
| | | | | | | | | | | |
| | | | | | | | | | | |
Share data has been adjusted for all periods presented to reflect a two-for-one stock split effective September 16, 2016.
Incremental shares from options and restricted stock units are computed by the treasury stock method. Options for the purchase of 310,566, 290,120, and 519,850 shares of common stock during fiscal 2016, 2015, and 2014, respectively, were excluded from the computation of diluted net earnings per share because they were anti-dilutive.
The consolidated statements of cash flows are prepared using the indirect method, which reconciles net earnings to cash flow from operating activities. The necessary adjustments include the removal of timing differences between the occurrence of operating receipts and payments and their recognition in net earnings. The adjustments also remove from operating activities cash flows arising from investing and financing activities, which are presented separately from operating activities. Cash flows from foreign currency transactions and operations are translated at an average exchange rate for the period. Cash paid for acquisitions is classified as investing activities.
New Accounting Pronouncements Adopted
In February 2015, the Financial Accounting Standards Board ("FASB") issued Accounting Standards Update ("ASU") No. 2015-02, Consolidation (Topic 810), which amends certain requirements for determining whether a variable interest entity must be consolidated. The company adopted this amended guidance in the fourth quarter of its fiscal 2016. The adoption of this
52
guidance did not change the company's conclusion on consolidation of a variable interest entity.
In November 2015, the FASB issued ASU No. 2015-17, Income Taxes (Topic 740): Balance Sheet Classification of Deferred Taxes. This amended guidance requires an entity to present deferred tax assets and liabilities, along with any related valuation allowance, as non-current on the Consolidated Balance Sheets. As a result of the new guidance, each jurisdiction will now only have one net non-current deferred tax asset or liability. The new guidance does not change the existing requirement that only permits offsetting deferred tax assets and liabilities within a single jurisdiction. Entities have the option to apply the new guidance prospectively or retrospectively. This amended guidance was retrospectively adopted in the fourth quarter of fiscal 2016. Prior periods have been retrospectively adjusted for the adoption of this amended guidance and are reclassified in the Consolidated Balance Sheets presentation of deferred tax balances as of October 31, 2015 by including $38,095 of previously classified current deferred tax assets as non-current.
| 2 | ACQUISITION |
On November 14, 2014, during the first quarter of fiscal 2015, the company acquired substantially all of the assets (excluding accounts receivable) of the BOSS® professional snow and ice management business of privately held Northern Star Industries, Inc. The purchase price of this acquisition was $229,490, which included a cash payment of $198,329 and issuance of a note payable at fair value of $31,161. The company funded the acquisition with cash on hand, a $130,000 term loan, and short-term debt under the company's revolving credit facility.
The purchase price of this acquisition was allocated to the identifiable assets acquired and liabilities assumed based on estimates of their fair value, with the excess purchase price for acquisitions recorded as goodwill.
| 3 | INVESTMENT IN JOINT VENTURE |
In fiscal 2009, the company and TCF Inventory Finance, Inc. ("TCFIF"), a subsidiary of TCF National Bank, established Red Iron Acceptance, LLC ("Red Iron"), a joint venture in the form of a Delaware limited liability company that primarily provides inventory financing to certain distributors and dealers of the company's products in the U.S. As of October 31, 2016, the initial term of Red Iron would have expired on October 31, 2017, unless it would have been extended for an additional two year term. See Note 17 as the Red Iron arrangement, including the initial term, were amended subsequent to October 31, 2016. Additionally, in connection with the joint venture, the company and an affiliate of TCFIF entered into an arrangement to provide inventory financing to dealers of the company's products in Canada.
The company owns 45 percent of Red Iron and TCFIF owns 55 percent of Red Iron. The company accounts for its investment in Red Iron under the equity method of accounting. The company and TCFIF each contributed a specified amount of the estimated cash required to enable Red Iron to purchase the company's inventory financing receivables and to provide financial support for Red Iron's inventory financing programs. As of October 31, 2016, Red Iron borrowed the remaining requisite estimated cash utilizing a $450,000 secured revolving credit facility established under a credit agreement between Red Iron and TCFIF. The company's total investment in Red Iron as of October 31, 2016 and 2015 was $18,719 and $18,979, respectively. The company has not guaranteed the outstanding indebtedness of Red Iron. The company has agreed to repurchase products repossessed by Red Iron and the TCFIF Canadian affiliate, up to a maximum aggregate amount of $7,500 in a calendar year.
Under the repurchase agreement between Red Iron and the company, Red Iron provides financing for certain dealers and distributors. These transactions are structured as an advance in the form of a payment by Red Iron to the company on behalf of a distributor or dealer with respect to invoices financed by Red Iron. These payments extinguish the obligation of the dealer or distributor to make payment to the company under the terms of the applicable invoice. Under separate agreements between Red Iron and the dealers and distributors, Red Iron provides loans to the dealers and distributors for the advances paid by Red Iron to the company. The net amount of receivables financed for dealers and distributors under this arrangement during fiscal 2016, 2015, and 2014 was $1,713,588, $1,430,855, and $1,280,505, respectively.
Summarized financial information for Red Iron is presented as follows:
| | | | | | | | | | | |
| For the twelve months ended October 31 |
2016 | 2015 | 2014 |
|||||||
| | | | | | | | | | | |
| Revenue | $ | 31,812 | $ | 27,483 | $ | 22,678 | ||||
| Net income | 21,306 | 18,598 | 16,139 | |||||||
| | | | | | | | | | | |
| | | | | | | | |
| As of October 31 | 2016 | 2015 |
|||||
| | | | | | | | |
| Finance receivables, net | $ | 370,169 | $ | 366,397 | |||
| Other assets | 4,416 | 5,928 | |||||
| Total liabilities | | 332,985 | | 330,149 | |||
| | | | | | | | |
53
| 4 | OTHER INCOME, NET |
Other income (expense) is as follows:
| | | | | | | | | | | |
| Fiscal years ended October 31 | 2016 | 2015 | 2014 |
|||||||
| | | | | | | | | | | |
| Interest income | $ | 827 | $ | 494 | $ | 465 | ||||
| Retail financing revenue | 1,087 | 1,086 | 1,077 | |||||||
| Foreign currency exchange rate gain/(loss) | | 974 | | (324 | ) | | (1,006 | ) | ||
| Gain on sale of business | 340 | — | — | |||||||
| Noncash income from finance affiliate | | 9,588 | | 8,353 | | 7,262 | ||||
| Litigation recovery, net | 1,300 | 125 | 127 | |||||||
| Miscellaneous | | 1,284 | | 940 | | 789 | ||||
| | | | | | | | | | | |
| Total other income, net | $ | 15,400 | $ | 10,674 | $ | 8,714 | ||||
| | | | | | | | | | | |
| | | | | | | | | | | |
| | | | | | | | | | | |
| 5 | GOODWILL AND OTHER INTANGIBLE ASSETS |
Goodwill — The changes in the net carrying amount of goodwill for fiscal 2016 and 2015 were as follows:
| | | | | | | | | | | |
| Professional Segment |
Residential Segment |
Total |
||||||||
| | | | | | | | | | | |
| Balance as of October 31, 2014 | $ | 80,946 | $ | 10,905 | $ | 91,851 | ||||
| | | | | | | | | | | |
| Goodwill acquired | 103,028 | — | 103,028 | |||||||
| Translation and other adjustments | | 792 | | (138 | ) | | 654 | |||
| | | | | | | | | | | |
| Balance as of October 31, 2015 | 184,766 | 10,767 | 195,533 | |||||||
| | | | | | | | | | | |
| Translation adjustments | | (428 | ) | | (323 | ) | | (751 | ) | |
| | | | | | | | | | | |
| Balance as of October 31, 2016 | $ | 184,338 | $ | 10,444 | $ | 194,782 | ||||
| | | | | | | | | | | |
| | | | | | | | | | | |
| | | | | | | | | | | |
Other Intangible Assets — The components of other intangible assets were as follows:
| | | | | | | | | |
| October 31, 2016 | Weighted- average Life (Years) |
Gross Carrying Amount |
Accumulated Amortization |
Net |
||||
| | | | | | | | | |
| Patents | 3.1 | $ 15,151 | $(10,866) | $ 4,285 | ||||
| Non-compete agreements | 0.4 | 6,886 | (6,681) | 205 | ||||
| Customer-related | 16.5 | 84,353 | (14,434) | 69,919 | ||||
| Developed technology | 1.4 | 28,648 | (23,712) | 4,936 | ||||
| Trade names | 17.1 | 28,715 | (4,235) | 24,480 | ||||
| Other | 800 | (800) | — | |||||
| | | | | | | | | |
| Total amortizable | | 164,553 | (60,728) | 103,825 | ||||
| | | | | | | | | |
| Non-amortizable - trade names | 4,268 | — | 4,268 | |||||
| | | | | | | | | |
| Total other intangible assets, net | | $168,821 | $(60,728) | $108,093 | ||||
| | | | | | | | | |
| | | | | | | | | |
| | | | | | | | | |
| | | | | | | | | |
| October 31, 2015 | Weighted- average Life (Years) |
Gross Carrying Amount |
Accumulated Amortization |
Net |
||||
| | | | | | | | | |
| Patents | 3.6 | $ 15,191 | $(10,175) | $ 5,016 | ||||
| Non-compete agreements | 0.9 | 6,922 | (6,206) | 716 | ||||
| Customer-related | 17.4 | 84,599 | (10,316) | 74,283 | ||||
| Developed technology | 2.3 | 28,804 | (20,530) | 8,274 | ||||
| Trade names | 18.0 | 28,715 | (2,825) | 25,890 | ||||
| Other | 800 | (800) | — | |||||
| | | | | | | | | |
| Total amortizable | 165,031 | (50,852) | 114,179 | |||||
| | | | | | | | | |
| Non-amortizable - trade names | 4,831 | — | 4,831 | |||||
| | | | | | | | | |
| Total other intangible assets, net | $169,862 | $(50,852) | $119,010 | |||||
| | | | | | | | | |
| | | | | | | | | |
| | | | | | | | | |
Amortization expense for intangible assets for the fiscal years ended October 31, 2016, 2015, and 2014 was $9,550, $11,438, and $6,002, respectively. Estimated amortization expense for the succeeding fiscal years is as follows: 2017, $9,458; 2018, $7,440; 2019, $6,562; 2020, $6,006; 2021, $5,601; and after 2021, $68,758.
| 6 | SHORT-TERM CAPITAL RESOURCES |
As of October 31, 2016, the company had a $150,000 unsecured senior five-year revolving credit facility that expires in October 2019. Included in this $150,000 revolving credit facility is a sublimit of $20,000 for standby letters of credit and a sublimit for swingline loans of $20,000. At the election of the company, and the approval of the named borrowers on the revolving credit facility and the election of the lenders to fund such increase, the aggregate maximum principal amount available under the facility may be increased by an amount up to $100,000 in aggregate. Funds are available under the revolving credit facility for working capital, capital expenditures, and other lawful purposes, including, but not limited to, acquisitions and stock repurchases. Interest expense on this credit line is determined based on a LIBOR rate (or other rates quoted by the Administrative Agent, Bank of America, N.A.) plus a basis point spread defined in the credit agreement. The company's non-U.S. operations also maintain unsecured short-term lines of credit in the aggregate amount of $9,130. These facilities bear interest at various rates depending on the rates in their respective countries of operation. Under the company's lines of credit, there was no outstanding debt as of October 31, 2016 and October 31, 2015.
The credit agreement that contains the revolving credit facility and term loan, which is described in more detail in Note 7, contains standard covenants, including, without limitation, financial covenants, such as the maintenance of minimum interest
54
coverage and maximum debt to earnings before interest, tax, depreciation, and amortization ("EBITDA") ratios; and negative covenants, which among other things, limit loans and investments, disposition of assets, consolidations and mergers, transactions with affiliates, restricted payments, contingent obligations, liens, and other matters customarily restricted in such agreements. Most of these restrictions are subject to certain minimum thresholds and exceptions. Under the revolving credit facility, the company is not limited in the amount for payments of cash dividends and stock repurchases as long as the debt to EBITDA ratio from the previous quarter compliance certificate is less than or equal to 3.25, provided that immediately after giving effect of any such proposed action, no default or event of default would exist. In fiscal 2016, 2015, and 2014, the company was not limited in the amount for payments of cash dividends and stock repurchases as its debt to EBITDA ratio was below the thresholds. The company was in compliance with all covenants related to the lines of credit described above as of October 31, 2016 and 2015.
| 7 | LONG-TERM DEBT |
A summary of long-term debt as of October 31 is as follows:
| | | | | | | | |
| 2016 | 2015 |
||||||
| | | | | | | | |
| Term loan, due October 25, 2019 | $ | 110,500 | $ | 123,500 | |||
| 7.800% Debentures, due June 15, 2027 | 100,000 | 100,000 | |||||
| 6.625% Senior Notes, due May 1, 2037 | | 123,730 | | 123,668 | |||
| 4% Unsecured Note, due November 14, 2017 | 19,677 | 30,604 | |||||
| Other | | — | | 180 | |||
| | | | | | | | |
| Total long-term debt | 353,907 | 377,952 | |||||
| | | | | | | | |
| Less current portion | | 22,484 | | 23,134 | |||
| | | | | | | | |
| Long-term debt, less current portion | $ | 331,423 | $ | 354,818 | |||
| | | | | | | | |
| | | | | | | | |
| | | | | | | | |
On November 14, 2014, the company issued a note with the aggregate principal amount of $30,000 to the former owner of the BOSS business, Northern Star Industries, Inc., which was recorded at fair value of $31,161.
In October 2014, the company obtained a $130,000 term loan with various banks, which was a part of the new credit agreement that included the new revolving credit facility. Under the credit agreement, the term loan bears interest based on a LIBOR rate (or other rates quoted by the Administrative Agent, Bank of America, N.A.) plus a basis point spread defined in the credit agreement. The term loan can be repaid in part or in full at any time without penalty, but in any event must be paid in full by October 2019.
On April 26, 2007, the company issued $125,000 in aggregate principal amount of 6.625% senior notes due May 1, 2037. The senior notes were priced at 98.513% of par value, and the resulting discount of $1,859 associated with the issuance of these senior notes is being amortized over the term of the notes using the effective interest rate method. The underwriting fee and direct debt issue costs totaling $1,524 will be amortized over the life of the notes. Although the coupon rate of the senior notes is 6.625%, the effective interest rate is 6.741% after taking into account the issuance discount. Interest on the senior notes is payable semi-annually on May 1 and November 1 of each year. The senior notes are unsecured senior obligations of the company and rank equally with the company's other unsecured and unsubordinated indebtedness. The indentures under which the senior notes were issued contain customary covenants and event of default provisions. The company may redeem some or all of the senior notes at any time at the greater of the full principal amount of the senior notes being redeemed or the present value of the remaining scheduled payments of principal and interest discounted to the redemption date on a semi-annual basis at the treasury rate plus 30 basis points, plus, in both cases, accrued and unpaid interest. In the event of the occurrence of both (i) a change of control of the company, and (ii) a downgrade of the notes below an investment grade rating by both Moody's Investors Service, Inc. and Standard & Poor's Ratings Services within a specified period, the company would be required to make an offer to purchase the senior notes at a price equal to 101% of the principal amount of the senior notes plus accrued and unpaid interest to the date of repurchase.
In June 1997, the company issued $175,000 of debt securities consisting of $75,000 of 7.125% coupon 10-year notes and $100,000 of 7.80% coupon 30-year debentures. The $75,000 of 7.125% coupon 10-year notes were repaid at maturity during fiscal 2007. In connection with the issuance of $175,000 in long-term debt securities, the company paid $23,688 to terminate three forward-starting interest rate swap agreements with notional amounts totaling $125,000. These swap agreements had been entered into to reduce exposure to interest rate risk prior to the issuance of the new long-term debt securities. As of the inception of one of the swap agreements, the company had received payments that were recorded as deferred income to be recognized as an adjustment to interest expense over the term of the new debt securities. As of the date the swaps were terminated, this deferred income totaled $18,710. The excess termination fees over the deferred income recorded has been deferred and is being recognized as an adjustment to interest expense over the term of the debt securities issued. As of October 31, 2016, the company had $1,680 remaining in other assets for the excess termination fees over deferred income.
Principal payments required on long-term debt in each of the next five fiscal years ending October 31 are as follows: 2017, $22,484; 2018, $23,193; 2019, $84,500; 2020, $0; 2021, $0; and after 2021, $223,730.
55
| 8 | STOCKHOLDERS' EQUITY |
Shares have been adjusted for all periods presented to reflect a two-for-one stock split effective September 16, 2016.
Stock Repurchase Program. On December 11, 2012, the company's Board of Directors authorized the repurchase of 10,000,000 shares of the company's common stock in open-market or in privately negotiated transactions. This program has no expiration date but may be terminated by the Board at any time. On December 3, 2015, the company's Board of Directors authorized the repurchase of up to an additional 8,000,000 shares of the company's common stock in open-market or in privately negotiated transactions. This repurchase program has no expiration date but may be terminated by the Board at any time.
During fiscal 2016, 2015, and 2014, the company paid $107,517, $105,964, and $101,674 to repurchase Board of Director authorized shares for repurchase in an aggregate of 2,560,567 shares, 3,122,358 shares, and 3,245,138 shares, respectively. As of October 31, 2016, 7,692,715 shares remained authorized by the Board of Directors for repurchase. The Board of Director authorized shares for repurchase does not include shares of our common stock surrendered by employees to satisfy minimum tax withholding obligations upon vesting of restricted stock granted under our stock-based compensation plans.
Treasury Shares. As of October 31, 2016, the company had 19,700,607 treasury shares at a cost of $1,280,495. On May 17, 2016, the company's Board of Directors authorized the retirement of 14,000,440 treasury shares, and the retired shares are included in the company's pool of authorized and unissued shares of common stock. As of October 31, 2015, the company had 46,827,048 treasury shares at a cost of $1,243,729.
Accumulated Other Comprehensive Loss. Components of accumulated other comprehensive loss ("AOCL"), net of tax, within the consolidated statements of stockholders' equity are as follows:
| | | | | | | | | | | |
| As of October 31 | 2016 | 2015 | 2014 |
|||||||
| | | | | | | | | | | |
| Foreign currency translation adjustments | $ | 31,430 | $ | 24,328 | $ | 12,536 | ||||
| Pension and post-retirement benefits | 6,359 | 5,386 | 5,266 | |||||||
| Derivative instruments | | 647 | | 129 | | (2,097) | ||||
| | | | | | | | | | | |
| Total accumulated other comprehensive loss | $ | 38,436 | $ | 29,843 | $ | 15,705 | ||||
| | | | | | | | | | | |
| | | | | | | | | | | |
| | | | | | | | | | | |
The components and activity of AOCL are as follows:
| | | | | | | | | | | | | | |
| Foreign Currency Translation Adjustments |
Pension and Postretirement Benefits |
Cash Flow Derivative Instruments |
Total |
||||||||||
| | | | | | | | | | | | | | |
| Balance as of October 31, 2015 | $ | 24,328 | $ | 5,386 | $ | 129 | $ | 29,843 | |||||
| Other comprehensive loss (income) before reclassifications | 7,102 | 973 | 1,116 | 9,191 | |||||||||
| Amounts reclassified from AOCL | | — | | — | | (598) | | (598) | |||||
| | | | | | | | | | | | | | |
| Net current period other comprehensive (income) loss | 7,102 | 973 | 518 | 8,593 | |||||||||
| | | | | | | | | | | | | | |
| Balance as of October 31, 2016 | $ | 31,430 | $ | 6,359 | $ | 647 | $ | 38,436 | |||||
| | | | | | | | | | | | | | |
| | | | | | | | | | | | | | |
| | | | | | | | | | | | | | |
| | | | | | | | | | | | | | |
| Foreign Currency Translation Adjustments |
Pension and Postretirement Benefits |
Cash Flow Derivative Instruments |
Total |
||||||||||
| | | | | | | | | | | | | | |
| Balance as of October 31, 2014 | $ | 12,536 | $ | 5,266 | $ | (2,097) | $ | 15,705 | |||||
| Other comprehensive loss (income) before reclassifications | 11,792 | — | (7,680) | 4,112 | |||||||||
| Amounts reclassified from AOCL | | — | | 120 | | 9,906 | | 10,026 | |||||
| | | | | | | | | | | | | | |
| Net current period other comprehensive (income) loss | 11,792 | 120 | 2,226 | 14,138 | |||||||||
| | | | | | | | | | | | | | |
| Balance as of October 31, 2015 | $ | 24,328 | $ | 5,386 | $ | 129 | $ | 29,843 | |||||
| | | | | | | | | | | | | | |
| | | | | | | | | | | | | | |
| | | | | | | | | | | | | | |
AOCL associated with pension and postretirement benefits are included in Note 11. Details of amounts reclassified from accumulated other comprehensive loss to the respective line items in net earnings for cash flow derivative instruments are included in Note 14.
| 9 | INCOME TAXES |
Earnings before income taxes were as follows:
| | | | | | | | | | | |
| Fiscal years ended October 31 | 2016 | 2015 | 2014 |
|||||||
| | | | | | | | | | | |
| Earnings before income taxes: | ||||||||||
U.S. |
$ | 292,184 | $ | 254,276 | $ | 239,501 | ||||
Non-U.S. |
38,276 | 36,755 | 16,944 | |||||||
| | | | | | | | | | | |
| Total | $ | 330,460 | $ | 291,031 | $ | 256,445 | ||||
| | | | | | | | | | | |
| | | | | | | | | | | |
| | | | | | | | | | | |
56
A reconciliation of the statutory federal income tax rate to the company's consolidated effective tax rate is summarized as follows:
| | | | | | | | | | | |
| Fiscal years ended October 31 | 2016 | 2015 | 2014 |
|||||||
| | | | | | | | | | | |
| Statutory federal income tax rate | | 35.0% | | 35.0% | | 35.0% | ||||
Domestic manufacturer's deduction |
(0.8) | (1.7) | (1.9) | |||||||
State and local income taxes, net of federal benefit |
| 1.5 | | 2.2 | | 1.5 | ||||
Non-U.S. taxes |
(1.8) | (3.1) | (1.2) | |||||||
Federal research tax credit |
| (1.5) | | (0.9) | | (0.2) | ||||
Other, net |
(2.3) | (0.8) | (1.0) | |||||||
| | | | | | | | | | | |
| Consolidated effective tax rate | | 30.1% | | 30.7% | | 32.2% | ||||
| | | | | | | | | | | |
| | | | | | | | | | | |
| | | | | | | | | | | |
Components of the provision for income taxes were as follows:
| | | | | | | | | | | |
| Fiscal years ended October 31 | 2016 | 2015 | 2014 |
|||||||
| | | | | | | | | | | |
| Provision for income taxes: | | | | |||||||
| Current: | ||||||||||
Federal |
$ | 77,685 | $ | 75,496 | $ | 75,815 | ||||
State |
6,929 | 9,389 | 5,997 | |||||||
Non-U.S. |
| 6,295 | | 6,219 | | 3,672 | ||||
| | | | | | | | | | | |
Current provision |
$ | 90,909 | $ | 91,104 | $ | 85,484 | ||||
| | | | | | | | | | | |
| Deferred: | | | | |||||||
Federal |
$ | 7,283 | $ | 430 | $ | (3,047) | ||||
State |
| 297 | | — | | (81) | ||||
Non-U.S. |
977 | (2,094) | 219 | |||||||
| | | | | | | | | | | |
Deferred benefit |
| 8,557 | | (1,664) | | (2,909) | ||||
| | | | | | | | | | | |
| Total provision for income taxes | $ | 99,466 | $ | 89,440 | $ | 82,575 | ||||
| | | | | | | | | | | |
| | | | | | | | | | | |
| | | | | | | | | | | |
The tax effects of temporary differences that give rise to the net deferred income tax assets are presented below:
| | | | | | | | |
| October 31 | 2016 | 2015 |
|||||
| | | | | | | | |
| Deferred tax assets (liabilities): | | | |||||
Compensation and benefits |
$ | 37,200 | $ | 41,341 | |||
Warranty and insurance |
| 17,443 | | 12,067 | |||
Advertising and sales allowance |
11,185 | 10,474 | |||||
Depreciation |
| (13,578) | | (7,689) | |||
Other |
6,845 | 12,264 | |||||
| | | | | | | | |
| Deferred tax assets | $ | 59,095 | $ | 68,457 | |||
| | | | | | | | |
Valuation allowance |
(1,867) | (1,801) | |||||
| | | | | | | | |
| Net deferred tax assets | $ | 57,228 | $ | 66,656 | |||
| | | | | | | | |
| | | | | | | | |
| | | | | | | | |
The valuation allowance as of October 31, 2016 and 2015 principally applies to capital loss carryforwards and foreign net operating loss carryforwards that are expected to expire prior to utilization. In fiscal 2016, the valuation allowance increased slightly for certain foreign jurisdictions with existing valuation allowances.
As of October 31, 2016, the company had net operating loss carryforwards of approximately $8,068 in foreign jurisdictions. The carryforward periods are as follows: $4,858 that do not expire; and $3,210 that expire between fiscal years 2017 and 2022.
No provision has been made for U.S. federal income taxes on certain undistributed earnings of foreign subsidiaries the company intends to permanently invest or that may be remitted substantially tax-free. The total of undistributed earnings that would be subject to federal income tax if remitted under existing law is approximately $117,866 as of October 31, 2016. Determination of the unrecognized deferred tax liability related to these earnings is not practicable because of the complexities with its hypothetical calculation. Upon distribution of these earnings, the company will be subject to U.S. taxes and withholding taxes payable to various foreign governments. A credit for foreign taxes already paid would be available to reduce the U.S. tax liability.
A reconciliation of the beginning and ending amount of unrecognized tax benefits is as follows:
| | | | | |
| Balance as of October 31, 2015 | $ | 6,343 | ||
| | | | | |
| Increase as a result of tax positions taken during a prior period | 683 | |||
| Increase as a result of tax positions taken during the current period | | 453 | ||
| Decrease relating to settlements with taxing authorities | (1,666) | |||
| Reductions as a result of statute of limitations lapses | | (638) | ||
| | | | | |
| Balance as of October 31, 2016 | $ | 5,175 | ||
| | | | | |
| | | | | |
| | | | | |
The company recognizes interest and penalties related to unrecognized tax benefits as a component of the provision for income taxes. In addition to the liability of $5,175 for unrecognized tax benefits as of October 31, 2016 was an amount of approximately $1,850 for accrued interest and penalties.
Included in the balance of unrecognized tax benefits as of October 31, 2016 are potential benefits of $5,089 that, if recognized, would affect the effective tax rate from continuing operations.
The company and its subsidiaries file income tax returns in the U.S. federal jurisdiction, and numerous state and foreign jurisdictions. With few exceptions, the company is no longer subject to U.S. federal, state and local, and non-U.S. income tax examinations by tax authorities for taxable years before fiscal 2012. The company is under audit in several state jurisdictions, and expects various statutes of limitation to expire during the next 12 months. Due to the uncertain response of taxing authorities, a range of outcomes cannot be reasonably estimated at this time.
| 10 | STOCK-BASED COMPENSATION PLANS |
The company maintains the 2010 plan for executive officers, other employees, and non-employee members of the company's Board of Directors. The 2010 plan allows the company to grant equity-based compensation awards, including stock options, restricted stock units, restricted stock, and performance share awards.
57
Shares and per share data have been adjusted for all periods presented to reflect a two-for-one stock split effective September 16, 2016.
The compensation costs related to stock-based awards were as follows:
| | | | | | | | | | | |
| Fiscal years ended October 31 | 2016 | 2015 | 2014 |
|||||||
| | | | | | | | | | | |
| Stock option awards | $ | 4,606 | $ | 4,704 | $ | 5,142 | ||||
| Restricted stock and restricted stock units | 1,891 | 1,756 | 1,653 | |||||||
| Performance share awards | | 3,676 | | 3,964 | | 4,496 | ||||
| Unrestricted common stock awards | 464 | 412 | 409 | |||||||
| | | | | | | | | | | |
| Total compensation cost for stock-based awards | $ | 10,637 | $ | 10,836 | $ | 11,700 | ||||
| | | | | | | | | | | |
| | | | | | | | | | | |
| | | | | | | | | | | |
| Related tax benefit from stock-based awards | $ | 3,936 | $ | 4,009 | $ | 4,329 | ||||
| | | | | | | | | | | |
The number of unissued shares of common stock available for future equity-based grants under the 2010 plan was 6,158,207 as of October 31, 2016. Shares of common stock issued upon exercise or settlement of stock options, restricted stock units, and performance shares are issued from treasury shares.
During fiscal 2016, 2015 and 2014, 12,320, 13,360 and 14,000 shares, respectively, of fully vested unrestricted common stock awards were granted to certain members of the company's Board of Directors as a component of their compensation for their service on the board and is recorded in selling, general, and administrative expense in the consolidated statements of earnings.
Stock Option Awards. Under the 2010 plan, stock options are granted with an exercise price equal to the closing price of the company's common stock on the date of grant, as reported by the New York Stock Exchange. Options are generally granted to executive officers, other employees, and non-employee members of the company's Board of Directors on an annual basis in the first quarter of the company's fiscal year. Options generally vest one-third each year over a three-year period and have a ten-year term. Other options granted to certain employees vest in full on the three-year anniversary of the date of grant and have a ten-year term. Generally, compensation expense equal to the grant date fair value is generally recognized for these awards over the vesting period. Stock options granted to executive officers and other employees are subject to accelerated expensing if the option holder meets the retirement definition set forth in the 2010 plan. In that case, the fair value of the options is expensed in the fiscal year of grant because generally the option holder must be employed as of the end of the fiscal year in which the options are granted in order for the options to continue to vest following retirement. Similarly, if a non-employee director has served on the company's Board of Directors for ten full fiscal years or more, the awards vest immediately upon retirement, and therefore, the fair value of the options granted is fully expensed on the date of the grant.
The table below presents stock option activity for fiscal 2016:
| | | | | | | | | | | | | | |
| Stock Option Awards |
Weighted- Average Exercise Price |
Weighted- Average Contractual Life (years) |
Intrinsic Value |
||||||||||
| | | | | | | | | | | | | | |
| Outstanding as of October 31, 2015 | | 5,829,442 | $ | 16.60 | | 5.2 | $ | 122,606 | |||||
| Granted | 618,884 | 38.73 | |||||||||||
| Exercised | | (1,491,666) | | 13.50 | | | | | |||||
| Cancelled/forfeited | (76,676) | 34.80 | |||||||||||
| Expired | | — | | — | | | | | |||||
| | | | | | | | | | | | | | |
| Outstanding as of October 31, 2016 | 4,879,984 | $ | 20.07 | 5.3 | $ | 135,697 | |||||||
| | | | | | | | | | | | | | |
| Exercisable as of October 31, 2016 | | 3,748,816 | $ | 15.61 | | 4.4 | $ | 120,973 | |||||
| | | | | | | | | | | | | | |
As of October 31, 2016, there was $1,888 of total unrecognized compensation expense related to unvested stock options. That cost is expected to be recognized over a weighted-average period of 1.93 years.
The table below presents the total market value of stock options exercised and the total intrinsic value of options exercised during the following fiscal years:
| | | | | | | | | | | |
| Fiscal years ended October 31 | 2016 | 2015 | 2014 |
|||||||
| | | | | | | | | | | |
| Market value of stock options exercised | $ | 61,468 | $ | 27,860 | $ | 19,017 | ||||
| Intrinsic value of options exercised1 | 41,365 | 18,739 | 12,311 | |||||||
| | | | | | | | | | | |
- 1
- Intrinsic value is calculated as amount by which the stock price at exercise date exceeded the option exercise price.
The fair value of each stock option is estimated on the date of grant using the Black-Scholes valuation method with the assumptions noted in the table below. The expected life is a significant assumption as it determines the period for which the risk-free interest rate, volatility, and dividend yield must be applied. The expected life is the average length of time in which executive officers, other employees, and non-employee directors are expected to exercise their stock options, which is primarily based on historical experience. Separate groups of employees and non-employee directors that have similar historical exercise behavior are considered separately for valuation purposes. Expected volatilities are based on the movement of the company's common stock over the most recent historical period equivalent to the expected life of the option. The risk-free interest rate for periods within the contractual life of the option is based on the U.S. Treasury rate over the expected life at the time of grant. Dividend yield is estimated over the expected life based on the company's historical cash dividends paid, expected future cash dividends and dividend yield, and expected changes in the company's stock price.
58
The table below illustrates the weighted-average valuation assumptions for all employee and non-employee director stock-based compensation for the following fiscal years:
| | | | | | | | |
| Fiscal years ended October 31 | 2016 | 2015 | 2014 |
||||
| | | | | | | | |
| Expected life of option in years | 5.97 | 5.94 | 6.00 | ||||
| Expected stock price volatility | 24.04% | 29.66% | 34.29% | ||||
| Risk-free interest rate | 1.80% | 1.61% | 1.92% | ||||
| Expected dividend yield | 1.24% | 1.29% | 1.25% | ||||
| | | | | | | | |
| Weighted-average fair value at date of grant | $8.79 | $8.41 | $9.35 | ||||
| | | | | | | | |
Restricted Stock and Restricted Stock Units. Under the 2010 plan, restricted stock and restricted stock unit awards are generally granted to certain employees that are not executive officers. Occasionally, restricted stock or restricted stock unit awards may be granted, including to executive officers, in connection with hiring, mid-year promotions, leadership transition, or retention. Restricted stock and restricted stock unit awards generally vest one-third each year over a three-year period, or vest in full on the three-year anniversary of the date of grant. Such awards may have performance-based rather than time-based vesting requirements. Compensation expense equal to the grant date fair value, which is equal to the closing price of the company's common stock on the date of grant multiplied by the number of shares subject to the restricted stock and restricted stock unit awards, is recognized for these awards over the vesting period.
Factors related to the company's restricted stock and restricted stock units during the following fiscal years are as follows:
| | | | | | | | | | | |
| Fiscal years ended October 31 | 2016 | 2015 | 2014 |
|||||||
| | | | | | | | | | | |
| Weighted-average fair value at date of grant | $ | 41.83 | $ | 33.88 | $ | 31.53 | ||||
| Fair value of restricted stock and restricted stock units vested | 1,265 | 1,702 | 1,890 | |||||||
| | | | | | | | | | | |
The table below summarizes the activity during fiscal 2016 for unvested restricted stock and restricted stock units:
| | | | | | | | |
| Restricted Stock and Units |
Weighted- Average Fair Value at Date of Grant |
||||||
| | | | | | | | |
| Unvested as of October 31, 2015 | | 183,594 | $ | 31.39 | |||
| Granted | 52,990 | 41.83 | |||||
| Vested | | (41,874) | | 30.21 | |||
| Forfeited | (19,370) | 33.17 | |||||
| | | | | | | | |
| Unvested as of October 31, 2016 | | 175,340 | $ | 34.63 | |||
| | | | | | | | |
| | | | | | | | |
| | | | | | | | |
As of October 31, 2016, there was $2,670 of total unrecognized compensation expense related to unvested restricted stock units. That cost is expected to be recognized over a weighted-average period of 2.14 years.
Performance Share Awards. The company grants performance share awards to executive officers and other employees under which they are entitled to receive shares of the company's common stock contingent on the achievement of performance goals of the company and businesses of the company, which are generally measured over a three-year period. The number of shares of common stock a participant receives will be increased (up to 200 percent of target levels) or reduced (down to zero) based on the level of achievement of performance goals and vest at the end of a three-year period. Performance share awards are generally granted on an annual basis in the first quarter of the company's fiscal year. Compensation expense is recognized for these awards on a straight-line basis over the vesting period based on the per share fair value as of the date of grant and the probability of achieving each performance goal.
Factors related to the company's performance share awards are as follows:
| | | | | | | | | | | |
| Fiscal years ended October 31 | 2016 | 2015 | 2014 |
|||||||
| | | | | | | | | | | |
| Weighted-average fair value at date of grant | $ | 38.89 | $ | 32.84 | $ | 29.66 | ||||
| Fair value of performance share awards vested | 7,454 | 7,989 | 7,926 | |||||||
| | | | | | | | | | | |
The table below summarizes the activity during fiscal 2016 for unvested performance share awards:
| | | | | | | | |
| Performance Shares |
Weighted- Average Fair Value at Date of Grant |
||||||
| | | | | | | | |
| Unvested as of October 31, 2015 | | 659,600 | $ | 26.43 | |||
| Granted | 116,400 | 38.89 | |||||
| Vested | | (302,800 | ) | | 21.03 | ||
| Cancelled/forfeited | (52,152 | ) | 32.39 | ||||
| | | | | | | | |
| Unvested as of October 31, 2016 | | 421,048 | $ | 33.00 | |||
| | | | | | | | |
| | | | | | | | |
| | | | | | | | |
As of October 31, 2016, there was $4,416 of total unrecognized compensation expense related to unvested performance share awards. That cost is expected to be recognized over a weighted-average period of 1.69 years.
| 11 | EMPLOYEE RETIREMENT PLANS |
The company maintains The Toro Company Investment, Savings, and Employee Stock Ownership Plan for eligible employees. The company's expenses under this plan were $16,986, $17,400, and $15,550 for the fiscal years ended October 31, 2016, 2015, and 2014, respectively.
In addition, the company and its subsidiaries have defined benefit, supplemental, and other retirement plans covering certain employees in the U.S. and the United Kingdom. The projected benefit obligation of these plans as of October 31, 2016 and 2015 was $45,603 and $46,427, respectively, and the net liability amount recognized in the consolidated balance sheets as of
59
October 31, 2016 and 2015 was $4,243 and $4,829, respectively. The accumulated benefit obligation of these plans as of October 31, 2016 and 2015 was $45,603 and $43,145, respectively. The funded status of these plans as of October 31, 2016 and 2015 was $12,984 and $11,303, respectively. The fair value of the plan assets as of October 31, 2016 and 2015 was $32,619 and $35,124, respectively. The net expense recognized in the consolidated financial statements for these plans was $1,220, $2,406, and $1,092 for the fiscal years ended October 31, 2016, 2015, and 2014, respectively.
Amounts recognized in accumulated other comprehensive loss consisted of:
| | | | | | | | | | | |
| Fiscal years ended October 31 | Defined Benefit Pension Plans |
Postretirement Benefit Plan |
Total |
|||||||
| | | | | | | | | | | |
| 2016 | ||||||||||
| Net actuarial loss (gain) | $ | 5,496 | $ | 554 | $ | 6,050 | ||||
| Net prior service cost | 309 | — | 309 | |||||||
| | | | | | | | | | | |
| Accumulated other comprehensive loss | $ | 5,805 | $ | 554 | $ | 6,359 | ||||
| | | | | | | | | | | |
| | | | | | | | | | | |
| | | | | | | | | | | |
| 2015 | ||||||||||
| | | | | | | | | | | |
| Net actuarial loss | $ | 5,100 | $ | (66 | ) | $ | 5,034 | |||
| Net prior service cost (credit) | 352 | — | 352 | |||||||
| | | | | | | | | | | |
| Accumulated other comprehensive loss | $ | 5,452 | $ | (66 | ) | $ | 5,386 | |||
| | | | | | | | | | | |
| | | | | | | | | | | |
| | | | | | | | | | | |
The following amounts are included in accumulated other comprehensive loss as of October 31, 2016 and are expected to be recognized as components of net periodic benefit cost during fiscal 2017.
| | | | | | | | | | | |
| Defined Benefit Pension Plans |
Postretirement Benefit Plan |
Total |
||||||||
| | | | | | | | | | | |
| Net actuarial loss | $ | 121 | $ | 7 | $ | 128 | ||||
| Net prior service cost | 67 | — | 67 | |||||||
| | | | | | | | | | | |
| Total | $ | 188 | $ | 7 | $ | 195 | ||||
| | | | | | | | | | | |
| | | | | | | | | | | |
| | | | | | | | | | | |
Amounts recognized in net periodic benefit cost and other comprehensive loss consisted of:
| | | | | | | | | | | |
| Fiscal years ended October 31 | Defined Benefit Pension Plans |
Postretirement Benefit Plan |
Total |
|||||||
| | | | | | | | | | | |
| 2016 | ||||||||||
| Net actuarial loss (gain) | $ | 469 | $ | 619 | $ | 1,088 | ||||
| Prior service cost | — | — | — | |||||||
| Amortization of unrecognized prior service (credit) cost | | (42 | ) | | — | | (42 | ) | ||
| Amortization of unrecognized actuarial loss (gain) | (73 | ) | — | (73 | ) | |||||
| | | | | | | | | | | |
| Total recognized in other comprehensive loss (income) | $ | 354 | $ | 619 | $ | 973 | ||||
| | | | | | | | | | | |
| | | | | | | | | | | |
| | | | | | | | | | | |
| Total recognized in net periodic benefit cost and other comprehensive loss | $ | 976 | $ | 1,217 | $ | 2,193 | ||||
| | | | | | | | | | | |
| 2015 | ||||||||||
| Net actuarial loss (gain) | $ | 37 | $ | (577 | ) | $ | (540 | ) | ||
| Prior service cost | 126 | — | 126 | |||||||
| Amortization of unrecognized prior service (credit) cost | | (32 | ) | | 25 | | (7 | ) | ||
| Amortization of unrecognized actuarial loss (gain) | 542 | (1 | ) | 541 | ||||||
| | | | | | | | | | | |
| Total recognized in other comprehensive loss (income) | $ | 673 | $ | (553 | ) | $ | 120 | |||
| | | | | | | | | | | |
| | | | | | | | | | | |
| | | | | | | | | | | |
| Total recognized in net periodic benefit cost and other comprehensive loss | $ | 2,475 | $ | 51 | $ | 2,526 | ||||
| | | | | | | | | | | |
The company has omitted the remaining disclosures for its defined benefit plans and postretirement healthcare plan as the company deems these plans to be immaterial to its consolidated financial position and results of operations.
| 12 | SEGMENT DATA |
The company's businesses are organized, managed, and internally grouped into segments based on differences in products and services. Segment selection was based on the manner in which management organizes segments for making operating and investment decisions and assessing performance. The company has identified nine operating segments and has aggregated those segments into three reportable segments: Professional, Residential, and Distribution. The aggregation of the company's segments is based on the segments having the following similarities: economic characteristics, types of products and services, types of production processes, type or class of customers, and method of distribution. The company's Distribution segment, which consists of a company-owned domestic distributorship, has been combined with the company's corporate activities and elimination of intersegment revenues and expenses and is shown as "Other" due to the insignificance of the segment.
60
The Professional business segment consists of turf and landscape equipment, snow and ice management equipment, and irrigation products. Turf and landscape equipment products include sports fields and grounds maintenance equipment, golf course mowing and maintenance equipment, landscape contractor mowing equipment, landscape creation and renovation equipment, rental and specialty construction equipment, and other maintenance equipment. Snow and ice management equipment products include snowplows, salt and sand spreaders, and related parts and accessories for light and medium duty trucks, ATVs, UTVs, skid steers, and front-end loaders. Irrigation products consist of sprinkler heads, electric and hydraulic valves, controllers, computer irrigation central control systems, and micro-irrigation drip tape and hose products, as well as professionally installed lighting products offered through distributors and landscape contractors that also purchase irrigation products. Professional business segment products are sold mainly through a network of distributors and dealers to professional users engaged in maintaining golf courses, sports fields, municipal properties, agricultural fields, residential and commercial landscapes, and removing snow, as well as directly to government customers, rental companies, and large retailers.
The Residential business segment consists of walk power mowers, riding mowers, snow throwers, replacement parts, and home solutions products, including trimmers, blowers, blower-vacuums, and underground and hose-end retail irrigation products sold in Australia. Residential business segment products are sold to homeowners through a network of distributors and dealers, and through a broad array of home centers, hardware retailers, and mass retailers, as well as over the internet.
The Other segment consists of the company's Distribution segment and corporate activities and elimination of intersegment revenues and expenses. Corporate activities include general corporate expenditures (finance, human resources, legal, information services, public relations, and similar activities) and other unallocated corporate assets and liabilities, such as corporate facilities, parts inventory, and deferred tax assets.
The accounting policies of the segments are the same as those described in the summary of significant accounting policies in Note 1. The company evaluates the performance of its Professional and Residential business segment results based on earnings from operations plus other income, net. Operating loss for the Other segment includes earnings (loss) from domestic wholly owned distribution companies, corporate activities, other income, and interest expense. The business segment's operating profits or losses include direct costs incurred at the segment's operating level plus allocated expenses, such as profit sharing and manufacturing expenses. The allocated expenses represent costs that these operations would have incurred otherwise, but do not include general corporate expenses, interest expense, and income taxes. The company accounts for intersegment gross sales at current market prices.
The following table shows summarized financial information concerning the company's reportable segments:
| | | | | | | | | | | | | | |
| Fiscal years ended October 31 |
Professional | Residential | Other | Total |
|||||||||
| | | | | | | | | | | | | | |
| 2016 | |||||||||||||
| Net sales | $ | 1,705,312 | $ | 669,131 | $ | 17,732 | $ | 2,392,175 | |||||
| Intersegment gross sales | 28,138 | 354 | (28,492 | ) | — | ||||||||
| Earnings (loss) before income taxes | | 352,060 | | 73,691 | | (95,291 | ) | | 330,460 | ||||
| Total assets | 774,762 | 188,920 | 423,836 | 1,387,518 | |||||||||
| Capital expenditures | | 27,296 | | 13,794 | | 9,633 | | 50,723 | |||||
| Depreciation and amortization | 40,715 | 10,406 | 12,976 | 64,097 | |||||||||
| | | | | | | | | | | | | | |
| 2015 | |||||||||||||
| Net sales | $ | 1,639,659 | $ | 725,682 | $ | 25,534 | $ | 2,390,875 | |||||
| Intersegment gross sales | 45,634 | 406 | (46,040 | ) | — | ||||||||
| Earnings (loss) before income taxes | | 308,010 | | 84,956 | | (101,935 | ) | | 291,031 | ||||
| Total assets | 805,686 | 217,093 | 280,879 | 1,303,658 | |||||||||
| Capital expenditures | | 29,016 | | 9,953 | | 17,405 | | 56,374 | |||||
| Depreciation and amortization | 42,799 | 9,131 | 11,213 | 63,143 | |||||||||
| | | | | | | | | | | | | | |
| 2014 | |||||||||||||
| Net sales | $ | 1,477,578 | $ | 672,443 | $ | 22,670 | $ | 2,172,691 | |||||
| Intersegment gross sales | 41,376 | 424 | (41,800 | ) | — | ||||||||
| Earnings (loss) before income taxes | | 276,305 | | 76,916 | | (96,776 | ) | | 256,445 | ||||
| Total assets | 573,086 | 172,984 | 446,345 | 1,192,415 | |||||||||
| Capital expenditures | | 25,226 | | 12,417 | | 33,495 | | 71,138 | |||||
| Depreciation and amortization | 34,228 | 8,883 | 10,027 | 53,138 | |||||||||
| | | | | | | | | | | | | | |
The following table presents the details of the Other segment operating loss before income taxes:
| | | | | | | | | | | |
Fiscal years ended October 31 |
2016 | 2015 | 2014 |
|||||||
| | | | | | | | | | | |
Corporate expenses |
$ | (95,288 | ) | $ | (95,167 | ) | $ | (88,539 | ) | |
Interest expense |
(19,336 | ) | (18,757 | ) | (15,426 | ) | ||||
Other income |
| 19,333 | | 11,989 | | 7,189 | ||||
| | | | | | | | | | | |
Total |
$ | (95,291 | ) | $ | (101,935 | ) | $ | (96,776 | ) | |
| | | | | | | | | | | |
| | | | | | | | | | | |
| | | | | | | | | | | |
The following table presents net sales for groups of similar products and services:
| | | | | | | | | | | |
Fiscal years ended October 31 |
2016 | 2015 | 2014 |
|||||||
| | | | | | | | | | | |
Equipment |
$ | 2,001,150 | $ | 2,004,274 | $ | 1,765,845 | ||||
Irrigation and lighting |
391,025 | 386,601 | 406,846 | |||||||
| | | | | | | | | | | |
Total |
$ | 2,392,175 | $ | 2,390,875 | $ | 2,172,691 | ||||
| | | | | | | | | | | |
| | | | | | | | | | | |
| | | | | | | | | | | |
61
Sales to one customer in the Residential segment accounted for 11 percent of total consolidated gross sales in fiscal 2016, 2015, and 2014.
The following geographic area data includes net sales based on product shipment destination. Long-lived assets consist of net property, plant, and equipment, which is determined based on physical location in addition to allocated capital tooling from U.S. plant facilities.
| | | | | | | | | | | |
Fiscal years ended |
United States |
Foreign Countries |
Total |
|||||||
| | | | | | | | | | | |
2016 |
||||||||||
Net sales |
$ | 1,812,587 | $ | 579,588 | $ | 2,392,175 | ||||
Long-lived assets |
188,869 | 33,169 | 222,038 | |||||||
| | | | | | | | | | | |
2015 |
||||||||||
Net sales |
$ | 1,780,240 | $ | 610,635 | $ | 2,390,875 | ||||
Long-lived assets |
190,262 | 34,733 | 224,995 | |||||||
| | | | | | | | | | | |
2014 |
||||||||||
Net sales |
$ | 1,550,077 | $ | 622,614 | $ | 2,172,691 | ||||
Long-lived assets |
169,797 | 35,398 | 205,195 | |||||||
| | | | | | | | | | | |
| 13 | COMMITMENTS AND CONTINGENT LIABILITIES |
Total rental expense for operating leases was $26,363, $24,986, and $24,329 for the fiscal years ended October 31, 2016, 2015, and 2014, respectively. As of October 31, 2016, future minimum lease payments under noncancelable operating leases amounted to $96,136 as follows: 2017, $15,002; 2018, $13,540; 2019, $11,597; 2020, $10,580; 2021, $10,042; and after 2021, $35,375.
Wholesale Financing. The company is party to a joint venture with TCFIF established as Red Iron. See Note 3 for additional information related to Red Iron. Some products sold to independent dealers in Australia are financed by a third-party finance company. This third-party financing company purchased $28,887 of receivables from the company during fiscal 2016. As of October 31, 2016, $12,316 of receivables financed by the third-party financing company, excluding Red Iron, was outstanding.
The company also enters into limited inventory repurchase agreements with third party financing companies and Red Iron for receivables financed by third party financing companies and Red Iron. As of October 31, 2016, the company was contingently liable to repurchase up to a maximum amount of $10,389 of inventory related to receivables under these financing arrangements. The company has repurchased only immaterial amounts of inventory under these repurchase agreements since inception.
End-User Financing. The company has agreements with third party financing companies to provide lease-financing options to golf course and sports fields and grounds equipment customers in the U.S. and select countries in Europe. The company has no contingent liabilities for residual value or credit collection risk under these agreements with third party financing companies.
From time to time, the company enters into agreements where it provides recourse to third party finance companies in the event of default by the customer for lease payments to the third-party finance company. The company's maximum exposure for credit collection as of October 31, 2016 was $4,904.
As of October 31, 2016, the company had $5,140 of noncancelable purchase commitments with some suppliers for materials and supplies as part of the normal course of business. The company also entered into a construction agreement for renovations at its corporate facilities located in Bloomington, Minnesota, for a maximum obligation, subject to certain exceptions, of $3,038. The amount of the remaining obligation as of October 31, 2016 was $2,524.
Letters of credit are issued by the company during the normal course of business, as required by some vendor contracts. As of October 31, 2016 and 2015, the company had $8,984 and $16,245, respectively, in outstanding letters of credit.
The company is party to litigation in the ordinary course of business. Such matters are generally subject to uncertainties and to outcomes that are not predictable with assurance and that may not be known for extended periods of time. Litigation occasionally involves claims for punitive, as well as compensatory, damages arising out of the use of the company's products. Although the company is self-insured to some extent, the company maintains insurance against certain product liability losses. The company is also subject to litigation and administrative and judicial proceedings with respect to claims involving asbestos and the discharge of hazardous substances into the environment. Some of these claims assert damages and liability for personal injury, remedial investigations or clean up and other costs and damages. The company is also typically involved in commercial disputes, employment disputes, and patent litigation cases in which it is asserting or defending against patent infringement claims. To prevent possible infringement of the company's patents by others, the company periodically reviews competitors' products. To avoid potential liability with respect to others' patents, the company regularly reviews certain patents issued by the United States Patent and Trademark Office and foreign patent offices. Management believes these activities help minimize its risk of
62
being a defendant in patent infringement litigation. The company is currently involved in patent litigation cases, including cases by or against competitors, where it is asserting and defending against claims of patent infringement. Such cases are at varying stages in the litigation process. The company records a liability in its consolidated financial statements for costs related to claims, including future legal costs, settlements and judgments, where the company has assessed that a loss is probable and an amount can be reasonably estimated. If the reasonable estimate of a probable loss is a range, the company records the most probable estimate of the loss or the minimum amount when no amount within the range is a better estimate than any other amount. The company discloses a contingent liability even if the liability is not probable or the amount is not estimable, or both, if there is a reasonable possibility that a material loss may have been incurred. In the opinion of management, the amount of liability, if any, with respect to these matters, individually or in the aggregate, will not materially affect its consolidated results of operations, financial position, or cash flows.
| 14 | FINANCIAL INSTRUMENTS |
Financial instruments, which potentially subject the company to concentrations of credit risk, consist principally of accounts receivable that are concentrated in the Professional and Residential business segments. The credit risk associated with these segments is limited because of the large number of customers in the company's customer base and their geographic dispersion, except for the Residential segment that has significant sales to The Home Depot.
Derivative Instruments and Hedging Activities
The company is exposed to foreign currency exchange rate risk arising from transactions in the normal course of business, such as sales to third party customers, sales and loans to wholly owned foreign subsidiaries, foreign plant operations, and purchases from suppliers. The company actively manages the exposure of its foreign currency exchange rate market risk by entering into various hedging instruments, authorized under company policies that place controls on these activities, with counterparties that are highly rated financial institutions. The company's hedging activities primarily involve the use of forward currency contracts, as well as cross currency swaps that are intended to offset intercompany loan exposures. The company uses derivative instruments only in an attempt to limit underlying exposure from foreign currency exchange rate fluctuations and to minimize earnings and cash flow volatility associated with foreign currency exchange rate changes. Decisions on whether to use such contracts are primarily based on the amount of exposure to the currency involved and an assessment of the near-term market value for each currency. The company's policy does not allow the use of derivatives for trading or speculative purposes. The company also made an accounting policy election to use the portfolio exception with respect to measuring counterparty credit risk for derivative instruments, and to measure the fair value of a portfolio of financial assets and financial liabilities on the basis of the net open risk position with each counterparty. The company's primary currency exchange rate exposures are with the Euro, the Australian dollar, the Canadian dollar, the British pound, the Mexican peso, the Japanese yen, the Chinese Renminbi, and the Romanian New Leu against the U.S. dollar, as well as the Romanian New Leu against the Euro.
Cash Flow Hedges. The company recognizes all derivative instruments as either assets or liabilities at fair value on the consolidated balance sheet and formally documents relationships between cash flow hedging instruments and hedged transactions, as well as its risk-management objective and strategy for undertaking hedge transactions. This process includes linking all derivatives to the forecasted transactions, such as sales to third parties, foreign plant operations, and purchases from suppliers. Changes in fair values of outstanding cash flow hedge derivatives, except the ineffective portion, are recorded in other comprehensive income ("OCI"), until net earnings is affected by the variability of cash flows of the hedged transaction. Gains and losses on the derivative representing either hedge ineffectiveness or hedge components excluded from the assessment of effectiveness are recognized in net earnings. The consolidated statement of earnings classification of effective hedge results is the same as that of the underlying exposure. Results of hedges of sales and foreign plant operations are recorded in net sales and cost of sales, respectively, when the underlying hedged transaction affects net earnings. The maximum amount of time the company hedges its exposure to the variability in future cash flows for forecasted trade sales and purchases is two years. Results of hedges of intercompany loans are recorded in other income, net as an offset to the remeasurement of the foreign loan balance.
The company formally assesses, at a hedge's inception and on an ongoing basis, whether the derivatives that are designated as hedges have been highly effective in offsetting changes in the cash flows of the hedged transactions and whether those derivatives may be expected to remain highly effective in future periods. When it is determined that a derivative is not, or has ceased to be, highly effective as a hedge, the company discontinues hedge accounting prospectively. When the company discontinues hedge accounting because it is no longer probable, but it is still reasonably possible that the forecasted transaction will occur by the end of the originally expected period or within an additional two-month period of time thereafter, the gain or loss on the derivative remains in AOCL and is reclassified to net earnings when the forecasted transaction affects net earnings. However, if it is probable that a forecasted transaction will not occur by the end of the originally specified time period or within an additional two-month period of time thereafter, the gains and losses that were in AOCL are recognized immediately in net earnings. In all
63
situations in which hedge accounting is discontinued and the derivative remains outstanding, the company carries the derivative at its fair value on the consolidated balance sheets, recognizing future changes in the fair value in other income, net. For the fiscal years ended October 31, 2016 and 2015, there were immaterial gains and losses on contracts reclassified into earnings as a result of the discontinuance of cash flow hedges. As of October 31, 2016, the notional amount of outstanding forward contracts designated as cash flow hedges was $122,497. During the third quarter of fiscal 2016, the company terminated its one cross currency interest rate swap instrument outstanding with gains on the instrument recorded in other income.
Derivatives Not Designated as Hedging Instruments. The company also enters into foreign currency contracts that include forward currency contracts and may include cross currency swaps to mitigate the remeasurement of specific assets and liabilities on the consolidated balance sheets. These contracts are not designated as hedging instruments. Accordingly, changes in the fair value of hedges of recorded balance sheet positions, such as cash, receivables, payables, intercompany notes, and other various contractual claims to pay or receive foreign currencies other than the functional currency, are recognized immediately in other income, net, on the consolidated statements of earnings together with the transaction gain or loss from the hedged balance sheet position.
The following table presents the fair value of the company's derivatives and consolidated balance sheet location.
| | | | | | | | |
Fair Value at October 31 |
2016 | 2015 |
|||||
| | | | | | | | |
Asset Derivatives |
| | |||||
Derivatives Designated as Hedging Instruments |
|||||||
Prepaid expenses and other current assets |
| | |||||
Forward currency contracts |
$ | 1,535 | $ | 2,102 | |||
Cross currency contract |
| — | | — | |||
Derivatives Not Designated as Hedging Instruments |
|||||||
Prepaid expenses and other current assets |
| | |||||
Forward currency contracts |
432 | 1,071 | |||||
Cross currency contract |
| — | | 2,136 | |||
| | | | | | | | |
Total Assets |
$ | 1,967 | $ | 5,309 | |||
| | | | | | | | |
| | | | | | | | |
| | | | | | | | |
Liability Derivatives |
| | |||||
Derivatives Designated as Hedging Instruments |
|||||||
Accrued liabilities |
| | |||||
Forward currency contracts |
$ | 973 | $ | 1,363 | |||
Cross currency contract |
| — | | 134 | |||
Derivatives Not Designated as Hedging Instruments |
|||||||
Accrued liabilities |
| | |||||
Forward currency contracts |
792 | 348 | |||||
Cross currency contract |
| — | | — | |||
| | | | | | | | |
Total Liabilities |
$ | 1,765 | $ | 1,845 | |||
| | | | | | | | |
| | | | | | | | |
| | | | | | | | |
The following table presents the impact of derivative instruments on the consolidated statements of earnings and the consolidated statements of comprehensive income for the company's derivatives designated as cash flow hedging instruments for the fiscal years ended October 31, 2016 and 2015, respectively.
|
Effective Portion | Ineffective Portion and excluded from Effectiveness Testing |
|||||||||||||||||||||
|
Gain (Loss) Recognized in OCI on Derivatives |
Location of Gain (Loss) Reclassified from AOCL into Income |
Gain (Loss) Reclassified from AOCL into Income |
Location of Gain (Loss) Recognized in Income on Derivatives |
Gain (Loss) Recognized in Income on Derivatives |
||||||||||||||||||
| | | | | | | | | | | | | | | | | | | | | | | | |
October 31 |
2016 | 2015 | 2016 | 2015 | 2016 | 2015 |
|||||||||||||||||
| | | | | | | | | | | | | | | | | | | | | | | | |
Forward currency contracts |
$ | (961 | ) | $ | (745 | ) | Net sales | $ | 2,094 | $ | 13,067 | Other income, net | $ | 608 | $ | 747 | |||||||
Forward currency contracts |
181 | (1,687 | ) | Cost of sales | (2,598 | ) | (2,806 | ) | |||||||||||||||
Cross currency contracts |
| 255 | | 200 | Other income, net | | (94 | ) | | (355 | ) | | | | | | |||||||
| | | | | | | | | | | | | | | | | | | | | | | | |
Total derivatives designated as cash flow hedges |
$ | (525 | ) | $ | (2,232 | ) | Total | $ | (598 | ) | $ | 9,906 | Total | $ | 608 | $ | 747 | ||||||
| | | | | | | | | | | | | | | | | | | | | | | | |
| | | | | | | | | | | | | | | | | | | | | | | | |
| | | | | | | | | | | | | | | | | | | | | | | | |
As of October 31, 2016, the company anticipates to reclassify approximately $153 of gains from AOCL to earnings during the next twelve months.
64
The following table presents the impact of derivative instruments on the consolidated statements of earnings for the company's derivatives not designated as hedging instruments.
| | | | | | | | | | | | |
| Fiscal Years Ended October 31 |
Location of Gain (Loss) Recognized in Net Earnings |
2016 | 2015 | ||||||||
| | | | | | | | | | | | |
| Forward currency contracts | Other income, net | $ | (4 | ) | $ | 7,703 | |||||
| Cross currency contracts | Other income, net | (191 | ) | 1,400 | |||||||
| | | | | | | | | | | | |
| Total derivatives not designated as hedges | | $ | (195 | ) | $ | 9,103 | |||||
| | | | | | | | | | | | |
| | | | | | | | | | | | |
| | | | | | | | | | | | |
The company entered into an International Swap Dealers Association ("ISDA") Master Agreement with each counterparty that permits the net settlement of amounts owed under their respective contracts. The ISDA Master Agreement is an industry standardized contract that governs all derivative contracts entered into between the company and the respective counterparty. Under these master netting agreements, net settlement generally permits the company or the counterparty to determine the net amount payable or receivable for contracts due on the same date or in the same currency for similar types of derivative transactions. The company records the fair value of its derivative contracts at the net amount in its consolidated balance sheets.
The following tables show the effects of the master netting arrangements on the fair value of the company's derivative contracts that are recorded in the consolidated balance sheets.
| | | | | | | |
October 31 |
2016 | 2015 | ||||
| | | | | | | |
Assets |
| | ||||
Forward currency contracts |
||||||
Gross Amounts of Recognized Assets |
$ | 2,264 | $ | 3,380 | ||
Gross Liabilities Offset in the Balance Sheets |
(297) | (207) | ||||
| | | | | | | |
Net Amounts of Assets Presented in the Balance Sheets |
| 1,967 | | 3,173 | ||
| | | | | | | |
Cross currency contracts |
||||||
Gross Amounts of Recognized Assets |
| — | | 2,136 | ||
Gross Liabilities Offset in the Balance Sheets |
— | — | ||||
| | | | | | | |
Net Amounts of Assets Presented in the Balance Sheets |
| — | | 2,136 | ||
| | | | | | | |
Total Assets |
$ | 1,967 | $ | 5,309 | ||
| | | | | | | |
| | | | | | | |
| | | | | | | |
Liabilities |
| | ||||
Forward currency contracts |
||||||
Gross Amounts of Recognized Liabilities |
$ | (1,765) | $ | (1,711) | ||
Gross Assets Offset in the Balance Sheets |
— | — | ||||
| | | | | | | |
Net Amounts of Liabilities Presented in the Balance Sheets |
| (1,765) | | (1,711) | ||
| | | | | | | |
Cross currency contracts |
||||||
Gross Amounts of Recognized Liabilities |
| — | | (134) | ||
Gross Assets Offset in the Balance Sheets |
— | — | ||||
| | | | | | | |
Net Amounts of Liabilities Presented in the Balance Sheets |
| — | | (134) | ||
| | | | | | | |
Total Liabilities |
$ | (1,765) | $ | (1,845) | ||
| | | | | | | |
| | | | | | | |
| | | | | | | |
| 15 | FAIR VALUE |
The company categorizes its assets and liabilities into one of three levels based on the assumptions (inputs) used in valuing the asset or liability. Estimates of fair value for financial assets and financial liabilities are based on the framework established in the accounting guidance for fair value measurements. The framework defines fair value, provides guidance for measuring fair value, and requires certain disclosures. The framework discusses valuation techniques such as the market approach (comparable market prices), the income approach (present value of future income or cash flow), and the cost approach (cost to replace the service capacity of an asset or replacement cost). The framework utilizes a fair value hierarchy that prioritizes the inputs to valuation techniques used to measure fair value into three broad levels. Level 1 provides the most reliable measure of fair value, while Level 3 generally requires significant management judgment. The three levels are defined as follows:
- •
- Level 1: Unadjusted quoted prices in active markets for identical assets or liabilities.
- •
- Level 2: Observable inputs other than Level 1 prices, such as quoted prices for similar assets or liabilities in active markets; quoted prices for identical assets or liabilities in markets that are not active; or other inputs that are observable or can be corroborated by observable market data for substantially the full term of the assets or liabilities.
- •
- Level 3: Unobservable inputs reflecting management's assumptions about the inputs used in pricing the asset or liability.
Cash balances are valued at their carrying amounts in the consolidated balance sheets, which are reasonable estimates of their fair value due to their short-term nature. Forward currency contracts are valued based on observable market transactions of forward currency prices and spot currency rates as of the reporting date. The fair value of cross currency contracts is determined using discounted cash flow analysis on the expected cash flows of each derivative. This analysis reflects the contractual terms of the derivatives, including the period to maturity, and uses observable market-based inputs such as interest rates and foreign currency exchange rates. In addition, credit valuation adjustments, which consider the impact of any credit enhancements to the contracts, such as collateral postings, thresholds, mutual puts, and guarantees, are incorporated in the fair values to account for potential nonperformance risk. The unfunded deferred compensation liability is primarily subject to changes in fixed-income investment contracts based on current yields. For accounts receivable and accounts payable, carrying amounts are a reasonable estimate of fair value given their short-term nature.
65
Assets and liabilities measured at fair value on a recurring basis, as of October 31, 2016 and 2015, respectively, are summarized below:
| | | | | | | | | |
| Fair Value Measurements Using Inputs Considered as: |
||||||||
| October 31, 2016 | Fair Value |
Level 1 | Level 2 | Level 3 | ||||
| | | | | | | | | |
| Assets: | ||||||||
| Cash and cash equivalents | $ 273,555 | $ 273,555 | $ — | $ — | ||||
| Forward currency contracts | 1,967 | — | 1,967 | — | ||||
| Cross currency contracts | — | — | — | — | ||||
| | | | | | | | | |
| Total Assets | $ 275,522 | $ 273,555 | $ 1,967 | $ — | ||||
| | | | | | | | | |
| | | | | | | | | |
| | | | | | | | | |
| Liabilities: | ||||||||
| Forward currency contracts | $ 1,765 | $ — | $ 1,765 | $ — | ||||
| Cross currency contracts | — | — | — | — | ||||
| Deferred compensation liabilities | 1,149 | — | 1,149 | — | ||||
| | | | | | | | | |
| Total Liabilities | $ 2,914 | $ — | $ 2,914 | $ — | ||||
| | | | | | | | | |
| | | | | | | | | |
| | | | | | | | | |
| | | | | | | | | |
| Fair Value Measurements Using Inputs Considered as: |
||||||||
| October 31, 2015 | Fair Value |
Level 1 | Level 2 | Level 3 | ||||
| | | | | | | | | |
| Assets: | ||||||||
| Cash and cash equivalents | $ 126,275 | $ 126,275 | $ — | $ — | ||||
| Forward currency contracts | 3,173 | — | 3,173 | — | ||||
| Cross currency contracts | 2,136 | — | 2,136 | — | ||||
| | | | | | | | | |
| Total Assets | $ 131,584 | $ 126,275 | $ 5,309 | $ — | ||||
| | | | | | | | | |
| | | | | | | | | |
| | | | | | | | | |
| Liabilities: | ||||||||
| Forward currency contracts | $ 1,711 | $ — | $ 1,711 | $ — | ||||
| Cross currency contracts | 134 | — | 134 | — | ||||
| Deferred compensation liabilities | 1,652 | — | 1,652 | — | ||||
| | | | | | | | | |
| Total Liabilities | $ 3,497 | $ — | $ 3,497 | $ — | ||||
| | | | | | | | | |
| | | | | | | | | |
| | | | | | | | | |
The company measures certain assets and liabilities at fair value on a non-recurring basis. Assets acquired and liabilities assumed as part of acquisitions are measured at fair value. Refer to Note 2 for additional information. There were no transfers between Level 1 and Level 2 during the fiscal years ended October 31, 2016 and 2015.
As of October 31, 2016, the estimated fair value of long-term debt with fixed interest rates was $293,295 compared to its carrying amount of $243,407. As of October 31, 2015, the estimated fair value of long-term debt with fixed interest rates was $298,541 compared to its carrying amount of $254,452. The fair value is estimated by discounting the projected cash flows using the rate at which similar amounts of debt could currently be borrowed. Long-term debt is a Level 2 liability in the fair value hierarchy.
| 16 | RELATED PARTY TRANSACTION |
On November 14, 2014, during the first quarter of fiscal 2015, the company acquired substantially all of the assets (excluding accounts receivable) of the BOSS® professional snow and ice management business of privately held Northern Star Industries, Inc. The purchase price included a cash payment and issuance of an unsecured promissory note in the aggregate principal amount of $30 million. Under the terms of the note, interest will accrue at the rate of 4.0% per year and principal payments of $10 million each, together with accrued interest, will be payable on the first, second, and third anniversaries of the closing date of the acquisition, subject to certain conditions. Effective as of the closing of the acquisition on November 14, 2014 and through May 31, 2016, the company employed David J. Brule II, who is also a minority shareholder of Northern Star Industries, Inc., as an executive officer of the company.
| 17 | SUBSEQUENT EVENTS |
On November 3, 2016, the company entered into an agreement to acquire Regnerbau Calw GmbH, a privately held manufacturer of professional irrigation equipment. The transaction is subject to customary closing conditions and currently is expected to close during the company's fiscal 2017 first quarter.
On November 29, 2016 the company entered into amended agreements for its Red Iron joint venture with TCFIF. The purpose of these amendments is, among other things, to: (i) revise the term of Red Iron from October 31, 2017 to October 31, 2024, subject to two-year extensions thereafter unless either party provides written notice to the other party of non-renewal at least one year prior to the end of the then-current term; (ii) provide for an additional exclusivity incentive payment by TCFIF to the company; (iii) extend the maturity date of the revolving credit facility used by Red Iron primarily to finance the acquisition of inventory of products from the company and its affiliates by its distributors and dealers in the United States from October 31, 2017 to October 31, 2024 and to increase the amount available under such revolving credit facility from $450,000 to $550,000; (iv) refine the calculations related to the estimated reserve provided for in the Fourth Amended and Restated Program and Repurchase Agreement with respect to the accounts of certain dealers and distributors; (v) adjust the percentages in the formula used to calculate the amount of the purchase option that Red Iron Holding Corporation has pursuant to the Limited Liability Company Agreement of Red Iron to acquire the equity interest of TCFIF Joint Venture I, LLC in Red Iron at the end of the applicable term or in certain termination events; (vi) expand the coverage of the Red Iron program to additional products of the company and its affiliates; and (vii) certain other non-material amendments.
66
The company evaluated all subsequent events and concluded that no additional subsequent events have occurred that would require recognition in the financial statements or disclosure in the notes to the financial statements.
| 18 | QUARTERLY FINANCIAL DATA (Unaudited) |
Summarized quarterly financial data for fiscal 2016 and 2015 are as follows:
| | | | | | | | | | | | | | |
| Fiscal Year Ended October 31, 2016 Quarter |
First | Second | Third | Fourth | |||||||||
| | | | | | | | | | | | | | |
| Net sales | $ | 486,398 | $ | 836,441 | $ | 600,980 | $ | 468,356 | |||||
| Gross profit | 182,654 | 303,187 | 216,617 | 172,137 | |||||||||
| Net earnings | | 39,261 | | 105,681 | | 55,822 | | 30,230 | |||||
| Basic net earnings per share1,2 | 0.36 | 0.96 | 0.51 | 0.28 | |||||||||
| Diluted net earnings per share1,2 | | 0.35 | | 0.94 | | 0.50 | | 0.27 | |||||
| | | | | | | | | | | | | | |
| Fiscal Year Ended October 31, 2015 Quarter |
First | Second | Third | Fourth | |||||||||
| | | | | | | | | | | | | | |
| Net sales | $ | 474,211 | $ | 826,242 | $ | 609,615 | $ | 480,807 | |||||
| Gross profit | 168,999 | 281,972 | 216,390 | 168,574 | |||||||||
| Net earnings | | 30,950 | | 93,763 | | 53,324 | | 23,554 | |||||
| Basic net earnings per share1,2 | 0.28 | 0.84 | 0.48 | 0.21 | |||||||||
| Diluted net earnings per share1,2 | | 0.27 | | 0.82 | | 0.47 | | 0.21 | |||||
| | | | | | | | | | | | | | |
- 1
- Net earnings per share amounts do not equal the full year total due to changes in the number
of shares outstanding during the periods and rounding.
- 2
- Per share data has been adjusted for all periods presented to reflect a two-for-one stock
split effective September 16, 2016.
67
ITEM 9. CHANGES IN AND DISAGREEMENTS WITH ACCOUNTANTS ON ACCOUNTING AND FINANCIAL DISCLOSURE
None.
ITEM 9A. CONTROLS AND PROCEDURES
The company maintains disclosure controls and procedures (as defined in Exchange Act Rules 13a-15(e) and 15d-15(e)) that are designed to provide reasonable assurance that information required to be disclosed by the company in the reports it files or submits under the Exchange Act is recorded, processed, summarized, and reported within the time periods specified in the SEC's rules and forms and that such information is accumulated and communicated to the company's management, including its principal executive and principal financial officers, or persons performing similar functions, as appropriate to allow timely decisions regarding required disclosure. In designing and evaluating its disclosure controls and procedures, the company recognizes that any controls and procedures, no matter how well designed and operated, can provide only reasonable assurance of achieving the desired control objectives, and management is required to apply judgment in evaluating the cost-benefit relationship of possible internal controls. The company's management evaluated, with the participation of the company's Chief Executive Officer and Chief Financial Officer, the effectiveness of the design and operation of the company's disclosure controls and procedures as of the end of the period covered by this Annual Report on Form 10-K. Based on that evaluation, the company's Chief Executive Officer and Chief Financial Officer concluded that the company's disclosure controls and procedures were effective as of the end of such period to provide reasonable assurance that information required to be disclosed in its Exchange Act reports is recorded, processed, summarized, and reported within the time periods specified in the SEC's rules and forms, and that such information relating to the company and its consolidated subsidiaries is accumulated and communicated to management, including the Chief Executive Officer and Chief Financial Officer, as appropriate to allow timely decisions regarding required disclosures. The company's management report on internal control over financial reporting is included in this report in Part II, Item 8, "Financial Statements and Supplementary Data" under the caption "Management's Report on Internal Control over Financial Reporting." The report of KPMG LLP, the company's independent registered public accounting firm, regarding the effectiveness of the company's internal control over financial reporting is included in this report in Part II, Item 8, "Financial Statements and Supplementary Data" under the caption "Report of Independent Registered Public Accounting Firm." There was no change in the company's internal control over financial reporting that occurred during the company's fourth fiscal quarter ended October 31, 2016 that has materially affected, or is reasonably likely to materially affect, the company's internal control over financial reporting.
None.
ITEM 10. DIRECTORS, EXECUTIVE OFFICERS AND CORPORATE GOVERNANCE
Information on executive officers required by this item is incorporated by reference from "Executive Officers of the Registrant" in Part I of this report. Additional information on certain executive officers and other information required by this item is incorporated by reference to information to be contained under the captions "Stock Ownership -Section 16(a) Beneficial Ownership Reporting Compliance," "Proposal One — Election of Directors — Information About Board Nominees and Continuing Directors," "Corporate Governance — Code of Conduct and Code of Ethics for our CEO and Senior Financial Officers," and "Corporate Governance — Board Committees," in the company's proxy statement for its 2017 Annual Meeting of Shareholders to be filed with the SEC.
During the fourth quarter of fiscal 2016, the company did not make any material changes to the procedures by which shareholders may recommend nominees to the Board of Directors, as described in the company's proxy statement for its 2016 Annual Meeting of Shareholders and disclosed in the company's quarterly report on Form 10-Q for the quarterly period ended July 29, 2016. The company has a Code of Ethics for its CEO and Senior Financial Officers, a copy of which is posted on the company's web site at www.thetorocompany.com (select the "Investor Information" link and then the "Corporate Governance" link). The company intends to satisfy the disclosure requirements of Item 5.05 of Form 8-K and applicable NYSE rules regarding amendments to or waivers from any provision of its code of ethics by posting such information on its web site at www.thetorocompany.com (select the "Investor Information" link and then the "Corporate Governance" link).
ITEM 11. EXECUTIVE COMPENSATION
Information required by this item is incorporated by reference to information to be contained under the captions "Executive Compensation" and "Corporate Governance – Director Compensation" in the company's proxy statement for its 2017 Annual Meeting of Shareholders to be filed with the SEC.
68
ITEM 12. SECURITY OWNERSHIP OF CERTAIN BENEFICIAL OWNERS AND MANAGEMENT AND RELATED STOCKHOLDER MATTERS
Information required by this item is incorporated by reference to information to be contained under the captions "Stock Ownership" and "Equity Compensation Plan Information" in the company's proxy statement for its 2017 Annual Meeting of Shareholders to be filed with the SEC.
ITEM 13. CERTAIN RELATIONSHIPS AND RELATED TRANSACTIONS, AND DIRECTOR INDEPENDENCE
Information required by this item is incorporated by reference to information to be contained under the caption "Corporate Governance — Director Independence" and "Corporate Governance — Related Person Transactions and Policies and Procedures Regarding Related Person Transactions" in the company's proxy statement for its 2017 Annual Meeting of Shareholders to be filed with the SEC.
ITEM 14. PRINCIPAL ACCOUNTANT FEES AND SERVICES
Information required by this item is incorporated by reference to information to be contained under the captions "Proposal Two — Ratification of Selection of Independent Registered Public Accounting Firm — Audit, Audit-Related, Tax and Other Fees" and "Proposal Two — Ratification of Selection of Independent Registered Public Accounting Firm — Pre-Approval Policies and Procedures" in the company's proxy statement for its 2017 Annual Meeting of Shareholders to be filed with the SEC.
ITEM 15. EXHIBITS, FINANCIAL STATEMENT SCHEDULES
(a) 1. List of Financial Statements
The following consolidated financial statements of The Toro Company and its consolidated subsidiaries are included in Part II, Item 8, "Financial Statements and Supplementary Data" of this report:
- •
- Management's Report on Internal Control over Financial Reporting.
- •
- Report of Independent Registered Public Accounting Firm.
- •
- Consolidated Statements of Earnings for the fiscal years ended October 31, 2016, 2015, and 2014.
- •
- Consolidated Statements of Comprehensive Income for the fiscal years ended October 31, 2016, 2015, and 2014.
- •
- Consolidated Balance Sheets as of October 31, 2016 and 2015.
- •
- Consolidated Statements of Cash Flows for the fiscal years ended October 31, 2016, 2015, and 2014.
- •
- Consolidated Statements of Stockholders' Equity for the fiscal years ended October 31, 2016, 2015, and 2014.
- •
- Notes to Consolidated Financial Statements.
(a) 2. List of Financial Statement Schedules
The following financial statement schedule of The Toro Company and its subsidiaries is included herein:
- •
- Schedule II — Valuation and Qualifying Accounts
All other schedules are omitted because the required information is inapplicable or the information is presented in the consolidated financial statements or related notes.
The following exhibits are incorporated herein by reference or are filed or furnished with this report as indicated below:
| Exhibit Number | Description |
|
| | | |
2.1 (1) Agreement to Form Joint Venture dated August 12, 2009 by and between The Toro Company and TCF Inventory Finance, Inc. (incorporated by reference to Exhibit 2.1 to Registrant's Current Report on Form 8-K dated August 12, 2009, Commission File No. 1-8649).** |
||
2.2 (2) First Amendment to Agreement to Form Joint Venture dated June 6, 2012 by and between The Toro Company and TCF Inventory Finance, Inc. (incorporated by reference to Exhibit 2.1 to Registrant's Quarterly Report on Form 10-Q for the fiscal quarter ended May 4, 2012, Commission File No. 1-8649).** |
||
2.3 (3) Second Amendment to Agreement to Form Joint Venture dated November 29, 2016 by and between The Toro Company and TCF Inventory Finance, Inc. (incorporated by reference to Exhibit 2.1 to Registrant's Current Report on Form 8-K dated November 29, 2016, Commission File No. 1-8649).** |
||
69
| 2.4 (1) Limited Liability Company Agreement of Red Iron Acceptance, LLC dated August 12, 2009 by and between Red Iron Holding Corporation and TCFIF Joint Venture I, LLC (incorporated by reference to Exhibit 2.2 to Registrant's Current Report on Form 8-K dated August 12, 2009, Commission File No. 1-8649).** | ||
2.5 Amendment No. 1 to Limited Liability Company Agreement of Red Iron Acceptance, LLC dated May 31, 2011 by and between Red Iron Holding Corporation and TCFIF Joint Venture I, LLC (incorporated by reference to Exhibit 2.4 to Registrant's Annual Report on Form 10-K for the fiscal year ended October 31, 2012, Commission File No. 1-8649).** |
||
2.6 (2) Second Amendment to Limited Liability Company Agreement of Red Iron Acceptance, LLC dated June 6, 2012 by and between Red Iron Holding Corporation and TCFIF Joint Venture I, LLC (incorporated by reference to Exhibit 2.2 to Registrant's Quarterly Report on Form 10-Q for the fiscal quarter ended May 4, 2012, Commission File No. 1-8649).** |
||
2.7 (3) Third Amendment to Limited Liability Company Agreement of Red Iron Acceptance, LLC dated November 29, 2016 by and between Red Iron Holding Corporation and TCFIF Joint Venture I, LLC (incorporated by reference to Exhibit 2.2 to Registrant's Current Report on Form 8-K dated November 29, 2016, Commission File No. 1-8649).** |
||
2.8 Receivable Purchase Agreement dated October 1, 2009 by and among Toro Credit Company, as Seller, The Toro Company, and Red Iron Acceptance, LLC, as Buyer (incorporated by reference to Exhibit 2.1 to Registrant's Current Report on Form 8-K dated October 1, 2009, Commission File No. 1-8649).** |
||
2.9 (3) Fourth Amended and Restated Program and Repurchase Agreement dated as of November 29, 2016 by and between The Toro Company and Red Iron Acceptance, LLC (incorporated by reference to Exhibit 2.3 to Registrant's Current Report on Form 8-K dated November 29, 2016, Commission File No. 1-8649). |
||
2.10 Asset Purchase Agreement dated as of October 27, 2014 among The Toro Company, Northern Star Industries, Inc. and its shareholders (incorporated by reference to Exhibit 2.1 to Registrant's Current Report on Form 8-K dated October 27, 2014, Commission File No. 1-8649).** |
||
3.1 and 4.1 Restated Certificate of Incorporation of The Toro Company (incorporated by reference to Exhibit 3.1 to Registrant's Current Report on Form 8-K dated June 17, 2008, Commission File No. 1-8649). |
||
3.2 and 4.2 Certificate of Amendment to Restated Certificate of Incorporation of The Toro Company (incorporated by reference to Exhibit 3.1 to Registrant's Current Report on Form 8-K dated March 12, 2013, Commission File No. 1-8649). |
||
3.3 and 4.3 Amended and Restated Bylaws of The Toro Company (incorporated by reference to Exhibit 3.1 to Registrant's Current Report on Form 8-K dated July 19, 2016, Commission File No. 1-8649). |
||
4.4 Specimen Form of Common Stock Certificate (incorporated by reference to Exhibit 4(c) to Registrant's Quarterly Report on Form 10-Q for the quarter ended August 1, 2008, Commission File No. 1-8649). |
||
4.5 Indenture dated as of January 31, 1997 between Registrant and First National Trust Association, as Trustee, relating to The Toro Company's 7.80% Debentures due June 15, 2027 (incorporated by reference to Exhibit 4(a) to Registrant's Current Report on Form 8-K dated June 24, 1997, Commission File No. 1-8649). |
||
4.6 Indenture dated as of April 20, 2007 between Registrant and The Bank of New York Trust Company, N.A., as Trustee, relating to The Toro Company's 6.625% Notes due May 1, 2037 (incorporated by reference to Exhibit 4.3 to Registrant's Registration Statement on Form S-3 filed with the Securities and Exchange Commission on April 23, 2007, Registration No. 333-142282). |
||
70
| 4.7 First Supplemental Indenture dated as of April 26, 2007 between Registrant and The Bank of New York Trust Company, N.A., as Trustee, relating to The Toro Company's 6.625% Notes due May 1, 2037 (incorporated by reference to Exhibit 4.1 to Registrant's Current Report on Form 8-K dated April 23, 2007, Commission File No. 1-8649). | ||
4.8 Form of The Toro Company 6.625% Note due May 1, 2037 (incorporated by reference to Exhibit 4.2 to Registrant's Current Report on Form 8-K dated April 23, 2007, Commission File No. 1-8649). |
||
10.1 The Toro Company Amended and Restated 2010 Equity and Incentive Plan, as amended and restated (filed herewith).* |
||
10.2 The Toro Company Performance Share Plan (As Amended January 15, 2008) (incorporated by reference to Exhibit 10.2 to Registrant's Current Report on Form 8-K dated January 15, 2008, Commission File No. 1-8649).* |
||
10.3 The Toro Company 2000 Stock Option Plan (As Amended December 3, 2008) (incorporated by reference to Exhibit 10.5 to Registrant's Annual Report on Form 10-K for the fiscal year ended October 31, 2008, Commission File No. 1-8649).* |
||
10.4 The Toro Company Supplemental Benefit Plan, Amended and Restated Effective January 1, 2009 (incorporated by reference to Exhibit 10(d) to Registrant's Quarterly Report on Form 10-Q for the fiscal quarter ended August 1, 2008, Commission File No. 1-8649).* |
||
10.5 The Toro Company Deferred Compensation Plan, Amended and Restated Effective January 1, 2009 (incorporated by reference to Exhibit 10(a) to Registrant's Quarterly Report on Form 10-Q for the fiscal quarter ended August 1, 2008, Commission File No. 1-8649).* |
||
10.6 The Toro Company Deferred Compensation Plan for Officers, Amended and Restated Effective January 1, 2009 (incorporated by reference to Exhibit 10(b) to Registrant's Quarterly Report on Form 10-Q for the fiscal quarter ended August 1, 2008, Commission File No. 1-8649).* |
||
10.7 The Toro Company Deferred Compensation Plan for Non-Employee Directors, Amended and Restated Effective January 1, 2009 (incorporated by reference to Exhibit 10(c) to Registrant's Quarterly Report on Form 10-Q for the fiscal quarter ended August 1, 2008, Commission File No. 1-8649).* |
||
10.8 The Toro Company 2000 Directors Stock Plan (As Amended March 18, 2009) (incorporated by reference to Exhibit 10.1 to Registrant's Quarterly Report on Form 10-Q for the fiscal quarter ended May 1, 2009, Commission File No. 1-8649).* |
||
10.9 Form of Nonqualified Stock Option Agreement between The Toro Company and its Non-Employee Directors under The Toro Company 2000 Directors Stock Plan (incorporated by reference to Exhibit 10.20 to Registrant's Annual Report on Form 10-K for the fiscal year ended October 31, 2008, Commission File No. 1-8649).* |
||
10.10 Form of Nonemployee Director Stock Option Agreement between The Toro Company and its Non-Employee Directors under The Toro Company 2010 Equity and Incentive Plan (incorporated by reference to 10.14 to Registrant's Annual Report on Form 10-K for fiscal year ended October 31, 2014, Commission File No. 1-8649).* |
||
10.11 Form of Nonemployee Director Stock Option Agreement between The Toro Company and its Non-Employee Directors under The Toro Company Amended and Restated 2010 Equity and Incentive Plan, as amended and restated (filed herewith).* |
||
10.12 Form of Nonqualified Stock Option Agreement between The Toro Company and its officers and other employees under The Toro Company 2000 Stock Option Plan (incorporated by reference to Exhibit 10.21 to Registrant's Annual Report on Form 10-K for the fiscal year ended October 31, 2008, Commission File No. 1-8649).* |
||
10.13 Form of Nonqualified Stock Option Agreement between The Toro Company and its officers and other employees under The Toro Company 2010 Equity and Incentive Plan (incorporated by reference to Exhibit 10.16 to Registrant's Annual Report on Form 10-K for the fiscal year ended October 31, 2014, Commission File No. 1-8649).* |
||
71
| 10.14 Form of Nonqualified Stock Option Agreement between The Toro Company and its officers and other employees under The Toro Company Amended and Restated 2010 Equity and Incentive Plan, as amended and restated (filed herewith).* | ||
10.15 Form of Performance Share Award Agreement between The Toro Company and its officers and other employees under The Toro Company Performance Share Plan (incorporated by reference to Exhibit 10(t) to Registrant's Annual Report on Form 10-K for the fiscal year ended October 31, 2007, Commission File No. 1-8649).* |
||
10.16 Form of Performance Share Award Agreement between The Toro Company and its officers and other employees under The Toro Company 2010 Equity and Incentive Plan (incorporated by reference to Exhibit 10.18 to Registrant's Annual Report on Form 10-K for the fiscal year ended October 31, 2014, Commission File No. 1-8649).* |
||
10.17 Form of Performance Share Award Agreement between The Toro Company and its officers and other employees under The Toro Company Amended and Restated 2010 Equity and Incentive Plan, as amended and restated (filed herewith).* |
||
10.18 Form of Annual Performance Award Agreement between The Toro Company and its officers and other employees under The Toro Company Amended and Restated 2010 Equity and Incentive Plan, as amended and restated (filed herewith).* |
||
10.19 Form of Restricted Stock Award Agreement between The Toro Company and its officers and other employees under The Toro Company Amended and Restated 2010 Equity and Incentive Plan, as amended and restated (filed herewith).* |
||
10.20 Form of Restricted Stock Unit Award Agreement between The Toro Company and its officers and other employees under The Toro Company 2010 Equity and Incentive Plan (incorporated by reference to Exhibit 10.21 to Registrant's Annual Report on Form 10-K for the fiscal year ended October 31, 2014, Commission File No. 1-8649).* |
||
10.21 Form of Restricted Stock Unit Award Agreement between The Toro Company and its officers and other employees under The Toro Company Amended and Restated 2010 Equity and Incentive Plan, as amended and restated (filed herewith).* |
||
10.22 Indemnification Agreement with the members of the Board of Directors (incorporated by reference to Exhibit 10(u) to Registrant's Annual Report on Form 10-K for the fiscal year ended October 31, 2006, Commission File No. 1-8649).* |
||
10.23 The Toro Company Change in Control Severance Compensation Policy and attached Form of Release (incorporated by reference to Exhibit 10.1 to Registrant's Current Report on Form 8-K dated January 18, 2011, Commission File No. 1-8649).* |
||
10.24 Offer Letter dated July 25, 2011 between The Toro Company and Renee J. Peterson (incorporated by reference to Exhibit 10.1 to Registrant's Current Report on Form 8-K dated July 29, 2011, Commission File No. 1-8649).* |
||
10.25 Offer Letter dated August 18, 2015 between The Toro Company and Richard M. Olson (incorporated by reference to Exhibit 10.1 to Registrant's Current Report on Form 8-K dated August 19, 2015, Commission File No. 1-8649).* |
||
10.26 Offer Letter dated July 19, 2016 between The Toro Company and Richard M. Olson (incorporated by reference to Exhibit 10.1 to Registrant's Current Report on Form 8-K dated July 19, 2016, Commission File No. 1-8649).* |
||
10.27 Offer Letter dated July 19, 2016 between The Toro Company and Michael J. Hoffman (incorporated by reference to Exhibit 10.2 to Registrant's Current Report on Form 8-K dated July 19, 2016, Commission File No. 1-8649).* |
||
72
| 10.28 Credit Agreement dated as of October 27, 2014 among The Toro Company, Toro Manufacturing LLC, Exmark Manufacturing Company Incorporated, Toro International Company and certain subsidiaries, as Borrowers, the lenders from time to time party thereto, Bank of America, N.A., as Administrative Agent, Swingline Lender and Letter of Credit Issuer and Wells Fargo Bank, National Association, as Syndication Agent (incorporated by reference to Exhibit 10.1 to Registrant's Current Report on Form 8-K dated October 27, 2014, Commission File No. 1-8649). | ||
10.29 (1) Credit and Security Agreement dated August 12, 2009 by and between Red Iron Acceptance, LLC and TCF Inventory Finance, Inc. (incorporated by reference to Exhibit 10.1 to Registrant's Current Report on Form 8-K dated August 12, 2009, Commission File No. 1-8649). |
||
10.30 (2) First Amendment to Credit and Security Agreement dated June 6, 2012 by and between Red Iron Acceptance, LLC and TCF Inventory Finance, Inc. (incorporated by reference to Exhibit 10.1 to Registrant's Quarterly Report on Form 10-Q for the fiscal quarter ended May 4, 2012, Commission File No. 1-8649). |
||
10.31 Second Amendment to Credit and Security Agreement dated November 29, 2016 by and between Red Iron Acceptance, LLC and TCF Inventory Finance, Inc. (incorporated by reference to Exhibit 10.1 to Registrant's Current Report on Form 8-K dated November 29, 2016, Commission File No. 1-8649). |
||
12 Computation of Ratio of Earnings to Fixed Charges (filed herewith). |
||
21 Subsidiaries of Registrant (filed herewith). |
||
23 Consent of Independent Registered Public Accounting Firm (filed herewith). |
||
31.1 Certification of Chief Executive Officer Pursuant to Rule 13a-14(a) (Section 302 of the Sarbanes-Oxley Act of 2002) (filed herewith). |
||
31.2 Certification of Chief Financial Officer Pursuant to Rule 13a-14(a) (Section 302 of the Sarbanes-Oxley Act of 2002) (filed herewith). |
||
32 Certification of Chief Executive Officer and Chief Financial Officer Pursuant to 18 U.S.C. Section 1350, as Adopted Pursuant to Section 906 of the Sarbanes-Oxley Act of 2002 (furnished herewith). |
||
101 The following financial information from The Toro Company's Annual Report on Form 10-K for the fiscal year ended October 31, 2016, filed with the SEC on December 22, 2016, formatted in eXtensible Business Reporting Language (XBRL): (i) Consolidated Statements of Earnings for each of the fiscal years in the three-year period ended October 31, 2016, (ii) Consolidated Statements of Comprehensive Income for each of the fiscal years in the three-year period ended October 31, 2016, (iii) Consolidated Balance Sheets as of October 31, 2016 and 2015, (iv) Consolidated Statements of Cash Flows for each of the fiscal years in the three-year period ended October 31, 2016, (v) Consolidated Statements of Stockholders' Equity each of the fiscal years in the three-year period ended October 31, 2016, and (vi) Notes to Consolidated Financial Statements (filed herewith). |
||
(1) Portions of this exhibit have been redacted and are subject to an order granting confidential treatment under the Securities Exchange Act of 1934, as amended (File No. 001-08649, CF #31557). The redacted material was filed separately with the Securities and Exchange Commission.
(2) Portions of this exhibit have been redacted and are subject to an order granting confidential treatment under the Securities Exchange Act of 1934, as amended (File No. 001-08649, CF # 28545). The redacted material was filed separately with the Securities and Exchange Commission.
(3) Portions of this exhibit have been redacted and are subject to an order granting confidential treatment under the Securities Exchange Act of 1934, as amended (File No. 001-08649, CF # 34521). The redacted material was filed separately with the Securities and Exchange Commission.
* Management contract or compensatory plan or arrangement.
** All exhibits and schedules to this exhibit have been omitted pursuant to Item 601(b)(2) of Regulation S-K. Toro will furnish the omitted exhibits and schedules to the Securities and Exchange Commission upon request by the Securities and Exchange Commission.
See Item 15(a)(3) above.
(c) Financial Statement Schedules
See Item 15(a)(2) above.
73
THE TORO COMPANY AND SUBSIDIARIES
Valuation and Qualifying Accounts
| | | | | | | | | | | | | | |
(Dollars in thousands) |
Balance as of the beginning of the fiscal year |
Charged to costs and expenses1 |
Deductions2 | Balance as of the end of the fiscal year |
|||||||||
| | | | | | | | | | | | | | |
Fiscal year ended October 31, 2016 |
|||||||||||||
Allowance for doubtful accounts and notes receivable reserves |
$ | 1,378 | $ | 424 | $ | 193 | $ | 1,609 | |||||
| | | | | | | | | | | | | | |
Fiscal year ended October 31, 2015 |
|||||||||||||
Allowance for doubtful accounts and notes receivable reserves |
| 1,481 | | 350 | | 453 | | 1,378 | |||||
| | | | | | | | | | | | | | |
Fiscal year ended October 31, 2014 |
|||||||||||||
Allowance for doubtful accounts and notes receivable reserves |
| 3,425 | | (79 | ) | | 1,865 | | 1,481 | ||||
| | | | | | | | | | | | | | |
- 1
- Provision/(recovery).
- 2
- Uncollectible accounts charged off.
| | | | | | | | | | | | | | |
(Dollars in thousands) |
Balance as of the beginning of the fiscal year |
Charged to costs and expenses1 |
Deductions2 | Balance as of the end of the fiscal year |
|||||||||
| | | | | | | | | | | | | | |
Fiscal year ended October 31, 2016 |
|||||||||||||
Accrued advertising and marketing programs |
$ | 76,689 | $ | 355,509 | $ | 350,883 | $ | 81,315 | |||||
| | | | | | | | | | | | | | |
Fiscal year ended October 31, 2015 |
|||||||||||||
Accrued advertising and marketing programs |
| 66,169 | | 318,211 | | 307,691 | | 76,689 | |||||
| | | | | | | | | | | | | | |
Fiscal year ended October 31, 2014 |
|||||||||||||
Accrued advertising and marketing programs |
| 64,191 | | 306,650 | | 304,672 | | 66,169 | |||||
| | | | | | | | | | | | | | |
- 1
- Provision consists of rebates, cooperative advertising, floor planning costs, commissions, and other promotional program expenses.
The expense of each program is classified either as a reduction of net sales or as a component of selling, general, and administrative expense.
- 2
- Claims paid.
74
Pursuant to the requirements of Section 13 or 15(d) of the Securities Exchange Act of 1934, as amended, the registrant has duly caused this report to be signed on its behalf by the undersigned, thereunto duly authorized.
| THE TORO COMPANY (Registrant) |
||||||
By: |
/s/ Renee J. Peterson Renee J. Peterson |
Dated: December 22, 2016 |
||||
| Vice President, Treasurer and Chief Financial Officer |
Pursuant to the requirements of the Securities Exchange Act of 1934, as amended, this report has been signed below by the following persons on behalf of the registrant and in the capacities and on the dates indicated.
| | | | | |
| Signature | Title | Date | ||
| | | | | |
| /s/ Richard M. Olson Richard M. Olson |
President and Chief Executive Officer and Director (principal executive officer) |
December 22, 2016 | ||
/s/ Renee J. Peterson Renee J. Peterson |
Vice President, Treasurer and Chief Financial Officer (principal financial officer) |
December 22, 2016 |
||
/s/ Thomas J. Larson Thomas J. Larson |
Vice President, Corporate Controller (principal accounting officer) |
December 22, 2016 |
||
/s/ Michael J. Hoffman Michael J. Hoffman |
Chairman of the Board |
December 22, 2016 |
||
/s/ Robert C. Buhrmaster Robert C. Buhrmaster |
Director |
December 22, 2016 |
||
/s/ Janet K. Cooper Janet K. Cooper |
Director |
December 22, 2016 |
||
/s/ Gary L. Ellis Gary L. Ellis |
Director |
December 22, 2016 |
||
/s/ Jeffrey M. Ettinger Jeffrey M. Ettinger |
Director |
December 22, 2016 |
||
/s/ Katherine J. Harless Katherine J. Harless |
Director |
December 22, 2016 |
||
/s/ D. Christian Koch D. Christian Koch |
Director |
December 22, 2016 |
||
/s/ James C. O'Rourke James C. O'Rourke |
Director |
December 22, 2016 |
||
/s/ Gregg W. Steinhafel Gregg W. Steinhafel |
Director |
December 22, 2016 |
||
/s/ Christopher A. Twomey Christopher A. Twomey |
Director |
December 22, 2016 |
75