Attached files
| file | filename |
|---|---|
| EX-23.1 - EX-23.1 - Schneider National, Inc. | d238359dex231.htm |
| EX-21.1 - EX-21.1 - Schneider National, Inc. | d238359dex211.htm |
| EX-10.8 - EX-10.8 - Schneider National, Inc. | d238359dex108.htm |
| EX-10.7 - EX-10.7 - Schneider National, Inc. | d238359dex107.htm |
| EX-10.6 - EX-10.6 - Schneider National, Inc. | d238359dex106.htm |
| EX-9.1 - EX-9.1 - Schneider National, Inc. | d238359dex91.htm |
| EX-3.2 - EX-3.2 - Schneider National, Inc. | d238359dex32.htm |
| EX-3.1 - EX-3.1 - Schneider National, Inc. | d238359dex31.htm |
Table of Contents
As filed with the Securities and Exchange Commission on December 22, 2016
Registration No. 333-
UNITED STATES
SECURITIES AND EXCHANGE COMMISSION
Washington, D.C. 20549
FORM S-1
REGISTRATION STATEMENT
UNDER
THE SECURITIES ACT OF 1933
Schneider National, Inc.
(Exact Name of Registrant as Specified in Its Charter)
| Wisconsin | 4213 | 39-1258315 | ||
| (State or Other Jurisdiction of Incorporation or Organization) |
(Primary Standard Industrial Classification Code Number) |
(I.R.S. Employer Identification Number) |
3101 Packerland Drive
Green Bay, WI 54313
(920) 592-2000
(Address, Including Zip Code, and Telephone Number, Including Area Code, of Registrant’s Principal Executive Offices)
Christopher B. Lofgren
Chief Executive Officer
Schneider National, Inc.
3101 Packerland Drive
Green Bay, WI 54313
(920) 592-2000
(Name, Address, Including Zip Code, and Telephone Number, Including Area Code, of Agent For Service)
Copies to:
| William J. Whelan, III Johnny G. Skumpija Cravath, Swaine & Moore LLP 825 Eighth Avenue New York, New York 10019 (212) 474-1000 |
Paul J. Kardish General Counsel, Secretary and Executive Vice President Schneider National, Inc. 3101 Packerland Drive Green Bay, WI 54313 (920) 592-2000 |
Kenneth B. Wallach Ryan R. Bekkerus Simpson Thacher & Bartlett LLP 425 Lexington Avenue New York, New York 10017 (212) 455-2000 |
Approximate date of commencement of proposed sale to the public: As soon as practicable after the effective date of this Registration Statement.
If any of the securities being registered on this form are to be offered on a delayed or continuous basis pursuant to Rule 415 under the Securities Act of 1933, check the following box. ☐
If this form is filed to register additional securities for an offering pursuant to Rule 462(b) under the Securities Act, check the following box and list the Securities Act registration statement number of the earlier effective registration statement for the same offering. ☐
If this form is a post-effective amendment filed pursuant to Rule 462(c) under the Securities Act, check the following box and list the Securities Act registration statement number of the earlier effective registration statement for the same offering. ☐
If this form is a post-effective amendment filed pursuant to Rule 462(d) under the Securities Act, check the following box and list the Securities Act registration statement number of the earlier effective registration statement for the same offering. ☐
Indicate by check mark whether the registrant is a large accelerated filer, an accelerated filer, a non-accelerated filer, or a smaller reporting company. See the definitions of “large accelerated filer,” “accelerated filer” and “smaller reporting company” in Rule 12b-2 of the Exchange Act.
| Large accelerated filer | ☐ | Accelerated filer | ☐ | |||
| Non-accelerated filer | ☒ (Do not check if a smaller reporting company) | Smaller reporting company | ☐ | |||
CALCULATION OF REGISTRATION FEE
|
| ||||
| Title Of Each Class Of Securities To Be Registered |
Proposed Maximum Aggregate Offering Price(1)(2) |
Amount Of Registration Fee | ||
| Class B Common Stock, no par value |
$100,000,000 | $11,590 | ||
|
| ||||
|
| ||||
| (1) | Includes the offering price of any additional shares of Class B common stock that the underwriters have the option to purchase to cover over-allotments, if any. |
| (2) | Estimated solely for the purpose of computing the amount of the registration fee pursuant to Rule 457(o) under the Securities Act of 1933. |
The registrant hereby amends this Registration Statement on such date or dates as may be necessary to delay its effective date until the Registrant shall file a further amendment which specifically states that this Registration Statement shall thereafter become effective in accordance with Section 8(a) of the Securities Act of 1933 or until the Registration Statement shall become effective on such date as the Commission, acting pursuant to said Section 8(a), may determine.
Table of Contents
The information in this prospectus is not complete and may be changed. We and the selling shareholders may not sell these securities until the registration statement filed with the Securities and Exchange Commission is effective. This prospectus is not an offer to sell these securities and we are not soliciting offers to buy these securities in any jurisdiction where the offer or sale is not permitted.
Subject to completion, dated December 22, 2016
shares

Schneider National, Inc.
Class B Common Stock
This is Schneider National, Inc.’s initial public offering. We are selling shares of our Class B common stock and the selling shareholders identified in this prospectus are selling shares of our Class B common stock. We will not receive any proceeds from the sale of shares being sold by the selling shareholders. This is our initial public offering and no public market exists for our Class B common stock. We anticipate that the initial public offering price of our Class B common stock will be between $ and $ per share. We intend to apply to list our Class B common stock on The New York Stock Exchange (“NYSE”) under the symbol “SNDR.”
Immediately following this offering, we will have two classes of authorized and outstanding common stock, Class A common stock and Class B common stock. The rights of holders of Class A common stock and Class B common stock are identical, except with respect to certain voting and conversion rights. The record holder of our Class A common stock, the Schneider National, Inc. Voting Trust, is entitled to ten votes per share and holders of our Class B common stock are entitled to one vote per share. Each share of Class A common stock is convertible into one share of Class B common stock at any time and automatically converts into one share of Class B common stock if it is withdrawn from the Schneider National, Inc. Voting Trust and/or is transferred outside the Schneider family. See “Description of Capital Stock—Class A Common Stock.” Outstanding shares of Class A common stock will represent approximately % of the voting power of our outstanding capital stock following this offering.
Immediately following this offering, the Schneider National, Inc. Voting Trust, our controlling shareholder, will continue to control a majority of the votes among all shares eligible to vote in the election of our directors. As a result, we will be a “controlled company” within the meaning of the corporate governance rules of the NYSE. See “Management—Controlled Company Status.”
We and the selling shareholders have granted the underwriters an option, exercisable for 30 days from the date of this prospectus, to purchase up to an additional shares of Class B common stock at the public offering price, less underwriting discounts and commissions.
Investing in our Class B common stock involves risks. See “Risk Factors” beginning on page 20.
| Per Share |
Total |
|||||||
| Initial public offering price |
$ | $ | ||||||
| Underwriting discounts and commissions* |
$ | $ | ||||||
| Proceeds, before expenses, to us |
$ | $ | ||||||
| Proceeds, before expenses, to selling shareholders |
$ | $ | ||||||
| * | See “Underwriting” for a description of all compensation payable to the underwriters. |
The underwriters expect to deliver the shares to purchasers on or about , 2017 through the book-entry facilities of The Depository Trust Company.
Neither the Securities and Exchange Commission nor any state securities commission has approved or disapproved of these securities or determined if this prospectus is truthful or complete. Any representation to the contrary is a criminal offense.
| Morgan Stanley | UBS Investment Bank | |||||
| BofA Merrill Lynch | ||||||
| Citigroup | Credit Suisse | J.P. Morgan | Wells Fargo Securities |
The date of this prospectus is , 2017.
Table of Contents

Table of Contents

Table of Contents

Table of Contents
You should rely only on the information contained in this prospectus. Neither we nor the underwriters have authorized anyone to provide you with information different from that contained in this prospectus. We do not, and the underwriters do not, take any responsibility for, and can provide no assurances as to, the reliability of any information that others provide to you. We are offering to sell, and seeking offers to buy, shares of Class B common stock only in jurisdictions where offers and sales are permitted. The information contained in this prospectus is accurate only as of the date of this prospectus, regardless of the time of delivery of this prospectus or of any sale of the Class B common stock.
i
Table of Contents
ABOUT THIS PROSPECTUS
In this prospectus, unless the context otherwise requires, “the company,” “we,” “us” and “our” refers to Schneider National, Inc., a Wisconsin corporation, together with its consolidated subsidiaries. Unless otherwise indicated, the information contained in this prospectus is as of , 2017, and assumes that the underwriters’ over-allotment option is not exercised.
In this prospectus, we refer to our Class A common stock, no par value per share, and our Class B common stock, no par value per share, as our Class A common stock and our Class B common stock, respectively, and, together, as our common stock. Unless otherwise indicated, all references to our common stock refer to our common stock as in effect at the time of the completion of this offering.
Prior to the completion of this offering, our Class A and Class B common stock was considered redeemable under GAAP because of certain repurchase rights granted to our shareholders pursuant to the Schneider National, Inc. Employee Stock Purchase Plan and certain agreements governing ownership of our common stock held by existing shareholders, including members of the Schneider family and their family trusts. All such repurchase rights will be terminated contemporaneously with, and contingent upon, the completion of this offering via amendments to these documents. References to our redeemable Class A common stock or redeemable Class B common stock refer to our common stock prior to the termination of these repurchase rights contemporaneously with this offering.
This prospectus contains references to fiscal year 2015, fiscal year 2014, fiscal year 2013, fiscal year 2012 and fiscal year 2011, which represent our fiscal years ended December 31, 2015, December 31, 2014, December 31, 2013, December 31, 2012 and December 31, 2011, respectively.
“GAAP” as used in this prospectus refers to United States generally accepted accounting principles.
NON-GAAP FINANCIAL MEASURES
In addition to our net income determined in accordance with U.S. GAAP, we evaluate operating performance at an enterprise level using certain non-GAAP measures, including adjusted income from operations, adjusted EBITDA, adjusted net income, adjusted net income per share, adjusted enterprise revenue (excluding fuel surcharge) and adjusted operating ratio. Management believes the use of non-GAAP measures assists investors in understanding the ongoing operating performance of our business by presenting comparable financial results between periods. The non-GAAP information provided is used by our management and may not be comparable to similar measures disclosed by other companies, because of differing methods used by other companies in calculating adjusted income from operations, adjusted EBITDA, adjusted net income, adjusted net income per share, adjusted enterprise revenue (excluding fuel surcharge) and adjusted operating ratio. The non-GAAP measures used herein have limitations as analytical tools, and you should not consider them in isolation or as substitutes for analysis of our results as reported under GAAP.
GLOSSARY OF TRUCKING AND OTHER TERMS
As used in this prospectus:
“Associate” means our employees and does not include owner-operators, which are independent contractors, or their owner-operator drivers or other employees.
ii
Table of Contents
“Brokerage” or “freight brokerage” means the customer loads for which we contract with third-party trucking companies to haul the load under third-party authority.
“Bulk tanker trailers” means trailers capable of transporting large quantities of unpackaged cargo. The cargo is moved either as a single undivided whole (one type of product), or in multiple divided compartments within the trailer (one or more types of product).
“Chassis” means the frame and wheels of a trailing unit upon which a container may be placed.
“Company assets” means assets owned by the company as well as those acquired under capital and/or operating leases.
“Company containers” means cargo containers owned or leased by the company.
“Company trucks” means trucks owned or leased by the company.
“Container” means a cargo container used in the domestic intermodal market with dimensions approximately the same dimensions as a 53-foot dry van that can be lifted from a detachable chassis and placed on a railcar (as opposed to international intermodal containers, which are 20-foot or 40-foot International Standards Organization (ISO) containers). Domestic intermodal containers are often double stacked on rail cars to minimize transportation cost.
“Core carrier” means one of a shipper’s preferred truckload carriers. Generally, shippers utilize a core carrier or core carrier group to improve service levels, reduce the complexity involved with managing a large number of carriers and experience efficiencies created through the level of trust, shipment density and communication frequency associated with a core carrier.
“Cross docking” means the practice in logistics of unloading materials from an incoming trailer or railroad car and loading these materials directly into outbound trailers or containers, with little or no storage in between.
“CSA” means the Federal Motor Carrier Safety Administration’s Compliance, Safety, Accountability initiative, which ranks both fleets and individual drivers based on multiple categories of safety-related data in an online Safety Measurement System.
“C-TPAT ” means the Customs-Trade Partnership Against Terrorism, a program designed to improve cross-border security between the United States and Canada and the United States and Mexico. Carrier members of the C-TPAT are entitled to shorter border delays and other priorities over non-member carriers.
“Dedicated contracts” means those contracts in which we have agreed to dedicate certain truck and trailer capacity for use by a specific customer. Dedicated contracts often have predictable routes and revenue and frequently replace all or part of a shipper’s private fleet. Our dedicated contracts generally average three years and are priced using a model that analyzes the cost elements, including revenue equipment, insurance, fuel, maintenance, drivers needed and mileage.
“Drayage” or “dray” means the transport of shipping containers from a dock or port to an intermediate or final destination or the transport of containers or trailers between pickup or delivery locations and a railhead. We directly provide drayage or utilize third parties in the pick-up and delivery associated with an intermodal movement, or for the pick-up and delivery to and from an ocean shipping port and an inland destination.
“Dry van” or “standard trailer” means a simple, enclosed, non-climate controlled 53-foot trailer that carries general cargo, including food and other products that do not require refrigeration.
iii
Table of Contents
“Electronic On-board Recorder” or “EOBR” means an electronic logging device that enables professional truck drivers and commercial motor carriers to track Hours of Service (HOS) compliance by monitoring the time spent by the driver in operating a truck.
“Final mile” means the movement of goods from a distribution center, warehouse or cross-dock to a final destination at the consumer’s home or business.
“First-to-final mile” means the movement of goods from a shipper to a distribution center, warehouse or cross-dock and then to a final destination at the consumer’s home or business.
“Flatbed trailer” means an open trailer with no sides used to carry large objects such as heavy machinery and building materials.
“For-hire truckload carriers” means a truckload carrier available to shippers for hire.
“For-hire contract” means a contract with a customer providing for services based on spot market or lane-based pricing rates.
“Fuel surcharge” means fees that are charged to a customer by a shipping company to pass through the costs of fuel in excess of a predetermined cost per gallon base (generally based on the average price of fuel in the United States as determined by the Department of Energy). Shipping company customers, such as our truckload customers, pay surcharges. In our intermodal business, our railroad partners charge fuel surcharge to us as their customers.
“Fuel surcharge revenue” means revenue attributable to fuel surcharges generated by Schneider.
“Intermodal” means the transport of shipping containers (COFC) or trailers (TOFC) on railroad flat cars before or after a movement by truck from the point of origin to the railhead or from the railhead to the destination.
“Less-than-truckload carriers” or “LTL carriers” means carriers that pick up and deliver multiple shipments, each typically weighing less than 10,000 pounds, for multiple customers in a single trailer.
“Line haul” means the movement of freight on a designated route between cities and terminals.
“Loads/orders” or “loads” is used to refer to requests from our customers other than our intermodal customers for services.
“Orders” means requests from our intermodal customers for services.
“Over-dimensional” means freight of a certain size or dimension that renders traditional shipping and packing methods used by less-than-truckload carriers inefficient or time-consuming for at least a portion of the transportation route when compared to trucks.
“Owner-operator” means a trucking business with whom we contract to move freight utilizing our operating authority, generally by pulling Schneider trailers attached to the owner-operator trucks driven by owner-operator drivers. The driver of an owner-operator truck may also be the owner of the associated owner-operator trucking business. Owner-operators have the ability to select the loads that they choose to move. Owner-operators are generally compensated on a percentage of revenue basis and must pay their own operating expenses, such as fuel, maintenance, the truck’s physical damage insurance and driver costs, and must meet our specified standards with respect to safety. Owner-operators hired by other companies in our industry are generally compensated on a per-mile basis.
iv
Table of Contents
“Preferred lanes” means the routes along which we strive to direct most of our trucks.
“Private fleet” means the trucks and trailers owned or leased, and operated, by a shipper to transport its own goods.
“Private fleet outsourcing” means the decision by shippers using a private fleet to outsource all or a portion of their transportation and logistics requirements to for-hire truckload carriers. Some shippers that previously maintained their own private fleets outsource this function to for-hire truckload carriers, like us, to reduce operating costs and to focus their resources on their core businesses.
“Revenue per order” means revenue (excluding fuel surcharge) per order.
“Revenue per truck per week” means the revenue (excluding fuel surcharge) that a truck, available to work, generates (on average) over a work week.
“Specialty equipment” means trailing equipment, other than dry vans, used in our truckload segment. Examples would be flatbed trailers, bulk tanker trailers and temperature controlled trailers.
“Stop-off pay” means the compensation we receive from customers for stopping a haul to pick up or unload a portion of the load or to allow for a sample testing of the product being transported.
“Straight truck” means a vehicle with the cargo body and tractor mounted on the same chassis.
“Team driving” means two drivers occupying a single truck who alternate between driving and non-driving time (such as time spent sleeping and resting) in order to expedite the shipment and maximize the overall production of the truck by decreasing idle time in transit to its destination.
“Temperature controlled” means an enclosed, temperature controlled trailer, generally used to carry perishable goods.
“Third-party logistics provider” or “3PL” means a provider of outsourced logistics services. In logistics and supply chain management, it means a company’s use of third-party businesses, the 3PL(s) to outsource elements of the company’s distribution, fulfillment and supply chain management services.
“Total miles” means the miles driven both with and without revenue-generating freight being transported.
“Tractor” means a vehicle with the ability to tow a trailer, generally by the use of the fifth wheel mounted over the tractor’s drive axle.
“Trailer” means a cargo body that is mounted on a separate chassis and attached to the back of a tractor or, in the case of a tandem rig, the tail of another trailer attached to a tractor.
“Trans-loading” means the process of transferring a shipment from one mode of transportation to another, through multiple forms of transportation including ship and rail. It is most commonly employed when one mode of transportation or one vehicle cannot be used for the entire trip, such as when goods must be shipped internationally from one inland point to another.
“Truck” means a vehicle that carries goods in a cargo body mounted to its chassis, such as a straight truck, and/or in a trailer towed by the vehicle, such as a tractor. Our truck fleet is mostly comprised of Class 8 tractors, which are generally over 33,000 pounds in gross vehicle weight rating.
“Truckload carrier” means a carrier that generally dedicates an entire trailer to one customer from origin to destination.
v
Table of Contents
“Unbilled miles” means miles driven without revenue generation for us.
“White glove” means a delivery service in which the shipped items are unloaded from a truck and then unpackaged and placed into a specific location designated by the customer.
vi
Table of Contents
The following summary highlights information about our business and the offering of our Class B common stock that appears elsewhere in this prospectus. This summary does not contain all of the information you should consider before investing in our Class B common stock. You should read this entire prospectus carefully, including the sections entitled “Risk Factors” and “Management’s Discussion and Analysis of Financial Condition and Results of Operations” and the consolidated financial statements and related notes included elsewhere in this prospectus.
OUR COMPANY
We are a leading transportation and logistics services company providing a broad portfolio of premier truckload, intermodal and logistics solutions and operating one of the largest for-hire trucking fleets in North America. We believe we have developed a differentiated business model that is difficult to replicate due to our scale, breadth of complementary service offerings and proprietary technology platform. Our highly flexible and balanced business combines asset-based truckload services with asset-light intermodal and non-asset logistics offerings, enabling us to serve our customers’ diverse transportation needs. Since our founding in 1935, we believe we have become an iconic and trusted brand within the transportation industry by adhering to a culture of safety “first and always” and upholding our responsibility to our associates, our customers and the communities that we serve.
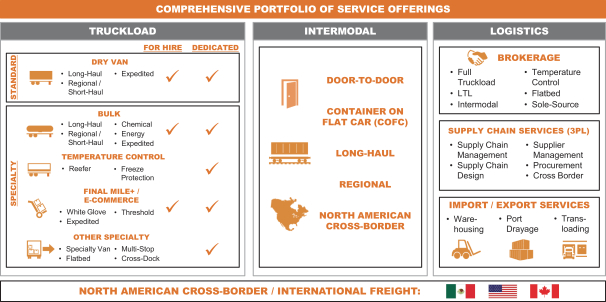
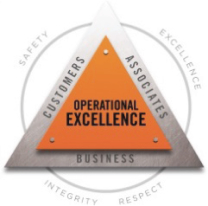
We are the second largest truckload company in North America by revenue, one of the largest intermodal transportation providers in North America by revenue and an industry leader in specialty equipment services and e-commerce fulfillment. We categorize our operations into the following reportable segments:
| • | Truckload – which consists of freight transported and delivered with dry van and specialty equipment by our company-employed drivers in company trucks and by owner-operators, executed through either for-hire or dedicated contracts. |
| • | Intermodal – which consists of door-to-door, container on flat car service by a combination of rail and over-the-road transportation, in association with our rail carrier partners. Our intermodal service offers vast coverage throughout North America, including cross-border freight through company containers and trucks. |
| • | Logistics – which consists of non-asset freight brokerage services, supply chain services (including 3PL) and import/export services. Our logistics business typically provides value-added services using third-party capacity, augmented by our assets, to manage and move our customers’ freight. |
We also engage in equipment leasing and provide insurance to support owner-operators, which combined with our limited Chinese truck brokerage and logistics operations, account for our remaining operating revenue.
Our portfolio consists of approximately 10,800 company and 2,800 owner-operator trucks, 38,400 trailers and 18,000 intermodal containers across North America and approximately 19,300 enterprise associates. We serve a diverse customer base across multiple industries represented by approximately 10,000 customers, including more than 200 Fortune 500 companies. Each day, our freight moves more than 8.8 million miles, equivalent to circling the globe approximately 350 times. Our logistics business manages over 20,000 qualified carrier relationships and, in 2015, managed approximately $2 billion of third-party freight. Our portfolio diversity, network density throughout North America and large fleet allow us to provide an exceptional level of service to our customers and consistently excel as a reliable partner, especially at times of peak demand.
1
Table of Contents
We believe we offer the broadest array of services in the transportation and logistics industries, ranging from dry van to bulk transport, intermodal to supply chain management and first to final mile “white glove” delivery. We believe we differentiate ourselves through expertise in services that utilize specialty equipment, which have high barriers to entry. With our recent acquisitions of Watkins and Shepard Trucking, Inc. (Watkins & Shepard) and Lodeso, Inc. (Lodeso) we have established a national footprint and expertise in shipping difficult-to-handle consumer items, such as furniture, mattresses and other household goods, which are among the fastest-growing services in the e-commerce sector according to management estimates. Our comprehensive and integrated suite of industry leading service offerings allows us to better meet customer needs and capture a larger share of our customers’ transportation spend. Customers value our breadth of services, demonstrated by 22 of our top 25 customers utilizing services from all three of our reportable segments.
The following graphic demonstrates the breadth and diversity of our service offerings:
In 2007, we launched Quest, a multi-year, comprehensive business processes and technology transformation program, using technology from our strategic development partner, Oracle Corporation. As part of this transformation, we created a quote-to-cash technology platform, which we refer to as our Quest platform, that serves as the backbone of our business and seamlessly integrates all business lines and functions. Our state-of-the-art Quest platform allows us to make informed decisions at every level of our business, providing real-time data analytics to optimize network density and equipment utilization across our entire network, which drives better customer service, operational efficiency and load optimization. We also realigned our organization to give our associates a direct line of sight to profit-and-loss responsibility both within their business lines and across the organization. This organizational change combined with our Quest platform empowers our associates to proactively pursue business opportunities that enhance profitability while maintaining high levels of customer service. We believe our over $250 million investment in technology and our related organizational realignment over the past several years have enabled us to improve our profit margins and put us in a favorable position to expand our profit margins and continue growing our business.
2
Table of Contents
Since refocusing our strategy and initiating our Quest technology and business transformation in 2007, we have experienced strong revenue growth and margin expansion, which is demonstrated in the following table.
| (in thousands) | 2015 Fiscal Year | 3-Year CAGR(1) | ||||||
| Operating revenue |
$ | 3,959,372 | 4.3 | % | ||||
| Adjusted enterprise revenue (excluding fuel surcharge)(2) |
$ | 3,588,220 | 7.7 | % | ||||
| Net income |
$ | 140,932 | 27.1 | % | ||||
| Adjusted EBITDA(3) |
$ | 529,338 | 12.9 | % | ||||
| Adjusted net income(3) |
$ | 162,740 | 27.3 | % | ||||
| (1) | Three-year compound annual growth rate from January 1, 2013 through December 31, 2015. |
| (2) | Adjusted enterprise revenue (excluding fuel surcharge) is a non-GAAP financial measure. For a reconciliation of operating revenue, the most closely comparable GAAP measure, to adjusted enterprise revenue (excluding fuel surcharge), see “Management’s Discussion and Analysis of Financial Condition and Results of Operations—Results of Operations.” |
| (3) | Adjusted EBITDA and adjusted net income are non-GAAP financial measures. For a reconciliation of net income to adjusted EBITDA and adjusted net income, in each case for which net income is the most comparable GAAP measure, see “—Summary Historical Consolidated Financial and Other Data.” |
Schneider was founded in 1935 by Al J. Schneider in Green Bay, Wisconsin, and further developed under the leadership of his son, Donald J. Schneider. Schneider’s deeply-rooted culture embodies several core values:
| • | Safety First and Always |
| • | Integrity in Every Action |
| • | Respect for All |
| • | Excellence in What We Do |
We put these values into practice through the Schneider “Value Triangle” of operational excellence. A guiding tenet of our business for over a decade, our “Value Triangle” provides a key reference for our associates to consider when making business decisions at each level of the company, including the needs of our customers, our associates and our business and its shareholders. We believe managing and balancing these often competing interests compels us to weigh the collective benefits to all of our stakeholders for every business decision.
3
Table of Contents
OUR INDUSTRY
Truckload
Trucking is the primary means of serving the North American transportation market and hauls approximately 70% of freight volume within the United States, which is embodied in a common phrase used within our industry: “if you’ve got it—a truck brought it.” Trucking continues to attract shippers due to the mode’s cost advantages relative to air transportation and flexibility relative to rail. Truckload growth is largely tied to U.S. economic activity such as GDP growth and industrial production and moves in line with changes in sales, inventory and production within various sectors of the U.S. economy. Truckload volumes are also positioned to benefit from secular trends in e-commerce retail, which is expected to grow at a 13% CAGR from 2014 to 2019 according to e-Marketer. Based on estimates by the American Trucking Associations (ATA), the U.S. trucking industry generated approximately $726 billion in revenue in 2015 and is expected to grow at a CAGR of 4.8% from 2016 to 2022.
The U.S. truckload industry is large and fragmented, characterized by many small carriers with revenues of less than $1 million per year, less than 50 carriers with revenues exceeding $100 million per year and 10 carriers with revenues exceeding $1 billion per year, according to 2015 data published by Transport Topics, an ATA publication. According to Department of Transportation (DOT) data, there were over 550,000 trucking companies in the United States at the end of 2015, approximately 90% of which owned 10 or fewer trucks.
Regulations and initiatives to improve the safety of the U.S. trucking industry have impacted industry dynamics. We believe the recent trend is for industry regulation to become progressively more restrictive and complex, which constrains the overall supply of trucks and drivers in the industry. Examples of recently enacted and upcoming regulations and initiatives include the Comprehensive Safety Analysis (CSA) initiative (2010), Hours of Service (HOS) rules (2013) and mandatory use of electronic logging devices to enforce Hours of Service (HOS) rules (2015), hair follicle (2016) and sleep apnea screening (upcoming), installation of speed limiters (2016) and phase 2 emission standards (2016). We believe small carriers will likely be challenged to maintain the utilization required for acceptable profitability under this regulatory framework.
Domestic Intermodal
Domestic intermodal transportation involves the transportation of freight in a 53-foot container or trailer, combining multiple modes of transportation (rail and truck) within the United States, Canada and Mexico. Eliminating the need for customers to directly handle freight when changing modes between rail and truck, intermodal transportation holds significant productivity, cost and fuel-efficiency advantages when moving mass freight. Domestic intermodal volumes are largely driven by over-the-road conversions from truckload to intermodal and from the volume of overseas imports into the United States, such as from China. Our management estimates the North American intermodal and drayage market to be $22 billion. According to the Association of American Railroads (AAR), intermodal has grown from 27% of all railcar loads in 1990 to 49% in 2015. Domestic intermodal accounts for 50% of total intermodal volume according to the Intermodal Association of North America (IANA). With fuel costs likely to increase in the long-term, fuel efficiency regulations set to tighten and labor shortages in the trucking industry, the intermodal market is well-positioned to take on freight capacity as trucking markets face external pressures.
The intermodal market is comprised of service providers of differing asset intensity, with customers being served by either non-asset intermodal marketing companies (IMCs) or asset-light network intermodal providers such as Schneider. While IMCs are the most prevalent intermodal solution provider, asset-light network intermodal providers offer differentiated higher-value solutions to customers given the reliability, geographic breadth and high service levels of company assets (trucks, containers and even chassis) compared to non-asset IMCs.
4
Table of Contents
The domestic intermodal segment is highly consolidated, where the top three intermodal providers operate over 50% of the U.S. dry van domestic container fleet, according to management estimates. Network density, size and scale are critical barriers to entry in the intermodal market. Increasing sophistication and complexity of shippers’ needs require network density and the ability to deliver reliable capacity. According to AAR, railroads have been spending record amounts in recent years to maintain and improve their infrastructure and equipment, which we believe supports growth of the intermodal industry and improves the efficiency and reliability of the railroad component of our intermodal service.
Logistics
The logistics industry is a large, fast-growing and fragmented market that represents an integral part of the global economy. As supply chain complexity increases, corporations have elected to focus on innovation, design, sales and marketing of their products rather than supply chain operations. Increased material costs coupled with enhanced global competition impose margin pressure on manufacturers, requiring the outsourcing of noncore transportation logistics to supply chain specialists who offer a combination of scale, strong technology platforms and lower costs. Additionally, more shipments of inputs and products will be transported using multiple modes and technical expertise, driving shipper preferences for logistics providers with an asset-based network to complement their third-party capacity. Transportation asset owners often provide logistics services to meet excess demand and provide customers with greater breadth of services.
OUR COMPETITIVE STRENGTHS
We believe the following key strengths have been instrumental to our success and position us well to continue growing our business and market share:
Iconic large-scale diversified North American truckload provider with a modern fleet
Over the past 80 years, we have become one of North America’s largest and most trusted providers of truckload services, including specialty equipment services. We have established a leading position through our commitment to provide an outstanding level of customer service. In 2016 alone, we have received 17 awards from customers and the media in recognition of our exceptional service and reliability. We operate one of North America’s largest truckload fleets with approximately 12,000 trucks and 38,100 trailers used in our truckload business. Given our large scale, we offer both network density and broad geographic coverage to meet our customers’ transportation needs across North America. Our scale and strong balance sheet provides us with access to capital necessary to consistently invest in our capacity, technology and people to drive performance and growth, and to comply with regulations. Our scale also gives us significant purchasing benefits in third-party capacity, fuel, equipment and MRO (maintenance, repair and operations), lowering our costs compared to smaller competitors.
Over the past several years, we have made significant investments in safety-enhancing equipment and technology, including roll stability, collision avoidance, forward facing cab cameras, training simulators and real-time truck sensor monitoring. Our relentless focus on safety not only enables us to better uphold our responsibility towards our associates, customers and the community, but also provides a critical competitive advantage in an industry with increasingly stringent safety and regulatory requirements and results in lower operating risk and insurance costs. In 2010, we were among the first large-scale carriers to fully equip our fleet with EOBRs, providing improved network management and safety. Unlike carriers that have yet to undertake the electronic logging device implementation process, we have significant experience operating with EOBRs and are well-positioned to benefit from the upcoming legislation on mandatory electronic logging device standards, which we expect will tighten truckload capacity and subsequently increase rates.
5
Table of Contents
Industry leading and highly scalable Quest technology platform integrated across all business lines and functions
Our early investment and adoption of next generation technology and data analytics is a competitive advantage. We believe we are the only truckload and intermodal industry player of size to have completed, integrated and culturally adopted a comprehensive quote-to-cash technology transformation that allows us to efficiently match capacity with customer loads/orders. Our Quest platform allows us to assess our entire network every 90 seconds, resulting in real-time, round-the-clock visibility into every shipment and delivery, route schedules, truck and driver capacity and the profitability of each load/order. Our Quest platform enables us to minimize unbilled miles, optimize driver efficiency and improve safety, resulting in increased service levels and profitability. We manage the purchasing of nearly 500,000 gallons of fuel per day and communicate to our drivers optimal timing and locations for refueling through our Quest platform, which increases our fuel efficiency and lowers our fuel purchasing costs. We have become a pioneer in applying “decision science” technology to trucking and intermodal freight that enhances driver and asset efficiency, leading to higher profitability and driver satisfaction. We receive and process millions of driver and equipment location updates daily, allowing us to select the optimal driver, truck and trailer for each load/order. This has been a key driver of increased profitability per load and operating margin improvements over the last few years. We believe that our Quest technology and business transformation provides us with a clear advantage within the transportation industry from which we are continuing to realize the financial benefits.
Leadership in fast-growing e-commerce, final mile and other specialty equipment markets
Our recent acquisitions of Watkins & Shepard and Lodeso have allowed us to rapidly expand our customized home, commercial and retail delivery offerings with “white glove” service for brick and mortar and e-commerce customers. New components of our final mile services include real-time shipment tracking for customers and our proprietary Simplex technology, which integrates with retailers’ e-commerce infrastructure, providing seamless end-to-end solutions and visibility for complex final mile deliveries. E-commerce has increasingly become the preferred channel for purchasing difficult-to-handle items, an area in which Watkins & Shepard and Lodeso specialize. Our expertise in this channel and national footprint in the final mile market positions us well to capitalize on this high-growth market opportunity that traditional less-than-truckload and package delivery operations generally cannot serve.
We have established a major nationwide presence in numerous specialty equipment freight markets with premium pricing and higher barriers to entry, including bulk chemicals, energy services and other specialty liquids. Our large specialty equipment asset base positions us to serve customers across the country, which differentiates us from most of our regional-based competitors and positions us well to take market share with large customers who value our geographic reach.
A leading intermodal business with built-in cost reductions through transition to a company-owned chassis model driving profitability
We are currently one of the largest intermodal providers in North America by revenue and are well-positioned for future growth in intermodal freight through our nationwide network and company container model. Our long-standing railroad relationships with BNSF Railway, CSX Transportation, Canadian National Railway, Kansas City Southern Railway and other regional rail carriers, such as Florida East Coast Railway, provide rail access nationwide. Our customers value our intermodal network over IMCs due to our consistent access to capacity through our company assets and high-quality drayage services that provide a larger geographic reach around intermodal terminals. We are in the process of converting from our rented chassis model to a company owned-chassis model. This conversion will lower our all-in chassis operating costs, improve service reliability, as well as increase driver efficiency and satisfaction, by increasing our control over the chassis
6
Table of Contents
operations of our intermodal business. We expect to complete our conversion to a company-owned chassis fleet by December 2017. We believe that our balanced network and large base of company assets provide a significant competitive advantage that would be difficult for other carriers to replicate.
Fast-growing non-asset logistics business expanding our customer base and complementing our asset-based network
Our non-asset logistics business represents our fastest-growing segment and complements our asset-based businesses with freight brokerage services and comprehensive supply chain management. In the three years from January 1, 2013, through December 31, 2015, our logistics segment operating revenue grew at a CAGR of 14%. Our logistics business not only provides additional services to existing customers and incremental freight to our assets, but helps to facilitate the expansion of our customer base and offers opportunities for cross-selling our suite of services. In 2015, our logistics business helped generate approximately $164 million in revenue for our truckload and intermodal segments. The scale of our asset-based network and our relationships with over 20,000 third-party carriers allow us to provide our brokerage and supply chain services (including 3PL) to our customers at competitive rates. By also offering warehousing, trans-loading and port drayage, we can provide customers with a suite of services that covers their entire North American transportation supply chain.
Diversified and resilient revenue mix supporting stable growth through business cycles
Our diverse portfolio of services, equipment, customers and end markets allows for resilient and consistent financial performance through all business cycles. We believe we offer the broadest portfolio of services in our industry, including in our truckload business, which consists of freight transported and delivered with dry van and specialty equipment by drivers in company trucks and by owner-operators. In addition to both long-haul and regional shipping services, our truckload services include team-based shipping for time-sensitive loads (utilizing dry van equipment) and bulk, temperature controlled, final mile “white glove” delivery and customized solutions for high-value and time-sensitive loads (utilizing specialty equipment). Our primarily asset-based truckload business is complemented by our asset-light intermodal and non-asset logistics businesses. Asset-based operations have the benefit of providing shippers with certainty of capacity and continuity of operations, while non-asset operations generally have lower capex requirements, higher returns on invested capital and lower fixed costs. We also manage a balanced mix of spot rates and contracted rates, through for-hire and dedicated contracts, to take advantage of freight rate increases in the short-term while benefiting from more resilient contracted revenue. Our dedicated contracts typically average three years in duration and provide us with greater revenue stability across economic cycles, promote customer loyalty and increase driver retention due to higher predictability in number of miles along familiar routes and time at home.
Our broad portfolio also limits our customer and industry concentration as compared to other carriers. We receive revenue from a diversified customer base with no single customer representing 10% or more of our revenue. The percentage of our revenue derived from our top ten customers has decreased by 800 basis points over the past five years. New business increased by approximately $300 million in 2015. We maintain a broad end-market footprint, encompassing over ten distinct industries including general merchandise, chemicals, electronics & appliances, and food & beverage, among others. Our diversified revenue mix and customer base drives stability throughout the fiscal year, even though many of our customers are affected by seasonal fluctuations.
7
Table of Contents
Proven and motivated management team with deep transportation industry expertise
We have a premier management team with extensive experience in the transportation and logistics industry, as well as a proven track record of success through various business environments. Our Chief Executive Officer and President, Christopher B. Lofgren, has over 22 years of experience at Schneider, a PhD in Industrial and Systems Engineering and is responsible for spearheading our Quest technology and business transformation. Our senior management team has spent on average over 14 years with Schneider and is composed of highly experienced transportation and logistics industry experts overseeing day-to-day operations. Our management team’s compensation structure and ownership of common stock provide further incentive to improve business performance and profitability. Our governance structure provides key independent oversight, complementing the strengths of the management team. A majority of the members of our Board of Directors are independent, a structure that has been in place since 1988. Our senior management team’s experience and commitment to upholding deeply-rooted values of safety, respect, integrity and excellence will continue to be critical to our future growth and performance. We believe our leadership team is well-positioned to execute our strategy and remains a key driver of our financial and operational success.
OUR GROWTH STRATEGIES
Our goals are to grow profitably, drive strong and consistent return on capital and increase stakeholder value. We believe our competitive strengths position us to pursue our goals through the following strategies:
Strengthen core operations to drive organic growth and maintain a leading market position
We intend to drive organic growth through leveraging our existing customer relationships, as well as expanding our customer base. With a broad, comprehensive service offering and a true North American footprint, we believe we have substantial cross-selling opportunities and the potential to capture a greater share of each customer’s annual transportation and logistics expenditures. We also plan to drive revenue growth by increasing market share amid a fragmented marketplace by marketing our services to customers seeking to outsource their transportation services. Our Quest platform serves as an instrumental factor in driving profitable growth from both new and existing customers as it enables real-time, data-driven decision support and business analysis of every load/order, assisting our associates in proactively cross-selling our broad suite of offerings. Together with our highly incentivized and proactive sales organization, our data-driven Quest platform will drive better service and organic growth in each of our reportable segments.
Expand capabilities in specialty equipment freight market and continue growing our freight brokerage business
We believe that our capabilities position us to grow in the specialty equipment market, which enjoys higher barriers to entry and a premium to conventional dry van pricing. The specialty equipment freight market represents a large addressable market within the truckload segment, comprising 62% of U.S. truckload revenue in 2015 according to Transportation Economics. The complexity and time-sensitivity of the loads often require enhanced collaboration with, and greater understanding of, our customers’ business needs and processes. The transportation of specialty equipment freight requires specially trained drivers with appropriate licenses and special hauling permits, as well as equipment that can handle items with unique requirements in terms of temperature, freight treatment, size and shape. As such, there are few carriers that have comparable network scale and capabilities in the specialty equipment market, which we believe will allow us to profitably grow in that segment.
The growth of our freight brokerage business, which is a significant part of our logistics segment, contributed to the growth of our logistics segment operating revenue, which grew at a CAGR of 14%, in the three years from January 1, 2013 through December 31, 2015. As shippers increasingly consolidate their business with
8
Table of Contents
fewer freight brokers, we are well-positioned to become one of their select providers due to our customer service and established, dense network of third-party carriers. Large shippers in particular see the value of working with providers like us that have scale, capacity and lane density, as they are more reliable, efficient and cost effective at covering loads. Our freight brokerage business provides us with the opportunity to serve our customers more broadly where we might not otherwise serve them, building diversity and resiliency in our existing customer portfolio in a non-asset manner with minimal capital deployment.
Capitalize on the growth of e-commerce fulfillment
As a leading “first, final and every mile” carrier for difficult-to-handle consumer items, such as furniture and mattresses, one of the fastest-growing e-commerce markets, we are well-positioned to capitalize on continued e-commerce growth. According to e-Marketer, the e-commerce industry is set to grow at four times the rate of traditional retail in North America (13% vs. 3% 2014-2019 CAGR) and is anticipated to reach 13% of total retail sales worldwide by 2019 (up from 6% in 2014). We provide services for many online retailers, offering first-to-final mile delivery from warehouses to consumer living rooms. Unlike many competitors, we have the technological capability, national footprint and the ability to utilize team driver capacity to provide network breadth and density to meet growing e-commerce fulfillment needs. We intend to leverage our end-market expertise, leading technology platform and end-to-end integrated capabilities to continue taking the complexity out of the supply chain for omni-channel retailers and manufacturers, further driving our revenue in the fast-growing e-commerce market.
Continue to improve our operations and margins by leveraging benefits from recent investments in our Quest technology and business transformation
We continue to benefit from the operational improvements related to our Quest technology and business transformation and continue to improve the effectiveness with which we utilize data to increase revenue and lower costs. We are able to better service customers, retain drivers and generate repeat business by anticipating our customers’ and drivers’ needs and preferences. We believe the future implementation of simple and intuitive customer interfaces will also enable a stronger connection with our customers through increased interaction and an enhanced user experience. We expect additional margin improvement as we continue to leverage data analytics within the Quest platform. The strong foundation we have established with our continuing Quest transformation will allow us to incorporate new technologies and build new capabilities into the platform over time, maintaining our competitive edge and setting the base for future growth.
Allocate capital across businesses to maximize return on capital, and selectively pursue opportunistic acquisitions
Our broad suite of services provides us with a greater opportunity to allocate growth capital in a manner that maximizes returns throughout the seasonal and economic business cycles. For example, we can efficiently move our equipment between services and regions when we see opportunities to maximize our return on capital. We continually monitor our performance to ensure appropriate allocation of capital and resources to grow our businesses while optimizing returns across reportable segments. Furthermore, our strong balance sheet enables us to selectively pursue opportunistic acquisitions that complement our current portfolio. We are positioned to leverage our scalable platform and experienced operations team to acquire high-quality businesses that meet our disciplined selection criteria in order to expand our service offerings and customer base.
9
Table of Contents
Attract and retain top talent at all levels to ensure sustainable growth
Our people are our strongest assets, and we believe they are key to growing our customer base and driving our performance. Our goal is to attract, retain and develop the best talent in the industry across all levels. We strive to foster a collaborative environment and seek individuals who are passionate about our business and fit within our culture. We value the direct relationships we have with our associates and we intend to continue working together without third-party representation. Our compensation structure is performance-based and aligned with our strategic objectives. Amid today’s driver shortage environment, we seek to maintain our reputation as a preferred carrier within the driver community. Our culture, which from its founding was focused on the well-being of our associates, helps us attract and retain high quality drivers. In addition to mandatory physical check-ups, covering among other things sleep apnea, we enforce hair follicle drug testing alongside mandatory urine testing and invest in the well-being of our drivers, which we believe helps us maintain a high quality driver base. Our leading technology platform facilitates the application, screening and onboarding of top talent. As a stable industry leader with a respected safety culture and underlying core values, we believe that we will continue to be the employer of choice for both driving and non-driving associates.
10
Table of Contents
RISKS RELATED TO OUR BUSINESS AND THIS OFFERING
Investing in our Class B common stock involves a high degree of risk. Before you invest in our Class B common stock, you should carefully consider all the information in this prospectus, including matters set forth in the section entitled “Risk Factors.” If any of these risks actually occur, our business, financial condition and results of operations may be materially adversely affected. In such case, the trading price of our Class B common stock may decline and you may lose part or all of your investment. Below is a summary of the primary risks to our business:
| • | economic and business risks inherent in the truckload industry, including competitive pressures pertaining to pricing, capacity and service; |
| • | the significant portion of revenue we derive from our largest customers, including approximately 30% in the aggregate for fiscal year 2015 with respect to our 10 largest customers; |
| • | fluctuations in the price or availability of fuel, the volume and terms of diesel fuel purchase commitments and surcharge collection; |
| • | our ability to attract and retain qualified drivers, including owner-operators, in the operation of our intermodal and trucking businesses, which is difficult to predict and is subject to factors outside of our control; |
| • | our third-party logistics customers improving their internal logistics operations and transportation services and therefore decreasing their reliance on our service offerings; |
| • | our ability to recruit, develop and retain our key associates and drivers; |
| • | increased costs of compliance with, or liability for violation of, existing or future regulations in our industry, which is highly regulated; |
| • | significant systems disruptions, including those caused by cybersecurity breaches, affecting our data networks and systems, including tracking and communications systems; |
| • | negative seasonal patterns generally experienced in the trucking industry during traditionally slower shipping periods and winter months; |
| • | we will be a “controlled company” within the corporate governance rules of the NYSE and, as a result, qualify for, and intend to rely on, the exemption from the requirement that our corporate governance committee be composed entirely of independent directors; and |
| • | the interests of our controlling shareholder may conflict with yours in the future, and, for so long as the Schneider National, Inc. Voting Trust (the “Voting Trust”) maintains control of us, our other shareholders will be unable to affect the outcome of proposed corporate actions supported by the Voting Trust trustees or, in the case of certain actions including a change of control, the Schneider family and trusts for their benefit. |
Corporate Information
Our principal executive offices are located at 3101 Packerland Drive, Green Bay, Wisconsin, and our telephone number is (920) 592-2000. We also maintain a website at https://schneider.com. The reference to our website is intended to be an inactive textual reference only. The information contained on, or that can be accessed through, our website is not part of this prospectus.
11
Table of Contents
THE OFFERING
| Class A common stock offered |
None. | |
| Class B common stock offered |
||
| By us |
shares. | |
| By the selling shareholders |
shares. | |
| Option to purchase additional shares of Class B |
We have granted the underwriters a 30-day option from the date of this prospectus to purchase up to additional shares of our Class B common stock at the initial public offering price, less underwriting discounts. | |
| Class A common stock to be outstanding after this |
shares, representing a % voting interest (or a % voting interest, if the underwriters exercise in full their option to purchase additional shares of Class B common stock). | |
| Class B common stock to be outstanding after this |
shares, representing a % voting interest (or shares, representing a % voting interest, if the underwriters’ exercise in full their option to purchase additional shares of Class B common stock). | |
| Voting rights |
Shares of Class A common stock are entitled to ten votes per share.
Shares of Class B common stock are entitled to one vote per share.
Holders of our Class A common stock and Class B common stock will generally vote together as a single class, unless otherwise required by law. After this offering, the Voting Trust will control more than % of the voting power of our outstanding capital stock, will continue to hold all of our Class A common stock and effectively control all matters submitted to our shareholders for a vote, except for the vote in any Major Transactions (as defined under “Description of Capital Stock—Shareholder Approval of Major Transactions”), which will be controlled by certain trusts for the benefit of the Schneider family members holding the trust certificates issued by the Voting Trust. See “Description of Capital Stock.” | |
| Controlled company |
Upon the completion of this offering, we will be a “controlled company” under the corporate governance rules of the NYSE . Under these rules, a “controlled company” may elect not to comply with certain corporate governance requirements. We intend to take | |
12
Table of Contents
| advantage of the exemption from the requirement to have a corporate governance committee that is composed entirely of independent directors. We have elected not to take advantage of any of the other available exemptions. See “Management—Controlled Company Status.” | ||
| Use of proceeds |
We estimate that the net proceeds to us from this offering will be approximately $ , or approximately $ if the underwriters exercise their over-allotment option in full, assuming an initial public offering price of $ per share (the mid-point of the estimated price range set forth on the cover page of this prospectus), after deducting estimated underwriting discounts and commissions and estimated offering expenses payable by us. We intend to use the net proceeds of this offering for general corporate purposes, including repayment of indebtedness, capital expenditures and potential acquisitions. We will not receive any of the proceeds from the sale of our Class B common stock by the selling shareholders named in this prospectus. See “Use of Proceeds.” | |
| Dividend policy |
As a public company we anticipate paying a quarterly dividend to holders of our Class A and Class B common stock.
The declaration and payment of all other future dividends to holders of our common stock will be at the discretion of our Board of Directors and will depend on many factors, including our financial condition, earnings, legal requirements and any debt agreements we are then party to and other factors our Board of Directors deems relevant. “See Dividend Policy.” | |
| Risk factors |
Investing in shares of our Class B common stock involves a high degree of risk. See “Risk Factors” for a discussion of factors you should carefully consider before you decide to invest in our Class B common stock. | |
| Proposed listing and symbol |
We intend to apply to have our common stock listed on the New York Stock Exchange under the symbol “SNDR.” | |
Except where expressly indicated otherwise, references to the total number of shares of our Class A common stock and Class B common stock outstanding after this offering is based on shares of our Class A common stock and shares of our Class B common stock outstanding as of , and excludes the following shares:
| • | shares of Class B common stock issuable upon the conversion of our Class A common stock that will be outstanding after this offering; and |
13
Table of Contents
| • | shares of Class B common stock reserved as of the closing date of this offering for future issuance under our 2017 Equity Incentive Plan. |
Unless we indicate otherwise or the context otherwise requires, this prospectus reflects and assumes:
| • | No exercise of the underwriters’ option to purchase additional shares of our Class B common stock; and |
| • | An initial public offering price of $ per share, which is the mid-point of the estimated price range set forth on the cover page of this prospectus. |
14
Table of Contents
SUMMARY HISTORICAL CONSOLIDATED FINANCIAL AND OTHER DATA
The following tables set forth our summary historical consolidated financial and other data as of and for the periods indicated. We have derived the summary historical consolidated financial data for the years ended December 31, 2015, December 31, 2014 and December 31, 2013 from the audited consolidated financial statements included elsewhere in this prospectus.
The summary historical consolidated financial data for the nine months ended September 30, 2016 and September 30, 2015, and as of September 30, 2016, have been derived from our unaudited condensed consolidated financial statements included elsewhere in this prospectus. The unaudited condensed consolidated financial statements were prepared on substantially the same basis as our audited consolidated financial statements. In the opinion of management, such unaudited financial statements reflect all adjustments, consisting only of normal and recurring adjustments, necessary to fairly present our financial position and operating results as of the dates and for the periods presented. The operating results presented in the unaudited condensed consolidated financial statements are not necessarily indicative of the results that may be expected for a full fiscal year or in any future period.
Contemporaneously with the completion of this offering, we will amend the Schneider National, Inc. Employee Stock Purchase Plan and certain agreements governing ownership of our common stock held by existing shareholders, including members of the Schneider family and their family trusts, in order to remove provisions that currently grant each of our shareholders the right to require us to repurchase our common stock held by such shareholder under certain circumstances. The as adjusted consolidated balance sheet data as of September 30, 2016 presents our consolidated balance sheet to give effect to the reclassification of our Class A and Class B common stock, which is, before giving effect to these amendments, considered redeemable under GAAP, to shareholders’ equity, including common stock and additional paid-in capital upon the elimination of the repurchase rights from the shareholders.
The summary historical consolidated financial and other data set forth below should be read in conjunction with the information included under the headings “Use of Proceeds,” “Capitalization,” “Selected Historical Consolidated Financial Data” and “Management’s Discussion and Analysis of Financial Condition and Results of Operations” and the audited and unaudited consolidated financial statements and related notes included elsewhere in this prospectus.
| Consolidated Statements of Income Data ($ in thousands) |
Nine Months Ended September 30, |
Year Ended December 31, | ||||||||||||||||||
| 2016 | 2015 | 2015 | 2014 | 2013 | ||||||||||||||||
| Operating revenue |
$ | 2,975,844 | $ | 2,932,875 | $ | 3,959,372 | $ | 3,940,576 | $ | 3,624,366 | ||||||||||
| Operating expenses: |
||||||||||||||||||||
| Purchased transportation |
1,077,635 | 1,055,865 | 1,430,164 | 1,384,979 | 1,198,090 | |||||||||||||||
| Salaries, wages, and benefits |
848,208 | 805,217 | 1,076,512 | 1,037,781 | 974,570 | |||||||||||||||
| Fuel and fuel taxes |
184,376 | 226,472 | 290,454 | 455,751 | 504,457 | |||||||||||||||
| Depreciation and amortization |
197,704 | 174,339 | 236,330 | 230,008 | 212,557 | |||||||||||||||
| Operating supplies and expenses |
333,049 | 340,193 | 452,452 | 435,753 | 397,465 | |||||||||||||||
| Insurance and related expenses |
57,050 | 55,552 | 82,007 | 62,846 | 71,577 | |||||||||||||||
| Other general expenses |
75,353 | 100,897 | 125,176 | 94,107 | 94,401 | |||||||||||||||
| Goodwill impairment charge |
— | — | 6,037 | — | — | |||||||||||||||
|
|
|
|
|
|
|
|
|
|
|
|||||||||||
| Total operating expenses |
2,773,375 | 2,758,535 | 3,699,132 | 3,701,225 | 3,453,117 | |||||||||||||||
|
|
|
|
|
|
|
|
|
|
|
|||||||||||
| Income from operations |
$ | 202,469 | $ | 174,340 | $ | 260,240 | $ | 239,351 | $ | 171,249 | ||||||||||
| Non-operating expenses: |
||||||||||||||||||||
| Interest expense—net |
15,708 | 13,968 | 18,730 | 11,732 | 13,860 | |||||||||||||||
| Other—net |
1,771 | 2,196 | 2,786 | 1,756 | 851 | |||||||||||||||
|
|
|
|
|
|
|
|
|
|
|
|||||||||||
| Total non-operating expenses |
17,479 | 16,164 | 21,516 | 13,488 | 14,711 | |||||||||||||||
|
|
|
|
|
|
|
|
|
|
|
|||||||||||
| Income before income taxes |
184,990 | 158,176 | 238,724 | 225,863 | 156,538 | |||||||||||||||
| Provision for income taxes |
75,846 | 64,852 | 97,792 | 92,295 | 61,064 | |||||||||||||||
|
|
|
|
|
|
|
|
|
|
|
|||||||||||
| Net income |
$ | 109,144 | $ | 93,324 | $ | 140,932 | $ | 133,568 | $ | 95,474 | ||||||||||
|
|
|
|
|
|
|
|
|
|
|
|||||||||||
15
Table of Contents
| Consolidated Statements of Income Per Share Data |
Nine Months Ended September 30, |
Year Ended December 31, | ||||||||||||||||||
| 2016 | 2015 | 2015 | 2014 | 2013 | ||||||||||||||||
| Net income per share attributable to common shareholders |
||||||||||||||||||||
| Basic |
$ | 20.97 | $ | 18.04 | $ | 27.23 | $ | 25.85 | $ | 18.50 | ||||||||||
| Diluted |
$ | 20.95 | $ | 18.01 | $ | 27.18 | $ | 25.80 | $ | 18.44 | ||||||||||
| Weighted average number of shares used in per share amounts |
||||||||||||||||||||
| Basic |
5,203,633 | 5,174,476 | 5,176,332 | 5,166,126 | 5,159,505 | |||||||||||||||
| Diluted |
5,209,735 | 5,180,902 | 5,185,548 | 5,177,671 | 5,177,555 | |||||||||||||||
| Other Financial Data ($ in thousands, except per share data) |
||||||||||||||||||||
| Adjusted income from operations(1) |
$ | 204,070 | $ | 201,040 | $ | 293,008 | $ | 244,276 | $ | 174,204 | ||||||||||
| Adjusted EBITDA(2) |
$ | 401,774 | $ | 375,379 | $ | 529,338 | $ | 474,284 | $ | 386,761 | ||||||||||
| Adjusted net income(3) |
$ | 110,089 | $ | 109,077 | $ | 162,740 | $ | 136,474 | $ | 97,277 | ||||||||||
| Adjusted net income per share(4) |
||||||||||||||||||||
| Basic |
$ | 21.16 | $ | 21.08 | $ | 31.44 | $ | 26.42 | $ | 18.85 | ||||||||||
| Diluted |
$ | 21.13 | $ | 21.05 | $ | 31.38 | $ | 26.36 | $ | 18.79 | ||||||||||
| Operating Statistics ($) | ||||||||||||||||||||
| Truckload |
||||||||||||||||||||
| Revenue per truck per week(5) |
$ | 3,444 | $ | 3,478 | $ | 3,520 | $ | 3,518 | $ | 3,366 | ||||||||||
| Average trucks:(6) |
||||||||||||||||||||
| Company |
9,006 | 8,514 | 8,536 | 8,336 | 8,334 | |||||||||||||||
| Owner-operator |
2,663 | 2,389 | 2,446 | 2,048 | 1,863 | |||||||||||||||
| Intermodal |
||||||||||||||||||||
| Orders (in thousands) |
281.4 | 286.9 | 386.9 | 376.9 | 360.6 | |||||||||||||||
| Containers (at period end) |
17,568 | 17,325 | 17,397 | 17,280 | 14,315 | |||||||||||||||
| Revenue per order(7) |
$ | 1,989 | $ | 2,014 | $ | 2,040 | $ | 1,918 | $ | 1,845 | ||||||||||
| Consolidated Balance Sheet Data ($ in thousands) |
As of September 30, 2016 | |||||||
| Actual | As Adjusted(8) |
|||||||
| Cash and cash equivalents |
$ | 84,954 | $ | 84,954 | ||||
| Property and equipment (net) |
1,785,128 | 1,785,128 | ||||||
| Total assets |
3,023,221 | 3,023,221 | ||||||
| Long-term debt and obligations under capital leases |
560,146 | 560,146 | ||||||
| Temporary equity—Redeemable common stock, Class A |
563,217 | — | ||||||
| Temporary equity—Redeemable common stock, Class B |
496,478 | — | ||||||
| Accumulated earnings |
108,733 | — | ||||||
| Accumulated other comprehensive income |
1,158 | 1,158 | ||||||
| Common stock, Class A |
— | — | ||||||
| Common stock, Class B |
— | — | ||||||
| Additional paid-in capital |
— | 1,059,695 | ||||||
| Retained earnings |
— | 108,733 | ||||||
16
Table of Contents
| Cash Flow Data
($ in thousands) |
Nine Months Ended September 30, |
Year Ended December 31, | ||||||||||||||||||
| 2016 | 2015 | 2015 | 2014 | 2013 | ||||||||||||||||
| Cash provided by (used in) operating activities |
$ | 317,496 | $ | 352,128 | $ | 485,557 | $ | 345,749 | $ | 278,283 | ||||||||||
| Cash provided by (used in) investing activities |
(442,030 | ) | (375,042 | ) | (483,302 | ) | (475,724 | ) | (270,463 | ) | ||||||||||
| Cash provided by (used in) financing activities |
48,812 | 4,580 | 8,536 | 109,028 | (7,210 | ) | ||||||||||||||
| (1) | We define “adjusted income from operations” as income from operations, adjusted to exclude certain litigation costs, goodwill impairment, changes in vacation policy and acquisition costs. We describe these adjustments reconciling income from operations to adjusted income from operations in the table below. |
We believe that using adjusted income from operations is helpful in analyzing our performance because it removes the impact of items from our operating results that, in our opinion, do not reflect our core operating performance. Our management and our Board of Directors focus on adjusted income from operations as a key measure of our performance. We believe our presentation of adjusted income from operations is helpful to investors because it provides investors the same information that we use internally for purposes of assessing our core operating performance.
Adjusted income from operations is a non-GAAP financial measure and should not be considered as an alternative to income from operations as a measure of financial performance or cash flows from operations as a measure of liquidity, or any other performance measure derived in accordance with GAAP, and it should not be construed as an inference that our future results will be unaffected by unusual or non-recurring items. In evaluating adjusted income from operations, you should be aware that in the future we may incur expenses that are the same as or similar to some of the adjustments in this presentation. Our presentation of adjusted income from operations should not be construed to imply that our future results will be unaffected by any such adjustments. Our management compensates for these limitations by primarily relying on our GAAP results in addition to using adjusted income from operations supplementally.
The following is a reconciliation of income from operations, which is the most directly comparable GAAP measure, to adjusted income from operations:
| ($ in thousands) |
Nine Months Ended September 30, |
Year Ended December 31, | ||||||||||||||||||
| 2016 | 2015 | 2015 | 2014 | 2013 | ||||||||||||||||
| Income from operations |
$ | 202,469 | $ | 174,340 | $ | 260,240 | $ | 239,351 | $ | 171,249 | ||||||||||
| Litigation(a) |
— | 26,700 | 26,731 | 4,925 | 10,000 | |||||||||||||||
| Goodwill impairment(b) |
— | — | 6,037 | — | — | |||||||||||||||
| Change in vacation policy(c) |
— | — | — | — | (7,045 | ) | ||||||||||||||
| Acquisition costs(d) |
1,601 | — | — | — | — | |||||||||||||||
|
|
|
|
|
|
|
|
|
|
|
|||||||||||
| Adjusted income from operations |
$ | 204,070 | $ | 201,040 | $ | 293,008 | $ | 244,276 | $ | 174,204 | ||||||||||
| (a) | Costs associated with certain lawsuits challenging compliance with aspects of the Fair Labor Standards Act (FLSA). |
| (b) | As a result of our annual goodwill impairment test as of December 31, 2015, we took an impairment charge for our Asia reporting unit. |
| (c) | Reflects a change to our vacation policy in 2013 in which the award of vacation days changed from being based on a vesting plan to an annual granting plan, resulting in a one-time benefit to income from operations. |
| (d) | Costs related to the acquisitions of Watkins & Shepard and Lodeso. |
| (2) | We define “adjusted EBITDA” as net income, plus income tax expense, interest expense and depreciation and amortization, as further adjusted to exclude other (income)/expense and certain adjustments. We describe these adjustments reconciling net income to adjusted EBITDA in the table below. |
We believe that using adjusted EBITDA is helpful in analyzing our performance because it removes the impact of items from our operating results that, in our opinion, do not reflect our core operating performance. Our management focuses on adjusted EBITDA principally as a measure of our operating performance and believes that adjusted EBITDA is helpful to investors because it is frequently used by analysts, investors and other interested parties to evaluate companies in our industry. We also believe adjusted EBITDA is helpful to our management and investors as a measure of comparative operating performance from period to period.
Adjusted EBITDA is a non-GAAP financial measure and should not be considered as an alternative to net income as a measure of financial performance or cash flows from operations as a measure of liquidity, or any other performance measure derived in accordance with GAAP, and it should not be construed as an inference that our future results will be unaffected by unusual or non-recurring items. In
17
Table of Contents
evaluating adjusted EBITDA, you should be aware that in the future we may incur expenses that are the same as or similar to some of the adjustments in this presentation. Our presentation of adjusted EBITDA should not be construed to imply that our future results will be unaffected by any such adjustments. Our management compensates for these limitations by primarily relying on our GAAP results in addition to using adjusted EBITDA supplementally.
The following is a reconciliation of net income, which is the most directly comparable GAAP measure, to adjusted EBITDA:
| ($ in thousands) |
Nine Months Ended September 30, |
Year Ended December 31, | ||||||||||||||||||
| 2016 | 2015 | 2015 | 2014 | 2013 | ||||||||||||||||
| Net income |
$ | 109,144 | $ | 93,324 | $ | 140,932 | $ | 133,568 | $ | 95,474 | ||||||||||
| Provision for income taxes |
75,846 | 64,852 | 97,792 | 92,295 | 61,064 | |||||||||||||||
| Interest expense |
15,708 | 13,968 | 18,730 | 11,732 | 13,860 | |||||||||||||||
| Depreciation and amortization |
197,704 | 174,339 | 236,330 | 230,008 | 212,557 | |||||||||||||||
| Other non-operating expenses |
1,771 | 2,196 | 2,786 | 1,756 | 851 | |||||||||||||||
| Litigation(a) |
— | 26,700 | 26,731 | 4,925 | 10,000 | |||||||||||||||
| Goodwill impairment(b) |
— | — | 6,037 | — | — | |||||||||||||||
| Change in vacation policy(c) |
— | — | — | — | (7,045 | ) | ||||||||||||||
| Acquisition costs(d) |
1,601 | — | — | — | — | |||||||||||||||
|
|
|
|
|
|
|
|
|
|
|
|||||||||||
| Adjusted EBITDA |
$ | 401,774 | $ | 375,379 | $ | 529,338 | $ | 474,284 | $ | 386,761 | ||||||||||
| (a) | Costs associated with certain lawsuits challenging compliance with aspects of the Fair Labor Standards Act (FLSA). |
| (b) | As a result of our annual goodwill impairment test as of December 31, 2015, we took an impairment charge for our Asia reporting unit. |
| (c) | Reflects a change to our vacation policy in 2013 in which the award of vacation days changed from being based on a vesting plan to an annual granting plan, resulting in a one-time benefit to net income. |
| (d) | Costs related to the acquisitions of Watkins & Shepard and Lodeso. |
| (3) | We define “adjusted net income” as net income, as adjusted to exclude certain litigation costs, goodwill impairment, changes in vacation policy and acquisition costs. We describe these adjustments reconciling net income to adjusted net income in the table below. |
We believe that using adjusted net income is helpful in analyzing our performance because it removes the impact of items from our operating results that, in our opinion, do not reflect our core operating performance. We believe our presentation of adjusted net income is helpful to investors because it provides investors the same type of information that we use internally for purposes of assessing our core operating performance.
Adjusted net income is a non-GAAP financial measure and should not be considered as an alternative to net income as a measure of financial performance or cash flows from operations as a measure of liquidity, or any other performance measure derived in accordance with GAAP, and it should not be construed as an inference that our future results will be unaffected by unusual or non-recurring items. In evaluating adjusted net income, you should be aware that in the future we may incur expenses that are the same as or similar to some of the adjustments in this presentation. Our presentation of adjusted net income should not be construed to imply that our future results will be unaffected by any such adjustments. Our management compensates for these limitations by primarily relying on our GAAP results in addition to using adjusted net income supplementally.
The following is a reconciliation of net income, which is the most directly comparable GAAP measure, to adjusted net income:
| ($ in thousands) |
Nine Months Ended September 30, |
Year Ended December 31, | ||||||||||||||||||
| 2016 | 2015 | 2015 | 2014 | 2013 | ||||||||||||||||
| Net income |
$ | 109,144 | $ | 93,324 | $ | 140,932 | $ | 133,568 | $ | 95,474 | ||||||||||
| Litigation(a) |
— | 26,700 | 26,731 | 4,925 | 10,000 | |||||||||||||||
| Goodwill impairment(b) |
— | — | 6,037 | — | — | |||||||||||||||
| Change in vacation policy(c) |
— | — | — | — | (7,045 | ) | ||||||||||||||
| Acquisition costs(d) |
1,601 | — | — | — | — | |||||||||||||||
| Income tax adjustment(e) |
(656 | ) | (10,947 | ) | (10,960 | ) | (2,019 | ) | (1,152 | ) | ||||||||||
|
|
|
|
|
|
|
|
|
|
|
|||||||||||
| Adjusted net income |
$ | 110,089 | $ | 109,077 | $ | 162,740 | $ | 136,474 | $ | 97,277 | ||||||||||
| (a) | Costs associated with certain lawsuits challenging compliance with aspects of the Fair Labor Standards Act (FLSA). |
| (b) | As a result of our annual goodwill impairment test as of December 31, 2015, we took an impairment charge for our Asia reporting unit. |
18
Table of Contents
| (c) | Reflects a change to our vacation policy in 2013 in which the award of vacation changed from being based on a vesting plan to an annual granting plan, resulting in a one-time benefit to net income. |
| (d) | Costs related to the acquisitions of Watkins & Shepard and Lodeso. |
| (e) | Income tax adjustment is based on determining the tax effect of each individual item presented in the table. |
| (4) | Calculated as adjusted net income divided by weighted-average number of common shares outstanding during the applicable period (for basic) or the weighted-average number of diluted common shares outstanding during the applicable period (for diluted). |
| (5) | See “Management’s Discussion and Analysis of Financial Condition and Results of Operations—Key Performance Indicators—Truckload Segment” for a discussion of revenue per truck per week. |
| (6) | Average trucks is calculated based on beginning and ending month counts and represents the average number of trucks available to haul freight over a specific period of time. |
| (7) | See “Management’s Discussion and Analysis of Financial Condition and Results of Operations—Key Performance Indicators— Intermodal Segment” for a discussion of revenue per order. |
| (8) | The consolidated balance sheet data as of September 30, 2016, as adjusted, presents our consolidated balance sheet to give effect to the reclassification of our Class A and Class B common stock, which is, before giving effect to these amendments, considered redeemable under GAAP, to shareholders’ equity, including common stock and additional paid-in capital and upon the elimination of the repurchase rights from the shareholders. Contemporaneously with the completion of this offering, we will amend the Schneider National, Inc. Employee Stock Purchase Plan and certain agreements governing ownership of our common stock held by existing shareholders, including members of the Schneider family and their family trusts, in order to remove provisions that currently grant each of our shareholders the right to require us to repurchase our common stock held by such shareholder under certain circumstances. When these repurchase rights terminate upon completion of this offering, all of our outstanding common stock will be considered shareholders’ equity rather than temporary equity under GAAP. |
19
Table of Contents
Investing in our Class B common stock involves a high degree of risk. You should carefully consider the risks and uncertainties described below, together with all of the other information in this prospectus, including our consolidated financial statements and related notes included elsewhere in this prospectus, before deciding whether to purchase shares of our Class B common stock. If any of the following risks are realized, our business, operating results, financial condition and prospects could be materially and adversely affected. In that event, the price of our Class B common stock could decline, and you could lose part or all of your investment.
Risks Relating to Our Business and Industry
The truckload and transportation industry is affected by economic and business risks that are largely beyond our control.
The truckload industry is highly cyclical, and our business is dependent on a number of factors that may have a negative impact on our operating results, many of which are beyond our control. A substantial portion of our freight is from customers in the general merchandise and consumer products goods industries. As such, our volumes are largely dependent on consumer spending and retail sales and our results may be more susceptible to trends in unemployment and retail sales than carriers that do not have this concentration.
We believe that some of the most significant factors beyond our control that may negatively impact our operating results are economic changes that affect supply and demand in transportation markets, such as:
| • | recessionary economic cycles, such as the period from 2007 to 2009; |
| • | changes in customers’ inventory levels, including shrinking product/package sizes, and in the availability of funding for their working capital; |
| • | commercial (Class A) driver shortages; |
| • | industry compliance with an ongoing regulatory environment; |
| • | excess truck capacity in comparison with shipping demand; and |
| • | downturns in customers’ business cycles, which may be caused by declines in consumer spending. |
The risks associated with these factors are heightened when the United States economy is weakened. Some of the principal risks during such times are as follows:
| • | low overall freight levels, which may impair our asset utilization; |
| • | customers with credit issues and cash flow problems; |
| • | changing freight patterns resulting from redesigned supply chains, resulting in an imbalance between our capacity and customer demand; |
| • | customers bidding out freight or selecting competitors that offer lower rates, in an attempt to lower their costs, forcing us to lower our rates or lose freight; and |
| • | more unbilled miles incurred to obtain loads. |
Economic conditions that decrease shipping demand or increase the supply of capacity in the truckload transportation industry can exert downward pressure on rates and equipment utilization, thereby decreasing asset productivity. Declining freight levels and rates, a prolonged recession or general economic instability could result in declines in our results of operations, which declines may be material.
We also are subject to cost increases outside our control that could materially reduce our profitability if we are unable to increase our rates sufficiently. Such cost increases include, but are not limited to, fuel and energy
20
Table of Contents
prices, driver wages, taxes and interest rates, tolls, license and registration fees, insurance premiums, regulations, revenue equipment and related maintenance costs and healthcare and other benefits for our associates. We cannot predict whether, or in what form, any such cost increase or event could occur. Any such cost increase or event could adversely affect our profitability.
In addition, events outside our control, such as strikes or other work stoppages at our facilities or at customer, port, border or other shipping locations, weather, actual or threatened armed conflicts or terrorist attacks, efforts to combat terrorism, military action against a foreign state or group located in a foreign state or heightened security requirements could lead to reduced economic demand, reduced availability of credit or temporary closing of shipping locations or United States borders. Such events or enhanced security measures in connection with such events could impair our operations and result in higher operating costs.
The truckload and transportation industry is highly competitive and fragmented, which subjects us to competitive pressures pertaining to pricing, capacity and service.
Our operating segments compete with many truckload carriers, some LTL carriers, railroads, logistics, brokerage, freight forwarding and other transportation companies. The North American surface transportation market is highly competitive and fragmented. Some of our customers may utilize their own private fleets rather than outsourcing loads to us. Some of our competitors may have greater access to equipment, a larger fleet, a wider range of services, preferential dedicated customer contracts, greater capital resources or other competitive advantages. Numerous competitive factors could impair our ability to maintain or improve our profitability. These factors include the following:
| • | Many of our competitors periodically reduce their freight rates to gain business, especially during times of reduced growth in the economy. This may make it difficult for us to maintain or increase freight rates, or may require us to reduce our freight rates. Additionally, it may limit our ability to maintain or expand our business. |
| • | We recently expanded our presence in the final mile market, with our acquisition of Watkins & Shepard and Lodeso. This is a difficult to serve market and we face competition in this market from competitors that have operated in this market for several years, which may hinder our ability to compete and gain market share. |
| • | Since some of our customers also operate their own private trucking fleets, they may decide to transport more of their own freight. |
| • | Some shippers have selected core carriers for their shipping needs, for which we may not be selected. |
| • | Many customers periodically solicit bids from multiple carriers for their shipping needs, despite the existence of dedicated contracts, which may depress freight rates or result in a loss of business to our competitors. |
| • | The continuing trend toward consolidation in the trucking industry may result in more large carriers with greater financial resources and other competitive advantages, with which we may have difficulty competing. |
| • | Higher fuel prices and higher fuel surcharges to our customers may cause some of our customers to consider freight transportation alternatives, including rail transportation. |
| • | Advancements in technology may necessitate that we increase investments in order to remain competitive, and our customers may not be willing to accept higher freight rates to cover the cost of these investments. |
| • | Competition from freight logistics and brokerage companies may negatively impact our customer relationships and freight rates. |
| • | Smaller carriers may build economies of scale with procurement aggregation providers, which may improve such carriers’ abilities to compete with us. |
21
Table of Contents
We may not be able to effectively manage and implement our organic growth strategies.
While we currently believe we can grow our profits and cash flows organically through further penetration of existing customers and by expanding our customer base, we may not be able to effectively and successfully implement such strategies and realize our stated goals. Our goals may be negatively affected by a failure to further penetrate our existing customer base, cross-sell our service offerings, pursue new customer opportunities, manage the operations and expenses of new or growing service offerings or otherwise achieve growth of our service offerings. Successful execution of our business strategies may not result in us achieving our current business goals.
Our businesses depend on our strong reputation and the value of the Schneider brand.
We believe that the Schneider brand name symbolizes high-quality service, reliability and efficiency, and is one of our most important and valuable assets. The Schneider brand name and our corporate reputation are significant sales and marketing tools, and we devote substantial resources to promoting and protecting them. Adverse publicity (whether or not justified) relating to activities by our associates, contractors or agents, such as accidents, customer service mishaps or noncompliance with laws, could tarnish our reputation and reduce the value of our brand. With the increased use of social media outlets such as YouTube, Facebook and Twitter, adverse publicity can be disseminated quickly and broadly, making it increasingly difficult for us to effectively respond. Damage to our reputation and loss of brand equity could reduce demand for our services and thus have an adverse effect on our financial condition, liquidity and results of operations, as well as require additional resources to rebuild our reputation and restore the value of our brand.
We have several major customers, the loss of one or more of which could have a material adverse effect on our business.
A significant portion of our operating revenue is generated from a number of major customers, the loss of one or more of which could have a material adverse effect on our business. For the year ended December 31, 2015, our top 20 customers accounted for approximately 43% of our revenue, our top 10 customers accounted for approximately 30% of our revenue, our top 5 customers accounted for approximately 22% of our revenue and our largest customer accounted for less than 10% of our revenue. Economic and capital markets conditions may adversely affect our customers and their ability to remain solvent. Our customers’ financial difficulties can negatively impact our business and operating results and financial condition. Generally, we do not have contractual relationships with our customers that guarantee any minimum volumes, and our customer relationships may not continue as presently in effect. We generally do not have long-term contractual relationships with our customers, including our dedicated customers, and certain of these contracts contain clauses that permit cancellation on a short-term basis without cause, and accordingly any of our customers may not continue to utilize our services, renew our existing contracts or continue at the same volume levels. Despite the existence of contract arrangements with our customers, certain of our customers may nonetheless engage in competitive bidding processes that could negatively impact our contractual relationship. In addition, certain of our major customers may increasingly use their own truckload and delivery fleets, which would reduce our freight volumes. A reduction in or termination of our services by one or more of our major customers could have a material adverse effect on our business and operating results.
Our profitability may be materially adversely impacted if our capital investments do not match customer demand for invested resources or if there is a decline in the availability of funding sources for these investments.
Our operations require significant investments. The amount and timing of capital investments depend on various factors, including anticipated volume levels and the price and availability of assets. If anticipated demand differs materially from actual usage, our capital-intensive truckload segment may have too much or too little
22
Table of Contents
capacity. Moreover, across our three reportable segments resource requirements vary with customer demand, which may be subject to seasonal or general economic conditions. Our ability to properly select freight and adapt to changes in customer transportation requirements is important to efficiently deploy resources and make capital investments in trucks, trailers, containers and chassis (with respect to our truckload and intermodal segments) or obtain qualified third-party capacity at a reasonable price (with respect to our logistics segment). Although our business volume is not highly concentrated, our customers’ financial failures or loss of customer business may also affect us.
We may not be able to successfully implement our company enterprise strategy of diversifying our revenue base and expanding our capabilities.
Our company enterprise strategy entails selectively diversifying our revenue base, as we have done, by entering the over-dimensional consumer freight market, increasingly becoming part of the e-commerce supply chain and growing our market share in specialty equipment services. This strategy involves certain risks, and we may not overcome these risks, in which case our business, financial position and operating results could be materially and adversely affected. In connection with our company enterprise strategy, we have in the past made selective acquisitions, made new investments in technology and in office, service and warehouse centers, increased sales and marketing efforts and hired new drivers and associates. We expect to continue to pursue our company enterprise strategy, and this exposes us to certain risks, including:
| • | making significant capital expenditures, which could require substantial capital and cash flow that we may not have or may not be able to obtain on satisfactory terms; |
| • | growth may strain our management, capital resources, information systems and customer service; |
| • | hiring new managers, drivers and other associates, including in specialty equipment services, may increase training and compliance costs and may result in temporary inefficiencies until those associates become proficient in their jobs; |
| • | specialty transport of bulk chemicals and other hazardous materials, which subjects us to environmental, health and safety laws and regulations by governmental authorities and, in the event of an accidental release of these commodities, could result in significant loss of life and extensive property damage as well as environmental remediation obligations; and |
| • | expanding our service offerings may require us to encounter new competitive challenges in markets in which we have not previously operated or with which we are unfamiliar. |
Fluctuations in the price or availability of fuel, the volume and terms of diesel fuel purchase commitments and surcharge collection may increase our costs of operation, which could materially and adversely affect our margins.
Fuel represents a significant expense for us. Diesel fuel prices fluctuate greatly due to factors beyond our control, such as political events, terrorist activities, armed conflicts, depreciation of the dollar against other currencies and weather, such as hurricanes, and other natural or man-made disasters, each of which may lead to an increase in the cost of fuel. Fuel prices also are affected by the rising demand in developing countries, and could be adversely impacted by diminished drilling activity and by the use of crude oil and oil reserves for other purposes. Such events may lead not only to increases in fuel prices, but also to fuel shortages and disruptions in the fuel supply chain. Because our operations are dependent upon diesel fuel, and a portion of our business is based on fuel purchased on the spot market at prevailing market rates, significant diesel fuel cost increases, shortages or supply disruptions could materially and adversely affect our operating results and financial condition.
Increases in fuel costs, to the extent not offset by rate per mile increases or fuel surcharges, have an adverse effect on our operations and profitability. While a portion of our fuel costs are covered by pass-through
23
Table of Contents
provisions in customer contracts and compensatory fuel surcharge programs, we also incur fuel costs that cannot be recovered even with respect to customers with which we maintain fuel surcharge programs, such as those associated with unbilled miles, or the time when our engines are idling. Because our fuel surcharge recovery lags behind changes in fuel prices, our fuel surcharge recovery may not capture the increased costs we pay for fuel, especially when prices are rising, leading to fluctuations in our levels of reimbursement. Our levels of reimbursement have fluctuated in the past. Further, during periods of low freight volumes, shippers can use their negotiating leverage to impose less compensatory fuel surcharge policies. In addition, the terms of each customer’s fuel surcharge agreement vary, and customers may seek to modify the terms of their fuel surcharge agreements to minimize recoverability for fuel price increases. Such fuel surcharges may not be maintained indefinitely or may not be sufficiently effective. As of December 31, 2015, we had no derivative financial instruments to reduce our exposure to fuel price fluctuations.
Difficulties attracting and retaining qualified drivers, including through owner-operators, could materially adversely affect our profitability and ability to maintain or grow our fleet.
Like many truckload carriers, from time to time we may experience difficulty in attracting and retaining sufficient numbers of qualified drivers, including through owner-operators, and driver shortages may recur in the future. Our challenge with attracting and retaining qualified drivers stems from intense market competition and our driver quality standards, which subjects us to increased payments for driver compensation and owner-operator contracted rates. Our specialty equipment services require special training to handle unique operating requirements. We use physical function tests and hair follicle and urine testing to screen and test all driver applicants, which we believe is a rigorous standard relative to others in our industry and could decrease the pool of qualified applicants available to us. Failure to recruit high-quality, safe drivers that meet our testing standards could diminish the safety of our fleet and could have a materially adverse effect on our customer relationships and our business.
Our company drivers are generally compensated on a per-mile basis, and the rate per-mile generally increases with the drivers’ length of service. Owner-operators contracting with us are generally compensated on a percentage of revenue basis. The compensation we offer our drivers and owner-operators is also subject to market conditions and labor supply. We may in future periods increase company driver and owner-operator compensation, which will be more likely to the extent that economic conditions improve and industry regulation exacerbates driver shortages forcing driver compensation higher. The recent electronic logging device regulations, requiring compliance by 2017, are expected to further tighten the market for eligible drivers. In addition to involuntary associate terminations, our company driver voluntary turnover rate throughout 2015 was approximately 79%, and like most in our industry, we suffer from a high turnover rate of company drivers, especially in the first 90 days of employment. Our turnover rate requires us to continually recruit a substantial number of company drivers in order to operate our revenue-producing fleet equipment, including trucks, chassis and specialty equipment. If we are unable to continue to attract and retain a sufficient number of high-quality company drivers, and contract with suitable owner-operators, we could be required to adjust our compensation packages, or operate with fewer trucks and face difficulty meeting shipper demands, all of which could adversely affect our profitability and ability to maintain our size or grow.
Our use of owner-operators to provide a portion of our truck fleet exposes us to different risks than we face with our owned trucks.
We may contract with more owner-operators and use more owner-operator trucks than some of our competitors. We are therefore more dependent on owner-operator trucks than some of our competitors. Failure to maintain owner-operator business and relationships and increased industry competition for owner-operators could have a materially adverse effect on our operating results.
During times of increased economic activity, we face heightened competition for owner-operators from other carriers. To the extent our turnover increases, we may be required to increase owner-operator compensation
24
Table of Contents
or take other measures to remain an attractive option for owner-operators. If we cannot attract sufficient owner-operators, or it becomes economically difficult for owner-operators to survive, we may not be able to maintain the percentage of our fleet provided by owner-operators or maintain our delivery schedules.
We provide financing to certain qualified owner-operators who qualify for financing in order to lease trucks from us. If we are unable to provide such financing in the future, due to liquidity constraints or other restrictions, we may experience a decrease in the number of owner-operators available to fully operate our assets. Further, if owner-operators operating the trucks we finance default under or otherwise terminate the financing arrangement and we are unable to find a replacement owner-operator, we may incur losses on amounts owed to us with respect to the truck in addition to any losses we may incur as a result of idling the truck.
Our lease contracts with owner-operators are governed by the federal and other leasing regulations, which impose specific requirements on us and owner-operators. It is possible that we could face lawsuits alleging the violation of leasing obligations or failure to follow the contractual terms, which could result in liability.
We utilize owner-operators to complete our services. These owner-operators are subject to similar regulation requirements, such as the electronic on-board recording and driver Hours of Service (HOS) requirements that apply to larger carriers, which may have a more significant impact on their operations, causing them to exit the transportation industry. Aside from when these third parties may use our trailing equipment to fulfill loads, we do not own the revenue equipment or control the drivers delivering these loads. The inability to obtain reliable third-party owner-operators could have a material adverse effect on our operating results and business growth.
We depend on railroads in the operation of our intermodal business and therefore our ability to offer intermodal services could be limited if we experience instability from third parties we use in that business.
Our intermodal segment utilizes railroads in the performance of its transportation services. The majority of these services are provided pursuant to contractual relationships with the railroads. While we have agreements with a number of Class I railroads, the majority of our business travels on the Burlington Northern Santa Fe (BNSF) and the CSX Transportation (CSX) railways, with which we have established relationships. One of our competitors has a preferential contractual arrangement with BNSF, which limits the market share and relative profitability of the services we provide through BNSF. We are currently in negotiations with CSX with respect to renewal of our contract, and there is no guarantee that these negotiations will be successful. Our intermodal business may be affected by any adverse change to relationships with railroad service providers upon the expiration or renewal of such contracts.
Pricing arrangements with these Class I Railroads generally permit pricing to be adjusted based on market conditions and an adverse change in future market conditions could adversely affect pricing. In addition, a material change in the relationship with or the inability to utilize one or more of these railroads could have a material adverse effect on our business and operating results. While the intermodal train speeds of BNSF in the western United States improved throughout 2015, intermodal train speeds on the eastern railroads CSX have been limited due to volume growth in the past two years. Future declines in overall service and volume levels provided by these railroads could have a material adverse effect on our intermodal segment. In addition, a portion of the freight we deliver through both our intermodal and trucking segments is imported to the United States through ports of call that are subject to labor union contracts. Work stoppages or other disruptions at any of these ports could have a material adverse effect on our business.
We depend on third-party capacity providers for logistics brokerage business, and service instability from these providers could limit growth and profitability of our logistics segment, which could adversely affect our revenue, operating results and customer relationships.
Our brokerage business is dependent upon the services of third-party capacity providers, including other truckload carriers. These third-party providers may seek other freight opportunities and may require increased
25
Table of Contents
compensation in times of improved freight demand or tight trucking capacity. Our third-party truckload carriers may also be affected by certain factors to which our drivers and owner-operators are subject, including, but not limited to, driver shortage, alternative employment opportunities, varying freight market conditions, high capital expenditures and trucking industry regulations. Most of our third-party capacity provider transportation services contracts are cancelable on a short-term basis without cause. Our inability to secure the services of these third-parties, or increases in the prices we must pay to secure such services, could have an adverse effect on our operations and profitability to the extent we are not able to obtain corresponding customer rate increases.
We currently depend on intermodal chassis rented to us by a third-party and our plan to convert our intermodal chassis supply to an ownership model will result in significant one-time costs and adversely affect our operating results if not executed successfully.
A significant percentage of the chassis currently utilized in our intermodal business are rented from a single company, which results in costs relating to lease, maintenance and repair and puts us at a competitive disadvantage. We expect to convert our rented intermodal chassis model to an ownership model to achieve cost savings, including by improving chassis quality. The expected timing for completion of this conversion process is constrained by our current chassis rental contract and may lead to significant one-time costs through fiscal year 2017 resulting from conversion costs and payments under our existing chassis rental contract (which is set to expire in fiscal year 2017). Our conversion of our rented intermodal chassis model to an ownership model to improve cost savings may not be successful and therefore could adversely affect our operating results.
If our third-party logistics customers are able to reduce their total cost structure and improve their internal logistics operations and transportation services, our third-party logistics business and operating results may be materially adversely effected.
A major driver for customers to use third-party logistics providers instead of their own personnel is their inherent high cost and difficulty in attaining logistics expertise and operational efficiencies. Our third-party logistics service is generally able to provide such services more efficiently than otherwise could be provided “in-house,” primarily as a result of our technological efficiencies, lower and more flexible associate cost structure and our existing industry relationships and expertise. If, however, our third-party logistics customers are able to reduce their in-house logistics cost structures, especially by reducing associate costs, we may not be able to provide our customers with an attractive alternative for their logistics needs and our third-party logistics business and operating results may be materially adversely effected.
Difficulty in obtaining material, equipment, goods and services from our vendors and suppliers could adversely affect our business.
We are dependent upon our suppliers for certain products and materials, including our trucks, trailers, chassis and containers. We manage our over-the-road fleet to a 5 year trade cycle with the current average age-of-fleet of our sleeper cab tractors at approximately 2.5 years. Accordingly, we rely on suppliers of our trucks and truck components to maintain the age of our fleet. We believe that we have positive relationships with our vendors and suppliers and are generally able to obtain favorable pricing and other terms from such parties. If we fail to maintain these relationships with our vendors and suppliers, or if our vendors and suppliers are unable to provide the products and materials we need or undergo financial hardship, we could experience difficulty in obtaining needed goods and services because of production interruptions, limited material availability or other reasons. Subsequently, our business and operations could be adversely affected.
If we are unable to recruit, develop and retain our key associates, our business, financial condition and operating results could be adversely affected.
We are highly dependent upon the services of certain key employees, including our team of executive officers and managers. We currently do not have employment agreements with any of our executive officers, and
26
Table of Contents
the loss of any of their services could negatively impact our operations and future profitability. Inadequate succession planning or unexpected departure of key executive officers could cause substantial disruption to our business operations, deplete our institutional knowledge base and erode our competitive advantage. Additionally, we must continue to recruit, develop and retain skilled and experienced service center managers if we are to realize our goal of expanding our operations and continuing our growth, including internationally. Failure to recruit, develop and retain a core group of service center managers could have a materially adverse effect on our business.
Efforts by labor unions could divert management’s attention and could have a materially adverse effect on our operating results.
We face the risk that Congress or one or more states will approve legislation significantly affecting our business and our relationship with our associates, such as the previously proposed federal legislation referred to as the Employee Free Choice Act, which would substantially liberalize the procedures for union organization. We also face the risk that our associates, including drivers, may attempt to organize. Currently, thirteen of our company drivers are members of an organized labor union as a result of a commitment from the 1980s to allow this group of drivers to finish their careers with Schneider. Any attempt to organize by our associates could result in increased legal and other associated costs. In addition, if we were to enter into a collective bargaining agreement, the terms could negatively affect our costs, efficiency and ability to generate acceptable returns on the affected operations. Moreover, any labor disputes or work stoppages, whether or not our other associates unionize, could disrupt our operations and reduce our revenues.
Insurance and claims expenses could significantly reduce our earnings.
Our future insurance and claims expense might exceed historical levels, which could reduce our earnings. We self-insure or maintain a high deductible for a portion of our claims exposure resulting from workers’ compensation, auto liability, general liability, cargo and property damage claims, as well as associate health insurance. Estimating the number and severity of claims, as well as related judgment or settlement amounts is inherently difficult. This, along with legal expenses, incurred but not reported claims and other uncertainties can cause unfavorable differences between actual claim costs and our reserve estimates. We reserve for anticipated losses and expenses and periodically evaluate and adjust our claims reserves to reflect our experience. However, ultimate results may differ from our estimates, which could result in losses over our reserved amounts.
We maintain insurance with licensed insurance carriers above the amounts which we retain. Although we believe our aggregate insurance limits should be sufficient to cover reasonably expected claims, it is possible that the amount of one or more claims could exceed our aggregate coverage limits. If any claim were to exceed our coverage, we would bear the excess, in addition to our other self-insured/retained amounts. Insurance carriers have raised premiums for many businesses, including transportation companies. As a result, our insurance and claims expense could increase, or we could raise our self-insured retention or deductible when our policies are renewed or replaced. Our operating results and financial condition could be materially and adversely affected if (i) cost per claim, premiums, or the number of claims significantly exceeds our estimates, (ii) we experience a claim in excess of our coverage limits, (iii) our insurance carriers fail to pay on our insurance claims or (iv) we experience a claim for which coverage is not provided.
Insuring risk through our captive insurance company could adversely impact our operations.
We insure a significant portion of our risk through our wholly owned and consolidated captive insurance company, INS Insurance, Inc. (INS). In addition to insuring portions of our own risk, INS provides insurance coverage to owner-operators. Our captive insurance company accesses the reinsurance markets and may increase retention amounts to offset the insurance market pressures, which could expose us to volatility in claims expenses.
27
Table of Contents
To comply with certain state insurance regulatory requirements, cash and cash equivalents must be paid to INS as capital investments and to cover insurance premiums, which deployed assets may be restricted as collateral for anticipated losses. In addition, we must deploy from our balance sheet the restricted cash used for payment of insured claims. In the future, we may continue to insure our risk through our captive insurance subsidiary, which may cause increases in the required amount of our restricted cash or other collateral, such as letters of credit. Significant increases in the amount of collateral required by third-party insurance carriers and regulators would reduce our liquidity and could adversely affect our results of operations.
Our captive insurance company is subject to substantial government regulation.
Our captive insurance company is domiciled in Vermont and regulated by state authorities. State regulations generally provide protection to policy holders, rather than shareholders, and generally involve:
| • | approval of premium rates for insurance; |
| • | standards of solvency; |
| • | minimum amounts of statutory capital surplus that must be maintained; |
| • | limitations on types and amounts of investments; |
| • | regulation of dividend payments and other transactions between affiliates; |
| • | regulation of reinsurance; |
| • | regulation of underwriting and marketing practices; |
| • | approval of policy forms; |
| • | methods of accounting; and |
| • | filing of annual and other reports with respect to financial condition and other matters. |
These regulations may increase our costs of regulatory compliance, limit our ability to change premiums, restrict our ability to access cash held in our captive insurance companies and otherwise impede our ability to take actions we would otherwise take.
We operate in a highly regulated industry and increased costs of compliance with, or liability for violation of, existing or future regulations could have a materially adverse effect on our business.
We operate in the United States pursuant to operating authority granted by the DOT. Our company drivers and owner-operator drivers with whom we contract also must comply with the safety and fitness regulations of the DOT, implemented through the Federal Motor Carrier Safety Administration (FMCSA), including those relating to CSA safety performance and measurements, drug and alcohol testing and Hours of Service (HOS). Weight and equipment dimensions also are subject to government regulations. We are also subject to regulation at the state level. We also may become subject to new or more restrictive regulations relating to exhaust emissions, drivers’ Hours of Service (HOS), ergonomics, collective bargaining, security at ports and other matters affecting safety or operating methods. In addition, FMCSA published the notice of proposed rulemaking regarding how carriers are assigned their “safety fitness” score in January 2016. See “Business—Regulation—Safety Fitness Determination.” Under the proposed rule, the current three tier system that requires an audit to occur in order for a rating to be issued would be replaced by a new system that would only indicate those carriers that are unfit. The new system would continue to use comprehensive audits but also allow for ratings to be based on CSA scores which are derived from roadside inspection and crash performance to determine which carriers are unfit to operate based on their performance against fixed thresholds. In order to be deemed unfit using CSA scores a carrier would have to be failing in 2 or more BASICs. We are still awaiting the final rule which is not expected until 2016 or 2017. FMCSA estimates that the proposed rule would increase the number of motor carriers determined to be unfit by more than two and a half times. Future CSA rulemaking could adversely affect us, including our ability to maintain or grow our fleet as well as our customer relationships.
28
Table of Contents
In December 2015, the FMCSA final rule related to mandatory use of electronic logging devices was published, and requires the use of electronic logging devices by nearly all carriers by December 10, 2017. All of our trucks, including all the owner-operator trucks used by us, are currently equipped with EOBRs. Nonetheless, we believe this electronic logging device regulation may exacerbate the driver shortage, tighten truck capacity and disproportionately impact relatively smaller carriers by reducing available driving time. There can be no guarantee that despite our current fleet-wide use of EOBRs, that upon enforcement of the electronic logging device regulation we will be found by enforcement authorities to be compliant with the electronic logging device rule in all respects. In addition, the implementation of the electronic logging device final rule is being contested in federal court by parties opposed to the rule. Federal law also requires major freight and commuter railroads to install and maintain new safety technology known as Positive Train Control, which is complex and can be costly to implement, and therefore may adversely affect our railroad partners and in turn have a materially adverse effect on operating results of our intermodal business. In September 2016, the National Highway Traffic Safety Administration (NHTSA) and FMCSA proposed regulations that would require vehicles of a certain size to be equipped with a speed limiting device set to a speed to be specified. There can be no guarantee as to whether a final rule requiring speed limiting devices will be implemented, and if so the nature of any such rule and its impact on our fleet and operations.
In 2008 the State of California’s Air Resources Board (ARB) approved the Heavy-Duty Vehicle Greenhouse Gas (GHG) Emission Reduction Regulation in efforts to reduce GHG emissions from certain long-haul tractor-trailers that operate in California by requiring them to utilize technologies that improve fuel efficiency (regardless of where the vehicle is registered). The regulation required owners of long-haul tractors and 53-foot trailers to replace or retrofit their vehicles with aerodynamic technologies and low rolling resistance tires. The regulation also contained certain emissions and registration standards for temperature controlled trailer operators. In December 2013, California’s ARB approved regulations to align its GHG emission standards and test procedures, as well as its tractor-trailer GHG regulation, with the federal Phase 1 GHG regulation, which applied fuel efficiency standards to vehicles for model years 2014-2018. In June 2015, the Environmental Protection Agency (EPA) and NHTSA, working in concert with California’s ARB, formally announced a proposed national program establishing Phase 2 of the GHG emissions and fuel efficiency standards for medium- and heavy-duty vehicles for model year 2018 and beyond.
In October 2016, the EPA and NHTSA formally published the Final Rule for Phase 2 of the GHG emissions and fuel efficiency standards for medium and heavy-duty engines and vehicles. The Final Rule, which will be effective as of December 27, 2016, is expected by the EPA to lower CO2 emissions by 1.1 billion metric tons and reduce oil consumption by up to 2 billion barrels over the lifetime of the vehicles sold under the Phase 2 program. As expected, first-time GHG and fuel efficiency standards for trailers will start in model year 2018 for EPA and model year 2021 for NHSTA, and CO2 and fuel consumption standards for combination tractors and engines (which are subject to individual and separate regulatory requirements) commence in model year 2021, increase incrementally in model year 2024 and achieve a fully phased-in requirement by model year 2027. EPA and NHSTA expect that motor carriers will meet the increased standards through the use of technology improvements in multiple areas, including the engine, transmission, driveline, aerodynamic design, extended idle reduction technologies and the use of other accessories. These regulations could adversely affect us by increasing the cost of new trucks, impairing productivity and increasing our operating expenses.
In addition to the United States, we also have the authority to operate in Mexico, various Canadian provinces and China. We, as well as our drivers and owner-operators, must comply with enacted governmental regulations regarding safety, equipment, environmental protection and operating methods. Examples include regulation of equipment weight, equipment dimensions, fuel emissions, driver Hours of Service (HOS), driver eligibility requirements, on-board reporting of operations and ergonomics. We may also become subject to new or more restrictive regulations related to safety or operating methods, which could adversely affect our fleet and operations in those jurisdictions.
29
Table of Contents
If current or future legislation or judicial decisions deem that independent contractors (owner-operators) or contingent workers are equivalent to employees, we would incur more employee-related expenses.
We face a complex and increasingly stringent regulatory and statutory scheme relating to wages, classification of employees and alternate work arrangements. Tax, federal and other regulatory authorities and private plaintiffs have argued that owner-operator drivers in the trucking and transportation industries are employees, rather than independent contractors. In April 2010, federal legislation was proposed that increased the recordkeeping requirements for companies that engage independent contractors and heightened the penalties to employers that misclassify individuals or violate overtime and/or wage requirements. There have been and may continue to be lawsuits concerning the appropriate worker classification of individuals that provide delivery services and the outcomes of such cases may be adverse to us. Further, class actions and other lawsuits have been filed against us and others in our industry seeking to reclassify owner-operator drivers as employees for a variety of purposes, including workers’ compensation and health care coverage. If any such cases are judicially determined in a manner adverse to us or our businesses, there could be an adverse impact on our operations in the effected jurisdictions. Taxing and other regulatory authorities and courts apply a variety of standards in their determination of independent contractor status. If the owner-operator drivers we contract with are deemed employees, we would incur additional exposure under laws for federal and state tax, workers’ compensation, unemployment benefits, labor, employment and tort. The exposure could include prior period compensation, as well as potential liability for employee benefits and tax withholdings.
Our operations in Mexico, Canada and China, including our cross-border operations with Canada and Mexico, make us vulnerable to risks associated with doing business in foreign countries.
As a result of our operations in Mexico, Canada and China, including our cross-border intermodal operations with Canada and Mexico, we are subject to certain risks inherent in doing business abroad, including:
| • | exposure to local economic and political conditions (for example, total freight value to and from both Mexico and Canada fell 10.7% from October 2014 to October 2015 in part as a result of lower crude oil prices); |
| • | foreign exchange rate fluctuations and currency controls (for example, the recent weakening of the Canadian dollar relative to the U.S. dollar, as well as fluctuations in the Mexican peso and the Chinese yuan relative to the U.S. dollar); |
| • | withholding and other taxes on remittances and other payments by subsidiaries; |
| • | difficulties in enforcing contractual obligations and intellectual property rights; |
| • | investment restrictions or requirements; and |
| • | export and import restrictions. |
In addition, if we are unable to maintain our C-TPAT, Free and Secure Trade (FAST) and Partners in Protection (PIP) status, we may have significant border delays. This could cause our Mexican and Canadian operations to be less efficient than those of competitor truckload carriers that have such status and operate in Mexico or Canada. We also face additional risks associated with our foreign operations, including restrictive trade policies and imposition of duties, taxes or government royalties imposed by the Mexican or Canadian government, to the extent not preempted by the terms of the North American Free Trade Agreement. In addition, changes to the North American Free Trade Agreement or other treaties governing our business could adversely impact our international business. Failure to comply with trade compliance laws and regulations applicable to our international operations may subject us to liability.
30
Table of Contents
Our operations are subject to various environmental laws and regulations, the violation of which could result in substantial fines or penalties.
We are subject to various environmental laws and regulations dealing with the hauling and handling of hazardous materials, waste and other oil, fuel storage tanks, air emissions from our vehicles and facilities, engine idling and discharge and retention of storm water. Our truck terminals often are located in industrial areas where groundwater or other forms of environmental contamination could occur. Our operations involve the risks of fuel spillage or seepage, environmental damage and hazardous waste disposal, among others. Certain of our facilities have waste oil or fuel storage tanks and fueling islands. If we are involved in a spill or other accident involving hazardous substances, if there are releases of hazardous substances we transport, if soil or groundwater contamination is found at our facilities or results from our operations, or if we are found to be in violation of applicable environmental laws or regulations, we could owe cleanup costs and incur related liabilities, including substantial fines or penalties or civil and criminal liability, any of which could have a materially adverse effect on our business and operating results.
EPA regulations limiting exhaust emissions became more restrictive in 2010. In 2010, an executive memorandum was signed directing the NHTSA and the EPA to develop new, stricter fuel efficiency standards for heavy trucks. In 2011, the NHTSA and the EPA adopted final rules that established the first-ever fuel economy and greenhouse gas standards for medium-and heavy-duty vehicles. These standards apply to model years 2014 to 2018, which are required to achieve an approximate 20 percent reduction in fuel consumption by model year 2018, and equates to approximately four gallons of fuel for every 100 miles traveled. In June 2015, the EPA and NHTSA jointly proposed new stricter standards that would apply to trailers beginning with model year 2018 and tractors beginning with model year 2021.
In October 2016, the EPA and NHTSA formally published the Final Rule for Phase 2 of the GHG emissions and fuel efficiency standards for medium and heavy-duty engines and vehicles. See “—We operate in a highly regulated industry and increased costs of compliance with, or liability for violation of, existing or future regulations could have a materially adverse effect on our business.”
We have significant ongoing capital requirements that could affect our profitability if we are unable to generate sufficient cash from operations or obtain financing on favorable terms.
The truckload industry generally, and our trucking and intermodal segments in particular, are capital intensive and asset heavy, and our policy of maintaining a young, technology-equipped fleet requires us to expend significant amounts in capital expenditures annually. We expect to pay for projected capital expenditures with cash flows from operations, proceeds from equity sales or financing available under our existing debt instruments. Our total capital expenditures in fiscal year 2015 were $483 million. If we were unable to generate sufficient cash from operations, we would need to seek alternative sources of capital, including financing, to meet our capital requirements. In the event that we are unable to generate sufficient cash from operations or obtain financing on favorable terms in the future, we may have to limit our fleet size, enter into less favorable financing arrangements or operate our revenue equipment for longer periods, any of which could have a materially adverse effect on our profitability.
The seasonal pattern generally experienced in the trucking industry may affect our periodic results during traditionally slower shipping periods and winter months.
In the trucking industry, revenue generally follows a seasonal pattern which may affect our operating results. We typically experience a seasonal surge in sales during the fourth quarter of our fiscal year as a result of holiday sales. After the December holiday season and during the remaining winter months, our freight volumes are typically lower because some customers reduce shipment levels. Our operating expenses have historically been higher in the winter months because of cold temperatures and other adverse winter weather conditions which result in decreased fuel efficiency, increased cold weather-related maintenance costs of revenue equipment
31
Table of Contents
and increased insurance and claims costs. Revenue can also be affected by adverse weather conditions, holidays and the number of business days during a given period because revenue is directly related to the available working days of shippers. From time to time, we may also suffer short-term impacts from severe weather and similar events, such as tornadoes, hurricanes, blizzards, ice storms, floods, fires, earthquakes, and explosions that could harm our results of operations or make our results of operations more volatile.
We are increasingly dependent on data networks and systems, including tracking and communications systems, and significant systems disruptions, including those caused by cybersecurity breaches, could adversely affect our business.
Our policy of increasingly using technology to improve productivity and reduce costs through our Quest platform means that our business is reliant on the efficient, stable and uninterrupted operation of our data networks and systems, including tracking and communications systems. Our computer systems and telematics technology are used in various aspects of our business, including load planning and receiving, dispatch of drivers and third-party capacity providers, freight and container tracking, customer billing and account monitoring, automation of tasks, producing financial and other reports and other general functions and purposes. We are currently dependent on a single vendor for asset management, driver communication and critical load planning data. If the stability or capability of such vendor is compromised, it could adversely affect our revenue, customer service, driver turnover rates and data preservation. Additionally, if any of our critical information or communications systems fail or become unavailable, we could have to perform certain functions manually, which could temporarily affect the efficiency and effectiveness of our operations.
Our operations and those of our technology and communications service providers are vulnerable to interruption by fire, earthquake, power loss, telecommunications failure, terrorist attacks, internet failures, computer viruses, malware, hacking and other events beyond our control. More sophisticated and frequent cyber-attacks within the United States in recent years have also increased security risks associated with information technology systems. Although we maintain information security processes and policies to protect our information, computer systems and data from cybersecurity threats, breaches and other such events, we have experienced cyber-attacks in the past that we were able to mitigate without any material adverse effect on our business and results of operations. In an attempt to reduce the risk of disruption to our business operations should a disaster occur, we have redundant computer systems and networks and the capability to deploy these backup systems from an off-site alternate location. We believe that any such disruption would be minimal, moderate or temporary. However, we cannot predict the likelihood or extent to which such alternate location or our information and communication systems would be affected. Our business and operations could be adversely affected in the event of a system failure, disruption or security breach that causes a delay, interruption or impairment of our services and operations.
Historically we have not made a significant number of acquisitions and we may not make acquisitions in the future, or if we do, we may not be successful in integrating the acquired company, either of which could have a materially adverse effect on our business.
Historically, acquisitions have not been a significant part of our growth strategy. From 2008 to 2015 we did not complete any significant acquisitions. We may not be successful in identifying, negotiating or consummating any future acquisitions. In 2016, we acquired Watkins & Shepard and Lodeso, and we may not successfully integrate these businesses or achieve the synergies and operating results anticipated in connection with these acquisitions. The continuing trend toward consolidation in the trucking industry may result in the acquisitions of smaller carriers by large carriers that gain market share and other competitive advantages through such acquisitions. If we fail to make or successfully execute future acquisitions, our growth rate could be materially and adversely affected.
32
Table of Contents
In addition, any acquisitions we undertake could involve numerous risks that could have a materially adverse effect on our business and operating results, including:
| • | difficulties in integrating the acquired company’s operations and in realizing anticipated economic, operational and other benefits in a timely manner that could result in substantial costs and delays or other operational, technical or financial problems; |
| • | challenges in achieving anticipated revenue, earnings or cash flows; |
| • | assumption of liabilities that may exceed our estimates or what was disclosed to us; |
| • | the diversion of our management’s attention from other business concerns; |
| • | the potential loss of customers, key associates and drivers of the acquired company; |
| • | difficulties operating in markets in which we have had no or only limited direct experience; |
| • | the incurrence of additional indebtedness; and |
| • | the issuance of additional shares of our common stock, which would dilute your ownership in the company. |
We are subject to various claims and lawsuits in the ordinary course of business, and increases in the amount or severity of these claims and lawsuits could adversely affect us.
We are exposed to various claims and litigation related to commercial disputes, personal injury, property damage, environmental liability and other matters. Proceedings include claims by third parties, and certain proceedings have been certified or purport to be class actions. Developments in regulatory, legislative or judicial standards, material changes to litigation trends, or a catastrophic accident or series of accidents, including railroad derailments that afflict our intermodal railroad operating partners, involving any or all of property damage, personal injury, and environmental liability could have a material adverse effect on our operating results, financial condition and liquidity.
We may need to obtain additional financing which may not be available or, if it is available, may result in a reduction in the percentage ownership of our then-existing shareholders.
We may need to raise additional funds in order to:
| • | finance unanticipated working capital requirements or refinance existing indebtedness; |
| • | develop or enhance our technological infrastructure and our existing products and services; |
| • | fund strategic relationships; |
| • | respond to competitive pressures; and |
| • | acquire complementary businesses, technologies, products or services. |
Additional financing may not be available on terms favorable to us, or at all. If adequate funds are not available or are not available on acceptable terms, our ability to fund our expansion strategy, take advantage of unanticipated opportunities, develop or enhance technology or services or otherwise respond to competitive pressures could be significantly limited. If we raise additional funds by issuing equity or convertible debt securities, the percentage ownership of our then-existing shareholders may be reduced, and holders of these securities may have rights, preferences or privileges senior to those of our then-existing shareholders.
Our existing and future indebtedness could limit our flexibility in operating our business or adversely affect our business and our liquidity position.
As of September 30, 2016, we had $615 million in aggregate principal amount of indebtedness for borrowed money outstanding, consisting of $500 million outstanding under our senior notes and $115 million of borrowings outstanding under our accounts receivable securitization facility.
33
Table of Contents
Our indebtedness may increase from time to time in the future for various reasons, including fluctuations in operating results, capital expenditures and potential acquisitions.
Any indebtedness we incur and restrictive covenants contained in the agreements related thereto could:
| • | make it difficult for us to satisfy our obligations, including making interest payments on our debt obligations; |
| • | limit our ability to obtain additional financing to operate our business; |
| • | require us to dedicate a substantial portion of our cash flow to payments on our debt, reducing our ability to use our cash flow to fund capital expenditures and working capital and other general operational requirements; |
| • | limit our flexibility to plan for and react to changes in our business; |
| • | place us at a competitive disadvantage relative to some of our competitors that have less, or less restrictive, debt than us; |
| • | limit our ability to pursue acquisitions; and |
| • | increase our vulnerability to general adverse economic and industry conditions, including changes in interest rates or a downturn in our business or the economy. |
The occurrence of any one of these events could have a material adverse effect on our business, financial condition and operating results or cause a significant decrease in our liquidity and impair our ability to pay amounts due on our indebtedness. Significant repayment penalties may limit our flexibility.
In addition, our credit facility contains, among other things, restrictive covenants that limit our and our subsidiaries’ ability to finance future operations or capital needs or to engage in other business activities. The credit facility restricts, among other things, our ability and the ability of our subsidiaries to incur additional indebtedness or issue guarantees, create liens on our assets make distributions on or redeem equity interests, make investments, transfer or sell properties or other assets and engage in mergers, consolidations or acquisitions. In addition, our credit facility requires us to meet specified financial ratios and tests.
We may be exposed to interest rate risk with regard to any indebtedness outstanding under our revolving credit facility.
The interest rate under the credit agreement governing our revolving credit facility is based on the Prime Rate, the Federal Funds Rate or LIBOR, depending upon the specific type of borrowing, plus an applicable margin. To the extent we incur borrowings under our revolving credit facility, increases in any of these rates may increase our interest expense relating to these borrowings. As a result, we are exposed to interest rate risk. If interest rates were to increase, our debt service obligations could increase even though the amount borrowed remained the same, and our net income and cash flows, including cash available for servicing our indebtedness, would correspondingly decrease. We are not a party to an interest rate swap contract or other derivative instrument designed to hedge our exposure to interest rate fluctuation risk.
The requirements of being a public company may strain our resources and distract our management, which could make it difficult to manage our business.
Following the completion of this offering, we will be required to comply with various regulatory and reporting requirements, including those required by the Securities and Exchange Commission (SEC). Complying with these reporting and other regulatory requirements will be time-consuming and will result in increased costs to us and could have a negative effect on our business, financial condition and operating results.
34
Table of Contents
As a public company, we will be subject to the reporting requirements of the Securities Exchange Act of 1934, which we refer to herein as the Exchange Act, and the requirements of the Sarbanes-Oxley Act. These requirements may place a strain on our systems and resources. The Exchange Act requires that we file annual, quarterly and current reports with respect to our business and financial condition. The Sarbanes-Oxley Act requires that we maintain effective disclosure controls and procedures and internal controls over financial reporting. To maintain and improve the effectiveness of our disclosure controls and procedures, we may need to commit significant resources, hire additional staff and provide additional management oversight. We will be implementing additional procedures and processes for the purpose of addressing the standards and requirements applicable to public companies. Sustaining our growth also will require us to commit additional management, operational and financial resources to identify new professionals to join the company and to maintain appropriate operational and financial systems to adequately support expansion. These activities may divert management’s attention from other business concerns, which could have a material adverse effect on our business, financial condition and operating results.
We cannot predict or estimate the amount of additional costs we may incur as a result of becoming a public company or the timing of such costs.
Risks Relating to This Offering and Ownership of Our Class B Common Stock
The dual class structure of our common stock has the effect of concentrating voting control with the Schneider family and the trustees under the Schneider National, Inc. Voting Trust, and limiting your ability to influence corporate matters. Their interests may conflict with yours in the future.
Immediately following this offering, we will have two classes of authorized and outstanding common stock:
| • | Class A common stock, which is entitled to ten votes per share; and |
| • | Class B common stock, which is entitled to one vote per share. |
All holders of Class A common stock and all holders of Class B common stock vote together as a single group on all matters submitted to a vote or consent of our shareholders. See “Description of Capital Stock”. Upon the consummation of this offering, assuming that the underwriters do not exercise the over-allotment option, the Schneider family, including trusts established for the benefit of members of the Schneider family, will collectively beneficially own 100% of our outstanding Class A common stock and % of our outstanding Class B common stock, representing approximately % of the total voting power of all of our outstanding common stock and approximately % of our total outstanding common stock. The Voting Trust holds the shares of Class A common stock and the trustees of the Voting Trust have agreed, pursuant to the terms of the Amended and Restated 1995 Schneider National, Inc. Voting Trust Agreement and Voting Agreement (the “Voting Trust Agreement”), to, among other things, vote the shares of Class A common stock in favor of our Chief Executive Officer and designated members of the Schneider family in any election of members of our Board of Directors in accordance with the nomination process agreement described below. This Voting Trust Agreement provides that the members of our Corporate Governance Committee (other than Schneider family members) will serve as trustees of the Voting Trust. Schneider family members have entered into a nomination process agreement with us pursuant to which our Corporate Governance Committee will recommend, and our Board of Directors will include in the slate of director nominees recommended to our shareholders, two specified Schneider family members to be nominated to serve on our Board of Directors on an annual, rotating basis. See “Description of Capital Stock—Voting Trust Agreement” and “Description of Capital Stock—Schneider Family Board Nomination Process Agreement.”
Our Articles of Incorporation provide that each share of Class A common stock withdrawn from, or otherwise transferred out of, the Voting Trust will automatically be converted into a share of Class B common stock.
35
Table of Contents
As a result of these arrangements, the Voting Trust’s voting control of us allows it to control the outcome of corporate actions that require or may be accomplished by shareholder approval, including the election and removal of directors and transactions resulting in a change in control of the company. For so long as the Voting Trust maintains control of us, our shareholders other than those members of the Schneider family will be unable to affect the outcome of proposed corporate actions supported by the Schneider family, including a change in control of the company.
The interests of the Schneider family may not be the same as ours or those of our other shareholders. For example, the Schneider family may have an interest in pursuing transactions that could enhance its investment even though such transactions might involve risks to the company and to you. The Schneider family may also have an interest in delaying, deterring or preventing a change in control or business combination that might otherwise be beneficial to the company and to you.
We will be a “controlled company” within the meaning of the rules of the NYSE and, as a result, qualify for, and intend to rely on, exemptions from certain corporate governance requirements relating to our corporate governance committee. You will not have the same protections afforded to shareholders of other companies that are subject to such requirements.
Upon the completion of this offering, the Voting Trust will have more than 50% of the voting power for the election of directors. As a result, we will qualify as a “controlled company” under the corporate governance rules for NYSE-listed companies. As a controlled company, certain exemptions under the NYSE listing standards will exempt us from the obligation to comply with certain NYSE corporate governance requirements, including the requirement that we have a nominating and governance committee that is composed entirely of independent directors.
We have elected to take advantage of this “controlled company” exemption, and the holders of our Class B common stock therefore may not have the same protections afforded to shareholders of companies that are subject to all of the corporate governance rules for NYSE-listed companies. Our status as a controlled company could therefore make our Class B common stock less attractive to some investors or otherwise harm our stock price.
In addition, in 2012, the SEC passed final rules implementing provisions of the Dodd-Frank Wall Street Reform and Consumer Protection Act of 2010 pertaining to compensation committee independence. The SEC’s rules direct each of the national securities exchanges (including the NYSE, on which we intend to list our Class B common stock) to develop listing standards requiring, among other things, that compensation committees be composed of fully independent directors, as determined pursuant to new independence requirements.
As a “controlled company,” we will not be subject to this compensation committee independence requirement under Dodd-Frank.
We will incur increased costs and become subject to additional regulations and requirements as a result of becoming a public company, and our management will be required to devote substantial time to new compliance matters, which could lower our profits or make it more difficult to run our business.
As a public company, we will incur significant legal, accounting and other expenses that we have not incurred as a private company, including costs associated with public company reporting requirements. We also have incurred and will incur costs associated with the Sarbanes-Oxley Act and related rules implemented by the SEC and the NYSE. The expenses incurred by public companies generally for reporting and corporate governance purposes have been increasing. We expect these rules and regulations to increase our legal and financial compliance costs and to make some activities more time-consuming and costly although we are currently unable to estimate these costs with any degree of certainty. Our management will need to devote a
36
Table of Contents
substantial amount of time to ensure that we comply with all of these requirements. These laws and regulations also could make it more difficult or costly for us to obtain certain types of insurance, including director and officer liability insurance, and we may be forced to accept reduced policy limits and coverage or incur substantially higher costs to obtain the same or similar coverage. These laws and regulations could also make it more difficult for us to attract and retain qualified persons to serve on our Board of Directors, our board committees or as our executive officers. Furthermore, if we are unable to satisfy our obligations as a public company, we could be subject to delisting of our Class B common stock, fines, sanctions and other regulatory action and potentially civil litigation.
Our internal controls over financial reporting may not be effective and our independent registered public accounting firm may not be able to certify as to their effectiveness, which could have a significant and adverse effect on our business, reputation and stock price.
We are not currently required to comply with SEC rules that implement Section 404 of the Sarbanes-Oxley Act, or Section 404, and are therefore not required to make a formal assessment of the effectiveness of our internal controls over financial reporting for that purpose. The process of designing and implementing effective internal controls is a continuous effort that requires us to anticipate and react to changes in our business and the economic and regulatory environments and to expend significant resources to maintain a system of internal controls that is adequate to satisfy our reporting obligations as a public company. If we are unable to establish or maintain appropriate internal financial reporting controls and procedures, it could cause us to fail to meet our reporting obligations on a timely basis, result in material misstatements in our consolidated financial statements and harm our operating results. As a public company, we will be required, pursuant to Section 404, to furnish a report by management on, among other things, the effectiveness of our internal control over financial reporting for the first fiscal year beginning after the effective date of this offering.
When evaluating our internal controls over financial reporting, we may identify material weaknesses that we may not be able to remediate in time to meet the applicable deadline imposed upon us for compliance with the requirements of Section 404. In addition, if we fail to achieve and maintain the adequacy of our internal controls, as such standards are modified, supplemented or amended from time to time, we may not be able to ensure that we can conclude, on an ongoing basis, that we have effective internal controls over financial reporting in accordance with Section 404. We cannot be certain as to the timing of completion of our evaluation, testing and any remediation actions or the impact of the same on our operations. If we are not able to implement the requirements of Section 404 in a timely manner or with adequate compliance, we may be subject to sanctions or investigation by regulatory authorities, such as the SEC. If either we are unable to conclude that we have effective internal control over financial reporting or our independent registered public accounting firm is unable to provide us with an unqualified report, investors could lose confidence in our reported financial information, which could have a material adverse effect on the trading price of our Class B common stock.
There may not be an active, liquid trading market for our shares of Class B common stock, which may cause shares of our Class B common stock to trade at a discount from the initial offering price and make it difficult to sell the shares of Class B common stock you purchase.
Prior to this offering, there has been no public market for shares of our Class B common stock. We cannot predict the extent to which investor interest in the company will lead to the development of a trading market on the NYSE or how liquid that market may become. If an active trading market does not develop, you may have difficulty selling any shares of our Class B common stock that you purchase. The initial public offering price of shares of our Class B common stock is, or will be, determined by negotiation between us and the underwriters and may not be indicative of prices that will prevail following the completion of this offering. The market price of shares of our Class B common stock may decline below the initial public offering price, and you may not be able to resell your shares of our Class B common stock at or above the initial public offering price, or at all.
We are not selling shares of our Class A common stock in this offering, and accordingly there will be no public market for shares of our Class A common stock.
37
Table of Contents
We expect that our Class B common stock price will fluctuate significantly, and you may not be able to resell your shares at or above the initial public offering price.
The trading price of our Class B common stock is likely to be volatile and subject to wide price fluctuations in response to various factors, including:
| • | market conditions in the broader stock market in general, or in our industry in particular; |
| • | actual or anticipated fluctuations in our guidance, quarterly financial reports and operating results; |
| • | our ability to satisfy our ongoing capital needs and unanticipated cash requirements; |
| • | adverse market reaction to any additional indebtedness incurred or securities we may issue in the future; |
| • | introduction of new products and services by us or our competitors; |
| • | announcements by our competitors of acquisitions, dispositions, strategic partnerships, joint ventures or capital commitments; |
| • | issuance of new or changed securities analysts’ reports or recommendations; |
| • | sales of large blocks of our stock; |
| • | additions or departures of key personnel; |
| • | changes or proposed changes in laws or regulations or differing interpretations or enforcement thereof affecting our business; |
| • | adverse publicity about our industry or individual scandals; |
| • | litigation and governmental investigations; and |
| • | economic and political conditions or events. |
These and other factors may cause the market price and demand for our Class B common stock to fluctuate substantially, which may limit or prevent investors from readily selling their shares of Class B common stock and may otherwise negatively affect the liquidity of our Class B common stock. In the past few years, stock markets have experienced extreme price and volume fluctuations. In the past, following periods of volatility in the overall market and the market price of a company’s securities, securities class action litigation has often been instituted against these companies. If any of our shareholders brought a lawsuit against us, we could incur substantial costs defending the lawsuit. Such a lawsuit could also divert the time and attention of our management from our business.
Future sales, or the perception of future sales, by us or our existing shareholders in the public market following this offering could cause the market price of our Class B common stock to decline.
If our existing shareholders sell substantial amounts of our Class B common stock in the public market following this offering, or transfer substantial amounts of our Class A common stock in a manner that would cause such Class A common stock to automatically convert into newly issued shares of Class B common stock, the market price of our Class B common stock could decrease significantly. The perception in the public market that our existing shareholders might sell shares of Class B common stock or transfer shares of Class A common stock could also depress our market price. Upon completion of this offering, we will have shares of Class A common stock outstanding and shares of Class B common stock outstanding, assuming no exercise of the underwriters’ over-allotment option. Of the outstanding shares, all of the shares sold in this offering, plus any additional shares sold upon exercise of the underwriters’ over-allotment option, will be freely tradable, except that any shares purchased by “affiliates” (as that term is defined in Rule 144 under the Securities Act) may be sold only in compliance with the limitations described under “Shares Eligible for Future Sale.”
38
Table of Contents
Taking into consideration the effect of the lock-up agreements described below and the provisions of Rule 144 and Rule 701 under the Securities Act, the remaining shares of our common stock will be available for sale in the public market as follows:
| • | shares will be eligible for sale on the date of this prospectus; and |
| • | shares will be eligible for sale upon the expiration of the lock-up agreements described below. |
We, our directors and executive officers, and certain holders of our outstanding common stock will enter into lock-up agreements in connection with this offering. The lock-up agreements expire 180 days after the date of this prospectus, subject to extension upon the occurrence of specified events. Morgan Stanley & Co. LLC, UBS Securities LLC and Merrill Lynch, Pierce, Fenner & Smith Incorporated may, in their sole discretion and at any time without notice, release all or any portion of the securities subject to lock-up agreements.
In addition, upon the closing of this offering, we will have an aggregate of up to shares of Class B common stock reserved for future issuances under our 2017 Equity Incentive Plan. We intend to file one or more registration statements on Form S-8 under the Securities Act to register all of the common stock subject to outstanding equity awards, as well as stock options and shares reserved for future issuance, under our 2017 Equity Incentive Plan. Any such Form S-8 registration statements will automatically become effective upon filing. Accordingly, shares registered under such registration statements will be available for sale in the open market, subject in the case of shares held by our affiliates to volume limits under Rule 144 and any applicable lock-up period.
After requisite holding periods have elapsed and, in the case of restricted stock, the shares have vested, additional shares will be eligible for sale in the public market. The market price of shares of our Class B common stock may drop significantly when the restrictions on resale by our existing shareholders lapse. A decline in the price of shares of our Class B common stock might impede our ability to raise capital through the issuance of additional shares of our Class B common stock or other equity or equity-linked securities.
Some provisions of Wisconsin law and our Amended and Restated Articles of Incorporation and Amended and Restated Bylaws that will be in effect at the closing of this offering could make a merger, tender offer or proxy contest difficult, thereby depressing the trading price of our Class B common stock.
Upon the closing of this offering, our status as a Wisconsin corporation and the anti-takeover provisions of the Wisconsin Business Corporation Law (WBCL) may discourage, delay or prevent a change in control even if a change in control would be beneficial to our shareholders by prohibiting us from engaging in a business combination with an interested shareholder for a period of three years after the person becomes an interested shareholder. We may engage in a business combination with an interested shareholder after the expiration of the three-year period with respect to that shareholder only if one or more of the following conditions is satisfied: (1) our Board of Directors approved the acquisition of the stock before the date on which the shareholder acquired the shares, (2) the business combination is approved by a majority of our outstanding voting stock not beneficially owned by the interested shareholder or (3) the consideration to be received by shareholders meets certain fair price requirements of the WBCL with respect to form and amount.
In addition, our Amended and Restated Articles of Incorporation and Amended and Restated Bylaws that will be in effect upon the closing of this offering will contain provisions that may make the acquisition of the company more difficult, including the following:
| • | a dual class common stock structure, which provides the Schneider National, Inc. Voting Trust with the ability to control the outcome of matters requiring shareholder approval, even if the Schneider National, Inc. Voting Trust beneficially owns significantly less than a majority of the shares of our outstanding Class A and Class B common stock; |
| • | require that certain transactions be conditioned upon approval by 60 percent of the voting power of our capital stock, including any transaction which results in the Schneider family holding less than 40 percent of the voting power of our capital stock, a sale of substantially all of our assets and a dissolution; |
39
Table of Contents
| • | do not provide for cumulative voting in the election of directors, which would otherwise allow holders of less than a majority of stock to elect some directors; |
| • | provide that special meetings of shareholders may be called only by the Board of Directors and the chief executive officer, and by our shareholders only if holders of at least ten percent of all votes entitled to be cast on the proposed issue submit a written demand in accordance with the WBCL and the other provisions of our Amended and Restated Articles of Incorporation and our Amended and Restated Bylaws; |
| • | establish advance notice procedures for the nomination of candidates for election as directors or for proposing matters that can be acted upon at shareholder meetings; and |
| • | authorize undesignated preferred stock, the terms of which may be established and shares of which may be issued by our Board of Directors without shareholder approval. |
These provisions could have the effect of discouraging, delaying or preventing a transaction involving a change in control of the company. These provisions could also have the effect of discouraging proxy contests and make it more difficult for you and other shareholders to elect directors of your choosing and cause us to take other corporate actions that you desire.
Investors in this offering will experience immediate and substantial dilution.
The initial public offering price of our Class B common stock will be substantially higher than the pro forma net tangible book value per share of the outstanding Class B common stock immediately after this offering. Based on an assumed initial public offering price of $ per share (the mid-point of the price range set forth on the cover page of this prospectus) and our net tangible book value as of , if you purchase our Class B common stock in this offering you will pay more for your shares than the amounts paid by our existing shareholders for their shares and you will suffer immediate dilution of approximately $ per share in pro forma net tangible book value. See “Dilution.” As a result of such dilution, investors purchasing Class B common stock in this offering may receive significantly less than the full purchase price that they paid for the shares purchased in this offering in the event of a liquidation.
You may be diluted by the future issuance of additional common stock in connection with our incentive plans, acquisitions or otherwise.
After this offering we will have approximately shares of Class B common stock authorized but unissued. Our amended and restated articles of incorporation will authorize us to issue these shares of Class B common stock and options relating to Class B common stock for the consideration and on the terms and conditions established by our Board of Directors in its sole discretion, whether in connection with acquisitions or otherwise. We have reserved shares for issuance under our 2017 Equity Incentive Plan. See “Compensation Discussion and Analysis—2017 Equity Incentive Plan.” Any Class B common stock that we issue, including under our 2017 Equity Incentive Plan or other equity incentive plans that we may adopt in the future, would dilute the percentage ownership held by the investors who purchase Class B common stock in this offering.
We will have broad discretion in using the net proceeds of this offering, and we may not effectively expend the proceeds.
We intend to use the net proceeds of this offering for general corporate purposes, including potential acquisitions, repayment of indebtedness and capital expenditures. We will have significant flexibility and broad discretion in applying the net proceeds of this offering and we may not apply the net proceeds of this offering effectively. Our management might not be able to yield a significant return, if any, on any investment of these net proceeds. You will not have the opportunity to influence our decisions on how to use our net proceeds from this offering. See “Use of Proceeds.”
40
Table of Contents
None of the proceeds from the sale of shares of our Class B common stock by the selling shareholders in this offering will be available to us to fund our operations or to pay dividends.
We will not receive any proceeds from the sale of shares of our Class B common stock by the selling shareholders in this offering. The selling shareholders will receive all proceeds from the sale of such Class B shares. Consequently, none of the proceeds from such sale by the selling shareholders will be available to us to fund our operations, capital expenditures, compensation plans or acquisition opportunities or to pay dividends. See “Use of Proceeds.”
We may change our dividend policy at any time.
Although following this offering we initially expect to pay dividends to holders of our Class A and Class B common stock, we have no obligation to pay any dividend, and our dividend policy may change at any time without notice. The declaration and amount of any future dividends is subject to the discretion of our Board of Directors in determining whether dividends are in the best interest of our shareholders and are in compliance with all laws and agreements applicable to the declaration and payment of cash dividends by us. Future dividends may also be affected by factors that our Board of Directors deems relevant, including our potential future capital requirements for investments, legal risks, changes in federal and state income tax laws or corporate laws and contractual restrictions such as financial or operating covenants in our debt arrangements. As a result, we may not pay dividends at any rate or at all.
Our business and stock price may suffer as a result of our lack of public company operating experience.
We have been a privately-held company since we began operations in 1935. Our lack of public company operating experience may make it difficult to forecast and evaluate our future prospects. If we are unable to execute our business strategy, either as a result of our inability to effectively manage our business in a public company environment or for any other reason, our prospects, financial condition and operating results may be harmed.
If securities analysts do not publish research or reports about our business or if they downgrade our stock or our sector, our stock price and trading volume could decline.
The trading market for our Class B common stock will rely in part on the research and reports that industry or financial analysts publish about us or our business. We do not control these analysts. Furthermore, if one or more of the analysts who do cover us downgrade our stock or our industry, or the stock of any of our competitors, or publish inaccurate or unfavorable research about our business, the price of our stock could decline. If one or more of these analysts ceases coverage of us or fail to publish reports on us regularly, we could lose visibility in the market, which in turn could cause our Class B common stock price or trading volume to decline.
41
Table of Contents
SPECIAL NOTE REGARDING FORWARD-LOOKING STATEMENTS
This prospectus includes forward-looking statements that reflect our current views with respect to, among other things, our operations and financial performance. Forward-looking statements include all statements that are not historical facts. These forward-looking statements are included throughout this prospectus, including in the sections entitled “Prospectus Summary,” “Risk Factors,” “Management’s Discussion and Analysis of Financial Condition and Results of Operating” and “Business” and relate to matters such as our industry, business strategy, goals and expectations concerning our market position, future operations, margins, profitability, capital expenditures, liquidity and capital resources and other financial and operating information. You can identify forward-looking statements by the fact that they do not relate strictly to historical or current facts. These statements may include words such as “may,” “might,” “will,” “should,” “expects,” “plans,” “anticipates,” “believes,” “estimates,” “predicts,” “potential” or “continue,” the negative of these terms and other comparable terminology.
These forward-looking statements, which are subject to risks, uncertainties and assumptions about us, may include projections of our future financial performance, our anticipated growth strategies and anticipated trends in our business. These statements are only predictions based on our current expectations and projections about future events. There are important factors that could cause our actual results, level of activity, performance or achievements to differ materially from the results, level of activity, performance or achievements expressed or implied by the forward-looking statements, many of which are beyond our control. We believe that these factors include but are not limited to those described under “Risk Factors.” These factors should not be construed as exhaustive and should be read in conjunction with the other cautionary statements that are included in this prospectus. Should one or more of these risks or uncertainties materialize, or should any of our assumptions prove incorrect, our actual results may vary in material respects from those projected in these forward-looking statements.
Any forward-looking statement made by us in this prospectus speaks only as of the date of this prospectus. Factors or events that could cause our actual results to differ may emerge from time to time, and it is not possible for us to predict all of them. We may not actually achieve the plans, intentions or expectations disclosed in our forward-looking statements and you should not place undue reliance on our forward-looking statements. Our forward-looking statements do not reflect the potential impact of any future acquisitions, mergers, dispositions, joint ventures, investments or other strategic transactions we may make. We undertake no obligation to publicly update or review any forward-looking statement, whether as a result of new information, future developments or otherwise, except as may be required by any applicable securities laws.
We use market data and industry forecasts and projections throughout this prospectus, and in particular in the section entitled “Business.” We have obtained the market data from certain publicly available sources of information, including publicly available independent industry publications and other third-party sources. American Trucking Associations, Inc. (ATA), Association of American Railroads (AAR), Intermodal Association of North America (IANA) and Transportation Economics were the primary independent sources of market data. Unless otherwise indicated, statements in this prospectus concerning our industry and the markets in which we operate, including our general expectations and competitive position, business opportunity and market size, growth and share, are based on data from our internal research and management estimates and, where indicated, information from independent industry organizations and other third-party sources (including industry publications, surveys and forecasts). Forecasts are based on industry surveys and the preparer’s expertise in the industry and there is no assurance that any of the forecasted amounts will be achieved. We believe the data that third parties have compiled is reliable, but we have not independently verified the accuracy of this information. Any forecasts are based on data (including third-party data), models and experience of various professionals and are based on various assumptions, all of which are subject to change without notice. Forecasts, assumptions, expectations, beliefs, estimates and projections involve risks and uncertainties and are subject to change based on various factors, including those described under the headings “Special Note Regarding Forward-Looking Statements” and “Risk Factors.”
42
Table of Contents
TRADEMARKS, SERVICE MARKS AND TRADE NAMES
Solely for convenience, the trademarks, service marks, logos and trade names referred to in this prospectus are without the ® and ™ symbols, but such references are not intended to indicate, in any way, that we will not assert, to the fullest extent under applicable law, our rights to these trademarks, service marks and trade names. This prospectus contains additional trademarks, service marks and trade names of others, which, to our knowledge, are the property of their respective owners. We do not intend our use or display of other parties’ trademarks, trade names or service marks to imply, and such use or display should not be construed to imply, a relationship with, or endorsement or sponsorship of us by, these other parties.
43
Table of Contents
We estimate that the net proceeds to us from this offering will be approximately $ , or approximately $ if the underwriters exercise their over-allotment option in full, assuming an initial public offering price of $ per share (the mid-point of the price range set forth on the cover page of this prospectus), after deducting estimated underwriting discounts and commissions and estimated offering expenses payable by us.
We intend to use the net proceeds of this offering for general corporate purposes, including repayment of indebtedness, capital expenditures and potential acquisitions.
We will not receive any proceeds from the sale of shares by the selling shareholders, including if the underwriters exercise their over-allotment option. After deducting the underwriting discounts, the selling shareholders will receive approximately $ of proceeds from this offering.
Each $1.00 increase (decrease) in the assumed initial public offering price per share of $ per share, based on the mid-point of the price range set forth on the cover page of this prospectus, would increase (decrease) our net proceeds by $ million, assuming the number of shares offered by us, as set forth on the cover page of this prospectus, remains the same and after deducting estimated underwriting discounts and commissions and estimated offering expenses payable by us. An increase (decrease) of 1,000,000 shares from the expected number of shares to be sold by us in this offering, assuming no change in the assumed initial offering price per share, which is the mid-point of the price range set forth on the cover page of this prospectus, would increase (decrease) our net proceeds from this offering by $ million.
44
Table of Contents
The following table sets forth our cash and cash equivalents and capitalization as of September 30, 2016:
| • | on an actual basis; |
| • | on an as adjusted basis to give effect to the reclassification of redeemable Class A and B common stock from temporary equity to shareholders’ equity to give effect to the removal of certain repurchase rights currently applicable to all of our common stock, which will occur concurrently with the closing of this offering; and |
| • | on an as further adjusted basis to give effect to the reclassification described above and the issuance and sale of shares of Class B common stock by us in the offering at an assumed initial public offering price of $ per share, the mid-point of the price range set forth on the cover page of this prospectus, the application of the net proceeds of the offering, after deducting estimated underwriting discounts and commissions and estimated offering expenses payable by us, as set forth under “Use of Proceeds.” |
This table should be read in conjunction with “Prospectus Summary—Summary Historical Consolidated Financial and Other Data,” “Use of Proceeds,” “Selected Historical Consolidated Financial Data,” “Management’s Discussion and Analysis of Financial Condition and Results of Operations” and the consolidated financial statements and related notes thereto included elsewhere in this prospectus.
| As of September 30, 2016 | ||||||||||||
| Actual | As Adjusted(1) | As Further Adjusted(1)(2) |
||||||||||
| ($ in thousands) | ||||||||||||
| Cash and cash equivalents |
$ | 84,954 | $ | 84,954 | $ | |||||||
|
|
|
|
|
|
|
|||||||
| Long-term debt and obligations under capital leases |
$ | 560,146 | $ | 560,146 | $ | |||||||
| Temporary equity: |
||||||||||||
| Redeemable common stock, Class A |
563,217 | — | ||||||||||
| Redeemable common stock, Class B |
496,478 | — | ||||||||||
| Accumulated earnings |
108,733 | — | ||||||||||
| Accumulated other comprehensive income |
1,158 | — | ||||||||||
| Shareholders’ equity: |
||||||||||||
| Common stock, Class A |
— | — | — | |||||||||
| Common stock, Class B |
— | — | — | |||||||||
| Additional paid-in capital |
1,059,695 | |||||||||||
| Retained earnings |
108,733 | |||||||||||
| Accumulated other comprehensive income |
1,158 | |||||||||||
|
|
|
|
|
|
|
|||||||
| Total shareholders’ equity |
1,169,586 | |||||||||||
|
|
|
|
|
|
|
|||||||
| Total capitalization |
$ | 1,729,732 | $ | 1,729,732 | $ | |||||||
|
|
|
|
|
|
|
|||||||
| (1) | The as adjusted and as further adjusted columns present our capitalization giving effect to the reclassification of amounts attributed to redeemable Class A and B common stock to shareholders’ equity, including common stock and additional paid-in capital. Contemporaneously with the completion of this offering, we will amend the Schneider National, Inc. Employee Stock Purchase Plan and certain agreements governing ownership of our common stock held by existing shareholders, including members of the Schneider family and their family trusts, in order to remove provisions that currently grant each of our shareholders the right to require us to repurchase our common stock held by such shareholder under certain circumstances. When these repurchase rights terminate upon completion of this offering, all of our outstanding common stock will be treated as shareholders’ equity rather than temporary equity under GAAP and our common stock will no longer be treated as redeemable under GAAP. |
45
Table of Contents
| (2) | Each $1.00 increase (decrease) in the assumed initial public offering price of $ per share would increase (decrease) additional paid-in capital, total shareholders’ investment and total capitalization by $ , assuming the number of shares offered by us remains the same as set forth on the cover page of this prospectus and after deducting estimated underwriting discounts and commissions and estimated offering expenses payable by us. An increase (decrease) of 1,000,000 shares from the expected number of shares to be sold by us in this offering, assuming no change in the assumed initial public offering price of $ per share, which is the mid-point of the price range set forth on the cover page of this prospectus, would increase (decrease) additional paid-in capital, total shareholders’ investment and total capitalization by approximately $ million after deducting the estimated underwriting discount and commissions and estimated offering expenses payable by us. |
46
Table of Contents
As a public company we anticipate paying a quarterly dividend to holders of our Class A and Class B common stock.
The declaration and payment of all future dividends to holders of our common stock will be at the discretion of our Board of Directors and will depend on many factors, including our financial condition, earnings, legal requirements and any debt agreements we are then party to and other factors our Board of Directors deems relevant. Our Amended and Restated Articles of Incorporation provide that holders of our Class A common stock and holders of our Class B common stock will be treated equally and ratably on a per share basis with respect to any such dividends, unless disparate treatment is approved in advance by the vote of the holders of a majority of the outstanding shares of our Class A common stock and Class B common stock, each voting as a separate group.
Prior to this offering, we paid annual dividends of $4.01 per share of redeemable Class A common stock and Class B common stock in fiscal year 2014, $4.85 per share of redeemable Class A common stock and Class B common stock in fiscal year 2015 and $6.00 per share of redeemable Class A common stock and Class B common stock on December 15, 2016.
47
Table of Contents
If you invest in our Class B common stock in this offering, your ownership interest in us will be diluted immediately to the extent of the difference between the initial public offering price per share you will pay in this offering and the as adjusted net tangible book value per share of our Class B common stock immediately after this offering and the use of proceeds therefrom.
Our net tangible book value as of December 31, 2016, was approximately $ or $ per share of our Class A and Class B common stock. Net tangible book value per share represents the amount of our total tangible assets, less the amount of our total liabilities, divided by the aggregate number of shares of Class A and Class B common stock outstanding.
After giving pro forma effect (1) to the sale by us and by the selling shareholders of the shares of Class B common stock in this offering, at an assumed initial public offering price of $ per share, the mid-point of the price range set forth on the cover page of this prospectus, after deducting estimated underwriting discounts and commissions and estimated offering expenses payable by us and the receipt and application of the net proceeds, as set forth under “Use of Proceeds,” and (2) the termination of our shareholders’ current rights to require us to repurchase our common stock held by our shareholders under certain circumstances, our as adjusted net tangible book value as of December 31, 2016, would have been $ or $ per share of our Class B common stock. This amount represents an immediate increase in net tangible book value to existing shareholders of $ per share and an immediate dilution to new investors purchasing shares in this offering of $ per share. Dilution per share represents the difference between the price per share to be paid by new investors for the shares of Class B common stock sold in this offering and the net tangible book value per share immediately after this offering. The following table illustrates this per share dilution assuming the underwriters do not exercise their option to purchase additional shares:
| Assumed initial public offering price per share |
$ | |||||||
| Net tangible book value per share as of December 31, 2016 |
$ | |||||||
| Increase in net tangible book value per share attributable to the offering |
$ | |||||||
|
|
|
|||||||
| As adjusted net tangible book value per share after the offering |
$ | |||||||
|
|
|
|||||||
| Dilution per share to new investors |
$ | |||||||
|
|
|
Assuming the number of shares offered by us, as set forth on the cover page of this prospectus, remains the same, after deducting estimated underwriting discounts and commissions and offering expenses payable by us, a $1.00 increase (decrease) in the assumed initial public offering price of $ per share, the mid-point of the price range set forth on the cover page of this prospectus, would increase (decrease) the net tangible book value per share after giving effect to this offering by $ per share and would increase or decrease the dilution in net tangible book value per share to new investors in this offering by $ per share. An increase (decrease) of 1,000,000 shares from the expected number of shares to be sold by us in this offering, assuming no change in the assumed initial public offering price of $ per share, which is the mid-point of the price range set forth on the cover page of this prospectus, would increase (decrease) additional paid-in capital and total shareholders’ equity by approximately $ million after deducting the estimated underwriting discounts and commissions and estimated offering expenses payable by us, would increase (decrease) the net tangible book value attributable to new investors by $ per share and the dilution to new investors by $ per share and increase (decrease) the adjusted net tangible book value (deficit) per share after giving effect to this offering, by $ per share.
The following table sets forth, on an as adjusted basis as of December 31, 2016, the differences between the number of shares of Class B common stock purchased from us and the selling shareholders, the total consideration paid to us, or to be paid, and the average price per share paid, or to be paid, by existing shareholders and by the new investors. As the table shows, new investors purchasing shares in this offering will pay an average price per share substantially higher than our existing shareholders paid. The table below assumes
48
Table of Contents
an initial public offering price of $ per share, the mid-point of the price range set forth on the cover page of this prospectus, before deducting estimated underwriting discounts and commissions and estimated offering expenses payable by us:
| Shares Purchased | Total Consideration | Average Price Per Share |
||||||||||||||||||
| Number | Percent | Amount | Percent | |||||||||||||||||
| Existing shareholders |
% | $ | % | $ | ||||||||||||||||
| New investors(1) |
$ | |||||||||||||||||||
|
|
|
|
|
|
|
|
|
|
|
|||||||||||
| Total |
100 | % | $ | 100 | % | |||||||||||||||
|
|
|
|
|
|
|
|
|
|||||||||||||
| (1) | Does not reflect any shares that may be purchased by new investors from us pursuant to the underwriters’ option to purchase additional shares. |
A $1.00 increase or decrease in the assumed initial public offering price of $ per share, the mid-point of the price range set forth on the cover page of this prospectus, would increase or decrease total consideration paid to us by new investors and total consideration paid to us by all shareholders by approximately $ . An increase (decrease) of 1,000,000 in the number of shares offered by us would increase (decrease) total consideration paid by new investors, total consideration paid by all shareholders and average price per share paid by all shareholders by $ million, $ million and $ per share, respectively.
To the extent that we grant options to our employees in the future and those options are exercised or other issuances of Class B common stock are made, there will be further dilution to new investors.
49
Table of Contents
SELECTED HISTORICAL CONSOLIDATED FINANCIAL AND OTHER DATA
The following tables present our selected historical consolidated financial and other data as of and for the periods indicated. We have derived the selected consolidated statement of operations data for the years ended December 31, 2015, December 31, 2014 and December 31, 2013 and the consolidated balance sheet data as of December 31, 2015 and December 31, 2014 from the audited consolidated financial statements included elsewhere in this prospectus. The selected consolidated statement of operations data for the years ended December 31, 2012 and December 31, 2011 and the consolidated balance sheet data as of December 31, 2013, December 31, 2012 and December 31, 2011 have been derived from our unaudited consolidated financial statements that are not included in this prospectus.
The selected historical consolidated financial data for the nine months ended September 30, 2016 and September 30, 2015 and as of September 30, 2016 have been derived from our unaudited condensed consolidated financial statements included elsewhere in this prospectus. The unaudited condensed consolidated financial statements were prepared on the same basis as our audited consolidated financial statements. In the opinion of management, such unaudited financial statements reflect all adjustments, consisting only of normal and recurring adjustments, necessary to fairly present our financial position and operating results as of the dates and for the periods presented. The operating results presented in the unaudited condensed consolidated financial statements are not necessarily indicative of the results that may be expected for a full fiscal year or in any future period.
You should read the following selected consolidated financial and other data together with the sections of this prospectus titled “Prospectus Summary—Summary Historical Consolidated Financial and Other Data,” “Use of Proceeds,” “Capitalization” and “Management’s Discussion and Analysis of Financial Condition and Results of Operations” and the consolidated financial statements and related notes thereto included elsewhere in this prospectus.
50
Table of Contents
| ($ in thousands, except for share and per share |
Nine Months Ended September 30, |
Year Ended December 31, | ||||||||||||||||||||||||||
| 2016 | 2015 | 2015 | 2014 | 2013 | 2012 | 2011 | ||||||||||||||||||||||
| Consolidated Statements of Income Data |
||||||||||||||||||||||||||||
| Operating revenues |
$ | 2,975,844 | $ | 2,932,875 | $ | 3,959,372 | $ | 3,940,576 | $ | 3,624,366 | $ | 3,489,434 | $ | 3,420,663 | ||||||||||||||
| Operating expenses: |
||||||||||||||||||||||||||||
| Purchased transportation |
1,077,635 | 1,055,865 | 1,430,164 | 1,384,979 | 1,198,090 | 1,106,389 | 1,034,467 | |||||||||||||||||||||
| Salaries, wages, and benefits |
848,208 | 805,217 | 1,076,512 | 1,037,781 | 974,570 | 983,026 | 965,191 | |||||||||||||||||||||
| Fuel and fuel taxes |
184,376 | 226,472 | 290,454 | 455,751 | 504,457 | 539,018 | 562,723 | |||||||||||||||||||||
| Depreciation and amortization |
197,704 | 174,339 | 236,330 | 230,008 | 212,557 | 220,710 | 198,546 | |||||||||||||||||||||
| Operating supplies and expenses |
333,049 | 340,193 | 452,452 | 435,753 | 397,465 | 368,966 | 379,318 | |||||||||||||||||||||
| Insurance and related expenses |
57,050 | 55,552 | 82,007 | 62,846 | 71,577 | 53,690 | 63,592 | |||||||||||||||||||||
| Other general expenses |
75,353 | 100,897 | 125,176 | 94,107 | 94,401 | 87,946 | 78,308 | |||||||||||||||||||||
| Goodwill impairment charge |
— | — | 6,037 | — | — | — | — | |||||||||||||||||||||
|
|
|
|
|
|
|
|
|
|
|
|
|
|
|
|||||||||||||||
| Total operating expenses |
2,773,375 | 2,758,535 | 3,699,132 | 3,701,225 | 3,453,117 | 3,359,745 | 3,282,145 | |||||||||||||||||||||
|
|
|
|
|
|
|
|
|
|
|
|
|
|
|
|||||||||||||||
| Income from operations |
202,469 | 174,340 | 260,240 | 239,351 | 171,249 | 129,689 | 138,518 | |||||||||||||||||||||
| Non-operating expenses: |
||||||||||||||||||||||||||||
| Interest expense—net |
15,708 | 13,968 | 18,730 | 11,732 | 13,860 | 13,700 | 15,038 | |||||||||||||||||||||
| Other—net |
1,771 | 2,196 | 2,786 | 1,756 | 851 | 1,401 | 1,587 | |||||||||||||||||||||
|
|
|
|
|
|
|
|
|
|
|
|
|
|
|
|||||||||||||||
| Total non-operating expenses |
17,479 | 16,164 | 21,516 | 13,488 | 14,711 | 15,101 | 16,625 | |||||||||||||||||||||
|
|
|
|
|
|
|
|
|
|
|
|
|
|
|
|||||||||||||||
| Income before income taxes |
$ | 184,990 | $ | 158,176 | $ | 238,724 | $ | 225,863 | $ | 156,538 | $ | 114,588 | $ | 121,893 | ||||||||||||||
| Provision for income taxes |
75,846 | 64,852 | 97,792 | 92,295 | 61,064 | 45,898 | 49,597 | |||||||||||||||||||||
|
|
|
|
|
|
|
|
|
|
|
|
|
|
|
|||||||||||||||
| Net income |
$ | 109,144 | $ | 93,324 | $ | 140,932 | $ | 133,568 | $ | 95,474 | $ | 68,690 | $ | 72,296 | ||||||||||||||
|
|
|
|
|
|
|
|
|
|
|
|
|
|
|
|||||||||||||||
| Per Share Data |
||||||||||||||||||||||||||||
| Net income per share attributable to common shareholders |
||||||||||||||||||||||||||||
| Basic |
$ | 20.97 | $ | 18.04 | $ | 27.23 | $ | 25.85 | $ | 18.50 | $ | 13.20 | $ | 13.91 | ||||||||||||||
| Diluted |
$ | 20.95 | $ | 18.01 | $ | 27.18 | $ | 25.80 | $ | 18.44 | $ | 13.16 | $ | 13.85 | ||||||||||||||
| Weighted average number of shares used in per share amounts |
||||||||||||||||||||||||||||
| Basic |
5,203,633 | 5,174,476 | 5,176,332 | 5,166,126 | 5,159,505 | 5,204,202 | 5,195,557 | |||||||||||||||||||||
| Diluted |
5,209,735 | 5,180,902 | 5,185,548 | 5,177,671 | 5,177,555 | 5,219,568 | 5,219,786 | |||||||||||||||||||||
| Consolidated Balance Sheet Data |
||||||||||||||||||||||||||||
| Cash and cash equivalents |
$ | 84,954 | $ | 160,676 | $ | 149,885 | $ | 170,832 | $ | 170,222 | $ | 179,230 | ||||||||||||||||
| Property and equipment (net) |
1,785,128 | 1,503,957 | 1,276,202 | 1,059,557 | 1,008,121 | 915,158 | ||||||||||||||||||||||
| Total assets |
3,023,221 | 2,621,937 | 2,320,211 | 2,010,236 | 1,893,927 | 1,842,461 | ||||||||||||||||||||||
| Long-term debt and obligations under capital leases |
560,146 | 539,606 | 509,223 | 294,902 | 336,320 | 334,668 | ||||||||||||||||||||||
| Temporary equity—Redeemable common stock, Class A(1) |
563,217 | 504,543 | 443,793 | 401,448 | 371,419 | 337,377 | ||||||||||||||||||||||
| Temporary equity—Redeemable common stock, Class B(1) |
496,478 | 441,018 | 383,109 | 347,050 | 323,107 | 295,702 | ||||||||||||||||||||||
| Accumulated earnings |
108,733 | 109,550 | 106,969 | 73,050 | 49,728 | 58,572 | ||||||||||||||||||||||
| Accumulated other comprehensive income |
1,158 | 412 | 810 | 758 | 1,663 | 357 | ||||||||||||||||||||||
| Total Dividends |
— | — | 25,158 | 20,697 | 16,001 | 12,794 | 7,007 | |||||||||||||||||||||
|
|
|
|
|
|
|
|
|
|
|
|
|
|
|
|||||||||||||||
| (1) | Pursuant to the Schneider National, Inc. Employee Stock Purchase Plan and certain agreements governing ownership of our common stock held by existing shareholders, including members of the Schneider family and their family trusts, each of our shareholders may require us to repurchase our common stock held by such shareholder under certain circumstances. As a result of these repurchase rights, we determined that our common stock is presently redeemable in accordance with GAAP, and therefore our common stock is treated as temporary equity in our historical financial statements. All such repurchase rights will be terminated contemporaneously with, and contingent upon, the completion of this offering via amendments to these documents. As a result, all of our outstanding redeemable common stock will be classified within shareholders’ equity, including common stock and additional paid-in capital. See “Capitalization.” |
51
Table of Contents
MANAGEMENT’S DISCUSSION AND ANALYSIS OF FINANCIAL CONDITION AND RESULTS OF OPERATIONS
You should read the following discussion of our financial condition and results of operations together with “Prospectus Summary—Summary Historical Consolidated Financial and Other Data,” “Selected Historical Consolidated Financial and Other Data” and consolidated financial statements and related notes thereto included elsewhere in this prospectus. The following discussion contains forward-looking statements and involves numerous risks and uncertainties, including but not limited to those described in the “Risk Factors” section of this prospectus. Actual results could differ materially from the results discussed in any forward-looking statements. See “Risk Factors” and “Special Note Regarding Forward-Looking Statements.”
Overview
We are a leading transportation and logistics services company providing a broad portfolio of premier truckload, intermodal and logistics solutions and operating one of the largest for-hire trucking fleets in North America. We believe we have developed a differentiated business model that is difficult to replicate due to our scale, breadth of complementary service offerings and proprietary technology platform. Our highly flexible and balanced business combines asset-based truckload services with asset-light intermodal and non-asset logistics offerings, enabling us to serve our customers’ diverse transportation needs. Since our founding in 1935, we believe we have become an iconic and trusted brand within the transportation industry by adhering to a culture of safety “first and always” and upholding our responsibility to our associates, our customers and the communities that we serve.
We are the second largest truckload company in North America by revenue, one of the largest intermodal transportation providers in North America by revenue and an industry leader in specialty equipment services and e-commerce fulfillment. We categorize our operations into the following reportable segments:
| • | Truckload – which consists of freight transported and delivered with dry van and specialty equipment by company-employed drivers in company trucks and owner-operators. Our truckload services include standard long-haul and regional shipping services primarily utilizing dry van equipment and bulk, temperature controlled, final mile “white glove” delivery and customized solutions for high-value and time-sensitive loads. These services are executed through either for-hire or dedicated contracts. |
| • | Intermodal – which consists of door-to-door, container on flat car service by a combination of rail and over-the-road transportation, in conjunction with our rail carrier partners. Our intermodal service offers vast coverage throughout North America, including cross-border freight utilizing company containers and trucks. |
| • | Logistics – which consists of non-asset brokerage, supply chain services (including 3PL) and import/export services. Our logistics business typically provides value-added services using third-party capacity, generally augmented by Schneider assets (except in our brokerage services), to handle and move our customers’ freight. |
In addition, we engage in equipment leasing to third parties through our wholly-owned subsidiary Schneider Finance, Inc. (SFI), which is an equipment leasing company primarily engaged in leasing trucks to owner-operators with whom we contract. We also provide insurance for both the company and owner-operators through our wholly owned insurance subsidiary and conduct limited China-based trucking operations consisting primarily of truck brokerage services.
Our portfolio consists of approximately 10,800 company and 2,800 owner-operator trucks, 38,400 trailers and 18,000 intermodal containers across North America and approximately 19,300 enterprise associates. We
52
Table of Contents
serve a diverse customer base across multiple industries represented by approximately 10,000 customers, including more than 200 Fortune 500 companies. Each day, our freight moves more than 8.8 million miles, equivalent to circling the globe approximately 350 times. Our logistics business manages over 20,000 qualified carrier relationships and, in 2015, managed approximately $2 billion of third-party freight. In addition, we have established a network of facilities across North America in order to maximize the geographic reach of our company trucks and owner-operators and provide maintenance services and personal amenities for our drivers. Our portfolio diversity, network density throughout North America and large fleet allow us to provide an exceptional level of service to our customers and consistently excel as a reliable partner, especially at times of peak demand.
Our success depends on our ability to balance our transportation network and efficiently and effectively manage our resources in the delivery of truckload, intermodal and logistics services to our customers. Resource requirements vary with customer demand, which may be subject to seasonal or general economic conditions. Our ability to properly select freight and adapt to changes in customer transportation requirements is important to efficiently deploy resources and make capital investments in trucks, trailers, containers and chassis (with respect to our truckload and intermodal segments) or obtain qualified third-party capacity at a reasonable price (with respect to our logistics segment). Although our business volume is not highly concentrated, our customers’ financial failures or loss of customer business may also affect us.
Factors Affecting Our Company and Results of Operations
Market Demand
Our results of operations are affected by industry-wide economic factors, general economic conditions, seasonal trucking industry freight patterns and industry capacity. The industry in which we operate is impacted by key drivers and trends including: the industrial and consumer economic environment of the United States, shipper demand for transportation services, truckload and intermodal capacity, market prices and the strength of the secondary equipment sales market. Our results of operations depend on our ability to efficiently manage our resources in providing solutions to our customers across all of our businesses in light of these factors. These drivers and trends impact our decisions in areas such as allocating capital across our reportable segments, driver wages, customer acquisition and retention, freight rates and investments in technology and fleet age.
Fuel
Shortages of fuel, increases in fuel prices and rationing of petroleum products can have a material adverse effect on our operations and profitability. Our customer fuel surcharge reimbursement programs generally enable us to recover from our customers a majority, but not all, of higher fuel prices compared to normalized average fuel prices. Rapid fluctuations in fuel cost can impact the effectiveness of those fuel surcharge reimbursement programs. In addition, we also pay fuel surcharges to our railroad partners in our intermodal segment. We attempt to offset these expenses by passing the fuel costs through to our customers. At times, the amount of fuel surcharge revenue we receive from our customers is less than the amount of fuel surcharges we pay to railroads in our intermodal segment, which can adversely affect our profitability.
Driver Capacity and Wage Cost
We recognize that our professional driver workforce is one of our most valuable assets. At times, there are driver shortages in the trucking industry. Changes in the demographic composition of the workforce, alternative employment opportunities that become available in the economy, and individual drivers’ desire to be home more frequently can affect availability of experienced drivers, including by increasing the wages our drivers require. Driver shortages impact both our ability to serve customers and driver wages paid to attract and retain drivers and can have a material adverse effect on our operations and profitability.
53
Table of Contents
Regulations
We are a motor carrier regulated by the DOT in the United States and similar governmental transportation agencies in the foreign countries in which we operate. The DOT generally governs matters such as safety requirements, registration to engage in motor carrier operations, and Hours of Service (HOS). New regulations and changes in regulations, such as the upcoming requirement to use electronic logging devices, could have a significant impact on the industry and company by increasing costs and reducing driver availability.
We have, and have always maintained, a satisfactory DOT safety rating, which is the highest available rating, and continually take efforts to maintain our satisfactory rating. A conditional or unsatisfactory DOT safety rating could adversely affect us because some of our customer contracts require a satisfactory rating. Equipment weight and dimensions are also subject to federal, state and international regulations with which we are required to comply.
We do not anticipate that the regulatory changes currently scheduled or being reviewed will have a material adverse impact on the Company.
Classification and Wage Litigation
The industry, including the company, has been subject to class action lawsuits challenging its compliance with aspects of the Fair Labor Standard Act (FLSA). Findings against us have the potential to both result in significant penalties and require inefficient, difficult to implement processes. As these judicial and legislative interpretations have taken effect, we have made the necessary adjustments to adequately comply with such interpretations.
Seasonality
In the transportation industry, results of operations generally show a seasonal pattern. As our customers ramp up for the holiday season at year-end, the late third and fourth quarters historically have been our strongest volume quarters. As our customers reduce shipments after the winter holiday season, the first quarter historically has been a lower volume quarter. Additionally, our operating expenses tend to be higher in the winter months primarily due to colder weather, which causes higher fuel consumption from increased idle time.
Key Performance Indicators
In addition to traditional financial metrics and our segment-level financial information, we track the key performance indicators described below to evaluate our business performance relative to our competitors and facilitate long-term high-level strategic planning.
Enterprise Level
We rely upon adjusted income from operations at the enterprise level to evaluate our business performance and facilitate long-term strategic planning. Operating ratio and adjusted operating ratio are used by us as indicators of our operating efficiency and profitability.
Adjusted income from operations and adjusted operating ratio are non-GAAP financial measures. Please see “—Results of Operations” below for a reconciliation of income from operations, the most comparable measure under GAAP, to adjusted income from operations, and operating ratio, the most comparable measure under GAAP, to adjusted operating ratio, respectively.
54
Table of Contents
Truckload Segment
Trucks
Trucks includes both company and owner-operator trucks in our active fleet that are available to be dispatched to haul freight at any point in time. This includes trucks that are able to be dispatched but have not been assigned a driver or are otherwise unstaffed.
Company trucks, a subset of trucks, includes trucks owned by the company and trucks acquired under capital and/or operating leases, and excludes units held for sale. Owner-operator trucks includes trucks owned and operated by third parties responsible for their own maintenance, licensing and other costs, but operated under our operating authority. Number of trucks is a key indicator of our capacity to haul freight in our truckload segment. This measure changes based on our ability to increase or decrease our fleet size to respond to changes in demand, as well as our ability to match drivers with trucks.
Average trucks is calculated based on beginning and ending month counts and represents the average number of trucks available to haul freight over a specific time frame.
Revenue Per Truck Per Week
Revenue per truck per week is a key productivity metric for our truckload segment and is calculated by dividing revenue (excluding fuel surcharge), which is how revenue is reported for segment purposes (as described below), by average trucks divided by weeks based off weighted workdays. Average trucks is calculated based on beginning and ending month counts. Because fuel surcharge revenues fluctuate in response to changes in fuel costs, we identify them separately and exclude them from the statistical calculations to provide a meaningful comparison between periods.
We strive to increase our revenue per truck per week by increasing freight rates and ancillary services billed to our customers, by hauling more loads and by moving more revenue producing miles with our existing equipment. Effectively moving freight within our network, keeping trucks maintained, recruiting and retaining drivers, and contracting owner-operators each impacts the increase of loads and miles and therefore revenue per truck per week.
We also assess average trucks and revenue per truck per week within the truckload segment to determine and compare how the type of contractual relationship with our customers, either for-hire or dedicated, drives our performance in a given period. The matrix explained in the bullet points below illustrates the way we monitor our truckload segment, based on the type of service offering and type of contractual relationship. We use this matrix to compare our business to our competitors and within our industry.
| • | For-hire (Standard)—Transportation services of one-way shipments utilizing standard dry van trailing equipment. |
| • | For-hire (Specialty)—Transportation services of one-way shipments utilizing bulk, temperature controlled, flatbed, straight truck and other specialty equipment. |
| • | Dedicated (Standard)—Transportation services with equipment devoted to customers under long-term contracts utilizing standard dry van trailing equipment. |
| • | Dedicated (Specialty)—Transportation services with devoted equipment to customers under long-term contracts utilizing bulk, temperature controlled, flatbed, straight truck and other specialty equipment. |
Trailers
Trailers are ‘standard’ 53-foot dry vans and specialty trailers, including flatbeds, temperature controlled trailers and bulk tankers, which we own or lease, or are owned by our customers and used by us in providing services. Trailers is a key indicator of our capacity to haul freight in our truckload segment. This measure changes based mainly on our ability to increase our fleet size to respond to changes in demand.
55
Table of Contents
Operating Ratio—Truckload
Operating ratio is used by us as an indicator of operating efficiency and profitability of our truckload segment. It is calculated as segment operating expenses divided by segment revenue (excluding fuel surcharge).
The following table presents our key performance metrics for our truckload segment for the periods indicated, consistent with how revenues and expenses are reported internally for segment purposes.
| Truckload (Revenue in thousands) |
Nine Months Ended September 30, |
Year Ended December 31, | ||||||||||||||||||
| 2016 | 2015 | 2015 | 2014 | 2013 | ||||||||||||||||
| Dedicated standard |
||||||||||||||||||||
| Revenue (excluding fuel surcharge) |
$ | 225,333 | $ | 189,587 | $ | 267,542 | $ | 216,294 | $ | 204,672 | ||||||||||
| Average trucks(1) |
1,766 | 1,468 | 1,532 | 1,284 | 1,206 | |||||||||||||||
| Revenue per truck per week(2) |
$ | 3,305 | $ | 3,356 | $ | 3,416 | $ | 3,307 | $ | 3,340 | ||||||||||
| Dedicated specialty |
||||||||||||||||||||
| Revenue (excluding fuel surcharge) |
$ | 283,533 | $ | 265,902 | $ | 358,352 | $ | 327,133 | $ | 297,523 | ||||||||||
| Average trucks(1) |
2,038 | 1,909 | 1,917 | 1,837 | 1,753 | |||||||||||||||
| Revenue per truck per week(2) |
$ | 3,604 | $ | 3,619 | $ | 3,655 | $ | 3,495 | $ | 3,341 | ||||||||||
| For-hire standard |
||||||||||||||||||||
| Revenue (excluding fuel surcharge) |
$ | 923,931 | $ | 882,433 | $ | 1,191,997 | $ | 1,138,528 | $ | 1,057,347 | ||||||||||
| Average trucks(1) |
7,066 | 6,637 | 6,652 | 6,356 | 6,233 | |||||||||||||||
| Revenue per truck per week(2) |
$ | 3,387 | $ | 3,455 | $ | 3,504 | $ | 3,515 | $ | 3,340 | ||||||||||
| For-hire specialty |
||||||||||||||||||||
| Revenue (excluding fuel surcharge) |
$ | 118,195 | $ | 121,089 | $ | 159,078 | $ | 179,912 | $ | 184,239 | ||||||||||
| Average trucks(1) |
798 | 888 | 880 | 909 | 1,005 | |||||||||||||||
| Revenue per truck per week(2) |
$ | 3,836 | $ | 3,543 | $ | 3,534 | $ | 3,885 | $ | 3,610 | ||||||||||
| Total Truckload |
||||||||||||||||||||
| Revenue (excluding fuel surcharge) |
$ | 1,550,992 | $ | 1,459,011 | $ | 1,976,970 | $ | 1,861,867 | $ | 1,743,781 | ||||||||||
| Average trucks(1)(3) |
11,669 | 10,903 | 10,982 | 10,385 | 10,197 | |||||||||||||||
| Revenue per truck per week(2) |
$ | 3,444 | $ | 3,478 | $ | 3,520 | $ | 3,518 | $ | 3,366 | ||||||||||
| Average company trucks(1) |
9,006 | 8,514 | 8,536 | 8,336 | 8,334 | |||||||||||||||
| Average owner-operator trucks(1) |
2,663 | 2,389 | 2,446 | 2,048 | 1,863 | |||||||||||||||
| Trailers |
38,098 | 33,579 | 33,508 | 32,055 | 30,777 | |||||||||||||||
| Operating ratio |
89.8% | 90.0% | 89.0% | 89.2% | 92.1% | |||||||||||||||
| (1) | Calculated based on beginning and ending month counts and represents the average number of trucks available to haul freight over the specified time frame. |
| (2) | Calculated excluding fuel surcharge, consistent with how revenue is reported internally for segment purposes, using weighted workdays. |
| (3) | Includes company trucks and owner-operator trucks. |
Intermodal Segment
Orders
Orders are requests from our intermodal customers for services for which the customer agrees to pay. Generally, an intermodal order represents a customer request for a full container of freight to be moved via intermodal from one shipping location to one destination. Because an order in an intermodal business generally represents one full container of freight to be transported by truck and by railroad, evaluating overall orders provides a consistent indicator of the volume and size of our intermodal business in a fiscal period. We review orders in intermodal but not truckload because in truckload there are significant differences in order size and volume within various truckload services such as final mile and other specialty services. For example, one
56
Table of Contents
truckload order may take up the entire capacity of a truck (known as a “full truckload” order) whereas another truckload order may be for a single end table or other item of furniture, leaving excess capacity in the truck. Given these differences, an order lacks consistency and reliability as a measurement tool for our truckload and logistics segments.
Containers
A container means a cargo container used in the domestic intermodal market with dimensions approximately the same dimensions as a 53-foot dry van that can be lifted from a detachable chassis and placed on a railcar (as opposed to international intermodal containers, which are 20-foot or 40-foot International Standards Organization (ISO) containers). Domestic intermodal containers are often double stacked on rail cars to minimize transportation cost. Containers are a key indicator of our ability to haul freight in our intermodal segment. This measure changes mainly based on our ability to increase our fleet size to respond to changes in demand.
Trucks
Trucks includes both company and owner-operator trucks in our active fleet that are available to be dispatched to haul freight at any point in time. This includes trucks that are able to be dispatched but have not been assigned a driver or are otherwise unstaffed.
Company trucks, a subset of trucks, includes trucks owned by the company and trucks acquired under capital and/or operating leases, and excludes units held for sale. Owner-operator trucks includes trucks owned and operated by third parties responsible for their own maintenance, licensing and other costs, but operated under our operating authority. Number of trucks is a key indicator of our capacity to haul freight in our intermodal segment. This measure changes based on our ability to increase or decrease our fleet size to respond to changes in demand, as well as our ability to match drivers with trucks.
Average trucks is calculated based on beginning and ending month counts and represents the average number of trucks available to haul freight over a specified time frame.
Revenue Per Order
Revenue per order is a key price metric for our intermodal segment and is calculated by dividing revenue (excluding fuel surcharge), consistent with how revenue is reported internally for segment purposes, by orders.
We strive to increase our revenue per order by improving rates with our customers. Orders and the rates received for our services affect revenue per order.
Operating Ratio—Intermodal
Operating ratio is used by us as an indicator of operating efficiency and profitability of our intermodal segment. It is calculated as segment operating expenses divided by segment revenue (excluding fuel surcharge, consistent with how revenue is reported internally for segment purposes).
57
Table of Contents
The following table presents our key performance indicators for our intermodal segment for the periods indicated.
| Intermodal |
Nine Months Ended September 30, |
Year Ended December 31, | ||||||||||||||||||
| 2016 | 2015 | 2015 | 2014 | 2013 | ||||||||||||||||
| Orders (in thousands) |
281.4 | 286.9 | 386.9 | 376.9 | 360.6 | |||||||||||||||
| Containers |
17,568 | 17,325 | 17,397 | 17,280 | 14,315 | |||||||||||||||
| Trucks(1) |
1,288 | 1,342 | 1,335 | 1,313 | 1,236 | |||||||||||||||
| Revenue per order(2) |
$ | 1,989 | $ | 2,014 | $ | 2,040 | $ | 1,918 | $ | 1,845 | ||||||||||
| Operating ratio |
94.3% | 93.4% | 92.6% | 94.3% | 94.1% | |||||||||||||||
| (1) | Includes company and owner-operator trucks. |
| (2) | Calculated excluding fuel surcharge, consistent with how revenue is calculated internally for segment purposes. |
Logistics Segment
Operating Ratio—Logistics
Operating ratio is used by us as an indicator of operating efficiency and profitability of our logistics segment. It is calculated as segment operating expenses divided by segment revenue (excluding fuel surcharge, consistent with how revenue is reported internally for segment purposes).
The following table presents our key performance indicator for our logistics segment for the periods indicated.
| Logistics |
Nine Months Ended September 30, |
Year Ended December 31, | ||||||||||||||||||
| 2016 | 2015 | 2015 | 2014 | 2013 | ||||||||||||||||
| Operating ratio |
96.0% | 96.4% | 96.0% | 96.9% | 97.1% | |||||||||||||||
Components of Revenue and Expenses
Operating Revenue
Operating revenue represents all revenue, including fuel surcharge revenue, reduced by inter-segment eliminations.
We primarily generate operating revenue by transporting freight for our customers. We are typically paid a predetermined rate per mile for our services. We enhance our revenue by charging for ancillary services including stop-off pay, loading and unloading activities, truck, trailer and container detention and other services. The main factors that affect our revenue are our revenue per truck per week, our total number of trucks and the number of miles traveled by our trucks. In the case of our intermodal segment, we receive a rate per order. In our logistics segment, we generate brokerage revenue generally based on a rate per order, while supply chain services (including 3PL) and import/export services revenue is generally based on a rate per transaction or rate per service provided.
We also generate other revenue streams, mainly premium revenue generated by our captive insurance company, INS, and truck lease revenue streams through leases from our leasing company, SFI.
Fuel surcharge revenue is designed to compensate us for fuel costs above a certain cost per gallon base. Generally, we receive fuel surcharge revenue on the miles for which we are compensated by customers.
58
Table of Contents
However, we continue to have exposure, as a result of shipper and rail contracts, to changing fuel prices to the extent the fuel surcharge paid by the customer is insufficient to cover the cost of our fuel. Generally, fuel surcharge revenue is determined based on the average price of fuel in the United States as determined by the Department of Energy. The main factors that affect fuel surcharge revenue are the price of diesel fuel and the number of miles driven.
Management’s goal with respect to fuel surcharge revenue is to reduce fluctuations in financial results caused by the cost of fuel. Some customers choose to incorporate the additional charge by splitting the impact between the basic rate per mile and the fuel surcharge rate. Fuel surcharge is calculated on a lag, meaning, the rate that we charge customers is based on a previous week’s DOE index.
Adjusted enterprise revenue (excluding fuel surcharge) is derived by excluding fuel surcharge revenue from operating revenue. Management recognizes that fuel surcharge revenue can and does fluctuate as fuel costs fluctuate, which is out of the control of management and can distort comparisons and analytics.
Expenses
The key expenses in our business vary with miles traveled and include fuel, driver-related expenses (such as wages and benefits) and purchased transportation expenses (services purchased from owner-operators, other transportation providers, such as the railroads, drayage providers and other trucking companies). Expenses that have both fixed and variable components include maintenance and tire expense and our total cost of insurance and claims. These expenses generally vary with the miles we travel, but also have a controllable component based on fleet age, efficiency, safety history and other factors. Our main fixed costs are depreciation of long-term assets, such as trucks, trailers, containers, chassis, software, facilities and the compensation of non-driver personnel.
Purchased Transportation
Purchased transportation consists of the payments we make to railroads (including fuel surcharges paid to our railroad partners), owner-operators, and third-party carriers that haul loads on our behalf. Fluctuations in purchased transportation are the result of the rates paid for these services and the mix of customer orders moved by these third parties (compared to company equipment). Rates fluctuate due to industry supply and demand.
Salaries, Wages, and Benefits
Salaries, wages, and benefits consist primarily of compensation and related taxes and benefits (including worker’s compensation). Salaries, wages, and benefits are primarily affected by the total number of miles driven by company drivers, the rate per mile we pay our company drivers, employee benefits including but not limited to health care costs, and, to a lesser extent, by the number of, and compensation and benefits paid to, non-driver associates.
Fuel and Fuel Taxes
Fuel expense consists primarily of diesel fuel expense and fuel taxes for our company trucks. The primary factors affecting our fuel expense
are the cost of diesel fuel, the miles per gallon we realize with our equipment and the number of miles driven by company drivers. We believe the most effective protection against fuel cost increases is to maintain a fuel-efficient fleet (by
incorporating fuel efficiency measures, such as slower truck speeds and engine idle limitations) and effective fuel surcharge programs.
Depreciation and Amortization
Depreciation and amortization expense consists primarily of depreciation of company trucks, trailers, containers, chassis, facilities and office equipment, and also includes the amortization of software and other
59
Table of Contents
intangible assets. The primary factors affecting these expense items include the size and age of our truck, trailer, container and chassis fleet, the cost of new equipment and the expected value of the assets upon disposal.
Operating Supplies and Expenses
Operating supplies and expenses consist primarily of ordinary vehicle repairs and maintenance, driver tolls, third-party lumper and related services, tank-washing costs, costs associated with preparing trucks and trailers for sale or trade-in, costs of taxes and licenses associated with our fleet of equipment, driver expenses, facility and office equipment rents, utilities and communications expenses. Communications expenses include driver in-cab mobile communications devices.
It also includes gain or loss on
the sale of property, plant and equipment, operating leases for trucks, trailers, containers, chassis, facilities and computer equipment, and the cost of goods sold by our sales-type equipment leasing business. The age and size of our
company-fleet of trucks and trailers, the number of miles driven in a period, the number of owner-operators leasing equipment from us, the number of units sold and proceeds in the used equipment market are the primary factors
affecting operating supplies and expenses.
Insurance and Related Expenses
Insurance and related expenses consist of insurance premiums and the accruals we make for estimated payments and expenses for claims for bodily injury, property damage, cargo damage and other casualty events. The primary factors affecting our insurance and related expense are the frequency and severity of accidents, seasonality (we typically experience higher accident frequency in winter months), developments in large, prior-year claims, trends in the development factors used in our actuarial accruals, and our self-insurance retention levels.
Other General Expenses
Other general expenses primarily represent administrative costs related to our organization. These costs include general office expenses, professional services, associate travel and entertainment, driver onboarding costs and other related expenses.
Goodwill Impairment Charge
Goodwill impairment charge is recorded when the carrying value of goodwill exceeds its fair value in connection with a goodwill impairment test.
Interest Expense—Net
Interest expense—net represents interest associated with our borrowings and leases and amortization of related issuance
costs and fees.
Other—Net
Other—net represents all other non-operating expenses besides interest expense – net that are outside of our main operations.
Provision for Income Taxes
Provision for income taxes represents the estimated amount of income taxes that we expect to pay for the current year and deferred taxes which will affect our future tax obligations.
60
Table of Contents
Results of Operations
The following table sets forth, for the periods indicated, our results of operations:
| ($ in thousands) | Nine months ended September 30, |
Year ended December 31, | ||||||||||||||||||
| 2016 | 2015 | 2015 | 2014 | 2013 | ||||||||||||||||
| Operating revenue |
$ | 2,975,844 | $ | 2,932,875 | $ | 3,959,372 | $ | 3,940,576 | $ | 3,624,366 | ||||||||||
| Operating expenses: |
||||||||||||||||||||
| Purchased transportation |
1,077,635 | $ | 1,055,865 | 1,430,164 | 1,384,979 | 1,198,090 | ||||||||||||||
| Salaries, wages, and benefits |
848,208 | 805,217 | 1,076,512 | 1,037,781 | 974,570 | |||||||||||||||
| Fuel and fuel taxes |
184,376 | 226,472 | 290,454 | 455,751 | 504,457 | |||||||||||||||
| Depreciation and amortization |
197,704 | 174,339 | 236,330 | 230,008 | 212,557 | |||||||||||||||
| Operating supplies and expenses |
333,049 | 340,193 | 452,452 | 435,753 | 397,465 | |||||||||||||||
| Insurance and related expenses |
57,050 | 55,552 | 82,007 | 62,846 | 71,577 | |||||||||||||||
| Other general expenses |
75,353 | 100,897 | 125,176 | 94,107 | 94,401 | |||||||||||||||
| Goodwill impairment charge |
— | — | 6,037 | — | — | |||||||||||||||
|
|
|
|
|
|
|
|
|
|
|
|||||||||||
| Total operating expenses |
2,773,375 | 2,758,535 | 3,699,132 | 3,701,225 | 3,453,117 | |||||||||||||||
|
|
|
|
|
|
|
|
|
|
|
|||||||||||
| Income from operations |
$ | 202,469 | $ | 174,340 | $ | 260,240 | $ | 239,351 | $ | 171,249 | ||||||||||
| Non-operating expenses |
||||||||||||||||||||
| Interest expense—net |
15,708 | 13,968 | 18,730 | 11,732 | 13,860 | |||||||||||||||
| Other—net |
1,771 | 2,196 | 2,786 | 1,756 | 851 | |||||||||||||||
|
|
|
|
|
|
|
|
|
|
|
|||||||||||
| Total non-operating expenses |
17,479 | 16,164 | 21,516 | 13,488 | 14,711 | |||||||||||||||
|
|
|
|
|
|
|
|
|
|
|
|||||||||||
| Income before income taxes |
184,990 | 158,176 | 238,724 | 225,863 | 156,538 | |||||||||||||||
| Provision for income taxes |
75,846 | 64,852 | 97,792 | 92,295 | 61,064 | |||||||||||||||
|
|
|
|
|
|
|
|
|
|
|
|||||||||||
| Net income |
$ | 109,144 | $ | 93,324 | $ | 140,932 | $ | 133,568 | $ | 95,474 | ||||||||||
|
|
|
|
|
|
|
|
|
|
|
|||||||||||
| Adjusted enterprise revenue (excluding fuel surcharge)(1) |
$ | 2,766,131 | $ | 2,641,554 | $ | 3,588,220 | $ | 3,333,718 | $ | 3,003,972 | ||||||||||
| Adjusted income from operations(2) |
$ | 204,070 | $ | 201,040 | $ | 293,008 | $ | 244,276 | $ | 174,204 | ||||||||||
| (1) | Adjusted enterprise revenue (excluding fuel surcharge) is a non-GAAP financial measure, and represents operating revenue, minus fuel surcharge revenue. This non-GAAP financial measure should not be considered an alternative to, or superior to, the GAAP financial measure operating revenue. However, our management believes that the non-GAAP measure adjusted enterprise revenue (excluding fuel surcharge) provides a useful measure of business results because it eliminates the distortion caused by fluctuating fuel costs. Volume, price and cost changes directly related to how we operate our business and industry demand are more readily apparent utilizing adjusted enterprise revenue (excluding fuel surcharge), since it isolates these factors from the exogenous factor of fuel prices and the programs we have in place to manage fuel price fluctuations. Although fuel-related costs and its impact on the industry are important to our results of operations, they are often independent of other factors affecting our industry that are more directly germane to the transportation industry specifically. Please see the table below for a reconciliation of operating revenue, the most closely comparable GAAP financial measure, to adjusted enterprise revenue (excluding fuel surcharge). |
| ($ in thousands) | Nine Months Ended September 30, |
Year Ended December 31, | ||||||||||||||||||
| 2016 | 2015 | 2015 | 2014 | 2013 | ||||||||||||||||
| Operating revenue |
$ | 2,975,844 | $ | 2,932,875 | $ | 3,959,372 | $ | 3,940,576 | $ | 3,624,366 | ||||||||||
| less: Fuel surcharge revenue |
209,713 | 291,321 | 371,152 | 606,858 | 620,394 | |||||||||||||||
|
|
|
|
|
|
|
|
|
|
|
|||||||||||
| Adjusted enterprise revenue (excluding fuel surcharge) |
$ | 2,766,131 | $ | 2,641,554 | $ | 3,588,220 | $ | 3,333,718 | $ | 3,003,972 | ||||||||||
61
Table of Contents
| (2) | We define “adjusted income from operations” as income from operations, adjusted to exclude certain litigation costs, goodwill impairment, changes in vacation policy and acquisition costs. We describe these adjustments reconciling income from operations to adjusted income from operations in the table below. |
We believe that using adjusted income from operations is helpful in analyzing our performance because it removes the impact of items from our operating results that, in our opinion, do not reflect our core operating performance. Our management and our Board of Directors focus on adjusted income from operations as a key measure of our performance. We believe our presentation of adjusted income from operations is helpful to investors because it provides investors the same information that we use internally for purposes of assessing our core operating performance.
Adjusted income from operations is a non-GAAP financial measure and should not be considered as an alternative to net income as a measure of financial performance or cash flows from operations as a measure of liquidity, or any other performance measure derived in accordance with GAAP and it should not be construed as an inference that our future results will be unaffected by unusual or non-recurring items. In evaluating adjusted income from operations, you should be aware that in the future we may incur expenses that are the same as or similar to some of the adjustments in this presentation. Our presentation of adjusted income from operations should not be construed to imply that our future results will be unaffected by any such adjustments. Our management compensates for these limitations by primarily relying on our GAAP results in addition to using adjusted income from operations supplementally.
The following is a reconciliation of income from operations, which is the most directly comparable GAAP measure, to adjusted income from operations:
| ($ in thousands) | Nine Months Ended September 30, |
Year Ended December 31, | ||||||||||||||||||
| 2016 | 2015 | 2015 | 2014 | 2013 | ||||||||||||||||
| Income from operations |
$ | 202,469 | $ | 174,340 | $ | 260,240 | $ | 239,351 | $ | 171,249 | ||||||||||
| Litigation(a) |
— | 26,700 | 26,731 | 4,925 | 10,000 | |||||||||||||||
| Goodwill impairment(b) |
— | — | 6,037 | — | — | |||||||||||||||
| Change in vacation policy(c) |
— | — | — | — | (7,045 | ) | ||||||||||||||
| Acquisition costs(d) |
1,601 | — | — | — | — | |||||||||||||||
|
|
|
|
|
|
|
|
|
|
|
|||||||||||
| Adjusted income from operations |
$ | 204,070 | $ | 201,040 | $ | 293,008 | $ | 244,276 | $ | 174,204 | ||||||||||
| (a) | Costs associated with certain lawsuits challenging compliance with aspects of the Fair Labor Standards Act (FLSA). |
| (b) | As a result of our annual goodwill impairment test as of December 31, 2015, we took an impairment charge for our Asia reporting unit. |
| (c) | Reflects a change to our vacation policy in 2013 in which the award of vacation days changed from being based on a vesting plan to an annual granting plan, resulting in a one-time benefit to income from operations. |
| (d) | Costs related to the acquisitions of Watkins & Shepard and Lodeso. |
62
Table of Contents
The following table sets forth, for the periods indicated, items in our Consolidated Statements of Comprehensive Income as a percentage of operating revenue:
| Nine Months Ended September 30, |
Year Ended December 31, | |||||||||||||||||||
| 2016 | 2015 | 2015 | 2014 | 2013 | ||||||||||||||||
| Operating revenue |
100.0 | % | 100.0 | % | 100.0 | % | 100.0 | % | 100.0 | % | ||||||||||
| Purchased transportation |
36.2 | % | 36.0 | % | 36.1 | % | 35.1 | % | 33.1 | % | ||||||||||
| Salaries, wages, and benefits |
28.5 | % | 27.5 | % | 27.2 | % | 26.3 | % | 26.9 | % | ||||||||||
| Fuel and fuel taxes |
6.2 | % | 7.7 | % | 7.3 | % | 11.6 | % | 13.9 | % | ||||||||||
| Depreciation and amortization |
6.6 | % | 5.9 | % | 6.0 | % | 5.8 | % | 5.9 | % | ||||||||||
| Operating supplies and expenses |
11.2 | % | 11.6 | % | 11.4 | % | 11.1 | % | 11.0 | % | ||||||||||
| Insurance and related expenses |
1.9 | % | 1.9 | % | 2.1 | % | 1.6 | % | 2.0 | % | ||||||||||
| Other general expenses |
2.6 | % | 3.5 | % | 3.1 | % | 2.4 | % | 2.5 | % | ||||||||||
| Goodwill impairment charge |
0.0 | % | 0.0 | % | 0.2 | % | 0.0 | % | 0.0 | % | ||||||||||
| Total operating expenses |
93.2 | % | 94.1 | % | 93.4 | % | 93.9 | % | 95.3 | % | ||||||||||
Operating ratio is calculated on both a GAAP basis (operating expenses as a percentage of operating revenue) and on a non-GAAP basis, (which we refer to as adjusted operating ratio, and calculated as operating expenses, less fuel surcharge and certain litigation costs, goodwill impairment, change in vacation policy and acquisition costs as a percentage of adjusted enterprise revenue (excluding fuel surcharge). Adjusted operating ratio should not be considered an alternative to, or superior to, the GAAP financial measure operating ratio. However, we believe adjusted operating ratio allows us to effectively compare periods while excluding the potentially volatile effect of changes in fuel prices and other certain adjustments. Adjusted operating ratio is not a substitute for the GAAP measurement operating ratio.
The following table sets forth, for the periods indicated, operating ratio (GAAP) and adjusted operating ratio (non-GAAP):
| For the nine months ended September 30, |
For the year ended December 31, | |||||||||||||||||||
| 2016 | 2015 | 2015 | 2014 | 2013 | ||||||||||||||||
| Operating ratio |
93.2 | % | 94.1 | % | 93.4 | % | 93.9 | % | 95.3 | % | ||||||||||
| Adjustment |
(0.5 | %) | 0.3 | % | 0.3 | % | (0.9 | %) | (0.9 | %) | ||||||||||
|
|
|
|
|
|
|
|
|
|
|
|||||||||||
| Adjusted operating ratio |
92.7 | % | 94.4 | % | 93.7 | % | 93.0 | % | 94.4 | % | ||||||||||
Nine Months Ended September 30, 2016 Compared to Nine Months Ended September 30, 2015
Net Income
Net income for the nine months ended September 30, 2016 was $109.1 million, an increase of $15.8 million, or 16.9%, compared to the nine months ended September 30, 2015, primarily due to operating revenue growth, favorable fuel cost and lower legal costs.
Revenue
Operating revenue for the nine months ended September 30, 2016 was $2,975.8 million, an increase of $42.9 million, or 1.5%, compared to the nine months ended September 30, 2015. This increase was primarily due to increased volume in our truckload and logistics segments and our acquisition of Watkins & Shepard and Lodeso in June 2016, offset by volume and price declines in our intermodal segment. Due to lower fuel prices, fuel surcharge revenue decreased $81.6 million, or 28.0%, compared to the nine months ended September 30, 2015. Adjusted enterprise revenue (excluding fuel surcharge), for the nine months ended September 30, 2016 was $2,766.1 million, an increase of $124.6 million, or 4.7% compared to the nine months ended September 30, 2015.
63
Table of Contents
Expenses
Our operating ratio (operating expenses expressed as a percentage of operating revenue) for the nine months ended September 30, 2016 was 93.2%, compared to 94.1% for the nine months ended September 30, 2015. Key expense items that impacted the overall operating ratio are described below.
| • | Purchased transportation for the nine months ended September 30, 2016 increased by $21.8 million, or 2.1%, compared to the nine months ended September 30, 2015. The increase in purchased transportation was primarily due to a 9.6% increase in the average number of owner-operators and over a 16% growth in our logistics segment operating revenue which resulted in higher third-party carrier costs. Offsetting the increase in purchased transportation costs was lower utilization of third-party carriers in our truckload segment and lower volumes in our intermodal segment. Purchased transportation represented 36.2% of our operating revenue for the nine months ended September 30, 2016 and 36.0% of our operating revenue for the nine months ended September 30, 2015. |
| • | Salaries, wages, and benefits for the nine months ended September 30, 2016 increased by $43.0 million, or 5.3%, compared to the nine months ended September 30, 2015. The increase in salaries, wages, and benefits was primarily due to a headcount increase of over 19% in our logistics segment due to business growth and driver related costs due to our June 2016 acquisition of Watkins & Shepard. Salaries, wages, and benefits represented 28.5% of our operating revenue for the nine months ended September 30, 2016 and 27.5% of our operating revenue for the nine months ended September 30, 2015. |
| • | Fuel and fuel taxes for the nine months ended September 30, 2016 decreased by $42.1 million, or 18.6%, compared to the nine months ended September 30, 2015. Age-of-fleet reductions, aerodynamic truck improvements and lower national fuel prices resulted in a greater than 2% improvement in miles per gallon and a greater than 20% reduction in cost per gallon. Fuel and fuel taxes represented 6.2% of our operating revenue for the nine months ended September 30, 2016 and 7.7% of our operating revenue for the nine months ended September 30, 2015. |
| • | Depreciation and amortization for the nine months ended September 30, 2016 increased by $23.4 million, or 13.4%, compared to the nine months ended September 30, 2015. The increase was primarily due to increases in our fleet size through purchases of owned and conversion of leased units. Depreciation and amortization represented 6.6% of our operating revenue for the nine months ended September 30, 2016 and 5.9% of our operating revenue for the nine months ended September 30, 2015. |
| • | Operating supplies and expenses for the nine months ended September 30, 2016 decreased by $7.2 million, or 2.1%, compared to the nine months ended September 30, 2015. The decrease in operating supplies and expenses was primarily due to lower cost of goods sold under sales-type financing leases and a reduction in the number of truck operating leases offset by $8.0 million lower gains on equipment sales and by related expenses of Watkins & Shepard. Operating supplies and expenses represented 11.2% of our operating revenue for the nine months ended September 30, 2016 and 11.6% of our operating revenue for the nine months ended September 30, 2015. |
| • | Insurance and related expenses for the nine months ended September 30, 2016 increased by $1.5 million, or 2.7%, compared to the nine months ended September 30, 2015. The increase in insurance and related expenses was primarily due to our acquisition of Watkins & Shepard offset by lower accident severity. Insurance and related expenses represented 1.9% of our operating revenue for the nine months ended September 30, 2016 and 1.9% of our operating revenue for the nine months ended September 30, 2015. |
| • | Other general expenses for the nine months ended September 30, 2016 decreased by $25.6 million, or 25.4%, compared to the nine months ended September 30, 2015, primarily due to a $25.1 million reduction in legal expenses. Other general expenses represented 2.6% of our operating revenue for the nine months ended September 30, 2016 and 3.5% of our operating revenue for the nine months ended September 30, 2015. |
64
Table of Contents
Income from Operations
Income from operations for the nine months ended September 30, 2016 was $202.5 million, an increase of $28.2 million, or 16.2%, compared to the nine months ended September 30, 2015. Adjusted income from operations for the nine months ended September 30, 2016 was $204.1 million, an increase of $3.0 million, or 1.5% compared to the nine months ended September 30, 2015.
Interest and Taxes
| • | Interest expense |
| • | Our effective tax rate for the nine months ended September 30, 2016 was 41.0%, unchanged compared to the nine months ended September 30, 2015. |
Year Ended December 31, 2015 Compared to Year Ended December 31, 2014
Net Income
Net income for fiscal year 2015 was $140.9 million, an increase of $7.3 million, or 5.5%, compared to 2014, primarily due to operating revenue growth, lower fuel and workers compensation expenses offset by increased insurance and legal expenses.
Revenue
Operating revenue for fiscal year 2015 was $3,959.4 million, an increase of $18.8 million, or 0.5%, compared to 2014 primarily due to price and volume increases. Volume increases were due to improved productivity across existing equipment and increased equipment levels. Due to lower fuel prices, fuel surcharge revenue decreased $235.7 million, or 38.8%, compared to fiscal year 2014. Adjusted enterprise revenue (excluding fuel surcharge), for fiscal year 2015 was $3,588.2 million, an increase of $254.5 million, or 7.6%, compared to 2014.
Expenses
Our operating ratio (operating expenses expressed as a percentage of operating revenue) for the fiscal year 2015 was 93.4%, compared to 93.9% for fiscal year 2014. Key expense items that impacted the overall operating ratio are described below.
| • | Purchased transportation for fiscal year 2015 increased by $45.2 million, or 3.3%, compared to fiscal year 2014. The increase in purchased transportation was primarily due to over a 20% increase in the average number of owner-operators and an 8.4% growth in our logistics segment operating revenue. Offsetting the increase in purchased transportation costs were lower third-party capacity rates across all segments due to market supply level relative to demand and declining fuel prices resulted in lower fuel surcharges being paid to owner-operators and third-party carriers. Purchased transportation represented 36.1% of our operating revenue for fiscal year 2015, and 35.1% of our operating revenue for fiscal year 2014. |
| • | Salaries, wages, and benefits for fiscal year 2015 increased by $38.7 million, or 3.7%, compared to fiscal year 2014. The increase in salaries, wages, and benefits was primarily due to over a 3% increase in our average number of company drivers, driver pay increases and an increase in our non-driver associates; primarily to accommodate growth in our logistics segment and in our maintenance operations due to increased fleet size. Offsetting the increase was lower worker’s compensation expense. Salaries, wages, and benefits represented 27.2% of our operating revenue for fiscal year 2015 and 26.3% of our operating revenue for fiscal year 2014. |
65
Table of Contents
| • | Fuel and fuel taxes for fiscal year 2015 decreased by $165.3 million, or 36.3%, compared to fiscal year 2014. Moderate weather, which generally improves driving conditions and enables our trucks to travel with fewer delays and obstacles than inclement weather, and lower national fuel prices resulted in over a 3% improvement in miles per gallon and over a 35% reduction in cost per gallon. Fuel and fuel taxes expense represented 7.3% of our operating revenue for fiscal year 2015 and 11.6% of our operating revenue for fiscal year 2014. |
| • | Depreciation and amortization for fiscal year 2015 increased by $6.3 million, or 2.7%, compared to fiscal year 2014. The increase was primarily due to an increase in our fleet size. Depreciation and amortization represented 6.0% of our operating revenue for fiscal year 2015 and 5.8% of our operating revenue for fiscal year 2014. |
| • | Operating supplies and expenses for fiscal year 2015 increased by $16.7 million, or 3.8% compared to fiscal year 2014. The increase in operating supplies and expenses was primarily due to an increase in cost of goods sold under sales-type financing leases offset by a decrease of our revenue equipment operating leases; primarily chassis. Operating supplies and expenses represented 11.4% of our operating revenue for fiscal year 2015 and 11.1% of our operating revenue for fiscal year 2014. |
| • | Insurance and related expenses for fiscal year 2015 increased by $19.2 million, or 30.6%, compared to fiscal year 2014. The increase in insurance and related expenses was primarily due to accident frequency. Insurance and related expenses represented 2.1% of our operating revenue for fiscal year 2015 and 1.6% of our operating revenue for fiscal year 2014. |
| • | Other general expenses for fiscal year 2015 increased by $31.2 million, or 33.2%, compared to fiscal year 2014, primarily due to legal expenses of $26.7 million relating to a driver meal/rest break and wage lawsuit in California and an increase in driver onboarding due to over a 24% increase in company driver and owner-operator hires. Other general expenses represented 3.1% of our operating revenue for fiscal year 2015 and 2.4% of our operating revenue for fiscal year 2014. |
| • | As further described in note 2 to the audited financial statements, we incurred a goodwill impairment charge for fiscal year 2015 of $6.0 million for our Asia business (included in our other segment). |
Income from Operations
Income from operations for fiscal year 2015 was $260.2 million, an increase of $20.8 million, or 8.7%, compared to fiscal year 2014. Adjusted income from operations for fiscal year 2015 was $293.0 million, an increase of $48.7 million, or 19.9% compared to fiscal year 2014.
Interest and Taxes
| • | Interest expense |
| • | Our effective tax rate for fiscal year 2015 was 41.0% compared to 40.9% fiscal year 2014. The increase in effective tax rate was primarily related to an increase in the provision for state taxes. |
Year Ended December 31, 2014 Compared to Year Ended December 31, 2013
Net Income
Net income for fiscal year 2014 was $133.6 million, an increase of $38.1 million, or 39.9% compared to 2013, due primarily to operating revenue growth in all segments and favorable gains from equipment disposals and insurance and related expenses.
66
Table of Contents
Revenue
Operating revenue for fiscal year 2014 was $3,940.6 million, an increase of $316.2 million, or 8.7%, compared to fiscal year 2013 primarily due to revenue management and network alignment that resulted in all of our segments experiencing volume and price growth. Adjusted enterprise revenue (excluding fuel surcharge) for fiscal year 2014 was $3,333.7 million, an increase of $329.7 million, or 11.0% compared to fiscal year 2013.
Expenses
Our operating ratio (operating expenses expressed as a percentage of operating revenue) for fiscal year 2014 was 93.9%, compared to 95.3% for fiscal year 2013. Expense items that impacted the overall operating ratio are described below.
| • | Purchased transportation for fiscal year 2014 was $1,385.0 million, an increase of $186.9 million, or 15.6%, compared to fiscal year 2013. The increase in purchased transportation was primarily due to an 11.0%
growth in the average number of owner-operator |
| • | Salaries, wages, and benefits for fiscal year 2014 was $1,037.8 million, an increase of $63.2 million, or 6.5% compared to fiscal year 2013. The increase in salaries, wages, and benefits was primarily due to a year-over-year headcount increase of over 4%, an increase of $14.6 million in our profit-sharing expense due to financial performance and increased worker’s compensation expense. Salaries, wages, and benefits represented 26.3% of our operating revenue for fiscal year 2014 and 26.9% of our operating revenue for fiscal year 2013. |
| • | Fuel and fuel taxes for fiscal year 2014 were $455.6 million, a decrease of $48.7 million, or 9.7%, compared to fiscal year 2013. The decrease in fuel and fuel taxes was primarily due to over a 5% decrease in cost per gallon and over a 3% improvement in miles per gallon primarily due to age-of-fleet reduction. Fuel and fuel taxes represented 11.6% of our operating revenue for fiscal year 2014 and 13.9% of our operating revenue for fiscal year 2013. |
| • | Depreciation and amortization for fiscal year 2014 were $230.0 million, an increase of $17.5 million, or 8.2%, compared to fiscal year 2013. The increase was primarily due to an increase in our fleet size. Depreciation and amortization represented 5.8% of our operating revenue for fiscal year 2014 and 5.9% of our operating revenue for fiscal year 2013. |
| • | Operating supplies and expenses for fiscal year 2014 were $435.8 million, an increase of $38.3 million, or 9.6% compared to fiscal year 2013. The increase in operating supplies and expenses was primarily due to an increase in cost of goods sold under sales-type financing leases and increases in maintenance costs offset by a $7.9 million increase in gains on sales of property, plant and equipment. Operating supplies and expenses represented 11.1% of our operating revenue for fiscal year 2014 and 11.0% of our operating revenue for fiscal year 2013. |
| • | Insurance and related expenses for fiscal year 2014 were $62.8 million, a decrease of $8.7 million, or 12.2%, compared to fiscal year 2013 primarily due to favorable accident development. Insurance and related expenses represented 1.6% of our operating revenue for fiscal year 2014 and 2.0% of our operating revenue for fiscal year 2013. |
| • | Other general expenses for fiscal year 2014 were $94.1 million, a decrease of $0.3 million, or 0.3% compared to fiscal year 2013. Other general expenses represented 2.4% of our operating revenue for fiscal year 2014 and 2.6% of our operating revenue for fiscal year 2013. |
67
Table of Contents
Income from Operations
Income from operations for fiscal year 2014 was $239.4 million, an increase of $68.1 million, or 39.8%, compared to fiscal year 2013. Adjusted income from operations for fiscal year 2014 was $244.3 million, an increase of $70.1 million, or 40.2% compared to fiscal year 2013.
Interest and Taxes
| • | Interest expense—net for fiscal year 2014 was $11.7 million, a decrease of $2.2 million, or 15.4%, compared to fiscal year 2013. The decrease in interest expense—net was primarily due to lower interest rates associated with the Senior Notes. |
| • | Our effective tax rate for fiscal year 2014 was 40.9% compared to 39.0% for fiscal year 2013. The increase in effective tax rate was primarily related to the release of a capital loss valuation allowance in fiscal year 2013. Capital gains generated from the sale leaseback transactions allowed us to fully utilize capital losses generated in earlier years. |
Results of Operations—Reportable Segments
Truckload
Our truckload segment consists of freight transported and delivered with dry van and specialty equipment by company-employed drivers in company trucks and owner-operators. In addition to both long-haul and regional shipping services, our truckload services include team-based shipping for time-sensitive loads (utilizing dry van equipment) and bulk, temperature controlled, final mile “white glove” delivery and customized solutions for high-value and time-sensitive loads (utilizing specialty equipment). These services are executed through either for-hire or dedicated contracts. Our recent acquisitions of Watkins & Shepard and Lodeso have allowed us to rapidly expand our customized home, commercial and retail delivery offerings with “white glove” service for brick and mortar and e-commerce customers. Generally, our customers pay for our services based on the number of miles and for other ancillary services we provide. Fluctuations in North American activity, as well as changes in inventory levels, changes in shipper packaging methods that reduce volumes, specific customer demand, the level of capacity in the truckload industry, driver availability and modal shifts between truck and rail intermodal shipping affect trucking revenue. As of the end of fiscal year 2015, our truckload segment had approximately 11,300 trucks (both company and owner-operator), 28,500 dry vans and 5,000 specialty trailers. Revenue (excluding fuel surcharge) for the truckload segment in fiscal year 2015, consistent with how revenues are reported internally for segment purposes, was $1,977.0 million.
Intermodal
Our intermodal segment consists of door-to-door, container on flat car service by a combination of rail and over-the-road transportation, in conjunction with our rail carrier partners. Our intermodal service offers vast coverage within the United States and cross-border throughout North America. We generate intermodal segment revenue by hauling freight for our customers using our trucks and containers over-the-road and over-the-rail. Generally, our customers pay us per order, based on the number of miles and for other ancillary services we provide. The main factors that affect intermodal rail revenue are available containers, rail capacity and our revenue per order. Fluctuations in North American economic activity, as well as changes in inventory levels, changes in shipper packaging methods that reduce volumes, specific customer demand, the level of capacity in the intermodal industry and modal shifts between truck and rail intermodal shipping affect intermodal rail revenue.
As of the end of fiscal year 2015, our intermodal segment had approximately 1,300 trucks (primarily company), 17,400 containers and 4,900 company-owned chassis. Revenue (excluding fuel surcharge) for the intermodal segment in 2015, consistent with how revenues are reported internally for segment purposes, was $789.5 million.
68
Table of Contents
Logistics
Our logistics segment offers three services: brokerage, supply chain and import/export. We generate logistics segment brokerage services revenue by executing movement of freight for our customers using third-party equipment and authority. Generally, we generate supply chain services (including 3PL) revenue based upon either a flat amount per transaction or on consulting and management fees. We generate import/export services revenue based upon the number of orders handled and in some circumstances the time the product is stored in company-operated warehouses.
In fiscal year 2015, our logistics brokerage service executed approximately 328,000 orders, our supply chain service (including 3PL) operation managed approximately $1.6 billion of transportation spend on behalf of customers and our import/export services operation managed over 6.2 million square feet monthly. Revenue (excluding fuel surcharge) for the logistics segment in fiscal year 2015, consistent with how revenues are reported internally for segment purposes, was $638.6 million.
The following tables summarize, for the periods indicated, revenue and operating earnings by segment.
Revenue by Segment
| ($ in thousands) | Nine Months Ended September 30, |
Year Ended December 31, | ||||||||||||||||||
| 2016 | 2015 | 2015 | 2014 | 2013 | ||||||||||||||||
| Truckload |
$ | 1,550,992 | $ | 1,459,011 | $ | 1,976,970 | $ | 1,861,867 | $ | 1,743,781 | ||||||||||
| Intermodal |
559,654 | 577,708 | 789,521 | 722,724 | 665,067 | |||||||||||||||
| Logistics |
539,909 | 464,319 | 638,648 | 587,778 | 466,682 | |||||||||||||||
| Other |
171,611 | 196,694 | 255,455 | 233,324 | 145,489 | |||||||||||||||
| Fuel surcharge |
209,713 | 291,321 | 371,152 | 606,858 | 620,394 | |||||||||||||||
| Inter-segment eliminations |
(56,035 | ) | (56,178 | ) | (72,374 | ) | (71,975 | ) | (17,047 | ) | ||||||||||
|
|
|
|
|
|
|
|
|
|
|
|||||||||||
| Operating revenue |
$ | 2,975,844 | $ | 2,932,875 | $ | 3,959,372 | $ | 3,940,576 | $ | 3,624,366 | ||||||||||
|
|
|
|
|
|
|
|
|
|
|
|||||||||||
Operating Earnings by Segment
| ($ in thousands) | Nine Months Ended September 30, |
Year Ended December 31, | ||||||||||||||||||
| 2016 | 2015 | 2015 | 2014 | 2013 | ||||||||||||||||
| Truckload |
$ | 157,548 | $ | 146,111 | $ | 217,363 | $ | 201,612 | $ | 137,418 | ||||||||||
| Intermodal |
31,631 | 38,353 | 58,117 | 40,862 | 39,393 | |||||||||||||||
| Logistics |
21,687 | 16,533 | 25,455 | 18,127 | 13,554 | |||||||||||||||
| Other |
(8,397 | ) | (26,657 | ) | (40,695 | ) | (21,250 | ) | (19,116 | ) | ||||||||||
|
|
|
|
|
|
|
|
|
|
|
|||||||||||
| Income from operations |
$ | 202,469 | $ | 174,340 | $ | 260,240 | $ | 239,351 | $ | 171,249 | ||||||||||
|
|
|
|
|
|
|
|
|
|
|
|||||||||||
Nine Months Ended September 30, 2016 Compared to Nine Months Ended September 30, 2015
Truckload
Truckload segment revenue (excluding fuel surcharge) for the nine months ended September 30, 2016 was $1,551.0 million, an increase of $92.0 million, or 6.3%, compared to the nine months ended September 30, 2015. The increase in truckload segment revenue (excluding fuel surcharge) was primarily due to increased volume, primarily in our specialty business, and price. Revenue per truck per week was $3,444, a decrease of $34, or 1.0% compared to the nine months ended September 30, 2015.
69
Table of Contents
Truckload segment operating earnings for the nine months ended September 30, 2016 was $157.5 million, an increase of $11.4 million, or 7.8%, compared to the nine months ended September 30, 2015. The increase in truckload segment operating earnings was primarily due to revenue (excluding fuel surcharge) growth and improved variable cost performance, offset by increased equipment depreciation, lower gain on equipment sales and increased facility costs.
Intermodal
Intermodal segment revenue (excluding fuel surcharge) for the nine months ended September 30, 2016 was $559.7 million, a decrease of $18.1 million, or 3.1% compared to the nine months ended September 30, 2015. The decrease in intermodal segment revenue (excluding fuel surcharge) was primarily due to reduced volume and declining revenue per order due to the competitive market and the over-supply of truckload capacity.
Intermodal segment operating earnings for the nine months ended September 30, 2016 was $31.6 million, a decrease of $6.7 million, or 17.5%, compared to the nine months ended September 30, 2015. The decrease in intermodal segment operating earnings was primarily due to the decline in revenue (excluding fuel surcharge) and lower gains from equipment disposals, partially offset by lower equipment ownership costs.
Logistics
Logistics segment revenue (excluding fuel surcharge) for the nine months ended September 30, 2016 was $539.9 million, an increase of $75.6 million, or 16.3%, compared to the nine months ended September 30, 2015 primarily due to increased volumes in brokerage, supply chain services (including 3PL) and import/export services as measured by revenue (excluding fuel surcharge).
Logistics segment operating earnings for the nine months ended September 30, 2016 was $21.7 million, an increase of $5.2 million, or 31.2%, compared to the nine months ended September 30, 2015. The increase in logistics segment operating earnings was primarily due to the increase in revenue (excluding fuel surcharge) offset by increased facility costs.
Year Ended December 31, 2015 Compared to Year Ended December 31, 2014
Truckload
Truckload segment revenue (excluding fuel surcharge) for fiscal year 2015 was $1,977.0 million, an increase of $115.1 million or 6.2%, compared to fiscal year 2014 primarily due to increased prices, improvements in our revenue management and network capabilities and new business wins. Revenue per truck per week for fiscal year 2015 was $3,520 compared to $3,518 for fiscal year 2014.
Truckload segment operating earnings for fiscal year 2015 was $217.4 million, an increase of $15.8 million, or 7.8%, compared to the fiscal year 2014. The change was primarily due to the increase in revenue (excluding fuel surcharge) offset by increases in driver pay and recruiting costs related to addressing supply and demand imbalance and equipment costs due to truck growth and age-of-fleet reduction.
Intermodal
Intermodal segment revenue (excluding fuel surcharge) for fiscal year 2015 was $789.5 million, an increase of $66.8 million, or 9.2% compared to fiscal year 2014. Despite a challenging climate due to weather, port labor issues and plentiful over-the-road alternatives, intermodal segment orders for fiscal year 2015 were 386,929, an increase of 10,037, or 2.7% compared to fiscal year 2014. Revenue per order for fiscal year 2015 increased by $123, or 6.4%, compared to fiscal year 2014, due primarily to price increases.
70
Table of Contents
Intermodal segment operating earnings for fiscal year 2015 was $58.1 million, an increase of $17.3 million, or 42.2%, compared to fiscal year 2014 primarily due to increases in price and volume and a reduction in rail purchased transportation.
Logistics
Logistics segment revenue (excluding fuel surcharge) for fiscal year 2015 was $638.6 million, an increase of $50.9 million, or 8.7%, compared to fiscal year 2014 primarily due to volume increases in brokerage, supply chain services (including 3PL) and import/export services. Brokerage growth was driven by abundant capacity in the market, and supply chain services (including 3PL) and import/export services growth was driven by strong market demand and new customer business.
Logistics segment operating earnings for fiscal year 2015 was $25.5 million, an increase of $7.3 million, or 40.4%, compared to fiscal year 2014. The increase in logistics segment operating earnings was primarily due to growth in revenue (excluding fuel surcharge) and lower third-party carrier and warehouse costs.
Year Ended December 31, 2014 Compared to Year Ended December 31, 2013
Truckload
Truckload segment revenue (excluding fuel surcharge) for fiscal year 2014 was $1,861.9 million, an increase of $118.1 million, or 6.8%, primarily due to price increases, premium revenue opportunities, network efficiencies, a reduction in unbilled miles per load and trailer pool reductions due to customer upgrades. Revenue per truck per week for fiscal year 2014 was $3,518, an increase of $152, or 4.5%, compared to fiscal year 2013.
Truckload segment operating earnings for fiscal year 2014 was $201.6 million, an increase of $64.2 million, or 46.7%, compared to fiscal year 2013 primarily due to fuel and price strength, network efficiencies and reduction of unbilled miles per load offset by investments we made in our capacity in driver pay, benefits, and recruiting and investments we made in our equipment fleet to lower our average fleet age and lower gains from equipment disposals.
Intermodal
Intermodal segment revenue (excluding fuel surcharge) for fiscal year 2014 was $722.7 million, an increase of $57.7 million, or 8.7%, compared to fiscal year 2013. This increase was primarily due to price increases, a premium spot market and investments in intermodal equipment. Intermodal orders were 376,891, an increase of 16,341, or 4.5% compared to fiscal year 2013. Intermodal revenue per order for fiscal year 2014 increased $73 or 4.0% compared to fiscal year 2013.
Intermodal segment operating earnings for fiscal year 2014 was $40.9 million, an increase of $1.5 million, or 3.7%, compared to the fiscal year 2013. The impacts of adverse winter weather carried into 2014 and resulted in significant costs and missed revenue opportunities, coupled with declining fuel prices (which due to a lag in the fuel costs charged to us by railroads and rapidly falling fuel prices caused significant earnings pressure on our intermodal segment) and increased equipment ownership costs resulted in a modest improvement in operating earnings as compared to fiscal year 2013.
Logistics
Logistics segment revenue (excluding fuel surcharge) for fiscal year 2014 was $587.8 million, an increase of $121.1 million, or 25.9%, compared to fiscal year 2013. This increase was due primarily to improved demand and strong prices in our brokerage and supply chain (including 3PL) services.
71
Table of Contents
Logistics segment operating earnings for fiscal year 2014 was $18.1 million, an increase of $4.6 million, or 33.7%, compared to fiscal year 2013. The increase in logistics segment operating earnings was primarily due to tight carrier capacity, which resulted in favorable prices and significant premium revenue generation.
See the notes to our consolidated financial statements for additional information regarding our reportable segments.
Liquidity and Capital Resources
Our primary uses of cash are working capital requirements, capital expenditures and debt service requirements. Additionally, from time to time, we may use cash for acquisitions and other investing and financing activities. Working capital is required principally to ensure we are able to run the business and have sufficient funds to satisfy maturing short-term debt and upcoming operational expenses. Our capital expenditures consist primarily of transportation equipment and IT-related assets.
Historically, our primary source of liquidity has been cash flow from operations. In addition, we also have a $250 million revolving credit facility and a $200 million accounts receivable facility to provide us with an additional source of liquidity. We anticipate that cash generated from operations together with amounts available under our credit facilities will be sufficient to meet our future working capital requirements, capital expenditures and debt service obligations as they become due for the foreseeable future. To the extent additional funds are necessary to meet our long-term liquidity needs as we continue to execute our business strategy, we anticipate that they will be obtained through the incurrence of additional indebtedness, additional equity financings or a combination of these potential sources of funds. In the event that we need access to additional cash, we may not be able to access the credit markets on commercially acceptable terms or at all. Our ability to fund future operating expenses and capital expenditures and our ability to meet future debt service obligations or refinance our indebtedness will depend on our future operating performance, which will be affected by general economic, financial and other factors beyond our control, including those described under “Risk Factors.”
The following table presents, as of the dates indicated, our cash and cash equivalents and debt:
| ($ in thousands) | As of September 30, | As of December 31, | ||||||||||||||||||
| 2016 | 2015 | 2015 | 2014 | 2013 | ||||||||||||||||
| Cash and cash equivalents |
$ | 84,954 | $ | 131,551 | $ | 160,676 | $ | 149,885 | $ | 170,832 | ||||||||||
|
|
|
|
|
|
|
|
|
|
|
|||||||||||
| Debt: |
||||||||||||||||||||
| Senior Notes |
500,000 | 500,000 | 500,000 | 320,000 | 223,000 | |||||||||||||||
| Accounts Receivable Facility |
115,000 | — | 30,000 | 145,000 | 75,000 | |||||||||||||||
| Revolving Credit Facility |
— | — | — | 28,900 | — | |||||||||||||||
| Equipment Financing |
54,409 | — | — | — | — | |||||||||||||||
| Capital Leases |
19,369 | 17,819 | 16,932 | 20,451 | 23,918 | |||||||||||||||
| Subordinated Notes |
— | — | — | — | 57,546 | |||||||||||||||
|
|
|
|
|
|
|
|
|
|
|
|||||||||||
| Total debt |
$ | 688,778 | $ | 517,819 | $ | 546,932 | $ | 514,351 | $ | 379,464 | ||||||||||
We believe our liquid assets, cash generated from operations, and various financing arrangements will provide sufficient funds for our capital requirements for the foreseeable future.
Debt
Revolving Credit Facility
As of September 30, 2016, we had $246.4 million of unused availability (after giving effect to $3.6 million of outstanding letters of credit) under a revolving credit facility pursuant to a Credit Agreement, dated as of
72
Table of Contents
February 18, 2011 (as amended by the First Amendment to Credit Agreement dated as of November 21, 2013), among our subsidiary Schneider National Leasing, Inc. (as borrower), Schneider National, Inc. and certain of our subsidiaries (as guarantors), the lenders party thereto and JPMorgan Chase Bank, N.A., as administrative agent (the “Revolving Credit Facility”). The Revolving Credit Facility matures in November 2018. The Revolving Credit Facility allows us to request an increase in the total commitment by up to $150 million. The Revolving Credit Facility also provides a sublimit of $100 million to be used for the issuance of letters of credit. At September 30, 2016, standby letters of credit under the Revolving Credit Facility amounted to $3.6 million and were primarily related to real estate leases. The applicable interest rate under the Revolving Credit Facility is based on the Prime Rate, the Federal Funds Rate or LIBOR, depending upon the specific type of borrowing, plus an applicable margin based on the Consolidated Net Debt Coverage Ratio as of the end of each fiscal quarter. At September 30, 2016, we had no borrowings outstanding under the Revolving Credit Facility.
Senior Notes
As of September 30, 2016, we had the following series of senior notes outstanding:
| ($ in thousands) | Principal Outstanding |
Issuance Date |
Maturity Date |
Interest Rate | ||||||||||
| Senior Notes—2010 |
$ | 100,000 | May 7, 2010 | May 7, 2017 | 4.83% | |||||||||
| Senior Notes—2013 |
$ | 30,000 | September 25, 2013 | September 25, 2020 | 2.91% | |||||||||
| $ | 70,000 | September 25, 2013 | September 25, 2023 | 3.55% | ||||||||||
| Senior Notes—2014 |
$ | 40,000 | November 10, 2014 | November 10, 2019 | 2.76% | |||||||||
| $ | 40,000 | November 10, 2014 | November 10, 2021 | 3.25% | ||||||||||
| $ | 40,000 | November 10, 2014 | November 10, 2024 | 3.61% | ||||||||||
| Senior Notes—2015 |
$ | 25,000 | March 10, 2015 | March 10, 2020 | 2.86% | |||||||||
| $ | 60,000 | March 10, 2015 | March 10, 2022 | 3.35% | ||||||||||
| $ | 95,000 | March 10, 2015 | March 10, 2025 | 3.71% | ||||||||||
The senior notes were issued by Schneider National Leasing, Inc. and are guaranteed by the company and certain of our subsidiaries. The senior notes may be redeemed pursuant to make-whole provisions set forth in the applicable note purchase agreement.
Accounts Receivable Facility
As of September 30, 2016, we had unused availability of $85 million (after giving effect to $115 million of outstanding borrowings) under a secured credit facility pursuant to an Amended and Restated Receivables Purchase Agreement, dated as of December 17, 2013, among Schneider Receivables Corporation (as seller), Schneider National, Inc. (as servicer) and Wells Fargo Bank, N.A., as administrative agent and L/C issuer (the “Accounts Receivable Facility”). The Accounts Receivable Facility matures in December 2017. The terms of the Accounts Receivable Facility allow funds to be borrowed at rates based on the 30-day LIBOR. The Accounts Receivable Facility allows for the issuance of letters of credit. At September 30, 2016 we had $115 million of outstanding borrowings under the Accounts Receivable Facility. We issued $66.1 million in standby letters of credit under the Accounts Receivable Facility primarily related to insurance obligations.
Covenants
Our financing arrangements require us to maintain certain covenants and financial ratios. Our Revolving Credit Facility contains various financial and other covenants, including required minimum consolidated net worth, consolidated net debt, limitations on indebtedness, transactions with affiliates, shareholder debt and restricted payments. Our parent guaranty of the outstanding senior notes subjects us to various financial and other covenants, including a maximum ratio of consolidated adjusted debt to consolidated EBITDA, a minimum consolidated net worth, and limitations on liens, priority debt, asset sales and transactions with affiliates. In
73
Table of Contents
addition, our Revolving Credit Facility and senior notes contain change of control provisions pursuant to which a change of control is defined to mean the Schneider family no longer owns more than 50% of the combined voting power of our capital stock. As of September 30, 2016, we were in compliance with all covenants and financial ratios under the Revolving Credit Facility and the note purchase agreements governing the senior notes.
We intend to use the net proceeds of this offering for general corporate purposes, including potential acquisitions, repayment of indebtedness and capital expenditures. See “Use of Proceeds.”
We may from time to time seek to retire or purchase our outstanding debt through cash purchases, in open market purchases, privately negotiated transactions or otherwise. Such repurchases or exchanges, if any, will depend on prevailing market conditions, our liquidity requirements, contractual restrictions and other factors. The amounts involved may be material.
This summary of our credit facilities and other financing arrangements does not purport to be complete and is subject to and qualified in its entirety by reference to, the underlying agreements, which are filed as exhibits to the registration statement of which this prospectus is a part.
Capital Expenditures
The following table sets forth, for the dates indicated, our total capital expenditures. The sources of cash for such capital expenditures were primarily cash flows from operations and, to a lesser extent, working capital and borrowings.
| ($ in thousands) | Nine Months Ended September 30, |
Year Ended December 31, | ||||||||||||||||||
| 2016 | 2015 | 2015 | 2014 | 2013 | ||||||||||||||||
| Transportation equipment |
$ | 359,680 | $ | 332,729 | $ | 441,764 | $ | 463,795 | $ | 281,614 | ||||||||||
| Other property and equipment |
29,508 | 29,599 | 41,020 | 23,904 | 27,037 | |||||||||||||||
| Acquisition of businesses |
78,221 | — | — | — | — | |||||||||||||||
|
|
|
|
|
|
|
|
|
|
|
|||||||||||
| Total capital expenditures |
$ | 467,409 | $ | 362,328 | $ | 482,784 | $ | 487,699 | $ | 308,651 | ||||||||||
Cash Flows
The following table summarizes, for the periods indicated, the changes to our cash flows provided by (used in) operating, investing and financing activities. It has been derived from our financial statements included elsewhere in this prospectus:
| ($ in thousands) | Nine Months Ended September 30, |
Year Ended December 31, | ||||||||||||||||||
| 2016 | 2015 | 2015 | 2014 | 2013 | ||||||||||||||||
| Cash provided by (used in) operating activities |
$ | 317,496 | $ | 352,128 | $ | 485,557 | $ | 345,749 | $ | 278,283 | ||||||||||
| Cash provided by (used in) investing activities |
(442,030 | ) | (375,042 | ) | (483,302 | ) | (475,724 | ) | (270,463 | ) | ||||||||||
| Cash provided by (used in) financing activities |
48,812 | 4,580 | 8,536 | 109,028 | (7,210 | ) | ||||||||||||||
Nine Months Ended September 30, 2016 Compared to Nine Months Ended September 30, 2015
As of September 30, 2016, we had $85.0 million of cash and cash equivalents, a decrease of $46.6 million compared to September 30, 2015. The following discussion summarizes changes to our cash flows from operating, investing and financing activities for the nine months ended September 30, 2016 compared to the nine months ended September 30, 2015.
Operating Activities: For the nine months ended September 30, 2016, cash provided by operating activities was $317.5 million. Compared to the nine months ended September 30, 2015, the decrease of $34.6 million, or
74
Table of Contents
9.8%, was primarily due to increased working capital cash usage, primarily to pay taxes and litigation liabilities and increased trade accounts receivable offset by increased earnings and depreciation and the fluctuation of other working capital items.
Investing Activities: For the nine months ended September 30, 2016, cash used by investing activities was $442.0 million. Compared to the nine months ended September 30, 2015, the increase of $67.0 million, or 17.9%, was primarily due to the acquisition of Watkins & Shepard and Lodeso and an increase in equipment purchases offset by lower equipment lease receivables due to a reduced number of new leases.
Financing Activities: For the nine months ended September 30, 2016, cash provided by financing activities was $48.8 million. Compared to the million for the nine months ended September 30, 2015, the increase of $44.2 million primarily resulted from the debt assumed in the acquisition of Watkins & Shepard and Lodeso.
Year Ended December 31, 2015 Compared to Year Ended December 31, 2014
At December 31, 2015, we had $160.7 million of cash and cash equivalents, an increase of $10.8 million compared to December 31, 2014. The following discussion summarizes changes to our cash flows from operating, investing and financing activities for the year ended December 31, 2015 compared to the year ended December 31, 2014.
Operating Activities: For fiscal year 2015, cash provided by operating activities was $485.6 million. Compared to fiscal year 2014, the increase of $139.9 million, or 40.5%, was primarily due to increased net income, deferred taxes (primarily from accelerated tax depreciation on revenue equipment) and accounts payable and reduced accounts receivable (primarily from lower fuel surcharge receivables).
Investing Activities: For fiscal year 2015, cash used by investing activities was $483.3 million. Compared to fiscal year 2014, the increase of $7.6 million, or 1.6%, was primarily due to increased leased equipment receivables offset by increased proceeds from sale of property and equipment.
Financing Activities: For fiscal year 2015, cash provided by financing activities was $8.5 million. Compared to fiscal year 2014, the decrease of $100.5 million was primarily due to net repayments of our revolving credit facility driven by strong cash flows.
Year Ended December 31, 2014 Compared to Year Ended December 31, 2013
At December 31, 2014, we had $149.9 million of cash and cash equivalents, a decrease of $20.9 million compared to December 31, 2013. The following discussion summarizes changes to our cash flows from operating, investing and financing activities for the year ended December 31, 2014 compared to the year ended December 31, 2013.
Operating Activities: For fiscal year 2014, cash provided by operating activities was $345.7 million. Compared to fiscal year 2013, the increase of $67.4 million, or 24.2%, was primarily due to increased net income, depreciation and amortization (primarily on revenue equipment) offset by increased accounts receivable (primarily tied to revenue growth).
Investing Activities: For fiscal year 2014, cash used by investing activities was $475.7 million. Compared to fiscal year 2013, the increase of $205.2 million, or 75.9%, was primarily due to increased revenue equipment purchases, increased leased equipment receivables and lower proceeds received from the sale of equipment.
Financing Activities: For fiscal year 2014, cash provided by financing activities was $109.0 million. Compared to fiscal year 2013, the increase of $116.2 million was primarily due to additional borrowings to fund revenue equipment capital expenditures, investments in tractor leases to owner-operators, and working capital (primarily growth driven receivable increase).
75
Table of Contents
Contractual Obligations
We are committed to making cash payments in the future on long-term debt, capital leases, operating leases, and purchase commitments. We have not guaranteed the debt of any other party. The following table summarizes our contractual cash obligations as of December 31, 2015 for each of the periods indicated:
| Contractual Obligations ($ in thousands) |
Payments due by period | |||||||||||||||||||
| Total | Less than 1 year |
1-3 years | 3-5 years | More than 5 years |
||||||||||||||||
| Long-term debt obligations—principal |
$ | 500,000 | $ | — | $ | 140,000 | $ | 95,000 | $ | 265,000 | ||||||||||
| Long-term debt obligations—interest |
106,467 | 18,285 | 42,781 | 22,758 | 22,643 | |||||||||||||||
| AR securitization facility |
30,000 | — | 30,000 | — | — | |||||||||||||||
| Capital lease obligations—principal |
16,932 | 5,966 | 10,837 | 129 | — | |||||||||||||||
| Capital lease obligations—interest |
1,279 | 464 | 802 | 13 | — | |||||||||||||||
| Operating lease obligations |
88,927 | 38,225 | 42,718 | 5,751 | 2,233 | |||||||||||||||
| Purchase obligations |
188,907 | 188,907 | — | — | — | |||||||||||||||
| Other long-term liabilities |
— | — | — | — | — | |||||||||||||||
|
|
|
|
|
|
|
|
|
|
|
|||||||||||
| Total |
$ | 932,512 | $ | 251,847 | $ | 267,138 | $ | 123,651 | $ | 289,876 | ||||||||||
|
|
|
|
|
|
|
|
|
|
|
|||||||||||
The contractual obligations table is presented as of December 31, 2015. The amount of these obligations can be expected to change over time as new contracts are initiated and existing contracts are completed, terminated or modified.
Operating Leases
We have no off balance sheet arrangements other than our operating leases. Please see “—Cash Flows–Contractual Obligations.”
Quantitative and Qualitative Disclosures about Market Risk
We are exposed to market risk from changes in certain commodity prices, foreign currency exchange rates, and interest rates. All of these market risks arise in the normal course of business, as we do not engage in speculative trading activities. We have established policies, procedures and internal processes governing our management of market risk and the use of financial instruments to manage our exposure to such risk.
Commodity Risk
We have commodity exposure with respect to fuel used in company-owned tractors. Further increases in fuel prices will continue to raise our operating costs, even after applying fuel surcharge revenue. Historically, we have been able to recover a majority of fuel price increases from our customers in the form of fuel surcharges. The average diesel price per gallon in the United States, as reported by the Department of Energy, declined from an average of $2.80 per gallon for the nine months ended September 30, 2015 to an average of $2.25 per gallon for the nine months ended September 30, 2016. We cannot predict the extent or speed of potential changes in fuel price levels in the future, the degree to which the lag effect of our fuel surcharge programs will impact us as a result of the timing and magnitude of such changes, or the extent to which effective fuel surcharges can be maintained and collected to offset future increases. We generally have not used derivative financial instruments to hedge our fuel price exposure in the past, but continue to evaluate this possibility.
Interest Rate Risk
We had cash of $84,954 as of September 30, 2016, which consists of bank deposits with FDIC participating banks and investments of $43,297. The cash on deposit with banks is not susceptible to interest rate risk.
76
Table of Contents
U.S. agency obligations, certificates of deposit and Treasuries are classified as available for sale and carried at fair value, with any unrealized gains and losses, net of tax, included as a component of other comprehensive income (loss).
There were no identified events or changes in circumstances that had a significant adverse effect on the values of these investments. If there were evidence of a decline in value, which is other than temporary, the amounts would be written down to their estimated recoverable value.
We have interest rate exposure arising from our existing revolving credit facility and accounts receivable securitization facility, which have variable interest rates. These variable interest rates are impacted by changes in short-term interest rates. We manage interest rate exposure through a mix of variable rate debt, fixed rate senior debt, fixed rate financing, and fixed rate lease financing. At September 30, 2016, we had outstanding variable rate borrowings of $115,000 under the accounts receivable securitization facility which is subject to LIBOR interest rates. Assuming the current level of borrowing under this facility, a hypothetical one-percentage point increase in LIBOR rates would increase our annual interest expense by $1,150.
Inflation Risk
Inflation can have an impact on our operating costs. A prolonged period of inflation could cause interest rates, fuel, wages and other costs to increase, which would adversely affect our results of operations unless freight rates correspondingly increase. However, we do not believe that inflation has had a material effect on our business, financial condition or results of operations. If our costs were to become subject to significant inflationary pressures, we may not be able to fully offset such higher costs through price increases. Our inability or failure to do so could harm our business, financial condition and results of operations.
Foreign Exchange Risk
Although we conduct business in foreign countries, international operations are not material to our consolidated financial position, results of operations, or cash flows. Foreign currency transaction gains and losses have not been material to our results of operations. We are not currently subject to material foreign currency exchange rate risks from the effects that exchange rate movements of foreign currencies would have on our future costs or on future cash flows we would receive from our foreign investment. To date, we have not entered into any foreign currency forward exchange contracts or other derivative financial instruments to hedge the effects of adverse fluctuations in foreign currency exchange rates.
Critical Accounting Policies
The preparation of our financial statements in accordance with United States generally accepted accounting principles requires that management make estimates and assumptions that impact the amounts reported in our Consolidated Financial Statements and accompanying notes. Therefore, these estimates and assumptions affect reported amounts of assets, liabilities, revenue, expenses and associated disclosures of contingent liabilities. Management evaluates these estimates on an ongoing basis, utilizing historical experience, consultation with third parties and other methods considered reasonable in the particular circumstances. Nevertheless, actual results may differ significantly from our estimates. Any effects on our business, financial position or results of operations resulting from revisions to these estimates are recognized in the accounting period in which the facts that give rise to the revision become known. We consider our critical accounting policies and estimates to be those that require us to make more significant judgments and estimates when we prepare our financial statements and include the following:
Claims Accruals
Reserves are established based on estimated or expected losses for claims. The primary claims arising for the company consist of cargo liability, personal injury, property damage, collision, comprehensive, workers’
77
Table of Contents
compensation and associate medical expenses. We maintain self-insurance levels for these various areas of risk and have established reserves to cover these self-insured liabilities. We also maintain insurance to cover liabilities in excess of the self-insurance amounts. The reserves represent accruals for the estimated self-insured portion of pending claims, including adverse development of known claims, as well as incurred but not reported claims. Our estimates require judgments concerning the nature and severity of the claim, historical trends, advice from third-party administrators and insurers, consultation with actuarial experts, the specific facts of individual cases, the jurisdictions involved, estimates of future claims development and the legal and other costs to settle or defend the claims. The actual cost to settle our self-insured claim liabilities can differ from our reserve estimates because of a number of uncertainties, including the inherent difficulty in estimating the severity of a claim and the potential amount to defend and settle a claim. We have significant exposure to fluctuations in the number and severity of claims. If there is an increase in the frequency and severity of claims, or we are required to accrue or pay additional amounts if the claims prove to be more severe than originally assessed, or any of the claims would exceed the limits of our insurance coverage, our profitability would be adversely affected.
In addition to estimates within our self-insured retention, we also must make judgments concerning our coverage limits. If any claim were to exceed our coverage limits, we would have to accrue for the excess amount. Our critical estimates include evaluating whether a claim may exceed such limits and, if so, by how much. Currently, we are not aware of any such claims. If one or more claims were to exceed our effective coverage limits, our financial condition and results of operations could be materially and adversely affected.
Depreciation of Property and Equipment
We operate a significant number of trucks, trailers, containers, chassis and other equipment in connection with our business and must select estimated useful lives and salvage values for calculating depreciation. Property and equipment is stated at cost less accumulated depreciation. It is depreciated to an estimated salvage value using the straight-line method over the asset’s estimated useful life. Depreciable lives of revenue equipment range from 4 to 20 years and are based on historical experience, as well as future expectations regarding the period we expect to benefit from the assets and company policies around maintenance and asset replacement. Estimates of salvage value at the expected date of sale are based on the expected market values of equipment at the expected time of disposal. We consider our experience with similar assets, conditions in the used revenue equipment market and operational information such as average annual miles. We periodically review the reasonableness of our estimates regarding useful lives and salvage values of our revenue equipment and adjust these assumptions appropriately when warranted. We review our property and equipment whenever events or circumstances indicate the carrying amount of the asset may not be recoverable. An impairment loss equal to the excess of carrying amount over fair value would be recognized if the carrying amount of the asset is not recoverable.
Goodwill and Other Intangible Assets
To expand our business offerings, we have, on occasion, acquired other companies. In a business combination, the consideration is first assigned to identifiable assets and liabilities, including customer lists and earn-out contracts, based on estimated fair values, with any excess recorded as goodwill. Determining fair value requires significant estimates and assumptions based on an evaluation of a number of factors, such as marketplace participants, history and future expansion expectations, amount and timing of future cash flows and the discount rate applied to the cash flows.
Goodwill is not amortized and is assessed for impairment at least annually. Goodwill is evaluated using a two-step impairment test at the reporting unit level. A reporting unit can be a segment or business within a segment. The first step compares the carrying value of a reporting unit, including goodwill, with its fair value, as determined by its discounted cash flows. Discounted cash flows are primarily based on growth rates for sales and operating profit which are inputs from our annual long-range planning process. Additionally, they are also impacted by estimates of discount rates, perpetuity growth assumptions and other factors. If the carrying value of
78
Table of Contents
a reporting unit exceeds its fair value, we complete the second step to determine the amount of goodwill impairment loss that we should record, if any. In the second step, we determine an implied fair value of the reporting unit’s goodwill by allocating the fair value of the reporting unit to all of the assets and liabilities other than goodwill (including any unrecognized intangible assets). The amount of impairment loss is equal to the excess of the carrying value of the goodwill over the implied fair value of that goodwill.
Significant management judgment is necessary to evaluate the impact of operating and macroeconomic changes and to estimate future cash flows. Assumptions used in our impairment evaluations, such as forecasted growth rates and our cost of capital, are based on the best available market information and are consistent with our internal forecasts and operating plans. These assumptions could be adversely impacted by certain risks discussed in earlier in this document.
Income Taxes
We account for income taxes under the asset and liability method, in accordance with ASC 740-10, Income Taxes. We recognize deferred tax assets and liabilities for the future tax consequences attributable to differences between the financial statement carrying amounts of existing assets and liabilities and their respective tax bases. Significant management judgment is required in determining our provision for income taxes and in determining whether deferred tax assets will be realized in full or in part. We measure deferred tax assets and liabilities using enacted tax rates expected to apply to taxable income in the years in which those temporary differences are expected to be recovered or settled. If we ever estimated that it is more likely than not that all or some portion of specific deferred tax assets will not be realized, we must establish a valuation allowance for the amount of the deferred tax assets that are determined not to be realizable. Accordingly, if the facts or financial results were to change in such a way as to impact the likelihood of realizing the deferred tax assets, we would have to apply judgment to determine the amount of valuation allowance required in the appropriate period.
We recognize a liability from unrecognized tax benefits when the benefits of tax positions taken on a tax return are not more likely than not to be sustained upon examination, including resolutions of any related appeals or litigation processes, based on the technical merits. See Note 9, Income Taxes, to the audited consolidated financial statements included elsewhere in this prospectus for a discussion of our current tax contingencies.
79
Table of Contents
Company Overview
We are a leading transportation and logistics services company providing a broad portfolio of premier truckload, intermodal and logistics solutions and operating one of the largest for-hire trucking fleets in North America. We believe we have developed a differentiated business model that is difficult to replicate due to our scale, breadth of complementary service offerings and proprietary technology platform. Our highly flexible and balanced business combines asset-based truckload services with asset-light intermodal and non-asset logistics offerings, enabling us to serve our customers’ diverse transportation needs. Since our founding in 1935, we believe we have become an iconic and trusted brand within the transportation industry by adhering to a culture of safety “first and always” and upholding our responsibility to our associates, our customers and the communities that we serve.
We are the second largest truckload company in North America by revenue, one of the largest intermodal transportation providers in North America by revenue and an industry leader in specialty equipment services and e-commerce fulfillment. We categorize our operations into the following reportable segments:
| • | Truckload – which consists of freight transported and delivered with dry van and specialty equipment by our company-employed drivers in company trucks and by owner-operators. Our truckload services include standard long-haul and regional shipping services primarily utilizing dry van equipment and bulk, temperature controlled, final mile “white glove” delivery and customized solutions for high-value and time-sensitive loads. These services are executed through either for-hire or dedicated contracts. |
| • | Intermodal – which consists of door-to-door, container on flat car service by a combination of rail and over-the-road transportation, in association with our rail carrier partners. Our intermodal service offers vast coverage throughout North America, including cross-border freight through company containers and trucks. |
| • | Logistics – which consists of non-asset freight brokerage services, supply chain services (including 3PL) and import/export services. Our logistics business typically provides value-added services using third-party capacity, augmented by our assets, to manage and move our customers’ freight. |
In addition, we engage in equipment leasing to third parties through our wholly owned subsidiary Schneider Finance, Inc. (SFI), which is primarily engaged in leasing trucks to owner-operators, including owner-operators with whom we contract. We also provide insurance for both the company and owner-operators through our wholly owned insurance subsidiary and conduct limited China-based trucking operations consisting primarily of truck brokerage services.
Our portfolio consists of approximately 10,800 company and 2,800 owner-operator trucks, 38,400 trailers and 18,000 intermodal containers across North America and approximately 19,300 enterprise associates. We serve a diverse customer base across multiple industries and serve approximately 10,000 customers, including more than 200 Fortune 500 companies. Each day, our freight moves more than 8.8 million miles, equivalent to circling the globe approximately 350 times. Our logistics business manages over 20,000 qualified carrier relationships and, in 2015, managed approximately $2 billion of third-party freight. In addition, we have established a network of facilities across North America in order to maximize the geographic reach of our company trucks and owner-operators and provide maintenance services and personal amenities for our drivers. Our portfolio diversity, network density throughout North America and large fleet allow us to provide an exceptional level of service to our customers and consistently excel as a reliable partner, especially at times of peak demand.
80
Table of Contents
We believe we offer the broadest array of services in the transportation and logistics industries, ranging from dry van to bulk transport, intermodal to supply chain management and first to final mile “white glove” delivery. We believe we differentiate ourselves through expertise in services that utilize specialty equipment, which have high barriers to entry. With our recent acquisitions of Watkins & Shepard and Lodeso, we have established a national footprint and expertise in shipping difficult-to-handle consumer items, such as furniture, mattresses and other household goods, which are among the fastest-growing services in the e-commerce sector according to management estimates. Our comprehensive and integrated suite of industry leading service offerings allows us to better meet customer needs and capture a larger share of our customers’ transportation spend. Customers value our breadth of services, demonstrated by 22 of our top 25 customers utilizing services from all three of our reportable segments.
The following graphic demonstrates the breadth and diversity of our service offerings:
In 2007, we launched Quest, a multi-year, comprehensive business processes and technology transformation program, using technology from our strategic development partner, Oracle Corporation. As part of this transformation, we created a quote-to-cash technology platform, which we refer to as our Quest platform, that serves as the backbone of our business and seamlessly integrates all business lines and functions. Our state-of-the-art Quest platform allows us to make informed decisions at every level of our business, providing real-time data analytics to optimize network density and equipment utilization across our entire network, which drives better customer service, operational efficiency and load optimization. We also realigned our organization to give our associates a direct line of sight to profit-and-loss responsibility both within their business lines and across the organization. This organizational change combined with our Quest platform empowers our associates to proactively pursue business opportunities that enhance profitability while maintaining high levels of customer service. We believe our over $250 million investment in technology and our related organizational realignment over the past several years have enabled us to improve our profit margins and put us in a favorable position to expand our profit margins and continue growing our business.
81
Table of Contents
Since refocusing our strategy and initiating our Quest technology and business transformation in 2007, we have experienced strong revenue growth and margin expansion, which is demonstrated in the following table:
| (in thousands) | 2015 Fiscal Year | 3-Year CAGR(1) | ||||||
| Operating revenue |
$ | 3,959,372 | 4.3 | % | ||||
| Adjusted enterprise revenue (excluding fuel surcharge)(2) |
$ | 3,588,220 | 7.7 | % | ||||
| Net income |
$ | 140,932 | 27.1 | % | ||||
| Adjusted EBITDA(3) |
$ | 529,338 | 12.9 | % | ||||
| Adjusted net income(3) |
$ | 162,740 | 27.3 | % | ||||
| (1) | Three-year compound annual growth rate from January 1, 2013 through December 31, 2015. |
| (2) | Adjusted enterprise revenue (excluding fuel surcharge) is a non-GAAP financial measure. For a reconciliation of operating revenue, the most closely comparable GAAP measure, to adjusted enterprise revenue (excluding fuel surcharge), see “Management’s Discussion and Analysis of Financial Condition and Results of Operations—Results of Operations.” |
| (3) | Adjusted EBITDA and adjusted net income are non-GAAP financial measures. For a reconciliation of net income to adjusted EBITDA and adjusted net income, in each case for which net income is the most comparable GAAP measure, see “—Summary Historical Consolidated Financial and Other Data.” |
We were founded in 1935 by Al J. Schneider in Green Bay, Wisconsin, who sold the family car to buy the first truck for the business that would become Schneider. His son, Donald J. Schneider, followed in his father’s footsteps to become our chief executive officer, and began our expansion from a United States company to one with international reach. Our deeply-rooted culture embodies several core values that Al and Donald Schneider established:
| • | Safety First and Always: We have a responsibility to our associates, customers and the community to operate safely. Nothing we do is worth harming ourselves or others. |
| • | Integrity in Every Action: We do what we say. We conduct our business with the highest ethical standards. |
| • | Respect for All: We treat everyone with dignity and respect. We embrace diversity of thought, experience and background. |
| • | Excellence in What We Do: We do not stop until we have delivered a superior experience. We have a relentless passion for innovation and improvement. |
We put these values into practice through the Schneider “Value Triangle” of operational excellence. A guiding tenet of our business for over a decade, our “Value Triangle” provides a key reference for our associates to consider when making business decisions at each level of the company, including the needs of our customers, our associates and our business and its shareholders. We believe managing and balancing these often competing interests compels us to weigh the collective benefits to all of our stakeholders for every business decision.
82
Table of Contents
Industry and Competition
Truckload
Trucking is the primary means of serving the North American transportation market and hauls approximately 70% of freight volume within the United States, which is embodied in a common phrase used within our industry: “if you’ve got it—a truck brought it.” Trucking continues to attract shippers due to the mode’s cost advantages relative to air transportation and flexibility relative to rail. Truckload growth is largely tied to U.S. economic activity such as GDP growth and industrial production and moves in line with changes in sales, inventory and production within various sectors of the U.S. economy, including manufactured goods, construction products and bulk commodities. Truckload volumes are also positioned to benefit from secular trends in e-commerce retail, which is expected to grow at a 13% CAGR from 2014 to 2019 according to e-Marketer. Based on estimates by the ATA, the U.S. trucking industry generated approximately $726 billion in revenue in 2015 and is expected to grow at a CAGR of 4.8% from 2016 to 2022.
The U.S. truckload industry sector comprises the use of dry van and specialty equipment. Both dry van and specialty equipment are used to transport goods over a long-haul and on a regional basis. Dry van carriers represent an integral component of the transportation supply chain for most retail and manufactured goods in North America. Specialty carriers employ equipment such as flat-bed trucks, temperature controlled trailers, over-sized trailers and bulk transport, dump and waste equipment. These carriers can transport temperature controlled products and bulk commodities such as specialty chemicals and petrochemicals. Specialty equipment offering is characterized by higher equipment costs and more extensive driver training requirements relative to dry van offerings, resulting in higher barriers to entry and creating opportunities for differentiated value propositions for customers.
The U.S. truckload industry is large and fragmented, characterized by many small carriers with revenues of less than $1 million per year, less than 50 carriers with revenues exceeding $100 million per year and 10 carriers with revenues exceeding $1 billion per year, according to 2015 data published by Transport Topics, an ATA publication. According to Department of Transportation data, there were over 550,000 trucking companies in the United States at the end of 2015, approximately 90% of which owned 10 or fewer trucks. The 25 largest for-hire truckload carriers are estimated to comprise approximately 8% of the total for-hire truckload revenue, according to Transport Topics.
Regulations and initiatives to improve the safety of the U.S. trucking industry have impacted industry dynamics. We believe the recent trend is for industry regulation to become progressively more restrictive and complex, which constrains the overall supply of trucks and drivers in the industry. Examples of recently enacted and upcoming regulations and initiatives include the Comprehensive Safety Analysis (CSA) initiative (2010), Hours of Service (HOS) rules (2013) and mandatory use of electronic logging devices to enforce Hours of Service (HOS) rules (2015), hair follicle (2016) and sleep apnea screening (upcoming), installation of speed limiters (2016) and phase 2 emission standards (2016). We believe small carriers will likely be challenged to maintain the utilization required for acceptable profitability under this regulatory framework.
Domestic Intermodal
“Domestic” or “North American domestic” intermodal is the term used within the trucking industry to refer to intermodal operations within North America (such as a shipment by rail and by truck either all within the United States or from Canada, through the United States and into Mexico). Domestic intermodal transportation involves the transportation of freight in a 53-foot container or trailer, combining multiple modes of transportation (rail and truck) within the United States, Canada and Mexico. Eliminating the need for customers to directly handle freight when changing modes between rail and truck, intermodal transportation holds significant productivity, cost and fuel-efficiency advantages when moving mass freight. Containers are typically moved from truck onto rail and then back onto trucks before they reach their final destination. Domestic intermodal
83
Table of Contents
volumes are largely driven by over-the-road conversions from truckload to intermodal and from the volume of overseas imports into the United States, such as from China. Our management estimates the North American intermodal and drayage market to be $22 billion. According to AAR, intermodal has grown from 27% of all railcar loads in 1990 to 49% in 2015. Domestic intermodal accounts for 50% of total intermodal volume according to the IANA. With fuel costs likely to increase in the long-term, fuel efficiency regulations set to tighten and labor shortages in the trucking industry, the intermodal market is well-positioned to take on freight capacity as trucking markets face external pressures. The ATA estimates rail intermodal volumes will grow at 4.0% CAGR over the next five years.
The intermodal market is comprised of service providers of differing asset intensity, with customers being served by either non-asset intermodal marketing companies (IMCs) or asset-light network intermodal providers such as Schneider. While IMCs are the most prevalent intermodal solution provider, asset-light network intermodal providers offer differentiated higher-value solutions to customers given the reliability, geographic breadth and high service levels of company assets (trucks, containers and even chassis) compared to non-asset IMCs.
The domestic intermodal segment is highly consolidated, where the top three intermodal providers operate over 50% of the U.S. dry van domestic container fleet, according to management estimates. Network density, size and scale are critical barriers to entry in the intermodal market. Increasing sophistication and complexity of shippers’ needs require network density and the ability to deliver reliable capacity. According to AAR, railroads have been spending record amounts in recent years to maintain and improve their infrastructure and equipment, which we believe supports growth of the intermodal industry and improves the efficiency and reliability of the railroad component of our intermodal service.
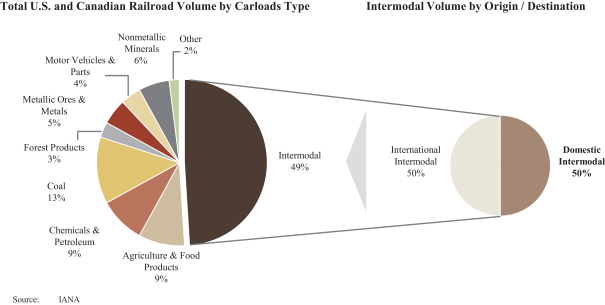
Logistics
The logistics industry is a large, fast-growing and fragmented market that represents an integral part of the global economy. Global trade has grown at twice the rate of global GDP over the last two decades. As supply chain complexity increases, corporations have elected to focus on innovation, design, sales and marketing of their products rather than supply chain operations. Increased material costs coupled with enhanced global competition impose margin pressure on manufacturers, requiring the outsourcing of noncore transportation logistics to supply
84
Table of Contents
chain specialists who offer a combination of scale, strong technology platforms and lower costs. Additionally, more shipments of inputs and products will be transported using multiple modes and technical expertise, driving shipper preferences for logistics providers with an asset-based network to complement their third-party capacity. Transportation asset owners often provide logistics services to meet excess demand and provide customers with greater breadth of services.
Our Competitive Strengths
We benefit from significant scale, as well as competitive margins and compelling returns on invested capital, in each of our three reportable segments. Our unique and balanced business mix as compared to our peers creates resiliency across business cycles. Specifically, we believe the following key strengths have been instrumental to our success and position us well to continue growing our business and market share:
Iconic large-scale diversified North American truckload provider with a modern fleet
Over the past 80 years, we have become one of North America’s largest and most trusted providers of truckload services, including specialty equipment services. We have established a leading position through our commitment to provide an outstanding level of customer service. In 2016 alone, we have received 17 awards from customers and the media in recognition of our exceptional service and reliability. We operate one of North America’s largest truckload fleets with approximately 12,000 trucks and 38,100 trailers used in our truckload business. Given our large scale, we offer both network density and broad geographic coverage to meet our customers’ transportation needs across North America. Our scale and strong balance sheet provides us with access to capital necessary to consistently invest in our capacity, technology and people to drive performance and growth, and to comply with regulations. Our scale also gives us significant purchasing benefits in third-party capacity, fuel, equipment and MRO (maintenance, repair and operations), lowering our costs compared to smaller competitors.
Over the past several years, we have made significant investments in safety-enhancing equipment and technology, including roll stability, collision avoidance, forward facing cab cameras, training simulators and real-time truck sensor monitoring. Our relentless focus on safety not only enables us to better uphold our responsibility towards our associates, customers and the community, but also provides a critical competitive advantage in an industry with increasingly stringent safety and regulatory requirements and results in lower operating risk and insurance costs. As we have modernized our fleet, the average age of our total truck fleet has decreased to 2.8 years over the last several years, with over-the-road sleeper cab tractors at an average age of approximately 2.5 years. Furthermore, in 2010, we were among the first large-scale carriers to fully equip our fleet with EOBRs, providing improved network management and safety. Unlike carriers that have yet to undertake the electronic logging device implementation process, we have significant experience operating with EOBRs and are well-positioned to benefit from the upcoming legislation on mandatory electronic logging device standards, which we expect will tighten truckload capacity and subsequently increase rates.
Industry leading and highly scalable Quest technology platform integrated across all business lines and functions
Our early investment and adoption of next generation technology and data analytics is a competitive advantage. We believe we are the only truckload and intermodal industry player of size to have completed and culturally adopted a comprehensive quote-to-cash technology transformation that allows us to efficiently match capacity with customer loads/orders. Our Quest platform allows us to assess our entire network every 90 seconds, resulting in real-time, round-the-clock visibility into every shipment and delivery, route schedules, truck and driver capacity and the profitability of each load/order. Our Quest platform enables us to minimize unbilled miles, optimize driver efficiency and improve safety, resulting in increased service levels and profitability. We manage the purchasing of nearly 500,000 gallons of fuel per day and communicate to our drivers optimal timing and locations for refueling through our Quest platform, which increases our fuel efficiency and lowers our fuel
85
Table of Contents
purchasing costs. We have become a pioneer in applying “decision science” technology to trucking and intermodal freight that enhances driver and asset efficiency, leading to higher profitability and driver satisfaction. We receive and process millions of driver and equipment location updates daily, allowing us to select the optimal driver, truck and trailer for each load/order. This has been a key driver of increased profitability per load and operating margin improvements over the last few years. We believe that our Quest technology and business transformation provides us with a clear advantage within the transportation industry from which we are continuing to realize the financial benefits.
Leadership in fast-growing e-commerce, final mile and other specialty equipment markets
Our recent acquisitions of Watkins & Shepard and Lodeso have allowed us to rapidly expand our customized home, commercial and retail delivery offerings with “white glove” service for brick and mortar and e-commerce customers. New components of our final mile services include real-time shipment tracking for customers and our proprietary Simplex technology, which integrates with retailers’ e-commerce infrastructure, providing seamless end-to-end solutions and visibility for complex final mile deliveries. E-commerce has increasingly become the preferred channel for purchasing difficult-to-handle items, such as furniture and mattresses, an area in which Watkins & Shepard and Lodeso specialize. Our expertise in this channel and national footprint in the final mile market positions us well to capitalize on this high-growth market opportunity that traditional less-than-truckload and package delivery operations generally cannot serve.
We have established a major nationwide presence in numerous specialty equipment freight markets with premium pricing and higher barriers to entry, including bulk chemicals, energy services and other specialty liquids. Our large specialty equipment asset base positions us to serve customers across the country, which differentiates us from most of our regional-based competitors and positions us well to take market share with large customers who value our geographic reach.
A leading intermodal business with built-in cost reductions through transition to a company-owned chassis model driving profitability
We are currently one of the largest intermodal providers in North America by revenue and are well-positioned for future growth in intermodal freight through our nationwide network and company container model. We focus on intermodal service as an alternative to placing additional trucks and drivers in lanes for which rail service otherwise provides competitive service or that are significantly longer in distance. Our long-standing railroad relationships with BNSF Railway, CSX Transportation, Canadian National Railway, Kansas City Southern Railway and other regional rail carriers, such as Florida East Coast Railway, provide rail access nationwide. In addition, we have a significant presence in the North American cross-border intermodal market, crossing a border with an intermodal load 120 times each day. Our customers value our intermodal network over IMCs due to our consistent access to capacity through our company assets and high-quality drayage services that provide a larger geographic reach around intermodal terminals. We are in the process of converting from our rented chassis model, where we pay a rental fee to use chassis owned by a third-party chassis rental company, to a company-owned chassis model. This conversion will lower our all-in chassis operating costs, improve service reliability, as well as increase driver efficiency and satisfaction, by increasing our control over the chassis operations of our intermodal business. We expect to complete our conversion to a company-owned chassis fleet by December 2017. We believe that our balanced network and large base of company assets provide a significant competitive advantage that would be difficult for other carriers to replicate.
Fast-growing non-asset logistics business expanding our customer base and complementing our asset-based network
Our non-asset logistics business represents our fastest-growing segment and complements our asset-based businesses with freight brokerage services and comprehensive supply chain management. In the three years from January 1, 2013, through December 31, 2015, our logistics segment operating revenue grew at a CAGR of 14%.
86
Table of Contents
Our logistics business not only provides additional services to existing customers and incremental freight to our assets, but helps to facilitate the expansion of our customer base and offers opportunities for cross-selling our suite of services. In 2015, our logistics business helped generate approximately $164 million in revenue for our truckload and intermodal segments. The scale of our asset-based network and our relationships with over 20,000 third-party carriers allow us to provide our brokerage and supply chain services (including 3PL) to our customers at competitive rates. By also offering warehousing, trans-loading and port drayage, we can provide customers with a suite of services that covers their entire North American transportation supply chain.
Diversified and resilient revenue mix supporting stable growth through business cycles
Our diverse portfolio of services, equipment, customers and end markets allows for resilient and consistent financial performance through all business cycles. We believe we offer the broadest portfolio of services in our industry, including in our truckload business, which consists of freight transported and delivered with dry van and specialty equipment by drivers in company trucks and by owner-operators. In addition to both long-haul and regional shipping services, our truckload services include team-based shipping for time-sensitive loads (utilizing dry van equipment) and bulk, temperature controlled, final mile “white glove” delivery and customized solutions for high-value and time-sensitive loads (utilizing specialty equipment). Our primarily asset-based truckload business is complemented by our asset-light intermodal and non-asset logistics businesses. Asset-based operations have the benefit of providing shippers with certainty of capacity and continuity of operations, while non-asset operations generally have lower capex requirements, higher returns on invested capital and lower fixed costs. We also manage a balanced mix of spot rates and contracted rates, through for-hire and dedicated contracts, to take advantage of freight rate increases in the short-term while benefiting from more resilient contracted revenue. Our dedicated contracts typically average three years in duration and provide us with greater revenue stability across economic cycles, promote customer loyalty and increase driver retention due to higher predictability in number of miles along familiar routes and time at home.
Our broad portfolio also limits our customer and industry concentration as compared to other carriers. We receive revenue from a diversified customer base with no single customer representing 10% or more of our revenue. The percentage of our revenue derived from our top ten customers has decreased by 800 basis points over the past five years. New business increased by approximately $300 million in 2015. We maintain a broad end-market footprint, encompassing over ten distinct industries including general merchandise, chemicals, electronics & appliances, and food & beverage, among others. Our diversified revenue mix and customer base drives stability throughout the fiscal year, even though many of our customers are affected by seasonal fluctuations. For example, our consumer goods and big box retail sales experience the greatest demand in the fourth quarter, whereas our food & beverage sales peak during the summer and the home improvement sales peak in spring and early summer, creating more balanced year-round demand. Our balanced revenue base allows for stable revenue and yield management through the fiscal year, allowing for more efficient seasonality management.
Proven and motivated management team with deep transportation industry expertise
We have a premier management team with extensive experience in the transportation and logistics industry, as well as a proven track record of success through various business environments. Our Chief Executive Officer and President, Christopher B. Lofgren, has over 22 years of experience at Schneider, a PhD in Industrial Engineering and is responsible for spearheading our Quest technology and business transformation. Our senior management team has spent on average over 14 years with Schneider and is composed of highly experienced transportation and logistics industry experts overseeing day-to-day operations. In their many years of collaboration, the management team has implemented strategic initiatives that have concentrated on increasing profitability and optimizing the portfolio of offerings, as well as leveraging technological innovation to manage revenue and drive horizontal integration across our reportable segments. Our management team’s compensation structure and ownership of common stock provide further incentive to improve business performance and profitability, aligning the senior team’s interests with our shareholders’. Our governance structure provides key independent oversight, complementing the strengths of the management team. A majority of the members of our
87
Table of Contents
Board of Directors are independent, a structure that has been in place since 1988. Our senior management team’s experience and commitment to upholding deeply-rooted values of safety, respect, integrity and excellence will continue to be critical to our future growth and performance. We believe our leadership team is well-positioned to execute our strategy and remains a key driver of our financial and operational success.
Our Growth Strategies
Our goals are to grow profitably, drive strong and consistent return on capital and increase stakeholder value. We believe our competitive strengths position us to pursue our goals through the following strategies:
Strengthen core operations to drive organic growth and maintain a leading market position
We intend to drive organic growth through leveraging our existing customer relationships, as well as expanding our customer base. With a broad, comprehensive service offering and a true North American footprint, we believe we have substantial cross-selling opportunities and the potential to capture a greater share of each customer’s annual transportation and logistics expenditures. We also plan to drive revenue growth by increasing market share amid a fragmented marketplace by marketing our services to customers seeking to outsource their transportation services. Our growth decisions are based on our “Value Triangle,” enabling us to grow sustainably and with balanced benefits for our three key stakeholders—our customers, our associates and our business and its shareholders. Our Quest platform serves as an instrumental factor in driving profitable growth from both new and existing customers as it enables real-time, data-driven decision support and business analysis of every load/order, assisting our associates in proactively cross-selling our broad suite of offerings. Together with our highly incentivized and proactive sales organization, our data-driven Quest platform will drive better service and organic growth in each of our reportable segments.
Expand capabilities in specialty equipment freight market and continue growing our freight brokerage business
We believe that our capabilities position us to grow in the specialty equipment market, which enjoys higher barriers to entry and a premium to conventional dry van pricing. The specialty equipment freight market represents a large addressable market within the truckload segment, comprising 62% of U.S. truckload revenue in 2015 according to Transportation Economics. The complexity and time-sensitivity of the loads often require enhanced collaboration with, and greater understanding of, our customers’ business needs and processes. The transportation of specialty equipment freight requires specially trained drivers with appropriate licenses and special hauling permits, as well as equipment that can handle items with unique requirements in terms of temperature, freight treatment, size and shape. As such, there are few carriers that have comparable network scale and capabilities in the specialty equipment market, which we believe will allow us to profitably grow in that segment.
Freight brokerage is another business where we have seen strong recent growth and expect to continue growing. The growth of our freight brokerage business, which is a significant part of our logistics segment, contributed to the growth of our logistics segment operating revenue, which grew at a CAGR of 14%, in the three years from January 1, 2013 through December 31, 2015. As shippers increasingly consolidate their business with fewer freight brokers, we are well-positioned to become one of their select providers due to our customer service and established, dense network of third-party carriers. Large shippers in particular see the value of working with providers like us that have scale, capacity and lane density, as they are more reliable, efficient and cost effective at covering loads. Our freight brokerage business provides us with the opportunity to serve our customers more broadly where we might not otherwise serve them, building diversity and resiliency in our existing customer portfolio in a non-asset manner with minimal capital deployment.
Capitalize on the growth of e-commerce fulfillment
As a leading “first, final and every mile” carrier for difficult-to-handle consumer items, such as furniture and mattresses, one of the fastest-growing e-commerce markets, we are well-positioned to capitalize on continued e-commerce growth. According to e-Marketer, the e-commerce industry is set to grow at four times the
88
Table of Contents
rate of traditional retail in North America (13% vs. 3% 2014-2019 CAGR) and is anticipated to reach 13% of total retail sales worldwide by 2019 (up from 6% in 2014). We provide services for many online retailers, offering first-to-final mile delivery from warehouses to consumer living rooms. Unlike many competitors, we have the technological capability, national footprint and the ability to utilize team driver capacity to provide network breadth and density to meet growing e-commerce fulfillment needs. We intend to leverage our end-market expertise, leading technology platform and end-to-end integrated capabilities to continue taking the complexity out of the supply chain for omni-channel retailers and manufacturers, further driving our revenue in the fast-growing e-commerce market.
Continue to improve our operations and margins by leveraging benefits from recent investments in our Quest technology and business transformation
We continue to benefit from our Quest technology and business transformation by improving the effectiveness with which we utilize data to increase revenue and lower costs. Full visibility into each driver’s profile allows us to increase associate satisfaction and retention by matching drivers to loads and routes that better fit their individual needs. We are able to better service customers, retain drivers and generate repeat business by anticipating our customers’ and drivers’ needs and preferences. We believe the future implementation of simple and intuitive customer interfaces will also enable a stronger connection with our customers through increased interaction and an enhanced user experience. We expect additional margin improvement as we continue to leverage data analytics within the Quest platform. The strong foundation we have established with our continuing Quest transformation will allow us to incorporate new technologies and build new capabilities into the platform over time, maintaining our competitive edge and setting the base for future growth.
Allocate capital across businesses to maximize return on capital, and selectively pursue opportunistic acquisitions
Our broad suite of services provides us with a greater opportunity to allocate growth capital in a manner that maximizes returns throughout the seasonal and economic business cycles. For example, we can efficiently move our equipment between services and regions when we see opportunities to maximize our return on capital. We continually monitor our performance to ensure appropriate allocation of capital and resources to grow our businesses while optimizing returns across reportable segments. Furthermore, our strong balance sheet enables us to selectively pursue opportunistic acquisitions that complement our current portfolio. We are positioned to leverage our scalable platform and experienced operations team to acquire high-quality businesses that meet our disciplined selection criteria in order to expand our service offerings and customer base.
Attract and retain top talent at all levels to ensure sustainable growth
Our people are our strongest assets, and we believe they are key to growing our customer base and driving our performance. Our goal is to attract, retain and develop the best talent in the industry across all levels. We strive to foster a collaborative environment and seek individuals who are passionate about our business and fit within our culture. We value the direct relationships we have with our associates and we intend to continue working together without third-party representation. Our compensation structure is performance-based and aligned with our strategic objectives. Amid today’s driver shortage environment, we seek to maintain our reputation as a preferred carrier within the driver community. Our culture, which from its founding was focused on the well-being of our associates, helps us attract and retain high quality drivers. In addition to mandatory physical check-ups, covering among other things sleep apnea, we enforce hair follicle drug testing alongside mandatory urine testing and invest in the well-being of our drivers, which we believe helps us maintain a high quality driver base. Our leading technology platform facilitates the application, screening and onboarding of top talent. As a stable industry leader with a respected safety culture and underlying core values, we believe that we will continue to be the employer of choice for both driving and non-driving associates.
89
Table of Contents
Customers
We offer our services to approximately 10,000 customers across our portfolio, including more than 200 Fortune 500 companies. Our top 10 customers include Family Dollar, Ford Motor Co, Georgia Pacific, Home Depot, Kimberly Clark, Lowes Home Centers, PEPSICO Inc., Proctor & Gamble, Target Stores and Wal Mart. For the past five years, we have been focused on broadening our customer base to reduce exposure to a single customer by growing our small and medium shipper base. We believe a broader customer base promotes resilience in all market conditions, since it increases the likelihood that any weakness that affects a specific customer or customer industry will be mitigated by our exposure to customers in industries not affected by the same weakness. Moreover, different types of customers mitigate seasonal volatility. For example, our big box retailer and consumer goods manufacturer sales experience the greatest demand in the fourth quarter, whereas our food and beverage sales peak during the summer and the home improvement sales peak in spring and early summer, creating more balanced year-round demand.
Our brokerage business has approximately 165 inside sales representatives that primarily conduct business telephonically rather than in person, which promotes our effort to expand beyond our legacy relationships with large shippers by developing relationships with smaller shippers. Inside sales representatives are able to contact a greater number of shippers at a lower cost than other sales representatives, increasing the efficiency of our outreach to smaller shipping customers. They also may generate leads for the rest of our sales force. This broadens our customer base and provides a solid source of incremental prospects for the enterprise. With a broad, comprehensive service offering and a true North American footprint, we believe we have substantial cross-selling opportunities and the potential to capture a greater share of each customer’s annual transportation and logistics expenditures.
We believe our customer base represents a wide cross-section of industries with truckload needs. By diversifying our customer portfolio to include accelerated growth of the small and medium sized shipper, we have been reducing our dependence on big box retailers and consumer goods manufacturers whose truckload activity is disproportionately concentrated in the fourth quarter of each calendar year. Food and beverage is now a larger part of our customer portfolio. Peak activity for those shippers typically is higher earlier in the calendar year, which we believe balances the impact of seasonality on our business.
Reportable Segments
We categorize our operations into truckload, intermodal and logistics segments.
Truckload Segment
We are the second largest truckload carrier in North America by revenue. Our truckload segment consists of freight transported and delivered with dry van and specialty equipment by company-employed drivers in company trucks and owner-operators. In addition to both long-haul and regional shipping services, our truckload services include team-based shipping for time-sensitive loads (utilizing dry van equipment) and bulk, final mile “white glove” delivery and customized solutions for high-value and time-sensitive loads (utilizing specialty equipment). The principal types of freight we transport include retail store merchandise, consumer products, grocery products, perishables, food and beverage, bulk chemicals and manufactured products. We focus on transporting consumer nondurable products that generally ship more consistently throughout the year and whose volumes are generally more stable during a slowdown in the economy. We generate truckload segment revenue by hauling freight for our customers using our trucks or owner-operators’ equipment.
Our truckload services are executed through either for-hire or dedicated contracts. Generally, for-hire services are contracted on a spot rate basis and/or lane based contract pricing which tend to be for a short duration. Dedicated contracts, which are typically three years in duration, are those contracts in which we have agreed to assign specific truck and trailer capacity for use by a specific customer. Dedicated contracts often have predictable routes and revenue, are attractive to drivers, and frequently replace all or part of a shipper’s private fleet.
90
Table of Contents
Generally, our customers pay for our services based on the number of miles and for other ancillary services we provide. Our truckload segment operates within the United States and Canada, and cross-border with both Canada and Mexico. The graphic below illustrates our service offerings categorized according to trailing equipment and contract type.
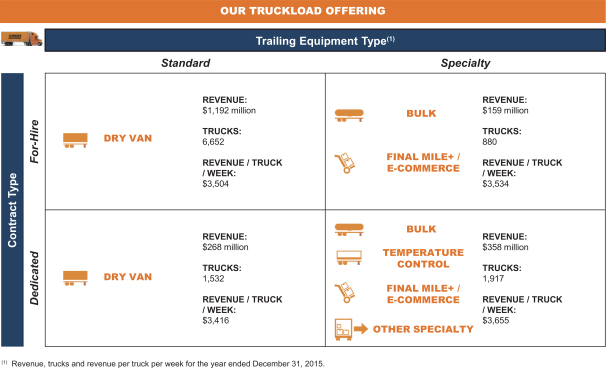
Our specialty equipment fleet is employed on both for-hire and dedicated contracts. The majority of our specialty trailer fleet is assigned to solve a specific supply chain problem for a specific customer under a dedicated contract.
Intermodal Segment
We are one of the largest intermodal providers in North America. Our intermodal segment accounted for 23% of our revenue for the year ended December 31, 2015, and consists of door-to-door, container on flat car service by a combination of rail and over-the-road transportation, in conjunction with our rail carrier partners. Our intermodal service offers vast coverage throughout North America, including Transcontinental, Eastern Core and North American Cross-Border.
Our intermodal segment consists of over-the-road drayage and over-the-rail mixed mode operations with primarily a company container and truck fleet. Intermodal relies on rail carriers for the line haul movement of its containers and freight between rail ramps. Key railroad relationships include the BNSF Railway, CSX Transportation, Canadian National Railway, Kansas City Southern Railway and other regional rail carriers, such as Florida East Coast Railway. Our company trucks accomplish the origin and destination pickup and delivery services for the majority of our intermodal loads, while we use third-party dray carriers where economical or necessary.
The majority of drayage for our intermodal shipments is provided by a company fleet of approximately 1,300 trucks. We are in the process of converting our rented chassis to a lower cost, more reliable company-owned chassis. This will improve customer service and driver satisfaction, and we estimate that it will lower our chassis cost by approximately 55% when fully converted at the end of 2017. The combination of company driver dray, owned containers and owned chassis positions our intermodal business for industry leading reliability and service.
91
Table of Contents
Generally, our intermodal services serve the same customer bases as our van truckload service. Customers choose intermodal when the time sensitivity of a shipment is relatively low, allowing them to take advantage of less expensive rail shipments that typically operate on a slower timeframe than truckloads. As the electronic logging device mandate and other regulatory changes put pressure on truckload capacity, intermodal will continue to be an attractive alternative. The graphic below illustrates our nationwide network of relationships with major railroads, which we believe positions our intermodal segment to take advantage of this trend of customers choosing intermodal service when the lead time of a shipment is adequate.
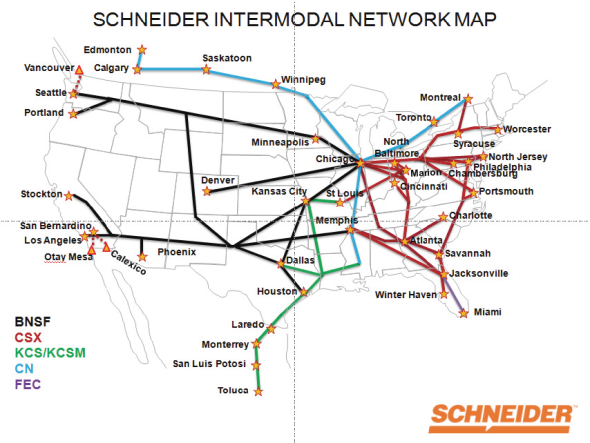
Logistics Segment
Our logistics segment offers three services: brokerage, supply chain (including 3PL) and import/export. Revenue (excluding fuel surcharge) for our logistics business has grown at 14%, compounded annually from January 1, 2013, through December 31, 2015. Additionally, our logistics business generated approximately $164 million of intercompany freight revenue in the year ended December 31, 2015, providing incremental growth to our portfolio of service offerings.
Our brokerage services use contracted carriers to complete customer shipments and delivers loads anywhere within the United States, Canada and Mexico. Our brokerage offering leverages relationships with over 20,000 other carriers across the truckload, less-than-truckload and intermodal segments of the transportation industry. Our brokerage business assists customers in contracting with these carriers to ship a single load or multiple loads, and also assists customers in extraordinary transportation projects using shipping transactions brokered for these customers. We generate brokerage services revenue by executing movement of freight for our customers using third-party equipment and authority. Fuel surcharge revenue is not recorded for our brokerage operation.
92
Table of Contents
Our supply chain services consist of a full range of single-source logistics management services and solutions, including supply chain design and optimization and coordinates suppliers for inbound transportation to customer’s supply chains. Generally, we generate supply chain services (including 3PL) revenue either based upon a flat amount per load or as consulting fees. We provide supply chain consulting and third-party logistics outsourced management for all or a portion of a customer’s supply chains. As a third-party logistics provider we leverage over 20,000 carriers.
Import/export services leverage 6.2 million square feet of warehouse space to provide value-added services immediately after shipments arrive in the United States, including trans-loading and warehousing, re-labeling, kitting, pick and pack assembly and inspection. A port drayage fleet of over 200 owner-operators ensures that product moves from the port to the warehouse timely and in good condition. Port business revenue is generated based upon the number of cases handled and, in some situations, the time the product is stored in company-leased warehouses.
Other
Not included in our three reportable segments is equipment leasing by SFI to third parties (primarily trucks to owner-operators) and our captive insurance business, which also provides insurance for both the company and owner-operators. It also includes limited China-based trucking operations consisting primarily of truck brokerage services.
Equipment
We operate a modern truck fleet to help attract and retain drivers, promote safe operations and reduce maintenance and repair costs. We use a level buy strategy for the tractor fleet in order to optimize total cost of ownership. The fleet is comprised of over-the-road sleeper cab tractors (approximately 85% of the fleet) and other trucks including day cab tractors (approximately 15% of the fleet). The over-the-road fleet is managed to a 5 year trade cycle, with the current average age-of-fleet of our sleeper cab tractors at approximately 2.5 years. The day-cab fleet is managed to an 8 year trade cycle and the current age-of-fleet is 4.1 years. The average age-of-fleet for the entire truck fleet is 2.8 years.
We own and lease the trucks in our company fleet. Owner-operators use their own equipment, although they may lease it from us through SFI. The table below shows the model year of our owned and leased company trucks, trailers, containers and chassis as of September 30, 2016.
| Model Year |
Trucks | Trailers | Containers | Chassis | ||||||||||||
| 2017 |
1,629 | 5,222 | 253 | 18 | ||||||||||||
| 2016 |
2,601 | 4,094 | 1,133 | 1,500 | ||||||||||||
| 2015 |
1,969 | 5,066 | 3,679 | 3,088 | ||||||||||||
| 2014 and prior |
4,584 | 23,990 | 12,932 | 847 | ||||||||||||
|
|
|
|
|
|
|
|
|
|||||||||
| Total |
10,783 | 38,372 | 17,997 | 5,453 | ||||||||||||
Employees
As of September 30, 2016, we employed approximately 19,300 persons, approximately 62% of whom are drivers and 38% of whom are managers, support personnel and other corporate office employees. Approximately 14% of our associates are based in our headquarters in Brown County, Wisconsin. We have not experienced any work stoppages and consider our associate relations to be good. Currently thirteen of our company drivers are members of an organized labor union, as a result of a commitment we made in the 1980s to allow this group of drivers to finish their careers at Schneider while remaining union members. None of our other associates are represented by a labor union.
93
Table of Contents
Owner-Operators
In addition to the company drivers that we employ, we enter into contracts with owner-operators. Owner-operators are small business owners who operate their own trucks (although some may employ drivers that they hire) and provide us with services under a contractual arrangement whereby they are generally responsible for the ownership and operating expenses and are generally compensated on a percentage of revenue basis. Owner-operators select their own load assignments and are in control of their schedule.
Owner-operators represented approximately 20% of all trucks in our truckload fleet as of September 30, 2016. By operating safely and productively, owner-operators can improve their own profitability and ours. Owner-operators tend to be experienced business owners that share the same incentives to be safe and productive as the company.
We offer owner-operators the opportunity to purchase trucks from us, and sometimes provide financing to owner-operators for these purchases. We offer owner-operators various operating arrangements that we believe strengthen our position as a strategic partner with these owner-operators, including self-dispatch, percentage of revenue settlement and truck financing. We believe these offerings are unique in our industry and position us as a preferred partner for owner-operators.
Safety
“Safety first and always” is a Schneider core value. We believe we have a responsibility to our associates, customers and the community to operate safely. Our safety culture is built on five key components.
| • | Driver hiring and drug testing. We complement our comprehensive driver hiring with physical testing. We voluntarily choose to use hair follicle testing in addition to urine-based drug testing. While costing more per driver, hair follicle testing is generally more accurate than the alternative. |
| • | Military drivers. We have a strong relationship with the United States military, and were voted most valuable military employer in 2014 and 2015. Military experience produces quality truck drivers due to the discipline instilled through the military training programs. We currently employ approximately 2,100 former military drivers, representing 18.6% of our drivers. |
| • | Training. Initial training is complemented by regularly scheduled follow-up training to sustain and enhance basic skills. We hire both experienced drivers and drivers new to the industry. We operate 17 company-sponsored driver training facilities. Additional training investments include 34 training simulators used for both initial and sustainment training. |
| • | Equipment and technology We invest in trucks that are configured with roll stability capability, proprietary collision mitigation and forward facing cameras. Driving behavior is electronically monitored, alerts are provided to the driver situationally and performance is documented for subsequent coaching. We employ electronic logging, which ensures Hours of Service (HOS) compliance and reduces the instance of fatigue. |
| • | Active management. Driver leaders and safety coordinators have real-time access to activity in the truck, facilitating situational and scheduled coaching. We have invested in predictive analytics that assist in proactively identifying drivers with potential safety issues and recommending a remediation path. |
Truckload carriers share safety performance information in monitored peer to peer forums. These comparisons show that we are one of the safest truckload carriers on the road today. We have, and have always maintained, a satisfactory DOT safety rating, which is the highest available rating.
94
Table of Contents
Fuel
We actively manage our fuel purchasing network in an effort to maintain adequate fuel supplies. In 2015, we purchased 127.3 million gallons of fuel, 98% of which were through negotiated volume purchase discounts. We minimize our fuel cost by providing our drivers with location and quantity specific fueling instructions as a part of their work assignment, which is facilitated by our Quest platform. We store fuel in underground storage tanks at 11 locations and at above ground storage tanks at 13 locations. We believe that we are in substantive compliance with applicable environmental laws relating to the storage of fuel.
Shortage of fuel, increases in fuel prices or rationing of petroleum products could have a material adverse effect on our operations and profitability. In response to increases in fuel costs we use fuel surcharge programs with our customers to pass on the majority of increase in fuel costs to our customers. We believe that the most cost effective protection against fuel cost increase is to continue the fuel surcharge programs and to invest in a fuel efficient fleet. To that end, we leverage fuel consumption metrics in driver evaluation. However, fuel surcharges may not adequately cover potential future increases in fuel prices.
Regulation
Industry Regulation
Our operations are regulated and licensed by various agencies in the United States, Mexico and Canada. Our company drivers and owner-operators must comply with the safety and fitness regulations of the DOT, including those relating to drug and alcohol testing and Hours of Service (HOS). Weight and equipment dimensions are also subject to government regulations. Other agencies, such as the EPA and Department of Homeland Security, also regulate equipment. We believe regulation in the transportation industry may become progressively more restrictive and complex. The following discussion presents recently enacted federal, state and local regulations that have an impact on our operations.
Hours of Service
In December 2011, the FMCSA released its final Hours of Service (HOS) rule, which was effective on July 1, 2013. The key provisions included:
| • | retaining the current 11-hour daily driving time limit; |
| • | reducing the maximum number of hours a truck driver can work within a week from 82 hours to 70 hours; and |
| • | limiting the number of consecutive driving hours a truck driver can work to eight hours before requiring the driver to take a 30 minute break. |
In 2013, we experienced some negative impact on our productivity as a result of the above. However, since then, we have raised our productivity levels while maintaining compliance.
Since 2004, the Hours of Service (HOS) rules allowed drivers to restart their duty-cycle clocks every 34 hours to begin a new work week. From July 2013 through December 2014, as a result of the final rule on Hours of Service (HOS), the FMCSA required that drivers include 1:00 a.m. to 5:00 a.m. on consecutive days before applying the restart, which was also capped at once per week, or 168 hours. On December 13, 2014, Congress passed the fiscal year 2015 Omnibus Appropriations bill, which temporarily suspended enforcement of the 1:00 a.m. to 5:00 am provision and the 168-hour rule until September 30, 2015. The restart provision was again suspended on December 18, 2015, when Congress passed the fiscal year 2016 Omnibus Appropriations bill. All other provisions of the Hours of Service (HOS) rules that went into effect on July 1, 2013 remained unchanged. A study on the effectiveness of the suspended restart provisions was recently completed. The FMCSA could move to reinstate these provisions or request that Congress remove the suspension. We continue to evaluate and adjust the various segments of our operations toward the ultimate impact of these changes in Hours of Service (HOS) safety requirements.
95
Table of Contents
BASICs
In December 2010, the FMCSA introduced a new enforcement and compliance model that ranks both fleets and individual drivers on seven categories of safety-related data, eventually replacing the current SafeStat model. The seven categories of safety-related data, known as BASICs, currently include Unsafe Driving, Fatigued Driving (Hours of Service), Driver Fitness, Controlled Substances/Alcohol, Vehicle Maintenance, Hazardous Materials Compliance and Crash Indicator.
Certain BASICs information was initially published and made available to carriers, as well as the general public. However, in December 2015, as part of the Fixing America’s Surface Transportation (FAST) Act, Congress mandated that the FMCSA remove all CSA scores from public view until a more comprehensive study regarding the effectiveness of BASICs improving truck safety can be completed.
Implementation and effective dates are unclear, as there is currently no proposed rulemaking with respect to BASICs, leaving SafeStat the authoritative safety measurement system in effect. We currently have a satisfactory SafeStat DOT rating, which is the best available rating under the current safety rating scale.
Safety Fitness Determination
In January 2016, the FMCSA published a Notice of Proposed Rulemaking (“NPRM”) in the Federal Register, regarding carrier safety fitness determination. The NPRM proposes new methodologies that would determine when a motor carrier is not fit to operate a controlled motor vehicle. Key proposed changes included in the NPRM are as follows:
| • | There would be only one safety rating of “unfit,” as compared to the current rules, which have three safety ratings (satisfactory, conditional and unsatisfactory). |
| • | Carriers could be determined “unfit” by failing two or more BASICs, investigation results or a combination of the two. |
| • | Stricter standards would be used for BASICs with a higher correlation to crash risk (Unsafe Driving and Hours of Service (HOS) Compliance). |
| • | All investigation results would be used, not just results from comprehensive on-site reviews. |
| • | Violations of a revised list of “critical” and “acute” safety regulations would result in failing a BASIC. |
| • | Carriers would be assessed monthly. |
The FMCSA estimates that the proposed rule would increase the number of carriers determined to be “unfit” by more than two and a half times.
Moving Ahead for Progress in the 21st Century Bill
On July 6, 2012, Congress passed the Moving Ahead for Progress in the 21st Century bill into law. Included in the highway bill was a provision that mandates electronic logging devices in commercial motor vehicles to record Hours of Service (HOS). During 2012, the FMCSA published a Supplemental NPRM, announcing its plan to proceed with the electronic logging device and Hours of Service (HOS) supporting documents rulemaking. In December 2015, the electronic logging device rule became final, as published in the Federal Register. Although the final electronic logging device rule may have a large impact on the industry as a whole, we do not expect a significant impact on us, as we previously installed EOBRs in our operational trucks in conjunction with our efforts to improve efficiency and communications with drivers and owner-operators. Our EOBRs comply with current electronic logging device rules and we expect that by 2019, the deadline for us to comply with new electronic logging device rules, we will remain in compliance.
96
Table of Contents
Prohibiting Coercion of Commercial Motor Vehicle Drivers
In November 2015, the Prohibiting Coercion of Commercial Motor Vehicle Drivers rule became final, as published in the Federal Register and adopted by the FMCSA. The rule explicitly prohibits motor carriers, among other parties in the supply chain, from coercing drivers to violate certain FMCSA regulations, including driver Hours of Service (HOS) limits, commercial drivers license regulations, drug and alcohol testing rules and hazardous materials regulations, among others. Under the new rule, drivers can report incidents of coercion to the FMCSA, who is authorized to issue penalties against the offending party.
Environmental Regulation
We are subject to various environmental laws and regulations dealing with the hauling and handling of hazardous materials, fuel storage tanks, emissions from our vehicle and facilities, engine idling, discharge and retention of storm water and other environmental matters that involve inherent environmental risk. We maintain bulk fuel storage and fuel islands at many of our terminals. We also have vehicle maintenance, repair and washing operations at some of our facilities. Our operations involve the risks of fuel spillage and seepage, discharge of contaminants, environmental damage and hazardous waste disposal, among others. We have instituted programs to monitor and control environmental risks and maintain compliance with applicable environmental laws. As part of our safety and risk management program we periodically perform environmental reviews. We are a partner in the EPA’s SmartWay Transport Partnership, a voluntary program promoting energy efficiency and air quality. We believe that our operations are in substantial compliance with current laws and regulations and do not know of any existing environmental condition that would be reasonably expected to have a material adverse effect on our business or operating results.
If we are held responsible for the cleanup of any environmental incidents caused by our operations or business, or if we are found to be in violation of applicable laws or regulations, we could be subject to liabilities, including substantial fines or penalties or civil and criminal liability. We have paid penalties for, and have incurred costs to remediate, spills and violations in the past.
In 2008 the State of California’s Air Resources Board (ARB) approved the Heavy-Duty Vehicle Greenhouse Gas (GHG) Emission Reduction Regulation in efforts to reduce GHG emissions from certain long-haul tractor-trailers that operate in California by requiring them to utilize technologies that improve fuel efficiency (regardless of where the vehicle is registered). The regulation required owners of long-haul tractors and 53-foot trailers to replace or retrofit their vehicles with aerodynamic technologies and low rolling resistance tires. The regulation also contained certain emissions and registration standards for temperature controlled trailer operators.
Thereafter, the United States EPA and the NHTSA began taking coordinated steps in support of a new generation of clean vehicles and engines through reduced GHG emissions and improved fuel efficiency at a national level. In September 2011, the United States EPA finalized federal regulations for controlling GHG emissions, beginning with model year 2014 medium- and heavy-duty engines and vehicles and increasing in stringency through model year 2018. The federal regulations relate to efficient engines, use of auxiliary power units, mass reduction, low rolling resistance tires, improved aerodynamics, improved transmissions and reduced accessory loads.
In December 2013, California’s ARB approved regulations to align its GHG emission standards and test procedures, as well as its tractor-trailer GHG regulation, with the federal Phase 1 GHG regulation, which applied fuel efficiency standards to vehicles for model years 2014 to 2018. In June 2015, the EPA and NHTSA, working in concert with California’s ARB, formally announced a proposed national program establishing Phase 2 of the GHG emissions and fuel efficiency standards for medium- and heavy-duty vehicles for model year 2018 and beyond.
In October 2016, the EPA and NHTSA formally published the Final Rule for Phase 2 of the GHG emissions and fuel efficiency standards for medium and heavy-duty engines and vehicles. The Final Rule, which will be
97
Table of Contents
effective as of December 27, 2016, is expected by the EPA to lower CO2 emissions by 1.1 billion metric tons and reduce oil consumption by up to 2 billion barrels over the lifetime of vehicles sold under the Phase 2 program. As expected, first-time GHG and fuel efficiency standards for trailers will start in model year 2018 for EPA and model year 2021 for NHSTA, and CO2 and fuel consumption standards for combination tractors and engines (which are subject to individual and separate regulatory requirements) commence in model year 2021, increase incrementally in model year 2024 and achieve a fully phased-in requirement by model year 2027. EPA and NHSTA expect that motor carriers will meet the increased standards through the use of technology improvements in multiple areas, including the engine, transmission, driveline, aerodynamic design, extended idle reduction technologies and the use of other accessories.
Current and proposed GHG regulations could impact us by increasing the cost of new trucks, impairing productivity and increasing our operating expenses.
Federal and state lawmakers are considering a variety of climate-change proposals related to carbon emissions and GHG emissions. The proposals could potentially limit carbon emissions for certain states and municipalities, which continue to restrict the location and amount of time that diesel-powered trucks (like ours) may idle.
Other Regulation
In the aftermath of the September 11, 2001 terrorist attacks, federal, state and municipal authorities implemented and continue to implement various security measures on large trucks, including checkpoints and travel restrictions. The TSA adopted regulations that require drivers applying for or renewing a license for carrying hazardous materials to obtain a TSA determination that they are not a security threat.
In December 2014, United States President, Barack Obama, signed the Tax Increase Prevention Act of 2014 (TIPA). Among other things, TIPA extended 50% bonus depreciation and the Work Opportunity Tax Credit (WOTC). In December 2015, President Obama signed the Protecting Americans from Tax Hikes (PATH) Act of 2015.
Sales and Marketing
We sell combinations of transportation services directly to 200 Fortune 500. We leverage a key account program providing each key account with a Global Account General Manager as the lead commercial interface (29 key accounts account for 37% of enterprise revenue).
Each service offering is represented by independent field sales representatives. We have approximately 175 field representatives located throughout North America. There are three distinct field representative roles, which respectively focus on: (1) generating new business with large shippers; (2) maintaining and growing relationships with existing customers; and (3) developing new business with the small to medium sized shipper. These roles are measured, trained and incentivized uniquely.
While our field representatives are service offering experts they are also trained and incented to cross-sell other services in which they do not have expertise. Twenty-two of our top twenty-five customers utilize services from all three reportable segments. We supplement the field representatives with approximately 165 inside sales representatives who focus primarily on new prospects (the bulk of these are in our brokerage business).
Large shippers generally anchor transportation buying in annual purchasing events. Over half of the freight we move is initially secured through a procurement event. Our outside and inside sellers are supported by customer service representatives who interact with our customers daily booking and executing orders.
98
Table of Contents
Unexpected exceptions are a staple of supply chains. Our customer service representatives’ ability to adroitly problem-solve and increase the level of sales to our existing customers, based on their knowledge of the business of our existing customers, is a key component of our commercial approach.
Technology and Research and Development
We are a technology leader in the truckload industry. We are pioneers in in-cab communications and were the first to install on-board satellite communications, untethering our drivers from landline telephones. We have built on that core in-cab capability over the past 30 years. Today our in-cab telematics platform in the truck delivers customer location specific step-by-step work assignments to our driver fleet. Work assignments include routing (with in-cab navigation) and fueling direction. Our trailer and container fleets are equipped with monitoring devices which function both when tethered to a tractor and standing alone. Our tractors are equipped with stability and collision avoidance technology. All tractor technology interfaces with the in-cab device and provides the driver and the driver leader with real-time performance data.
We execute our business on Quest, an integrated technology platform using technology from our strategic development partner, Oracle Corporation, reflecting an end-to-end process design with focus on information accessibility and insight across our value chain. Quest enables an integrated approach to cash process including load/order acceptance, based on driver and network optimization, vehicle dispatch, continuous quote monitoring and visibility to the load from pick up to delivery and finally customer billing. Our technology is enhanced by the work of a team of operations research engineers and data scientists. Proprietary decision support tools are embedded throughout the Quest platform. Decision support tools improve our ability to, among other things, situationally coach drivers, minimize fuel costs and maintain the fleet in the most cost effective manner. The most significant application of such “decision science” technology is in planning and dispatch. These tools assist our associates in making the right trades-offs among drivers’ needs for earnings and work-life balance, customers’ needs for reliable capacity and service, and our business and its shareholders’ needs for an adequate return.
We continue to expand business capabilities by extending the foundational Quest platform. Development of the next generation of in-cab technology is well underway. We are also leveraging mobile applications to better connect with drivers and customers. One recent example is a mobile application that prompts our drivers to rate the shipping, receiving and driver support locations that they visit. Our gathering and sharing of this information with customers and providers has been well received and is driving action to improve the driver’s experience.
Properties
We own or lease over two hundred properties across thirty-six states, Canada and Mexico. Our expansive network includes nearly 50 operating centers, approximately 40 distribution warehouses, 14 offices and over 100 drop yards. In addition, we physically operate at a number of customer locations.
99
Table of Contents
The operating centers we own or lease throughout the United States offer on-site management to support our transportation network for our truckload and intermodal segments. Often, our facilities include customer service centers, where our customers may contact a company representative to discuss their loads/orders, fuel and maintenance stations, and other amenities to support our drivers. Our facility network also includes warehouse capacity to further enhance our supply chain solutions. The following table provides a list of 32 properties that are central to our transportation network and indicates the functional capability at each site.
| Facility Capabilities | ||||||||||
| Location |
Function |
Customer Service |
Operations | Fuel | Maintenance | |||||
| Charlotte, NC |
Truckload | ✓ | ✓ | ✓ | ✓ | |||||
| Gary, IN |
Truckload | ✓ | ✓ | ✓ | ✓ | |||||
| Indianapolis, IN |
Truckload | ✓ | ✓ | ✓ | ✓ | |||||
| West Memphis, AR |
Truckload | ✓ | ✓ | ✓ | ✓ | |||||
| Puslinch/Guelph, ON |
Truckload | ✓ | ✓ | ✓ | ✓ | |||||
| Houston, TX |
Truckload | ✓ | ✓ | ✓ | ✓ | |||||
| Dallas, TX |
Truckload | ✓ | ✓ | ✓ | ✓ | |||||
| Carlisle/Harrisburg, PA |
Truckload | ✓ | ✓ | ✓ | ✓ | |||||
| Green Bay, WI (three facilities) |
Corporate | ✓ | ✓ | |||||||
| Santa Fe / Mexico City, Mexico |
Mexico | ✓ | ✓ | |||||||
| Chicago, IL |
Logistics | ✓ | ✓ | |||||||
| Dallas, TX |
Logistics | ✓ | ✓ | |||||||
| Farmington Hills, MI |
Logistics | ✓ | ✓ | |||||||
| Green Bay, WI |
Truckload | ✓ | ||||||||
| Atlanta, GA |
Truckload | ✓ | ✓ | ✓ | ✓ | |||||
| Eastvale, CA |
Truckload | ✓ | ||||||||
| Edwardsville, IL |
Truckload | ✓ | ✓ | ✓ | ✓ | |||||
| Portland, OR |
Truckload | ✓ | ✓ | ✓ | ✓ | |||||
| Des Moines, IA |
Truckload | ✓ | ||||||||
| Chicago, IL |
Intermodal | ✓ | ✓ | ✓ | ||||||
| Elwood, IL |
Logistics | ✓ | ||||||||
| Laredo, TX |
Truckload | ✓ | ✓ | ✓ | ✓ | |||||
| Houston, TX |
Truckload | ✓ | ✓ | |||||||
| Reserve, LA |
Truckload | ✓ | ✓ | |||||||
| San Bernardino, CA |
Intermodal | ✓ | ||||||||
| Phoenix, AZ |
Truckload | ✓ | ✓ | ✓ | ||||||
| Port Wentworth, GA |
Logistics | ✓ | ||||||||
| Zeeland, MI |
Truckload | ✓ | ✓ | |||||||
| Helena, MT |
Truckload | ✓ | ✓ | ✓ | ✓ | |||||
| Missoula, MT |
Truckload | ✓ | ✓ | ✓ | ✓ | |||||
Legal Proceedings
In November 2016, we received a Finding and Notice of Violation from the EPA alleging that, among other matters, 150 of the vehicles we own, hire or lease failed to comply with certain provisions of the California Air Resources Board Truck and Bus Regulation, in violation of the Clean Air Act.
We are not currently a party to any material litigation proceedings. From time to time, however, we may be a party to litigation and subject to claims incident to the ordinary course of business. Regardless of the outcome, litigation can have an adverse impact on us because of defense and settlement costs, diversion of management resources and other factors.
100
Table of Contents
Executive Officers and Directors
The following table sets forth information regarding our executive officers, directors and significant employees at the time of effectiveness of this registration statement:
| Name |
Age |
Position | ||
| Christopher B. Lofgren |
57 | Chief Executive Officer, President and Director | ||
| Mark Rourke |
52 | Chief Operating Officer and Executive Vice President | ||
| Lori Lutey |
52 | Chief Financial Officer and Executive Vice President | ||
| Shaleen Devgun |
44 | Chief Information Officer and Executive Vice President | ||
| Steve Matheys |
58 | Chief Administrative Officer and Executive Vice President | ||
| Paul Kardish |
54 | General Counsel, Secretary and Executive Vice President | ||
| Thomas Gannon |
62 | Director | ||
| Adam Godfrey |
54 | Director | ||
| Robert Grubbs |
59 | Director | ||
| Norman Johnson |
68 | Director | ||
| Therese Koller |
56 | Director | ||
| Daniel Sullivan |
70 | Chairman of our Board of Directors | ||
| R. Scott Trumbull |
68 | Director | ||
| Kathleen Zimmerman |
50 | Director | ||
Christopher B. Lofgren has served as our Chief Executive Officer and President, and as a director, since August 2002. He joined Schneider Logistics in 1994 as vice president of engineering and systems. He later served as Chief Information Officer and Chief Operating Officer before being named President and Chief Executive Officer of Schneider in 2002. Dr. Lofgren currently serves on the Board of Directors of CA Technologies and the U.S. Chamber of Commerce. Locally, he is a member of the Senior Advisory Council for Junior Achievement of Brown County (Wisconsin). Before joining the company, Dr. Lofgren held positions at Symantec Corporation, Motorola and CAPS Logistics. He holds a bachelor’s degree and a master’s degree in industrial and management engineering from Montana State University and a doctorate in industrial and systems engineering from The Georgia Institute of Technology. In October 2009, Dr. Lofgren was inducted into the National Academy of Engineering. We believe that Dr. Lofgren is qualified to serve on our Board of Directors because of his extensive knowledge and experience in all aspects of our business, and his extensive technical expertise in all aspects of our truckload, intermodal and logistics services.
Mark Rourke has served as our Chief Operating Officer and Executive Vice President since September 2015. He previously served as our President of our Truckload Services Division and was also previously General Manager of Schneider Transportation Management, where he was responsible for the effective delivery to market of sole source, promotional and brokerage service offerings. Before that, he held a variety of leadership roles with increasing responsibility at our company, including Vice President of Customer Service, Director of Transportation Planning for Customer Service, Midwest Area Service Manager for Customer Service and Director of Driver Training. Mr. Rourke joined our company in 1987 as a service team leader in the company’s Seville, Ohio, location. His earlier roles with the company included on-site account manager for B.F. Goodrich in Cleveland, Ohio, Dedicated team operations manager and van support manager. He holds a bachelor’s degree in marketing from the University of Akron, Ohio. He also serves on the Board of Directors for the Boys and Girls Club of Green Bay.
101
Table of Contents
Lori Lutey has served as our Chief Financial Officer and Executive Vice President since April 2011. Prior to joining our company in 2011, Ms. Lutey was Vice President of Finance at FedEx Services, where she was responsible for financial planning and analysis for over $1 billion in annual expense and led all strategic and tactical financial support. Ms. Lutey started her 22-year career with FedEx Corporation and advanced steadily after starting as a financial analyst, including serving as Vice President at FedEx Supply Chain Services and as Vice President and CFO of FedEx Trade Networks. She holds a bachelor’s degree in management information systems from Tennessee Tech University and a master’s degree in business administration from the University of Memphis. She also serves on the Board of Directors for LIVE54218, a non-profit focused on obesity prevention.
Shaleen Devgun has served as our Chief Information Officer and Executive Vice President since July 2015. Mr. Devgun previously served as Vice President for Strategy, Planning and Solution Delivery. Prior to joining our company in 2009, Mr. Devgun spent twelve years in management consulting roles with DiamondCluster International and Deloitte, specializing in corporate venturing, formulation and execution of business and technology strategy, program leadership and operational design. He holds bachelor’s degrees in economics and math from the University of Pune and a master’s degree in business administration from the University of Detroit Mercy.
Steve Matheys has served as our Chief Administrative Officer and Executive Vice President since October 2009. Mr. Matheys joined our company in 1994 and held progressive leadership roles in the Information Technology department before being promoted to Executive Vice President and Chief Information Officer in 2001. Subsequently, he was promoted to Executive Vice President, Sales and Marketing in 2004, added customer service to his responsibilities in 2006, and then refocused his accountability on our largest customers in 2008 prior to moving into his current role in 2009. In addition to his leadership roles at the company, Mr. Matheys spent the first thirteen years of his career with Nielson Marketing Research, The Trane Company and General Motors in a variety of information technology roles. He holds a bachelor’s degree in business administration from the University of Wisconsin-La Crosse, with a minor in computer science, and actively serves on the Brown County United Way Board of Directors, of which he was previously chair, and the Wharton Research Advisory Group (RAG) for Human Resources.
Paul Kardish has served as our General Counsel, Secretary and Executive Vice President since August 2013. At the time Mr. Kardish joined our company, he had more than 20 years of broad ranging corporate legal, human resource, corporate governance/compliance, security and government relations experience. His career includes work at several Fortune 250 companies spanning multiple industries, including Honeywell, Intel, Micron and Freeport McMoRan. He holds a bachelor’s degree in social work/psychology from Juniata College, a juris doctor from Gonzaga University School of Law and a master of laws degree from New York University School of Law. He was admitted to the Texas Bar in 1993 and to the Wisconsin Bar in 2013. Mr. Kardish also served as a Special Agent with the Federal Bureau of Investigation and is trained in emergency management. Mr. Kardish is a member of the Texas and Wisconsin and American Bar Associations and the Phi Delta Phi Legal Honor Fraternity. He also serves as a member of the Board of Directors for the American Red Cross—Northeastern Wisconsin.
Thomas Gannon has served as a director since 2005, and has served as Chairman of the Corporate Governance Committee and as a member of the Audit and Compensation Committees of the Board during his tenure. Mr. Gannon joined our company in 1982. Since 1984, he has served as a financial, tax and philanthropic adviser to multiple generations and family branches of the Schneider family and related trusts, and has been principally responsible for maintaining ownership control by the Schneider family through generational shifts. He is also responsible for all matters relating to the company’s shareholders and transactions in Company stock. Mr. Gannon has indicated to the company that he intends to resign from these roles at the time of this offering. Mr. Gannon also served as the chief financial officer of the company from 1989 until 2005, and the Secretary of the company from 1991 until 2015. Mr. Gannon has also served as a director of the Little Rapids Corporation, where he was Chairman of the Audit and Compensation Committees, from 2001 until 2015, and as a director of Aearo Technologies, Inc. from 2006 until 2008, where he served as Chairman of the Audit Committee. He holds
102
Table of Contents
an Economics degree from Marquette University and a law degree from the University of Wisconsin. We believe that Mr. Gannon is qualified to serve on our Board of Directors because of his deep knowledge of Schneider, its history and its corporate values, in addition to his business and leadership experience.
Adam Godfrey has served as a director since 2005. Mr. Godfrey is a Managing Partner of Stella Point Capital, which he co-founded in 2012. Stella Point Capital is a New York-based private equity firm focused on industrial, consumer and business services investments. Mr. Godfrey is an investment professional and has sourced and managed numerous investments for Stella Point Capital. Previously, Mr. Godfrey spent nearly 19 years with Lindsay Goldberg and its predecessor entities, which he joined in 1992. Currently, he serves on the Board of Directors of First American Payment Systems Holdings, Inc., Rightpoint Consulting LLC and Intermex Holdings, Inc. Mr. Godfrey holds a bachelor’s degree from Brown University and a master’s degree in business administration from the Tuck School of Business at Dartmouth. We believe that Mr. Godfrey is qualified to serve on our Board of Directors because of his extensive experience in finance, investing and corporate strategy during his time at Stella Point Capital and Lindsay Goldberg and his prior experience serving on the Boards of Directors of several portfolio companies in which Stella Point Capital and Lindsay Goldberg invested.
Robert Grubbs has served as a director since 2012. Mr. Grubbs serves as the Non-Executive Chairman of Ohio Transmission Corp., a distributor of motion control and related products and services. He also serves as Non-executive Chairman of Grand Northern Products (GNAP, LLC), a distributor of industrial abrasive products, equipment, specialty ceramics and ancillary services used in the applications of investment casting, metal stamping, machining, forging, remediation, coating and paving. Ohio Transmission Corp. and Grand Northern Products have previously received financing from Frontenac Company, LLC, a private equity firm based in Chicago that focuses on investing in lower middle market buyout transactions in the food, industrial and services industries. From 1998 to 2008, Mr. Grubbs served as the President and Chief Executive Officer of Anixter International Inc., a Chicago-based distributor of network and security solutions, electrical and electronic solutions and utility power solutions. From 1994 to 2008 Mr. Grubbs was also the President and Chief Executive Officer of Anixter Inc., a subsidiary of Anixter International Inc. He has also served as a director of Anixter International Inc. since 1996. Mr. Grubbs holds a bachelor’s degree in business administration from the University of Missouri. We believe Mr. Grubbs is qualified to serve on our Board of Directors because of his extensive executive, leadership and director experience, his experience as an executive and director of a publicly traded company and because of his expertise in the area of supply chain services (including 3PL).
Norman Johnson has served as a director since 2006. Since August 2012, Mr. Johnson has served on the Board of Directors of Cracker Barrel Old Country Store, Inc., an operator of stores and restaurants. From March 2000 to July 2010, Mr. Johnson served as President, Chairman and Chief Executive Officer of CLARCOR Inc., a diverse filtration company. From July 2010 to December 2011, Mr. Johnson was the Chairman and Chief Executive Officer of CLARCOR, and he later served as the Executive Chairman of CLARCOR from December 2011 until his retirement in November 2012. In addition, Mr. Johnson served from July 2012 until October 2016 on the Board of Directors of CIRCOR International, Inc., a manufacturer of valves and other highly engineered products and sub-systems used in the energy, aerospace and industrial markets. Mr. Johnson holds a bachelor’s degree in business administration from the University of Iowa and a master’s degree in business administration from Drake University. We believe Mr. Johnson is qualified to serve on our Board of Directors because of his extensive executive, leadership and director experience, his experience as an executive and director of publicly traded companies and because of his deep knowledge of integration and distribution networks.
Therese Koller has served as a director following her appointment for the 2016 annual term. Ms. Koller engages in philanthropic work and serves on the board of a variety of non-profit organizations. She holds a bachelor’s degree from the University of St. Thomas and a master’s degree from the University of Pennsylvania. Ms. Koller is the sister of director Kathleen Zimmermann. We believe that Ms. Koller is qualified to serve on our Board of Directors due to her deep knowledge of Schneider, its history and its corporate values, in addition to her business and leadership experience.
103
Table of Contents
Daniel Sullivan has served as a director since 2009 and as Chairman of our Board of Directors since 2014. Mr. Sullivan is a Principal of Flyway, LLC, a private investment company. He most recently served as the President and Chief Executive Officer of FedEx Ground from 1998 until 2007. FedEx Ground is a wholly owned subsidiary of FedEx Corporation. From 1996 to 1998, Mr. Sullivan was the Chairman, President and Chief Executive Officer of Caliber System. In 1995, Mr. Sullivan was the Chairman, President and Chief Executive Officer of Roadway Services. Mr. Sullivan has served as the Chairman of the Board of Directors of Computer Task Group, an IT solutions and staffing services company, since October 2014, and as a member of the Computer Task Group Board of Directors since 2002. He is also a current member of the Board of Directors of The Medical University of South Carolina Foundation where he serves as Vice Chairman of the Board of Directors. Mr. Sullivan previously served as a member of the Board of Directors of Pike Electric, Inc. from 2007 to 2014 (Pike Electric was sold in December 2014 to Court Square Capital Partners), GDS Express (Akron, Ohio) from 2004 to 2009 and Gevity, Inc. (Bradenton, Florida) from 2008 to 2009. He is a former federal commissioner for the Flight 93 National Memorial project in Somerset County, Pennsylvania. Mr. Sullivan holds a bachelor’s degree from Amherst College. We believe that Mr. Sullivan is qualified to serve on our Board of Directors because of his extensive leadership and executive experience, his experience has a director of publicly traded companies and because of his operational experience with companies having large and diverse employee workforces across geographic markets.
R. Scott Trumbull has served as a director since 2002. Since January 2014, Mr. Trumbull has served on the Board of Directors of Columbus McKinnon Corporate, a global designer, manufacturer and marketer of material handling products for commercial and industrial end-user markets. Since 1999, Mr. Trumbull has served on the Board of Directors of Welltower Inc., a company that invests with seniors housing operators, post-acute providers and health systems to fund real estate and infrastructure. He also serves as a director of Artisan Partners Funds, Inc., a registered mutual fund, and is a member of the Board of Trustees of ProMedica, a healthcare system with facilities throughout Northwest Ohio and Southeast Michigan. From 2003 until May 2014, he was the Chief Executive Officer of Franklin Electric Co., Inc., a company that designs, manufactures and distributes water and fuel pumping systems. Mr. Trumbull also served as Chairman of the Board of Franklin Electric Co., Inc. from 2003 until May 2015. Prior to his service with Franklin Electric Co., Inc., Mr. Trumbull was Executive Vice President and Chief Financial Officer of Owens-Illinois, Inc., a global manufacturer of glass and plastic packaging products, from 2001 to 2002, and prior thereto, he was Executive Vice President of International Operations & Corporate Development of Owens-Illinois, Inc., from 1993 to 2001. He began his career at Owens-Illinois, Inc. in 1972. Mr. Trumbull holds a bachelor’s degree in economics from Denison University and a master’s degree in business administration from Harvard Business School. We believe that Mr. Trumbull is qualified to serve on our Board of Directors because of his extensive leadership and executive experience, his experience has a director of publicly traded companies and because of his global perspective attained through many years of chief executive experience.
Kathleen Zimmermann is currently anticipated to serve as a director following her appointment for the 2017 annual term. Ms. Zimmermann is currently a real estate investor and holds her real estate license. She received her bachelor’s degree in marketing from Marquette University. Ms. Zimmerman is the sister of director Therese Koller. Ms. Zimmermann has held a variety of sales leadership roles throughout her career including with Schneider Communications, Frontier Communications and Global Crossing. We believe that Ms. Zimmermann is qualified to serve on our Board of Directors due to her deep knowledge of Schneider, its history and its corporate values, in addition to her business and leadership experience.
Controlled Company Status
Upon completion of this offering, the Schneider National, Inc. Voting Trust will hold a majority of the voting power of our outstanding common stock. Accordingly, we expect to be considered a “controlled company” under the NYSE listing rules. As a controlled company, certain exemptions under the NYSE listing standards will exempt us from the obligation to have a compensation committee that is composed entirely of independent directors. We intend to use this exemption following the completion of this offering. We do not intend to use any other controlled company exemption.
104
Table of Contents
Board Structure
Upon completion of the offering, our Board of Directors will consist of nine members. Our board has determined that each of is independent under applicable NYSE rules.
In accordance with our Amended and Restated Articles of Incorporation and our Amended and Restated Bylaws effective upon the completion of the offering, each of our directors will serve for a one-year term or until his or her successor is elected and qualified. Each of our directors and director-nominees must satisfy certain conditions specified in our Amended and Restated Bylaws, including that such individual cannot be 74 years or older, cannot be a material customer or supplier, cannot be an officer of any entity of which any other of our directors is a director and must have his or her nomination approved by the unanimous vote of our full Board of Directors if such individual has served on our Board of Directors for more than 14 consecutive fiscal years. At each annual meeting of our shareholders, our shareholders will elect the members of our Board of Directors. There will be no limit on the number of terms a director may serve on our Board of Directors.
Pursuant to the Schneider Family Board Nomination Process Agreement, five specified members of the Schneider family shall have the right to nominate, and the company shall include in the slate of nominees recommended to shareholders of the company for election as a director at any meeting of shareholders at which directors are to be elected, two family members to serve on our Board of Directors on an annual, rotating basis. Each Schneider family member nominated in accordance with such agreement must satisfy the qualifications for service as a director set forth in the Amended and Restated Bylaws or such qualifications must be waived in accordance with such Amended and Restated Bylaws. The directorships will rotate among the five Schneider family members through 2025, with each director anticipated to serve for three consecutive years, plus the remainder of any current rotation at the time of the consummation of this offering. After the rotation system described above is complete, the five specified Schneider family members may, if they have at least 80% of such family members in agreement, propose to the corporate governance committee an amendment to the agreement, consistent with such agreement, to cover nominations in subsequent periods, the approval of which shall not be unreasonably withheld by either the corporate governance committee or the Board of Directors.
Board Committees
Our Board of Directors will have the following committees, each of which will operate under a written charter that will be posted on our website prior to the completion of this offering. The initial members of each committee will be determined prior to the effectiveness of the registration statement of which this prospectus is a part.
Audit Committee
Our audit committee will assist the board in overseeing our accounting and financial reporting processes and the audits of our financial statements. In addition, the audit committee will be establishing the scope of the company’s annual audit, review the report and comments of the company’s independent registered public accounting firm, be directly responsible for the appointment, compensation, retention and oversight of the work of our independent registered public accounting firm and will perform any other activities delegated to the committee by the Board of Directors.
Compensation Committee
Our compensation committee is responsible for assisting our Board of Directors in discharging its responsibilities relating to establishing and reviewing the compensation of our officers and approving, overseeing and monitoring incentive and other benefit plans for our employees and performing any other activities delegated to the committee by the Board of Directors.
105
Table of Contents
Corporate Governance Committee
Our corporate governance committee assists our Board of Directors in identifying individuals qualified to become members of our Board of Directors consistent with criteria established by our board and in developing our corporate governance principles. This committee’s responsibilities include selecting individuals to be proposed for nomination as directors of the company, nominating individuals for election as directors of the company, establishing and nominating directors for appointment to committees of the Board of Directors, reviewing the performance and qualifications of directors, reviewing and recommending policies to the Board of Directors and establishing and reviewing compensation for the Board of Directors and performing any other activities delegated to the committee by the Board of Directors.
Our Amended and Restated Bylaws provide that those members of our corporate governance committee who are not members of the Schneider family shall serve as trustees of the Voting Trust in accordance with the terms of the Voting Trust. Our Amended and Restated Bylaws also provide that the chairman of our corporate governance committee shall be an individual who is not a member of the Schneider family, and that our corporate governance committee shall at all times be comprised of each director that is a member of the Schneider family and up to six directors who are not members of the Schneider family.
Code of Ethics
Our code of business conduct and ethics applies to all of our directors, officers and other employees, including our principal executive officer, principal financial officer and principal accounting officer. Any waiver of the code for directors or executive officers may be made only by our Board of Directors and will be promptly disclosed to our shareholders through publication on our website, https://schneider.com. Amendments to the code must be approved by our Board of Directors and will be promptly disclosed (other than technical, administrative or non-substantive changes). A copy of our code of business conduct and ethics will be posted on our website.
Corporate Governance Guidelines
Our Board of Directors will adopt corporate governance guidelines that serve as a flexible framework within which our Board of Directors and its committees operate. These guidelines will cover a number of areas, including the size and composition of the board, board membership criteria and director qualifications, director responsibilities, board agenda, roles of the Chairman of the Board, Chief Executive Officer and presiding director, meetings of independent directors, committee responsibilities and assignments, board member access to management and independent advisors, director communications with third parties, director compensation, director orientation and continuing education, evaluation of senior management and management succession planning. Additionally, our Board of Directors will adopt independence standards as part of our corporate governance guidelines. A copy of our corporate governance guidelines will be posted on our website, https://schneider.com.
Compensation Committee Interlocks and Insider Participation
None of our executive officers has served as a member of a compensation committee of any other entity that has an executive officer serving as a member of our Board of Directors.
106
Table of Contents
COMPENSATION DISCUSSION AND ANALYSIS
Introduction
This Compensation Discussion and Analysis (“CD&A”) describes our process for determining the compensation and benefits provided to our “named executive officers” in fiscal year 2015. We also provide an overview of the compensation philosophies we expect to adopt following the closing of this offering.
Our named executive officers for fiscal year 2015 are all members of our senior executive management team:
| • | Christopher B. Lofgren—President and Chief Executive Officer |
| • | Lori Lutey—Executive Vice President, Chief Financial Officer |
| • | Mark Rourke—Executive Vice President, Chief Operating Officer |
| • | Steve Matheys—Executive Vice President, Chief Administrative Officer |
| • | Paul Kardish—Executive Vice President, General Counsel |
We expect that our named executive officers will hold the same positions with the company following the closing of this offering.
Compensation Philosophy and Principles
Retention of executive talent is critical to our success. Our compensation committee believes that the ability to attract, retain and provide appropriate incentives to our leadership, including the named executive officers, is essential to maintain our leading competitive position and promote our long-term success. Accordingly, our executive compensation program is designed to encourage retention, particularly of executives who assume a broad span of responsibilities and successfully lead complex business units to market-leading positions in the industry.
The transportation industry is highly competitive, and we compete for executive talent with a large number of companies across various geographies, including companies with significant market capitalizations. Our compensation committee’s goal is to maintain compensation programs that are competitive both within the transportation industry and with similarly situated companies from the broader general industry. Each year, our compensation committee reviews the executive compensation program with respect to (i) external competitiveness and (ii) linkage between executive compensation and the creation of shareholder value, and determines what changes, if any, are appropriate.
The overall compensation philosophy of our compensation committee and management is guided by the following principles:
| • | Target compensation levels should be sufficiently competitive to attract and retain key talent. We aim to attract, motivate and retain high-performance talent to achieve and maintain a leading position in our industry. Our target total direct compensation (“TDC”) levels should be competitive with other transportation and general industry alternatives. |
| • | Actual compensation should relate directly to performance and responsibility. Actual compensation levels should be tied to and vary with performance, both at the company and individual level, in achieving financial, operational and strategic objectives. Differentiated pay for high performers should be proportional to their contributions to our success. |
| • | Incentive compensation should constitute a significant portion of target total direct compensation. A large portion of each executive’s compensation opportunity should be tied to performance, and therefore at risk, as position and responsibility increase. Individuals with greater roles and the ability to directly impact strategic direction and long-term results should bear a greater proportion of the risk. |
107
Table of Contents
| • | Long-term incentive compensation should be closely aligned with shareholders’ interests. Awards of long-term compensation provide incentives to our named executive officers to focus on the company’s long-range growth and development. Moreover, providing our named executives with a meaningful equity stake in the company (including through our stock purchase policy) helps to align management interests with those of our shareholders, and encourages long-term career orientation. See “—Stock Purchase Policy.” |
The company’s executive compensation program is designed to reward the achievement of initiatives regarding growth, productivity and people, including:
| • | setting, implementing and communicating strategies, goals and objectives to ensure that the company grows revenues and earnings at attractive rates over the long-term; |
| • | motivating and exhibiting leadership that aligns the interests of the employees with those of the shareholders; |
| • | developing a grasp of the competitive environment and taking steps to position the company for growth and as a competitive force in the industry; |
| • | constantly renewing the company’s business model and seeking strategic opportunities that benefit the company and its shareholders; and |
| • | implementing a discipline of compliance and focusing on the highest standards of professional conduct and corporate governance. |
Process of Setting Compensation
Market Assessment against Peer Group
In 2014, our compensation committee engaged Frederic W. Cook & Co., Inc. (“FW Cook”) to perform a competitive market assessment for our named executive officers, including with respect to base salary, annual incentive targets, target cash compensation, long-term incentives and target TDC level (the sum of base salary, target bonus and long-term incentive grant value).
The assessment involved the selection of a peer group consisting of companies in related industries with revenues generally ranging from one-third to 3.5 times those of the company and whose median revenue was similar to that of the company. The resulting group consisted of the following 15 transportation and logistics companies with median revenues of $4.235 billion compared to the company’s $3.937 billion.
| Arc Best Corp. |
JB Hunt Transport Services, Inc. | SAIA, Inc. | ||
| C.H. Robinson Worldwide |
Landstar System, Inc. | Swift Transportation Company | ||
| Con-Way, Inc. |
Old Dominion Freight Line, Inc. | UTI Worldwide, Inc. | ||
| Expeditors Int’l of Washington, Inc. |
Roadrunner Transportation | Werner Enterprises, Inc. | ||
| Hub Group, Inc. |
Ryder System, Inc. | YRC Worldwide | ||
The above peer group data were supplemented with general industry data from two national surveys to provide additional reference points, with data size-adjusted based on the revenue responsibility of each named executive officer and to reflect lower margins and market cap-to-revenue ratios among transportation companies relative to general industry companies. In reviewing target TDC levels against the survey data, our compensation committee considers only the aggregated survey data provided by the surveys. The identity of the individual companies comprising the survey data is not disclosed to, or considered by, our compensation committee in its evaluation process. Therefore, our compensation committee does not consider the identity of the companies comprising the survey data to be material for this purpose.
108
Table of Contents
Our compensation committee believes it is appropriate to consider both peer group data and general industry data in order to remain competitive within the transportation industry as well as with respect to other industries where skills may be easily transferable. Our compensation committee considers target TDC levels around the 50th percentile of each of the peer group data and survey data as a useful reference in determining the competitiveness of our named executive officers’ target TDC levels. Our compensation committee does not target specific positioning, nor does it use a formulaic approach in determining competitive pay levels. Instead, our compensation committee uses a range of data as a reference, which is considered in the context of various executive-specific factors, such as tenure, proficiency in role and criticality to the company.
Determining Executive Pay
Our compensation committee reviews and approves our Chief Executive Officer’s target TDC level annually. Our compensation committee also approves target TDC levels for the other named executive officers, taking into account our Chief Executive Officer’s recommendations. This review process occurs in the fall of each year to coincide with our fourth quarter Board of Directors meeting. Historically, compensation actions, including annual long-term incentive grants, have been made in January, after the previous year’s performance results have been finalized and certified by our compensation committee. Compensation increases and equity award grants are not usually made at other times of the year, except in cases of new hires or promotions.
Key Compensation Policies and Programs
Pay for Performance
We believe that a sizeable portion of overall target TDC should be at risk and tied to shareholder value. Our compensation committee takes into account our performance in its process for determining executive compensation, and designs incentive programs to encourage our growth. Our compensation committee and management believe that the proportion of compensation at risk should rise as the employee’s level of responsibility increases.
For example, our annual cash bonuses in recent years have been tied to company-wide performance measures, such as earnings before interest and tax (“EBIT”) and revenue growth. As each performance measure improves, so do executive bonuses. We also use long-term incentives as tools to reward executives for future financial and stock price performance.
Long-Term Compensation
With respect to long-term incentive compensation awards, the company maintains the following long-term incentive plans:
| • | The Schneider National, Inc. Omnibus Long-Term Incentive Plan (which we refer to as the “LTIP”), under which equity and cash awards may be granted to eligible employees and directors, including our named executive officers. Our Board of Directors originally adopted and approved the LTIP on February 7, 2011, and approved an amended and restated LTIP on November 8, 2011 and December 31, 2012. |
| • | The 2005 Schneider National, Inc. Long-Term Incentive Plan (which we refer to as the “2005 LTIP”), under which awards of Retention Credits (described below) have been granted, including to certain of our named executive officers. Our Board of Directors adopted and approved the 2005 LTIP effective January 1, 2005. |
Recently, we have granted restricted share and performance-based long-term cash awards under the LTIP. These awards are intended to attract and retain employees and directors, to provide incentives to enhance job performance and to enable those persons to participate in the long-term success and growth of the company through an equity or equity-like interest in the company. The number of restricted shares that may be awarded to
109
Table of Contents
an individual, or the size of any cash award, is within the discretion of our compensation committee and is generally based on the company’s performance and the individual’s current level of compensation, individual performance, potential for promotion and marketability outside the company. The size of an individual’s previous LTIP awards may be, but is not always, a consideration in determining the amount of awards granted to that individual in the future. Restricted shares are intended to provide approximately 30% of the grant date value of an individual’s long-term incentive grant while the performance-based long-term cash award is intended to account for the other 70% (assuming target performance).
Restricted Shares. Our restricted share awards vest over time, typically over three years, based on continued employment with us through each vesting date, with limited exceptions for a termination of employment due to death or disability, an eligible retirement or a change in control. We began granting restricted shares under the LTIP in 2011. Recipients of restricted shares realize value as restricted shares vest, with such value increasing as our book value increases. Cash dividends are not paid on unvested restricted shares, nor do they accumulate during the vesting period.
Long-Term Cash Awards. Our long-term cash awards, which we have granted annually since 2013, are performance-based in an effort to link future compensation to the long-term financial success of the company. Payout is contingent on the company’s attainment of two pre-established performance metrics, measured over a five-year period: compounded net income growth (determined on the basis of GAAP) and return on capital (which we refer to as “ROC”). These performance metrics were selected because they represent the key drivers of value creation in the transportation industry. While each grant is expressed as a fixed dollar amount, the actual amount earned may range from 0% of target to 250% of target for superior performance. The award cliff-vests after the end of the five-year performance period, subject to continued employment with us and compliance with the terms of certain restrictive covenants. Vested awards will be paid out 90 days following completion of the five-year performance period, or on a subsequent deferral date elected by the executive pursuant to our 2005 Supplemental Savings Plan. See “—Nonqualified Deferred Compensation for Fiscal Year 2015—Supplemental Savings Plan.” The awards are also subject to continued compliance with the terms of certain restrictive covenants. Individuals who terminate employment due to death, disability, an eligible retirement or a change in control during the performance period will receive a pro rata portion of the cash award.
Retention Credits. Our compensation committee occasionally grants mandatorily deferred time-based cash “Retention Credits,” which typically vest in 20% increments over a five-year period based on continued employment. Vested Retention Credits are paid out in March following the second anniversary of the date of the employee’s termination of employment, provided the employee has not violated the terms of their restrictive covenant agreements. These awards are intended to enhance the retentive aspects of executive compensation, to provide deferred compensation, and to incentivize compliance with post-employment restrictive covenants.
Stock Appreciation Rights. Stock Appreciation Rights, or “SARs,” is a legacy program. In 2011 and 2012, our compensation committee granted SARs which become 100% vested on the date provided in the applicable award agreement (generally a three-year vesting period). The 2012 awards vested in 2015, and are reported under the “Non-Equity Incentive Plan Compensation” column of the Summary Compensation Table for Fiscal Year 2015, below, and the “Registrant Contributions in Last Fiscal Year” column of the Nonqualified Deferred Compensation Table for Fiscal Year 2015, below. The account balance for 2011 and 2012 awards are included in the “Aggregate Balance at Last Fiscal Year End” column of the Nonqualified Deferred Compensation Table for Fiscal Year 2015. See “—Nonqualified Deferred Compensation For Fiscal Year 2015.” Vested SARs will be paid out on March 1 of the fifth year following the year of such grant (or as soon as practicable thereafter, but in no event later than June 1) or on a subsequent deferral date elected by the executive (or within 90 days following a termination of employment or change in control, if earlier), and until payment, continue to appreciate (or depreciate) as if notionally invested in our Class B common stock. The value of the SARs upon payment will equal the excess, if any, of the fair market value of a share of our Class B common stock on the date of payment over the grant price set forth in the applicable award agreement, multiplied by the number of vested SARs. Grants of SARs were intended to enhance the retentive aspects of executive compensation, and to tie executive compensation to the value of our equity.
110
Table of Contents
In connection with their annual grants, all LTIP participants are required to sign the company’s form of restrictive covenant agreement, which includes noncompetition, nonsolicitation and nondisclosure covenants. All of our named executive officers have signed and returned such agreements for each year in which they have participated in the LTIP.
Stock Purchase Policy
Historically, to align the interests of our executive officers with our shareholders, we have required our executive officers to purchase, using their own funds, shares of our Class B common stock at levels described in the table shown below, subject to the overall cap indicated. As of December 31, 2015, all of our named executive officers covered by this policy met these targets. Following this offering, this policy will be replaced by the stock ownership policy. See “—Looking Forward.”
| Position |
Purchase Requirement as a Multiple of Base Salary |
Purchase Cap | ||||||
| Chief Executive Officer |
1.5 times | $ | 3,100,000 | |||||
| CEO Direct Reports |
1.0 times | $ | 1,500,000 | |||||
Clawback Policy
The company has a policy requiring forfeiture of deferred LTIP payments upon any executive’s breach of confidentiality obligations, or breach of post-employment noncompetition or nonsolicitation agreements.
Retirement Focus
Our compensation committee believes it is important to use retirement programs that encourage our named executive officers to continue long-term careers with us. For example, stock ownership and equity awards are critical to each such executive’s ability to adequately provide for his or her retirement. Our named executive officers hold equity and cash awards that vest over time, or are deferred over time. We also encourage, although do not mandate, that our named executive officers maintain certain stock ownership levels until retirement.
In addition, our company maintains a 401(k) plan available to our employees generally, including our named executive officers. The company makes discretionary contributions to each participant’s account each year based on his or her voluntary contribution amount, eligible compensation and years of service.
2015 Compensation
Summary
Our executive compensation program is tied to the performance of the company and is structured to ensure that, due to the nature of the business and the degree of competitiveness for executive talent, there is an appropriate balance between:
| • | fixed and variable compensation; |
| • | short-term and long-term compensation; and |
| • | cash and equity compensation. |
Each element of pay is determined and measured by:
| • | competitive compensation data; |
| • | financial, operational and strategic goals; |
111
Table of Contents
| • | short-term and long-term performance of the company compared with its peer group; and |
| • | individual contribution to the success of the company. |
For 2015, our compensation committee, in consultation with its independent compensation consultant, established target TDC levels of our named executive officers. To inform its decision-making with respect to the appropriate target range, our compensation committee reviewed target TDC levels of those provided to executives holding equivalent positions in the peer group (described above) and those provided to executives holding equivalent positions in the adjusted general industry survey data (described above). See “—Process of Setting Compensation—Market Assessment against Peer Group.” Our compensation committee believes that changes made in target TDC for 2015, as discussed further below, were necessary to provide each named executive officer with compensation appropriate for his or her respective peer group and position. Our compensation committee also believes that payments and awards were consistent with the company’s financial performance and size, as well as the individual performance of each of the named executive officers, and that target TDC was reasonable.
Elements of 2015 Compensation
Total compensation for the named executive officers consists of one or more of the following components:
| • | base salary; |
| • | cash-based annual incentive awards; |
| • | long-term incentive (cash and equity) awards; |
| • | health and welfare benefits; and |
| • | limited perquisite benefits. |
Our compensation committee, with recommendations from management, works to create what it believes is the best mix of these components in delivering target TDC. In making its target TDC decisions annually, our compensation committee reviews all elements of target TDC separately and in the aggregate. These compensation components are comparable to those of the company’s competitors and peer group.
Determining 2015 Compensation
In its review of target TDC for our executive officers, and, in particular, in determining the amount and form of incentive awards discussed below, our compensation committee generally considers several factors. Among these factors are:
| • | market information with respect to cash and long-term compensation; |
| • | the officer’s existing compensation package; |
| • | annual bonus and other compensation; |
| • | the officer’s responsibilities and performance during the calendar year; and |
| • | our overall performance during prior calendar years and our future objectives and challenges. |
At transportation companies, generally the largest elements of compensation are paid in the form of annual short-term incentives and long-term compensation. Compensation mix and industry profitability vary as the industry faces many risk factors, such as those associated with the economy, safety and fuel prices.
Our compensation committee generally determines bonus targets and long-term incentive awards based on each employee’s relevant peer group match, considering individual performance and experience. Our
112
Table of Contents
compensation committee has retained FW Cook as its compensation consultant. FW Cook reports directly to our compensation committee and has no other engagements with the company. See “—Process of Setting Compensation—Market Assessment against Peer Group.” In 2014, FW Cook prepared a study providing information and an independent analysis of the company’s executive compensation program. The results of the study included observations about the competitiveness of 2014 target TDC levels, which informed potential adjustments for 2015.
Our compensation committee does not rely solely on predetermined formulas or a limited set of criteria when it evaluates the individual performance of our named executive officers. Our compensation committee considers actual results against deliverables and also bases its compensation decisions for the named executive officers on:
| • | leadership; |
| • | the execution of business plans; |
| • | strategic results; |
| • | operating results; |
| • | growth in net income; |
| • | size and complexity of the business; |
| • | experience; |
| • | strengthening of competitive position; |
| • | analysis of competitive compensation practices; and |
| • | an assessment of our performance. |
Where possible, the above criteria were compared with our peer group, taking into account the Chief Executive Officer’s input for his direct reports. For our Chief Executive Officer, the above criteria were compared with our peer group, taking into account input from members of our compensation committee. Our Chief Executive Officer did not participate in any of our compensation committee’s deliberations regarding his own compensation.
Base Salary
Our compensation committee believes that competitive levels of cash compensation, together with equity-based and other incentive programs, are necessary for motivating and retaining the company’s executives. Salaries provide executives with a base level of monthly income and help achieve the objectives outlined above by attracting and retaining strong talent. Base salaries are evaluated annually for all the named executive officers. Generally, base salaries are not directly related to specific measures of corporate performance, but are determined by the relevance of experience, the scope and complexity of the position, current job responsibilities, retention and relative salaries of the peer group members. Our compensation committee may elect not to increase a named executive officer’s annual salary, and has so elected in prior years. However, if warranted, our compensation committee may increase base salary where a named executive officer takes on added responsibilities or is promoted.
In 2015, we increased the base salary rates for each of our named executive officers. Each of Christopher B. Lofgren, Lori Lutey and Mark Rourke received a merit increase in base salary that was aligned with our merit increases for our general employee population. Mark Rourke also received a mid-year increase in base salary in connection with his promotion to Chief Operating Officer. Steve Matheys and Paul Kardish received base salary increases that were intended to align their target TDC level for 2015 with the market. See “—Annual Bonuses.”
113
Table of Contents
Annual Bonuses
Our annual bonus plan may be tied to revenue growth relative to budget, annual EBIT relative to budget, or a combination of the foregoing. At its fall meeting, when management presents its budget for the following year, our compensation committee establishes a matrix of revenue growth and/or EBIT results with bonus payout levels. These forecasted results are based on customer freight trends, strategies for growth and controlling costs and corporate strategies to maximize shareholder return. Once presented to our compensation committee, the revenue growth budget, EBIT budget, and bonus plan matrix remain fixed, and as the company performs against the original budget, the executive’s bonus performs against the pre-established matrix. Our compensation committee reserves the right to adjust payouts or performance targets based on non-recurring transactions or other extraordinary circumstances. Changes in uncontrollable factors such as general economic conditions, railroad service issues or rapidly fluctuating fuel costs can have a significant impact on the company’s actual revenue growth and EBIT.
For our 2015 annual incentive program, our compensation committee selected revenue growth and EBIT as the metrics, each weighted 50% for executives (provided that, with respect to the period during 2015 prior to his promotion to Chief Operating Officer, Mr. Rourke’s annual bonus was further sub-weighted 60% to overall corporate performance and 40% to performance of those lines of businesses for which he had operational responsibility). For each metric, our compensation committee determines the threshold, target and maximum level of performance achievement.
| • | Revenue Growth: The portion of a named executive officer’s 2015 bonus relating to revenue growth goals (i.e., 50% of the 2015 bonus) may range between 0% and 200% of target. Performance at or below the threshold level of the revenue growth goal would result in no payout for that portion of the 2015 bonus. Achievement above the threshold level of the revenue growth goal would result in a payout determined by linear interpolation between threshold and maximum performance. |
| • | EBIT: With respect to the portion of a named executive officer’s 2015 bonus relating to EBIT goals (i.e., the remaining 50% of the 2015 bonus), achievement of EBIT threshold, target and maximum performance results in a payout of 50%, 100% and 200% of target, respectively, with linear interpolation between threshold and maximum performance. Performance below the threshold level of the EBIT goal would result in no payout for that portion of the 2015 bonus. |
The table below sets forth the corporate performance goals for our 2015 annual incentive program, our performance achievement against such goals and the resulting payout percentages:
| 2015 Annual Incentive Performance Goals* (000) |
||||||||||||||||||||||||||||
| Threshold | Target | Maximum | Actual Performance |
Payout (% of Target) | ||||||||||||||||||||||||
| Performance Metrics |
Weighting | (Revenue: 0% of Target Payout if at or below Threshold; EBIT: 50% of Target Payout at Threshold) |
(100% of Target Payout) |
(200% of Target Payout) |
(Unweighted) | (Weighted) | ||||||||||||||||||||||
| Revenue Growth |
50 | % | $ | 172,190 | $ | 286,980 | $ | 401,770 | $ | 252,055 | 69.6 | % | 35 | % | ||||||||||||||
| EBIT Performance |
50 | % | $ | 224,000 | $ | 280,000 | $ | 392,000 | $ | 292,260 | 110.9 | % | 55 | % | ||||||||||||||
| Total |
100 | % | 90.3 | % | ||||||||||||||||||||||||
| * | Linear interpolation applies between threshold and maximum performance levels |
Actual bonus amounts paid to our named executive officers for 2015 were based on the performance achievement levels described above. No adjustments were made to bonus payouts or performance targets for 2015.
114
Table of Contents
Our compensation committee considers several factors when approving each executive’s target bonus opportunity at the outset of the year, including our overall median philosophy, peer group and survey market data, prior year targets, the recommendation of the Chief Executive Officer (other than for himself) and any other executive-specific factors that it deems relevant. Our target annual incentive opportunities are expressed and considered as a fixed dollar amount rather than a percentage of base salary, because by avoiding the direct flow-through impact of changes in base salary on the annual incentive opportunity, our compensation committee has greater flexibility to manage the magnitude and mix of the various elements of target TDC.
In determining target annual incentive opportunities for 2015, our compensation committee took into account the FW Cook market assessment prepared in 2014. Our compensation committee believed that changes to target TDC levels for 2015 were necessary to provide each named executive officer with compensation appropriate for his or her respective peer group and position. See “—Process of Setting Compensation—Market Assessment against Peer Group.” Accordingly, our compensation committee determined annual bonus targets for 2015 that were intended to align each named executive’s target TDC with the market.
The FW Cook market assessment indicated that the target TDC levels for our named executive officers for 2015 were, in the aggregate, 119% and 106% of the peer group proxy and survey medians (excluding Mr. Matheys, for whom there was insufficient data among the peer companies). The FW Cook market assessment also indicated that the proposed target TDC levels for our named executive officers were 114% of the median, if the average of the peer group and survey data was used (where available). These results indicate overall alignment with our compensation philosophy to provide competitive target TDC levels to our named executive officers, taking into consideration target TDC levels around the 50th percentile of each of the peer group data and survey data, generally. Our compensation committee further believed that payments and awards were consistent with our financial performance and size, as well as the individual performance of each of the named executive officers, and that each named executive officer’s target TDC was reasonable.
The following table sets forth each named executive officer’s target and actual bonus amounts for 2015:
| 2015 Target Bonus ($) | 2015 Actual Bonus ($) | |||||||
| Christopher B. Lofgren |
850,000 | 767,550 | ||||||
| Lori Lutey |
275,000 | 248,325 | ||||||
| Mark Rourke* |
371,875 | 336,547 | ||||||
| Steve Matheys |
200,000 | 180,600 | ||||||
| Paul Kardish |
185,000 | 167,055 | ||||||
| * | Mr. Rourke was promoted to Chief Operating Officer on October 1, 2015. His 2015 target bonus indicated above represents the weighted average of his pre- and post-promotion target bonus amounts. |
Long-Term Incentive Awards
Each of our named executive officers is eligible to receive a long-term incentive award of restricted shares and a performance-based long-term cash award, with value-based weightings of 30% and 70%, respectively. These long-term incentive awards are intended to help achieve the objectives of the compensation program, including the retention of high-performing and experienced talent, a career orientation and strong alignment with shareholders’ interests. No Retention Credits were granted during 2015.
In administering the LTIP and awarding long-term incentive awards, we are sensitive to the potential for shareholder dilution. The LTIP is a narrowly based incentive compensation program. At the same time, our compensation committee believes that restricted shares must be sufficient in size to provide a strong, long-term performance and retention incentive for executives and to increase their vested interest in the company. As such, we focus the program on executives who will have the greatest impact on the strategic direction and long-term results of the company by virtue of their senior roles and responsibilities. A total of 8,766 restricted shares were granted to the named executive officers in 2015.
115
Table of Contents
Restricted Shares. For 2015, our compensation committee approved the following restricted share grants to the named executive officers:
| Restricted Shares (#) | Grant Date Fair Value ($)* | |||||||
| Christopher B. Lofgren |
4,668 | 850,976 | ||||||
| Lori Lutey |
1,317 | 240,089 | ||||||
| Mark Rourke |
1,605 | 292,592 | ||||||
| Steve Matheys |
612 | 111,568 | ||||||
| Paul Kardish |
564 | 102,817 | ||||||
| * | Grant date fair value determined in accordance with the applicable accounting guidance for equity-based awards. See Note 12 to the audited consolidated financial statements included elsewhere in this prospectus for an explanation of the methodology and assumptions used in the FASB ASC Topic 718 valuations. |
Our restricted share awards vest ratably over a three-year period, subject to continued employment with us through each vesting date, with limited exceptions for a termination of employment due to death or disability, an eligible retirement or a change in control.
2015 Long-Term Cash Awards. For 2015, our compensation committee also approved performance-based long-term cash awards for the named executive officers. Awards totaling $3,729,000 at target were awarded to the named executive officers in 2015, as follows:
| Threshold ($) (10% of Target) |
Target ($) | Maximum ($) (250% of Target) |
||||||||||
| Christopher B. Lofgren |
198,600 | 1,986,000 | 4,965,000 | |||||||||
| Lori Lutey |
56,000 | 560,000 | 1,400,000 | |||||||||
| Mark Rourke |
68,300 | 683,000 | 1,707,500 | |||||||||
| Steve Matheys |
26,000 | 260,000 | 650,000 | |||||||||
| Paul Kardish |
24,000 | 240,000 | 600,000 | |||||||||
Our long-term cash awards are subject to the company’s attainment of two pre-established performance metrics, measured over a five-year period: compounded net income growth (determined on the basis of GAAP) and ROC. See “—Long-Term Compensation—Long-Term Cash Awards.” While each grant is expressed as a fixed dollar amount, the actual amount earned is based on a performance grid and may range from 0% of target to 250% of target for achievement of maximum performance on one measure and at least threshold performance on the other measure. The awards are also subject to continued compliance with certain restrictive covenants and continued employment through the end of the performance period (with limited exceptions in case of termination of employment due to death, disability, eligible retirement or change in control).
All participants who received restricted shares or long-term cash awards in 2015 have executed restrictive covenant agreements containing noncompetition, nonsolicitation and nondisclosure restrictions.
Deferred Compensation
The company maintains the 2005 Schneider National, Inc. Supplemental Savings Plan, a deferred compensation plan for its named executive officers. Under this plan, the officer may elect on an annual basis to defer up to 90% of his or her salary and/or bonus. In addition, the plan provides for continuation of company contributions in excess of that otherwise permitted under the qualified retirement plan. This plan assists key employees in planning for retirement. The company pays interest equal to the rate on a treasury bill with 7 years remaining to maturity plus one percent, currently 2.97%, and is reset each December 1st. This plan is unfunded and any amounts are considered a general liability of the company.
116
Table of Contents
Health and Welfare Benefits
The company provides benefits such as medical, dental, vision and life insurance, short-term and long-term disability coverage, and 401(k) and other retirement plan opportunities to all eligible employees, including the named executive officers. The company provides up to $1,000,000 in basic life insurance coverage and up to $10,000 per month in long-term disability coverage. In accordance with SEC rules, the value of these benefits is not included in the Summary Compensation Table for Fiscal Year 2015, because they are available to all employees on a nondiscriminatory basis.
The company matches employee contributions to the 401(k) plan up to a designated maximum amount and provides a retirement contribution dependent on years of service. In the case of the named executive officers and other highly compensated employees, the company’s retirement contribution is made in taxable cash in order to pass certain IRS nondiscrimination tests pertaining to the retirement plan. Further, the company provides up to 18 months of postretirement medical coverage to retirees who (i) are not employed by us as drivers at the time of retirement, (ii) have at least 20 years of service with the company, (iii) retire after age 62 and (iv) are not entitled to Medicare. This benefit is in addition to the 18-month period required under the Consolidated Omnibus Budget Reconciliation Act of 1985 (known as “COBRA”), and is at the retiree’s sole cost. None of our named executive officers were retirement-eligible as of December 31, 2015.
The company also provides vacation, sick leave and other paid holidays to employees, including the named executive officers, which are comparable to those provided at other transportation companies. The company’s commitment to provide employee benefits is due to our recognition that the health and well-being of our employees contribute directly to a productive and successful work life that produces better results for the company and for its employees.
Personal Benefits and Perquisites
In 2013, the company began offering an annual executive physical benefit to our Chief Executive Officer and his direct reports, including the named executive officers. In addition to the cost of the physical itself, the benefit covers ordinary and necessary travel, meals, lodging and tax gross-ups for the meals and lodging incurred in connection with the physical. The aggregate incremental cost of this benefit is reported in the “All Other Compensation” column of the Summary Compensation Table for Fiscal Year 2015. See “—Summary Compensation Table for Fiscal Year 2015.” Our practice of providing tax gross-ups on meals and lodging will be discontinued following the effectiveness of this offering. We do not provide any other personal benefits or perquisites to our named executive officers.
Termination and Change-in-Control Benefits
We do not have employment agreements or pre-established severance agreements with any of our named executive officers.
According to their terms, outstanding LTIP awards held by our named executive officers may become immediately vested, in whole or in part, upon certain termination of employment scenarios or a “change in control.” See “—Potential Payments upon Termination or Change in Control.” We believe that such protections help create an environment where key executives are able to take actions in the best interest of the company without incurring undue personal risk, and foster management stability during periods of potential uncertainty.
Looking Forward
Following this offering, our compensation committee expects that our objectives, principles and procedures for setting compensation levels for our executives will remain unchanged. In addition, we anticipate that all outstanding awards will continue to largely run their course, adjusted as appropriate to avoid undue dilution or
117
Table of Contents
enlargement of rights or value delivered substantially different than that expected when the awards were originally made. Following this offering, our compensation committee expects that we will continue to offer our key employees compensation directly linked to the performance of our business, which we expect will enhance our ability to attract, retain and motivate qualified personnel and serve the interests of our shareholders.
Annual Bonus
In connection with this offering, Schneider intends to make no material modifications to the existing annual bonus plan design for the benefit of our officers and associates, thereby maintaining alignment with the interests of our shareholders.
Equity Incentive Plan
In connection with this offering, we intend to establish an equity incentive plan for the benefit of our officers, key employees and directors, which we will use to provide equity-based incentives to such individuals, aligning their interests with those of our shareholders. See “—2017 Equity Incentive Plan.” Following this offering, we expect to offer three forms of equity awards to our executive officers, as follows:
| • | nonqualified stock options, representing approximately 25% of the annual long-term incentive grant value opportunity; |
| • | performance shares or performance share units, representing approximately 50% of the annual long-term incentive grant value opportunity, utilizing the same performance metrics (compounded net income growth and ROC) and procedures to establish the goals as with our existing long-term cash awards; and |
| • | restricted shares or restricted share units, representing approximately 25% of the annual long-term incentive grant value opportunity, which will vest over time subject to continued employment or service. |
Once the specific terms and conditions relating to vesting, thresholds, maximums, dividend treatment and employment separation have been finalized, a description will be provided in a subsequent amendment to this Registration Statement.
Stock Ownership and Clawback Policies
Following this offering, we expect to adopt the following policies covering our executive officers:
| • | stock ownership policy requiring executive officers to hold a multiple of annual base salary in our shares of common stock, supporting alignment with shareholder’s long-term interests; and |
| • | any incentive compensation “clawback” rules that may apply to us, as and when applicable laws and regulations become effective. |
Under the stock ownership policy that we expect to adopt, our Chief Executive Officer will be required to hold equity that is six times annual base salary, our Chief Operating Officer and Chief Financial Officer will be required to hold equity that is three times annual base salary, and direct reports to our Chief Executive Officer will be required to hold equity that is two times annual base salary. Executives must retain 75% of all net-profit shares from equity awards until the stock ownership policy requirements have been satisfied. Shares owned outright and the after-tax value of time-vested restricted share units will count toward satisfaction of the stock ownership policy.
Other Considerations
At this time, we do not anticipate entering into any new employment agreements or severance arrangements with any of our executive officers in connection with this offering. We expect that our executive officers will continue to be eligible to participate in the benefit programs that we will offer to our employees generally. We expect to continue to provide a nonqualified deferral opportunity.
118
Table of Contents
Following this offering, our compensation committee will consider Section 162(m) of the Internal Revenue Code of 1986, as amended (the “Code”), when designing and implementing our compensation programs, but will maintain flexibility to authorize payments that might not be deductible. As a newly public company, we expect to be eligible for transition relief from the deduction limitations imposed under Section 162(m) of the Code until our first shareholders meeting at which directors are elected that occurs after the close of the third calendar year following the calendar year in which this offering becomes effective. As a result, compensation awards under the 2017 Equity Incentive Plan (described below) (whether in the form of equity or cash bonuses) need not be designed to qualify as performance-based compensation for purposes of Section 162(m) of the Code during this transition period, and our compensation committee may take this into account in determining the terms and conditions of such awards.
Our executive compensation has not historically been the subject of a shareholder advisory vote. Following this offering, to the extent applicable, our compensation committee will consider the results of advisory votes and the views expressed by our shareholders.
Summary Compensation Table for Fiscal Year 2015
The following table summarizes the total compensation earned by, paid to or accrued for our named executive officers who served in such capacities as of December 31, 2015, for their services rendered to the company during fiscal year 2015.
| Name and Principal Position |
Year | Salary ($)(1) |
Stock Awards ($)(2) |
Non—Equity Incentive Plan Compensation ($)(3) |
Change in Pension Value and Nonqualified Deferred Compensation Earnings ($)(4) |
All Other Compensation ($)(5) |
Total ($) | |||||||||||||||||||||
| Christopher B. Lofgren |
2015 | 768,800 | 850,976 | 1,557,699 | — | 148,524 | 3,325,999 | |||||||||||||||||||||
| President and CEO |
||||||||||||||||||||||||||||
| Lori Lutey |
2015 | 399,800 | 240,089 | 462,613 | — | 65,357 | 1,167,858 | |||||||||||||||||||||
| EVP, CFO |
||||||||||||||||||||||||||||
| Mark Rourke |
2015 | 498,013 | 292,592 | 603,791 | — | 157,365 | 1,551,760 | |||||||||||||||||||||
| EVP, COO |
||||||||||||||||||||||||||||
| Steve Matheys |
2015 | 375,000 | 111,568 | 261,300 | — | 52,412 | 800,280 | |||||||||||||||||||||
| EVP, CAO |
||||||||||||||||||||||||||||
| Paul Kardish |
2015 | 325,000 | 102,817 | 167,055 | — | 21,491 | 616,363 | |||||||||||||||||||||
| EVP, General Counsel |
||||||||||||||||||||||||||||
| (1) | Salary amounts shown above are reported as gross earnings (i.e. gross amounts before taxes and applicable payroll deductions), and as such, may include amounts transferred into our nonqualified deferred compensation plan, our 401(k) plan or both. Salary amounts shown above take into account increases in annual base salary rates, following the effective date of such increase. See “—Determining 2015 Compensation—Base Salary.” |
| (2) | Amounts reflect grant date fair value of restricted share awards, determined in accordance with the applicable accounting guidance for equity-based awards. See Note 12 to the audited consolidated financial statements included elsewhere in this prospectus for an explanation of the methodology and assumptions used in the FASB ASC Topic 718 valuations. These awards of restricted shares vest ratably on March 15, 2016, March 15, 2017 and March 15, 2018, subject to continued employment through the applicable vesting date. |
| (3) | Represents (a) the annual bonus earned for 2015, and paid in early 2016, for Mr. Lofgren of $767,550, Ms. Lutey of $248,325, Mr. Rourke of $336,547, Mr. Matheys of $180,600 and Mr. Kardish of $167,055 and (b) the value of the 2012 SAR awards vested in 2015, for Mr. Lofgren of $790,149, Ms. Lutey of |
119
Table of Contents
| $214,288, Mr. Rourke of $267,244 and Mr. Matheys of $80,700. Annual bonus amounts shown above are reported as gross earnings (i.e. gross amounts before taxes and applicable payroll deductions), and as such, may include amounts transferred into our nonqualified deferred compensation plan, our 401(k) plan or both. |
| (4) | None of our named executive officers receive any above-market or preferential earnings in respect of any nonqualified deferred compensation plan or benefit provided by the company. |
| (5) | Further details on the “All Other Compensation” column for fiscal year 2015 are provided in the following table. |
Components of All Other Compensation for Fiscal Year 2015
| Perquisites(a) | Retirement Contributions | |||||||||||||||||||||||||||||||
| Name |
Executive Physical ($) |
Travel, Meals & Lodging ($) |
Tax Gross- Up ($) |
401(k) Company Match ($)(b) |
Taxable Cash Contribution ($)(c) |
Company SSP Contributions ($)(b) |
Retention Credit ($)(d) |
Total ($) |
||||||||||||||||||||||||
| Christopher B. Lofgren |
6,019 | 749 | 417 | 7,950 | 15,900 | 117,489 | — | 148,524 | ||||||||||||||||||||||||
| Lori Lutey |
— | — | — | 7,950 | 5,300 | 12,107 | 40,000 | 65,357 | ||||||||||||||||||||||||
| Mark Rourke |
2,402 | 421 | 212 | 7,950 | 15,900 | 50,479 | 80,000 | 157,365 | ||||||||||||||||||||||||
| Steve Matheys |
2,888 | 78 | 4 | 7,950 | 15,900 | 25,592 | — | 52,412 | ||||||||||||||||||||||||
| Paul Kardish |
2,250 | — | — | 7,950 | 5,300 | 5,991 | — | 21,491 | ||||||||||||||||||||||||
| (a) | Represents costs to the company for the executive physical benefit, affiliated travel, meals and lodging and tax gross-up on the meals and lodging. Our practice of providing tax gross-ups on meals and lodging will be discontinued following the effectiveness of this offering. |
| (b) | Represents contributions for 2015 made in early 2016. |
| (c) | Represents a taxable cash retirement contribution for 2015, which could not be contributed to the named executive officer’s 401(k) account due to limitations under the Code with respect to nondiscrimination testing of our 401(k) plan. |
| (d) | Represents that portion of Retention Credits awarded in prior years which vested during 2015. |
120
Table of Contents
Grants of Plan-based Awards Table for Fiscal Year 2015
The following table reflects estimated possible payouts under equity and non-equity incentive plans to the named executive officers during 2015. In 2015, (i) annual bonuses were awarded under our 2015 annual incentive program to named executive officers, measuring revenue growth and EBIT for the calendar year, (ii) long-term cash awards were granted under the LTIP to the named executive officers, subject to performance goal achievement over a five-year period and continued employment through the end of the performance period, and (iii) restricted share awards were granted under the LTIP subject to a vesting schedule over three years. See “—Determining 2015 Compensation.”
| Estimated Possible Payouts Under Non—Equity Incentive Plan Awards(1) |
||||||||||||||||||||||||||
| Name |
Grant Date | Plan |
Threshold ($)(2) |
Target ($) |
Maximum ($) |
All Other Stock Awards: Number of Shares of Stock (#) |
Grant Date Fair Value of Stock Awards ($) |
|||||||||||||||||||
| Christopher B. Lofgren |
1/17/2015 | Annual Bonus | 850,000 | 1,700,000 | ||||||||||||||||||||||
| 1/17/2015 | Long-Term Cash | 198,600 | 1,986,000 | 4,965,000 | ||||||||||||||||||||||
| 1/17/2015 | Restricted Shares | 4,668 | 850,976 | |||||||||||||||||||||||
| Lori Lutey |
1/17/2015 | Annual Bonus | 275,000 | 550,000 | ||||||||||||||||||||||
| 1/17/2015 | Long-Term Cash | 56,000 | 560,000 | 1,400,000 | ||||||||||||||||||||||
| 1/17/2015 | Restricted Shares | 1,317 | 240,089 | |||||||||||||||||||||||
| Mark Rourke |
1/17/2015 | Annual Bonus | 371,875 | 743,750 | ||||||||||||||||||||||
| 1/17/2015 | Long-Term Cash | 68,300 | 683,000 | 1,707,500 | ||||||||||||||||||||||
| 1/17/2015 | Restricted Shares | 1,605 | 292,592 | |||||||||||||||||||||||
| Steve Matheys |
1/17/2015 | Annual Bonus | 200,000 | 400,000 | ||||||||||||||||||||||
| 1/17/2015 | Long-Term Cash | 26,000 | 260,000 | 650,000 | ||||||||||||||||||||||
| 1/17/2015 | Restricted Shares | 612 | 111,568 | |||||||||||||||||||||||
| Paul Kardish |
1/17/2015 | Annual Bonus | 185,000 | 370,000 | ||||||||||||||||||||||
| 1/17/2015 | Long-Term Cash | 24,000 | 240,000 | 600,000 | ||||||||||||||||||||||
| 1/17/2015 | Restricted Shares | 564 | 102,817 | |||||||||||||||||||||||
| (1) | Actual amounts earned in respect of annual bonus grants shown here are disclosed in the “Non-Equity Incentive Plan Compensation” column of the Summary Compensation Table. See “—Summary Compensation Table for Fiscal Year 2015.” |
| (2) | Awards under our 2015 annual incentive program may be achieved at 0% if neither the revenue growth goal nor the EBIT threshold goal is achieved. See “—2015 Compensation—Annual Bonuses.” Accordingly, no amounts are shown for annual bonus awards under the “Threshold” column. If the revenue growth goal is not achieved, but the EBIT threshold goal is achieved, the annual bonus payout would equal: Christopher B. Lofgren, $212,500; Lori Lutey, $68,750; Mark Rourke, $92,969; Steve Matheys, $50,000; and Paul Kardish, $46,250. |
Material Terms and Conditions of LTIP Awards
The following narrative describes the material terms and conditions of the LTIP awards reported in our Summary Compensation Table for Fiscal Year 2015 and Grants of Plan-Based Award Table for Fiscal Year 2015. See “—Summary Compensation Table for Fiscal Year 2015.”
Restricted Shares. Restricted shares of our Class B common stock vest ratably over a three-year period, subject to continued employment with us through each vesting date, with limited exceptions for a termination of employment due to death or disability, an eligible retirement or a change in control. Dividends are not paid or accumulated during the vesting period.
121
Table of Contents
Long-Term Cash Awards. Our long-term cash awards are target opportunities denominated in cash. They are granted annually and measure company performance over a five-year period. The actual payment to be made in 2020 will depend on the five-year compound annual growth rate of net income (“NI CAGR”) achieved relative to a target of 8% and the five-year average ROC achieved relative to a target of 15% occurring over the 2015-2019 timeframe. The amount ultimately paid is determined according to a schedule and may range from 0% to 250% of target with a threshold entry point of at least 3% NI CAGR and 10% ROC where 10% of target is paid. The award cliff-vests after the end of the five-year performance period, subject to continued employment with us and compliance with the terms of certain restrictive covenants. Individuals who terminate employment due to death, disability, an eligible retirement or a change in control during the performance period will receive a pro rata portion of the cash award. Provided a valid election has been made, the payment may be deferred under our nonqualified deferred compensation plan.
Retention Credits. Our compensation committee occasionally grants mandatorily deferred time-based cash “Retention Credits,” which typically vest in 20% increments over a five-year period based on continued employment with us.
SARs. SARs were awarded to certain of the named executive officers in 2011 and 2012. Each participant received a fixed number of units which generally cliff-vest after three years subject to continued employment with us. SARs are settled in cash after five years from grant, but may be deferred an additional five years from the original scheduled payment date if so elected by the executive, subject to Section 409A of the Code. We maintain an account for each participant, to which we notionally credit the value of the SARs. The value of the SARs is equal to the product of (a) the excess, if any, of the fair market value of a share of our Class B common stock on the date of payment over the grant price and (b) the vested number of SARs granted. Dividends are not paid or accumulated on the SARs. The account is maintained solely for accounting purposes and no assets of the company are segregated or subject to any trust for the participant’s benefit.
Outstanding Equity Awards at End of Fiscal Year 2015
The following tables set forth information concerning equity awards held by the named executive officers as of December 31, 2015.
| Stock Awards | ||||||||
| Name |
Number of Shares of Stock That Have Not Vested (#)(1) |
Market Value of Shares of Stock That Have Not Vested ($)(5) |
||||||
| Christopher B. Lofgren |
1,956 | (2) | 356,579 | |||||
| 3,540 | (3) | 645,342 | ||||||
| 4,668 | (4) | 850,976 | ||||||
| Lori Lutey |
552 | (2) | 100,630 | |||||
| 1,000 | (3) | 182,300 | ||||||
| 1,317 | (4) | 240,089 | ||||||
| Mark Rourke |
651 | (2) | 118,677 | |||||
| 1,178 | (3) | 214,749 | ||||||
| 1,605 | (4) | 292,592 | ||||||
| Steve Matheys |
157 | (2) | 28,621 | |||||
| 384 | (3) | 70,003 | ||||||
| 612 | (4) | 111,568 | ||||||
| Paul Kardish |
282 | (3) | 51,409 | |||||
| 564 | (4) | 102,817 | ||||||
| (1) | These awards of restricted shares vest ratably on March 15, 2016, March 15, 2017 and March 15, 2018, subject to continued employment with us through the applicable vesting date. |
| (2) | The final installment of restricted share awards granted on January 17, 2013 vested on March 15, 2016. |
122
Table of Contents
| (3) | One-half of the remaining portion of the restricted share awards granted on January 17, 2014 vested on March 15, 2016, and one-half of such remaining portion is scheduled to vest on March 15, 2017, subject to continued employment with us. |
| (4) | One-third of the restricted share awards granted on January 17, 2015 vested on March 15, 2016. One-third of such restricted shares is scheduled to vest on March 15, 2017, and the remaining one-third of such restricted shares is scheduled to vest on March 15, 2018, in each case subject to continued employment with us. |
| (5) | Market values are based on the closing book value of a Class B share equal to $182.30 as of December 31, 2015. |
Stock Vested in Fiscal Year 2015
| Stock Awards | ||||||||
| Name |
Number of Shares Acquired on Vesting (#) |
Value Realized on Vesting ($)(1) |
||||||
| Christopher B. Lofgren |
7,101 | 1,294,512 | ||||||
| Lori Lutey |
1,966 | 358,402 | ||||||
| Mark Rourke |
2,382 | 434,239 | ||||||
| Steve Matheys |
693 | 126,334 | ||||||
| Paul Kardish |
141 | 25,704 | ||||||
| (1) | Values are based on the closing book value of a Class B share equal to $182.30 as of the vesting date (March 15, 2015). While values are shown in the above table as of the vesting date, such value is earned based on service over multiple years. |
Nonqualified Deferred Compensation for Fiscal Year 2015
| Name |
Executive Contributions in Last Fiscal Year ($)(1) |
Registrant Contributions in Last Fiscal Year ($)(2) |
Aggregate Earnings in Last Fiscal Year ($)(3)(4) |
Aggregate Withdrawals and Distributions ($) |
Aggregate Balance at Last Fiscal Year End ($) |
|||||||||||||||||
| Christopher B. Lofgren |
SSP |
— | 117,489 | 19,090 | — | 668,787 | ||||||||||||||||
| Retention Credits | — | — | 133,736 | — | 4,634,355 | |||||||||||||||||
| SARs | — | 790,149 | 538,236 | — | 1,811,449 | |||||||||||||||||
|
|
|
|
|
|
|
|
|
|
|
|||||||||||||
| Total | — | 907,638 | 691,062 | — | 7,114,591 | |||||||||||||||||
| Lori Lutey |
SSP |
— | 12,107 | 672 | — | 24,014 | ||||||||||||||||
| Retention Credits | — | — | 6,422 | — | 222,551 | |||||||||||||||||
| SARs | — | 214,288 | 145,946 | — | 491,219 | |||||||||||||||||
|
|
|
|
|
|
|
|
|
|
|
|||||||||||||
| Total | — | 226,395 | 153,040 | — | 737,784 | |||||||||||||||||
| Mark Rourke |
SSP |
— | 50,479 | 5,042 | — | 177,479 | ||||||||||||||||
| Retention Credits | — | — | 41,245 | — | 1,429,275 | |||||||||||||||||
| SARs | — | 267,244 | 182,053 | — | 612,689 | |||||||||||||||||
|
|
|
|
|
|
|
|
|
|
|
|||||||||||||
| Total | — | 317,723 | 228,341 | — | 2,219,443 | |||||||||||||||||
| Steve Matheys |
SSP |
— | 25,592 | 7,505 | — | 261,381 | ||||||||||||||||
| SARs | — | 80,700 | 54,963 | — | 184,992 | |||||||||||||||||
|
|
|
|
|
|
|
|
|
|
|
|||||||||||||
| Total | — | 106,292 | 62,468 | — | 446,373 | |||||||||||||||||
| Paul Kardish |
SSP |
92,385 | 5,991 | 2,877 | — | 124,339 | ||||||||||||||||
|
|
|
|
|
|
|
|
|
|
|
|||||||||||||
| Total | 92,385 | 5,991 | 2,877 | — | 124,339 | |||||||||||||||||
| (1) | Amounts of executive contributions are included in the Summary Compensation Table detailed above. |
123
Table of Contents
| (2) | Represents (a) our Supplemental Savings Plan contributions for 2015, made in early 2016 (which amounts are included in the “All Other Compensation” column of the Summary Compensation Table, above), and (b) the value of the 2012 SAR awards vested in 2015 (which amounts are included in the “Non-Equity Incentive Plan Compensation” column of the Summary Compensation Table, above). |
| (3) | Represents (a) interest which accrued during 2015 on the executive’s and registrant’s contributions and existing balances under the Supplemental Savings Plan, and (b) the change in vested SAR values during 2015. |
| (4) | None of the amounts reported in the “Aggregate Earnings in Last Fiscal Year” column are required to be reported as compensation in the Summary Compensation Table for Fiscal Year 2015 because there were no above-market or preferential earnings on the deferred compensation. None of the amounts reported in the “Aggregate Balance at Last Fiscal Year End” column were reported as compensation in the Summary Compensation Table for prior years because this offering is the first time we have been required to provide this disclosure under SEC rules. |
The Nonqualified Deferred Compensation Table for Fiscal Year 2015, above, includes amounts under the following plans.
Supplemental Savings Plan (or “SSP”). We maintain the 2005 Supplemental Savings Plan, which was amended and restated effective as of December 1, 2007 and subsequently amended on December 31, 2012. The Supplemental Savings Plan is a nonqualified deferred compensation plan that allows eligible employees to defer a portion of their compensation. Participants can elect to defer up to a maximum of 90% of their base salary as well as up to 90% of their bonus for the year. In addition, the plan provides for continuation of company contributions in excess of that otherwise permitted under the qualified plan. The compensation deferred under this plan is credited with earnings equal to the rate on a treasury bill with 7 years remaining to maturity plus one percent, currently 2.97%, and is reset each December 1st. Each participant is fully vested in the deferred compensation and earnings which they contribute and which we contribute towards their retirement. All amounts are considered unfunded and are subject to general creditor claims until actually distributed to the employee. A participant may elect to receive their elective deferrals in one lump sum payment or in annual installments payable over a period of three, five or ten years. Non-elective retirement deferrals are paid out 50% in January of the year following separation of employment and 50% the January following that.
Retention Credits. Retention Credits, if any, are subject to a five-year vesting schedule. Vested Retention Credits are paid out in March following the second anniversary of the date of the employee’s termination of employment with us, provided the employee has not violated the terms of his or her restrictive covenant agreements.
SARs. Vested SARs are notionally credited with the appreciation or depreciation of our Class B common stock, until the awards are settled. See “—Material Terms and Conditions of LTIP Awards—SARs.” SARs are settled in cash after five years from grant, but may be deferred an additional five years from the original scheduled payment date subject to Section 409A of the Code.
Potential Payments upon Termination or Change in Control
The company does not have employment agreements or predetermined personal severance agreements with any of its executives. According to the terms of our LTIP awards, certain outstanding awards held by our named executive officers accelerate all or in part upon death, disability, change in control and retirement, as described below.
Restricted Shares. Restricted shares immediately vest in full upon a change in control or upon a termination of employment due to death, disability or eligible retirement (provided that restricted shares granted in 2015 will continue to vest on the original vesting schedule upon retirement). Upon termination of employment for any reason other than death, disability or eligible retirement (including termination for cause or voluntary resignation), unvested restricted shares are forfeited.
124
Table of Contents
Long-Term Cash Awards. Long-term cash awards held by our named executive officers vest as to the service-vesting condition on a pro rata basis upon termination of employment by reason of death, disability, eligible retirement or change in control during the performance period. The amount will be determined by our compensation committee, taking into account the executive’s completed calendar years of service during the performance period and the attained level of performance with respect to such year. Such vested amounts are payable within 90 days following such termination of employment. Upon termination of employment for any reason other than death, disability, eligible retirement or change in control (including termination for cause or voluntary resignation), the unvested portion of the award is forfeited, and any vested portion of the award is payable in cash within 90 days following the end of the five-year performance period. Payment of long-term cash awards is subject to compliance with the company’s restrictive covenant agreements.
Retention Credits. Retention Credits immediately vest in full upon termination of employment due to death, disability or eligible retirement (provided that unvested retention credits granted in 2015 are forfeited upon retirement unless otherwise determined by our compensation committee). Vested Retention Credits are payable within 90 days following death. In the case of termination of employment due to disability or eligible retirement, vested Retention Credits are payable on the normal payment date in March following the second anniversary of the date of termination of employment. Vesting of Retention Credits does not accelerate upon a change in control. Upon termination of employment for any reason other than death, disability or eligible retirement (including termination for cause or voluntary resignation), unvested Retention Credits are forfeited, and any then vested Retention Credits are payable on the normal payment date in March following the second anniversary of the date of termination of employment.
SARs. SARs account balances will be payable in a lump sum within 90 days following the executive’s termination of employment or a change in control (such account balances are set forth in the Nonqualified Deferred Compensation Table for Fiscal Year 2015). See “—Nonqualified Deferred Compensation for Fiscal Year 2015.”
Generally, for purposes of the LTIP awards described above, a “change in control” means the date on which a person or group of affiliated or associated persons (an “acquiring person”) has acquired legal or beneficial ownership of more than 50% of the outstanding shares of the voting stock of Schneider National, Inc., or the date an acquiring person acquires all or substantially all of the assets of Schneider National, Inc. Transfers of voting stock of Schneider National, Inc. among trusts held for the primary benefit of members of the Donald J. Schneider family would not constitute a change in control.
Retirement treatment of LTIP awards is conditioned on, among other things, the executive reaching the required retirement age of 59 1⁄2 and having at least ten consecutive years of service with us. As of December 31, 2015, none of the named executive officers met the required retirement age of 59 1⁄2.
125
Table of Contents
Potential benefits of the named executive officers due to death, disability or a change in control (other than payment of deferred compensation accounts) are shown in the table below, assuming such event occurred as of December 31, 2015.
| Value of Long- Term Cash Awards ($)(1) |
Value of Acceleration of Restricted Shares ($)(2) |
Value of Acceleration of Retention Credits ($)(3) |
Total ($) | |||||||||||||
| Christopher B. Lofgren |
||||||||||||||||
| Change in Control |
2,383,200 | 1,852,897 | 0 | 4,236,097 | ||||||||||||
| Death or Disability |
2,383,200 | 1,852,897 | 0 | 4,236,097 | ||||||||||||
| Lori Lutey |
||||||||||||||||
| Change in Control |
672,000 | 523,019 | 0 | 1,195.019 | ||||||||||||
| Death or Disability |
672,000 | 523,019 | 44,510 | 1,239,529 | ||||||||||||
| Mark Rourke |
||||||||||||||||
| Change in Control |
828,600 | 626,018 | 0 | 1,454,618 | ||||||||||||
| Death or Disability |
828,600 | 626,018 | 173,561 | 1,628,179 | ||||||||||||
| Steve Matheys |
||||||||||||||||
| Change in Control |
282,400 | 210,192 | 0 | 492,592 | ||||||||||||
| Death or Disability |
282,400 | 210,192 | 0 | 492,592 | ||||||||||||
| Paul Kardish |
||||||||||||||||
| Change in Control |
111,000 | 154,226 | 0 | 265,226 | ||||||||||||
| Death or Disability |
111,000 | 154,226 | 0 | 265,226 | ||||||||||||
| (1) | Represents amounts payable under the long-term cash awards granted in 2013, 2014 and 2015 to our named executive officers that vest as to the service-vesting condition on a pro rata basis upon termination of employment by reason of death, disability or change in control, assuming performance achievement yielding a 100% payout of the executive’s target dollar value award, appropriately prorated through December 31, 2015. |
| (2) | Represents value of restricted shares held by our named executive officers that vest upon a change in control or upon a termination of employment due to death or disability, using the closing book value of a share of Class B common stock equal to $182.30 as of December 31, 2015. |
| (3) | Represents amounts payable in respect of Retention Credits, which immediately vest in full upon termination of employment due to death or disability. |
2017 Equity Incentive Plan
We plan to adopt the Equity Incentive Plan pursuant to which equity-based and cash incentives may be granted to participating employees, directors and consultants. We expect our Board of Directors to adopt, and our shareholders to approve, the Equity Incentive Plan prior to the consummation of this offering. The Equity Incentive Plan will provide for an aggregate of shares of our Class B common stock. Immediately following the adoption of the Equity Incentive Plan, no new awards will be granted under our LTIP.
Director Compensation for Fiscal Year 2015
Currently, we provide each of our non-employee directors with an annual cash retainer of $125,000 and annual equity awards of $75,000, each awarded quarterly in arrears. We provide additional annual cash retainers of $75,000 for the chairperson and $10,000 for each committee chairperson. Directors may elect to receive their annual cash retainers in cash or equity. Equity awards are fully vested at grant. Retainers are prorated when a director joins or leaves the Board of Directors or a chairperson position. Directors do not receive meeting fees. All directors are eligible to participate in our medical plan and dental plan on a basis equivalent to employees of the company.
Under our director stock ownership policy, we require non-employee directors to purchase Class B shares of stock of the company, with a value of at least two times their annual cash retainer, within two years of their
126
Table of Contents
election to the Board of Directors. Shares received by electing to receive annual cash retainers in equity count towards the stock ownership policy requirement; annual equity awards do not count towards the stock ownership policy requirement. As of December 31, 2015, all of our non-employee directors satisfied our director stock ownership policy.
The following table sets forth the compensation for each of our non-employee directors in 2015:
| Name |
Fees earned or paid in cash ($)(1) |
Stock awards ($)(2)(3) |
Non-equity incentive plan compensation ($) |
Nonqualified Deferred Compensation Earnings ($) |
All Other Compensation ($) |
Total ($) |
||||||||||||||||||
| Daniel J. Sullivan |
200,000 | 75,000 | 0 | 0 | 0 | 275,000 | ||||||||||||||||||
| Norman E. Johnson |
135,000 | 75,000 | 0 | 0 | 0 | 210,000 | ||||||||||||||||||
| Robert W. Grubbs |
125,000 | 75,000 | 0 | 0 | 0 | 200,000 | ||||||||||||||||||
| Adam P. Godfrey |
135,000 | 75,000 | 0 | 0 | 0 | 210,000 | ||||||||||||||||||
| R. Scott Trumbull |
125,000 | 75,000 | 0 | 0 | 0 | 200,000 | ||||||||||||||||||
| Thomas A. Gannon |
135,000 | 75,000 | 0 | 0 | 0 | 210,000 | ||||||||||||||||||
| (1) | Represents the portion of the annual Board of Directors and chairperson retainers that was earned during 2015, paid quarterly in arrears. All such fees were paid in Class B shares, at the director’s election. The number of Class B shares issued was calculated using the value of a Class B share as of December 31, 2014, which was $182.30. |
| (2) | Amounts reflect grant date fair value of restricted share awards, determined in accordance with the applicable accounting guidance for equity-based awards. See Note 12 to the audited consolidated financial statements included elsewhere in this prospectus for an explanation of the methodology and assumptions used in the FASB ASC Topic 718 valuations. |
| (3) | All such equity awards were fully vested at grant. |
Upon the closing of this offering, we may grant equity-based compensation to our directors. Further, we approved and implemented a new director compensation policy that, effective upon the closing of this offering, will become applicable to all of our non-employee directors. Under the new director compensation policy, each non-employee director will be entitled to:
| • | an annual cash retainer of $75,000, paid quarterly in arrears, which the director can elect to receive in whole or in part in the form of restricted share units; and |
| • | equity-based compensation of $125,000 in the form of restricted share units, which will vest on the earlier of (x) the one-year anniversary of the grant date and (y) the following year’s shareholder meeting. |
We expect to reallocate our annual retainer amounts so that a greater portion of annual director compensation is weighted toward equity. Any director who joins the Board mid-year will receive a pro rata portion of equity-based compensation for service during the balance of the director’s service year, which will vest on the date of the next annual meeting.
In addition, our new director compensation policy provides for annual retainers for the chairperson of our Board of Directors and committee chairs, in the following amounts:
| • | $100,000 for the chairperson; |
| • | $20,000 for the chair of our audit committee; |
| • | $15,000 for the chair of our compensation and leadership committee; and |
| • | $10,000 for the chair of our nominating and governance committee. |
127
Table of Contents
Under our new director compensation policy, directors may elect to defer all or a portion of their cash compensation and/or settlement of their restricted share units. Equity awards will be granted to each director annually at the date of the annual shareholder meeting, prospectively for the year of service following the annual shareholder meeting. Directors joining the Board of Directors mid-year will receive a prorated equity grant in light of their partial year of service. Until the first annual shareholder meeting, we will continue with our practice of retrospective quarterly equity grants.
We have also approved a new director stock ownership policy, pursuant to which each non-employee director will be expected to retain equity with value at least equal to five times his or her annual cash retainer. We will no longer expect that directors will purchase stock; instead, each director will be required to maintain 75% of all shares from their equity awards on an after-tax basis, until achievement of the requirements of our director stock ownership policy. Only shares held outright and deferred stock units, not unvested equity awards, will count toward the director stock ownership policy.
128
Table of Contents
CERTAIN RELATIONSHIPS AND RELATED TRANSACTIONS
In addition to the compensation arrangements with directors and executive officers described under “Compensation Discussion and Analysis” and the Schneider Family Board Nomination Process Agreement described below, the following is a description of each transaction that has occurred during our last three fiscal years, and each currently proposed transaction in which:
| • | we have been or are to be a participant; |
| • | the amount involved exceeded or will exceed $120,000; and |
| • | any of our directors, executive officers, beneficial holders of more than 5% of our capital stock, or any member of their immediate family or person sharing their household had or will have a direct or indirect material interest. |
Schneider Family Board Nomination Process Agreement
Pursuant to the Schneider Family Board Nomination Process Agreement, five specified members of the Schneider family shall have the right to nominate, and the company shall include in the slate of nominees recommended to shareholders of the company for election as a director at any meeting of shareholders at which directors are to be elected, two family members to serve on our Board of Directors on an annual, rotating basis. Each Schneider family member nominated in accordance with such agreement must satisfy the qualifications for service as a director set forth in the Amended and Restated Bylaws or such qualifications must be waived in accordance with such Amended and Restated Bylaws. The directorships will rotate among the five Schneider family members through 2025, with each director anticipated to serve for three consecutive years, plus the remainder of any current rotation at the time of the consummation of this offering. After the rotation system described above is complete, the five specified Schneider family members may, if they have at least 80% of such family members in agreement, propose to the corporate governance committee an amendment to the agreement, consistent with such agreement, to cover nominations in subsequent periods, the approval of which shall not be unreasonably withheld by either the corporate governance committee or the Board of Directors.
Registration Rights Agreement
Certain holders of shares of our Class A common stock and Class B common stock are entitled to rights with respect to the registration of their shares following this offering under the Securities Act. For a description of these registration rights, see “Description of Capital Stock—Registration Rights.”
Employment Arrangements
We have employed Thomas Gannon, who is a director of our company, as a financial and tax adviser to the Schneider family and certain of the family trusts established for the benefit of the Schneider family. Mr. Gannon’s employment has also included responsibility for administrative matters relating to our company’s shareholders (including both the Schneider family and management investors), shareholder communications and oversight over all transactions in our company stock, including equity awards, and, until 2015, service as secretary of our company. Mr. Gannon has indicated to us that he intends to resign from his employment at the time of this offering. Mr. Gannon also serves as trustee for certain of the family trusts established for the benefit of the Schneider family members that hold greater than 5% of our common stock.
The foregoing employment roles and Mr. Gannon’s compensation were established in 2004 by our chairman of the Board of Directors at the time, Donald J. Schneider. In the previous three fiscal years, we paid Mr. Gannon a total amount of $698,678 in 2015, including $650,000 in salary, $10,728 in nonqualified deferred compensation interest, $7,950 in 401(k) matching contributions, $15,900 in retirement cash payments and $14,100 in nonqualified retirement contributions, $699,169 in 2014, including $650,000 in salary, $10,774 in
129
Table of Contents
nonqualified deferred compensation interest, $7,800 in 401(k) matching contributions, $15,600 in retirement cash payment, $14,400 in nonqualified retirement contributions, $357 in 410(k) contribution returns and $238 in cash to offset 401(k) match losses, and $694,162 in 2013, including $650,000 in salary, $6,512 in nonqualified deferred compensation interest, $7,650 in 401(k) matching contributions, $15,300 in retirement cash payment and $14,700 in nonqualified retirement contributions. During this three-year period, Mr. Gannon also received fees for his service as a director. See “Compensation Discussion and Analysis—Director Compensation for Fiscal Year 2015.”
Policies and Procedures for Related Party Transactions
Our Board of Directors will adopt a written related person transaction policy, to be effective upon the closing of this offering, setting forth the policies and procedures for the review and approval or ratification of related person transactions. This policy will cover any transaction, arrangement or relationship, or any series of similar transactions, arrangements or relationships, in which we were or are to be a participant and a related person had or will have a direct or indirect material interest, as determined by our Board of Directors, including purchases of goods or services by or from the related person or entities in which the related person has a material interest and indebtedness, guarantees of indebtedness or employment by us of a related person. In reviewing any such proposal, our Board of Directors will be tasked to consider all relevant facts and circumstances, including the commercial reasonableness of the terms, the benefit or perceived benefit, or lack thereof, to us, opportunity costs of alternate transactions, the materiality and character of the related person’s direct or indirect interest and the actual or apparent conflict of interest of the related person.
All related party transactions described in this section occurred prior to adoption of this policy and, as such, these transactions were not subject to the approval and review procedures set forth in the policy.
130
Table of Contents
PRINCIPAL AND SELLING SHAREHOLDERS
At the time of this offering, there is one record holder of Class A common stock and approximately record holders of Class B common stock. The following table sets forth information regarding beneficial ownership of our Class A common stock and Class B common stock immediately prior to the initial public offering and after giving effect to the initial public offering, by:
| • | each of the directors and named executive officers individually; |
| • | all directors and executive officers as a group; |
| • | each other selling shareholder; and |
| • | each person whom we know to own beneficially more than 5% of our Class A or Class B common stock. |
The number of shares of Class B common stock outstanding after this offering includes shares of Class B common stock being offered for sale by us and by the selling shareholders in this offering and assumes no exercise of the underwriters’ over-allotment option. The percentage of beneficial ownership for the following table is based on shares of Class A common stock and shares of Class B common stock outstanding immediately prior to the initial public offering, and shares of Class A common stock and shares of Class B common stock outstanding after the completion of this offering and assumes no exercise of the underwriters’ over-allotment option.
Beneficial ownership for purposes of the following table is determined in accordance with the rules and regulations of the SEC. These rules generally provide that a person is the beneficial owner of securities if they have or share the power to vote or direct the voting thereof, or to dispose or direct the disposition thereof, or have the right to acquire such powers within 60 days. Accordingly, the following table does not include options to purchase shares of our common stock that are not exercisable within the next 60 days. To our knowledge, except as indicated in the footnotes to this table and pursuant to applicable community property laws, the persons named in the table have sole voting and investment power with respect to all shares of Class A or Class B common stock. Unless otherwise indicated, the address of each beneficial owner listed in the table below is 3101 Packerland Dr., Green Bay, WI 54313.
| Shares of Class A Common Stock Beneficially Owned(1) |
Percentage of Shares of |
Shares of Class B Common Stock Beneficially Owned |
Shares of Class B Common Stock Offered Hereby |
Percentage of Shares of |
Percentage of | |||||||||||||||||||
| Name of Beneficial Owner |
Before |
After |
Before |
After |
Before |
After | ||||||||||||||||||
| Named executive officers and directors(7): |
||||||||||||||||||||||||
| Christopher B. Lofgren |
||||||||||||||||||||||||
| Paul Kardish |
||||||||||||||||||||||||
| Lori Lutey |
||||||||||||||||||||||||
| Steve Matheys |
||||||||||||||||||||||||
| Mark Rourke |
||||||||||||||||||||||||
| Thomas Gannon(8)(9) |
||||||||||||||||||||||||
| Adam Godfrey(8) |
||||||||||||||||||||||||
| Robert Grubbs(8) |
||||||||||||||||||||||||
| Norman Johnson(8) |
||||||||||||||||||||||||
| Daniel Sullivan(8) |
||||||||||||||||||||||||
| R. Scott Trumbull(8) |
||||||||||||||||||||||||
| Therese Koller (10) |
||||||||||||||||||||||||
| Kathleen Zimmermann(11) |
||||||||||||||||||||||||
131
Table of Contents
| Shares of Class A Common Stock Beneficially Owned(1) |
Percentage of Shares of |
Shares of Class B Common Stock Beneficially Owned |
Shares of Class B Common Stock Offered Hereby |
Percentage of Shares of |
Percentage of Total | |||||||||||||||||||
| Name of Beneficial |
Before |
After |
Before |
After |
Before |
After | ||||||||||||||||||
| All directors and executive officers as a group ( persons) |
||||||||||||||||||||||||
| Other greater than 5% Shareholders: |
||||||||||||||||||||||||
| Joan Klimpel(12) |
||||||||||||||||||||||||
| Thomas Schneider(13) |
||||||||||||||||||||||||
| Mary DePrey(14) |
||||||||||||||||||||||||
| Paul Schneider(15) |
||||||||||||||||||||||||
| Schneider National, Inc. Voting Trust(16) |
||||||||||||||||||||||||
| * | Less than 1% |
| (1) | Class A (10 votes per share) and Class B (1 vote per share). The Schneider National, Inc. Voting Trust is the record holder of all shares of Class A common stock. See “Description of Capital Stock—Class A Common Stock.” |
| (2) | Assumes Class A shares outstanding. |
| (3) | Assumes Class B shares outstanding. |
| (4) | Assumes Class B shares outstanding. |
| (5) | Assumes Class A has votes and Class B has votes (for a total of ). |
| (6) | Assumes Class A has votes and Class B has votes (for a total of ). |
| (7) | The listed individuals will be directors and officers at the time of effectiveness of this registration statement and the initial public offering. |
| (8) | Excludes Class A shares subject to the terms of the Voting Trust. |
| (9) | Consists of (i) Class A shares held in trust for the benefit of members of the Schneider family for which Mr. Gannon serves as co-trustee with Ms. Klimpel, over which Mr. Gannon has shared voting and dispositive power, subject to the terms of the Voting Trust, (ii) Class B shares held in trust for the benefit of members of the Schneider family for which Mr. Gannon serves as co-trustee with Ms. Klimpel, over which Mr. Gannon has shared voting and dispositive power and (iii) Class B shares held in trust for the benefit of members of the Schneider family for which Mr. Gannon serves as the sole trustee, over which he has sole voting and dispositive power. Mr. Gannon is also a director of the company. Class B common shares owned by Mr. Gannon have been pledged as security to a financial institution. |
| (10) | Consists of (i) Class A shares held in trust for the benefit of Ms. Koller and her descendants for which Ms. Koller serves as co-trustee with Ms. Klimpel, over which Ms. Koller has shared voting and dispositive power, subject to the terms of the Voting Trust, (ii) Class B shares held in trust for the benefit of Ms. Koller and her descendants for which Ms. Koller serves as co-trustee with Ms. Klimpel, over which Ms. Koller has shared voting and dispositive power, (iii) Class B shares held directly by Ms. Koller over which she has sole voting and dispositive power and (iv) Class B shares held in trust for Ms. Koller’s children for which Ms. Koller is the sole trustee, over which she has sole voting and dispositive power. |
| (11) | Consists of (i) Class A shares held in trust for the benefit of Ms. Zimmermann and her descendants for which Ms. Zimmermann serves as co-trustee with Ms. Klimpel, over which Ms. Zimmermann has shared voting and dispositive power, subject to the terms of the Voting Trust, (ii) Class B shares held in trust for the benefit of Ms. Zimmermann and her descendants for which Ms. Zimmermann serves as co-trustee with Ms. Klimpel, over which Ms. Zimmermann has shared voting and dispositive power and (iii) Class B shares held directly by Ms. Zimmermann and her spouse, over which she and her spouse have sole voting and dispositive power. |
| (12) | Consists of (i) Class A shares held in trust for the benefit of members of the Schneider family for which Ms. Klimpel serves as co-trustee with Mr. Gannon, over which Ms. Klimpel has shared voting and dispositive power, subject to the terms of the Voting Trust, (ii) Class A shares held in trust for the benefit of members of the Schneider family for which Ms. Klimpel serves as co-trustee with Mr. Thomas Schneider, Ms. DePrey, Ms. Koller, Ms. Zimmermann and Mr. Paul Schneider, respectively, over which Ms. Klimpel has shared voting and dispositive power, subject to the terms of the Voting Trust, (iii) Class B shares held in trust for the benefit of members of the Schneider family for which Ms. Klimpel serves as co-trustee with Mr. Gannon, over which Ms. Klimpel has shared voting and dispositive power, (iv) Class B shares held in trust for the benefit of members of the Schneider family for which Ms. Klimpel serves as co-trustee with Mr. Thomas Schneider, Ms. DePrey, Ms. Koller, Ms. Zimmermann and Mr. Paul Schneider, respectively, over which Ms. Klimpel has shared voting and dispositive power and (v) Class B shares held in trust for the benefit of members of the Schneider family for which Ms. Klimpel serves as sole trustee, over which she has sole voting and dispositive power. |
| (13) | Consists of (i) Class A shares held in trust for the benefit of Mr. Schneider for which Mr. Schneider serves as co-trustee with Ms. Klimpel, over which Mr. Schneider has shared voting and dispositive power, subject to the terms of the Voting Trust, (ii) Class B |
132
Table of Contents
| shares held in trust for the benefit of Mr. Schneider for which Mr. Schneider serves as co-trustee with Ms. Klimpel, over which Mr. Schneider has shared voting and dispositive power and (iii) Class B shares held directly by Mr. Schneider, over which he has sole voting and dispositive power. |
| (14) | Consists of (i) Class A shares held in trust for the benefit of Ms. DePrey and her descendants for which Ms. DePrey serves as co-trustee with Ms. Klimpel, over which Ms. DePrey has shared voting and dispositive power, subject to the terms of the Voting Trust, (ii) Class B shares held in trust for the benefit of Ms. DePrey and her descendants for which Ms. DePrey serves as co-trustee with Ms. Klimpel, over which Ms. DePrey has shared voting and dispositive power, (iii) Class B shares held directly by Ms. DePrey, over which she has sole voting and dispositive power and (iv) Class B shares held in trust for Ms. DePrey’s children for which Ms. DePrey is the sole trustee, over which she has sole voting and dispositive power. |
| (15) | Consists of (i) Class A shares held in trust for the benefit of Mr. Schneider and his descendants for which Mr. Schneider serves as co-trustee with Ms. Klimpel, over which Mr. Schneider has shared voting and dispositive power, subject to the terms of the Voting Trust, (ii) Class B shares held in trust for the benefit of Mr. Schneider and his descendants for which Mr. Schneider serves as co-trustee with Ms. Klimpel, over which Mr. Schneider has shared voting and dispositive power and (iii) Class B shares held directly by Mr. Schneider, over which he has sole voting and dispositive power. |
| (16) | Consists of Class A shares over which the members of the Corporate Governance Committee who serve as trustees of the Voting Trust, have shared voting power with the trustees of the trusts which have deposited such shares into the Voting Trust, subject to the terms of the Voting Trust. |
133
Table of Contents
The following descriptions are summaries of the material terms of our Amended and Restated Articles of Incorporation, Amended and Restated Bylaws, Amended and Restated 1995 Schneider National, Inc. Voting Trust Agreement and Voting Agreement, Amended and Restated Stock Restriction Agreement and the Schneider Family Board Nomination Process Agreement that will be in effect at or prior to the consummation of this offering. Reference is made to the more detailed provisions of, and the descriptions are qualified in their entirety by reference to, these documents, forms of which are exhibits to the registration statement of which this prospectus is a part, and applicable law including the Wisconsin Business Corporation Law (WBCL).
General
Following completion of this offering, our authorized capital stock will consist of 250,000,000 shares of Class A common stock, no par value per share, 750,000,000 shares of Class B common stock, no par value per share and 50,000,000 shares of preferred stock, no par value per share.
Class A Common Stock
Class A common stock outstanding. Upon completion of this offering, there will be shares of Class A common stock outstanding. All outstanding shares of Class A common stock are fully paid and non-assessable. The Schneider National, Inc. Voting Trust (the “Voting Trust”) holds all outstanding shares of Class A common stock for the benefit of certain Schneider family trusts.
Voting rights. The holder of Class A common stock is entitled to ten votes per share on all matters to be voted upon by our shareholders. See “Voting Trust Agreement.”
Conversion. The Voting Trust is the sole qualified Class A shareholder that is qualified to hold Class A common stock. Our shares of Class A common stock will automatically convert into shares of Class B common stock on a one-for-one basis upon any transfer of Class A common stock, whether or not for value and whether voluntary or involuntary, in exchange for a trust certificate of the Voting Trust representing such share. We shall at all times reserve and keep available out of our authorized but unissued shares of Class B common stock a number of shares of Class B common stock sufficient to effect the conversion of all then outstanding shares of Class A common stock. Our Class A common stock is not and will not be listed for trading on any national stock exchange. Therefore, no trading market is expected to develop in our Class A common stock.
Class B Common Stock
Class B common stock outstanding. Upon completion of this offering, there will be shares of Class B common stock outstanding, assuming no exercise of the underwriters’ over-allotment option, after giving effect to the sale of shares of Class B common stock offered in this offering. All outstanding shares of Class B common stock are fully paid and non-assessable. The Schneider family and trusts for their benefit will beneficially own outstanding shares of Class B common stock upon completion of this offering.
Voting rights. The holders of Class B common stock are entitled to one vote per share on all matters to be voted upon by our shareholders. Our Class A shareholders and Class B shareholders will vote together as a single group on all matters (including the election of directors) submitted to a vote of shareholders, subject to voting with respect to distribution rights as explained below, except as otherwise expressly provided for in our Amended and Restated Articles of Incorporation or required by applicable law.
Conversion. Our Class B common stock is not convertible into any other shares of our capital stock.
134
Table of Contents
Other Rights of Class A Common Stock and Class B Common Stock Generally
Except as otherwise provided in our Amended and Restated Articles of Incorporation or as required by applicable law, the rights of the holders of Class A common stock and Class B common stock are identical, except for the voting rights and conversion, as described above.
Distribution rights. Subject to preferences that may be applicable to any outstanding preferred stock and except as otherwise provided in the Amended and Restated Articles of Incorporation, the holders of Class A common stock and Class B common stock are entitled to receive ratably such dividends, if any, as may be declared from time to time by the Board of Directors out of funds legally available therefor. See “Dividend Policy.” However, a different dividend per share of Class A common stock and Class B common stock may be made if such different dividend is approved in advance by the affirmative vote of the holders of a majority of the outstanding shares of both Class A common stock and Class B common stock, each voting as a separate group. Also, see “—Merger or consolidation” below.
Rights upon liquidation. In the event of any dissolution, liquidation or winding up of the company, the holders of Class A common stock and Class B common stock are entitled to share ratably in all assets and funds remaining after payment of liabilities, subject to prior distribution rights of preferred stock, if any, then outstanding. However, a different distribution per share of Class A common stock and Class B common stock may be made if such different distribution is approved in advance by the affirmative vote of the holders of a majority of the outstanding shares of both Class A common stock and Class B common stock, each voting as a separate group.
Subdivision or combination. Shares of Class A common stock and Class B common stock may not be subdivided or combined unless the shares of the other class are concurrently therewith proportionately subdivided or combined in the manner that maintains the same proportionate equity ownership between the holders of the outstanding Class A common stock and Class B common stock on the record date of such subdivision or combination. However, the shares of one class may be subdivided or combined in a different or disproportionate manner if such subdivision or combination is approved in advance by the affirmative vote of the holders of a majority of the outstanding shares of both Class A common stock and Class B common stock, each voting as a separate group.
Merger or consolidation. In the case of any distribution or payment in respect of the shares of Class A common stock and Class B common stock upon the consolidation or merger of the company with or into any other entity, such distribution or payment shall be made ratably on a per share basis among the holders of Class A common stock and Class B common stock as a single class. However, shares of one such class may receive different or disproportionate distributions or payments in connection with such merger or consolidation if (i) the only difference in the per share distribution to the holders of the Class A common stock and Class B common stock is that any securities distributed to a holder of a share of Class A common stock have ten times the voting power of any securities distributed to the holder of Class B common stock or (ii) such merger or consolidation is approved by the affirmative vote of the holders of a majority of the outstanding shares of both Class A common stock and Class B common stock, each voting as a separate group.
Other rights. The holders of our Class A common stock and Class B common stock have no preemptive, subscription or conversion rights. There are no redemption or sinking fund provisions applicable to the Class A common stock and Class B common stock. The rights, preferences and privileges of holders of our Class A common stock and Class B common stock will be subject to those of the holders of any shares of our preferred stock we may issue in the future.
Preferred Stock
Our Board of Directors has the authority to issue shares of preferred stock in one or more series and to fix the rights, preferences, privileges and restrictions thereof, including dividend rights, dividend rates, conversion, voting rights, terms of redemption, redemption prices, liquidation preferences and the number of shares constituting any series or the designation of such series, without further vote or action by the shareholders.
135
Table of Contents
The issuance of preferred stock may have the effect of delaying, deferring or preventing a change in control of the company without further action by the shareholders and may adversely affect the voting and other rights of the holders of Class B common stock. At present, we have no plans to issue any preferred stock.
Election and Removal of Directors; Vacancies
Our Board of Directors will consist of up to fifteen directors, excluding any directors elected by holders of preferred stock voting separately as a series under our Amended and Restated Articles of Incorporation. The exact number of directors will be fixed from time to time by resolution of the Board of Directors. In accordance with our Amended and Restated Articles of Incorporation, our Amended and Restated Bylaws and the Schneider Family Board Nomination Process Agreement, each of our directors will serve for a one-year term or until his or her successor is elected. At each annual meeting of our shareholders, our shareholders will elect the members of our Board of Directors. There will be no limit on the number of terms a director may serve on our Board of Directors.
No Cumulative Voting
The WBCL provides that shareholders are not entitled to the right to cumulate votes in the election of directors unless our Amended and Restated Articles of Incorporation provides otherwise. Our Amended and Restated Articles of Incorporation do not provide for cumulative voting for the election of directors.
Shareholder Action by Written Consent
The WBCL permits shareholder action by written consent if so provided by our Amended and Restated Articles of Incorporation. Our Amended and Restated Articles of Incorporation and Amended and Restated Bylaws permit shareholder action by written consent for any action that may be taken at a shareholders’ meeting if written consents are submitted and signed by shareholders entitled to vote at a meeting with voting power not less than the minimum number of votes entitled to vote on such action were a meeting to vote on such action to be held.
Shareholder Meetings
Our Amended and Restated Bylaws provide that special meetings of shareholders may be called only by our Board of Directors or our chief executive officer. Our Amended and Restated Bylaws also provide that a special meeting of shareholders may be held if written demand(s) are submitted by holders of at least ten percent of all votes entitled to be cast on any issue proposed to be considered at such meeting.
Shareholder Approval of Major Transactions
Our Amended and Restated Bylaws state that we shall not enter into any “Major Transaction” unless the consummation of the proposed Major Transaction is conditioned upon the approval of such Major Transaction by 60% of the voting power of our outstanding shares of stock. Our Amended and Restated Bylaws define a Major Transaction as any one of the following: (i) any transaction to which we are party that results in, or would result in, more than 40% of the voting power of our outstanding shares of stock being held collectively by persons who are not members of the Schneider family, (ii) the sale of all or substantially all of our assets, (iii) our dissolution or liquidation, (iv) changing the location of our headquarters from Green Bay, Wisconsin to a different location, (v) the removal of the name “Schneider” from our legal and/or business name or (vi) changing our official color from orange. Our Amended and Restated Articles of Incorporation provide that we shall not enter into any proposed Major Transaction except in accordance with our Amended and Restated Bylaws.
Amendment of Amended and Restated Articles of Incorporation
The affirmative vote of holders of at least 50% of the voting power of our outstanding shares of stock will generally be required to amend provisions of our Amended and Restated Articles of Incorporation. The
136
Table of Contents
affirmative votes of at least 75% of our directors and of at least 80% of the outstanding shares of Class A common stock shall be required to amend certain provisions of our Amended and Restated Articles of Incorporation, including the provision related to a Major Transaction described above.
Amendment of Amended and Restated Bylaws
Our Amended and Restated Bylaws may generally be altered, amended or repealed, and new bylaws may be adopted, with:
| • | the affirmative vote of a majority of our directors; or |
| • | the affirmative vote of holders of at least a majority of the voting power of our outstanding shares of voting stock. |
The affirmative votes of at least 75% of our directors and of at least 80% of the outstanding shares of Class A common stock and Class B common stock shall be required to amend certain provisions of our Amended and Restated Bylaws, including the corporate governance bylaws, such as director nominations, voting for directors, director qualifications, tenure of directors, director vacancies, committees, indemnification, shareholder approval of Major Transactions and the power to amend certain bylaws related to the corporate governance bylaws. The aforementioned voting requirements are required until the first occurrence of: (i) any of the following Major Transactions: (a) any transaction to which we are party that results in, or would result in, more than 40% of the voting power of our outstanding shares of stock being held collectively by persons who are not members of the Schneider family, (b) the sale of all or substantially all of our assets, (c) our dissolution or liquidation or (ii) the termination of the Voting Trust (as described below).
Voting Trust Agreement
The Voting Trust holds all of the outstanding shares of Class A common stock and is governed by the Amended and Restated 1995 Schneider National, Inc. Voting Trust Agreement and Voting Agreement, which we refer to herein as the Voting Trust Agreement. The trustees of the Voting Trust, whom we refer to herein as the Voting Trustees, are the members of the Corporate Governance Committee of the Board of Directors who are not Schneider family members. In exchange for shares of Class A common stock transferred to the Voting Trust by Schneider family trusts, the Voting Trustees issued trust certificates evidencing shares of beneficial interest in the Voting Trust equal to the number of shares of Class A common stock transferred to the Voting Trust.
The Voting Trustees do not have any economic rights or investment power with respect to the shares of Class A common stock transferred to the Voting Trust; their rights consist of voting rights. Under the Voting Trust Agreement, the Voting Trust exercises all voting power with respect to shares of Class A common stock. Unless otherwise prescribed by the Voting Trust Agreement, the Voting Trustees must act by majority consent in exercising all voting power with respect to the shares of Class A common stock subject to the Voting Trust. However, if there is a vacancy, the Voting Trustees must act by unanimous consent. On votes with respect to Major Transactions, the Voting Trustees must take direction from the holders of trust certificates, voting in the same proportion as the vote of the holders of trust certificates.
The Voting Trust also requires the Voting Trustees to vote all shares of capital stock of the company held by the Voting Trust entitled to vote in the election of directors of the company to elect as director: (i) each eligible family member (as defined in the Voting Trust Agreement) who has been nominated in accordance with the Schneider Family Board Nomination Process Agreement (described below); (ii) the Chief Executive Officer; and (iii) each of up to fifteen individuals who are not eligible family members, less the number of individuals elected pursuant to (i) and (ii).
The Voting Trust Agreement will automatically terminate upon:
| • | any of the following Major Transactions: (i) any transaction to which we are party that results in, or would result in, more than 40% of the voting power of our outstanding shares of stock being held collectively by persons who are not members of the Schneider family, (ii) the sale of all or substantially all of our assets or (iii) our dissolution or liquidation; |
137
Table of Contents
| • | the affirmative vote of holders of trust certificates then holding at least 80% of the shares of beneficial interest in the Voting Trust or the unanimous agreement of the trustees of the Voting Trust to terminate the Voting Trust within 180 days after the issuance of our financial statements for any fiscal year as of the end of which the book value of the company plus any distributions is less than two-thirds of the book value of the company as of the end of any of the five fiscal years of the company preceding such fiscal year; or |
| • | the time at which the outstanding shares of Class B common stock represent more than 40% of the voting power of the capital stock of the company entitled to vote generally in the election of directors. |
Amended and Restated Stock Restriction Agreement
The Amended and Restated Stock Restriction Agreement, which we refer to herein as the SRA, limits the transfer of trust certificates (evidencing shares of beneficial interest in the Voting Trust equal to the number of shares of Class A common stock transferred to the Voting Trust) or any interests therein from the Voting Trust to another party. The SRA provides for two circumstances in which a member of the Schneider family (and holder of a trust certificate) may withdraw shares of Class A common stock from the Voting Trust for sale, and such withdrawn shares shall be converted to shares of Class B common stock effective upon transfer in accordance with the Amended and Restated Articles of Incorporation. The first circumstance is the funding of estate taxes attributable to shares of Class A common stock and the second circumstance is “emergency need” as defined in the SRA. The SRA provides that, prior to the termination of the Voting Trust, any shares of Class A common stock (represented by a trust certificate) that are transferred outside the Schneider family will be distributed from the Voting Trust and converted to shares of Class B common stock effective upon transfer and in accordance with the Amended and Restated Articles of Incorporation. However, if such transfer is to an irrevocable trust providing a surviving spouse with income rights only for the balance of his or her lifetime after which ownership will rest with a descendant of Donald J. Schneider, no conversion to Class B common stock will occur. The SRA will automatically terminate upon the termination of the Voting Trust.
Schneider Family Board Nomination Process Agreement
As described above, the Voting Trust Agreement requires that the trustees of the Voting Trust vote all shares of capital stock of the company held by the Voting Trust entitled to vote in the election of directors of the company to elect as a director of the company each of the eligible family members, as defined in the Voting Trust Agreement, who has been nominated in accordance with the Schneider Family Board Nomination Process Agreement, which we refer to herein as the Nomination Agreement. The Nomination Agreement provides that the five Schneider family members specified in the Nomination Agreement shall have the right to nominate, and the company shall include in the slate of nominees recommended to shareholders of the company for election as a director at any annual or special meeting of shareholders at which directors are to be elected, the two family members specified in the Nomination Agreement for each of the annual meetings held in 2017 through 2025. The directorships will rotate among the five Schneider family members, and each member is anticipated to serve for three consecutive years, plus the remainder of any current rotation at the time of the consummation of this offering. Each Schneider family member nominated in accordance with the Nomination Agreement must satisfy the qualifications for service as a director set forth in the Amended and Restated Bylaws or such qualifications must be waived in accordance with such Amended and Restated Bylaws. The rotation system described above may end earlier than 2025 in the event a Schneider family member is unable or declines to serve all or any portion of his or her term. Each Schneider family member may participate as an observer in all board meetings occurring during the calendar quarter immediately preceding his or her scheduled nomination to the board.
After the rotation system described above is complete, the five specified Schneider family members may, if they have at least 80% of such family members in agreement, propose an amendment to the Nomination Agreement to the Corporate Governance Committee to cover subsequent periods. The amendment shall be consistent with the terms of the Nomination Agreement (including, but not limited to, satisfaction or waiver of
138
Table of Contents
the qualifications for service as a director set forth in Amended and Restated Bylaws and equal opportunity for representation among the family branches constituting the issue of Donald J. Schneider) and shall be subject to the approval of the Corporate Governance Committee and the Board of Directors, which approval shall not be unreasonably withheld. During any subsequent period that is not covered by an amendment to the Nomination Agreement that has been so approved, the trustees of the Voting Trust shall not be required to vote for the election of any Schneider family member as a director of the company.
The Nomination Agreement may be amended from time to time with the consent of at least 80% of the five specified Schneider family members and at least 75% of the directors constituting the full Board of Directors, and, in the case of the amendment referred to above, the approval of the Corporate Governance Committee.
Other Limitations on Shareholder Actions
Our Amended and Restated Bylaws will also impose some procedural requirements on shareholders who wish to:
| • | make nominations in the election of directors; |
| • | propose that a director be removed; |
| • | propose any repeal or change in our bylaws; or |
| • | propose any other business to be brought before an annual or special meeting of shareholders. |
Under these procedural requirements, in order to bring a proposal before a meeting of shareholders, a shareholder must deliver timely notice of a proposal pertaining to a proper subject for presentment at such a meeting, and such notice must be accompanied with the following information:
| • | a brief description of the business desired to be brought before the meeting of shareholders and the reasons for conducting such business at the meeting; |
| • | with respect to the shareholder proposing such business: |
| • | the name and address, as they appear on our books and records; |
| • | the class and number of shares owned (beneficially or of record) or any other type of ownership, including but not limited to, through any derivative instrument or a proxy, contract or other arrangement that gives the shareholder the right to vote any of our shares; |
| • | information of such shareholder that would be required to be disclosed in a proxy statement or other filings in accordance with applicable SEC regulations; |
| • | a representation that such shareholder is a holder of record of stock entitled to vote at such meeting and intends to appear in person or by proxy at the meeting to present such proposed business; and |
| • | any interest of the shareholder in such business. |
To be timely, a shareholder must generally deliver notice:
| • | to the Secretary of the company at our principal office; and |
| • | not later than the close of business on the 90th day prior to, and not earlier than the close of business on the 120th day in advance of the anniversary of, the annual meeting of shareholders held in the prior year. |
139
Table of Contents
Limitation of Liability of Directors and Officers
Section 180.0828 of the WBCL provides that a director is not liable to a corporation, its shareholders or any person asserting rights on behalf of the corporation or its shareholders for damages, settlements, fees, fines, penalties or other monetary liabilities arising from the breach of, or failure to perform, any duty resulting solely from his or her status as director, unless the person asserting liability proves that the breach or failure to perform constitutes:
| • | a willful failure to deal fairly with the corporation or its shareholders in connection with a matter in which the director or officer has a material conflict of interest; |
| • | a violation of criminal law, unless the person has reasonable cause to believe his conduct was lawful or had no reasonable cause to believe his conduct was unlawful; |
| • | a transaction from which the person derived an improper personal profit; or |
| • | willful misconduct. |
As a result, our shareholders do not have the right, through shareholders’ derivative suits on our behalf, to recover monetary damages against a director for breach of fiduciary duty as a director, including breaches resulting from grossly negligent behavior, except in the situations described above. A corporation may limit the immunity provided under Section 180.0828 by its articles of incorporation. We have not provided for such limitation in our Amended and Restated Articles of Incorporation.
Our Amended and Restated Bylaws contain indemnification provisions that are substantially similar to the statutory indemnification provisions.
Forum Selection
Our Amended and Restated Bylaws provide that the Circuit Court for Brown County, Wisconsin or the U.S. District Court for the Eastern District of Wisconsin—Green Bay Division will be the exclusive forum for any derivative action or proceeding brought on our behalf, any action asserting a breach of fiduciary duty, any action asserting a claim against us arising pursuant to the WBCL, our Amended and Restated Articles of Incorporation or our Amended and Restated Bylaws or any action asserting a claim against us that is governed by the internal affairs doctrine. The enforceability of similar choice of forum provisions in other companies’ articles of incorporation has been challenged in legal proceedings, and it is possible that a court could find these types of provisions to be inapplicable or unenforceable.
Anti-Takeover Effects of Certain Provisions of the Voting Trust, Our Amended and Restated Articles of Incorporation and Our Amended and Restated Bylaws
So long as the outstanding shares of our Class A common stock represent a majority of the combined voting power of common stock, the Voting Trust will effectively control all matters submitted to our shareholders for a vote, except for the vote in any Major Transactions, which will be controlled by certain trusts for the benefit of the Schneider family members or holders of the trust certificates issued by the Voting Trust, as well as the overall management and direction of the company, which may have the effect of delaying, deferring or discouraging another person from acquiring control of the company. After such time as the shares of our Class A common stock no longer represent a majority of the combined voting power of our common stock, the provisions of Wisconsin law, our Amended and Restated Articles of Incorporation and our Amended and Restated Bylaws may have the effect of delaying, deferring or discouraging another person from acquiring control of the company.
Some provisions of our Amended and Restated Articles of Incorporation and Amended and Restated Bylaws could make the following more difficult:
| • | acquisition of control of us by means of a proxy contest or otherwise; or |
| • | removal of our incumbent officers and directors. |
140
Table of Contents
In addition, as provided in “Shareholder Approval of Major Transactions” above, we shall not enter into any Major Transaction unless the consummation of the proposed Major Transaction is conditioned upon the approval of such Major Transaction by 60% of the combined voting power of our outstanding shares of stock, with all classes of such stock voting together as a single voting group.
These provisions, as well as our ability to issue preferred stock, are designed to discourage coercive takeover practices and inadequate takeover bids. These provisions are also designed to encourage persons seeking to acquire control of us to first negotiate with our Board of Directors. We believe that the benefits of increased protection give us the potential ability to negotiate with the proponent of an unfriendly or unsolicited proposal to acquire or restructure us, and that the benefits of this increased protection outweigh the disadvantages of discouraging those proposals, because negotiation of those proposals could result in an improvement of their terms.
Anti-Takeover Provisions of the Wisconsin Business Corporation Law
Wisconsin Business Combination Statutes. We are subject to Sections 180.1140 to 180.1144 of the WBCL, which prohibit a Wisconsin corporation from engaging in a “business combination” with an interested stockholder for a period of three years following the interested stockholder’s stock acquisition date, unless before such date, the board of directors of the corporation approved either the business combination or the purchase of stock made by the interested stockholder on that stock acquisition date.
We may engage in a business combination with an interested stockholder after the expiration of the three-year period with respect to such stockholder only if one or more of the following is satisfied:
| • | our Board of Directors approved the acquisition of stock before such stockholder’s acquisition date; |
| • | the business combination is approved by a majority of the outstanding voting stock not beneficially owned by such stockholder; or |
| • | the consideration to be received by stockholders meets certain fair price requirements of the statute with respect to form and amount. |
Section 180.1140 defines a business combination between a “resident domestic corporation” and an “interested stockholder” to include the following:
| • | a merger or share exchange with an interested stockholder or a corporation that is, or after the merger or share exchange would be, an affiliate or associate of an interested stockholder; |
| • | a sale, lease, exchange, mortgage, pledge, transfer or other disposition of assets to or with an interested stockholder or affiliate or associate of an interested stockholder equal to 5% or more of the aggregate market value of the assets or outstanding stock of the resident domestic corporation or 10% of its earning power or income; |
| • | the issuance or transfer of stock or rights to purchase stock with an aggregate market value equal to 5% or more of the outstanding stock of the resident domestic corporation; and |
| • | certain other transactions involving an interested stockholder. |
Section 180.1140(8)(a) of the WBCL defines an “interested stockholder” as a person who beneficially owns, directly or indirectly, at least 10% of the voting power of the outstanding voting stock of a resident domestic corporation or who is an affiliate or associate of the resident domestic corporation and beneficially owned at least 10% of the voting power of the then outstanding voting stock within the last three years.
Section 180.1140(9)(a) defines a “resident domestic corporation” as a Wisconsin corporation that, as of the relevant date, satisfies any of the following: (i) its principal offices are located in Wisconsin, (ii) it has significant business operations located in Wisconsin, (iii) more than 10% of the holders of record of its shares are residents of Wisconsin or (iv) more than 10% of its shares are held of record by residents in Wisconsin. Following the closing of this offering we will be a resident domestic corporation for purposes of these statutory provisions.
141
Table of Contents
Wisconsin Fair Price Statute. Sections 180.1130 to 180.1133 of the WBCL provide that certain mergers, share exchanges or sales, leases, exchanges or other dispositions of assets in a transaction involving a “significant shareholder” require a supermajority vote of shareholders in addition to any approval otherwise required, unless shareholders receive a fair price for their shares that satisfies a statutory formula. A “significant shareholder” for this purpose is defined as a person or group who beneficially owns, directly or indirectly, 10% or more of the voting stock of the corporation, or is an affiliate of the corporation and beneficially owned, directly or indirectly, 10% or more of the voting stock of the corporation within the last two years. Any business combination to which the statute applies must be approved by 80% of the voting power of the corporation’s stock and at least two-thirds of the voting power of the corporation’s stock not beneficially owned by the significant shareholder who is a party to the relevant transaction or any of its affiliates or associates, in each case voting together as a single group, unless the following standards have been met:
| • | the aggregate value of the per share consideration is at least equal to the highest of: |
| • | the highest per share price paid for any shares of the same class of common stock of the corporation by the significant shareholder either in the transaction in which it became a significant shareholder or within two years before the date of the business combination, whichever is higher; |
| • | the market value per share of the same class of the corporation’s common stock on the date of commencement of any tender offer by the significant shareholder, the date on which the person became a significant shareholder or the date of the first public announcement of the proposed business combination, whichever is higher; or |
| • | the highest preferential amount per share of the same class or series of common stock in a liquidation or dissolution to which holders of the shares would be entitled; and |
| • | either cash, or the form of consideration used by the significant shareholder to acquire the largest number of shares, is offered. |
Wisconsin Defensive Action Restrictions. Section 180.1134 of the WBCL provides that, in addition to the vote otherwise required by law or the articles of incorporation of a resident domestic corporation, the approval of the holders of a majority of the shares entitled to vote on the proposal is required before such corporation can take certain actions while a takeover offer is being made or after a takeover offer has been publicly announced and before it is concluded. This statute requires shareholder approval for the corporation to do either of the following: (i) acquire more than 5% of its outstanding voting shares at a price above the market value from any individual or organization that owns more than 3% of the outstanding voting shares and has held such shares for less than two years, unless an equal offer is made to acquire all voting shares and all securities that may be converted into voting shares or (ii) sell or option assets of the resident domestic corporation that amount to 10% or more of the market value of the resident domestic corporation, unless the corporation has at least three independent directors (directors who are not officers or employees) and a majority of the independent directors vote not to have this provision apply to the resident domestic corporation.
We have elected not to be subject to Sections 180.1130 to 180.1134 of the WBCL.
Wisconsin Control Share Voting Restrictions Statute. Pursuant to Section 180.1150 of the WBCL, unless otherwise provided in the articles of incorporation or otherwise specified by the board of directors, the voting power of shares of a resident domestic corporation held by any person, including shares issuable upon conversion of convertible securities or upon exercise of options or warrants, in excess of 20% of the voting power in the election of directors is limited to 10% of the full voting power of those shares. Our Amended and Restated Articles of Incorporation provide this statute will not apply to the shares of common stock held by the Voting Trust.
Wisconsin Constituency or Stakeholder Provision. Pursuant to Section 180.0827 of the WBCL, in discharging his or her duties to us and in determining what he or she believes to be in our best interests, a director
142
Table of Contents
or officer may, in addition to considering the effects of any action on shareholders, consider the effects of the action on employees, suppliers, customers, the communities in which we operate and any other factors that the director or officer considers pertinent.
Registration Rights Agreement
Upon the completion of this offering, we intend to enter into a registration rights agreement with to register for sale under the Securities Act shares of our Class B common stock. Subject to certain conditions and limitations, this agreement will provide with certain registration rights as described below. An aggregate of shares of Class B common stock, including shares of Class A common stock that will convert into shares of Class B common stock if such shares of Class A common stock are transferred outside of the Voting Trust as specified in the Voting Trust Agreement and our Amended and Restated Articles of Incorporation, will be entitled to these registration rights.
Demand registration rights
At any time after the completion of this offering, each of will have the right to demand that we file up to one registration statement on Form S-1 within any six-month period. These registration rights are subject to specified conditions and limitations, including the right of the underwriters, if any, to limit the number of shares included in any such registration under specified circumstances. Upon such a request, we will be required to use reasonable best efforts to effect the registration as expeditiously as possible.
Shelf registration rights
At any time after we become eligible to file a registration statement on Form S-3, will be entitled to have their shares of Class B common stock, including shares of Class A common stock that will convert into shares of Class B common stock if such shares of Class A common stock are transferred outside of the Voting Trust as specified in the Voting Trust Agreement and our Amended and Restated Articles of Incorporation, registered by us on a Form S-3 registration statement at our expense. These shelf registration rights are subject to specified conditions and limitations.
Expenses and indemnification
We will pay all expenses relating to any demand or shelf registration, other than underwriting discounts and commissions and any transfer taxes, subject to specified conditions and limitations. The registration rights agreement will include customary indemnification provisions, including indemnification of the participating holders of shares of Class B common stock and their directors, officers and employees by us for any losses, claims, damages or liabilities in respect thereof and expenses to which such holders may become subject under the Securities Act, state law or otherwise.
Termination of registration rights
The registration rights granted under the registration rights agreement will terminate upon the date the holders of shares that are a party thereto no longer hold any such shares that are entitled to registration rights.
Listing
We have applied to list our Class B common stock on the NYSE under the symbol “SNDR.”
Transfer Agent and Registrar
The transfer agent and registrar for the Class B common stock is .
143
Table of Contents
U.S. FEDERAL INCOME AND ESTATE TAX CONSIDERATIONS
FOR NON-U.S. HOLDERS OF CLASS B COMMON STOCK
The following is a discussion of the material U.S. federal income and estate tax consequences of the purchase, ownership and disposition of our Class B common stock by a beneficial owner that is a “non-U.S. holder.” Except where noted, this summary deals only with Class B common stock that is held as a capital asset.
A “non-U.S. holder” means a beneficial owner of our Class B common stock that is a person or entity (other than an entity treated as a partnership for U.S. federal income tax purposes) that, for U.S. federal income tax purposes, is:
| • | a non-resident alien individual, other than certain former citizens and residents of the United States subject to tax as expatriates; |
| • | a corporation, or other entity treated as a corporation for U.S. federal income tax purposes, created or organized in or under the laws of a jurisdiction other than the United States or any state or political subdivision thereof or the District of Columbia; or |
| • | an estate or trust, other than an estate or trust the income of which is subject to U.S. federal income taxation regardless of its source. |
A “non-U.S. holder” does not include an individual who is present in the United States for 183 days or more in the taxable year of the disposition of such individual’s common stock and is not otherwise a resident of the United States for U.S. federal income tax purposes. Such an individual is urged to consult his or her own tax advisor regarding the U.S. federal income tax consequences of the disposition of our Class B common stock.
This discussion is based on the Code and administrative pronouncements, judicial decisions and final, temporary and proposed Treasury regulations each as of the date hereof, changes to any of which subsequent to the date of this prospectus may affect the tax consequences described herein, potentially retroactively. This discussion does not address all aspects of U.S. federal income taxation that may be relevant to non-U.S. holders in light of their particular circumstances and it does not address any tax consequences arising under the laws of any state, local or foreign jurisdiction. In addition, it does not represent a detailed description of the United States federal income and estate tax consequences applicable to you if you are subject to special treatment under the United States federal income tax laws (including if you are a United States expatriate, “controlled foreign corporation,” “passive foreign investment company” or a partnership or other pass-through entity for United States federal income tax purposes). A change in law may alter significantly the tax considerations that we describe in this summary.
If an entity or arrangement treated as a partnership for U.S. federal income tax purposes holds our Class B common stock, the tax treatment of a partner will generally depend upon the status of the partner and the activities of the partnership. If you are such an entity or arrangement holding our Class B common stock, or a partner in such an entity or arrangement, you should consult your own tax advisors regarding the purchase, ownership and disposition of our Class B common stock.
Prospective holders are urged to consult their own tax advisors with respect to the particular tax consequences to them of purchasing, owning and disposing of our Class B common stock, including the consequences under the laws of any state, local or foreign jurisdiction.
Dividends
Except as provided under “Dividend Policy,” we do not currently expect to make any distributions on our Class B common stock. In the event that we do make any distributions of cash or other property (other than certain pro rata distributions of our Class B common stock or rights to acquire our Class B common stock) with respect to shares of our Class B common stock, such distributions generally will constitute dividends for U.S.
144
Table of Contents
federal income tax purposes to the extent paid out of our current or accumulated earnings and profits, as determined under U.S. federal income tax principles. If a distribution exceeds our current and accumulated earnings and profits as determined under U.S. federal income tax principles, the excess will be treated first as a tax-free return of capital, causing a reduction in the non-U.S. holder’s adjusted tax basis in our Class B common stock and thereafter as capital gain, subject to the tax treatment described below in “—Gain on Disposition of Our Class B Common Stock.” Dividends paid to a non-U.S. holder of our Class B common stock generally will be subject to U.S. federal withholding tax at a 30% rate or a reduced rate specified by an applicable income tax treaty. In order to obtain a reduced rate of withholding, a non-U.S. holder will be required to provide documentation (generally an IRS Form W-8BEN or W-8BEN-E) certifying its entitlement to benefits under an applicable income tax treaty. Additional certification requirements apply if a non-U.S. holder holds our Class B common stock through a foreign partnership or a foreign intermediary.
The withholding tax does not apply to dividends paid to a non-U.S. holder who provides an IRS Form W-8ECI, certifying that the dividends are effectively connected with the non-U.S. holder’s conduct of a trade or business within the United States (and, if required by an applicable income tax treaty, attributable to a permanent establishment maintained by the non-U.S. holder in the United States). Instead, the effectively connected dividends will be subject to U.S. federal income tax in substantially the same manner as if the non-U.S. holder were a U.S. person. A non-U.S. holder treated as a corporation for U.S. federal income tax purposes receiving effectively connected dividends may also be subject to an additional “branch profits tax” imposed at a rate of 30% (or a lower treaty rate) with respect to its effectively-connected earnings and profits attributable to such dividends.
If you are a non-U.S. holder, you may obtain a refund of any excess amounts withheld by timely filing an appropriate claim for a refund with the IRS. Non-U.S. holders should consult their tax own advisors regarding their entitlement to benefits under an applicable income tax treaty and the specific manner of claiming the benefits of the treaty.
The foregoing discussion is subject to the discussion below under “—FATCA Withholding” and “—Information Reporting and Backup Withholding.”
Gain on Disposition of Our Class B Common Stock
A non-U.S. holder generally will not be subject to U.S. federal income tax on gain realized on a sale or other disposition of our Class B common stock unless:
| • | such gain is effectively connected with a trade or business of the non-U.S. holder in the United States (and, if required by an applicable income tax treaty, attributable to a permanent establishment maintained by the non-U.S. holder in the United States), in which event such non-U.S. holder generally will be subject to U.S. federal income tax on such gain in substantially the same manner as a U.S. person and, if such non-U.S. holder is treated as a corporation for U.S. federal income tax purposes, may also be subject to a branch profits tax at a rate of 30% (or a lower rate if it is provided by an applicable income tax treaty); or |
| • | we are or have been a U.S. real property holding corporation, as defined in the Code, at any time within the five-year period preceding the disposition or the non-U.S. holder’s holding period, whichever period is shorter, and our Class B common stock has ceased to be traded on an established securities market prior to the beginning of the calendar year in which the sale or disposition occurs. |
Generally, a corporation is a “United States real property holding corporation” if the fair market value of its U.S. real property interests equals or exceeds 50% of the sum of the fair market value of its worldwide real property interests and its other assets used or held for use in a trade or business (all as determined for U.S. federal income tax purposes). We believe that we are not, and we do not anticipate becoming, a U.S. real property holding corporation.
145
Table of Contents
The foregoing discussion is subject to the discussion below under “—FATCA Withholding” and “—Information Reporting and Backup Withholding.”
FATCA Withholding
Under the provisions of the Code and related U.S. Treasury guidance commonly referred to as the Foreign Account Tax Compliance Act, or FATCA, a withholding tax of 30% will be imposed in certain circumstances on payments of (i) dividends on our Class B common stock and (ii) beginning after December 31, 2018, gross proceeds from the sale or other disposition of our Class B common stock. In the case of payments made to a “foreign financial institution” (such as a bank, a broker or an investment fund), as a beneficial owner or as an intermediary, this tax generally will be imposed, subject to certain exceptions, unless such institution (i) has agreed to (and does) comply with the requirements of an agreement with the United States, or an FFI Agreement or (ii) is required by (and does comply with) applicable foreign law enacted in connection with an intergovernmental agreement between the United States and a foreign jurisdiction, or an intergovernmental agreement (an “IGA”), in either case to, among other things, collect and provide to the U.S. tax authorities or other relevant tax authorities certain information regarding U.S. account holders of such institution. In the case of payments made to a foreign entity that is not a financial institution, the tax generally will be imposed, subject to certain exceptions, unless such entity provides the withholding agent with a certification that it does not have any “substantial U.S. owner” (generally any specified U.S. person that directly or indirectly owns more than a specified percentage of such entity) or that identifies its substantial U.S. owners. If our Class B common stock is held through a foreign financial institution that has agreed to comply with the requirements of an FFI Agreement, such foreign financial institution (or, in certain cases, a person paying amounts to such foreign financial institution) generally will be required, subject to certain exceptions, to withhold tax on payments of dividends and proceeds described above made to (i) a person (including an individual) that fails to comply with certain information requests or (ii) a foreign financial institution that has not agreed to comply with the requirements of an FFI Agreement, unless such foreign financial institution is required by (and does comply with) applicable foreign law enacted in connection with an IGA. If a dividend payment is both subject to withholding under FATCA and subject to the withholding tax discussed above under “—Dividends,” the withholding under FATCA may be credited against, and therefore reduce, such other withholding tax. Each non-U.S. holder should consult its own tax advisor regarding the application of FATCA to the purchase, ownership and disposition of our Class B common stock.
Information Reporting and Backup Withholding
Amounts treated as payments of dividends on our Class B common stock paid to a non-U.S. holder and the amount of any U.S. federal tax withheld from such payments generally must be reported annually to the IRS and to such non-U.S. holder by the applicable withholding agent.
The additional information reporting and backup withholding rules that apply to payments of dividends to certain U.S. persons generally will not apply to payments of dividends on our Class B common stock to a non-U.S. holder if such non-U.S. holder certifies under penalties of perjury that it is not a U.S. person (generally by providing an IRS Form W-8BEN or W-8BEN-E to the applicable withholding agent) or otherwise establishes an exemption.
Proceeds from the sale, exchange or other disposition of our Class B common stock by a non-U.S. holder effected outside the United States through a non-U.S. office of a non-U.S. broker generally will not be subject to the information reporting and backup withholding rules that apply to payments to certain U.S. persons, provided that the proceeds are paid to the non-U.S. holder outside the United States. However, proceeds from the sale, exchange or other disposition of our Class B common stock by a non-U.S. holder effected through a non-U.S. office of a non-U.S. broker with certain specified U.S. connections or a U.S. broker generally will be subject to these information reporting rules (but generally not to these backup withholding rules), even if the proceeds are paid to such non-U.S. holder outside the United States, unless such non-U.S. holder certifies under penalties of
146
Table of Contents
perjury that it is not a U.S. person (for instance, by providing an IRS Form W-8BEN or W-8BEN-E to the applicable withholding agent) or otherwise establishes an exemption. Proceeds from the sale, exchange or other disposition of our Class B common stock by a non-U.S. holder effected through a U.S. office of a broker generally will be subject to these information reporting and backup withholding rules unless such non-U.S. holder certifies under penalties of perjury that it is not a U.S. person (for instance, by providing an IRS Form W-8BEN or W-8BEN-E to the applicable withholding agent) or otherwise establishes an exemption.
Backup withholding is not an additional tax. The amount of any backup withholding from a payment to a non-U.S. holder will be allowed as a credit against such holder’s U.S. federal income tax liability, if any, and may entitle such holder to a refund, provided that the required information is timely furnished to the IRS.
Federal Estate Tax
Individual non-U.S. holders and entities the property of which is potentially includible in such an individual’s gross estate for U.S. federal estate tax purposes (for example, a trust funded by such an individual and with respect to which the individual has retained certain interests or powers) should note that, absent an applicable treaty benefit, our Class B common stock generally will be treated as U.S. situs property subject to U.S. federal estate tax.
147
Table of Contents
The following discussion is a summary of certain considerations associated with the purchase of our Class B common stock by (i) employee benefit plans that are subject to Title I of the Employee Retirement Income Security Act of 1974, as amended (ERISA), (ii) plans, individual retirement accounts, and other arrangements that are subject to Section 4975 of the Code, or provisions under any other federal, state, local, non-U.S. or other laws or regulations that are similar to such provisions of ERISA or the Code, which we refer to collectively as Similar Laws, and (iii) entities whose underlying assets are considered to include “plan assets,” as defined by ERISA, of any such plans, accounts and arrangements, each of which we refer to as a Plan.
Section 406 of ERISA and Section 4975 of the Code prohibit Plans which are subject to Title I of ERISA or Section 4975 of the Code, which we refer to as ERISA Plans, from engaging in specified transactions involving plan assets with persons or entities who are “parties in interest,” within the meaning of ERISA, or “disqualified persons,” within the meaning of Section 4975 of the Code, unless an exemption is available. A party in interest or disqualified person who engaged in a non-exempt prohibited transaction may be subject to excise taxes and other penalties and liabilities under ERISA and the Code. In addition, the fiduciary of the ERISA Plan that engaged in such a non-exempt prohibited transaction may be subject to penalties and liabilities under ERISA and the Code.
Any fiduciary that proposes to cause an ERISA Plan to purchase the Class B common stock should consult with its counsel regarding the applicability of the fiduciary responsibility and prohibited transaction provisions of Title I of ERISA and Section 4975 of the Code to such an investment, and to confirm that such purchase will not constitute a non-exempt prohibited transaction under ERISA or Section 4975 of the Code. Because of the nature of our business as an operating company, it is not likely that we would be considered a party in interest or a disqualified person with respect to any ERISA Plan. However, a prohibited transaction within the meaning of ERISA and the Code may result if our Class B common stock is acquired by an ERISA Plan to which an underwriter is a party in interest and such acquisition is not entitled to an applicable exemption, of which there are many. In addition, in considering an investment in the Class B common stock of a portion of the assets of any Plan, a fiduciary should determine whether the investment is in accordance with the documents and instruments governing the Plan and the applicable provisions of ERISA, the Code or any Similar Law relating to a fiduciary’s duties to the Plan including, without limitation, the prudence, diversification, delegation of control and prohibited transaction provisions of ERISA, the Code and any other applicable Similar Laws.
By acceptance of the Class B common stock, each purchaser and subsequent transferee of the Class B common stock will be deemed to have represented and warranted that either (i) no portion of the assets used by such purchaser or transferee to acquire and hold the Class B common stock constitutes assets of any Plan or (ii) the purchase and holding of the Class B common stock by such purchaser or transferee will not constitute a non-exempt prohibited transaction under Section 406 of ERISA or Section 4975 of the Code or similar violation under any applicable Similar Laws.
Purchasers of the Class B common stock have exclusive responsibility for ensuring that their acquisition and holding of the Class B common stock does not violate the fiduciary or prohibited transaction rules of ERISA or the Code, or any similar provision of applicable Similar Laws. The foregoing discussion is general in nature and is not intended to be all-inclusive and is based on laws in effect on the date of this prospectus. Such discussion should not be construed as legal advice. Due to the complexity of these rules and the penalties that may be imposed upon persons involved in non-exempt prohibited transactions, it is particularly important that fiduciaries, or other persons considering purchasing our Class B common stock on behalf of, or with the assets of, any ERISA Plan or any Plan subject to any Similar Law, consult with their counsel regarding the matters described herein.
148
Table of Contents
SHARES ELIGIBLE FOR FUTURE SALE
Prior to this offering, there has been no market for our Class B common stock. Future sales of substantial amounts of our Class B common stock in the public market or the perception that such sales might occur could adversely affect market prices prevailing from time to time. Furthermore, because only a limited number of shares will be available for sale shortly after this offering due to existing contractual and legal restrictions on resale as described below, there may be sales of substantial amounts of our Class B common stock in the public market after the restrictions lapse. This may adversely affect the prevailing market price and our ability to raise equity capital in the future.
After completion of this offering, we will have shares of Class B common stock outstanding (assuming no exercise of the underwriters’ over-allotment option). All of the shares of Class B common stock sold in this offering, plus any shares sold upon exercise of the underwriters’ over-allotment option, will be freely tradable without restrictions or further registration under the Securities Act, unless the shares are purchased by our “affiliates” as that term is defined in Rule 144 under the Securities Act. Any shares owned by our affiliates may not be resold except in compliance with Rule 144 volume limitations, manner of sale and notice requirements, pursuant to another applicable exemption from registration or pursuant to an effective registration statement. The shares of Class B common stock issuable to our Class B shareholders will be “restricted securities” as that term is defined in Rule 144 under the Securities Act. These restricted securities may be sold in the public market only if they are registered or if they qualify for an exemption from registration under Rule 144 under the Securities Act. This rule is summarized below.
Rule 144
In general under Rule 144 as currently in effect, a person who has beneficially owned restricted shares of our Class B common stock for at least six months would be entitled to sell such securities, provided that (i) such person is not deemed to have been one of our affiliates at the time of, or at any time during the 90 days preceding, a sale and (ii) we are subject to the Exchange Act periodic reporting requirements for at least 90 days before the sale. If such person has beneficially owned the shares proposed to be sold for at least one year, then that person is entitled to sell those shares without complying with any of the requirements of Rule 144. Persons who have beneficially owned restricted shares of our Class B common stock for at least six months but who are our affiliates at the time of, or any time during the 90 days preceding, a sale, would be subject to additional restrictions, by which such person would be entitled to sell within any three-month period only a number of securities that does not exceed the greater of either of the following:
| • | 1% of the number of shares of our Class B common stock then outstanding; or |
| • | the average weekly trading volume of our Class B common stock during the four calendar weeks preceding the filing of a notice on Form 144 with respect to the sale; |
provided, in each case, that we are subject to the Exchange Act periodic reporting requirements for at least 90 days before the sale. Such sales both by affiliates and by non-affiliates must also comply with the manner of sale, current public information and notice provisions of Rule 144 to the extent applicable.
We are unable to estimate the number of shares that will be sold under Rule 144 since this will depend on the market price for our common stock, the personal circumstances of the shareholder and other factors.
Class B Common Stock Issuable Upon Conversion of Class A Common Stock
After completion of this offering, shares of our Class A common stock will be outstanding. Each share of Class A common stock will automatically convert into shares of our Class B common stock on a one-for-one basis if such shares of Class A common stock are transferred outside of the Voting Trust as specified in the Voting Trust Agreement and our Amended and Restated Articles of Incorporation.
149
Table of Contents
Lock-Up Agreements
We, our directors and executive officers, and certain holders of our outstanding common stock, including certain Schneider family members and their family trusts, will enter into lock-up agreements in connection with this offering and will agree, subject to certain exceptions, not to sell, dispose of or hedge any shares of our Class B common stock or securities convertible into or exchangeable for shares of our Class B common stock, without, in each case, the prior written consent of Morgan Stanley & Co. LLC, UBS Securities LLC and Merrill Lynch, Pierce, Fenner & Smith Incorporated. The lock-up agreements expire 180 days after the date of this prospectus, subject to extension upon the occurrence of specified events. For further details, see “Underwriting.”
Upon the expiration of the lock-up agreements in connection with this offering, up to an additional shares of Class B common stock (or securities convertible into or exercisable or exchangeable for Class B common stock) will be eligible for sale in the public market, of which shares are held by directors, executive officers and other affiliates and will be subject to volume, manner of sale and other limitations under Rule 144.
Registration Rights Agreement
Certain holders of shares of our Class A common stock and Class B common stock are entitled to rights with respect to the registration of their shares following this offering under the Securities Act. For a description of these registration rights, see “Description of Capital Stock—Registration Rights.”
Stock Options
shares of Class B common stock are available for future option grants under stock plans.
Upon completion of this offering, we intend to file a registration statement under the Securities Act covering all shares of Class B common stock issuable pursuant to our to be adopted incentive plan. Subject to Rule 144 volume limitations applicable to affiliates, shares registered under any registration statements will be available for sale in the open market, beginning 90 days after the date of the prospectus, except to the extent that the shares are subject to vesting restrictions with us or the contractual restrictions described below.
Rule 701
In general, under Rule 701 of the Securities Act, or Rule 701, as currently in effect, any of our directors, officers, employees, consultants or advisors who purchase shares of Class B common stock from us in connection with a compensatory stock or option plan or other written agreement in a transaction before the effective date of this offering, or who purchased shares of Class B common stock from us after that date upon the exercise of options granted before that date, in reliance on Rule 701 and complied with the requirements of Rule 701 will be eligible to resell such shares 90 days after the date of this prospectus in reliance on Rule 144. If such person is not an affiliate, such sale may be made subject only to the manner of sale provisions of Rule 144. If such person is an affiliate, such sale may be made under Rule 144 without compliance with its six-month minimum holding period, but subject to the other Rule 144 restrictions described above.
150
Table of Contents
Under the terms and subject to the conditions in an underwriting agreement dated the date of this prospectus, the underwriters named below, for whom Morgan Stanley & Co. LLC, UBS Securities LLC and Merrill Lynch, Pierce, Fenner & Smith Incorporated are acting as representatives, have severally agreed to purchase, and we and the selling shareholders have agreed to sell to them, severally, the number of shares indicated below:
| Name |
Number of Shares |
|||
| Morgan Stanley & Co. LLC |
||||
| UBS Securities LLC |
||||
| Merrill Lynch, Pierce, Fenner & Smith Incorporated |
||||
| Citigroup Global Markets Inc. |
||||
| Credit Suisse Securities (USA) LLC |
||||
| J.P. Morgan Securities LLC |
||||
| Wells Fargo Securities, LLC |
||||
|
|
|
|||
| Total: |
||||
The underwriters and the representatives are collectively referred to as the “underwriters” and the “representatives,” respectively. The underwriters are offering the shares of Class B common stock subject to their acceptance of the shares from us and subject to prior sale. The underwriting agreement provides that the obligations of the several underwriters to pay for and accept delivery of the shares of Class B common stock offered by this prospectus are subject to the approval of certain legal matters by their counsel and to certain other conditions. The underwriters are obligated to take and pay for all of the shares of Class B common stock offered by this prospectus if any such shares are taken. However, the underwriters are not required to take or pay for the shares covered by the underwriters’ over-allotment option described below.
The underwriters initially propose to offer part of the shares of Class B common stock directly to the public at the offering price listed on the cover page of this prospectus and part to certain dealers at a price that represents a concession not in excess of $ per share under the public offering price. After the initial offering of the shares of Class B common stock, the offering price and other selling terms may from time to time be varied by the representatives.
We have granted to the underwriters an option, exercisable for 30 days from the date of this prospectus, to purchase up to an additional shares of Class B common stock at the public offering price listed on the cover page of this prospectus, less underwriting discounts and commissions. The underwriters may exercise this option solely for the purpose of covering over-allotments, if any, made in connection with the offering of the shares of Class B common stock offered by this prospectus. To the extent the option is exercised, each underwriter will become obligated, subject to certain conditions, to purchase about the same percentage of the additional shares of Class B common stock as the number listed next to the underwriter’s name in the preceding table bears to the total number of shares of Class B common stock listed next to the names of all underwriters in the preceding table.
151
Table of Contents
The following table shows the per share and total public offering price, underwriting discounts and commissions, and proceeds before expenses to us and the selling shareholders. These amounts are shown assuming both no exercise and full exercise of the underwriters’ option to purchase up to an additional shares of Class B common stock.
| Total | ||||||||||||
| Per Share | No Exercise | Full Exercise | ||||||||||
| Public offering price |
$ | $ | $ | |||||||||
| Underwriting discounts and commissions to be paid by: |
||||||||||||
| Us |
$ | $ | $ | |||||||||
| The selling shareholders |
$ | $ | $ | |||||||||
| Proceeds, before expenses, to us |
$ | $ | $ | |||||||||
| Proceeds, before expenses, to selling shareholders |
$ | $ | $ | |||||||||
The estimated offering expenses payable by us, exclusive of the underwriting discounts and commissions, are approximately $ . We have agreed to reimburse the underwriters for expense relating to clearance of this offering with the Financial Industry Regulatory Authority up to $ .
The underwriters have informed us that they do not intend sales to discretionary accounts to exceed 5% of the total number of shares of Class B common stock offered by them.
We intend to list our Class B common stock on NYSE under the trading symbol “SNDR.”
We, our directors and executive officers, and certain holders of our outstanding common stock, including certain Schneider family members and their family trusts, will agree that, without the prior written consent of Morgan Stanley & Co. LLC, UBS Securities LLC and Merrill Lynch, Pierce, Fenner & Smith Incorporated on behalf of the underwriters, we and they will not, during the period ending 180 days after the date of this prospectus (the “restricted period”):
| • | offer, pledge, sell, contract to sell, sell any option or contract to purchase, purchase any option or contract to sell, grant any option, right or warrant to purchase, lend or otherwise transfer or dispose of, directly or indirectly, any shares of Class B common stock or any securities convertible into or exercisable or exchangeable for shares of Class B common stock; |
| • | file any registration statement with the Securities and Exchange Commission relating to the offering of any shares of Class B common stock or any securities convertible into or exercisable or exchangeable for Class B common stock; or |
| • | enter into any swap or other arrangement that transfers to another, in whole or in part, any of the economic consequences of ownership of Class B common stock. |
whether any such transaction described above is to be settled by delivery of common stock or such other securities, in cash or otherwise. In addition, we and each such person will agree that, without the prior written consent of Morgan Stanley & Co. LLC, UBS Securities LLC and Merrill Lynch, Pierce, Fenner & Smith Incorporated on behalf of the underwriters, we or such other person will not, during the restricted period, make any demand for, or exercise any right with respect to, the registration of any shares of Class B common stock or any security convertible into or exercisable or exchangeable for Class B common stock.
The restrictions described in the immediately preceding paragraph to do not apply to, among other exceptions:
| • | the sale of shares to the underwriters; or |
| • | the issuance by us of shares of Class B common stock upon the exercise of an option or a warrant or the conversion of a security outstanding on the date of this prospectus of which the underwriters have been advised in writing; |
152
Table of Contents
| • | transactions by any person other than us relating to shares of Class B common stock or other securities acquired in open market transactions after the completion of the offering of the shares; provided that no filing under Section 16(a) of the Securities Exchange Act of 1934, as amended (the “Exchange Act”), is required or voluntarily made in connection with subsequent sales of the Class B common stock or other securities acquired in such open market transactions; or |
| • | the establishment of a trading plan pursuant to Rule 10b5-1 under the Exchange Act for the transfer of shares of Class B common stock, provided that (i) such plan does not provide for the transfer of Class B common stock during the restricted period and (ii) to the extent a public announcement or filing under the Exchange Act, if any, is required or voluntarily made regarding the establishment of such plan, such announcement or filing shall include a statement to the effect that no transfer of Class B common stock may be made under such plan during the restricted period. |
Morgan Stanley & Co. LLC, UBS Securities LLC and Merrill Lynch, Pierce, Fenner & Smith Incorporated, in their sole discretion, may release the Class B common stock and other securities subject to the lock-up agreements described above in whole or in part at any time.
In order to facilitate the offering of the Class B common stock, the underwriters may engage in transactions that stabilize, maintain or otherwise affect the price of the Class B common stock. Specifically, the underwriters may sell more shares than they are obligated to purchase under the underwriting agreement, creating a short position. A short sale is covered if the short position is no greater than the number of shares available for purchase by the underwriters under the over-allotment option. The underwriters can close out a covered short sale by exercising the over-allotment option or purchasing shares in the open market. In determining the source of shares to close out a covered short sale, the underwriters will consider, among other things, the open market price of shares compared to the price available under the over-allotment option. The underwriters may also sell shares in excess of the over-allotment option, creating a naked short position. The underwriters must close out any naked short position by purchasing shares in the open market. A naked short position is more likely to be created if the underwriters are concerned that there may be downward pressure on the price of the Class B common stock in the open market after pricing that could adversely affect investors who purchase in this offering. As an additional means of facilitating this offering, the underwriters may bid for, and purchase, shares of Class B common stock in the open market to stabilize the price of the Class B common stock. These activities may raise or maintain the market price of the Class B common stock above independent market levels or prevent or retard a decline in the market price of the Class B common stock. The underwriters are not required to engage in these activities and may end any of these activities at any time.
We, the selling shareholders and the underwriters have agreed to indemnify each other against certain liabilities, including liabilities under the Securities Act.
A prospectus in electronic format may be made available on websites maintained by one or more underwriters, or selling group members, if any, participating in this offering. The representatives may agree to allocate a number of shares of Class B common stock to underwriters for sale to their online brokerage account holders. Internet distributions will be allocated by the representatives to underwriters that may make Internet distributions on the same basis as other allocations.
The underwriters and their respective affiliates are full service financial institutions engaged in various activities, which may include securities trading, commercial and investment banking, financial advisory, investment management, investment research, principal investment, hedging, financing and brokerage activities. Certain of the underwriters and their respective affiliates have, from time to time, performed, and may in the future perform, various financial advisory and investment banking services for us, for which they received or will receive customary fees and expenses.
In addition, in the ordinary course of their various business activities, the underwriters and their respective affiliates may make or hold a broad array of investments and actively trade debt and equity securities (or related
153
Table of Contents
derivative securities) and financial instruments (including bank loans) for their own account and for the accounts of their customers and may at any time hold long and short positions in such securities and instruments. Such investment and securities activities may involve our securities and instruments. The underwriters and their respective affiliates may also make investment recommendations or publish or express independent research views in respect of such securities or instruments and may at any time hold, or recommend to clients that they acquire, long or short positions in such securities and instruments.
An affiliate of J.P. Morgan Securities LLC is the administrative agent under our revolving credit facility, and certain of the underwriters or their affiliates are lenders thereunder. To the extent that we use a portion of the net proceeds of this offering to repay indebtedness under our revolving credit facility, these underwriters or their affiliates will receive a portion of the net proceeds of this offering.
Pricing of the Offering
Prior to this offering, there has been no public market for our common stock. The initial public offering price was determined by negotiations between us and the representatives. Among the factors considered in determining the initial public offering price were our future prospects and those of our industry in general, our sales, earnings and certain other financial and operating information in recent periods, and the price-earnings ratios, price-sales ratios, market prices of securities, and certain financial and operating information of companies engaged in activities similar to ours.
Selling Restrictions
Sales of shares made outside of the United States may be made by affiliates of the underwriters.
Other than in the United States, no action has been taken by us or the underwriters that would permit a public offering of the securities offered by this prospectus in any jurisdiction where action for that purpose is required. The securities offered by this prospectus may not be offered or sold, directly or indirectly, nor may this prospectus or any other offering material or advertisements in connection with the offer and sale of any such securities be distributed or published in any jurisdiction, except under circumstances that will result in compliance with the applicable rules and regulations of that jurisdiction. Persons into whose possession this prospectus comes are advised to inform themselves about and to observe any restrictions relating to the offering and the distribution of this prospectus. This prospectus does not constitute an offer to sell or a solicitation of an offer to buy any securities offered by this prospectus in any jurisdiction in which such an offer or a solicitation is unlawful.
Canada
The shares of our Class B common stock may be sold only to purchasers purchasing, or deemed to be purchasing, as principal that are accredited investors, as defined in National Instrument 45-106 Prospectus Exemptions or subsection 73.3(1) of the Securities Act (Ontario), and are permitted clients, as defined in National Instrument 31-103 Registration Requirements, Exemptions and Ongoing Registrant Obligations. Any resale of the shares must be made in accordance with an exemption from, or in a transaction not subject to, the prospectus requirements of applicable securities laws.
Securities legislation in certain provinces or territories of Canada may provide a purchaser with remedies for rescission or damages if this prospectus supplement (including any amendment thereto) contains a misrepresentation, provided that the remedies for rescission or damages are exercised by the purchaser within the time limit prescribed by the securities legislation of the purchaser’s province or territory. The purchaser should refer to any applicable provisions of the securities legislation of the purchaser’s province or territory for particulars of these rights or consult with a legal advisor.
Pursuant to section 3A.3 of National Instrument 33-105 Underwriting Conflicts (NI 33-105), the underwriters are not required to comply with the disclosure requirements of NI 33-105 regarding underwriter conflicts of interest in connection with this offering.
154
Table of Contents
European Economic Area
In relation to each Member State of the European Economic Area which has implemented the Prospectus Directive (each, a “Relevant Member State”), with effect from and including the date on which the Prospectus Directive is implemented in that Relevant Member State, no offer of shares of our Class B common stock may be made to the public in that Relevant Member State other than:
| (a) | to any legal entity which is a qualified investor as defined in the Prospectus Directive; |
| (b) | to fewer than 150 natural or legal persons (other than qualified investors as defined in the Prospectus Directive), subject to obtaining the prior consent of the representatives for any such offer; or |
| (c) | in any other circumstances falling within Article 3(2) of the Prospectus Directive, |
provided that no such offer of shares of our Class B common stock shall result in a requirement for the publication by us or any underwriter of a prospectus pursuant to Article 3 of the Prospectus Directive.
For the purposes of this provision, the expression an “offer to the public” in relation to any shares of our Class B common stock in any Relevant Member State means the communication in any form and by any means of sufficient information on the terms of the offer and any shares of our Class B common stock to be offered so as to enable an investor to decide to purchase any shares of our Class B common stock, as the same may be varied in that Member State by any measure implementing the Prospectus Directive in that Member State, the expression “Prospectus Directive” means Directive 2003/71/EC (as amended, including by Directive 2010/73/EU), and includes any relevant implementing measure in the Relevant Member State.
United Kingdom
Each underwriter has represented and agreed that:
| (a) | it has only communicated or caused to be communicated and will only communicate or cause to be communicated an invitation or inducement to engage in investment activity (within the meaning of Section 21 of the Financial Services and Markets Act 2000 (“FSMA”) received by it in connection with the issue or sale of the shares of our Class B common stock in circumstances in which Section 21(1) of the FSMA does not apply to us; and |
| (b) | it has complied and will comply with all applicable provisions of the FSMA with respect to anything done by it in relation to the shares of our Class B common stock in, from or otherwise involving the United Kingdom. |
155
Table of Contents
The validity of the issuance of the shares of Class B common stock offered hereby will be passed upon for us by Godfrey & Kahn, S.C., Milwaukee, Wisconsin. We have also been represented by Cravath, Swaine & Moore LLP, New York, New York. The underwriters have been represented by Simpson Thacher & Bartlett LLP, New York, New York.
The consolidated financial statements as of December 31, 2015 and 2014, and for each of the three years ended December 31, 2015, 2014 and 2013, included in this prospectus, have been audited by Deloitte & Touche LLP, an independent registered public accounting firm, as stated in their report appearing herein. Such consolidated financial statements have been so included in reliance upon the report of such firm given upon their authority as experts in accounting and auditing.
WHERE YOU CAN FIND MORE INFORMATION
We have filed with the SEC a registration statement on Form S-1 under the Securities Act with respect to the Class B common stock offered hereby. This prospectus does not contain all of the information set forth in the registration statement and the exhibits and schedules thereto. For further information with respect to the company and its Class B common stock, reference is made to the registration statement and the exhibits and any schedules filed therewith. Statements contained in this prospectus as to the contents of any contract or other document referred to are not necessarily complete and in each instance, if such contract or document is filed as an exhibit, reference is made to the copy of such contract or other document filed as an exhibit to the registration statement, each statement being qualified in all respects by such reference. A copy of the registration statement, including the exhibits and schedules thereto, may be read and copied at the SEC’s Public Reference Room at 100 F Street, N.E., Washington, D.C. 20549. Information on the operation of the Public Reference Room may be obtained by calling the SEC at 1-800-SEC-0330. In addition, the SEC maintains an Internet site at www.sec.gov, from which interested persons can electronically access the registration statement, including the exhibits and any schedules thereto.
As a result of the offering, we will become subject to the informational requirements of the Exchange Act. We will fulfill our obligations with respect to such requirements by filing periodic reports and other information with the SEC. We intend to furnish our shareholders with annual reports containing financial statements certified by an independent public accounting firm. We also maintain an Internet site at https://schneider.com. Our website and the information contained therein or connected thereto shall not be deemed to be incorporated into this prospectus or the registration statement of which it forms a part.
156
Table of Contents
| Index to audited consolidated financial statements |
||||
| F-2 | ||||
| F-2 | ||||
| Consolidated balance sheets as of December 31, 2015 and 2014 |
F-3 | |||
| Consolidated statements of comprehensive income for the years ended December 31, 2015, 2014 and 2013 |
F-5 | |||
| F-6 | ||||
| Consolidated statements of cash flows for the years ended December 31, 2015, 2014 and 2013 |
F-7 | |||
| F-8 | ||||
| Index to unaudited consolidated financial statements |
||||
| F-29 | ||||
| Consolidated balance sheets as of September 30, 2016 and year ended December 31, 2015 |
F-29 | |||
| F-31 | ||||
| F-32 | ||||
| Consolidated statements of cash flows for the nine months ended September 30, 2016 and 2015 |
F-33 | |||
| F-34 | ||||
F-1
Table of Contents
REPORT OF INDEPENDENT REGISTERED PUBLIC ACCOUNTING FIRM
To the Board of Directors and Shareholders of
Schneider National, Inc.
Green Bay, Wisconsin
We have audited the accompanying consolidated balance sheets of Schneider National, Inc. and subsidiaries (the “Company”) as of December 31, 2015 and 2014, and the related consolidated statements of comprehensive income, cash flows, and redeemable common shares, accumulated earnings and accumulated other comprehensive income for each of the three years in the period ended December 31, 2015. These financial statements are the responsibility of the Company’s management. Our responsibility is to express an opinion on the financial statements based on our audits.
We conducted our audits in accordance with the standards of the Public Company Accounting Oversight Board (United States). Those standards require that we plan and perform the audit to obtain reasonable assurance about whether the financial statements are free of material misstatement. The Company is not required to have, nor were we engaged to perform, an audit of its internal control over financial reporting. Our audits included consideration of internal control over financial reporting as a basis for designing audit procedures that are appropriate in the circumstances, but not for the purpose of expressing an opinion on the effectiveness of the Company’s internal control over financial reporting. Accordingly, we express no such opinion. An audit also includes examining, on a test basis, evidence supporting the amounts and disclosures in the financial statements, assessing the accounting principles used and significant estimates made by management, as well as evaluating the overall financial statement presentation. We believe that our audits provide a reasonable basis for our opinion.
In our opinion, such consolidated financial statements present fairly, in all material respects, the financial position of Schneider National, Inc. and subsidiaries at December 31, 2015 and 2014, and the results of their operations and their cash flows for each of the three years in the period ended December 31, 2015, in conformity with accounting principles generally accepted in the United States of America.
/s/ Deloitte & Touche LLP
Milwaukee, Wisconsin
December 22, 2016
F-2
Table of Contents
SCHNEIDER NATIONAL, INC., AND SUBSIDIARIES
AS OF DECEMBER 31, 2015 AND 2014
(in thousands, except share and per share information)
| 2015 | 2014 | |||||||
| ASSETS |
||||||||
| CURRENT ASSETS: |
||||||||
| Cash and cash equivalents |
$ | 160,676 | $ | 149,885 | ||||
| Marketable securities |
50,318 | 47,739 | ||||||
| Receivables: |
||||||||
| Trade—net of allowance |
400,399 | 410,030 | ||||||
| Managed freight |
6,881 | 3,677 | ||||||
| Other |
64,645 | 44,122 | ||||||
| Current portion of lease receivables—net of allowance |
118,183 | 87,636 | ||||||
| Inventories |
68,466 | 44,944 | ||||||
| Prepaid expenses and other assets |
43,430 | 40,295 | ||||||
|
|
|
|
|
|||||
| Total current assets |
912,998 | 828,328 | ||||||
|
|
|
|
|
|||||
| PROPERTY AND EQUIPMENT: |
||||||||
| Transportation equipment—net |
1,409,445 | 1,194,411 | ||||||
| Land, buildings, and improvements—net |
64,578 | 63,623 | ||||||
| Other—net |
29,934 | 18,168 | ||||||
|
|
|
|
|
|||||
| Net property and equipment |
1,503,957 | 1,276,202 | ||||||
| LEASE RECEIVABLES |
106,344 | 89,213 | ||||||
| CAPITALIZED SOFTWARE AND OTHER NONCURRENT ASSETS |
71,932 | 92,746 | ||||||
| GOODWILL |
26,706 | 33,722 | ||||||
|
|
|
|
|
|||||
| TOTAL |
$ | 2,621,937 | $ | 2,320,211 | ||||
|
|
|
|
|
|||||
See notes to consolidated financial statements.
F-3
Table of Contents
SCHNEIDER NATIONAL, INC., AND SUBSIDIARIES
CONSOLIDATED BALANCE SHEETS
AS OF DECEMBER 31, 2015 AND 2014
(in thousands, except share and per share information)
| 2015 | 2014 | |||||||
| LIABILITIES, REDEEMABLE COMMON SHARES, ACCUMULATED EARNINGS AND ACCUMULATED OTHER COMPREHENSIVE INCOME |
||||||||
| CURRENT LIABILITIES: |
||||||||
| Payables: |
||||||||
| Trade |
$ | 203,319 | $ | 167,725 | ||||
| Managed freight |
6,990 | 3,746 | ||||||
| Accrued liabilities: |
||||||||
| Salaries and wages |
82,829 | 83,943 | ||||||
| Claims accruals |
49,198 | 49,961 | ||||||
| Other |
57,812 | 45,421 | ||||||
| Current maturities of debt and capital lease obligations |
5,966 | 3,519 | ||||||
|
|
|
|
|
|||||
| Total current liabilities |
406,114 | 354,315 | ||||||
|
|
|
|
|
|||||
| NONCURRENT LIABILITIES: |
||||||||
| Debt |
528,640 | 492,291 | ||||||
| Capital lease obligations |
10,966 | 16,932 | ||||||
| Claims accruals |
113,561 | 110,726 | ||||||
| Deferred income taxes |
464,314 | 377,604 | ||||||
| Other |
42,819 | 33,662 | ||||||
|
|
|
|
|
|||||
| Total noncurrent liabilities |
1,160,300 | 1,031,215 | ||||||
|
|
|
|
|
|||||
| COMMITMENTS AND CONTINGENCIES (Note 14) |
||||||||
| TEMPORARY EQUITY—REDEEMABLE COMMON SHARES: |
||||||||
| Redeemable common shares, Class A, $0.005 par value, shares authorized: 10,000,000, shares issued and outstanding: 2,767,650 |
504,543 | 443,793 | ||||||
|
|
|
|
|
|||||
| Redeemable common shares, Class B, $0.005 par value, shares authorized: 30,000,000, shares issued and outstanding: 2,419,192 and 2,389,209, respectively |
441,018 | 383,109 | ||||||
|
|
|
|
|
|||||
| ACCUMULATED EARNINGS |
109,550 | 106,969 | ||||||
| ACCUMULATED OTHER COMPREHENSIVE INCOME |
412 | 810 | ||||||
|
|
|
|
|
|||||
| TOTAL |
$ | 2,621,937 | $ | 2,320,211 | ||||
|
|
|
|
|
|||||
See notes to consolidated financial statements.
F-4
Table of Contents
SCHNEIDER NATIONAL, INC., AND SUBSIDIARIES
CONSOLIDATED STATEMENTS OF COMPREHENSIVE INCOME
FOR THE YEARS ENDED DECEMBER 31, 2015, 2014, and 2013
(in thousands, except share and per share information)
| 2015 | 2014 | 2013 | ||||||||||
| OPERATING REVENUES |
$ | 3,959,372 | $ | 3,940,576 | $ | 3,624,366 | ||||||
|
|
|
|
|
|
|
|||||||
| OPERATING EXPENSES: |
||||||||||||
| Purchased transportation |
1,430,164 | 1,384,979 | 1,198,090 | |||||||||
| Salaries, wages, and benefits |
1,076,512 | 1,037,781 | 974,570 | |||||||||
| Fuel and fuel taxes |
290,454 | 455,751 | 504,457 | |||||||||
| Depreciation and amortization |
236,330 | 230,008 | 212,557 | |||||||||
| Operating supplies and expenses |
452,452 | 435,753 | 397,465 | |||||||||
| Insurance and related expenses |
82,007 | 62,846 | 71,577 | |||||||||
| Other general expenses |
125,176 | 94,107 | 94,401 | |||||||||
| Goodwill impairment charge |
6,037 | — | — | |||||||||
|
|
|
|
|
|
|
|||||||
| Total operating expenses |
3,699,132 | 3,701,225 | 3,453,117 | |||||||||
|
|
|
|
|
|
|
|||||||
| INCOME FROM OPERATIONS |
260,240 | 239,351 | 171,249 | |||||||||
|
|
|
|
|
|
|
|||||||
| NONOPERATING EXPENSES: |
||||||||||||
| Interest expense—net |
18,730 | 11,732 | 13,860 | |||||||||
| Other—net |
2,786 | 1,756 | 851 | |||||||||
|
|
|
|
|
|
|
|||||||
| Total nonoperating expenses |
21,516 | 13,488 | 14,711 | |||||||||
|
|
|
|
|
|
|
|||||||
| INCOME BEFORE INCOME TAXES |
238,724 | 225,863 | 156,538 | |||||||||
| PROVISION FOR INCOME TAXES |
97,792 | 92,295 | 61,064 | |||||||||
|
|
|
|
|
|
|
|||||||
| NET INCOME |
140,932 | 133,568 | 95,474 | |||||||||
|
|
|
|
|
|
|
|||||||
| OTHER COMPREHENSIVE (LOSS) INCOME: |
||||||||||||
| Foreign currency translation adjustments |
(381 | ) | (140 | ) | 39 | |||||||
| Unrealized (loss) gain on marketable securities—net of tax |
(17 | ) | 192 | (944 | ) | |||||||
|
|
|
|
|
|
|
|||||||
| Total other comprehensive (loss) income |
(398 | ) | 52 | (905 | ) | |||||||
|
|
|
|
|
|
|
|||||||
| COMPREHENSIVE INCOME |
$ | 140,534 | $ | 133,620 | $ | 94,569 | ||||||
|
|
|
|
|
|
|
|||||||
| Weighted average common shares outstanding |
5,176,332 | 5,166,126 | 5,159,505 | |||||||||
| Basic earnings per share |
$ | 27.23 | $ | 25.85 | $ | 18.50 | ||||||
| Weighted average diluted shares outstanding |
5,185,548 | 5,177,671 | 5,177,555 | |||||||||
| Diluted earnings per share |
$ | 27.18 | $ | 25.80 | $ | 18.44 | ||||||
See notes to consolidated financial statements.
F-5
Table of Contents
SCHNEIDER NATIONAL, INC., AND SUBSIDIARIES
CONSOLIDATED STATEMENTS OF REDEEMABLE COMMON SHARES, ACCUMULATED EARNINGS
AND ACCUMULATED OTHER COMPREHENSIVE INCOME
FOR THE YEARS ENDED DECEMBER 31, 2015, 2014 AND 2013
(Dollars in thousands)
| Class A Redeemable Common Shares |
Class B Redeemable Common Shares |
Accumulated Earnings |
Accumulated Other Comprehensive Income |
|||||||||||||||||||||
| Shares | Amount | Shares | Amount | |||||||||||||||||||||
| BALANCE—December 31, 2012 |
2,767,650 | $ | 371,419 | 2,407,653 | $ | 323,107 | $ | 49,728 | $ | 1,663 | ||||||||||||||
| Net income |
— | — | — | — | 95,474 | — | ||||||||||||||||||
| Other comprehensive loss |
— | — | — | — | — | (905 | ) | |||||||||||||||||
| Dividends declared at $3.10 per share |
— | — | — | — | (16,001 | ) | — | |||||||||||||||||
| Issuance of redeemable shares |
— | — | 33,605 | 4,874 | — | — | ||||||||||||||||||
| Redemption of redeemable common shares |
— | — | (48,633 | ) | (7,054 | ) | — | — | ||||||||||||||||
| Change in redemption value of redeemable common shares |
— | 30,029 | — | 26,123 | (56,152 | ) | — | |||||||||||||||||
|
|
|
|
|
|
|
|
|
|
|
|
|
|||||||||||||
| BALANCE—December 31, 2013 |
2,767,650 | $ | 401,448 | 2,392,625 | $ | 347,050 | $ | 73,049 | $ | 758 | ||||||||||||||
| Net income |
— | — | — | — | 133,568 | — | ||||||||||||||||||
| Other comprehensive income |
— | — | — | — | — | 52 | ||||||||||||||||||
| Dividends declared at $4.01 per share |
— | — | — | — | (20,697 | ) | — | |||||||||||||||||
| Issuance of redeemable shares |
— | — | 36,681 | 5,882 | — | — | ||||||||||||||||||
| Redemption of redeemable common shares |
— | — | (40,097 | ) | (6,429 | ) | — | — | ||||||||||||||||
| Change in redemption value of redeemable common shares |
— | 42,345 | — | 36,606 | (78,951 | ) | — | |||||||||||||||||
|
|
|
|
|
|
|
|
|
|
|
|
|
|||||||||||||
| BALANCE—December 31, 2014 |
2,767,650 | $ | 443,793 | 2,389,209 | $ | 383,109 | $ | 106,969 | $ | 810 | ||||||||||||||
| Net income |
— | — | — | — | 140,932 | — | ||||||||||||||||||
| Other comprehensive loss |
— | — | — | — | — | (398 | ) | |||||||||||||||||
| Dividends declared at $4.85 per share |
— | — | — | — | (25,158 | ) | — | |||||||||||||||||
| Issuance of redeemable shares |
— | — | 41,772 | 7,615 | — | — | ||||||||||||||||||
| Redemption of redeemable common shares |
— | — | (11,789 | ) | (2,149 | ) | — | — | ||||||||||||||||
| Change in redemption value of redeemable common shares |
— | 60,750 | — | 52,443 | (113,193 | ) | — | |||||||||||||||||
|
|
|
|
|
|
|
|
|
|
|
|
|
|||||||||||||
| BALANCE—December 31, 2015 |
2,767,650 | $ | 504,543 | 2,419,192 | $ | 441,018 | $ | 109,550 | $ | 412 | ||||||||||||||
|
|
|
|
|
|
|
|
|
|
|
|
|
|||||||||||||
See notes to consolidated financial statements.
F-6
Table of Contents
SCHNEIDER NATIONAL, INC., AND SUBSIDIARIES
CONSOLIDATED STATEMENTS OF CASH FLOWS
FOR THE YEARS ENDED DECEMBER 31, 2015, 2014 AND 2013
(in thousands)
| 2015 | 2014 | 2013 | ||||||||||
| OPERATING ACTIVITIES: |
||||||||||||
| Net income |
$ | 140,932 | $ | 133,568 | $ | 95,474 | ||||||
| Adjustments to reconcile net income to net cash provided by operating activities: |
||||||||||||
| Depreciation and amortization |
236,330 | 230,008 | 212,557 | |||||||||
| Gain on sale of property and equipment |
(31,113 | ) | (26,708 | ) | (18,775 | ) | ||||||
| Impairment on assets held for sale |
2,950 | — | — | |||||||||
| Goodwill impairment charge |
6,037 | — | — | |||||||||
| Loss on sale of investments |
132 | 54 | 31 | |||||||||
| Deferred income taxes |
86,719 | 57,257 | 20,731 | |||||||||
| Other noncash items |
(955 | ) | (1,017 | ) | 53 | |||||||
| Changes in operating assets and liabilities: |
||||||||||||
| Receivables |
(14,095 | ) | (63,489 | ) | (30,622 | ) | ||||||
| Other assets |
(9 | ) | (2,586 | ) | 495 | |||||||
| Payables |
32,441 | 5,448 | (1,425 | ) | ||||||||
| Other liabilities |
26,188 | 13,214 | (236 | ) | ||||||||
|
|
|
|
|
|
|
|||||||
| Net cash provided by operating activities |
485,557 | 345,749 | 278,283 | |||||||||
|
|
|
|
|
|
|
|||||||
| INVESTING ACTIVITIES: |
||||||||||||
| Purchases of transportation equipment |
(441,764 | ) | (463,795 | ) | (281,614 | ) | ||||||
| Purchases of other property and equipment |
(41,020 | ) | (23,904 | ) | (27,037 | ) | ||||||
| Proceeds from sale of property and equipment |
70,356 | 61,538 | 72,511 | |||||||||
| Proceeds from lease receipts and sale of off lease inventory |
57,017 | 43,091 | 27,847 | |||||||||
| Purchase of lease equipment |
(124,476 | ) | (91,706 | ) | (61,709 | ) | ||||||
| Sales of marketable securities |
15,166 | 12,084 | 16,795 | |||||||||
| Purchases of marketable securities |
(18,581 | ) | (13,032 | ) | (17,256 | ) | ||||||
|
|
|
|
|
|
|
|||||||
| Net cash used in investing activities |
(483,302 | ) | (475,724 | ) | (270,463 | ) | ||||||
|
|
|
|
|
|
|
|||||||
| FINANCING ACTIVITIES: |
||||||||||||
| Proceeds under revolving credit agreements |
130,000 | 225,900 | 110,000 | |||||||||
| Payments under revolving credit agreements |
(273,900 | ) | (127,000 | ) | (167,000 | ) | ||||||
| Proceeds from other debt |
180,000 | 120,000 | 100,000 | |||||||||
| Payments of debt and capital lease obligations |
(3,519 | ) | (84,013 | ) | (30,381 | ) | ||||||
| Dividends on redeemable common shares |
(25,158 | ) | (20,697 | ) | (16,001 | ) | ||||||
| Redemptions of redeemable common shares |
(2,149 | ) | (6,430 | ) | (7,054 | ) | ||||||
| Proceeds from issuances of redeemable common shares |
3,262 | 1,268 | 3,226 | |||||||||
|
|
|
|
|
|
|
|||||||
| Net cash provided by (used in) financing activities |
8,536 | 109,028 | (7,210 | ) | ||||||||
|
|
|
|
|
|
|
|||||||
| NET INCREASE (DECREASE) IN CASH AND CASH EQUIVALENTS |
10,791 | (20,947 | ) | 610 | ||||||||
| CASH AND CASH EQUIVALENTS: |
||||||||||||
| Beginning of year |
149,885 | 170,832 | 170,222 | |||||||||
|
|
|
|
|
|
|
|||||||
| End of year |
$ | 160,676 | $ | 149,885 | $ | 170,832 | ||||||
|
|
|
|
|
|
|
|||||||
| OTHER DISCLOSURES: |
||||||||||||
| Noncash investing and financing activity: |
||||||||||||
| Equipment purchases in accounts payable |
$ | 12,694 | $ | 6,298 | $ | 13,420 | ||||||
|
|
|
|
|
|
|
|||||||
| Change in redemption value of redeemable common shares |
$ | 113,193 | $ | 78,951 | $ | 56,152 | ||||||
|
|
|
|
|
|
|
|||||||
| Cash paid during the year for: |
||||||||||||
| Interest |
$ | 16,461 | $ | 12,516 | $ | 12,468 | ||||||
|
|
|
|
|
|
|
|||||||
| Income taxes—net of refunds |
$ | 30,502 | $ | 56,918 | $ | 45,032 | ||||||
|
|
|
|
|
|
|
|||||||
See notes to consolidated financial statements.
F-7
Table of Contents
SCHNEIDER NATIONAL, INC., AND SUBSIDIARIES
NOTES TO CONSOLIDATED FINANCIAL STATEMENTS
(in thousands, except share and per share information)
1. DESCRIPTION OF BUSINESS
Schneider National, Inc., and subsidiaries (the “Company”) is a Wisconsin corporation headquartered in Green Bay, Wisconsin. The Company is a leading transportation services organization providing a broad portfolio of premier truckload, intermodal and logistics solutions and operating one of the largest trucking fleets in North America. As described in Note 16, on June 1, 2016, the Company acquired 100% of the shares of Watkins and Shepard Trucking, Inc. (“WST”). WST brings together final-mile delivery, claims-free handling and an innovative technology platform. The acquisition positions the Company in the fast growing transportation segment which delivers difficult to handle goods, such as furniture and floor coverings across North America using less-than-truckload (“LTL”), truckload and logistics services.
2. SUMMARY OF SIGNIFICANT ACCOUNTING POLICIES
Basis of Consolidation—The consolidated financial statements include the accounts of the Company and all subsidiaries. All significant intercompany transactions and balances have been eliminated in consolidation.
Subsequent Events—The Company evaluated subsequent events after the consolidated balance sheet date through December 22, 2016.
Revenue Recognition—The consolidated statements of comprehensive income reflect recognition of operating revenues (including fuel surcharge revenues) and related direct costs when the shipment is delivered.
The Company also manages freight transactions for certain customers. The Company records revenue based on the net services provided, meaning that the components of revenue and expense associated with these transactions are not presented on a gross basis in the Company’s consolidated statements of comprehensive income, but rather on a net basis and classified within revenue. The amounts due from customers associated with managed freight costs and the related amounts due to managed freight carriers are classified within managed freight receivables and managed freight payables in the consolidated balance sheets.
Cash and Cash Equivalents—Cash and cash equivalents include short-term liquid investments that have original maturities of three months or less.
Marketable Securities—Marketable securities represent investments in tax-exempt municipal bonds, corporate bonds, US Treasury notes, federal agency notes and bonds, commercial paper, and certificates of deposit with original maturities of greater than 90 days from the date of acquisition. Marketable securities are classified as available for sale and carried at fair value, with any unrealized gains and losses, net of tax, included as a component of accumulated other comprehensive income. The cost of securities sold is based on the specific identification method; realized gains and losses resulting from such sales are included in interest expense—net in the consolidated statements of comprehensive income.
Marketable securities are periodically reviewed for indications of other than temporary impairment considering factors such as the extent and duration to which a security’s fair value has been less than its cost, overall economic and market conditions, and the financial conditions and specific prospects for the issuer. Impairment of marketable securities due to credit risk results in a recognized loss in the consolidated statements of comprehensive income when a market decline below cost is deemed other than temporary.
Receivables and Allowances for Doubtful Accounts—All trade and lease receivables are reported in the consolidated balance sheets at their outstanding balance adjusted for any charge-offs and net of allowances for doubtful accounts.
F-8
Table of Contents
The Company maintains allowances for doubtful accounts to absorb probable losses inherent in its portfolio of receivables. The allowances for doubtful accounts represent management’s estimates and takes into consideration numerous quantitative and qualitative factors, by receivable type, including historical loss experience, portfolio duration, collection experience, delinquency trends, economic conditions, and credit risk quality. In estimating losses inherent in each of its receivable portfolios, the Company uses historical loss experience rates by portfolio and applies them to a related aging analysis.
Management performs detailed reviews of its receivables on a monthly basis to assess the adequacy of the allowances based on historical and current trends and other factors affecting credit losses and to determine if any impairment has occurred. A receivable is impaired when it is probable that amounts related to the receivable will not be collected according to contractual terms. In circumstances where the Company is aware of a specific customer’s inability to meet its financial obligations, a specific reserve is recorded against amounts due to reduce the net receivable to the amount reasonably expected to be collected. Additions to the allowances for doubtful accounts are maintained through adjustments to bad debt expense, which is included in other general expenses in the consolidated statements of comprehensive income; amounts determined to be uncollectible are charged directly against the allowances.
Inventories—Inventories consist of tractors and trailing equipment held for sale or lease to independent contractors and supplies. These inventories are stated at the lower of cost or market using specific identification or average cost as of December 31, 2015 and 2014, and were as follows:
| 2015 | 2014 | |||||||
| Tractors and trailing equipment for sale or lease |
$ | 53,557 | $ | 30,540 | ||||
| Replacement parts |
12,547 | 11,463 | ||||||
| Tires, rims, and other |
2,362 | 2,941 | ||||||
|
|
|
|
|
|||||
| Total |
$ | 68,466 | $ | 44,944 | ||||
|
|
|
|
|
|||||
Property and Equipment—Property and equipment are recorded at cost. Equipment acquired under capitalized leases is included as a component of transportation equipment in the consolidated balance sheets. Depreciation and amortization are computed using the straight-line method based on estimated useful lives and residual values. Generally, the estimated useful lives are as follows:
| Tractors |
6–8 years | |||
| Trailing equipment |
10–20 years | |||
| Other transportation equipment |
4–20 years | |||
| Buildings and improvements |
5–25 years | |||
| Other property |
3–10 years |
The Company had $1,166,239 and $1,118,476 of accumulated depreciation as of December 31, 2015 and 2014, respectively. Depreciation expense for the years ended December 31, 2015, 2014, and 2013 was $207,483, $201,477, and $184,869, respectively.
Expenditures for maintenance and repairs are expensed as incurred. Tires related to new equipment are included in the capitalized equipment cost and depreciated using the same methods as equipment. Replacement tires are expensed when placed in service.
F-9
Table of Contents
Assets held for sale are evaluated for impairment when they are placed in held for sale status and in subsequent reporting periods. The assets are measured at the lower of carrying amount or fair value less cost to sell. Assets held for sale are included in prepaid expenses and other assets on the consolidated balance sheets. As of December 31, 2015 and 2014, assets held for sale by segment were as follows:
| Segment |
2015 | 2014 | ||||||
| Truckload |
$ | 16,319 | $ | 14,207 | ||||
| Intermodal |
1,061 | 502 | ||||||
|
|
|
|
|
|||||
| Total |
$ | 17,380 | $ | 14,709 | ||||
|
|
|
|
|
|||||
Gains and losses on the sale or other disposition of equipment are recognized at the time of disposition and are based on the difference between the proceeds received and the net book value of the assets disposed. Gains from the sale of held for sale assets were $19,225, $15,280, and $8,369 for the years ended December 31, 2015, 2014, and 2013, respectively and are classified in operating supplies and expenses on the consolidated statements of comprehensive income.
Software Development—The Company’s policy is to capitalize certain costs related to software developed and implemented for internal use and to amortize such costs over a period of five years on a straight-line basis. The Company had $67,728 and $86,741 of capitalized software development costs, net of accumulated amortization, as of December 31, 2015 and 2014, respectively. Amortization expense totaled $28,429 for the year ended December 31, 2015. Amortization expense was $27,904 and $27,061 for the years ended December 31, 2014 and 2013, respectively.
Impairment of Long-Lived Assets—The Company reviews long-lived assets for impairment whenever events or changes in circumstances indicate that the carrying amount of these assets may not be recoverable. The Company evaluates these assets for impairment based on estimated undiscounted future cash flows from these assets. Impairment is measured as the amount by which the carrying amount exceeds fair value and is classified in operating supplies and expenses on the consolidated statements of comprehensive income. Such analyses necessarily involve significant estimates. Impairment of long-lived assets totaled $2,950 for the year ended December 31, 2015 using level 3 inputs as defined in Note 3. No impairment of long-lived assets was recorded for the years ended December 31, 2014 and 2013.
Goodwill and Other Intangibles—The Company performs an annual goodwill impairment test at the reporting unit level as of December 31 each year. The impairment test is a two-step process. Step 1 includes the estimation of the fair value of each reporting unit. The fair value of the Company’s reporting units is estimated using the present value of expected future cash flows. If the carrying amount of the reporting unit exceeds its estimated fair value, the second step of the impairment test is required. Step 2 requires that the implied fair value of the reporting unit goodwill be compared to the carrying amount of that goodwill. If the carrying amount of the reporting unit goodwill exceeds the implied fair value of that goodwill, an impairment loss shall be recognized in an amount equal to that excess.
After performing Step 2, it was determined that the implied value of goodwill recorded in the Asia reporting unit, a business under the Other segment, was less than the carrying value, resulting in an impairment charge of $6,000 for the year ended December 31, 2015. The facts and circumstances that led to an impairment of goodwill included consecutive years of less than expected performance and the declining Chinese economy. Step 1 indicated no impairment for the Import/Export reporting unit, a business under the Logistics segment. The impairment test performed for both reporting units in 2014 and 2013 determined that there was no impairment nor was there impairment in any prior period.
F-10
Table of Contents
Changes to goodwill, by reportable segment, and other intangibles during the periods indicated are as follows:
| Other | Logistics | Total Goodwill |
Other Intangibles |
|||||||||||||
| Balance—December 31, 2013 |
$ | 19,676 | $ | 14,173 | $ | 33,849 | $ | 1,298 | ||||||||
| Currency translation |
(127 | ) | — | (127 | ) | (3 | ) | |||||||||
| Amortization |
— | — | — | (628 | ) | |||||||||||
|
|
|
|
|
|
|
|
|
|||||||||
| Balance—December 31, 2014 |
19,549 | 14,173 | 33,722 | 667 | ||||||||||||
| Currency translation |
(1,016 | ) | — | (1,016 | ) | (15 | ) | |||||||||
| Impairment |
(6,000 | ) | — | (6,000 | ) | — | ||||||||||
| Amortization |
— | — | — | (418 | ) | |||||||||||
|
|
|
|
|
|
|
|
|
|||||||||
| Balance—December 31, 2015 |
$ | 12,533 | $ | 14,173 | $ | 26,706 | $ | 234 | ||||||||
|
|
|
|
|
|
|
|
|
|||||||||
Identifiable intangible assets, other than goodwill, include customer lists and are included as a component of other noncurrent assets in the consolidated balance sheets. Such assets are being amortized over a 10-year period from the date of acquisition.
Debt Issuance Costs—The Company incurred and capitalized certain costs and fees in connection with various financing transactions. These costs are being amortized within interest expense—net in the consolidated statements of comprehensive income over the terms of the related financing agreements. Capitalized debt issuance costs are reported as a direct deduction from the carrying amount of the associated debt on the consolidated balance sheets.
Earnings Per Share—The Company computes basic earnings per share by dividing net earnings available to common shareholders by the actual weighted average number of redeemable Class A and B common shares outstanding for the reporting period. Diluted earnings per share reflect the potential dilution that could occur if holders of unvested restricted shares become vested. Outstanding unvested restricted share units represent the dilutive effects on weighted average shares.
Accounts Payable—Included in payables—trade are amounts payable to banks as a result of checks in transit of $66,973 and $20,661 as of December 31, 2015 and 2014, respectively.
Claims Accruals—The primary claims arising for the Company consist of cargo liability, auto liability, and workers’ compensation losses. Accruals are based on estimated or expected losses for claims. Estimates are determined by evaluating the nature and severity of individual claims and by estimating future claims development based upon historical claim development trends, advice from third-party administrators and legal counsel. The actual cost to settle claim liabilities may differ from reserve estimates due to legal costs, claims that have not been reported, and various other uncertainties, including the inherent difficulty in estimating the severity of the claims and the potential judgement or settlement amount to dispose of the claim. The obligations for claims that are not expected to be paid within one year are classified as noncurrent liabilities in the consolidated balance sheets.
F-11
Table of Contents
The rollforward of the claims accruals for the years ended December 31, 2015, 2014 and 2013 are as follows:
| 2015 | 2014 | 2013 | ||||||||||
| Beginning Balance |
$ | (160,687 | ) | $ | (172,591 | ) | $ | (179,238 | ) | |||
| Incurred |
(88,758 | ) | (88,393 | ) | (88,856 | ) | ||||||
| Paid |
86,686 | 100,298 | 95,502 | |||||||||
|
|
|
|
|
|
|
|||||||
| Ending Balance |
$ | (162,759 | ) | $ | (160,687 | ) | $ | (172,591 | ) | |||
|
|
|
|
|
|
|
|||||||
| Less: Current claims accruals |
49,198 | 49,961 | 84,799 | |||||||||
| Noncurrent claim accruals |
$ | 113,561 | $ | 110,726 | $ | 87,792 | ||||||
|
|
|
|
|
|
|
|||||||
Related Parties—As of December 31, 2013, the Company had certain related-party balances with its majority shareholder and other shareholders consisting mainly of a note payable totaling $57,546 to the related party. The terms of the transactions were determined by the Company’s management and were reviewed by the Company’s Board of Directors. All such shareholder debts were paid off by the Company at maturity in January 2014.
Foreign Currency Translation—The net assets of the Company’s non-US operations in Mexico and China are translated at current exchange rates and income and expense items are translated at their average exchange rate for the year. The resulting translation adjustments are recorded as a separate component of accumulated other comprehensive income. The functional currency for the non-US operations is the respective local currency.
Income Taxes—Income taxes are accounted for using an asset and liability approach that requires the recognition of deferred tax assets and liabilities for the expected future tax consequences of events that have been recognized in the Company’s consolidated financial statements or tax returns. In estimating future tax consequences, all expected future events other than proposed changes in the tax law or rates are considered. Valuation allowances are provided if it is more likely than not that a deferred tax asset will not be realized. The Company records a liability for unrecognized tax benefits when it is more likely than not that the benefits of tax positions taken on a tax return will not be sustained upon audit. Potential interest and penalties related to uncertain tax positions are recorded in income tax expense.
Accumulated Other Comprehensive Income—Accumulated other comprehensive income refers to unrealized gains and losses that are not currently included in net income. For the years ended December 31, 2015 and 2014, the components of accumulated other comprehensive income were as follows:
| 2015 | 2014 | |||||||
| Foreign currency translation adjustments |
$ | 407 | $ | 789 | ||||
| Unrealized gain on marketable securities—net of taxes of $3 and $11 for 2015 and 2014, respectively. |
5 | 21 | ||||||
|
|
|
|
|
|||||
| Total |
$ | 412 | $ | 810 | ||||
|
|
|
|
|
|||||
In 2015, amounts reclassified from accumulated other comprehensive income represented realized losses of $132, which is included as a component of interest expense—net in the consolidated statements of comprehensive income.
Use of Estimates—The preparation of consolidated financial statements in conformity with accounting principles generally accepted in the United States of America (GAAP) requires management to make estimates and assumptions that affect the reported amounts of assets and liabilities, disclosure of contingent assets and liabilities, and the reported amounts of revenues and expenses. Actual results could differ from those estimates.
F-12
Table of Contents
3. ACCOUNTING PRONOUNCEMENTS
Accounting Standards Issued But Not Yet Adopted—In May 2014, the Financial Accounting Standards Board (“FASB”) and International Accounting Standards Board (“IASB”) issued their final standard on revenue from contracts with customers. The standard, issued as ASU No. 2014-09, Revenue from Contracts with Customers by the FASB and as International Financial Reporting Standard 15, Revenue from Contracts with Customers, by the IASB, outlines a single comprehensive model for entities to use in accounting for revenue arising from contracts with customers and supersedes most current revenue recognition guidance, including industry-specific guidance. As amended, the new revenue recognition standard will be effective for the Company’s 2018 interim and annual periods. The Company is currently evaluating the impact that the adoption of this pronouncement will have on its consolidated financial statements.
In February 2016, the FASB issued ASU No. 2016-02, Leases (Topic 842), which requires lessees to recognize in the consolidated balance sheets assets and liabilities for leases with lease terms of more than 12 months. Consistent with current accounting principles, the recognition, measurement, and presentation of expenses and cash flows arising from a lease by a lessee primarily will depend on its classification as a finance or operating lease. However, unlike current accounting principles, which require only capital leases to be recognized in the consolidated balance sheets, the new ASU will require both types of leases to be recognized in the consolidated balance sheets. In transition, lessees and lessors are required to recognize and measure leases at the beginning of the earliest period presented using a modified retrospective approach. The modified retrospective approach includes a number of optional practical expedients that companies may elect to apply. These practical expedients relate to the identification and classification of leases that commenced before the effective date, initial direct costs for leases that commenced before the effective date, and the ability to use hindsight in evaluating lessee options to extend or terminate a lease or to purchase the underlying asset. The transition guidance also provides specific guidance for sale and leaseback transactions, build-to-suit leases, leveraged leases, and amounts previously recognized in accordance with the business combinations guidance for leases. The ASU will take effect for public companies for fiscal years beginning after December 15, 2018. Early adoption of ASU No. 2016-02 is permitted. The Company is currently evaluating the impact that the adoption of this pronouncement will have on its consolidated financial statements.
In January 2016, the FASB issued ASU 2016-01, Financial Instruments–Overall (Subtopic 825-10). This update was issued to enhance the reporting model for financial instruments regarding certain aspects of recognition, measurement, presentation, and disclosure. The update (i) requires equity investments (except those accounted for under the equity method or that are consolidated) to be measured at fair value with changes in fair value recognized in net income; (ii) simplifies the impairment assessment of equity investments without readily determinable fair values by requiring a qualitative assessment to identify impairment; (iii) eliminates the requirement for an entity to disclose the methods and significant assumptions used to estimate the fair value of financial instruments measured at amortized cost; (iv) requires an entity to use the exit price notion when measuring the fair value of financial instruments for disclosure purposes; and (v) requires separate presentation of financial assets and financial liabilities by measurement category and form of financial asset on the balance sheet or in the accompanying notes to consolidated financial statements. These provisions are effective for annual reporting periods beginning after December 15, 2017, and interim periods within those annual periods. The standard is to be applied using a cumulative-effect adjustment to the balance sheet as of the beginning of the year of adoption. The Company is currently evaluating the effect that adopting this standard will have on the Company’s consolidated financial statements.
In March 2016, the FASB issued ASU No. 2016-09, Compensation—Stock Compensation: Improvements to Employee Share-Based Payment Accounting, to simplify several aspects of the accounting for share-based payment transactions, including the income tax consequences, classification of awards as either equity or liabilities, and classification on the statement of cash flows. An entity should recognize all excess tax benefits previously unrecognized, along with any valuation allowance, on a modified retrospective basis as a cumulative-effect adjustment to accumulated earnings as of the date of adoption. The change in classification on the
F-13
Table of Contents
statement of cash flows can be applied prospectively or retrospectively to all periods presented. The provisions of this update are effective for fiscal years beginning after December 15, 2016. The Company is currently evaluating the effect that adopting this standard will have on the Company’s consolidated financial statements.
In August 2016, the FASB issued ASU No. 2016-15, Statement of Cash Flows (Topic 230): Classification of Certain Cash Receipts and Cash Payments, which addresses eight specific cash flow issues with the objective of reducing the existing diversity in practice. Entities must apply the guidance retrospectively to all periods presented but may apply it prospectively if retrospective application would be impracticable. The provisions of this update are effective for fiscal years beginning after December 15, 2017. The Company is currently evaluating the effect that adopting this standard will have on the Company’s consolidated financial statements.
4. FAIR VALUE MEASUREMENTS
Fair value focuses on the estimated price that would be received to sell the asset or paid to transfer the liability, which is referred to as the exit price. Inputs to valuation techniques used to measure fair value fall into three broad levels (Levels 1, 2, and 3) as follows:
Level 1—Observable inputs that reflect quoted prices for identical assets or liabilities in active markets that the Company has the ability to access at the measurement date.
Level 2—Observable inputs, other than quoted prices included in Level 1, for the asset or liability or prices for similar assets and liabilities.
Level 3—Unobservable inputs reflecting the reporting entity’s estimates of the assumptions that market participants would use in pricing the asset or liability (including assumptions about risk).
The recorded value of cash, receivables, payables, and accrued liabilities approximate fair value. The Company measures its marketable securities on a recurring, monthly basis. As of December 31, 2015 and 2014, available-for-sale marketable securities of $50,318 and $47,739, respectively, were classified as current assets. The amortized cost of these securities was $50,311 and $47,707 at December 31, 2015 and 2014, respectively. The Company’s marketable securities have maturities of 12 to 30 months and are as follows:
| 2015 | 2014 | |||||||||||||||
| Amortized Cost |
Fair Value |
Amortized Cost |
Fair Value |
|||||||||||||
| Zero coupon bonds |
$ | 3,692 | $ | 3,724 | $ | 3,617 | $ | 3,624 | ||||||||
| U.S. treasury and government agencies |
10,036 | 9,996 | 12,062 | 12,052 | ||||||||||||
| Asset-backed securities |
528 | 514 | 652 | 636 | ||||||||||||
| Corporate debt securities |
18,653 | 18,760 | 16,091 | 16,278 | ||||||||||||
| State and political subdivisions |
17,402 | 17,324 | 15,285 | 15,149 | ||||||||||||
|
|
|
|
|
|
|
|
|
|||||||||
| Total marketable securities |
$ | 50,311 | $ | 50,318 | $ | 47,707 | $ | 47,739 | ||||||||
|
|
|
|
|
|
|
|
|
|||||||||
All marketable securities were valued based upon quoted prices for similar assets in active markets or quoted prices for identical or similar assets in markets that are not active (Level 2). During all periods presented, there were no transfers of securities between levels. Gross realized gains and losses on sales of marketable securities were not material in 2015, 2014 or 2013.
The fair value of noncurrent assets are evaluated on a nonrecurring basis when facts come to the attention of management which indicate an other than temporary impairment. Fair values are determined based on valuation techniques using Level 3 inputs.
F-14
Table of Contents
5. RECEIVABLES
Trade Receivables—The Company’s trade receivables primarily arise from providing transportation and logistics services to customers. The components of trade receivables as of December 31, 2015 and 2014, are as follows:
| 2015 | 2014 | |||||||
| Trade receivables |
$ | 403,955 | $ | 414,707 | ||||
| Allowance for doubtful accounts |
(3,556 | ) | (4,677 | ) | ||||
|
|
|
|
|
|||||
| Trade receivables—net of allowance |
$ | 400,399 | $ | 410,030 | ||||
|
|
|
|
|
|||||
The rollforward of the allowance for doubtful accounts for the years ended December 31, 2015, 2014 and 2013 are as follows:
| 2015 | 2014 | 2013 | ||||||||||
| Beginning Balance |
$ | (4,677 | ) | $ | (3,093 | ) | $ | (3,334 | ) | |||
| Provision |
(229 | ) | (2,442 | ) | (3,657 | ) | ||||||
| Recoveries |
(545 | ) | (174 | ) | (289 | ) | ||||||
| Write-offs |
1,895 | 1,032 | 4,187 | |||||||||
|
|
|
|
|
|
|
|||||||
| Ending Balance |
$ | (3,556 | ) | $ | (4,677 | ) | $ | (3,093 | ) | |||
|
|
|
|
|
|
|
|||||||
Lease Receivables—The Company finances various types of transportation-related equipment for independent third parties. The transactions are generally for one to five years and are accounted for as sales-type or direct financing leases. As of December 31, 2015 and 2014, the investment in lease receivables was as follows:
| 2015 | 2014 | |||||||
| Future minimum payments to be received on leases |
$ | 113,926 | $ | 95,999 | ||||
| Guaranteed residual lease values |
137,040 | 102,208 | ||||||
|
|
|
|
|
|||||
| Total minimum lease payments to be received |
250,966 | 198,207 | ||||||
| Unearned income |
(26,439 | ) | (21,395 | ) | ||||
|
|
|
|
|
|||||
| Net investment in leases |
224,527 | 176,812 | ||||||
|
|
|
|
|
|||||
| Notes receivable |
— | 37 | ||||||
|
|
|
|
|
|||||
| Current maturities of lease and notes receivable |
118,846 | 87,932 | ||||||
| Less—allowance for doubtful accounts |
(663 | ) | (296 | ) | ||||
|
|
|
|
|
|||||
| Current portion of lease and notes receivable—net of allowance |
118,183 | 87,636 | ||||||
|
|
|
|
|
|||||
| Lease receivables—noncurrent |
$ | 106,344 | $ | 89,213 | ||||
|
|
|
|
|
|||||
The principal amounts to be received on lease receivables as of December 31, 2015, are as follows:
| Years Ending December 31 |
Leases | |||
| 2016 |
$ | 118,846 | ||
| 2017 |
51,789 | |||
| 2018 |
48,011 | |||
| 2019 |
5,121 | |||
| 2020 |
1,423 | |||
| Thereafter |
— | |||
|
|
|
|||
| Total |
$ | 225,190 | ||
|
|
|
|||
F-15
Table of Contents
Leases are generally placed on nonaccrual status (nonaccrual of interest and other fees) when a payment becomes 90 days past due or upon receipt of notification of bankruptcy, upon the death of a customer, or in other instances in which management concludes collectability is not reasonably assured. The accrual of interest and other fees is resumed when all payments are less than 60 days past due. At December 31, 2015, there were $284 of lease payments greater than 90 days past due, with amounts reserved, as discussed in Note 2, of $663.
The terms of the lease agreements generally give the Company the ability to take possession of the underlying asset in the event of default. The Company may incur credit losses in excess of recorded allowances if the full amount of any anticipated proceeds from the sale or re-lease of the asset supporting the third party’s financial obligation is not realized. Costs to repossess and estimated reconditioning costs are recorded in the consolidated statements of comprehensive income in the period incurred.
Other receivables—The Company’s other receivables consist of income tax receivable balances and other non-trade receivables. Non-trade receivables primarily arise from transactions outside of the core transportation and logistics business.
6. DEBT AND CREDIT FACILITIES
As of December 31, 2015 and 2014, debt includes the following:
| 2015 | 2014 | |||||||
| Unsecured senior notes: principal payable at maturity; interest payable in quarterly or semiannual installments through 2024; weighted-average interest rates of 3.66% and 3.76% for 2015 and 2014, respectively |
$ | 500,000 | $ | 320,000 | ||||
| Revolving credit borrowings: interest rates of 1.47% and 1.42% for 2015 and 2014, respectively |
— | 28,900 | ||||||
| Secured credit facility: collateralized by certain trade receivables and interest rates of 1.38% and 1.26% for 2015 and 2014, respectively |
30,000 | 145,000 | ||||||
|
|
|
|
|
|||||
| Total principal outstanding |
530,000 | 493,900 | ||||||
| Current maturities |
— | — | ||||||
| Debt issuance costs |
(1,360 | ) | (1,609 | ) | ||||
|
|
|
|
|
|||||
| Long-term debt |
$ | 528,640 | $ | 492,291 | ||||
|
|
|
|
|
|||||
Scheduled principal payments of debt subsequent to December 31, 2015, are as follows:
| Years Ending December 31 |
||||
| 2016 |
$ | — | ||
| 2017 |
130,000 | |||
| 2018 |
— | |||
| 2019 |
40,000 | |||
| 2020 |
55,000 | |||
| 2021 and thereafter |
305,000 | |||
|
|
|
|||
| Total |
$ | 530,000 | ||
|
|
|
|||
Financing arrangements require the Company to maintain certain covenants and financial ratios. The credit agreement contains various financial and other covenants, including required minimum consolidated net worth, consolidated net debt, limitations on indebtedness, transactions with affiliates, shareholder debt and restricted payments. The credit agreement and senior notes contain change of control provisions pursuant to which a change of control is defined to mean the Schneider family no longer owns more than 50% of the combined voting power of the Company’s capital stock. As of December 31, 2015, the Company was in compliance with all covenants and financial ratios under the credit agreement and the indentures governing the Senior Notes.
F-16
Table of Contents
In September 2014, the Company entered into a $300,000 private placement unsecured senior note offering. The initial funding of $120,000 occurred in November 2014, with final maturity dates of 2019, 2021, and 2024 and fixed interest rates of 2.76%, 3.25%, and 3.61%, respectively. The second funding of $180,000 was completed in March 2015, with final maturity dates of 2020, 2022, and 2025 and fixed interest rates of 2.86%, 3.35%, and 3.71%, respectively.
In November 2013, the Company entered into a five-year master revolving credit agreement with a syndicate of commercial banks providing borrowing capacity of up to $250,000. This agreement extended until November 2018 the previous revolving credit agreement, which would have expired in February 2016. Under the terms of the agreement, funds may be borrowed at rates selected by the Company based on various market indices. Borrowings under the credit agreement, which are primarily used for working capital and capital expenditures, are unsecured. No principal payments are required until the expiration date of the agreement. This agreement also provides a sublimit of $100,000 to be used for the issuance of letters of credit. At December 31, 2015 and 2014, standby letters of credit under this agreement amounted to $100 and $100, respectively, and were primarily related to the requirements of certain of the Company’s real estate leases. As of December 31, 2015, the Company had no outstanding borrowings under the revolving credit agreement. As of December 31, 2014, the Company had outstanding borrowings of $28,900 under the revolving credit agreement.
In December 2013, the Company entered into a secured credit facility that allows the Company to borrow up to $200,000 against qualifying trade receivables. This agreement extended the previous secured credit facility, which would have expired in March 2015. The amended credit facility, which expires in December 2017, increases the $125,000 borrowing capacity of the previous agreement. No principal payments are required until the expiration date of the facility. Under the terms of the agreement, funds may be borrowed at rates based on the 30-day London InterBank Offered Rate. The amended facility allows for the issuance of letters of credit. At December 31, 2015, standby letters of credit under this agreement amounted to $62,531 and were primarily related to the requirements of certain of the Company’s insurance obligations. The Company had $30,000 and $145,000 of outstanding borrowings under the credit facility as of December 31, 2015 and 2014, respectively.
Based upon borrowing rates available to the Company in the applicable year, a fixed-rate debt portfolio with similar terms and maturities would have a fair value of approximately $528,653 and $503,117 as of December 31, 2015 and 2014, respectively.
7. CAPITALIZED LEASES
The consolidated balance sheets include assets acquired under capital lease as components of property and equipment as of December 31, 2015 and 2014, as follows:
| 2015 | 2014 | |||||||
| Transportation equipment |
$ | 29,991 | $ | 30,017 | ||||
| Real property |
825 | 825 | ||||||
| Accumulated depreciation |
(11,712 | ) | (9,142 | ) | ||||
|
|
|
|
|
|||||
| Total |
$ | 19,104 | $ | 21,700 | ||||
|
|
|
|
|
|||||
The related capitalized lease obligations as of December 31, 2015 and 2014, are as follows:
| 2015 | 2014 | |||||||
| Total future minimum payments |
$ | 18,211 | $ | 22,274 | ||||
| Amount representing interest |
(1,279 | ) | (1,823 | ) | ||||
|
|
|
|
|
|||||
| Present value of minimum lease payments |
16,932 | 20,451 | ||||||
| Current maturities |
(5,966 | ) | (3,519 | ) | ||||
|
|
|
|
|
|||||
| Long-term capital lease obligations |
$ | 10,966 | $ | 16,932 | ||||
|
|
|
|
|
|||||
F-17
Table of Contents
Interest paid under capital leases totaled $544, $617, and $684 in 2015, 2014, and 2013, respectively.
Future minimum lease and interest payments required under capitalized leases as of December 31, 2015, are as follows:
| Years Ending December 31 |
||||
| 2016 |
$ | 6,431 | ||
| 2017 |
2,465 | |||
| 2018 |
2,465 | |||
| 2019 |
6,708 | |||
| 2020 |
142 | |||
| 2021 and thereafter |
— | |||
|
|
|
|||
| Total |
$ | 18,211 | ||
|
|
|
|||
8. OPERATING LEASES
The Company has various operating lease agreements primarily related to transportation equipment and real estate. These leases are noncancelable and expire on various dates through 2023. Future minimum payments required under these leases as of December 31, 2015, are as follows:
| Years Ending December 31 |
||||
| 2016 |
$ | 38,225 | ||
| 2017 |
20,170 | |||
| 2018 |
14,170 | |||
| 2019 |
8,378 | |||
| 2020 |
5,751 | |||
| 2021 and thereafter |
2,233 | |||
|
|
|
|||
| Total |
$ | 88,927 | ||
|
|
|
|||
Lease expense for all operating leases was $51,422, $51,750, and $53,716 in 2015, 2014, and 2013, respectively, and is classified in operating supplies and expenses on the consolidated statements of comprehensive income.
9. INCOME TAXES
The components of the provision for income taxes as of December 31, 2015, 2014 and 2013, were as follows:
| 2015 | 2014 | 2013 | ||||||||||
| Current: |
||||||||||||
| Federal |
$ | 5,533 | $ | 28,988 | $ | 36,250 | ||||||
| State and other |
7,496 | 6,339 | 4,980 | |||||||||
|
|
|
|
|
|
|
|||||||
| 13,029 | 35,327 | 41,230 | ||||||||||
|
|
|
|
|
|
|
|||||||
| Deferred: |
||||||||||||
| Federal |
79,311 | 51,765 | 18,147 | |||||||||
| State and other |
5,452 | 5,203 | 1,687 | |||||||||
|
|
|
|
|
|
|
|||||||
| 84,763 | 56,968 | 19,834 | ||||||||||
|
|
|
|
|
|
|
|||||||
| Total provision for income taxes |
$ | 97,792 | $ | 92,295 | $ | 61,064 | ||||||
|
|
|
|
|
|
|
|||||||
F-18
Table of Contents
Foreign operations of the Company are insignificant in relation to overall Company operating results.
The provision for income taxes as of December 31, 2015, 2014 and 2013 differed from the amounts computed using the federal statutory rate of 35% as follows:
| 2015 | 2014 | 2013 | ||||||||||
| Income tax at federal statutory rate |
$ | 83,553 | $ | 78,999 | $ | 54,788 | ||||||
| State tax, net of federal effect |
10,325 | 9,323 | 4,923 | |||||||||
| Nondeductible meals and entertainment |
3,572 | 3,523 | 3,734 | |||||||||
| Other, net |
342 | 450 | (2,381 | ) | ||||||||
|
|
|
|
|
|
|
|||||||
| Total provision for income taxes |
$ | 97,792 | $ | 92,295 | $ | 61,064 | ||||||
|
|
|
|
|
|
|
|||||||
The components of the net deferred tax liability included in deferred income taxes in the consolidated balance sheets as of December 31, 2015 and 2014, were as follows:
| 2015 | 2014 | |||||||
| Deferred tax assets: |
||||||||
| Allowance for doubtful accounts |
$ | 830 | $ | 1,088 | ||||
| Compensation and employee benefits |
15,859 | 12,835 | ||||||
| Insurance and claims accruals |
3,838 | 3,399 | ||||||
| Other |
8,763 | 12,822 | ||||||
|
|
|
|
|
|||||
| Total gross deferred tax assets |
29,290 | 30,144 | ||||||
| Valuation allowance |
(1,818 | ) | (2,360 | ) | ||||
|
|
|
|
|
|||||
| Total deferred tax assets, net of valuation allowance |
27,472 | 27,784 | ||||||
|
|
|
|
|
|||||
| Deferred tax liabilities: |
||||||||
| Property and equipment |
473,000 | 394,569 | ||||||
| Prepaid expenses |
4,923 | 3,506 | ||||||
| Intangibles |
4,306 | 3,436 | ||||||
| Other |
9,557 | 3,877 | ||||||
|
|
|
|
|
|||||
| Total gross deferred tax liabilities |
491,786 | 405,388 | ||||||
|
|
|
|
|
|||||
| Net deferred tax liability |
$ | 464,314 | $ | 377,604 | ||||
|
|
|
|
|
|||||
As of December 31, 2015 and 2014, a reconciliation of the beginning and ending amount of unrecognized tax benefits, which is recorded as other noncurrent liabilities in the consolidated balance sheets, is as follows:
| 2015 | 2014 | 2013 | ||||||||||
| Gross unrecognized tax benefits—beginning of year |
$ | 2,940 | $ | 3,274 | $ | 3,462 | ||||||
| Gross increases—tax positions related to current year |
525 | 347 | 247 | |||||||||
| Gross decreases—tax positions taken in prior years |
(1,110 | ) | (513 | ) | 0 | |||||||
| Settlements |
(237 | ) | (92 | ) | (113 | ) | ||||||
| Lapse of Statutes |
(78 | ) | (76 | ) | (322 | ) | ||||||
|
|
|
|
|
|
|
|||||||
| Gross unrecognized tax benefits—end of year |
$ | 2,040 | $ | 2,940 | $ | 3,274 | ||||||
|
|
|
|
|
|
|
|||||||
Unrecognized Tax Benefits—The Company’s unrecognized tax benefits as of December 31, 2015 would reduce the provision for income taxes if subsequently recognized. Potential interest and penalties related to unrecognized tax benefits are recorded in income tax expense. Interest and penalties recorded in income tax expense for the years ended December 31, 2015, 2014, and 2013 were immaterial and accrued interest and penalties for such unrecognized tax benefits as of December 31, 2015, 2014 and 2013 were $948, $2,835 and
F-19
Table of Contents
$2,724 respectively. The Company expects no significant increases or decreases for uncertain tax positions during the twelve months immediately following the December 31, 2015 reporting date.
Tax Examinations—The Company files a U.S. federal income tax return, as well as income tax returns in a majority of state tax jurisdictions. The Company also files returns in foreign jurisdictions. The years 2014 and 2015 are open for examination by the Internal Revenue Service (“IRS”), and various years are open for examination by state and foreign tax authorities. In June 2016, the Company closed the examination with the IRS for tax years 2012 and 2013 and there were no adjustments that had a material impact on income tax expense. State and foreign jurisdictional statutes of limitations generally range from three to four years.
Carryforwards—As of December 31, 2015, the Company has $220,823 of state net operating loss carryforwards which are subject to expiration from 2016 to 2035. The Company also had state credit carryforwards of $2,001, which are subject to expiration from 2016 to 2019 and no capital loss carryforwards. The deferred tax assets related to carryforwards at December 31, 2015 were $10,908 for state net operating loss carryforwards and $1,301 for state credit carryforwards. Carryforwards are reviewed for recoverability based on historical taxable income, the expected reversals of existing temporary differences, tax-planning strategies, and projections of future taxable income. At December 31, 2015, the Company carried a total valuation allowance of $1,818 which represents $911 against state deferred tax assets and $907 against state credit carryforwards.
10. EMPLOYEE BENEFIT PLANS
The Company sponsors defined contribution plans for certain eligible employees. Under these plans, annual contribution levels, as defined in the agreements, are based upon years of service. Expense under these plans totaled $10,325, $9,918, and $9,612 in 2015, 2014, and 2013, respectively, and is classified in salaries, wages, and benefits on the consolidated statements of comprehensive income.
The Company also has a savings plan, organized pursuant to Section 401(k) of the Internal Revenue Code, to provide employees with additional income upon retirement. Under the terms of the plan, substantially all employees may contribute a percentage of their annual compensation, as defined, to the plan. The Company makes contributions to the plan, up to a maximum amount per employee, based upon a percentage of employee contributions. The Company’s net expense under this plan was $9,556, $10,469, and $10,089 in 2015, 2014, and 2013, respectively.
11. REDEEMABLE COMMON SHARES AND SHARE-BASED AWARDS
The Company’s outstanding shares of Class A and B redeemable common shares share equally in all dividends and distributions. However, the redeemable Class B shares do not having voting rights. The Company has the right to call the Class A and Class B shares under certain circumstances. Likewise, the Class A and Class B Shareholders have the right to put the Class A and Class B shares to the Company under certain circumstances. The repurchase price in the event of a Company call or shareholder put is generally the net book value of the shares as of the end of the immediately preceding fiscal year. Other than through these repurchase provisions or other certain permitted transactions defined in the shareholders’ agreement, the Class A and Class B Shareholders are not permitted to transfer their shares.
The Company has an employee share purchase plan whereby the Board of Directors may offer directors and selected employees an opportunity to purchase shares of the Company’s Class B common shares at the net book value of the shares as of the end of the immediately preceding fiscal year (consistent with the price used for repurchasing Class A and B redeemable common shares with all shareholders). The directors and employees may sell their Class B redeemable common shares subject to the Company’s right of first refusal. If exercised, the Company’s right of first refusal would be exercised at the net book value of the shares as of the end of the immediately preceding fiscal year. The Company does not record compensation cost associated with the employee share purchase plan because the directors and employees purchase and sell their shares under the
F-20
Table of Contents
employee share purchase plan on the same terms available to all other holders of the Company’s Class A and Class B redeemable common shares.
The Board of Directors may grant directors and selected employees restricted shares at no cost to the recipient, and which can be settled only in Class B redeemable common shares at the end of the vesting period. Compensation cost associated with the awarded shares is measured at the net book value of the shares as of the end of the immediately preceding fiscal year and is recognized ratably over the requisite service period, which is generally one to three years. Restricted shares do not provide the holder with cash dividends during the vesting period, nor do dividends accrue prior to vesting. Any Class B shares issued in settlement of vested restricted shares are subject to the same sale and repurchase provisions as the shares acquired under the employee share purchase plan discussed above.
While no Class A or Class B redeemable common shares are mandatorily redeemable, certain of the circumstances under which the Class A and Class B shareholders, including the directors and employees holding shares pursuant to the employee share purchase plan and settlement of restricted shares, can redeem shares are outside the control of the Company. As a consequence, all vested Class A and B common shares are recorded as temporary equity (redeemable common shares) in the consolidated balance sheets at their redemption value as of the respective balance sheet date. Accumulated earnings in the consolidated balance sheets is adjusted for the changes during the period in the current redemption value of vested Class A and B redeemable common shares. Restricted shares that are not yet vested and held for more than 180 days as of the reporting date are classified in liabilities at their redemption values taking into consideration the portion of the requisite service that has been provided as of the reporting date.
Employee and Director Share Purchases and Grants—During the year ended December 31, 2015, employees and directors purchased 25,053 Class B common shares at a price per share of $182.30. During the year ended December 31, 2014, employees and directors purchased 15,771 shares at a price per share of $160.35. During the year ended December 31, 2013, employees and directors purchased 25,579 shares at a price per share of $145.05. As of December 31, 2015, the Company was authorized to issue an additional 30,267 shares under the employee share purchase plan.
Restricted Shares—The Company grants to certain management restricted shares that vest generally over a three year period. Restricted shares must be paid out in shares and are accounted for as equity awards once vested and held for more than 180 days. Cash dividends are not paid on the nonvested restricted shares, nor do they accumulate during the vesting period. A summary of the restricted shares activity during 2015, was as follows:
| Restricted Shares | ||||||||
| Shares | Weighted Average Grant Date Fair Value Per Share |
|||||||
| Nonvested at January 1, 2015 |
30,500 | $ | 148.98 | |||||
| Granted |
13,581 | 182.30 | ||||||
| Vested |
(17,449 | ) | 144.36 | |||||
| Forfeited |
— | — | ||||||
|
|
|
|
|
|||||
| Nonvested at December 31, 2015 |
26,632 | $ | 168.99 | |||||
|
|
|
|
|
|||||
Compensation expense recognized within salaries, wages, and benefits in the statements of comprehensive income for restricted shares in 2015, 2014, and 2013 was $2,194, $2,401, and $2,502, respectively. As of December 31, 2015, the total unrecognized compensation cost related to nonvested restricted share grants awards was $2,630 and the weighted-average period over which it is expected to be recognized is 1.8 years.
F-21
Table of Contents
12. OTHER SHARE-BASED COMPENSATION
The Company offers the following compensation programs to employees that are based upon the performance of its Class B common shares or the Company’s economic performance. Programs must be settled in cash and do not result in the issuance of common shares. Awards under these programs are accounted for as liabilities within Other accrued liabilities and other noncurrent liabilities on the balance sheet, with compensation expense recorded within salaries, wages, and benefits in the consolidated statements of comprehensive income. Compensation expense recognized within salaries, wages, and benefits in the statements of comprehensive income for other share-based compensation programs in 2015, 2014, and 2013 was $14,406, $7,909, and $5,397, respectively.
Long-Term Cash Awards—The Company began to grant Long-Term Cash Awards (“LTCA”) in 2013. All payouts under the LTCA, if any, are made in cash after five years from the grant date. Compensation expense is recorded ratably generally over the cliff vesting performance period of 5 years based on the fair value of the awards at each reporting period. In general, in the event that a participant’s employment terminates prior to the conclusion of the performance period, the award under the LTCA is deemed forfeited and canceled. However, some awards under the LTCA pro rata vest in the event of a participant’s death, disability, retirement or change of control.
Payments under the LTCA are based on levels of compounded Net Income Growth and average Return on Capital, as defined in the long-term incentive plan agreement. No payments are made under the LTCA unless the Company achieves a minimum performance of 3% of compounded Net Income Growth and Return on Capital of 8.5%, 9.5%, and 10% in 2013-2017, 2014-2018 and 2015-2019 performance periods, respectively. Payments will equal 100% of the targeted payout if compounded Net Income Growth averages 8% and Return on Capital equals or exceeds 13.5%, 14.5%, and 15% in 2013-2017, 2014-2018 and 2015-2019 performance periods, respectively. Targeted payouts for the 2015, 2014 and 2013 grants are $5,776, $5,103 and $5,132, respectively. The actual amount earned may range from 0% to 250% of target based upon performance and 2015 (dollars in thousands).
Information related to the LTCA for the three years ended December 31, 2015, 2014 and 2013 is as follows:
| Amount | ||||
| LTCA liability at January 1, 2013 |
$ | — | ||
| Compensation expense |
1,026 | |||
| Forfeitures |
(36 | ) | ||
| Payments |
— | |||
|
|
|
|||
| LTCA liability at December 31, 2013 |
990 | |||
| Compensation expense |
5,696 | |||
| Forfeitures |
(17 | ) | ||
| Payments |
— | |||
|
|
|
|||
| LTCA liability at December 31, 2014 |
6,669 | |||
| Compensation expense |
5,734 | |||
| Forfeitures |
(33 | ) | ||
| Payments |
(414 | ) | ||
|
|
|
|||
| LTCA liability at December 31, 2015 |
$ | 11,956 | ||
Stock Appreciation Rights—The Company under the Long-Term Incentive Plan (“LTIP”) granted Stock Appreciation Rights (“SAR”) through 2012. SARs entitle the participants to the benefits of changes in fair value of the Class B common shares from the date of issuance to the date in which the award is redeemed. SARs cliff-vest three years after the grant date and ordinarily are redeemed five years after the grant date based on the fair value of the Class B common shares at that date. However, prior to the end of the fourth anniversary of the grant date, participants may elect to defer redemption until after the tenth year based on the fair value of the Class B common shares at that date. Subsequent to vesting, the Company continues to record the liabilities at fair value
F-22
Table of Contents
until redemption. Because no further service is required after the three-year vesting period, the Company records compensation expense based upon the fair value of the awards ratably over three years.
There were no redemptions that occurred during the years ended December 31, 2015, 2014, or 2013. SARs outstanding as of December 31, 2015 were 105,400 units, with a related liability recorded in the December 31, 2015 balance sheet of $6,269.
13. EARNINGS PER SHARE
The Company computes basic earnings per share by dividing net earnings available to common shareholders by the actual weighted average number of redeemable common shares outstanding for the reporting period. Diluted earnings per share reflects the potential dilution that could occur if holders of unvested restricted share units converted their holdings into redeemable common shares. Outstanding unvested restricted share units represent the dilutive effects on weighted average shares. A reconciliation of the number of shares used in computing basic and diluted earnings per share is shown below.
The calculation of basic and diluted earnings per share for the years ended December 31, 2015, 2014, and 2013 was as follows:
| Year ended December 31, | ||||||||||||
| (dollar amounts in thousands, except share and per share amounts) |
2015 | 2014 | 2013 | |||||||||
| Basic earnings per common share: |
||||||||||||
| Net income available to common shareholders |
$ | 140,932 | $ | 133,568 | $ | 95,474 | ||||||
|
|
|
|
|
|
|
|||||||
| Weighted average common shares issued and outstanding |
5,176,332 | 5,166,126 | 5,159,505 | |||||||||
| Basic earnings per common share |
$ | 27.23 | $ | 25.85 | $ | 18.50 | ||||||
| Diluted earnings per common share: |
||||||||||||
| Net income applicable to diluted earnings per share |
$ | 140,932 | $ | 133,568 | $ | 95,474 | ||||||
|
|
|
|
|
|
|
|||||||
| Dilutive potential common shares: |
||||||||||||
| Restricted share units |
9,216 | 11,545 | 18,050 | |||||||||
|
|
|
|
|
|
|
|||||||
| Dilutive potential common shares |
9,216 | 11,545 | 18,050 | |||||||||
|
|
|
|
|
|
|
|||||||
| Total diluted average common shares issued and outstanding |
5,185,548 | 5,177,671 | 5,177,555 | |||||||||
|
|
|
|
|
|
|
|||||||
| Diluted earnings per common share |
$ | 27.18 | $ | 25.80 | $ | 18.44 | ||||||
14. COMMITMENTS AND CONTINGENCIES
In the ordinary course of conducting its business, the Company becomes involved in certain legal matters and investigations on a number of matters, including liability claims, taxes other than income taxes, contract disputes, employment, and other litigation matters. The Company accrues for anticipated costs to defend and resolve matters that are probable and estimatable. The Company believes the outcomes of these matters will not have a material impact on the business or the consolidated financial statements of the Company.
At December 31, 2015, the Company had firm commitments coming due in 2016 to acquire approximately $188,907 of transportation equipment. Commitments related to operating leases are discussed in Note 8.
15. SEGMENT REPORTING
The Company has three reportable segments—Truckload, Intermodal, and Logistics—which are based primarily on the services each segment provides.
The Truckload reportable segment consists of three operating segments (Van Truckload, Specialty Dedicated, and Bulk) that are aggregated because they have similar economic characteristics and meet the other
F-23
Table of Contents
aggregation criteria described in the accounting guidance for segment reporting. The Van Truckload segment delivers truckload quantities over irregular routes using dry van trailers. The Specialty Dedicated segment is similar except that it involves recurring routes between the same locations for which specified trucks are dedicated to the route. The Bulk segment transports key inputs to the manufacturing process such as specialty chemicals.
The Intermodal reportable segment provides rail intermodal and drayage services to the Company’s customers. Company-owned containers and generally company-owned dray tractors are utilized to provide these transportation services.
The Logistics reportable segment consists of three operating segments (Brokerage, Supply Chain Management, and Import/Export Services) that are aggregated because they have similar economic characteristics and meet the other aggregation criteria described in the accounting guidance for segment reporting. In the Logistics segment, the Company provides additional sources of truck capacity and manage transportation-systems analysis requirements for individual customers and provide trans-loading and warehousing services.
The Company generates other revenues from a captive insurance business and from a leasing business which are operated by wholly-owned subsidiaries of the Company. The Company also has operations in Asia which meet the definition of an operating segment. None of these operations meets the quantitative reporting thresholds. As a result, these operations are grouped in “Other” in the tables below. The Company has also included in “Other”, revenues and expenses that are incidental to the Company’s activities and are not attributable to any of the operating segments. Separate balance sheets are not prepared by segment and, as a result, assets are not separately identifiable by segment. All transactions between reporting segments are eliminated in consolidation. The chief operating decision maker reviews revenue for each segment without the inclusion of fuel surcharge revenue.
The following tables summarize segment information:
| For the year ended December 31 | ||||||||||||
| 2015 | 2014 | 2013 | ||||||||||
| Operating Revenues: |
||||||||||||
| Truckload |
$ | 1,976,970 | $ | 1,861,867 | $ | 1,743,781 | ||||||
| Intermodal |
789,521 | 722,724 | 665,067 | |||||||||
| Logistics |
638,648 | 587,778 | 466,682 | |||||||||
| Other |
255,455 | 233,324 | 145,489 | |||||||||
| Fuel Surcharge |
371,152 | 606,858 | 620,394 | |||||||||
| Inter-segment eliminations |
(72,374 | ) | (71,975 | ) | (17,047 | ) | ||||||
|
|
|
|
|
|
|
|||||||
| Total |
$ | 3,959,372 | $ | 3,940,576 | $ | 3,624,366 | ||||||
|
|
|
|
|
|
|
|||||||
| Operating Earnings: |
||||||||||||
| Truckload |
$ | 217,363 | $ | 201,612 | $ | 137,418 | ||||||
| Intermodal |
58,117 | 40,862 | 39,393 | |||||||||
| Logistics |
25,455 | 18,127 | 13,554 | |||||||||
| Other |
(40,695 | ) | (21,250 | ) | (19,116 | ) | ||||||
|
|
|
|
|
|
|
|||||||
| Total Income from Operations |
260,240 | 239,351 | 171,249 | |||||||||
|
|
|
|
|
|
|
|||||||
| Depreciation and Amortization Expense: |
||||||||||||
| Truckload |
$ | 159,558 | $ | 159,225 | $ | 150,189 | ||||||
| Intermodal |
38,297 | 32,536 | 24,329 | |||||||||
| Logistics |
941 | 731 | 729 | |||||||||
| Other |
37,534 | 37,516 | 37,310 | |||||||||
|
|
|
|
|
|
|
|||||||
| Total |
$ | 236,330 | $ | 230,008 | $ | 212,557 | ||||||
|
|
|
|
|
|
|
|||||||
F-24
Table of Contents
Reconciliation of income from operations to income before income taxes is as follows:
| For the year ended December 31 | ||||||||||||
| 2015 | 2014 | 2013 | ||||||||||
| Income from operations |
$ | 260,240 | $ | 239,351 | $ | 171,249 | ||||||
| Interest expense, net |
(18,730 | ) | (11,732 | ) | (13,860 | ) | ||||||
| Other non-operating expenses |
(2,786 | ) | (1,756 | ) | (851 | ) | ||||||
|
|
|
|
|
|
|
|||||||
| Income before income taxes |
$ | 238,724 | $ | 225,863 | $ | 156,538 | ||||||
|
|
|
|
|
|
|
|||||||
Substantially all of the Company’s revenues and assets are located in the United States. No customer generated more than 10% of consolidated operating revenue for the years ended December 31, 2015, 2014 or 2013.
16. SUBSEQUENT EVENTS
Dividends
On October 25, 2016, the Company’s Board of Directors approved the 2016 dividend of $6.00 per share of Class A common shares and Class B common shares. The dividend totaling $31,265 was paid on December 15, 2016.
Share Amendments
Certain amendments have been executed in October 2016 related to the Company’s Class A and Class B common shares in contemplation of the Company’s planned initial offering of Class B shares to the public. The amendments are only effective upon completion of the initial offering. Certain amendments have been completed while other amendments are still in process and will be completed prior to the offering becoming effective. Amendments to date include the removal of provisions that grant the Schneider family members and their family trusts rights to put certain shares to Schneider for repurchase.
Business Acquisition
On June 1, 2016, the Company acquired 100% of the shares of Watkins and Shepard Trucking, Inc. (“WST”) for $150,752 in cash and future payments. WST brings together final-mile delivery, claims-free handling and an innovative technology platform. WST is a provider of LTL, truckload and logistics services for difficult to handle goods, such as furniture and floor coverings across North America. WST uses proprietary technology to handle supply chain complexities within the national home delivery industry. The Company acquired WST because management believes it creates integrated first-to-final-mile-delivery capabilities, which take the complexity out of the supply chain for omnichannel retailers and manufacturers.
The acquisition of WST was accounted for as a purchase in accordance with FASB Accounting Standards Codification Topic 805, Business Combinations. Assets acquired and liabilities assumed were recorded at their fair values as of the acquisition date. The fair values of identifiable intangible assets, which were primarily customer relationships, trade names, and technology, were based on valuations using the income approach. The excess of the purchase price over the estimated fair values of tangible assets, identifiable intangible assets and assumed liabilities was recorded as goodwill. The goodwill is attributable to expected synergies and expected growth opportunities. The Company estimates approximately 100% of goodwill will be deductible for United States income tax purposes. The allocation of purchase price is preliminary as the Company has not completed its analysis estimating certain contingent liabilities. Measurement period adjustments will be recorded in the reporting period in which they are identified.
F-25
Table of Contents
The preliminary purchase price allocation for WST was as follows:
| Consideration |
||||
| Cash |
$ | 79,539 | ||
| Guaranteed payments |
57,713 | |||
| Contingent payments |
13,500 | |||
|
|
|
|||
| Fair value of total consideration transferred |
$ | 150,752 | ||
|
|
|
|||
| Recognized amounts of identifiable assets acquired and liabilities assumed |
||||
| Cash |
$ | 1,318 | ||
| Receivables |
16,347 | |||
| Inventories |
480 | |||
| Prepaid expenses and other current assets |
4,392 | |||
| Property and equipment |
85,030 | |||
| Capitalized software and other noncurrent assets |
5,915 | |||
| Intangible assets |
10,900 | |||
| Goodwill |
135,015 | |||
|
|
|
|||
| Total assets acquired |
259,397 | |||
|
|
|
|||
| Payables assumed |
7,807 | |||
| Accrued liabilities assumed |
5,289 | |||
| Current maturities of debt and capital lease obligations assumed |
47,692 | |||
| Debt and capital lease obligations assumed |
46,211 | |||
| Other noncurrent liabilities assumed |
1,646 | |||
|
|
|
|||
| Net assets acquired |
$ | 150,752 | ||
|
|
|
|||
| Acquisition-related costs (included in other general expenses in the Company’s consolidated statements of comprehensive income for the period ended September 30, 2016) |
$ | 1,069 | ||
|
|
|
In addition to the cash paid at closing, the guaranteed payment arrangement requires the Company to pay the former owners of WST $20,000 on each of the next three anniversary dates of the closing. This amount is discounted between one percent and three percent, based on the credit-adjusted discount rates for a present value amount of $57,713. The contingent payment arrangement requires the Company to make earnout payments of up to $13,333 at each of the 12 month, 24 month, and 36 month anniversaries of the closing date with the aggregate payment total not to exceed $39,999. Payments are based on a minimum of 80% achievement of annual EBITDA targets. The fair value of the contingent payment arrangement of $13,500 was estimated based on significant inputs that are not observable in the market, which are referred to as Level 3 inputs. Key assumptions include a probability-adjusted level of EBITDA estimated using the Monte Carlo method.
The valuation of the net assets acquired, excluding acquired cash, was classified as Level 3 in the valuation hierarchy (see Note 4 of the Notes to the consolidated financial statements for the definition of Level 3 inputs). The Company valued property and equipment using both a market approach and a cost approach depending on the asset. Intangible assets were valued using the present value of projected future cash flows and significant assumptions included discount rates, customer attrition and obsolescence factors.
The components of Intangible assets included as part of the WST acquisition were as follows:
| Amortization Period (Years) |
Gross Value |
|||||||
| Customer List |
10 | $ | 9,500 | |||||
| Trade Name |
3 | 1,400 | ||||||
|
|
|
|||||||
| Intangible assets |
$ | 10,900 | ||||||
|
|
|
|||||||
F-26
Table of Contents
The following unaudited pro forma condensed combined financial information presents the Company’s results as if the Company had acquired WST on January 1, 2014. The unaudited pro forma information has been prepared with the following considerations:
| • | The acquisition method of accounting under existing GAAP was used. The Company is the acquirer for accounting purposes. |
| • | The financial information does not reflect any operating cost synergy savings that the combined companies may achieve as a result of the acquisition, the costs necessary to achieve these operating synergy savings or additional charges necessary as a result of the integration. |
| December 2015 | December 2014 | |||||||
| Pro forma net sales |
$ | 4,137,010 | $ | 4,114,031 | ||||
| Pro forma net income |
$ | 144,756 | $ | 134,876 | ||||
| Basic earnings per share as reported |
$ | 27.23 | $ | 25.85 | ||||
| Pro forma basic earnings per share |
$ | 27.96 | $ | 26.11 | ||||
| Diluted earnings per share as reported |
$ | 27.18 | $ | 25.80 | ||||
| Pro forma diluted earnings per share |
$ | 27.92 | $ | 26.05 | ||||
******
F-27
Table of Contents
[Page intentionally left blank]
F-28
Table of Contents
SCHNEIDER NATIONAL, INC., AND SUBSIDIARIES
CONDENSED CONSOLIDATED BALANCE SHEETS (UNAUDITED)
AS OF SEPTEMBER 30, 2016 AND DECEMBER 31, 2015
(in thousands, except share and per share information)
| September 30, 2016 |
December 31, 2015 |
|||||||
| ASSETS |
||||||||
| CURRENT ASSETS: |
||||||||
| Cash and cash equivalents |
$ | 84,954 | $ | 160,676 | ||||
| Marketable securities |
43,297 | 50,318 | ||||||
| Receivables: |
||||||||
| Trade—net of allowance |
439,545 | 400,399 | ||||||
| Managed freight |
6,342 | 6,881 | ||||||
| Other |
41,895 | 64,645 | ||||||
| Current portion of lease receivables—net of allowance |
104,722 | 118,183 | ||||||
| Inventories |
86,564 | 68,466 | ||||||
| Prepaid expenses and other assets |
74,578 | 43,430 | ||||||
|
|
|
|
|
|||||
| Total current assets |
881,897 | 912,998 | ||||||
|
|
|
|
|
|||||
| PROPERTY AND EQUIPMENT: |
||||||||
| Transportation equipment—net |
1,679,354 | 1,409,445 | ||||||
| Land, buildings, and improvements—net |
70,397 | 64,578 | ||||||
| Other—net |
35,377 | 29,934 | ||||||
|
|
|
|
|
|||||
| Net property and equipment |
1,785,128 | 1,503,957 | ||||||
| LEASE RECEIVABLES |
114,562 | 106,344 | ||||||
| CAPITALIZED SOFTWARE AND OTHER NONCURRENT ASSETS |
80,256 | 71,932 | ||||||
| GOODWILL |
161,378 | 26,706 | ||||||
|
|
|
|
|
|||||
| TOTAL |
$ | 3,023,221 | $ | 2,621,937 | ||||
|
|
|
|
|
|||||
See notes to condensed consolidated financial statements (unaudited).
F-29
Table of Contents
SCHNEIDER NATIONAL, INC., AND SUBSIDIARIES
CONDENSED CONSOLIDATED BALANCE SHEETS (UNAUDITED)
AS OF SEPTEMBER 30, 2016 AND DECEMBER 31, 2015
(in thousands, except share and per share information)
| September 30, 2016 |
December 31, 2015 |
Pro Forma Shareholders’ Equity as of September 30, 2016 (Note 2) |
||||||||||
| LIABILITIES, REDEEMABLE COMMON SHARES, ACCUMULATED EARNINGS, ACCUMULATED OTHER COMPREHENSIVE INCOME AND SHAREHOLDERS’ EQUITY |
||||||||||||
| CURRENT LIABILITIES: |
||||||||||||
| Payables: |
||||||||||||
| Trade |
$ | 245,288 | $ | 203,319 | $ | |||||||
| Managed freight |
6,461 | 6,990 | ||||||||||
| Accrued liabilities: |
||||||||||||
| Salaries and wages |
76,809 | 82,829 | ||||||||||
| Claims accruals |
61,581 | 49,198 | ||||||||||
| Other |
55,418 | 57,812 | ||||||||||
| Current maturities of debt and capital lease obligations |
127,474 | 5,966 | ||||||||||
|
|
|
|
|
|||||||||
| Total current liabilities |
573,031 | 406,114 | ||||||||||
|
|
|
|
|
|||||||||
| NONCURRENT LIABILITIES: |
||||||||||||
| Debt |
547,907 | 528,640 | ||||||||||
| Capital lease obligations |
12,239 | 10,966 | ||||||||||
| Claims accruals |
110,314 | 113,561 | ||||||||||
| Deferred income taxes |
512,685 | 464,314 | ||||||||||
| Other |
97,459 | 42,819 | ||||||||||
|
|
|
|
|
|||||||||
| Total noncurrent liabilities |
1,280,604 | 1,160,300 | ||||||||||
|
|
|
|
|
|||||||||
| COMMITMENTS AND CONTINGENCIES (Note 15) |
||||||||||||
| TEMPORARY EQUITY—REDEEMABLE COMMON SHARES: |
||||||||||||
| Redeemable common shares, Class A, $0.005 par value; shares authorized: 10,000,000; shares issued and outstanding: 2,767,650 |
563,217 | 504,543 | — | |||||||||
|
|
|
|
|
|||||||||
| Redeemable common shares, Class B, $0.005 par value; shares authorized: 30,000,000, shares issued and outstanding: 2,439,698 and 2,419,192, respectively |
496,478 | 441,018 | — | |||||||||
|
|
|
|
|
|||||||||
| ACCUMULATED EARNINGS |
108,733 | 109,550 | — | |||||||||
|
|
|
|
|
|||||||||
| ACCUMULATED OTHER COMPREHENSIVE INCOME |
1,158 | 412 | — | |||||||||
|
|
|
|
|
|||||||||
| SHAREHOLDERS’ EQUITY: |
||||||||||||
| Common shares, Class A, no par value; No shares issued and outstanding as of September 30, 2016 and December 31, 2015, actual; 2,767,650 shares issued and outstanding, proforma (Note 2) |
— | |||||||||||
| Common shares, Class B, no par value; No shares issued and outstanding as of September 30, 2016 and December 31, 2015, actual; 2,439,698 and 2,419,192 shares issued and outstanding, respectively, proforma (Note 2) |
— | |||||||||||
| Additional paid-in capital |
1,059,695 | |||||||||||
| Retained Earnings |
108,733 | |||||||||||
| Accumulated other comprehensive income |
1,158 | |||||||||||
|
|
|
|||||||||||
| Total shareholders’ equity |
$ | 1,169,586 | ||||||||||
|
|
|
|||||||||||
| TOTAL |
$ | 3,023,221 | $ | 2,621,937 | ||||||||
|
|
|
|
|
|||||||||
F-30
Table of Contents
SCHNEIDER NATIONAL, INC., AND SUBSIDIARIES
CONDENSED CONSOLIDATED STATEMENTS OF COMPREHENSIVE INCOME (UNAUDITED)
FOR THE NINE MONTHS ENDED SEPTEMBER 30, 2016 AND 2015
(in thousands, except share and per share information)
| 2016 | 2015 | |||||||
| OPERATING REVENUES |
$ | 2,975,844 | $ | 2,932,875 | ||||
|
|
|
|
|
|||||
| OPERATING EXPENSES: |
||||||||
| Purchased transportation |
1,077,635 | 1,055,865 | ||||||
| Salaries, wages, and benefits |
848,208 | 805,217 | ||||||
| Fuel and fuel taxes |
184,376 | 226,472 | ||||||
| Depreciation and amortization |
197,704 | 174,339 | ||||||
| Operating supplies and expenses |
333,049 | 340,193 | ||||||
| Insurance and related expenses |
57,050 | 55,552 | ||||||
| Other general expenses |
75,353 | 100,897 | ||||||
|
|
|
|
|
|||||
| Total operating expenses |
2,773,375 | 2,758,535 | ||||||
|
|
|
|
|
|||||
| INCOME FROM OPERATIONS |
202,469 | 174,340 | ||||||
|
|
|
|
|
|||||
| NONOPERATING EXPENSES: |
||||||||
| Interest expense—net |
15,708 | 13,968 | ||||||
| Other—net |
1,771 | 2,196 | ||||||
|
|
|
|
|
|||||
| Total nonoperating expenses |
17,479 | 16,164 | ||||||
|
|
|
|
|
|||||
| INCOME BEFORE INCOME TAXES |
184,990 | 158,176 | ||||||
| PROVISION FOR INCOME TAXES |
75,846 | 64,852 | ||||||
|
|
|
|
|
|||||
| NET INCOME |
109,144 | 93,324 | ||||||
|
|
|
|
|
|||||
| OTHER COMPREHENSIVE INCOME (LOSS): |
||||||||
| Foreign currency translation adjustments |
381 | (320 | ) | |||||
| Unrealized gain on marketable securities—net of tax |
365 | 198 | ||||||
|
|
|
|
|
|||||
| Total other comprehensive income (loss) |
746 | (122 | ) | |||||
|
|
|
|
|
|||||
| COMPREHENSIVE INCOME |
$ | 109,890 | $ | 93,202 | ||||
|
|
|
|
|
|||||
| Weighted average common shares outstanding |
5,203,633 | 5,174,476 | ||||||
| Basic earnings per share |
$ | 20.97 | $ | 18.04 | ||||
| Weighted average diluted shares outstanding |
5,209,735 | 5,180,902 | ||||||
| Diluted earnings per share |
$ | 20.95 | $ | 18.01 | ||||
See notes to condensed consolidated financial statements (unaudited).
F-31
Table of Contents
SCHNEIDER NATIONAL, INC., AND SUBSIDIARIES
CONDENSED CONSOLIDATED STATEMENTS OF REDEEMABLE COMMON SHARES,
ACCUMULATED EARNINGS
AND ACCUMULATED OTHER COMPREHENSIVE INCOME (Unaudited)
FOR THE PERIOD ENDED SEPTEMBER 30, 2016 AND YEAR ENDED DECEMBER 31, 2015
(in thousands, except share and per share information)
| Class A Redeemable Common Shares |
Class B Redeemable Common Shares |
Accumulated Earnings |
Accumulated Other Comprehensive Income |
|||||||||||||||||||||
| Shares | Amount | Shares | Amount | |||||||||||||||||||||
| BALANCE—December 31, 2014 |
2,767,650 | $ | 443,793 | 2,389,209 | $ | 383,109 | $ | 106,969 | $ | 810 | ||||||||||||||
| Net income |
— | — | — | — | 140,932 | — | ||||||||||||||||||
| Other comprehensive loss |
— | — | — | — | — | (398 | ) | |||||||||||||||||
| Dividends declared at $4.85 per share |
— | — | — | — | (25,158 | ) | — | |||||||||||||||||
| Issuance of redeemable shares |
— | — | 41,772 | 7,615 | — | |||||||||||||||||||
| Redemption of redeemable common shares |
— | — | (11,789 | ) | (2,149 | ) | — | |||||||||||||||||
| Change in redemption value of redeemable common shares |
— | 60,750 | — | 52,443 | (113,193 | ) | — | |||||||||||||||||
|
|
|
|
|
|
|
|
|
|
|
|
|
|||||||||||||
| BALANCE—December 31, 2015 |
2,767,650 | $ | 504,543 | 2,419,192 | $ | 441,018 | $ | 109,550 | $ | 412 | ||||||||||||||
| Net income |
— | — | — | — | 109,144 | — | ||||||||||||||||||
| Other comprehensive income |
— | — | — | — | — | 746 | ||||||||||||||||||
| Issuance of redeemable shares |
— | — | 27,533 | 5,603 | — | — | ||||||||||||||||||
| Redemption of redeemable common shares |
— | — | (7,027 | ) | (1,430 | ) | — | — | ||||||||||||||||
| Change in redemption value of redeemable common shares |
— | 58,674 | — | 51,287 | (109,961 | ) | — | |||||||||||||||||
|
|
|
|
|
|
|
|
|
|
|
|
|
|||||||||||||
| BALANCE—September 30, 2016 |
2,767,650 | $ | 563,217 | 2,439,698 | $ | 496,478 | $ | 108,733 | $ | 1,158 | ||||||||||||||
|
|
|
|
|
|
|
|
|
|
|
|
|
|||||||||||||
See notes to condensed consolidated financial statements (unaudited).
F-32
Table of Contents
SCHNEIDER NATIONAL, INC., AND SUBSIDIARIES
CONDENSED CONSOLIDATED STATEMENTS OF CASH FLOWS (Unaudited)
FOR THE NINE MONTHS ENDED SEPTEMBER 30, 2016 AND 2015
(in thousands)
| 2016 | 2015 | |||||||
| OPERATING ACTIVITIES: |
||||||||
| Net income |
$ | 109,144 | $ | 93,324 | ||||
| Adjustments to reconcile net income to net cash provided by operating activities: |
||||||||
| Depreciation and amortization |
197,704 | 174,339 | ||||||
| Gain on sale of property and equipment |
(15,388 | ) | (23,214 | ) | ||||
| Impairment on assets held for sale |
285 | 129 | ||||||
| Loss on sale of investments |
56 | 135 | ||||||
| Deferred income taxes |
49,316 | (4,449 | ) | |||||
| Other noncash items |
(1,044 | ) | (408 | ) | ||||
| Changes in operating assets and liabilities: |
||||||||
| Receivables |
(30 | ) | 22,149 | |||||
| Other assets |
(7,684 | ) | (6,918 | ) | ||||
| Payables |
6,319 | 29,662 | ||||||
| Other liabilities |
(21,182 | ) | 67,379 | |||||
|
|
|
|
|
|||||
| Net cash provided by operating activities |
317,496 | 352,128 | ||||||
|
|
|
|
|
|||||
| INVESTING ACTIVITIES: |
||||||||
| Purchases of transportation equipment |
(359,680 | ) | (332,729 | ) | ||||
| Purchases of other property and equipment |
(29,508 | ) | (29,599 | ) | ||||
| Proceeds from sale of property and equipment |
39,624 | 51,275 | ||||||
| Proceeds from lease receipts and sale of off lease inventory |
47,387 | 42,667 | ||||||
| Purchase of lease equipment |
(68,728 | ) | (105,599 | ) | ||||
| Sales of marketable securities |
11,098 | 13,166 | ||||||
| Purchases of marketable securities |
(4,002 | ) | (14,223 | ) | ||||
| Acquisition of businesses, net of cash acquired |
(78,221 | ) | — | |||||
|
|
|
|
|
|||||
| Net cash used in investing activities |
(442,030 | ) | (375,042 | ) | ||||
|
|
|
|
|
|||||
| FINANCING ACTIVITIES: |
||||||||
| Payments under revolving credit agreements |
(89,948 | ) | (174,900 | ) | ||||
| Proceeds under revolving credit agreements |
174,948 | 1,000 | ||||||
| Proceeds from other debt |
593 | 180,000 | ||||||
| Payments of debt and capital lease obligations |
(37,649 | ) | (2,632 | ) | ||||
| Redemptions of redeemable common shares |
(1,430 | ) | (2,149 | ) | ||||
| Proceeds from issuances of redeemable common shares |
2,298 | 3,261 | ||||||
|
|
|
|
|
|||||
| Net cash provided by financing activities |
48,812 | 4,580 | ||||||
|
|
|
|
|
|||||
| NET DECREASE IN CASH AND CASH EQUIVALENTS |
(75,722 | ) | (18,334 | ) | ||||
| CASH AND CASH EQUIVALENTS: |
||||||||
| Beginning of period |
160,676 | 149,885 | ||||||
|
|
|
|
|
|||||
| End of period |
$ | 84,954 | $ | 131,551 | ||||
|
|
|
|
|
|||||
| OTHER DISCLOSURES: |
||||||||
| Noncash investing and financing activity: |
||||||||
| Equipment purchases in accounts payable |
$ | 40,007 | $ | 61,282 | ||||
|
|
|
|
|
|||||
| Change in redemption value of redeemable common shares |
109,961 | 113,193 | ||||||
| Cash paid during the year for: |
||||||||
| Interest |
$ | 14,742 | $ | 11,867 | ||||
|
|
|
|
|
|||||
| Income taxes—net of refunds |
$ | 4,093 | $ | 27,953 | ||||
|
|
|
|
|
|||||
See notes to condensed consolidated financial statements (unaudited).
F-33
Table of Contents
SCHNEIDER NATIONAL, INC., AND SUBSIDIARIES
NOTES TO CONDENSED CONSOLIDATED FINANCIAL STATEMENTS (UNAUDITED)
(in thousands, except share and per share information)
1. DESCRIPTION OF BUSINESS
Schneider National, Inc., and subsidiaries (the “Company”) is a Wisconsin corporation headquartered in Green Bay, Wisconsin. The Company is a leading transportation services organization providing a broad portfolio of premier truckload, intermodal and logistics solutions and operating one of the largest trucking fleets in North America. As described in Note 5, on June 1, 2016, the Company acquired 100% of the shares of Watkins and Shepard Trucking, Inc. (“WST”). WST brings together final-mile delivery, claims-free handling and an innovative technology platform. The acquisition positions the Company in the fast growing transportation segment which delivers difficult to handle goods, such as furniture and floor coverings across North America using less-than-truckload (“LTL”), truckload and logistics services.
2. SUMMARY OF SIGNIFICANT ACCOUNTING POLICIES
Basis of Consolidation—The condensed consolidated financial statements include the accounts of the Company and all subsidiaries. All significant intercompany transactions and balances have been eliminated in consolidation.
The unaudited financial statements included herein have been prepared pursuant to the rules and regulations of the Securities and Exchange Commission (“SEC”). Accordingly, certain information and note disclosures normally included in financial statements prepared in accordance with GAAP have been condensed or omitted, although management believes that the disclosures are adequate to make the information presented not misleading. These condensed financial statements should be read in conjunction with the December 31, 2015 financial statements and the notes thereto.
In the opinion of management, all adjustments, which unless otherwise noted are normal and recurring in nature, necessary for a fair presentation of the results of operations, financial position and cash flows have been made. Results for the nine months ended September 30, 2016 are not necessarily indicative of results that may be expected for the year ending December 31, 2016. A change in management’s estimates or assumptions could have a material impact on financial condition and results of operations during the period in which such change occurred.
Unaudited Pro Forma Shareholders’ Equity—The September 30, 2016 unaudited pro forma shareholders’ equity has been prepared to reflect the reclassification of Redeemable Class A and Class B common shares to permanent equity as a result of amendments to the Class A and Class B shareholder agreements to remove all redemption features, effective upon the completion of the Company’s initial public offering. The unaudited pro forma shareholders’ equity does not assume any proceeds from the proposed initial public offering.
Subsequent Events—The Company evaluated subsequent events after the condensed consolidated balance sheet date through December 22, 2016.
Acquisitions—The Company recognizes assets acquired, liabilities assumed, contractual contingencies and guaranteed payments at their fair value on the acquisition date. The operating results of the acquired companies are included in the Company’s condensed consolidated financial statements from the date of acquisition.
Revenue Recognition—Transportation-related operating revenues and the related direct costs are recorded upon delivery of the freight.
F-34
Table of Contents
The Company also manages freight transactions for certain customers. The Company records revenue based on the net services provided, meaning that the components of revenue and expense associated with these transactions are not presented on a gross basis in the Company’s condensed consolidated statements of comprehensive income, but rather on a net basis and classified within revenue. The amounts due from customers associated with managed freight costs and the related amounts due to managed freight carriers are classified within managed freight receivables and managed freight payables in the condensed consolidated balance sheets.
No customers generated more than 10% of the Company’s consolidated operating revenue for the periods presented.
Cash and Cash Equivalents—Cash and cash equivalents include short-term liquid investments that have original maturities of three months or less.
Marketable Securities—Marketable securities represent investments in tax-exempt municipal bonds, corporate bonds, US Treasury notes, federal agency notes and bonds, commercial paper, and certificates of deposit with original maturities of greater than 90 days from the date of acquisition. Marketable securities are classified as available for sale and carried at fair value, with any unrealized gains and losses, net of tax, included as a component of accumulated other comprehensive income. The cost of securities sold is based on the specific identification method; realized gains and losses resulting from such sales are included in interest expense—net in the condensed consolidated statements of comprehensive income.
Marketable securities are periodically reviewed for indications of other than temporary impairment considering factors such as the extent and duration to which a security’s fair value has been less than its cost, overall economic and market conditions, and the financial conditions and specific prospects for the issuer. Impairment of marketable securities due to credit risk results in a recognized loss in the condensed consolidated statements of comprehensive income when a market decline below cost is deemed other than temporary.
Receivables and Allowances for Doubtful Accounts—All trade and lease receivables are reported in the condensed consolidated balance sheets at their outstanding balance adjusted for any charge-offs and net of allowances for doubtful accounts.
The Company maintains allowances for doubtful accounts to absorb probable losses inherent in its portfolio of receivables. The allowances for doubtful accounts represent management’s estimates and takes into consideration numerous quantitative and qualitative factors, by receivable type, including historical loss experience, portfolio duration, collection experience, delinquency trends, economic conditions, and credit risk quality. In estimating losses inherent in each of its receivable portfolios, the Company uses historical loss experience rates by portfolio and applies them to a related aging analysis.
Management performs detailed reviews of its receivables on a monthly basis to assess the adequacy of the allowances based on historical and current trends and other factors affecting credit losses and to determine if any impairment has occurred. A receivable is impaired when it is probable that amounts related to the receivable will not be collected according to contractual terms. In circumstances where the Company is aware of a specific customer’s inability to meet its financial obligations, a specific reserve is recorded against amounts due to reduce the net receivable to the amount reasonably expected to be collected. Additions to the allowances for doubtful accounts are maintained through adjustments to bad debt expense, which is included in other general expenses in the condensed consolidated statements of comprehensive income; amounts determined to be uncollectible are charged directly against the allowances.
F-35
Table of Contents
Inventories—Inventories consist of tractors and trailing equipment held for sale or lease to independent contractors and supplies. These inventories are stated at the lower of cost or market using specific identification or average cost as of September 30, 2016 and December 31, 2015, and were as follows:
| September 2016 |
December 2015 |
|||||||
| Tractors and trailing equipment for sale or lease |
$ | 74,083 | $ | 53,557 | ||||
| Replacement parts |
11,535 | 12,547 | ||||||
| Tires, rims, and other |
946 | 2,362 | ||||||
|
|
|
|
|
|||||
| Total |
$ | 86,564 | $ | 68,466 | ||||
|
|
|
|
|
|||||
Property and Equipment—Property and equipment are recorded at cost. Equipment acquired under capitalized leases is included as a component of transportation equipment in the condensed consolidated balance sheets. Depreciation and amortization are computed using the straight-line method based on estimated useful lives and residual values. Generally, the estimated useful lives are as follows:
| Tractors |
5–10 years | |||
| Trailing equipment |
6–20 years | |||
| Other transportation equipment |
2–20 years | |||
| Buildings and improvements |
5–25 years | |||
| Other property |
3–10 years |
The Company had $1,192,237 and $1,166,239 of accumulated depreciation as of September 30, 2016 and December 31, 2015, respectively. Depreciation expense for the nine months ended September 30, 2016 and 2015 was $176,254 and $152,453, respectively.
Expenditures for maintenance and repairs are expensed as incurred. Tires related to new equipment are included in the capitalized equipment cost and depreciated using the same methods as equipment. Replacement tires are expensed when placed in service.
Assets held for sale are evaluated for impairment when they are placed in held for sale status and in subsequent periods. The assets are measured at the lower of carrying amount or fair value less cost to sell. Assets held for sale are included in prepaid expenses and other assets on the condensed consolidated balance sheets. As of September 30, 2016 and December 31, 2015, assets held for sale by segment were as follows:
| Segment |
September 2016 | December 2015 | ||||||
| Truckload |
$ | 29,263 | $ | 16,319 | ||||
| Intermodal |
3,061 | 1,061 | ||||||
|
|
|
|
|
|||||
| Total |
$ | 32,324 | $ | 17,380 | ||||
|
|
|
|
|
|||||
Gains and losses on the sale or other disposition of equipment are recognized at the time of disposition and are based on the difference between the proceeds received and the net book value of the assets disposed. Gains from the sale of held for sale assets were $8,107 and $13,800 for the nine months ended September 30, 2016 and 2015, respectively and are classified in operating supplies and expenses on the consolidated statements of comprehensive income
Software Development—The Company’s policy is to capitalize certain costs related to software developed and implemented for internal use and to amortize such costs over a period of five years on a straight-line basis. The Company had $60,337 and $67,728 of capitalized software development costs, net of accumulated amortization, as of September 30, 2016 and December 31, 2015, respectively. Amortization expense totaled $20,891 and $21,498 for the nine months ended September 30, 2016 and 2015, respectively.
F-36
Table of Contents
Impairment of Long-Lived Assets—The Company reviews long-lived assets for impairment whenever events or changes in circumstances indicate that the carrying amount of these assets may not be recoverable. The Company evaluates these assets for impairment based on estimated undiscounted future cash flows from these assets. Impairment is measured as the amount by which the carrying amount exceeds fair value and is classified in operating supplies and expense on the condensed consolidated statements of comprehensive income. Such analyses necessarily involve significant estimates. Impairment of long-lived assets totaled $285 and $129 for the nine months ended September 30, 2016 and 2015, respectively, using level 3 inputs as defined in Note 3.
Goodwill and Other Intangibles—The Company performs an annual goodwill impairment test at the reporting unit level as of December 31 each year or when an event occurs which might cause or indicate impairment. The impairment test is a two-step process. Step 1 includes the estimation of the fair value of each reporting unit. The fair value of the Company’s reporting units is estimated using the present value of expected future cash flows. If the carrying amount of the reporting unit exceeds its estimated fair value, the second step of the impairment test is required. Step 2 requires that the implied fair value of the reporting unit goodwill be compared to the carrying amount of that goodwill. If the carrying amount of the reporting unit goodwill exceeds the implied fair value of that goodwill, an impairment loss shall be recognized in an amount equal to that excess.
After performing Step 2 in 2015, it was determined that the implied value of goodwill recorded in the Asia reporting unit, a business under the Other Segment, was less than the carrying value, resulting in an impairment charge of $6,000 in the fourth quarter of the year ended December 31, 2015. The facts and circumstances that led to an impairment of goodwill included consecutive years of less than expected performance and the declining Chinese economy. Step 1 indicated no impairment for the Import/Export reporting unit, a business under the Logistics segment. Changes to goodwill, by reportable segment, and other intangibles during the periods indicated are as follows:
| Truckload | Other | Logistics | Total Goodwill |
Other Intangibles |
||||||||||||||||
| Balance—December 31, 2014 |
$ | — | $ | 19,549 | $ | 14,173 | $ | 33,722 | $ | 667 | ||||||||||
| Currency translation |
— | (1,016 | ) | — | (1,016 | ) | (15 | ) | ||||||||||||
| Impairment |
— | (6,000 | ) | — | (6,000 | ) | ||||||||||||||
| Amortization |
— | — | — | — | (418 | ) | ||||||||||||||
|
|
|
|
|
|
|
|
|
|
|
|||||||||||
| Balance—December 31, 2015 |
— | 12,533 | 14,173 | 26,706 | 234 | |||||||||||||||
| Acquisitions |
135,015 | — | — | 135,015 | 10,900 | |||||||||||||||
| Currency translation |
— | (343 | ) | — | (343 | ) | (5 | ) | ||||||||||||
| Amortization |
— | — | — | — | (559 | ) | ||||||||||||||
|
|
|
|
|
|
|
|
|
|
|
|||||||||||
| Balance—September 30, 2016 |
$ | 135,015 | $ | 12,190 | $ | 14,173 | $ | 161,378 | $ | 10,570 | ||||||||||
|
|
|
|
|
|
|
|
|
|
|
|||||||||||
Identifiable intangible assets, other than goodwill, include customer relationships and trade names and are included as a component of other noncurrent assets in the condensed consolidated balance sheets. Such assets are being amortized over a 10-year period from the date of acquisition. The Company had $10,570, net of accumulated amortization, of customer relationship and trade name intangibles as of September 30, 2016 and $234 as of December 31, 2015, respectively.
Debt Issuance Costs—The Company incurred and capitalized certain costs and fees in connection with various financing transactions. These costs are being amortized within interest expense—net in the condensed consolidated statements of comprehensive income over the terms of the related financing agreements. Capitalized debt issuance costs are reported as a direct deduction from the carrying amount of the associated debt on the condensed consolidated balance sheets.
Accounts Payable—Included in payables—trade are amounts payable to banks as a result of checks in transit of $38,092 and $66,973 as of September 30, 2016 and December 31, 2015, respectively.
F-37
Table of Contents
Claims Accruals—The primary claims arising for the Company consist of cargo liability, auto liability, and workers’ compensation losses. Accruals are based on estimated or expected losses for claims. Estimates are determined by evaluating the nature and severity of individual claims and by estimating future claims development based upon historical claim development trends, advice from third-party administrators and legal counsel. The actual cost to settle claim liabilities may differ from reserve estimates due to legal costs, claims that have not been reported, and various other uncertainties, including the inherent difficulty in estimating the severity of the claims and the potential judgement or settlement amount to dispose of the claim. The obligations for claims that are not expected to be paid within one year are classified as noncurrent liabilities in the condensed consolidated balance sheets.
Foreign Currency Translation—The net assets of the Company’s non-US operations in Mexico and China are translated at current exchange rates and income and expense items are translated at their average exchange rate for the year. The resulting translation adjustments are recorded as a separate component of accumulated other comprehensive income. The functional currency for the non-US operations is the respective local currency.
Income Taxes—Income taxes are accounted for using an asset and liability approach that requires the recognition of deferred tax assets and liabilities for the expected future tax consequences of events that have been recognized in the Company’s condensed consolidated financial statements or tax returns. In estimating future tax consequences, all expected future events other than proposed changes in the tax law or rates are considered. Valuation allowances are provided if it is more likely than not that a deferred tax asset will not be realized. The Company records a liability for unrecognized tax benefits when it is more likely than not that the benefits of tax positions taken on a tax return will not be sustained upon audit. Potential interest and penalties related to uncertain tax positions are recorded in income tax expense.
Accumulated Other Comprehensive Income—Accumulated other comprehensive income (loss) refers to unrealized gains and losses that are not currently included in net income. At September 30, 2016 and December 31, 2015, the components of accumulated other comprehensive income were as follows:
| September 2016 |
December 2015 |
|||||||
| Foreign currency translation adjustments |
$ | 788 | $ | 407 | ||||
| Unrealized gain on marketable securities—net of taxes of $240 and $3 for 2016 and 2015, respectively. |
370 | 5 | ||||||
|
|
|
|
|
|||||
| Total |
$ | 1,158 | $ | 412 | ||||
|
|
|
|
|
|||||
Amounts reclassified from accumulated other comprehensive income represented realized losses of $56 and $135 for the periods ended September 30, 2016 and 2015, respectively, which are included as a component of interest expense—net in the condensed consolidated statements of comprehensive income.
Use of Estimates—The preparation of condensed consolidated financial statements in conformity with accounting principles generally accepted in the United States of America (GAAP) requires management to make estimates and assumptions that affect the reported amounts of assets and liabilities, disclosure of contingent assets and liabilities, and the reported amounts of revenues and expenses. Actual results could differ from those estimates.
3. ACCOUNTING PRONOUNCEMENTS
Accounting Standards Issued But Not Yet Adopted—In May 2014, the Financial Accounting Standards Board (“FASB”) and International Accounting Standards Board (“IASB”) issued their final standard on revenue from contracts with customers. The standard, issued as ASU No. 2014-09, Revenue from Contracts with Customers by the FASB and as International Financial Reporting Standard 15, Revenue from Contracts with
F-38
Table of Contents
Customers, by the IASB, outlines a single comprehensive model for entities to use in accounting for revenue arising from contracts with customers and supersedes most current revenue recognition guidance, including industry-specific guidance. As amended, the new revenue recognition standard will be effective for the Company’s 2018 interim and annual periods. The standard permits the use of either the retrospective or cumulative effect transition method. The Company is currently evaluating the alternative transition methods and the potential effects of the adoption of this update on the financial statements.
In February 2016, the FASB issued ASU No. 2016-02, Leases (Topic 842), which requires lessees to recognize in the consolidated balance sheets assets and liabilities for leases with lease terms of more than 12 months. Consistent with current accounting principles, the recognition, measurement, and presentation of expenses and cash flows arising from a lease by a lessee primarily will depend on its classification as a finance or operating lease. However, unlike current accounting principles, which require only capital leases to be recognized in the consolidated balance sheets, the new ASU will require both types of leases to be recognized in the consolidated balance sheets. In transition, lessees and lessors are required to recognize and measure leases at the beginning of the earliest period presented using a modified retrospective approach. The modified retrospective approach includes a number of optional practical expedients that companies may elect to apply. These practical expedients relate to the identification and classification of leases that commenced before the effective date, initial direct costs for leases that commenced before the effective date, and the ability to use hindsight in evaluating lessee options to extend or terminate a lease or to purchase the underlying asset. The transition guidance also provides specific guidance for sale and leaseback transactions, build-to-suit leases, leveraged leases, and amounts previously recognized in accordance with the business combinations guidance for leases. The new standard is effective for public companies for annual periods beginning after December 15, 2018, and interim periods within those years, with early adoption permitted. The Company is currently evaluating the impact that the adoption of this pronouncement will have on its condensed consolidated financial statements.
In January 2016, the FASB issued ASU 2016-01, Financial Instruments–Overall (Subtopic 825-10). This update was issued to enhance the reporting model for financial instruments regarding certain aspects of recognition, measurement, presentation, and disclosure. The update (i) requires equity investments (except those accounted for under the equity method or that are consolidated) to be measured at fair value with changes in fair value recognized in net income; (ii) simplifies the impairment assessment of equity investments without readily determinable fair values by requiring a qualitative assessment to identify impairment; (iii) eliminates the requirement for an entity to disclose the methods and significant assumptions used to estimate the fair value of financial instruments measured at amortized cost; (iv) requires an entity to use the exit price notion when measuring the fair value of financial instruments for disclosure purposes; and (v) requires separate presentation of financial assets and financial liabilities by measurement category and form of financial asset on the balance sheet or in the accompanying notes to the financial statements. These provisions are effective for annual reporting periods beginning after December 15, 2017, and interim periods within those annual periods. The standard is to be applied using a cumulative-effect adjustment to the balance sheet as of the beginning of the year of adoption. The Company is currently evaluating the effect that adopting this standard will have on the Company’s condensed consolidated financial statements.
In March 2016, the FASB issued ASU No. 2016-09, Compensation—Stock Compensation: Improvements to Employee Share-Based Payment Accounting, to simplify several aspects of the accounting for share-based payment transactions, including the income tax consequences, classification of awards as either equity or liabilities, and classification on the statement of cash flows. An entity should recognize all excess tax benefits previously unrecognized, along with any valuation allowance, on a modified retrospective basis as a cumulative-effect adjustment to accumulated earnings as of the date of adoption. The change in classification on the statement of cash flows can be applied prospectively or retrospectively to all periods presented. The provisions of this update are effective for fiscal years beginning after December 15, 2016. The Company is currently evaluating the effect that adopting this standard will have on the Company’s condensed consolidated financial statements.
F-39
Table of Contents
In August 2016, the FASB issued ASU No. 2016-15, Statement of Cash Flows (Topic 230): Classification of Certain Cash Receipts and Cash Payments, which addresses eight specific cash flow issues with the objective of reducing the existing diversity in practice. Entities must apply the guidance retrospectively to all periods presented but may apply it prospectively if retrospective application would be impracticable. The provisions of this update are effective for fiscal years beginning after December 15, 2017. The Company is currently evaluating the effect that adopting this standard will have on the Company’s condensed consolidated financial statements.
4. FAIR VALUE MEASUREMENTS
Fair value focuses on the estimated price that would be received to sell the asset or paid to transfer the liability, which is referred to as the exit price. Inputs to valuation techniques used to measure fair value fall into three broad levels (Levels 1, 2, and 3) as follows:
Level 1—Observable inputs that reflect quoted prices for identical assets or liabilities in active markets that the Company has the ability to access at the measurement date.
Level 2—Observable inputs, other than quoted prices included in Level 1, for the asset or liability or prices for similar assets and liabilities.
Level 3—Unobservable inputs reflecting the reporting entity’s estimates of the assumptions that market participants would use in pricing the asset or liability (including assumptions about risk).
The recorded value of cash, receivables, payables, and accrued liabilities approximate fair value. The company measures its marketable securities on a recurring monthly basis. As of September 30, 2016 and December 31, 2015, available-for-sale marketable securities of $43,297 and $50,318, respectively, were classified as current assets. The cost of these securities was $42,727 and $50,311 at September 30, 2016 and December 31, 2015, respectively. The Company’s marketable securities have maturities of 12 to 30 months and are as follows:
| September 30, 2016 | December 31, 2015 | |||||||||||||||
| Amortized Cost |
Fair Value |
Amortized Cost |
Fair Value |
|||||||||||||
| Zero coupon bonds |
$ | 3,748 | $ | 3,858 | $ | 3,692 | $ | 3,724 | ||||||||
| U.S. treasury and government agencies |
10,042 | 10,133 | 10,036 | 9,996 | ||||||||||||
| Asset-backed securities |
409 | 399 | 528 | 514 | ||||||||||||
| Corporate debt securities |
12,413 | 12,782 | 18,653 | 18,760 | ||||||||||||
| State and political subdivisions |
16,115 | 16,125 | 17,402 | 17,324 | ||||||||||||
|
|
|
|
|
|
|
|
|
|||||||||
| Total marketable securities |
$ | 42,727 | $ | 43,297 | $ | 50,311 | $ | 50,318 | ||||||||
|
|
|
|
|
|
|
|
|
|||||||||
All marketable securities were valued based upon quoted prices for similar assets in active markets or quoted prices for identical or similar assets in markets that are not active (Level 2). During all periods presented, there were no transfers of securities between levels. Gross realized gains and losses on sales of marketable securities were not material in 2016 or 2015.
The fair value of noncurrent assets are evaluated on a nonrecurring basis when facts come to the attention of management which indicate an other than temporary impairment. Fair values are determined based on valuation techniques using Level 3 inputs.
5. ACQUISITIONS
On June 1, 2016, the Company acquired 100% of the shares of Watkins and Shepard Trucking, Inc. (“WST”) for $150,752 in cash and future payments. WST brings together final-mile delivery, claims-free
F-40
Table of Contents
handling and an innovative technology platform. WST is a provider of LTL, truckload and logistics services for difficult to handle goods, such as furniture and floor coverings across North America. WST uses proprietary technology to handle supply chain complexities within the national home delivery industry. The Company acquired WST because management believes it creates integrated first-to-final-mile-delivery capabilities, which take the complexity out of the supply chain for omnichannel retailers and manufacturers.
The acquisition of WST was accounted for as a purchase in accordance with FASB Accounting Standards Codification Topic 805, Business Combinations. Assets acquired and liabilities assumed were recorded at their fair values as of the acquisition date. The fair values of identifiable intangible assets, which were primarily customer relationships, trade names, and technology, were based on valuations using the income approach. The excess of the purchase price over the estimated fair values of tangible assets, identifiable intangible assets and assumed liabilities was recorded as goodwill. The goodwill is attributable to expected synergies and expected growth opportunities. The Company estimates approximately 100% of goodwill will be deductible for United States income tax purposes. The allocation of purchase price is preliminary as the Company has not completed its analysis estimating certain contingent liabilities. Measurement period adjustments will be recorded in the reporting period in which they are identified.
The preliminary purchase price allocation for WST was as follows:
| Consideration |
||||
| Cash |
$ | 79,539 | ||
| Guaranteed payments |
57,713 | |||
| Contingent payments |
13,500 | |||
|
|
|
|||
| Fair value of total consideration transferred |
$ | 150,752 | ||
|
|
|
|||
| Recognized amounts of identifiable assets acquired and liabilities assumed |
||||
| Cash |
$ | 1,318 | ||
| Receivables |
16,347 | |||
| Inventories |
480 | |||
| Prepaid expenses and other current assets |
4,392 | |||
| Property and equipment |
85,030 | |||
| Capitalized software and other noncurrent assets |
5,915 | |||
| Intangible assets |
10,900 | |||
| Goodwill |
135,015 | |||
|
|
|
|||
| Total assets acquired |
259,397 | |||
|
|
|
|||
| Payables assumed |
7,807 | |||
| Accrued liabilities assumed |
5,289 | |||
| Current maturities of debt and capital lease obligations assumed |
47,692 | |||
| Debt and capital lease obligations assumed |
46,211 | |||
| Other noncurrent liabilities assumed |
1,646 | |||
|
|
|
|||
| Net assets acquired |
$ | 150,752 | ||
|
|
|
|||
| Acquisition-related costs (included in other general expenses in the Company’s consolidated statements of comprehensive income for the period ended September 30, 2016) |
$ | 1,069 | ||
|
|
|
In addition to cash paid at closing, the guaranteed payment arrangement requires the Company to pay the former owners of WST $20,000 on each of the next three anniversary dates of the closing. This amount is discounted between one percent and three percent, based on the credit-adjusted discount rates for a present value amount of $57,713. The contingent payment arrangement requires the Company to make earnout payments of up to $13,333 at each of the 12 month, 24 month, and 36 month anniversaries of the closing date with the aggregate payment total not to exceed $39,999. Payments are based on a minimum of 80% achievement of annual EBITDA targets. The fair value of the guaranteed payment arrangement of $13,500 was estimated based on significant inputs that are not observable in the market, which are referred to as Level 3 inputs. Key assumptions include a probability-adjusted level of EBITDA estimated using the Monte Carlo method. As of September 30, 2016, the
F-41
Table of Contents
amount recognized for the guaranteed and contingent payment arrangements, the range of outcomes, and the assumptions used to develop the estimates had not changed significantly.
The valuation of the net assets acquired, excluding acquired cash, was classified as Level 3 in the valuation hierarchy (see Note 4 of the Notes to the condensed consolidated financial statements for the definition of Level 3 inputs). The Company valued property and equipment using both a market approach and a cost approach depending on the asset. Intangible assets were valued using the present value of projected future cash flows and significant assumptions included discount rates, customer attrition and obsolescence factors.
The components of Intangible assets included as part of the WST acquisition were as follows:
| Amortization Period (Years) |
Gross Value | |||||||
| Customer List |
10 | $ | 9,500 | |||||
| Trade Name |
3 | 1,400 | ||||||
|
|
|
|||||||
| Intangible assets |
$ | 10,900 | ||||||
|
|
|
|||||||
The condensed consolidated statement of comprehensive income includes WST revenue of $59,671 and net income of $1,486 since the date of acquisition during the nine months ended September 30, 2016. The following pro forma condensed combined financial information presents the Company’s results as if the Company had acquired WST on January 1, 2015. The unaudited pro forma information has been prepared with the following considerations:
| • | The acquisition method of accounting under existing GAAP was used. The Company is the acquirer for accounting purposes. |
| • | The financial information does not reflect any operating cost synergy savings that the combined companies may achieve as a result of the acquisition, the costs necessary to achieve these operating synergy savings or additional charges necessary as a result of the integration. |
| Nine months ended September 2016 |
Nine months ended September 2015 |
|||||||
| Pro forma net sales |
$ | 3,049,409 | $ | 3,064,450 | ||||
| Pro forma net income |
$ | 106,953 | $ | 97,220 | ||||
| Basic earnings per share as reported |
$ | 20.97 | $ | 18.04 | ||||
| Pro forma basic earnings per share |
$ | 20.55 | $ | 18.79 | ||||
| Diluted earnings per share as reported |
$ | 20.95 | $ | 18.01 | ||||
| Pro forma diluted earnings per share |
$ | 20.53 | $ | 18.77 | ||||
6. RECEIVABLES
Trade Receivables—The Company’s trade receivables primarily arise from providing transportation and logistics services to customers. The components of trade receivables as of September 30, 2016 and December 31, 2015, are as follows:
| September 2016 |
December 2015 |
|||||||
| Trade receivables |
$ | 442,572 | $ | 403,955 | ||||
| Allowance for doubtful accounts |
(3,027 | ) | (3,556 | ) | ||||
|
|
|
|
|
|||||
| Trade receivables—net of allowance |
$ | 439,545 | $ | 400,399 | ||||
|
|
|
|
|
|||||
F-42
Table of Contents
The rollforward of the allowance for doubtful accounts for the nine-months ended September 30, 2016 and year ended December 31, 2015 are as follows:
| September 2016 |
December 2015 |
|||||||
| Beginning Balance |
$ | (3,556 | ) | $ | (4,677 | ) | ||
| Provision |
1,049 | (229 | ) | |||||
| Recoveries |
(1,050 | ) | (545 | ) | ||||
| Write-offs |
530 | 1,895 | ||||||
|
|
|
|
|
|||||
| Ending Balance |
$ | (3,027 | ) | $ | (3,556 | ) | ||
|
|
|
|
|
|||||
Lease Receivable—The Company finances various types of transportation-related equipment for independent third parties. The transactions are generally for one to five years and are accounted for as sales-type or direct financing leases. As of September 30, 2016 and December 31, 2015, the investment in lease receivables was as follows:
| September 2016 |
December 2015 |
|||||||
| Future minimum payments to be received on leases |
$ | 121,978 | $ | 113,926 | ||||
| Guaranteed residual lease values |
123,921 | 137,040 | ||||||
|
|
|
|
|
|||||
| Total minimum lease payments to be received |
245,899 | 250,966 | ||||||
| Unearned income |
(26,615 | ) | (26,439 | ) | ||||
|
|
|
|
|
|||||
| Net investment in leases |
219,284 | 224,527 | ||||||
|
|
|
|
|
|||||
| Current maturities of lease receivables |
105,938 | 118,846 | ||||||
| Less—allowance for doubtful accounts |
(1,216 | ) | (663 | ) | ||||
|
|
|
|
|
|||||
| Current portion of lease receivables—net of allowance |
104,722 | 118,183 | ||||||
|
|
|
|
|
|||||
| Lease receivables—noncurrent |
$ | 114,562 | $ | 106,344 | ||||
|
|
|
|
|
|||||
Leases are generally placed on nonaccrual status (nonaccrual of interest and other fees) when a payment becomes 90 days past due or upon receipt of notification of bankruptcy, upon the death of a customer, or in other instances in which management concludes collectability is not reasonably assured. The accrual of interest and other fees is resumed when all payments are less than 60 days past due. At September 30, 2016, there were $818 of lease payments greater than 90 days past due, with amounts reserved, as discussed in Note 2, of $1,216.
The terms of the lease agreements generally give the Company the ability to take possession of the underlying asset in the event of default. The Company may incur credit losses in excess of recorded allowances if the full amount of any anticipated proceeds from the sale or re-lease of the asset supporting the third party’s financial obligation is not realized. Costs to repossess and estimated reconditioning costs are recorded in the condensed consolidated statements of comprehensive income in the period incurred.
Other receivables—The Company’s other receivables consist of income tax receivable balances and other non-trade receivables. Non-trade receivables primarily arise from transactions outside of the core transportation and logistics business.
F-43
Table of Contents
7. DEBT AND CREDIT FACILITIES
As of September 30, 2016 and December 31, 2015, debt includes the following:
| September 2016 |
December 2015 |
|||||||
| Unsecured senior notes: principal payable at maturity; interest payable in quarterly or semiannual installments through 2024; weighted-average interest rate of 3.66% for 2016 and 2015 |
$ | 500,000 | $ | 500,000 | ||||
| Equipment financing notes: principal and interest payable in monthly installments through 2023; average interest rate of 3.97% for 2016 |
54,409 | — | ||||||
| Secured credit facility: collateralized by certain trade receivables and interest rates of 1.66% and 1.38% for 2016 and 2015, respectively |
115,000 | 30,000 | ||||||
|
|
|
|
|
|||||
| Total principal outstanding |
669,409 | 530,000 | ||||||
| Current maturities |
(120,344 | ) | — | |||||
| Debt issuance costs |
(1,158 | ) | (1,360 | ) | ||||
|
|
|
|
|
|||||
| Long-term debt |
$ | 547,907 | $ | 528,640 | ||||
|
|
|
|
|
|||||
Financing arrangements require the Company to maintain certain covenants and financial ratios. The credit agreement contains various financial and other covenants, including required minimum consolidated net worth, consolidated net debt, limitations on indebtedness, transactions with affiliates, shareholder debt and restricted payments. The credit agreement and senior notes contain change of control provisions pursuant to which a change of control is defined to mean the Schneider family no longer owns more than 50% of the combined voting power of the Company’s capital stock. As of December 31, 2015, the Company was in compliance with all covenants and financial ratios under the credit agreement and the indentures governing the Senior Notes.
On June 1, 2016, the Company acquired debt of $88,640 in accordance with the acquisition of WST referenced in footnote 5. In connection with the closing, the Company paid in full the outstanding balance due on the revolving credit facility and term loan of $22,623 and certain equipment financing notes of $3,631. The remaining equipment financing notes have maturities through 2023 with fixed interest rates ranging from 3.19% to 4.69%.
In September 2014, the Company entered into a $300,000 private placement unsecured senior note offering. The initial funding of $120,000 occurred in November 2014, with final maturity dates of 2019, 2021, and 2024 and fixed interest rates of 2.76%, 3.25%, and 3.61%, respectively. The second funding of $180,000 was completed in March 2015, with final maturity dates of 2020, 2022, and 2025 and fixed interest rates of 2.86%, 3.35%, and 3.71%, respectively.
In November 2013, the Company entered into a five-year master revolving credit agreement with a syndicate of commercial banks providing borrowing capacity of up to $250,000. This agreement extended until November 2018 the previous revolving credit agreement, which would have expired in February 2016. Under the terms of the agreement, funds may be borrowed at rates selected by the Company based on various market indices. Borrowings under the credit agreement, which are primarily used for working capital and capital expenditures, are unsecured. No principal payments are required until the expiration date of the agreement. This agreement also provides a sublimit of $100,000 to be used for the issuance of letters of credit. At September 30, 2016 and December 31, 2015, standby letters of credit under this agreement amounted to $3,600 and $100, respectively, and were primarily related to the requirements of certain of the Company’s real estate leases. As of September 30, 2016 and December 31, 2015, the Company had no outstanding borrowings under the revolving credit agreement.
In December 2013, the Company entered into a secured credit facility that allows the Company to borrow up to $200,000 against qualifying trade receivables. This agreement extended the previous secured credit facility,
F-44
Table of Contents
which would have expired in March 2015. The amended credit facility, which expires in December 2017, increases the $125,000 borrowing capacity of the previous agreement. No principal payments are required until the expiration date of the facility. Under the terms of the agreement, funds may be borrowed at rates based on the 30-day London InterBank Offered Rate. The amended facility allows for the issuance of letters of credit. As of September 30, 2016 and December 31, 2015, standby letters of credit under this agreement amounted to $66,070 and $62,531, respectively, and were primarily related to the requirements of certain of the Company’s insurance obligations. The Company had $115,000 and $30,000 of outstanding borrowings under the credit facility as of September 30, 2016 and December 31, 2015, respectively.
Based upon borrowing rates available to the Company in the applicable year, a fixed-rate debt portfolio with similar terms and maturities would have a fair value of approximately $682,785 and $528,653 as of September 30, 2016 and December 31, 2015, respectively.
8. CAPITALIZED LEASES
The condensed consolidated balance sheets include assets acquired under capital lease as components of property and equipment as of September 30, 2016 and December 31, 2015, as follows:
| September 2016 |
December 2015 |
|||||||
| Transportation equipment |
$ | 35,403 | $ | 29,991 | ||||
| Real property |
825 | 825 | ||||||
| IT equipment |
593 | |||||||
| Accumulated depreciation |
(14,039 | ) | (11,712 | ) | ||||
|
|
|
|
|
|||||
| Total |
$ | 22,782 | $ | 19,104 | ||||
|
|
|
|
|
|||||
The related capitalized lease obligations as of September 30, 2016 and December 31, 2015, are as follows:
| September 2016 |
December 2015 |
|||||||
| Total future minimum payments |
$ | 20,585 | $ | 18,211 | ||||
| Amount representing interest |
(1,216 | ) | (1,279 | ) | ||||
|
|
|
|
|
|||||
| Present value of minimum lease payments |
19,369 | 16,932 | ||||||
| Current maturities |
(7,130 | ) | (5,966 | ) | ||||
|
|
|
|
|
|||||
| Long-term capital lease obligations |
$ | 12,239 | $ | 10,966 | ||||
|
|
|
|
|
|||||
Interest paid under capital leases totaled $360 and $410 for the nine months ended September 30, 2016 and 2015, respectively.
9. OPERATING LEASES
The Company has various operating lease agreements primarily related to transportation equipment and real estate. These leases are noncancelable and expire on various dates through 2023. Lease expense is included as a component of operating supplies and expenses on the condensed consolidated statements of comprehensive income.
10. INCOME TAXES
Effective Tax Rate—The effective income tax rate was 41% for the nine months ended September 30, 2016 and September 30, 2015. In determining the quarterly provision for income taxes, the Company uses an estimated annual effective tax rate, adjusted for discrete items. This rate is based upon the Company’s expected annual income, statutory tax rates, best estimate of nontaxable and nondeductible items of income and expense, and the ultimate outcome of tax audits.
F-45
Table of Contents
Foreign operations of the Company are insignificant in relation to overall Company operating results.
Unrecognized Tax Benefits—The Company’s unrecognized tax benefits of $2,841 as of September 30, 2016 would reduce the provision for income taxes if subsequently recognized. Potential interest and penalties related to unrecognized tax benefits are recorded in income tax expense. The total amount of accrued interest and penalties for such unrecognized tax benefits was $948 at September 30, 2016. The Company expects no significant increases or decreases for these uncertain tax positions during the twelve months immediately following the September 30, 2016 reporting date.
Tax Examinations—In June 2016, the Company closed the examination with the Internal Revenue Service for the tax years 2012 and 2013 and there were no adjustments that had a material impact on income tax expense. As of September 30, 2016, the Company remains subject to audits for various state jurisdictions for tax years subsequent to 2011.
11. EMPLOYEE BENEFIT PLANS
The Company sponsors defined contribution plans for certain eligible employees. Under these plans, annual contribution levels, as defined in the agreements, are based upon years of service. Expense under these plans totaled $8,526 and $8,176 for the nine months ended September 30, 2016 and 2015, respectively, and is a component of salaries, wages, and benefits on the condensed consolidated statements of comprehensive income.
The Company also has a savings plan, organized pursuant to Section 401(k) of the Internal Revenue Code, to provide employees with additional income upon retirement. Under the terms of the plan, substantially all employees may contribute a percentage of their annual compensation, as defined, to the plan. The Company makes contributions to the plan, up to a maximum amount per employee, based upon a percentage of employee contributions. The Company’s net expense under this plan was $7,471 and $7,200 for the nine months ended September 30, 2016 and 2015, respectively.
12. REDEEMABLE COMMON SHARES AND SHARE-BASED AWARDS
The Company’s outstanding shares of Class A and B redeemable common stock share equally in all dividends and distributions. However, the redeemable Class B shares do not have voting rights. The Company has the right to call the Class A and Class B Shares under certain circumstances. Likewise, the Class A and Class B Shareholders have the right to put the Class A and Class B shares to the Company under certain circumstances. The repurchase price in the event of a Company call or shareholder put is generally the net book value of the shares as of the end of the immediately preceding fiscal year. Other than through these repurchase provisions or other certain permitted transactions defined in the shareholders’ agreement the Class A and Class B common shareholders are not permitted to transfer their shares.
The Company has an employee share purchase plan whereby the Board of Directors may offer directors and selected employees an opportunity to purchase shares of the Company’s Class B common shares at the net book value of the shares as of the end of the immediately preceding fiscal year (consistent with the price used for repurchasing Class A and B redeemable common shares with all shareholders). The directors and employees may sell their Class B redeemable common shares subject to the Company’s right of first refusal. If exercised, the Company’s right of first refusal would be exercised at the net book value of the shares as of the end of the immediately preceding fiscal year. The Company does not record compensation cost associated with the employee share purchase plan because the directors and employees purchase and sell their shares under the employee share purchase plan on the same terms available to all other holders of the Company’s Class A and Class B redeemable common shares.
The Board of Directors may grant directors and selected employees restricted shares at no cost to the recipient, and which can be settled only in Class B redeemable common shares at the end of the vesting period.
F-46
Table of Contents
Compensation cost associated with the awarded shares is measured at the net book value of the shares as of the end of the immediately preceding fiscal year and is recognized ratably over the requisite service period, which is generally one to three years. Restricted shares do not provide the holder with cash dividends during the vesting period, nor do dividends accrue prior to vesting. Any Class B shares issued in settlement of vested restricted shares are subject to the same sale and repurchase provisions as the shares acquired under the employee share purchase plan discussed above.
While no Class A or Class B redeemable common shares are mandatorily redeemable, certain of the circumstances under which the Class A and Class B shareholders, including the directors and employees holding shares pursuant to the employee share purchase plan and settlement of restricted shares, can redeem shares are outside the control of the Company. As a consequence, all vested Class A and B redeemable common shares are recorded as temporary equity (redeemable common shares) in the consolidated balance sheets at their redemption value as of the respective balance sheet date. Accumulated earnings in the consolidated balance sheets is adjusted for the changes during the period in the current redemption value of vested Class A and B redeemable common shares. Restricted shares that are not yet vested and held for more than 180 days as of the reporting date are classified in liabilities at their redemption values taking into consideration the portion of the requisite service that has been provided as of the reporting date.
Employee and Director Stock Purchases and Grants—During the period ended September 30, 2016, employees and directors purchased 17,708 Class B common shares at a price per share of $203.50. As of September 30, 2016, the Company did not authorize any additional shares to be issued under the employee stock purchase plan.
Restricted Shares—The Company grants to certain management restricted shares that vest generally over a three year period. Restricted shares must be paid out in shares and are accounted for as equity awards on vested and held for more than 180 days. Cash dividends are not paid on the nonvested restricted shares, nor do they accumulate during the vesting period. A summary of the restricted share grants activity during 2015 and for the nine-month period ended September 30, 2016, was as follows:
| Restricted Shares | ||||||||
| Shares | Weighted Average Grant Date Fair Value Per Share |
|||||||
| Nonvested at January 1, 2015 |
30,500 | $ | 148.98 | |||||
| Granted |
13,581 | 182.30 | ||||||
| Vested |
(17,449 | ) | 144.36 | |||||
| Forfeited |
— | — | ||||||
|
|
|
|
|
|||||
| Nonvested at December 31, 2015 |
26,632 | $ | 168.99 | |||||
| Granted |
12,879 | 203.50 | ||||||
| Vested |
(13,274 | ) | 162.71 | |||||
| Forfeited |
(330 | ) | 184.95 | |||||
|
|
|
|
|
|||||
| Nonvested at September 30, 2016 |
25,907 | $ | 189.16 | |||||
|
|
|
|
|
|||||
Compensation expense recognized within salaries, wages, and benefits in the statements of comprehensive income for restricted shares for the nine months ended 2016 and 2015 was $2,049 and $1,998, respectively. As of September 30, 2016, the total unrecognized compensation cost related to nonvested restricted shares awards was $3,288 and the weighted-average period over which it is expected to be recognized is 1.9 years.
F-47
Table of Contents
13. OTHER SHARE-BASED COMPENSATION
The Company offers the following compensation programs to employees that are based upon the performance of its Class B redeemable common shares or the Company’s economic performance. Programs must be settled in cash and do not result in the issuance of common shares. Awards under these programs are accounted for as liabilities within other accrued liabilities and other noncurrent liabilities on the balance sheet, with compensation expense recorded recorded within salaries, wages, and benefits in the consolidated statements of comprehensive income. Compensation expense recognized within salaries, wages, and benefits in the statements of comprehensive income for other share-based compensation programs for the nine months ended 2016 and 2015 was $9,553 and $10,449, respectively.
Long-term cash awards-The Company began to grant Long-Term Cash Awards (“LTCA”) in 2013. All payouts under the LTCA, if any, are made in cash after five years from the grant date. Compensation expense is recorded ratably generally over the vesting period of 5 years based on the fair value of the awards at each reporting period. In general, in the event that a participant’s employment terminates prior to the conclusion of the performance period, the award under the LTCA is deemed forfeited and canceled. However, some awards under the LTCA pro rata vest in the event of a participant’s death, disability, retirement or change of control.
Payments under the LTCA are based on levels of compounded Net Income Growth and average Return on Capital, as defined in the long-term incentive plan agreement. No payments are made under the LTCA unless the Company achieves a minimum performance of 3% of compounded Net Income Growth and Return on Capital of 8.5%, 9.5%, 10%, and 11% for 2013-2017, 2014-2018, 2015-2019 and 2016-2020, respectively, as defined in the agreement. Payments will equal 100% of the targeted payout if compounded Net Income Growth averages 8% and Return on Capital equals 13.5%, 14.5%, 15%, and 16% in 2013-2017, 2014-2018, 2015-2019 and 2016-2020, respectively. Targeted payouts for the 2016, 2015, 2014 and 2013 grants are $6,145, $5,776, $5,103 and $5,132, respectively. While each grant is expressed as a fixed dollar amount, the actual amount earned may range from 0% to 250% of target based upon performance.
| Amount | ||||
| LTCA liability at January 1, 2015 |
$ | 6,669 | ||
| Compensation expense |
5,734 | |||
| Forfeitures |
(33 | ) | ||
| Payments |
(414 | ) | ||
|
|
|
|||
| LTCA liability at December 31, 2015 |
11,956 | |||
| Compensation expense |
8,287 | |||
| Forfeitures |
(152 | ) | ||
| Payments |
(135 | ) | ||
|
|
|
|||
| LTCA liability at September 30, 2016 |
$ | 19,956 | ||
|
|
|
|||
Stock Appreciation Rights—The Company under the Long-Term Incentive Plan (“LTIP”) granted Stock Appreciation Rights (“SAR”) through 2012. SARs entitle the participants to the benefits of changes in fair value of the Class B common shares from the date of issuance to the date in which the award is redeemed. SARs cliff-vest three years after the grant date and ordinarily are redeemed five years after the grant date based on the fair value of the Class B common shares at that date. However, prior to the end of the fourth anniversary of the grant date, participants may elect to defer redemption until after the tenth year based on the fair value of the Class B common shares at that date. Subsequent to vesting, the Company continues to record the liabilities at fair value until redemption. Because no further service is required after the three year vesting period, the Company records compensation expense based upon the fair value of the awards ratably over three years.
There were no redemptions that occurred during the nine-month periods ended September 30, 2016 or 2015. SARs outstanding as of September 30, 2016 were 100,533 units, with a related liability recorded in the September 30, 2016 balance sheet of $7,860.
F-48
Table of Contents
14. EARNINGS PER SHARE
The Company computes basic earnings per share by dividing net earnings available to common shareholders by the actual weighted average number of redeemable common shares outstanding for the reporting period. Diluted earnings per share reflect the potential dilution that could occur if holders of unvested restricted shares converted their holdings into redeemable common shares. Outstanding unvested restricted share units represent the dilutive effects on weighted average shares. A reconciliation of the number of shares used in computing basic and diluted earnings per share is shown below.
The calculation of basic and diluted earnings per share for the nine-month periods ended September 30, 2016 and 2015 is shown below (in thousands, except share and per share amounts):
| Nine Months Ended September 30, |
||||||||
| 2016 | 2015 | |||||||
| Basic earnings per common share: |
||||||||
| Net income available to common shareholders |
$ | 109,144 | $ | 93,324 | ||||
|
|
|
|
|
|||||
| Weighted average common shares issued and outstanding |
5,203,633 | 5,174,476 | ||||||
| Basic earnings per common share |
$ | 20.97 | $ | 18.04 | ||||
|
|
|
|
|
|||||
| Diluted earnings per common share: |
||||||||
| Net income applicable to diluted earnings per share |
$ | 109,144 | $ | 93,324 | ||||
|
|
|
|
|
|||||
| Dilutive potential common shares: |
||||||||
| Restricted share units |
6,102 | 6,426 | ||||||
|
|
|
|
|
|||||
| Dilutive potential common shares |
6,102 | 6,426 | ||||||
|
|
|
|
|
|||||
| Total diluted average common shares issued and outstanding |
5,209,735 | 5,180,902 | ||||||
|
|
|
|
|
|||||
| Diluted earnings per common share |
$ | 20.95 | $ | 18.01 | ||||
15. COMMITMENTS AND CONTINGENCIES
In the ordinary course of conducting its business, the Company becomes involved in certain legal matters and investigations on a number of matters, including liability claims, taxes other than income taxes, contract disputes, employment, and other litigation matters. The Company accrues for anticipated costs to defend and resolve matters that are probable and estimatable. The Company believes the outcomes of these matters will not have a material impact on the business or the condensed consolidated financial statements of the Company.
At September 30, 2016, the Company had firm commitments coming due in 2016-2017 to acquire approximately $98,242 of transportation equipment.
16. SEGMENT REPORTING
The Company has three reportable segments—Truckload, Intermodal, and Logistics—which are based primarily on the services each segment provides.
The Truckload reportable segment consists of three operating segments (Van Truckload, Specialty Dedicated, and Bulk) that are aggregated because they have similar economic characteristics and meet the other aggregation criteria described in the accounting guidance for segment reporting. The Van Truckload segment delivers truckload quantities over irregular routes using dry van trailers. The Specialty Dedicated segment is similar except that it involves recurring routes between the same locations for which specified trucks are dedicated to the route. The Bulk segment transports key inputs to the manufacturing process such as specialty chemicals.
F-49
Table of Contents
The Intermodal reportable segment provides rail intermodal and drayage services to the Company’s customers. Company-owned containers and generally company-owned dray tractors are utilized to provide these transportation services.
The Logistics reportable segment consists of three operating segments (Brokerage, Supply Chain Management, and Import/Export Services) that are aggregated because they have similar economic characteristics and meet the other aggregation criteria described in the accounting guidance for segment reporting. In the Logistics segment, the Company provides additional sources of truck capacity and manage transportation-systems analysis requirements for individual customers and provide trans-loading and warehousing services.
The Company generates other revenues from a captive insurance business and from a leasing business, which are operated by wholly owned subsidiaries of the Company. The Company also has operations in Asia which meet the definition of an operating segment. None of these operations meets the quantitative reporting thresholds. As a result, these operations are grouped in “Other” in the tables below. The Company has also included in “Other”, revenues and expenses that are incidental to the Company’s activities and are not attributable to any of the operating segments. Separate balance sheets are not prepared by segment and, as a result, assets are not separately identifiable by segment. All transactions between reporting segments are eliminated in consolidation. The chief operating decision maker reviews revenue for each segment without the inclusion of fuel surcharge revenue.
The following tables summarize segment information:
| For the nine months ended September 30 |
||||||||
| 2016 | 2015 | |||||||
| Operating Revenues: |
||||||||
| Truckload |
$ | 1,550,992 | $ | 1,459,011 | ||||
| Intermodal |
559,654 | 577,708 | ||||||
| Logistics |
539,909 | 464,319 | ||||||
| Other |
171,611 | 196,694 | ||||||
| Fuel surcharge |
209,713 | 291,321 | ||||||
| Inter-segment eliminations |
(56,035 | ) | (56,178 | ) | ||||
|
|
|
|
|
|||||
| Total |
$ | 2,975,844 | $ | 2,932,875 | ||||
|
|
|
|
|
|||||
| Operating Earnings: |
||||||||
| Truckload |
$ | 157,548 | $ | 146,111 | ||||
| Intermodal |
31,631 | 38,353 | ||||||
| Logistics |
21,687 | 16,533 | ||||||
| Other |
(8,397 | ) | (26,657 | ) | ||||
|
|
|
|
|
|||||
| Total Income from Operations |
$ | 202,469 | $ | 174,340 | ||||
|
|
|
|
|
|||||
| Depreciation and Amortization Expense: |
||||||||
| Truckload |
$ | 141,067 | $ | 117,195 | ||||
| Intermodal |
23,209 | 28,347 | ||||||
| Logistics |
294 | 793 | ||||||
| Other |
33,134 | 28,004 | ||||||
|
|
|
|
|
|||||
| Total |
$ | 197,704 | $ | 174,339 | ||||
|
|
|
|
|
|||||
F-50
Table of Contents
Reconciliation of operating earnings to income before income taxes is as follows:
| For the nine months ended September 30 |
||||||||
| 2016 | 2015 | |||||||
| Income from operations |
$ | 202,469 | $ | 174,340 | ||||
| Interest expense, net |
(15,708 | ) | (13,968 | ) | ||||
| Other non-operating expenses |
(1,771 | ) | (2,196 | ) | ||||
|
|
|
|
|
|||||
| Income before income taxes |
$ | 184,990 | $ | 158,176 | ||||
|
|
|
|
|
|||||
17. SUBSEQUENT EVENTS
On October 25, 2016, the Company’s Board of Directors approved the 2016 dividend of $6.00 per share of Class A common shares and Class B common shares. The dividend totaling $31,265 was paid on December 15, 2016.
Certain amendments have been executed in October 2016 related to the Company’s Class A and Class B common shares in contemplation of the Company’s planned initial offering of Class B shares to the public. The amendments are only effective upon completion of the initial offering. Certain amendments have been completed while other amendments are still in process and will be completed prior to the offering becoming effective. Amendments to date include the removal of provisions that grant the Schneider family members and their family trusts rights to put certain shares to Schneider for repurchase.
* * * * * *
F-51
Table of Contents

Table of Contents

Table of Contents
shares
Schneider National, Inc.
Class B Common Stock
PROSPECTUS
| Morgan Stanley | UBS Investment Bank | |||||
| BofA Merrill Lynch | ||||||
| Citigroup | Credit Suisse | J.P. Morgan | Wells Fargo Securities | |||
, 2017
Until , 2017, all dealers that buy, sell or trade our Class B common stock, whether or not participating in this offering, may be required to deliver a prospectus. This is in addition to the dealers’ obligation to deliver a prospectus when acting as underwriters and with respect to their unsold allotments or subscriptions.
Table of Contents
PART II
Information not required in prospectus
Item 13. Other expenses of issuance and distribution
| Amount To Be Paid | ||||
| SEC registration fee |
$ | |||
| FINRA filing fee |
15,500 | |||
| New York Stock Exchange listing fee |
||||
| Transfer agent’s fees |
||||
| Printing and engraving expenses |
||||
| Legal fees and expenses |
||||
| Accounting fees and expenses |
||||
| Blue Sky fees and expenses |
||||
| Miscellaneous |
||||
|
|
|
|||
| Total |
$ | |||
The table above sets forth the expenses to be incurred in connection with the offering described in this Registration Statement, other than the underwriting discount, all of which will be paid by the Registrant. Each of the amounts set forth above, other than the SEC Registration fee, FINRA filing fee and the NYSE listing fee, is an estimate.
Item 14. Indemnification of directors and officers
Sections 180.0850 to 180.0859 of the Wisconsin Business Corporation Law, or the WBCL, require a corporation to indemnify any director or officer who is a party to any threatened, pending or completed civil, criminal, administrative or investigative action, suit arbitration or other proceeding, whether formal or informal, which involves foreign, federal, state or local law and that is brought by or in the right of the corporation or by any other person. A corporation’s obligation to indemnify any such person includes the obligation to pay any judgment, settlement, forfeiture or fine, including any excise tax assessed with respect to an employee benefit plan, and all reasonable expenses, including fees, costs, charges, disbursements, attorney’s fees and other expenses except in those cases in which liability was incurred as a result of the breach or failure to perform a duty that the director or officer owes to the corporation and the breach or failure to perform constitutes: (i) a willful failure to deal fairly with the corporation or its shareholders in connection with a matter in which the director or officer has a material conflict of interest; (ii) a violation of criminal law, unless the person has reasonable cause to believe his conduct was lawful or had no reasonable cause to believe his conduct was unlawful; (iii) a transaction from which the person derived an improper personal profit; or (iv) willful misconduct.
An officer or director seeking indemnification is entitled to indemnification if approved in any of the following manners: (i) by a majority vote of a disinterested quorum of the board of directors, or if such quorum of disinterested directors cannot be obtained, by a majority vote of a committee of two or more disinterested directors; (ii) by independent legal counsel; (iii) by a panel of three arbitrators; (iv) by an affirmative vote of disinterested shareholders; (v) by a court; or (vi) with respect to any additional right to indemnification granted, by any other method permitted in Section 180.0858 of the WBCL.
Reasonable expenses incurred by a director or officer who is a party to a proceeding may be reimbursed by a corporation at such time as the director or officer furnishes to the corporation written affirmation of his good faith belief that he has not breached or failed to perform his duties and a written undertaking to repay any amounts advanced if it is determined that indemnification by the corporation is not required.
II-1
Table of Contents
The indemnification provisions of Sections 180.0850 to 180.0859 of the WBCL are not exclusive. A corporation may expand an officer’s or director’s right to indemnification (i) in its articles of incorporation or bylaws; (ii) by written agreement between the director or officer and the corporation; (iii) by resolution of its board of directors; or (iv) by resolution of a majority of all of the corporation’s voting shares then issued and outstanding.
As permitted by Section 180.0858 of the WBCL, the company’s Amended and Restated Bylaws contain indemnification provisions that are substantially similar to the statutory indemnification provisions. Additionally, the company has purchased director and officer liability insurance.
The underwriting agreement for this offering provides that the underwriters indemnify the company against certain civil liabilities that may be incurred in connection with this offering, including certain liabilities under the Securities Act.
Item 15. Recent sales of unregistered securities
The following list sets forth information regarding all securities sold or issued by the registrant in the three years preceding the date of this registration statement. No underwriters were involved in these sales. There was no general solicitation of investors or advertising, and we did not pay or give, directly or indirectly, any commission or other remuneration, in connection with the offering of these shares In each of the transactions described below, the recipients of the securities represented their intention to acquire the securities for investment only and not with a view to or for sale in connection with any distribution thereof, and appropriate legends were affixed to the securities issued in these transactions.
As of 2017, shares of Class B redeemable common stock were issued and outstanding. Of this amount, shares of Class B redeemable common stock shares were granted to employees and non-employee directors of the company in the form of restricted stock, which are shares of Class B redeemable common stock that vest over a period of years from the date of grant. During fiscal year 2016, shares of restricted stock were issued to employees and non-employee directors of the company. During fiscal year 2015, 42,018 shares of Class B redeemable common stock were issued to employees and non-employee directors of the company. During fiscal year 2014, 36,681 shares of Class B redeemable common stock were issued to employees and non-employee directors of the company.
The offers, sales and issuances of the securities described above were deemed to be exempt from registration under the Securities Act in reliance upon Section 4(a)(2) of the Securities Act as transactions by an issuer not involving any public offering. The recipients in each of these transactions acquired the securities for investment only and not with a view to or for sale in connection with any distribution thereof and appropriate legends were affixed to the securities issued in these transactions.
II-2
Table of Contents
Item 16. Exhibits and financial statement schedules
(a) The following exhibits are filed as part of this registration statement:
| Exhibit Number |
Description | |
| 1.1** | Form of Underwriting Agreement | |
| 3.1* | Form of Amended and Restated Certificate of Incorporation of Schneider National, Inc. | |
| 3.2* | Form of Amended and Restated Bylaws of Schneider National, Inc. | |
| 4.1** | Form of Class B common stock certificate | |
| 5.1** | Opinion of Godfrey & Kahn, S.C., regarding validity of the shares of Class B common stock registered | |
| 9.1* | Amended and Restated 1995 Schneider National, Inc. Voting Trust Agreement and Voting Agreement | |
| 10.1** | Amended and Restated Credit Agreement dated as of February 18, 2011, as amended through November 21, 2013, among Schneider National Leasing, Inc., the guarantors party thereto, the lenders party thereto, and JPMorgan Chase Bank, N.A., as administrative agent | |
| 10.2** | Note Purchase Agreement dated as of May 7, 2010 by and among Schneider National Leasing, Inc., as issuer, Schneider National, Inc., as parent guarantor, and the purchasers party thereto | |
| 10.3** | Note Purchase Agreement dated as of June 12, 2013 by and among Schneider National Leasing, Inc., as issuer, Schneider National, Inc., as parent guarantor, and the purchasers party thereto | |
| 10.4** | Note Purchase Agreement dated as of November 10, 2014 by and among Schneider National Leasing, Inc., as issuer, Schneider National, Inc., as parent guarantor, and the purchasers party thereto | |
| 10.5** | Amended and Restated Receivables Purchase Agreement dated as of March 31, 2011, as amended as of December 17, 2013, among Schneider Receivables Corporation, as seller, Schneider National, Inc., as the servicer, Wells Fargo Bank, N.A., as administrative agent, and the purchasers party thereto | |
| 10.6* | Amended and Restated Stock Restriction Agreement | |
| 10.7* | Schneider Family Board Nomination Process Agreement | |
| 10.8* | Form of Registration Rights Agreement by and among Schneider National, Inc. and certain shareholders of Schneider National, Inc. | |
| 10.9**+ | Schneider National, Inc. 2017 Equity Incentive Plan | |
| 21.1* | Subsidiaries of Schneider National, Inc. | |
| 23.1* | Consent of Deloitte & Touche LLP | |
| 23.2** | Consent of Godfrey & Kahn, S.C. (included as part of Exhibit 5.1) | |
| 24.1* | Power of Attorney (included in the signature page to this registration statement) | |
| * | Filed herewith. |
| ** | To be filed by amendment. |
| + | Constitutes a management contract or compensatory plan or arrangement. |
(b) Financial statement schedules
All schedules have been omitted because they are not required or because the required information is given in the financial statements or notes to those statements.
II-3
Table of Contents
Item 17. Undertakings
(a) The undersigned registrant hereby undertakes to provide to the underwriters at the closing specified in the underwriting agreement certificates in such denominations and registered in such names as required by the underwriters to permit prompt delivery to each purchaser.
(b) Insofar as indemnification for liabilities arising under the Securities Act may be permitted to directors, officers and controlling persons of the registrant pursuant to the foregoing provisions or otherwise, the registrant has been advised that in the opinion of the Securities and Exchange Commission such indemnification is against public policy as expressed in the Act and is, therefore, unenforceable. In the event that a claim for indemnification against such liabilities (other than the payment by the registrant of expenses incurred or paid by a director, officer or controlling person of the registrant in the successful defense of any action, suit or proceeding) is asserted by such director, officer or controlling person in connection with the securities being registered, the registrant will, unless in the opinion of its counsel the matter has been settled by controlling precedent, submit to a court of appropriate jurisdiction the question of whether such indemnification by it is against public policy as expressed in the Securities Act, and will be governed by the final adjudication of such issue.
(c) The undersigned registrant hereby undertakes that:
(1) For purposes of determining any liability under the Securities Act, the information omitted from the form of prospectus filed as part of this registration statement in reliance upon Rule 430A and contained in a form of prospectus filed by us pursuant to Rule 424(b)(1) or (4) or 497(h) under the Securities Act shall be deemed to be part of this registration statement as of the time it was declared effective.
(2) For the purpose of determining any liability under the Securities Act, each post-effective amendment that contains a form of prospectus shall be deemed to be a new registration statement relating to the securities offered therein and the offering of such securities at that time shall be deemed to be the initial bona fide offering thereof.
(3) For the purpose of determining liability under the Securities Act to any purchaser, each prospectus filed pursuant to Rule 424(b) as part of a registration statement relating to an offering, other than registration statements relying on Rule 430B or other than prospectuses filed in reliance on Rule 430A, shall be deemed to be part of and included in the registration statement as of the date it is first used after effectiveness; provided, however, that no statement made in a registration statement or prospectus that is part of the registration statement or made in a document incorporated or deemed incorporated by reference into the registration statement or prospectus that is part of the registration statement will, as to a purchaser with a time of contract of sale prior to such first use, supersede or modify any statement that was made in the registration statement or prospectus that was part of the registration statement or made in any such document immediately prior to such date of first use.
(4) In a primary offering of securities of the undersigned registrant pursuant to this registration statement, regardless of the underwriting method used to sell the securities to the purchaser, if the securities are offered or sold to such purchaser by means of any of the following communications, the undersigned registrant will be a seller to the purchaser and will be considered to offer or sell such securities to such purchaser:
(i) any preliminary prospectus or prospectus of the undersigned registrant relating to the offering required to be filed pursuant to Rule 424;
(ii) any free writing prospectus relating to the offering prepared by or on behalf of the undersigned registrant or used or referred to by the undersigned registrant;
(iii) the portion of any other free writing prospectus relating to the offering containing material information about the undersigned registrant or its securities provided by or on behalf of the undersigned registrant; and
(iv) any other communication that is an offer in the offering made by the undersigned registrant to the purchaser.
II-4
Table of Contents
SIGNATURES
Pursuant to the requirements of the Securities Act of 1933, the registrant has duly caused this registration statement to be signed on its behalf by the undersigned, thereunto duly authorized, in the City of Green Bay, in the State of Wisconsin, on December 22, 2016.
| SCHNEIDER NATIONAL, INC. | ||
| By: |
/s/ Christopher B. Lofgren | |
| Name: Christopher B. Lofgren | ||
| Title: Chief Executive Officer | ||
POWER OF ATTORNEY
KNOWN ALL MEN BY THESE PRESENTS, that each person whose signature appears immediately below constitutes and appoints Christopher B. Lofgren, Lori Lutey and Paul Kardish, and any one or more of them, his or her true and lawful attorney-in-fact and agent, with full power of substitution and resubstitution, for him or her and in his or her name, place and stead in any and all capacities, to sign any and all amendments (including post-effective amendments) to this registration statement, and any and all additional registration statements pursuant to Rule 462(b) of the Securities Act, and to file the same with all exhibits thereto and other documents in connection therewith with the SEC, granting unto said attorneys-in-fact and agents, and each of them, full power and authority to do and perform each and every act and thing requisite and necessary to be done, as fully to all intents and purposes as he might or could do in person, hereby ratifying and confirming all that said attorneys-in-fact and agents or any of them, or their or his substitute or substitutes, may lawfully do or cause to be done by virtue hereof.
Pursuant to the requirements of the Securities Act of 1933, this registration statement has been signed by the following persons in the capacities and on the dates indicated.
| Signature |
Title |
Date | ||
| /s/ Christopher B. Lofgren Christopher B. Lofgren |
Chief Executive Officer, President and Director (principal executive officer) |
December 22, 2016 | ||
| /s/ Lori Lutey |
Chief Financial Officer (principal financial officer) |
December 22, 2016 | ||
| Lori Lutey | ||||
| /s/ Amy Schilling |
Chief Accounting Officer (principal accounting officer) |
December 22, 2016 | ||
| Amy Schilling | ||||
| /s/ Daniel Sullivan |
Chairman of the Board of Directors |
December 22, 2016 | ||
| Daniel Sullivan | ||||
| /s/ Thomas Gannon |
Director | December 22, 2016 | ||
| Thomas Gannon | ||||
| /s/ Adam Godfrey |
Director | December 22, 2016 | ||
| Adam Godfrey | ||||
| /s/ Robert Grubbs |
Director | December 22, 2016 | ||
| Robert Grubbs | ||||
Table of Contents
| Signature |
Title |
Date | ||
| /s/ Norman Johnson |
Director | December 22, 2016 | ||
| Norman Johnson | ||||
| /s/ Therese Koller |
Director | December 22, 2016 | ||
| Therese Koller | ||||
| /s/ Thomas Schneider |
Director | December 22, 2016 | ||
| Thomas Schneider | ||||
| /s/ R. Scott Trumbull |
Director | December 22, 2016 | ||
| R. Scott Trumbull | ||||
Table of Contents
EXHIBIT INDEX
(a) The following exhibits are filed as part of this registration statement:
| Exhibit Number |
Description | |
| 1.1** | Form of Underwriting Agreement | |
| 3.1* | Form of Amended and Restated Certificate of Incorporation of Schneider National, Inc. | |
| 3.2* | Form of Amended and Restated Bylaws of Schneider National, Inc. | |
| 4.1** | Form of Class B common stock certificate | |
| 5.1** | Opinion of Godfrey & Kahn, S.C., regarding validity of the shares of Class B common stock registered | |
| 9.1* | Amended and Restated 1995 Schneider National, Inc. Voting Trust Agreement and Voting Agreement | |
| 10.1** | Amended and Restated Credit Agreement dated as of February 18, 2011, as amended through November 21, 2013, among Schneider National Leasing, Inc., the guarantors party thereto, the leaders party thereto, and JPMorgan Chase Bank, N.A., as administrative agent | |
| 10.2** | Note Purchase Agreement dated as of May 7, 2010 by and among Schneider National Leasing, Inc., as issuer, Schneider National, Inc., as parent guarantor, and the purchasers party thereto | |
| 10.3** | Note Purchase Agreement dated as of June 12, 2013 by and among Schneider National Leasing, Inc., as issuer, Schneider National, Inc., as parent guarantor, and the purchasers party thereto | |
| 10.4** | Note Purchase Agreement dated as of November 10, 2014 by and among Schneider National Leasing, Inc., as issuer, Schneider National, Inc., as parent guarantor, and the purchasers party thereto | |
| 10.5** | Amended and Restated Receivables Purchase Agreement dated as of March 31, 2011, as amended as of December 17, 2013, among Schneider Receivables Corporation, as seller, Schneider National, Inc., as the servicer, Wells Fargo Bank, N.A., as the administrative agent, and the purchasers party thereto | |
| 10.6* | Amended and Restated Stock Restriction Agreement | |
| 10.7* | Schneider Family Board Nomination Process Agreement | |
| 10.8* | Form of Registration Rights Agreement by and among Schneider National, Inc. and certain shareholders of Schneider National, Inc. | |
| 10.9**+ | Schneider National, Inc. 2017 Equity Incentive Plan | |
| 21.1* | Subsidiaries of Schneider National, Inc. | |
| 23.1* | Consent of Deloitte & Touche LLP | |
| 23.2** | Consent of Godfrey & Kahn, S.C. (included as part of Exhibit 5.1) | |
| 24.1* | Power of Attorney (included in the signature page to this registration statement) | |
| * | Filed herewith. |
| ** | To be filed by amendment. |
| + | Constitutes a management contract or compensatory plan or arrangement. |