Attached files
| file | filename |
|---|---|
| EX-99.1 - EXHIBIT 99.1 - RITE AID CORP | v455414_ex99-1.htm |
| 8-K - FORM 8-K - RITE AID CORP | v455414_8k.htm |
Exhibit 99.2
With us, it’s personal. 3rd QUARTER FISCAL 2017 SUPPLEMENTAL INFORMATION December 22, 2016

Safe Harbor Statement Investors are urged to review Rite Aid’s SEC filings. Statements, estimates, targets and other information included herein might be considered forward-looking. These statements and estimates are based upon various assumptions that may not prove to be correct. Such assumptions are inherently subject to significant uncertainties and contingencies, many of which are beyond the company’s control. No representation is made, and no assurance can be given, that such results can or will be attained. The risk factors associated with those uncertainties are described in Rite Aid’s most recent Form 10-K, its Form 10-Q’s and other filings with the SEC. Rite Aid assumes no obligation to update the information or the forward-looking statements contained herein, whether as a result of new information or otherwise. Also included herein are non-GAAP financial measures. The definition and purpose for using these measures are in Rite Aid’s Form 8-K furnished to the SEC on the date hereof.

Reconciliation of Non-GAAP Financial Measures The company separately reports financial results on the basis of Adjusted Net Income, Adjusted Net Income per diluted share, and Adjusted EBITDA, which are non-GAAP financial measures. Adjusted Net Income and Adjusted Net Income per diluted share exclude amortization of EnvisionRx intangible assets, merger and acquisition-related costs, loss on debt retirements and LIFO adjustments. Adjusted EBITDA is defined as net income excluding the impact of income taxes, interest expense, depreciation and amortization, LIFO adjustments, charges or credits for facility closing and impairment, inventory write-downs related to store closings, debt retirements and other items (including stock-based compensation expense, merger and acquisition-related costs, severance and costs related to distribution center closures, gain or loss on sale of assets and revenue deferrals related to our customer loyalty program).

Q3 -Fiscal 2017 Summary ($ in millions, except per share amounts) 13 Weeks Ended 13 Weeks Ended November 26, 2016 November 28, 2015 Revenue $ 8,089.7 $ 8,154.2 Net Income $ 15.0 $ 59.5 Net Income per Diluted Share $ 0.01 $ 0.06 Adjusted Net Income $ 23.3 $ 87.2 Adjusted Net Income per Diluted Share $ 0.02 $ 0.08 Adjusted EBITDA $ 274.1 3.39% $ 373.2 4.58%

Q3 - Fiscal 2017 Reconciliation of Net Income to Adjusted EBITDA ($ in thousands) 13 Weeks Ended 13 Weeks Ended November 26, 2016 November 28, 2015 Net Income $ 15,010 $ 59,543 Adjustments: Interest expense 106,309 106,879 Income tax (benefit) expense (8,087) 48,468 Depreciation and amortization 143,245 136,434 LIFO charge 13,750 5,986 Lease termination and impairment charges 7,265 7,011 Other (3,345) 8,845 Adjusted EBITDA $ 274,147 $ 373,166 Percent of revenues 3.39% 4.58%

Q3 - Fiscal 2017 Reconciliation of Net Income to Adjusted Net Income ($ in thousands, except per share amounts) 13 Weeks Ended 13 Weeks Ended November 26, 2016 November 28, 2015 Net Income $ 15,010 $ 59,543 Add back - Income tax (benefit) expense (8,087) 48,468 Income before income taxes 6,923 108,011 Adjustments: Amortization of EnvisionRx intangible assets 21,049 21,177 LIFO charge 13,750 5,986 Merger and acquisition-related costs 1,964 10,078 Adjusted income before income taxes $ 43,686 $ 145,252 Adjusted income tax expense 20,401 58,101 Adjusted net income $ 23,285 $ 87,151 Net income per diluted share $ 0.01 $ 0.06 Adjusted net income per diluted share $ 0.02 $ 0.08
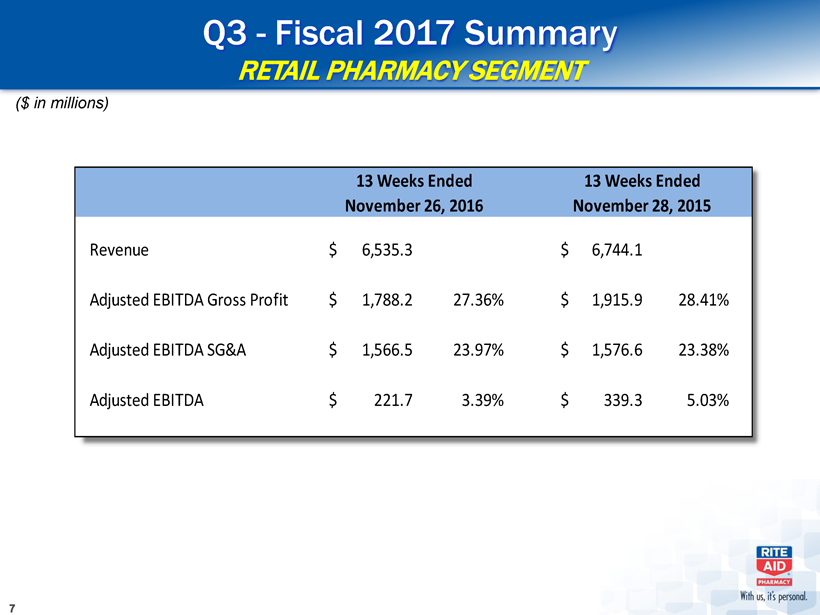
Q3 - Fiscal 2017 Summary RETAIL PHARMACY SEGMENT ($ in millions) 13 Weeks Ended 13 Weeks Ended November 26, 2016 November 28, 2015 Revenue $ 6,535.3 $ 6,744.1 Adjusted EBITDA Gross Profit $ 1,788.2 27.36% $ 1,915.9 28.41% Adjusted EBITDA SG&A $ 1,566.5 23.97% $ 1,576.6 23.38% Adjusted EBITDA $ 221.7 3.39% $ 339.3 5.03%

Q3 - Fiscal 2017 Summary RETAIL PHARMACY SEGMENT Retail Pharmacy Segment revenue decreased $208.8 million or 3.1%, driven by a 2.4% decrease in comparable script growth, a decrease in reimbursement rates and a 0.4% decrease in same store front end sales. Adjusted EBITDA Gross Profit decreased $127.7 million, and Adjusted EBITDA Gross Margin decreased by 105 bps. The decrease was driven by reductions in reimbursement rates and script volume, partially offset by an increase in front- end gross profit. Adjusted EBITDA SG&A decreased $10.1 million, but increased 59 bps as a percentage of revenues, due to our decline in revenue.

Reconciliation of Adjusted EBITDA Gross Profit RETAIL PHARMACY SEGMENT ($ in thousands) 13 Weeks Ended 13 Weeks Ended November 26, 2016 November 28, 2015 Revenues $ 6,535,274 $ 6,744,143 Gross Profit 1,791,803 1,921,886 Addback: LIFO charge 13,750 5,987 Customer loyalty card program revenue deferral (22,624) (15,683) Depreciation and amortization (COGS portion only) 4,490 3,491 Other 766 210 Adjusted EBITDA Gross Profit $ 1,788,185 $ 1,915,891 Adjusted EBITDA Gross Profit as a percent of revenue 27.36% 28.41%

Reconciliation of Adjusted EBITDA SG&A RETAIL PHARMACY SEGMENT ($ in thousands) 13 Weeks Ended 13 Weeks Ended November 26, 2016 November 28, 2015 Total Revenues $ 6,535,274 $ 6,744,143 Selling, general and administrative expenses 1,700,625 1,708,445 Less: Depreciation and amortization (SG&A portion only) 116,144 110,821 Stock based compensation expense 13,070 10,328 Other 4,940 10,663 Adjusted EBITDA SG&A $ 1,566,471 $ 1,576,633 Adjusted EBITDA SG&A as a percent of revenue 23.97% 23.38%

Pharmacy Services Segment Results ($ in millions) 13 Weeks Ended 13 Weeks Ended November 26, 2016 November 28, 2015 Revenues $ 1,645.8 $ 1,500.9 Cost of Revenues 1,542.8 1,419.9 Gross Profit 103.0 81.0 Selling, General and Administrative Expense (73.2) (69.2) Addback: Depreciation and Amortization 22.6 22.1 Adjusted EBITDA - Pharmacy Services Segment $ 52.4 $ 33.9

Q3 - FY 2017 Summary PHARMACY SERVICES SEGMENT Revenues increased $144.9 million due to the addition of lives at both Envision and MedTrak. Gross profit increased $22.0 million due the addition of lives at both Envision and MedTrak and increases in rebate income. Selling, general and administrative expenses were consistent with prior years.

Comparable Store Sales Growth FY 15 FY 16 FY 17 Q1 Q2 Q3 Q4 Q1 Q2 Q3 Q4 Q1 Q2 Q3 2.0% FRONT 1.6% END 1.1% 1.2% SALES 0.6% 0.3% 0.3% 0.1% 0.0% -0.4% -0.4% 7.2% 5.6% 5.7% RX 4.6% 3.9% SALES 2.8% 1.2% 0.1% -0.8% -3.6% -4.7% SCRIPT 4.5% COUNT 3.7% 3.5% 2.3% 1.6% 0.2% 0.2% 0.1% 0.6% -1.8% -2.4%

Wellness Store Renovations Comp results for Wellness stores continue to exceed the chain average(1) Front-end sales growth outperformance of 221 bps in Q3 of Fiscal 2017 Script count growth outperformance of 145 bps in Q3 of Fiscal 2017 Remodeled Stores Since 2012 2,322 2,042 1,634 1,215 797 274 FY 2012 FY 2013 FY 2014 FY 2015 FY 2016 FY 2017 Q3 (1) Calculation compares the comp results of Wellness stores remodeled in the last 24 months to the remainder of the chain.

Capitalization Table & Leverage ($ in thousands) November 26, 2016 February 27, 2016 Secured Debt: Senior secured revolving credit facility due January 2020 $ 2,352,708 $ 2,066,097 Tranche 1 Term Loan (second lien) due August 2020 465,504 464,586 Tranche 2 Term Loan (second lien) due June 2021 497,416 496,993 Other 90 90 3,315,718 3,027,766 Unsecured Guaranteed Debt: 9.25% senior notes due March 2020 896,011 894,563 6.75% senior notes due June 2021 803,241 802,128 6.125% senior secured notes due April 2023 1,772,865 1,769,657 3,472,117 3,466,348 Unsecured Unguaranteed Debt: 7.7% notes due February 2027 293,330 293,206 6.875% fixed-rate senior notes due December 2028 127,211 127,163 420,541 420,369 Lease financing obligations 66,534 79,653 Total Debt: 7,274,910 6,994,136 Current maturities of long-term debt and lease financing obligations (22,681) (26,848) Long-term debt and lease financing obligations, less current maturities $ 7,252,229 $ 6,967,288 Leverage Ratio: Total Debt $ 7,274,910 $ 6,994,136 Add back: Unamortized debt issuance costs 78,953 93,349 Less invested cash 18,087 14,910 $ 7,335,776 $ 7,072,575 Retail Pharmacy Segment Adjusted EBITDA (Last 12 months) $ 1,077,971 $ 1,300,905 Pharmacy Services Segment Adjusted EBITDA 177,840 155,000 $ 1,255,811 $ 1,455,905 Debt: EBITDA Leverage Ratio 5.84 4.86 Note: Debt in the capitalization table is shown net of unamortized debt issuance costs.

Debt Maturity Profile ($ in millions) Second Lien ABL Funded $5,500 ABL Unfunded Commitment $5,000 Senior Unsecured Notes Senior Unsecured (Guaranteed) Notes Callable at $905 $4,500 104.625 $4,000 $470 $3,500 $3,000 $1,320 $2,500 $2,000 $1,500 $2,380 $1,000 $810 $1,800 $500 $500 $295 $0 $128 2016 2017 2018 2019 2020 2021 2022 2023 . . . . . . 2027 2028 Maturity table as of November 26, 2016. Note: Maturities reflect calendar year.

With us, it’s personal.