Attached files
| file | filename |
|---|---|
| EX-99.1 - EX-99.1 - EQUITY BANCSHARES INC | d315275dex991.htm |
| EX-10.2 - EX-10.2 - EQUITY BANCSHARES INC | d315275dex102.htm |
| EX-10.1 - EX-10.1 - EQUITY BANCSHARES INC | d315275dex101.htm |
| 8-K - FORM 8-K - EQUITY BANCSHARES INC | d315275d8k.htm |
| Exhibit 99.2
|

EQUITY BANCSHARES, INC.
|
|
Disclaimers
FORWARD-LOOKING STATEMENTS
The following information contains “forward-looking statements within the meaning of Section 27A of the Securities Act of 1933, as amended, and Section 21E of the Securities Exchange Act of 1934, as amended. These forward-looking statements reflect the current views of Equity’s management with respect to, among other things, future events and Equity’s financial performance. These statements are often, but not always, made through the use of words or phrases such as “may,” “should,” “could,” “predict,” “potential,” “believe,” “will likely result,”
“expect,” “continue,” “will,” “anticipate,” “seek,” “estimate,” “intend,” “plan,” “project,” “forecast,” “goal,” “target,” “would” and “outlook,” or the negative variations of those words or other comparable words of a future or forward-looking nature. These forward-looking statements are not historical facts, and are based on current expectations, estimates and projections about Equity’s industry, management’s beliefs and certain assumptions made by management, many of which, by their nature, are inherently uncertain and beyond Equity’s control. Accordingly, Equity cautions you that any such forward-looking statements are not guarantees of future performance and are subject to risks, assumptions and uncertainties that are difficult to predict. Although Equity believes that the expectations reflected in these forward-looking statements are reasonable as of the date made, actual results may prove to be materially different from the results expressed or implied by the forward-looking statements. Factors that could cause actual results to differ materially from Equity’s expectations include competition from other financial institutions and bank holding companies; the effects of and changes in trade, monetary and fiscal policies and laws, including interest rate policies of the Federal Reserve Board; changes in the demand for loans; fluctuations in value of collateral and loan reserves; inflation, interest rate, market and monetary fluctuations; changes in consumer spending, borrowing and savings habits; and acquisitions and integration of acquired businesses, and similar variables. The foregoing list of factors is not exhaustive.
For discussion of these and other risks that may cause actual results to differ from expectations, please refer to “Cautionary Note Regarding Forward-Looking Statements” and “Risk Factors” in Equity’s Annual Report on Form 10-K filed with the Securities and Exchange Commission (“SEC”) on March 17, 2016 and any updates to those risk factors set forth in Equity’s subsequent Quarterly Reports on Form 10-Q or Current Reports on Form 8-K. If one or more events related to these or other risks or uncertainties materialize, or if Equity’s underlying assumptions prove to be incorrect, actual results may differ materially from what Equity anticipates. Accordingly, you should not place undue reliance on any such forward-looking statements. Any forward-looking statement speaks only as of the date on which it is made, and Equity does not undertake any obligation to publicly update or review any forward-looking statement, whether as a result of new information, future developments or otherwise. New risks and uncertainties arise from time to time, and it is not possible for us to predict those events or how they may affect us. In addition, Equity cannot assess the impact of each factor on Equity’s business or the extent to which any factor, or combination of factors, may cause actual results to differ materially from those contained in any forward-looking statements. All forward-looking statements, expressed or implied, included herein are expressly qualified in their entirety by this cautionary statement. This cautionary statement should also be considered in connection with any subsequent written or oral forward-looking statements that Equity or persons acting on Equity’s behalf may issue.
NON-GAAP FINANCIAL MEASURES
This presentation contains certain non-GAAP financial measures intended to supplement, not substitute for, comparable GAAP measures. Reconciliations of non-GAAP financial measures to GAAP financial measures are provided at the end of this presentation. Numbers in the presentation may not sum due to rounding.
2
|
|
Experienced Management Team
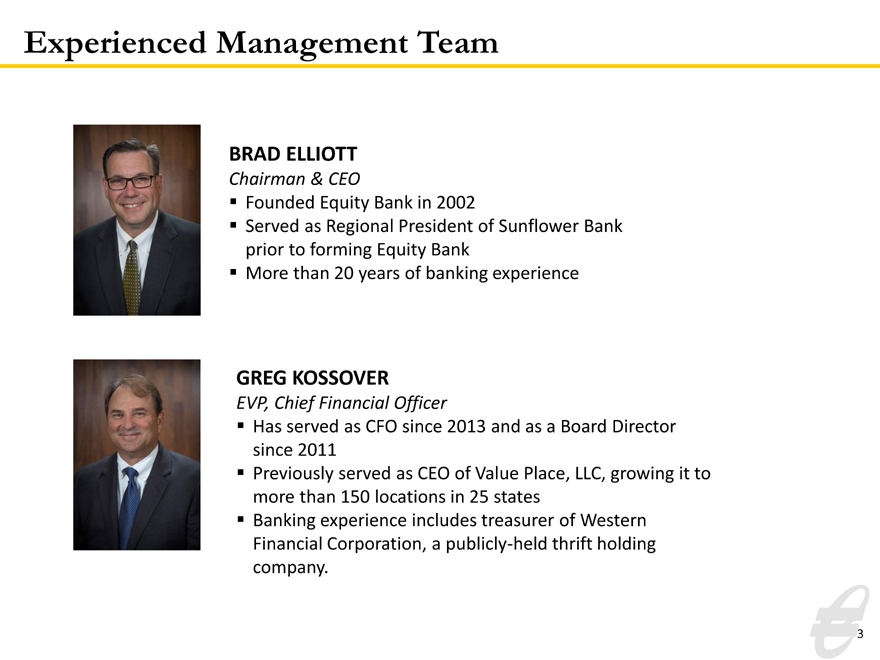
BRAD ELLIOTT
Chairman & CEO
Founded Equity Bank in 2002
Served as Regional President of Sunflower Bank prior to forming Equity Bank More than 20 years of banking experience
GREG KOSSOVER
EVP, Chief Financial Officer
Has served as CFO since 2013 and as a Board Director since 2011 Previously served as CEO of Value Place, LLC, growing it to more than 150 locations in 25 states Banking experience includes treasurer of Western Financial Corporation, a publicly-held thrift holding company.
3
|
|
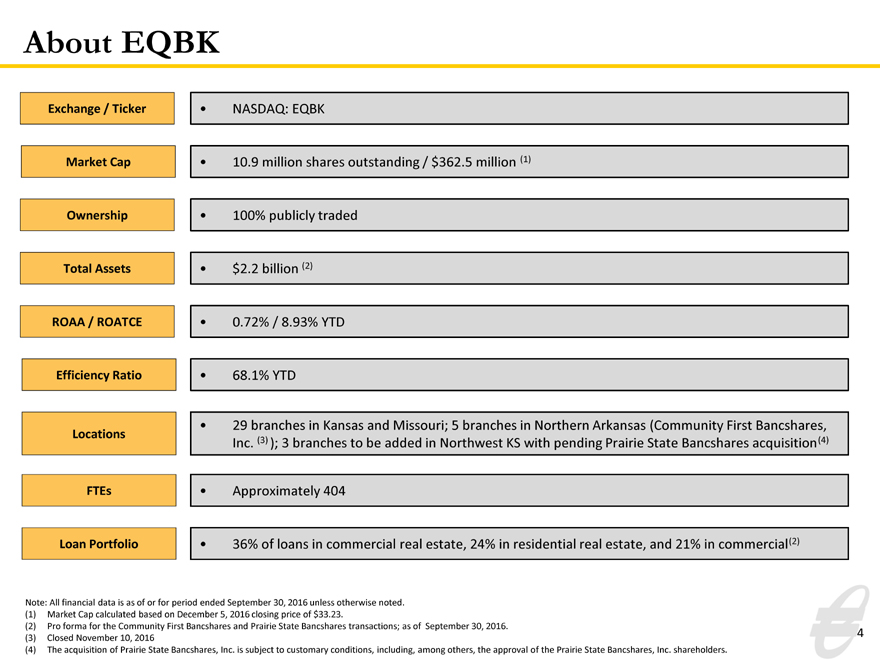
About EQBK
Exchange / Ticker NASDAQ: EQBK
Market Cap 10.9 million shares outstanding / $362.5 million (1)
Ownership 100% publicly traded
Total Assets $2.2 billion (2)
ROAA / ROATCE 0.72% / 8.93% YTD
Efficiency Ratio 68.1% YTD
29 branches in Kansas and Missouri; 5 branches in Northern Arkansas (Community First Bancshares,
Locations
Inc. (3) ); 3 branches to be added in Northwest KS with pending Prairie State Bancshares acquisition(4)
FTEs Approximately 404
Loan Portfolio 36% of loans in commercial real estate, 24% in residential real estate, and 21% in commercial(2)
Note: All financial data is as of or for period ended September 30, 2016 unless otherwise noted. (1) Market Cap calculated based on December 5, 2016 closing price of $33.23.
(2) Pro forma for the Community First Bancshares and Prairie State Bancshares transactions; as of September 30, 2016. (3) Closed November 10, 2016
(4) The acquisition of Prairie State Bancshares, Inc. is subject to customary conditions, including, among others, the approval of the Prairie State Bancshares, Inc. shareholders.
4
|
|
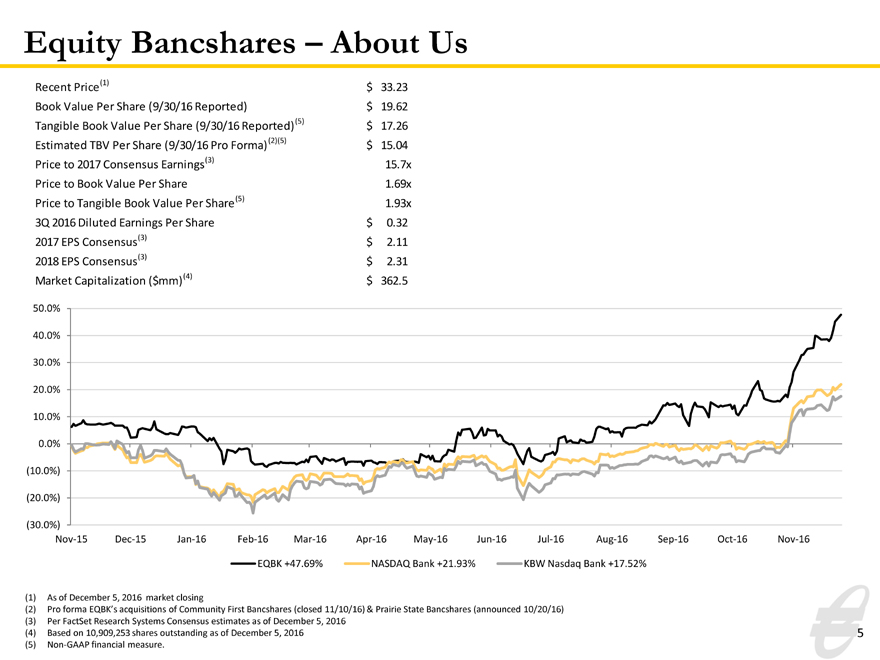
Equity Bancshares – About Us
Recent Price(1) $33.23
Book Value Per Share (9/30/16 Reported) $19.62
Tangible Book Value Per Share (9/30/16 Reported)(5) $17.26
Estimated TBV Per Share (9/30/16 Pro Forma) (2)(5) $15.04
Price to 2017 Consensus Earnings(3) 15.7x
Price to Book Value Per Share 1.69x
Price to Tangible Book Value Per Share(5) 1.93x
3Q 2016 Diluted Earnings Per Share $0.32
2017 EPS Consensus(3) $2.11
2018 EPS Consensus(3) $2.31
Market Capitalization ($mm)(4) $362.5
50.0% 40.0% 30.0% 20.0% 10.0%
0.0% (10.0%) (20.0%)
(30.0%)
Nov-15 Dec-15 Jan-16 Feb-16 Mar-16 Apr-16 May-16 Jun-16 Jul-16 Aug-16 Sep-16 Oct-16 Nov-16
EQBK +47.69% NASDAQ Bank +21.93% KBW Nasdaq Bank +17.52%
(1) As of December 5, 2016 market closing
(2) Pro forma EQBK’s acquisitions of Community First Bancshares (closed 11/10/16) & Prairie State Bancshares (announced 10/20/16)
(3) Per FactSet Research Systems Consensus estimates as of December 5, 2016
(4) Based on 10,909,253 shares outstanding as of December 5, 2016 5 (5) Non-GAAP financial measure.
5
|
|
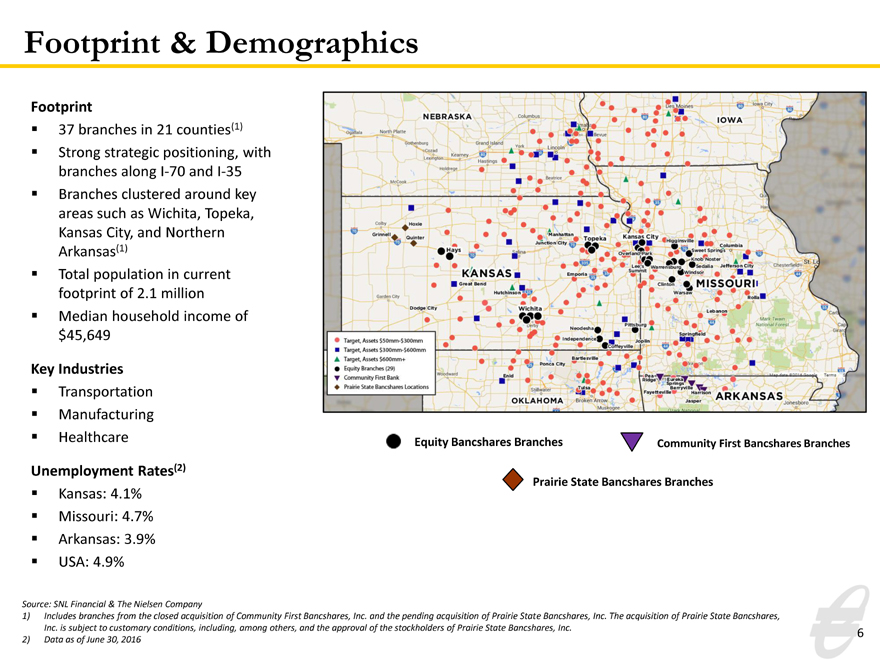
Footprint & Demographics
Footprint
37 branches in 21 counties(1)
Strong strategic positioning, with
branches along I-70 and I-35
Branches clustered around key
areas such as Wichita, Topeka,
Kansas City, and Northern
Arkansas(1)
Total population in current
footprint of 2.1 million
Median household income of
$45,649
Key Industries
Transportation
Manufacturing
Healthcare
Unemployment Rates(2)
Kansas: 4.1%
Missouri: 4.7%
Arkansas: 3.9%
USA: 4.9%
Equity Bancshares Branches Community First Bancshares Branches
Prairie State Bancshares Branches
Source: SNL Financial & The Nielsen Company
1) Includes branches from the closed acquisition of Community First Bancshares, Inc. and the pending acquisition of Prairie State Bancshares, Inc. The acquisition of Prairie State Bancshares, Inc. is subject to customary conditions, including, among others, and the approval of the stockholders of Prairie State Bancshares, Inc.
2) Data as of June 30, 2016
6
|
|
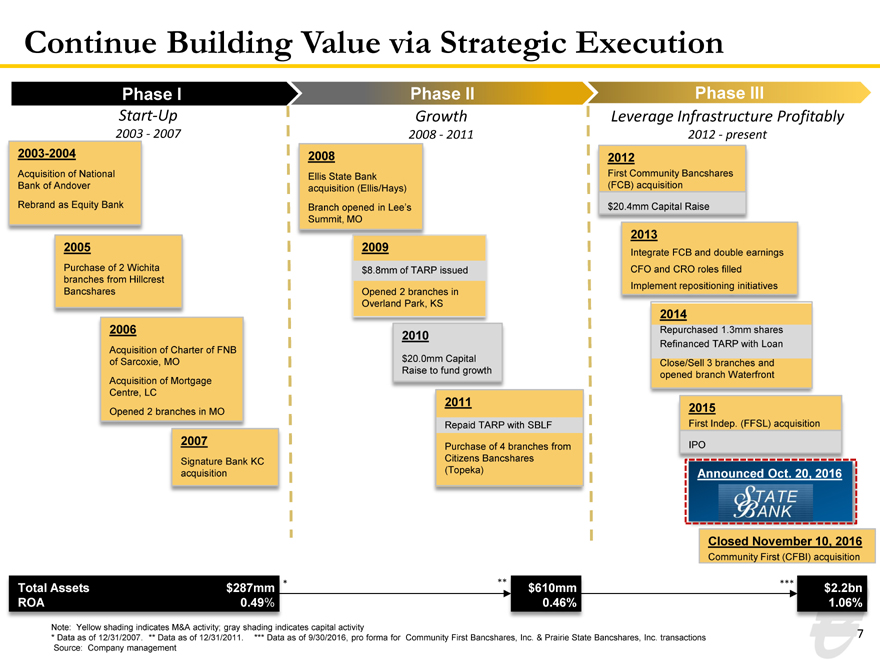
Continue Building Value via Strategic Execution
Phase I Phase II Phase III
Start-Up Growth Leverage Infrastructure Profitably
2003—2007 2008—2011 2012—present
2003-2004 2008 2012
Acquisition of National Ellis State Bank First Community Bancshares Bank of Andover acquisition (Ellis/Hays) (FCB) acquisition Rebrand as Equity Bank Branch opened in Lee’s $20.4mm Capital Raise Summit, MO
2013 2005
Integrate FCB and double earnings Purchase of 2 Wichita $8.8mm of TARP issued CFO and CRO roles filled branches from Hillcrest Implement repositioning initiatives Bancshares Opened 2 branches in Overland Park, KS
2014
2006 Repurchased 1.3mm shares
2010
Refinanced TARP with Loan Acquisition of Charter of FNB $20.0mm Capital of Sarcoxie, MO Raise to fund growth Close/Sell 3 branches and opened branch Waterfront Acquisition of Mortgage Centre, LC
Opened 2 branches in MO 2015
Repaid TARP with SBLF First Indep. (FFSL) acquisition
2007 IPO
Purchase of 4 branches from Signature Bank KC Citizens Bancshares acquisition (Topeka) Announced Oct. 20, 2016
Closed November 10, 2016
Community First (CFBI) acquisition
Total Assets $287mm * ** $610mm *** $2.2bn
ROA 0.49% 0.46% 1.06%
Note: Yellow shading indicates M&A activity; gray shading indicates capital activity
* Data as of 12/31/2007. ** Data as of 12/31/2011. *** Data as of 9/30/2016, pro forma for Community First Bancshares, Inc. & Prairie State Bancshares, Inc. transactions Source: Company management
7
|
|
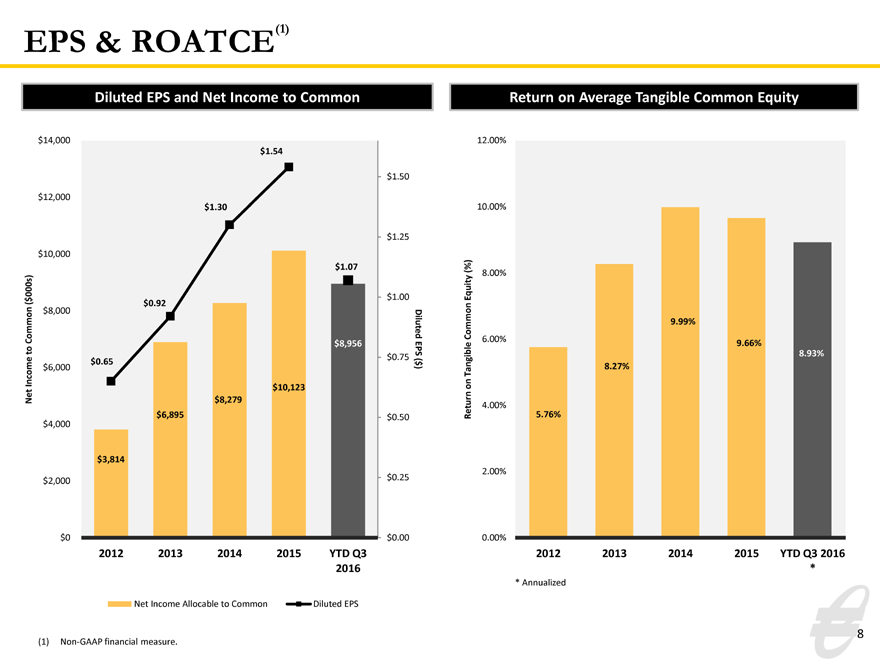
EPS & ROATCE(1)
Diluted EPS and Net Income to Common
$14,000 $1.54
$1.50
$12,000 $1.30
$1.25
$10,000 $1.07 000s) $ $1.00
( $0.92 $8,000 Diluted Common to $8,956 EPS $0.75 ( $0.65 $ Income $6,000) $10,123 Net $8,279 $6,895 $0.50 $4,000
$3,814
$2,000 $0.25
$0 $0.00
2012 2013 2014 2015 YTD Q3 2016
Net Income Allocable to Common Diluted EPS
Return on Average Tangible Common Equity
12.00%
10.00%
(%) Equity 8.00%
Common 9.99%
6.00% 9.66%
8.93% Tangible 8.27% on
4.00%
Return 5.76%
2.00%
0.00%
2012 2013 2014 2015 YTD Q3 2016 *
* Annualized
(1) Non-GAAP financial measure.
8
|
|
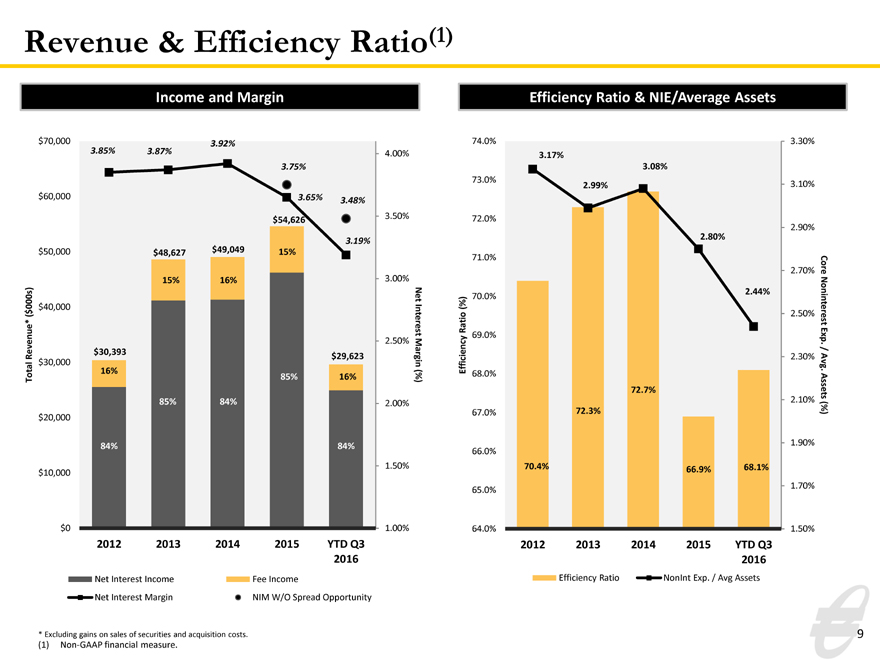
Revenue & Efficiency Ratio(1)
Income and Margin
$70,000 3.92%
3.85% 3.87% 4.00%
3.75%
$60,000 3.65%
3.48%
3.50% $54,626
3.19% $50,000 $48,627 $49,049 15%
15% 16% 3.00% Net 000s) $40,000 ( $ Interest
2.50% $30,393 Revenue* $29,623 $30,000 Margin 16% Total 85% 16% (%) 85% 84% 2.00% $20,000
84% 84%
$10,000 1.50%
$0 1.00%
2012 2013 2014 2015 YTD Q3 2016
Net Interest Income Fee Income
Net Interest Margin NIM W/O Spread Opportunity
Efficiency Ratio & NIE/Average Assets
74.0% 3.30%
3.17%
3.08%
73.0%
2.99% 3.10%
72.0%
2.90%
2.80%
71.0%
2.70% Core
2.44%
70.0%
(%)
2.50% Noninterest Ratio 69.0% Exp .
/
2.30% Avg Efficiency 68.0%.
72.7% Assets
2.10%
67.0% 72.3% (%)
1.90% 66.0%
70.4% 66.9% 68.1%
1.70% 65.0%
64.0% 1.50%
2012 2013 2014 2015 YTD Q3 2016
Efficiency Ratio NonInt Exp. / Avg Assets
* Excluding gains on sales of securities and acquisition costs.
(1) Non-GAAP financial measure.
9
|
|
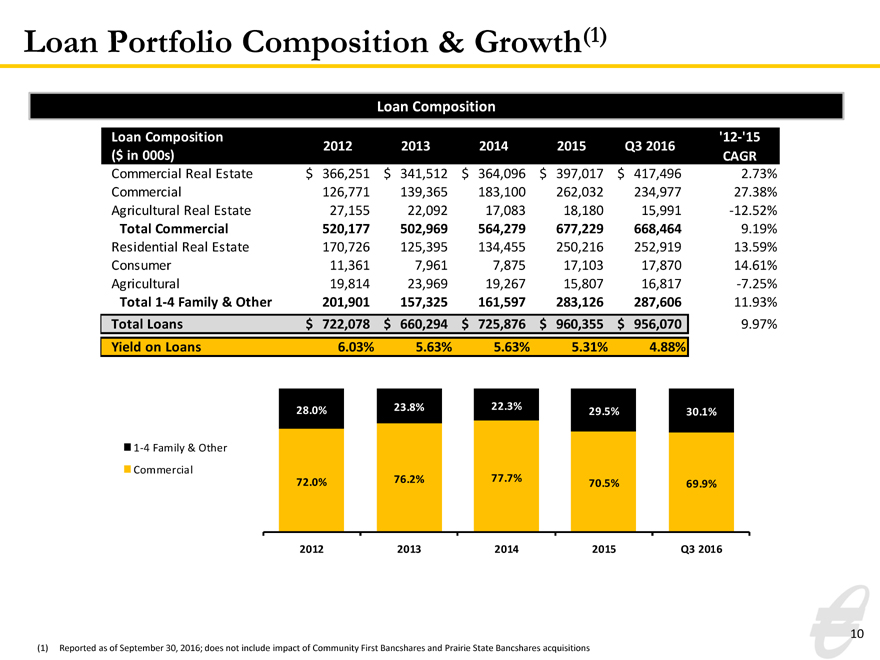
Loan Portfolio Composition & Growth(1)
Loan Composition
Loan Composition ‘12-‘15
2012201320142015Q3 2016
($ in 000s) CAGR
Commercial Real Estate $366,251$341,512$364,096$397,017$417,4962.73%
Commercial 126,771139,365183,100262,032234,97727.38%
Agricultural Real Estate 27,15522,09217,08318,18015,991-12.52%
Total Commercial 520,177502,969564,279677,229668,4649.19%
Residential Real Estate 170,726125,395134,455250,216252,91913.59%
Consumer 11,3617,9617,87517,10317,87014.61%
Agricultural 19,81423,96919,26715,80716,817-7.25%
Total 1-4 Family & Other 201,901157,325161,597283,126287,60611.93%
Total Loans $722,078$660,294$725,876$960,355$956,0709.97%
Yield on Loans 6.03%5.63%5.63%5.31%4.88%
28.0% 23.8%22.3%29.5%30.1%
1-4 Family & Other
Commercial
72.0% 76.2%77.7%70.5%69.9%
2012 201320142015Q3 2016
(1) Reported as of September 30, 2016; does not include impact of Community First Bancshares and Prairie State Bancshares acquisitions
10
|
|
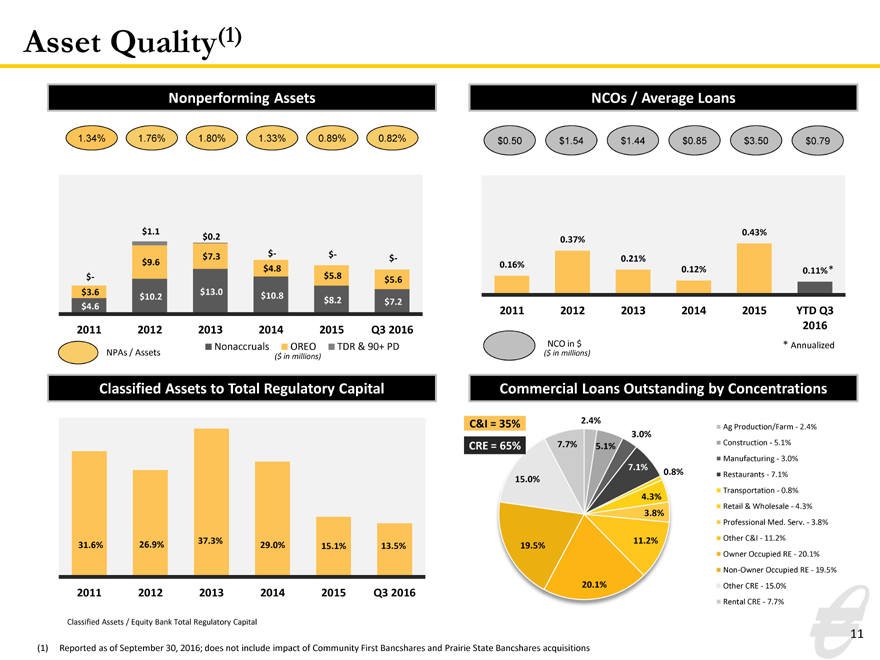
Asset Quality(1)
Nonperforming Assets
1.34% 1.76% 1.80% 1.33% 0.89% 0.82%
$1.1
$0.2
$7.3 $- $- $-
$9.6
$4.8 $5.8
$- $5.6
$3.6 $13.0 $10.2 $10.8
$8.2 $7.2
$4.6
2011 2012 2013 2014 2015 Q3 2016
Nonaccruals OREO TDR & 90+ PD
NPAs / Assets
($ in millions)
NCOs / Average Loans
$0.50 $1.54 $1.44 $0.85 $3.50 $0.79
0.37% 0.43%
0.21%
0.16%
0.12% 0.11% *
2011 2012 2013 2014 2015 YTD Q3 2016
NCO in $ * Annualized
($ in millions)
Classified Assets to Total Regulatory Capital
37.3%
31.6% 26.9% 29.0% 15.1% 13.5%
2011 2012 2013 2014 2015 Q3 2016
Classified Assets / Equity Bank Total Regulatory Capital
Commercial Loans Outstanding by Concentrations
C&I = 35% 2.4% Ag Production/Farm—2.4%
3.0%
CRE = 65% 7.7% 5.1% Construction—5.1%
Manufacturing—3.0%
7.1%
15.0% 0.8% Restaurants—7.1%
Transportation—0.8%
4.3%
3.8% Retail & Wholesale—4.3%
Professional Med. Serv.—3.8%
19.5% 11.2% Other C&I—11.2%
Owner Occupied RE—20.1%
Non-Owner Occupied RE—19.5%
20.1% Other CRE—15.0%
Rental CRE—7.7%
(1) Reported as of September 30, 2016; does not include impact of Community First Bancshares and Prairie State Bancshares acquisitions
11
|
|
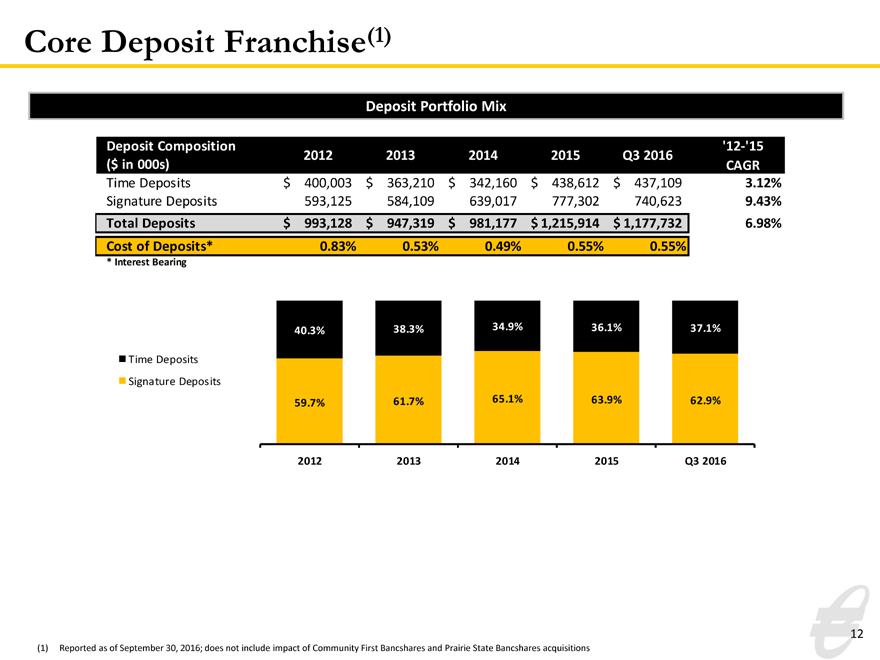
Core Deposit Franchise(1)
Deposit Portfolio Mix
Deposit Composition ’12-‘15
2012201320142015Q3 2016
($ in 000s) CAGR
Time Deposits $ 400,003$ 363,210$342,160$ 438,612$437,1093.12%
Signature Deposits 593,125584,109639,017777,302740,6239.43%
Total Deposits $ 993,128$ 947,319$981,177$ 1,215,914$1,177,7326.98%
Cost of Deposits* 0.83%0.53%0.49%0.55%0.55%
* Interest Bearing
40.3%38.3%34.9%36.1%37.1%
Time Deposits
Signature Deposits
59.7%61.7%65.1%63.9%62.9%
2012201320142015Q3 2016
(1) Reported as of September 30, 2016; does not include impact of Community First Bancshares and Prairie State Bancshares acquisitions
12
|
|
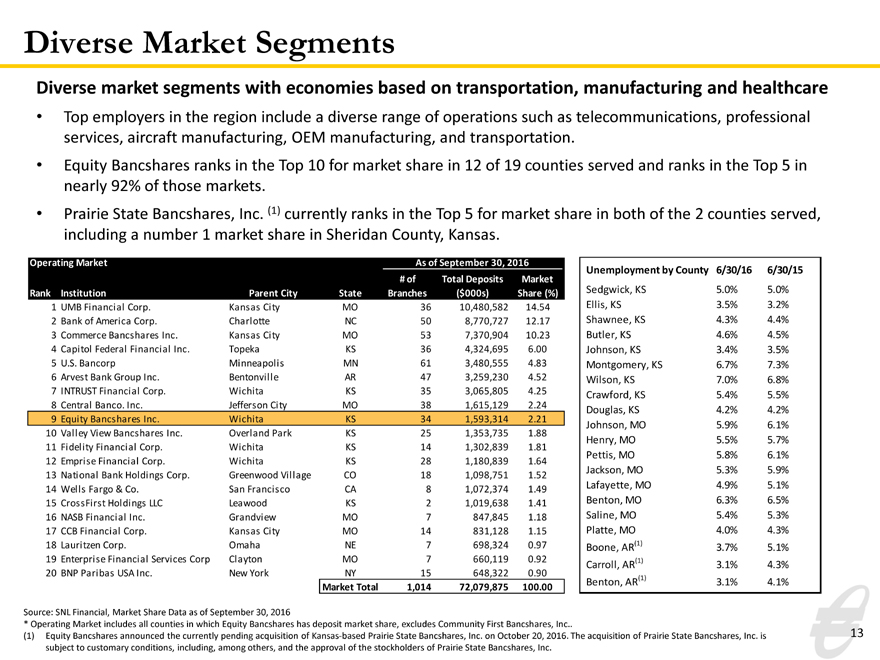
Diverse Market Segments
Diverse market segments with economies based on transportation, manufacturing and healthcare
• Top employers in the region include a diverse range of operations such as telecommunications, professional services, aircraft manufacturing, OEM manufacturing, and transportation.
• Equity Bancshares ranks in the Top 10 for market share in 12 of 19 counties served and ranks in the Top 5 in nearly 92% of those markets.
• Prairie State Bancshares, Inc. (1) currently ranks in the Top 5 for market share in both of the 2 counties served, including a number 1 market share in Sheridan County, Kansas.
Operating Market As of September 30, 2016
# ofTotal DepositsMarket
Rank Institution Parent CityStateBranches($000s)Share (%)
1 UMB Financial Corp. Kansas CityMO3610,480,58214.54
2 Bank of America Corp. CharlotteNC508,770,72712.17
3 Commerce Bancshares Inc. Kansas CityMO537,370,90410.23
4 Capitol Federal Financial Inc. TopekaKS364,324,6956.00
5 U.S. Bancorp MinneapolisMN613,480,5554.83
6 Arvest Bank Group Inc. BentonvilleAR473,259,2304.52
7 INTRUST Financial Corp. WichitaKS353,065,8054.25
8 Central Banco. Inc. Jefferson CityMO381,615,1292.24
9 Equity Bancshares Inc. WichitaKS341,593,3142.21
10 Valley View Bancshares Inc. Overland ParkKS251,353,7351.88
11 Fidelity Financial Corp. WichitaKS141,302,8391.81
12 Emprise Financial Corp. WichitaKS281,180,8391.64
13 National Bank Holdings Corp. Greenwood VillageCO181,098,7511.52
14 Wells Fargo & Co. San FranciscoCA81,072,3741.49
15 CrossFirst Holdings LLC LeawoodKS21,019,6381.41
16 NASB Financial Inc. GrandviewMO7847,8451.18
17 CCB Financial Corp. Kansas CityMO14831,1281.15
18 Lauritzen Corp. OmahaNE7698,3240.97
19 Enterprise Financial Services Corp ClaytonMO7660,1190.92
20 BNP Paribas USA Inc. New YorkNY15648,3220.90
Market Total1,01472,079,875100.00
Unemployment by County 6/30/16 6/30/15
Sedgwick, KS 5.0% 5.0%
Ellis, KS 3.5% 3.2%
Shawnee, KS 4.3% 4.4%
Butler, KS 4.6% 4.5%
Johnson, KS 3.4% 3.5%
Montgomery, KS 6.7% 7.3%
Wilson, KS 7.0% 6.8%
Crawford, KS 5.4% 5.5%
Douglas, KS 4.2% 4.2%
Johnson, MO 5.9% 6.1%
Henry, MO 5.5% 5.7%
Pettis, MO 5.8% 6.1%
Jackson, MO 5.3% 5.9%
Lafayette, MO 4.9% 5.1%
Benton, MO 6.3% 6.5%
Saline, MO 5.4% 5.3%
Platte, MO 4.0% 4.3%
Boone, AR(1) 3.7% 5.1%
Carroll, AR(1) 3.1% 4.3%
Benton, AR(1) 3.1% 4.1%
Source: SNL Financial, Market Share Data as of September 30, 2016
* Operating Market includes all counties in which Equity Bancshares has deposit market share, excludes Community First Bancshares, Inc
(1) Equity Bancshares announced the currently pending acquisition of Kansas-based Prairie State Bancshares, Inc. on October 20, 2016. The acquisition of Prairie State Bancshares, Inc. is subject to customary conditions, including, among others, and the approval of the stockholders of Prairie State Bancshares, Inc.
13
|
|
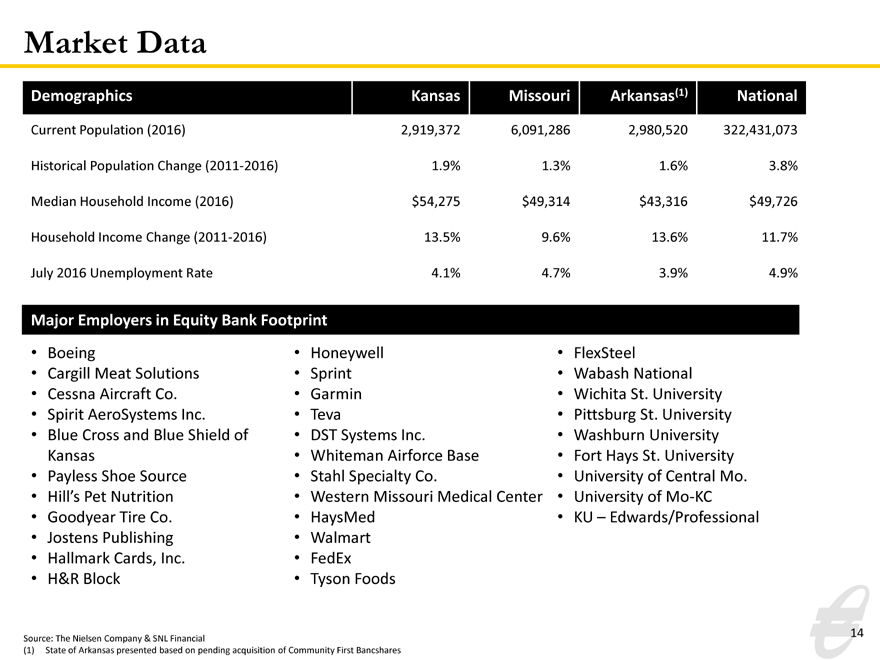
Market Data
Demographics Kansas MissouriArkansas(1)National
Current Population (2016) 2,919,372 6,091,2862,980,520322,431,073
Historical Population Change (2011-2016) 1.9% 1.3%1.6%3.8%
Median Household Income (2016) $54,275 $49,314$43,316$49,726
Household Income Change (2011-2016) 13.5% 9.6%13.6%11.7%
July 2016 Unemployment Rate 4.1% 4.7%3.9%4.9%
Major Employers in Equity Bank Footprint
• Boeing • Honeywell • FlexSteel
• Cargill Meat Solutions • Sprint • Wabash National
• Cessna Aircraft Co. • Garmin • Wichita St. University
• Spirit AeroSystems Inc. • Teva • Pittsburg St. University
• Blue Cross and Blue Shield of • DST Systems Inc. • Washburn University
Kansas • Whiteman Airforce Base • Fort Hays St. University
• Payless Shoe Source • Stahl Specialty Co. • University of Central Mo.
• Hill’s Pet Nutrition • Western Missouri Medical Center • University of Mo-KC
• Goodyear Tire Co. • HaysMed • KU – Edwards/Professional
• Jostens Publishing • Walmart
• Hallmark Cards, Inc. • FedEx
• H&R Block • Tyson Foods
Source: The Nielsen Company & SNL Financial
(1) State of Arkansas presented based on pending acquisition of Community First Bancshares
14
|
|
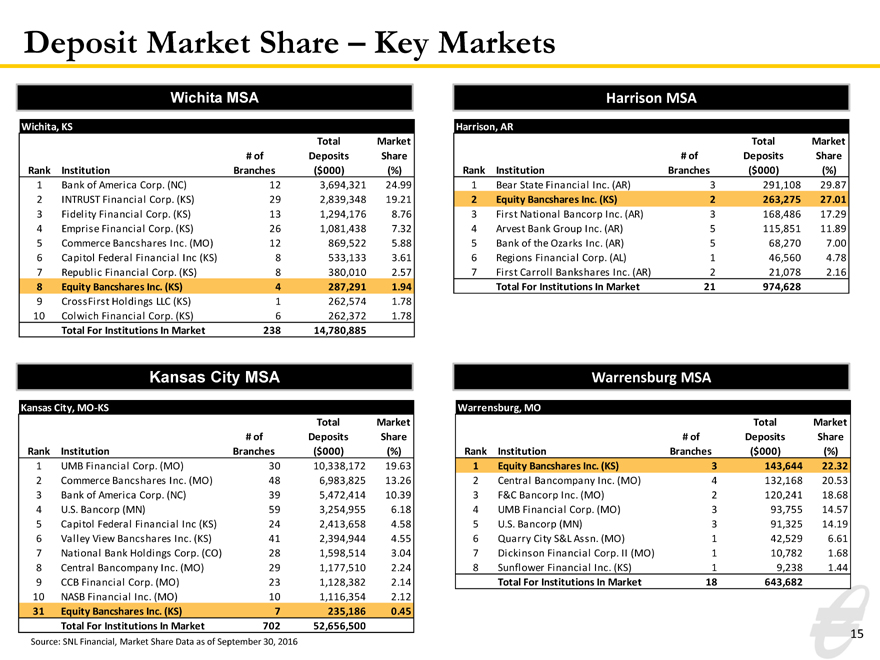
Deposit Market Share – Key Markets
Wichita MSA
Wichita, KS
TotalMarket
# ofDepositsShare
Rank Institution Branches($000)(%)
1 Bank of America Corp. (NC) 123,694,32124.99
2 INTRUST Financial Corp. (KS) 292,839,34819.21
3 Fidelity Financial Corp. (KS) 131,294,1768.76
4 Emprise Financial Corp. (KS) 261,081,4387.32
5 Commerce Bancshares Inc. (MO) 12869,5225.88
6 Capitol Federal Financial Inc (KS) 8533,1333.61
7 Republic Financial Corp. (KS) 8380,0102.57
8 Equity Bancshares Inc. (KS) 4287,2911.94
9 CrossFirst Holdings LLC (KS) 1262,5741.78
10 Colwich Financial Corp. (KS) 6262,3721.78
Total For Institutions In Market 23814,780,885
Kansas City MSA
Kansas City, MO-KS
TotalMarket
# ofDepositsShare
Rank Institution Branches($000)(%)
1 UMB Financial Corp. (MO) 3010,338,17219.63
2 Commerce Bancshares Inc. (MO) 486,983,82513.26
3 Bank of America Corp. (NC) 395,472,41410.39
4 U.S. Bancorp (MN) 593,254,9556.18
5 Capitol Federal Financial Inc (KS) 242,413,6584.58
6 Valley View Bancshares Inc. (KS) 412,394,9444.55
7 National Bank Holdings Corp. (CO) 281,598,5143.04
8 Central Bancompany Inc. (MO) 291,177,5102.24
9 CCB Financial Corp. (MO) 231,128,3822.14
10 NASB Financial Inc. (MO) 101,116,3542.12
31 Equity Bancshares Inc. (KS) 7235,1860.45
Total For Institutions In Market 70252,656,500
Source: SNL Financial, Market Share Data as of September 30, 2016
Harrison MSA
Harrison, AR
TotalMarket
# ofDepositsShare
Rank Institution Branches($000)(%)
1 Bear State Financial Inc. (AR) 3291,10829.87
2 Equity Bancshares Inc. (KS) 2263,27527.01
3 First National Bancorp Inc. (AR) 3168,48617.29
4 Arvest Bank Group Inc. (AR) 5115,85111.89
5 Bank of the Ozarks Inc. (AR) 568,2707.00
6 Regions Financial Corp. (AL) 146,5604.78
7 First Carroll Bankshares Inc. (AR) 221,0782.16
Total For Institutions In Market 21974,628
Warrensburg MSA
Warrensburg, MO
TotalMarket
# ofDepositsShare
Rank Institution Branches($000)(%)
1 Equity Bancshares Inc. (KS) 3143,64422.32
2 Central Bancompany Inc. (MO) 4132,16820.53
3 F&C Bancorp Inc. (MO) 2120,24118.68
4 UMB Financial Corp. (MO) 393,75514.57
5 U.S. Bancorp (MN) 391,32514.19
6 Quarry City S&L Assn. (MO) 142,5296.61
7 Dickinson Financial Corp. II (MO) 110,7821.68
8 Sunflower Financial Inc. (KS) 19,2381.44
Total For Institutions In Market 18643,682
15
|
|
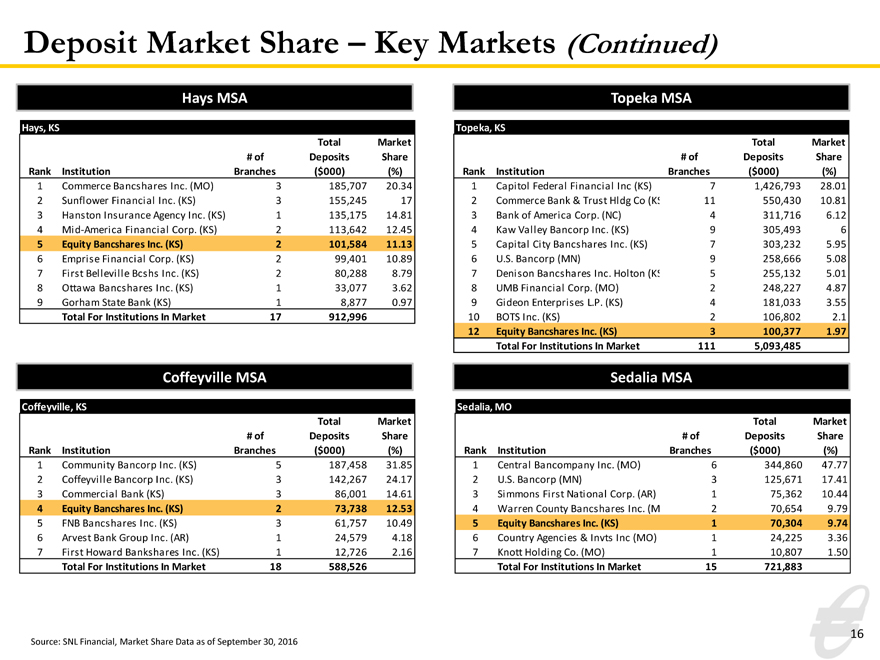
Deposit Market Share – Key Markets (Continued)
Hays MSA
Hays, KS
TotalMarket
# ofDepositsShare
Rank Institution Branches($000)(%)
1 Commerce Bancshares Inc. (MO) 3185,70720.34
2 Sunflower Financial Inc. (KS) 3155,24517
3 Hanston Insurance Agency Inc. (KS) 1135,17514.81
4 Mid-America Financial Corp. (KS) 2113,64212.45
5 Equity Bancshares Inc. (KS) 2101,58411.13
6 Emprise Financial Corp. (KS) 299,40110.89
7 First Belleville Bcshs Inc. (KS) 280,2888.79
8 Ottawa Bancshares Inc. (KS) 133,0773.62
9 Gorham State Bank (KS) 18,8770.97
Total For Institutions In Market 17912,996
Coffeyville MSA
Coffeyville, KS
TotalMarket
# ofDepositsShare
Rank Institution Branches($000)(%)
1 Community Bancorp Inc. (KS) 5187,45831.85
2 Coffeyville Bancorp Inc. (KS) 3142,26724.17
3 Commercial Bank (KS) 386,00114.61
4 Equity Bancshares Inc. (KS) 273,73812.53
5 FNB Bancshares Inc. (KS) 361,75710.49
6 Arvest Bank Group Inc. (AR) 124,5794.18
7 First Howard Bankshares Inc. (KS) 112,7262.16
Total For Institutions In Market 18588,526
Source: SNL Financial, Market Share Data as of September 30, 2016
Topeka MSA
Topeka, KS
TotalMarket
# ofDepositsShare
Rank Institution Branches($000)(%)
1 Capitol Federal Financial Inc (KS) 71,426,79328.01
2 Commerce Bank & Trust Hldg Co (K 11550,43010.81
3 Bank of America Corp. (NC) 4311,7166.12
4 Kaw Valley Bancorp Inc. (KS) 9305,4936
5 Capital City Bancshares Inc. (KS) 7303,2325.95
6 U.S. Bancorp (MN) 9258,6665.08
7 Denison Bancshares Inc. Holton (K 5255,1325.01
8 UMB Financial Corp. (MO) 2248,2274.87
9 Gideon Enterprises L.P. (KS) 4181,0333.55
10 BOTS Inc. (KS) 2106,8022.1
12 Equity Bancshares Inc. (KS) 3100,3771.97
Total For Institutions In Market 1115,093,485
Sedalia MSA
Sedalia, MO
TotalMarket
# ofDepositsShare
Rank Institution Branches($000)(%)
1 Central Bancompany Inc. (MO) 6344,86047.77
2 U.S. Bancorp (MN) 3125,67117.41
3 Simmons First National Corp. (AR) 175,36210.44
4 Warren County Bancshares Inc. (M 270,6549.79
5 Equity Bancshares Inc. (KS) 170,3049.74
6 Country Agencies & Invts Inc (MO) 124,2253.36
7 Knott Holding Co. (MO) 110,8071.50
Total For Institutions In Market 15721,883
16
|
|
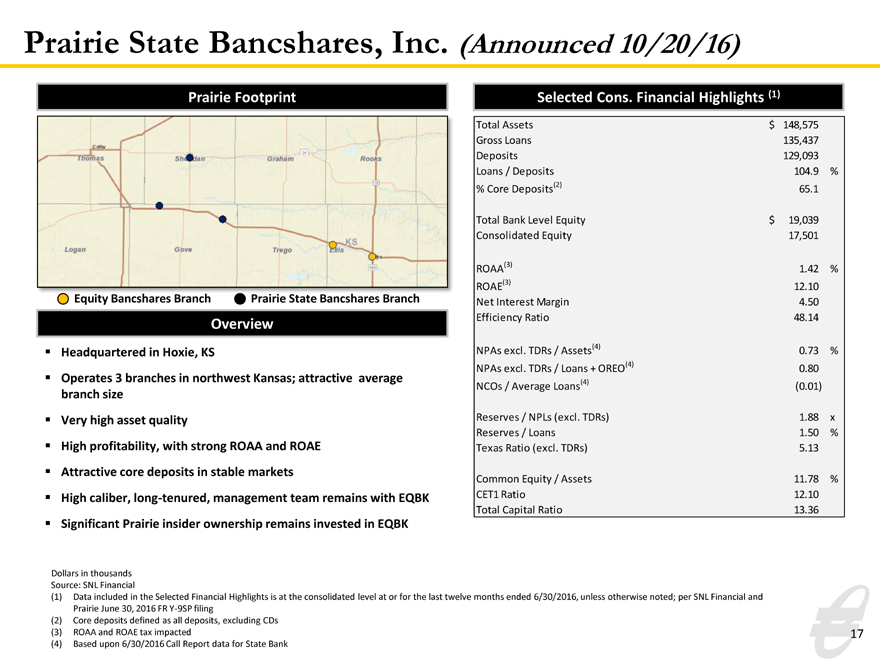
Prairie State Bancshares, Inc. (Announced 10/20/16)
Prairie Footprint
Equity Bancshares Branch Prairie State Bancshares Branch
Overview
Headquartered in Hoxie, KS
Operates 3 branches in northwest Kansas; attractive average branch size
Very high asset quality
High profitability, with strong ROAA and ROAE Attractive core deposits in stable markets
High caliber, long-tenured, management team remains with EQBK Significant Prairie insider ownership remains invested in EQBK
Dollars in thousands Source: SNL Financial
(1) Data included in the Selected Financial Highlights is at the consolidated level at or for the last twelve months ended 6/30/2016, unless otherwise noted; per SNL Financial and Prairie June 30, 2016 FR Y-9SP filing (2) Core deposits defined as all deposits, excluding CDs (3) ROAA and ROAE tax impacted (4) Based upon 6/30/2016 Call Report data for State Bank
Selected Cons. Financial Highlights (1)
Total Assets $148,575
Gross Loans 135,437
Deposits 129,093
Loans / Deposits 104.9%
% Core Deposits(2) 65.1
Total Bank Level Equity $19,039
Consolidated Equity 17,501
ROAA(3) 1.42%
ROAE(3) 12.10
Net Interest Margin 4.50
Efficiency Ratio 48.14
NPAs excl. TDRs / Assets(4) 0.73%
NPAs excl. TDRs / Loans + OREO(4) 0.80
NCOs / Average Loans(4) (0.01)
Reserves / NPLs (excl. TDRs) 1.88x
Reserves / Loans 1.50%
Texas Ratio (excl. TDRs) 5.13
Common Equity / Assets 11.78%
CET1 Ratio 12.10
Total Capital Ratio 13.36
17
|
|
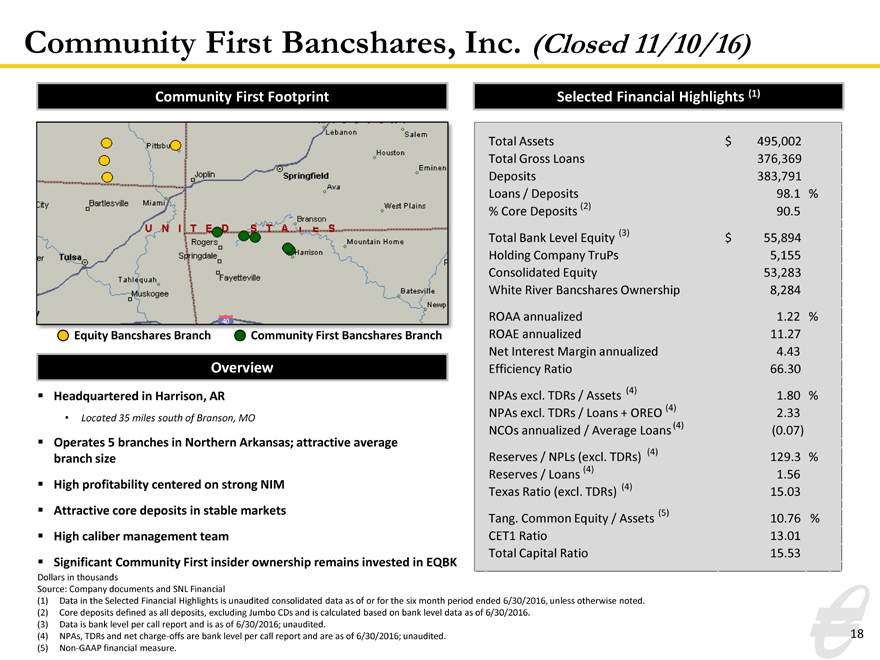
Community First Bancshares, Inc. (Closed 11/10/16)
Community First Footprint
Equity Bancshares Branch Community First Bancshares Branch
Overview
Headquartered in Harrison, AR
• Located 35 miles south of Branson, MO
Operates 5 branches in Northern Arkansas; attractive average branch size
High profitability centered on strong NIM Attractive core deposits in stable markets High caliber management team
Significant Community First insider ownership remains invested in EQBK
Dollars in thousands
Source: Company documents and SNL Financial
(1) Data in the Selected Financial Highlights is unaudited consolidated data as of or for the six month period ended 6/30/2016, unless otherwise noted. (2) Core deposits defined as all deposits, excluding Jumbo CDs and is calculated based on bank level data as of 6/30/2016.
(3) Data is bank level per call report and is as of 6/30/2016; unaudited.
(4) NPAs, TDRs and net charge-offs are bank level per call report and are as of 6/30/2016; unaudited. (5) Non-GAAP financial measure.
Selected Financial Highlights (1)
Total Assets $495,002
Total Gross Loans 376,369
Deposits 383,791
Loans / Deposits 98.1%
% Core Deposits (2) 90.5
Total Bank Level Equity (3) $55,894
Holding Company TruPs 5,155
Consolidated Equity 53,283
White River Bancshares Ownership 8,284
ROAA annualized 1.22%
ROAE annualized 11.27
Net Interest Margin annualized 4.43
Efficiency Ratio 66.30
NPAs excl. TDRs / Assets (4) 1.80%
NPAs excl. TDRs / Loans + OREO (4) 2.33
NCOs annualized / Average Loans (4) (0.07)
Reserves / NPLs (excl. TDRs) (4) 129.3%
Reserves / Loans (4) 1.56
Texas Ratio (excl. TDRs) (4) 15.03
Tang. Common Equity / Assets (5) 10.76%
CET1 Ratio 13.01
Total Capital Ratio 15.53
18
|
|
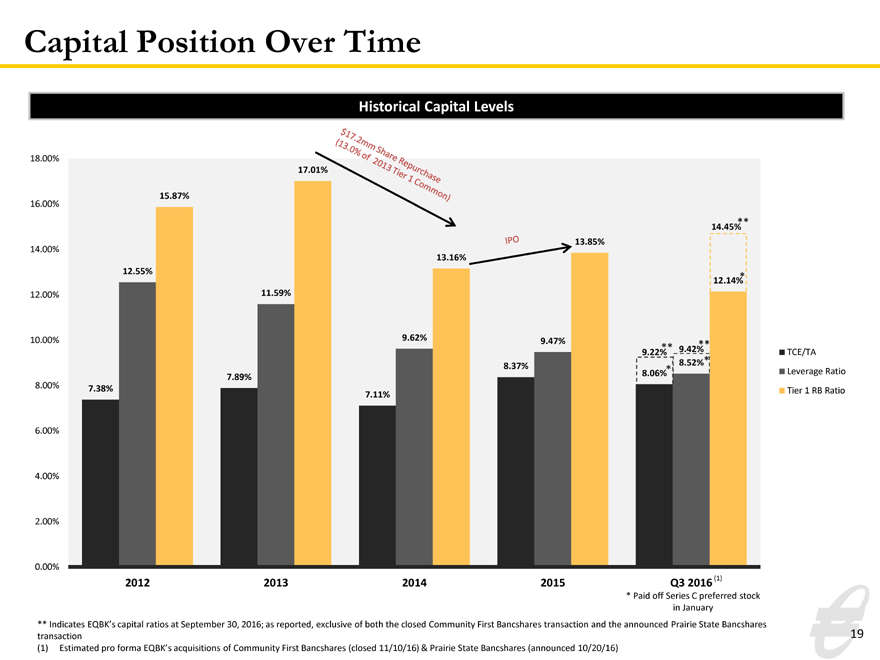
Capital Position Over Time
Historical Capital Levels
18.00%
17.01%
15.87%
16.00%
**
14.45%
14.00% 13.85%
13.16%
12.55%
12.14% *
12.00% 11.59%
10.00% 9.62% 9.47%
** **
9.22% 9.42% TCE/TA 8.52%* 8.37% *
8.06% Leverage Ratio
7.89%
8.00% 7.38%
Tier 1 RB Ratio
7.11%
6.00% 4.00% 2.00%
0.00%
2012 2013 2014 2015 Q3 2016(1)
* Paid off Series C preferred stock in January
** Indicates EQBK’s capital ratios at September 30, 2016; as reported, exclusive of both the closed Community First Bancshares transaction and the announced Prairie State Bancshares 19 transaction
(1) Estimated pro forma EQBK’s acquisitions of Community First Bancshares (closed 11/10/16) & Prairie State Bancshares (announced 10/20/16)
|
|
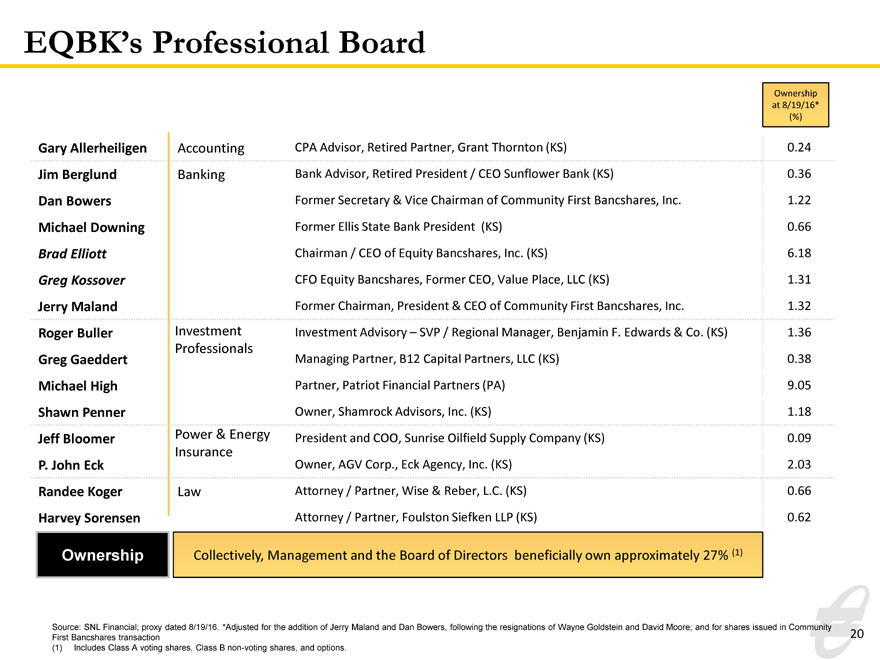
EQBK’s Professional Board
Ownership
at 8/19/16*
(%)
Gary Allerheiligen Accounting CPA Advisor, Retired Partner, Grant Thornton (KS)0.24
Jim Berglund Banking Bank Advisor, Retired President / CEO Sunflower Bank (KS)0.36
Dan Bowers Former Secretary & Vice Chairman of Community First Bancshares, Inc.1.22
Michael Downing Former Ellis State Bank President (KS)0.66
Brad Elliott Chairman / CEO of Equity Bancshares, Inc. (KS)6.18
Greg Kossover CFO Equity Bancshares, Former CEO, Value Place, LLC (KS)1.31
Jerry Maland Former Chairman, President & CEO of Community First Bancshares, Inc.1.32
Roger Buller Investment Investment Advisory – SVP / Regional Manager, Benjamin F. Edwards & Co. (KS)1.36
Professionals
Greg Gaeddert Managing Partner, B12 Capital Partners, LLC (KS)0.38
Michael High Partner, Patriot Financial Partners (PA)9.05
Shawn Penner Owner, Shamrock Advisors, Inc. (KS)1.18
Jeff Bloomer Power & Energy President and COO, Sunrise Oilfield Supply Company (KS)0.09
Insurance
P. John Eck Owner, AGV Corp., Eck Agency, Inc. (KS)2.03
Randee Koger Law Attorney / Partner, Wise & Reber, L.C. (KS)0.66
Harvey Sorensen Attorney / Partner, Foulston Siefken LLP (KS)0.62
Ownership Collectively, Management and the Board of Directors beneficially own approximately 27% (1)
Source: SNL Financial; proxy dated 8/19/16. *Adjusted for the addition of Jerry Maland and Dan Bowers, following the resignations of Wayne Goldstein and David Moore; and for shares issued in Community First Bancshares transaction (1) Includes Class A voting shares, Class B non-voting shares, and options.
20
|
|
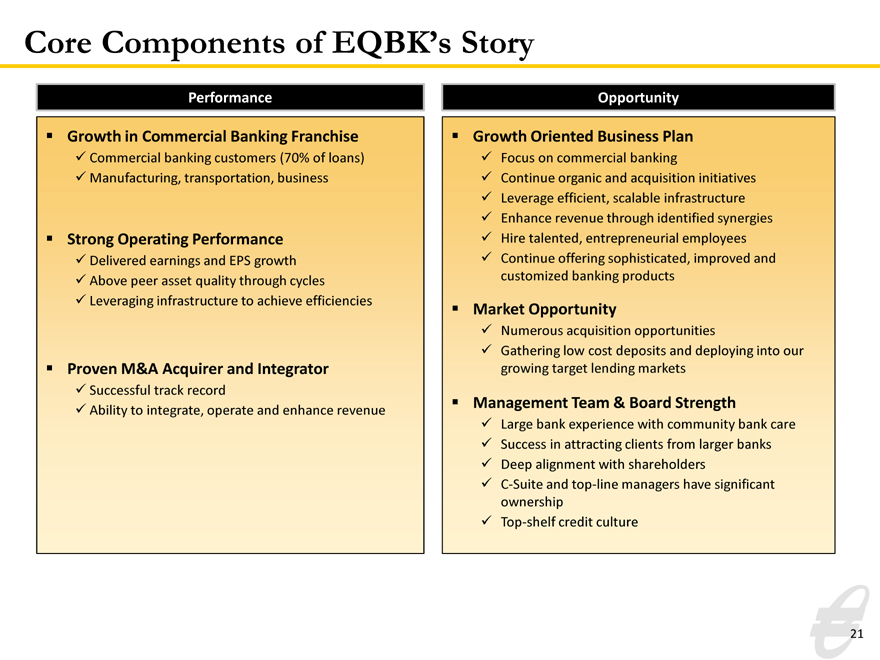
Core Components of EQBK’s Story
Performance
Growth in Commercial Banking Franchise
Commercial banking customers (70% of loans) Manufacturing, transportation, business
Strong Operating Performance
Delivered earnings and EPS growth Above peer asset quality through cycles Leveraging infrastructure to achieve efficiencies
Proven M&A Acquirer and Integrator
Successful track record
Ability to integrate, operate and enhance revenue
Opportunity
Growth Oriented Business Plan
Focus on commercial banking
Continue organic and acquisition initiatives Leverage efficient, scalable infrastructure Enhance revenue through identified synergies Hire talented, entrepreneurial employees Continue offering sophisticated, improved and customized banking products
Market Opportunity
Numerous acquisition opportunities
Gathering low cost deposits and deploying into our growing target lending markets
Management Team & Board Strength
Large bank experience with community bank care
Success in attracting clients from larger banks Deep alignment with shareholders C-Suite and top-line managers have significant ownership Top-shelf credit culture
21