Attached files
| file | filename |
|---|---|
| EX-23.2 - EX-23.2 - Kleopatra Holdings 2 S.C.A. | d447312dex232.htm |
| EX-23.1 - EX-23.1 - Kleopatra Holdings 2 S.C.A. | d447312dex231.htm |
Table of Contents
As filed with the Securities and Exchange Commission on December 21, 2016
No. 333-
UNITED STATES
SECURITIES AND EXCHANGE COMMISSION
Washington, D.C. 20549
FORM S-1
REGISTRATION STATEMENT
UNDER
THE SECURITIES ACT OF 1933
KLEOPATRA HOLDINGS 2 S.C.A.*
(Exact name of registrant as specified in its charter)
| Luxembourg (prior to migration) Delaware (after migration) |
3081 | N/A | ||
| (State or other jurisdiction of incorporation or organization) |
(Primary Standard Industrial Classification Code Number) |
(I.R.S. Employer Identification No.) |
46A, Avenue J.F. Kennedy
L-1855 Luxembourg
(+352) 26 428-1
(Address, including zip code, and telephone number, including area code, of registrant’s principal executive offices)
Robert B. Lence, Esq.
General Counsel
187 Danbury Road
Wilton, Connecticut 06897
(203) 423-4219
(Name, address, including zip code, and telephone number, including area code, of agent for service)
With copies to:
| Joshua N. Korff, P.C. William Burke Brian Hecht Kirkland & Ellis LLP 601 Lexington Avenue New York, New York 10022 (212) 446-4800 |
Richard Alsop Shearman & Sterling LLP 599 Lexington Avenue New York, New York 10022 (212) 848-4000 |
Approximate date of commencement of proposed sale to the public: As soon as practicable after this Registration Statement becomes effective.
If any of the securities being registered on this Form are to be offered on a delayed or continuous basis pursuant to Rule 415 under the Securities Act of 1933, check the following box: ☐
If this Form is filed to registered additional securities for an offering pursuant to Rule 462(b) under the Securities Act, please check the following box and list the Securities Act registration statement number of the earlier effective registration statement for the same offering. ☐
If this Form is a post-effective amendment filed pursuant to Rule 462(c) under the Securities Act, check the following box and list the Securities Act registration statement number of the earlier effective registration statement for the same offering. ☐
If this Form is a post-effective amendment filed pursuant to Rule 462(d) under the Securities Act, check the following box and list the Securities Act registration statement number of the earlier effective registration statement for the same offering. ☐
Indicate by check mark whether the registrant is a large accelerated filer, an accelerated filer, a non-accelerated filer, or a smaller reporting company. See the definitions of “large accelerated filer,” “accelerated filer” and “smaller reporting company” in Rule 12b-2 of the Exchange Act. (Check one):
| Large accelerated filer | ☐ | Accelerated filer | ☐ | |||
| Non-accelerated filer | ☒ (Do not check if a smaller reporting company) | Smaller reporting company | ☐ |
CALCULATION OF REGISTRATION FEE
|
| ||||
| Title of Each Class of Securities to be Registered |
Proposed Maximum Aggregate Offering Price (1)(2) |
Amount of Registration Fee | ||
| Common Stock, $0.001 par value per share |
$100,000,000 | $11,590 | ||
|
| ||||
|
| ||||
| (1) | Estimated solely for the purpose of calculating the registration fee pursuant to Rule 457(o) promulgated under the Securities Act of 1933, as amended. |
| (2) | Includes the offering price of any additional shares of common stock that the underwriters have the option to purchase. |
The registrant hereby amends this Registration Statement on such date or dates as may be necessary to delay its effective date until the registrant shall file a further amendment which specifically states that this Registration Statement shall thereafter become effective in accordance with Section 8(a) of the Securities Act of 1933 or until this Registration Statement shall become effective on such date as the Commission, acting pursuant to said Section 8(a), may determine.
| * | Prior to the completion of this offering contemplated hereby, the registrant will migrate to Delaware and continue to exist as a Delaware corporation by deregistering in Luxembourg and registering by way of continuation in Delaware and, in connection therewith, will change its corporate name to Klöckner Pentaplast Inc. |
Table of Contents
The information in this preliminary prospectus is not complete and may be changed. These securities may not be sold until the registration statement filed with the Securities and Exchange Commission is effective. This preliminary prospectus is not an offer to sell nor does it seek an offer to buy these securities in any jurisdiction where the offer or sale is not permitted.
Subject to Completion. Dated December 21, 2016
PRELIMINARY PROSPECTUS
Shares

KLEOPATRA HOLDINGS 2 S.C.A.
(to be renamed Klöckner Pentaplast Inc.)
Common Stock
This is the initial public offering of shares of common stock of Kleopatra Holdings 2 S.C.A. (to be renamed Klöckner Pentaplast Inc.). We are offering shares of our common stock in this offering.
Prior to this offering, there has been no public market for our common stock. It is currently estimated that the initial public offering price per share will be between $ and $ . We intend to list the common stock on the New York Stock Exchange under the symbol “KP.”
After the completion of this offering, we expect to be a “controlled company” within the meaning of the corporate governance standards of the New York Stock Exchange. See “Principal Stockholders” and “Management.”
See “Risk Factors” on page 21 to read about factors you should consider before buying shares of our common stock.
Neither the Securities and Exchange Commission nor any other regulatory body has approved or disapproved of these securities or passed upon the accuracy or adequacy of this prospectus. Any representation to the contrary is a criminal offense.
| Per Share |
Total | |||||||
| Initial public offering price |
$ | $ | ||||||
| Underwriting discount |
$ | $ | ||||||
| Proceeds, before expenses, to us |
$ | $ | ||||||
To the extent that the underwriters sell more than shares of common stock, the underwriters have the option to purchase up to an additional shares from us at the initial price to the public less the underwriting discount.
The underwriters expect to deliver the shares against payment in New York, New York on , .
| Citigroup | Credit Suisse | Goldman, Sachs & Co. | ||
| BofA Merrill Lynch | Baird |
Jefferies |
Prospectus dated , .
Table of Contents
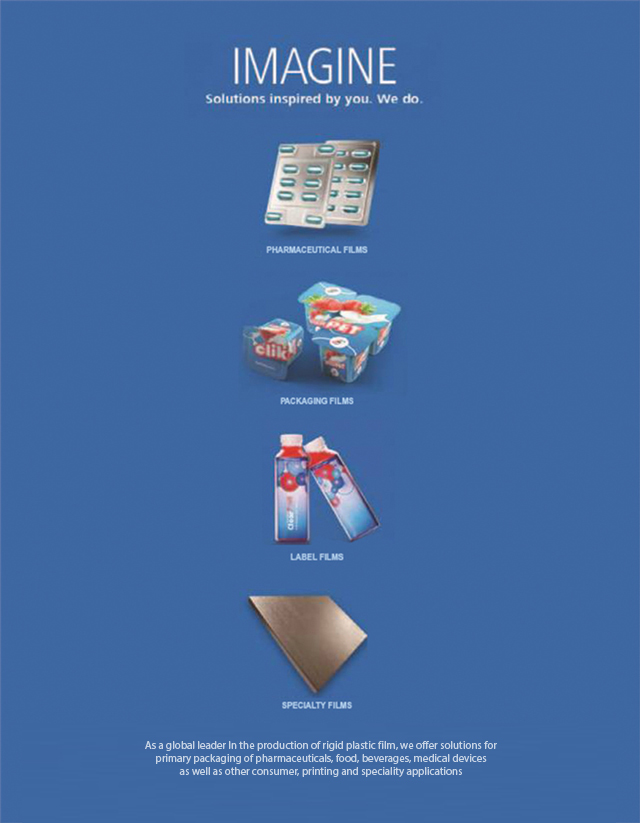
Table of Contents
Prospectus
| Page | ||||
| 1 | ||||
| 21 | ||||
| 43 | ||||
| 45 | ||||
| 46 | ||||
| 47 | ||||
| 48 | ||||
| 50 | ||||
| MANAGEMENT’S DISCUSSION AND ANALYSIS OF FINANCIAL CONDITION AND RESULTS OF OPERATIONS |
51 | |||
| 80 | ||||
| 98 | ||||
| 101 | ||||
| 106 | ||||
| 116 | ||||
| 118 | ||||
| 120 | ||||
| 124 | ||||
| 128 | ||||
| CERTAIN U.S. FEDERAL INCOME AND ESTATE TAX CONSIDERATIONS FOR NON-U.S. HOLDERS |
130 | |||
| 134 | ||||
| 140 | ||||
| 140 | ||||
| 140 | ||||
| F-1 | ||||
Through and including , (the 25th day after the date of this prospectus), all dealers effecting transactions in these securities, whether or not participating in this offering, may be required to deliver a prospectus. This is in addition to a dealer’s obligation to deliver a prospectus when acting as an underwriter and with respect to an unsold allotment or subscription.
We have not and the underwriters have not authorized anyone to provide you with any information other than that contained in this prospectus or in any free writing prospectus prepared by or on behalf of us or to which we have referred you. We are offering to sell, and seeking offers to buy, shares of our common stock only in jurisdictions where such offers and sales are permitted. The information in this prospectus or any free writing prospectus is accurate only as of its date, regardless of its time of delivery or the time of any sale of shares of our common stock. Our business, financial condition, results of operations and prospects may have changed since that date.
i
Table of Contents
MARKET, RANKING AND OTHER INDUSTRY DATA
This prospectus includes market share and industry information, which was obtained by us from industry publications, surveys and industry reports prepared by consultants, internal surveys and customer feedback. The market share and industry information sourced from third parties, which is used throughout this prospectus, has been accurately reproduced and, as far as we are aware and are able to ascertain from information published by relevant third parties, no facts have been omitted that would render the reproduced information inaccurate or misleading. These third party sources include information published by Smithers Information Ltd (“Smithers Pira”). We have also used data obtained from IHS Inc. (“CMAI Global/IHS”), formerly Chemical Market Associates, Inc. The aforementioned third party sources generally state that the information they contain has been obtained from sources believed to be reliable. However, these third party sources also state that the accuracy and completeness of such information is not guaranteed and that the projections they contain are based on significant assumptions. As we do not have access to the facts and assumptions underlying such market data, statistical information and economic indicators contained in these third party sources, we are unable to verify such information and cannot guarantee its accuracy or completeness. We also do not have access to the facts and assumptions underlying the projections made in these reports and various economic and other factors may cause actual results to differ from these projections.
In addition, certain information in this prospectus is not based on published data obtained from independent third parties, or extrapolations thereof, but are information and statements reflecting our best estimates based upon information obtained from trade and business organizations and associations, consultants and other contacts within the industries in which we operate, as well as information published by our competitors. Such information is based on the following: (i) in respect of our market position, information obtained from trade and business organizations and associations and other contacts within the industries in which we compete; (ii) in respect of industry trends, our senior management team’s business experience and experience in the industry and the local markets in which we operate; and (iii) in respect of the performance of our operations, our internal analysis of our own audited and unaudited information. We cannot assure you that any of the assumptions that we have made in compiling this data are accurate or correctly reflect our position in our markets.
TRADEMARKS, SERVICE MARKS AND TRADE NAMES
We own the trademarks, service marks and trade names that we use in connection with the operation of our business. Our trademarks include “Klöckner Pentaplast,” “Pentafood,” “Pentalabel,” “Pentapharm,” “BlisterPro,” “clikPET” and “kp i.center,” among others. Overall, we have 47 different trademarks. This prospectus may also contain trademarks, service marks, trade names and copyrights of other companies, which are the property of their respective owners. Solely for convenience, the trademarks, service marks, trade names and copyrights referred to in this prospectus are listed without the TM, SM, © and ® symbols, but we will assert, to the fullest extent under applicable law, our rights or the rights of the applicable licensors, if any, to these trademarks, service marks, trade names and copyrights.
ii
Table of Contents
The following summary highlights information appearing elsewhere in this prospectus. This summary does not contain all of the information you should consider before investing in our common stock. You should read this entire prospectus carefully. In particular, you should read the sections entitled “Risk Factors” and “Management’s Discussion and Analysis of Financial Condition and Results of Operations” and the consolidated financial statements and the notes relating to those statements included elsewhere in this prospectus. Some of the statements in this prospectus constitute forward-looking statements. See “Forward-Looking Statements.” Unless the context requires otherwise, references to the “Company,” “we,” “our” or “us” refer to Kleopatra Holdings 2 S.C.A. (or following its migration and continued existence in Delaware, Klöckner Pentaplast Inc.), the issuer of the common stock offered hereby and its consolidated subsidiaries, and the “Issuer” refers to Kleopatra Holdings 2 S.C.A. (or following its migration and continued existence in Delaware, Klöckner Pentaplast Inc.) alone. References to “fiscal” refer to our fiscal year ending September 30 of that year.
Company Overview
We are the leading global provider in the rigid plastic film industry with highly complementary capabilities in semi-rigid and flexible films used in packaging and other protective film applications. Our primary end-markets include pharmaceutical, medical devices, and food and beverage, as well as applications for other consumer and industrial products. We sell a wide range of custom rigid plastic films, including many proprietary solutions, which we believe provide mission-critical safety and security functions and enhance performance or drive end-user pull-through on the shelf. We have established ourselves as a leading supplier of rigid plastic films in the value chain for packaging, label and surface protection, among others, due to our expertise in compounding, formulation, calendering, extrusion, surface treatment and converting. We believe we are the leader in many of our end-markets, with approximately 75% of our fiscal 2016 net sales from end-markets where we hold a top 3 market position.
Within the markets we serve, we have one of the broadest product portfolios across a variety of polymers. Our manufacturing footprint across North America, South America, Europe and Asia Pacific allows us to serve our customers locally, offering customized solutions while maintaining the highest production standards. Starting with over 250 base formulations, we have created more than 4,800 customer-driven formulations. In fiscal 2016 alone we completed more than 1,400 formulation changes, of which over 350 were on single customer requests. The application of value-added secondary processes has resulted in a product suite of more than 17,000 SKUs. The size and scope of our existing material science capabilities allow us to remain a leader of innovation in the industry and meet and exceed the unique requirements of our customers for highly technical applications.
Our material science expertise relates to polyvinyl chloride (“PVC”) and polyethylene terephthalate (“PET”), which are two of the most important polymers in the rigid film industry. We complement our rigid film capabilities with semi-rigid and flexible films, manufactured from other polymers such as polyolefin (“PP”) and polystyrene (“PS”).
We are able to innovate and differentiate our products through our long-standing (50+ year history) technical expertise and know-how in developing formulations and customized products to meet customer needs. Our films are developed in close collaboration with our customers to meet their specific performance requirements to preserve, protect or otherwise enhance the value of their products and their manufacturing productivity. Typically, our products represent less than 5% of our customers’ total product cost.
We serve customers through four market-oriented segments: Pharma, Food & Consumer Packaging, Labels and Specialties. Our core end-markets have varying, yet complementary growth drivers and are generally non-cyclical in nature. In our Pharma segment, we benefit from the increasing need for innovative packaging
1
Table of Contents
solutions, the aging global population and increasing generic penetration. In our Labels segment, the drive to enhance and differentiate the look and appearance of consumer products has led to increased demand for the more vibrant and flexible packaging capabilities provided by shrink sleeve films. In addition to end-market specific drivers, we expect to benefit from positive macro trends such as a growing middle class in emerging markets and increasing spending on consumer and healthcare products.
We have a diverse mix of approximately 3,700 customers ranging from multinational companies to mid-size regional and local specialty companies. We enjoy long-term relationships with our customers and continue to serve 96% of our top 50 customers from 2012. In addition, each of our top 10 customers has been a customer for over 10 years, and no single customer represented more than 4% of fiscal 2016 revenue.
We believe that we are the only rigid plastic film manufacturer with a global operating platform complemented by local capabilities, evidenced by our 19 manufacturing facilities across North America, South America, Europe and Asia Pacific. As of September 30, 2016, including the Farmamak Acquisition (as described below), we had approximately 600,000 tons of capacity for calendering and extruding and approximately 110,000 additional tons of capacity for secondary processes such as laminating and coating. Our manufacturing footprint is supported by a global network of technical innovation engineers developing solutions in partnership with our commercial sales organization. Our global presence, capabilities and scale help ensure consistency and certainty of supply of our products.
We are led by our CEO, Wayne Hewett, formerly President and CEO of Arysta LifeScience, and CFO, R. Brent Jones, formerly interim CFO of Pall Corporation. We do business in approximately 80 countries worldwide, and our long tenured and well trained workforce of approximately 3,600 associates has an average tenure of more than a decade at the Company.
For fiscal 2016, net sales were $1,403 million, net loss was $11.6 million and Adjusted EBITDA was $242.9. Excluding the impact of foreign currency translation, net sales decreased by 0.5% and Adjusted EBITDA increased by 5.3%. For fiscal 2016, net cash provided by operating activities was $116.8 million and Adjusted Free Cash Flow was $86.4 million. For a reconciliation of Adjusted EBITDA and Adjusted Free Cash Flow to the closest comparable GAAP measures, see “—Summary Historical Consolidated Financial and Other Data.”
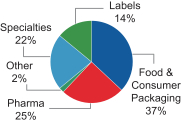
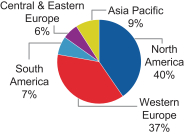
The charts below illustrate the breakdown of our net sales by segment and geography in fiscal 2016:
| Fiscal 2016 Net Sales Breakdown | ||
| Net Sales by Segment |
Net Sales by Geography | |
|
|
| |
Our Products and Innovations
Our product portfolio includes diverse packaging film solutions such as rigid barrier films, shrink sleeve films for labels and specialty niche films for decorative surfaces, gift cards and other specialty printing and label
2
Table of Contents
applications. Our products play an integral role in the customer value chain by enhancing product graphics and protecting product integrity, food safety, UV protection, consumer health and, ultimately, brand reputation. For example, our specially formulated films for the pharmaceutical industry adhere to strict regulatory requirements set by the U.S. Food & Drug Administration (the “FDA”) and protect products against moisture, gas (e.g., oxygen) and UV rays, enabling maximum product efficacy and increased shelf life. Similarly, our highly engineered label films allow customers to cover the entire body of their product with high-resolution graphics and vibrant color, increasing product appeal while at the same time providing enhanced product protection through tamper evident features.
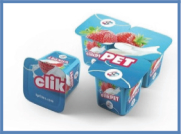
We believe our experience in the rigid films industry positions us to drive growth through our strong product innovation platform. Recent product launches include clikPET, an innovative yogurt packaging film that extends product shelf life, reduces waste and increases product convenience, and Luxury Vinyl Tile films, which deliver superior durability and wear resistance. We are building on the momentum from recent innovation successes by increasing our investment in research and development capabilities. In 2015, we opened our first kp i.center, a new front-end facility, to strengthen co-creation and collaboration with suppliers and customers. The kp i.center was created to decrease time-to-market and increase our hit-rate for new product innovations. We have also grown our Research & Development team to approximately 80 people as of December 7, 2016. In addition to creating new product formulations, our innovation team also supports customers seeking regulatory approval in high-value areas such as pharma and certain food applications, as well as improving product appearance in consumer products.
| Recent Innovations | ||
| clikPET |
Luxury Vinyl Tile films | |
|
|
| |

Our Differentiated Business Model
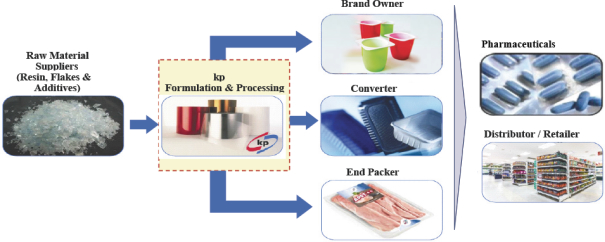
We manufacture rigid film from raw materials (e.g., resin, flakes and additives) and sell our products directly to brand owners and end packers, or to other companies for conversion into packaging or other products in accordance with customers’ and end-user specifications. Our sales to converters are often guided by our relationships with the ultimate brand owners who specify that converters use our film for the end products they manufacture.
3
Table of Contents
| kp Value Chain Overview |
|
|
|
|
Manufacturing
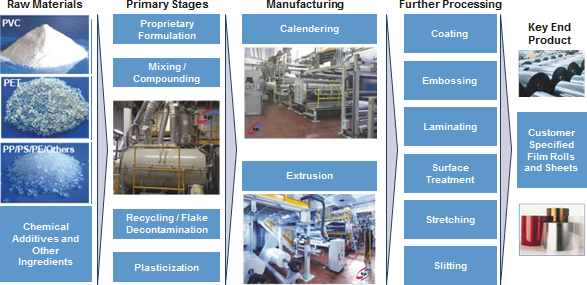
Nearly all of our film formulations are developed in-house. We believe our ability to create bespoke, customized film solutions is a key differentiator in the markets we serve. Our core production processes consist of calendering and extruding polymers, adding chemical additives as necessary and further processing to customer specifications. Our process includes complex mixing of various raw materials and ingredients to produce homogenous products. Calendering and extrusion are industrial scale processes to manufacture rigid plastic film using different types of polymers formulated to deliver various performance benefits. Our products are further customized to fit customer specifications through late stage differentiation techniques, as illustrated in the diagram below.
| Manufacturing Process Overview |
|
|
4
Table of Contents
Sales
We have a dedicated commercial team of approximately 340 associates, organized by our segments, across North America, Europe, Asia Pacific and South America. Our sales force works closely with our customers to create value added product solutions and to service our customers based on quality, timeliness of delivery and steadiness of supply. Our sales force is supported by a team of approximately 80 research and development personnel who we believe provide industry-leading support services directly to our customers. Our technical support team lowers overall costs for our customers by maximizing our customers’ machine uptime, throughput and yield. We believe our sales force and technical support teams are key differentiators of our “go-to-market” strategy.
5
Table of Contents
Segments
Our business operates through four segments: Pharma, Food & Consumer Packaging, Labels and Specialties. Each segment has a dedicated commercial and innovation team aligned by market to promote greater sales force effectiveness and customer focus.
| End-Market Overview | ||||||||
| Pharma |
Food & Consumer |
Labels |
Specialties | |||||
| % of our Fiscal 2016 Net Sales |
• 25% |
• 37% |
• 14% |
• 22% | ||||
| Est. Market Growth | • 3-5% |
• 2-3% |
• 4-6% |
• 2-5% | ||||
| Applications | • Pharmaceuticals
• Medical devices |
• Food
• Dairy
• Consumer Products
|
• Bottles
• Bottle Caps
• Batteries |
• Decorative surfaces
• Card films (e.g. gift and ID)
• Stationery films
• Industrial & Construction | ||||
| Key Growth Drivers |
• Aging population in developed markets
• Drug safety/integrity
• Evolution of packaging solutions to extend product shelf life
• Expanding generic drug market
• Growing middle class in emerging markets
• Increase in capsule-based applications |
• Increased penetration of pre-packaged foods
• Increased food safety requirements
• Innovative packaging alternatives driven by market demand
• Secular trend to single serving and smaller food packs
• Millennial consumption habits (snacking)
• Strong growth in select sub- segments (yogurts) |
• Label conversion towards high margin shrink sleeve market
• Increasing demand for smart labels for safety and product tracking
• Shrink film continues to displace traditional flexible label alternatives
• Introduction of new polymer (polyolefin) |
• Diverse blend of global market exposures
• Attractive niche applications with superior performance characteristics relative to existing technology
• Surface protection for high value goods (flooring)
• Gift cards and ID card products expected to further proliferate worldwide | ||||
| Select Product Images |
|
|
|
| ||||
Pharma
We manufacture an extensive range of pharmaceutical packaging rigid films, including multi-layer barrier films for blister packaging as well as mono-layer barrier and multi-layer polymer films for sterile packaging of
6
Table of Contents
medical devices, such as surgical tools. As a result of strict regulatory specifications, our products and processes are required to be certified by various regulatory authorities, such as the FDA, as part of the initial drug approval process and are typically included in the drug master file. With an average overall certification process length of 6 to 12 months, we believe that these production requirements, along with our scale in the global market, create a significant competitive advantage.
Food & Consumer Packaging
Our Food & Consumer Packaging product portfolio consists mainly of mono-layer and multi-layer rigid films based on a wide variety of polymers. We produce films used in the packaging of fresh and pre-prepared foods, including sandwiches, salads, pasta, meat, cheese and fish. Our films are designed to provide heat resistance and specialized barrier properties to protect against moisture and oxygen and to improve the appearance, appeal and shelf life of packaged food products. Our rigid plastic films are also used by our global customers in a broad range of other packaging applications, including packaging for electronic components, cosmetics, household goods, personal care and lighting products.
Labels
We offer a broad range of label products for customers in the beverage and electronic battery end-markets. Our films are used for bottle wrap labels, tamper resistant closures, wine bottle capsules and battery wraps. With full color photographic images that wrap 360 degrees around containers, our customized products enhance the shelf appeal and marketability of the end product. In addition, our products can enhance the performance and functionality of the end product (such as UV protection in the case of full body shrink labels). We continue to introduce new products and build additional capacity to support this segment, with a focus on performance, differentiation and recyclability.
Specialties
We actively manage a portfolio of distinctive application solutions that require a high level of technical collaboration with our customers. For example, we produce a full portfolio of core and overlay films for specific card applications (such as gift cards). These solutions need to provide extended durability, increased security and greater design flexibility. Our film solutions for decorative flooring were developed in response to customer needs for wear resistance and superior durability in luxury vinyl tiles. Other application solutions apply to areas such as specialized printing and other decorative surfaces.
Industry and End-Markets
The packaging industry encompasses a wide variety of materials (plastic, glass, metal and paper) and applications (food and beverage, consumer, industrial and pharmaceutical). We estimate that the current size of the overall global packaging industry exceeds $850 billion, growing at approximately 3% annually.
We primarily operate within the approximately $190 billion rigid plastic packaging segment of the wider packaging market, with complementary applications in attractive semi-rigid and flexible films for products such as shrink sleeve labels. According to Smithers Pira, the rigid plastic market, which includes rigid plastic films, is expected to grow between 2015 and 2020 at an approximately 4% compound annual growth rate (“CAGR”), which is above the global packaging industry. Growth in the rigid plastic market is driven by numerous factors which include increasing demand for light weight, re-sealable, convenient and portable packaging. The expanded market for packaged food in retail outlets is also driving increased demand for on-the-go packaging solutions, highly decorative and eye-catching packaging. Finally, the focus on food and drug safety and sustainability, with
7
Table of Contents
demographic changes through an aging and urbanizing population, is creating additional demand for our products, which is being further driven by the increasing need for innovation and customization through more complex packaging applications on a global scale.
| Global Rigid Plastics Industry (million tons) |
|
|
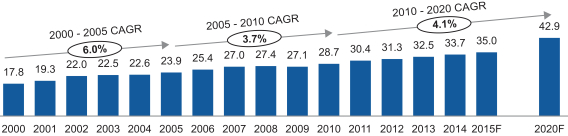
Source: Smithers Pira
Packaged goods utilizing PET and PVC, our primary base polymers, have seen consistent and stable growth in our largest developed markets. PET growth is expected to outpace PVC growth modestly as a result of selected areas of industry migration towards PET. Within developing economies, demand growth for PET-based and PVC-based packaging products is expected to grow at higher rates as the middle class grows and overall consumption of related goods increases. In our core end-markets, we expect volume growth in Pharma and Labels will outpace the broader global rigid plastics industry with growth rates of 3% to 5% and 4% to 6%, respectively, while Food & Consumer Packaging and Specialties are more likely to see volume growth of 2% to 5% annually, on average.
As a large global producer of rigid plastic films, we believe we hold a top 3 position in the majority of our end-markets across Europe and the Americas. We estimate that we are more than double the size of our nearest global competitor in terms of volume supplied. Our key competitors tend to focus on films based on a specific polymer, either PET or PVC, as well as specific end-markets.
We believe that we are the global leader in the PVC market. Our competitors that focus on PVC include Bilcare, Nan Ya, Tekni-Plex, Alfatherm and Perlen. While the PET market is more fragmented than the PVC market, over the last decade, we have established ourselves as a global leader in PET applications as well. Key competitors in the PET market include Octal and Hagner.
8
Table of Contents
We believe we enjoy market leading positions across a majority of our products across the end-markets and geographies we serve.
| Western Europe | North America | South America | ||||||
| Pharma | Mono | #1 | #1 | #1 | ||||
| Barrier | Top 3 | #1 | #1 | |||||
| Medical Devices | Top 3 | Top 3 | — | |||||
| Food & Consumer Packaging |
Multi-Layer | #1 | — | — | ||||
| Mono-Layer | Top 3 | Top 3 | Top 3 | |||||
| PP/PS | — | — | — | |||||
| Labels | Shrink Sleeve | Top 3 | Top 3 | — | ||||
| Roll Sleeve | Top 3 | #1 | — | |||||
| Battery | #1 | #1 | — | |||||
| Specialties | Cards | #1 | #1 | — | ||||
| Decorative Surfaces | Top 3 | — | — | |||||
| Tape | #1 | — | — |
Our Competitive Strengths
Market Leading Positions Across Key Geographies and End-Markets
We are the global leader in the rigid plastic film industry with highly complementary capabilities in semi-rigid and flexible films. Our market leadership is a function of our technical and material science capabilities, which allow us to provide customized solutions and services to customers. With $1.4 billion of net sales in fiscal 2016, we have 19 production sites servicing customers in approximately 80 countries and capacity of approximately 600,000 tons, we believe we are substantially larger than our nearest competitors in PVC and PET. We are the only rigid film manufacturer with in-house sales and manufacturing capabilities across North America, South America, Europe and Asia Pacific. We believe approximately 75% of our net sales comes from end-markets where we are a top 3 market leader.
Growing, Resilient End-Markets with Strong Secular Growth Drivers
We continue to benefit from a trend of increasing demand for rigid packaging in our segments. According to Smithers Pira, the rigid packaging market has experienced growth in 14 of the last 15 years. Currently, Smithers Pira projects that the market will grow at a CAGR of approximately 4% through 2020. Our business further benefits from trends in our core Pharma and Food & Consumer Packaging markets, in particular toward conversion from other packaging types to rigid film. Our success in capitalizing on this growing demand is a function of our ability to anticipate changing consumer preferences, such as trends towards light weighting, sustainability, smaller, more affordable and convenient product sizes and smart and aesthetically-pleasing packaging.
While organized as four segments, we operate in a number of distinct end-markets with varying yet complementary growth drivers. Our end-markets are generally non-cyclical in nature, and include pharmaceuticals, medical devices, food and beverage, fresh dairy, batteries, gift cards, decorative flooring, specialty printing and other consumer and industrial product categories. Our geographic footprint and end-market diversification has led to increased resilience, improved stability and limited cyclicality in our business.
9
Table of Contents
Leading Technical Expertise and Material Science Capabilities
Over our 50+ year history, we have developed industry-leading technical, manufacturing and material science capabilities that allow us to provide our customers with a broad range of proprietary film formulations, product solutions and services.
We have over 250 base formulations developed in-house through in-depth knowledge of chemistry and material interactions, and differentiated secondary processes of coating, embossing and laminating, which we use to create bespoke products for our customers, providing protection, durability, clarity and color, among other things. This unique expertise is evidenced through our product portfolio of more than 17,000 SKUs. Our manufacturing operations comply with the required regulatory certifications, and all of our sites and clean rooms are ISO 9001-14001 certified and approved by various food and drug agencies, such as the FDA and European Medicines Agency. These certifications are particularly important as we are a key supplier to the pharmaceutical and food end-markets.
Product quality, innovation, regulatory and customer certifications, delivery time and degree of customization create significant competitive advantages that we believe help us drive growth and profitability in our business.
Commitment to Innovation
We believe that we are an innovator and process leader in the rigid plastic films industry, and our business has historically benefitted from a strong technology platform. Our technological leadership is the result of our operational and engineering experience that we have built up over the past 50+ years, embedded process knowledge, product development efforts and efficient machinery base, a significant portion of which we custom engineer in-house.
To enhance our innovation efforts, within our 80 person Research and Development team we have (i) created a dedicated innovation team of approximately 40 associates and a VP of Innovation; (ii) hired dedicated product development directors for each segment; (iii) created a Chief Engineering Officer position; (iv) partnered with universities to bolster ongoing product development; and (v) opened a kp i.center for our Pharma segment. We believe these additional capabilities will enable us to maintain our competitive advantage as an innovation leader and drive growth throughout the organization.
Longstanding Relationships with a Diverse Global Customer Base
Our ability to provide bespoke products, meeting our customers’ stringent qualifications, has led to sticky and long-term relationships with a diverse customer base. Each of our top 10 customers has been our customer for over 10 years. Since 2012, we have retained 96% of our top 50 customers. In addition, we believe that we maintain the majority of most of our key customers’ wallet share.
Track Record of Growth and Cash Flow Generation
Excluding the impact of foreign currency translation, we have delivered consistent Adjusted EBITDA growth and margin improvement, which has translated into significant Adjusted Free Cash Flow generation and value creation for our stockholders. Over the past 4 years, our Adjusted EBITDA has increased at a CAGR of 2.5% and Adjusted EBITDA margins have increased by approximately 270 bps. Over the same period and excluding the impact of foreign currency translation, our Adjusted EBITDA has increased at a CAGR of 8.1% and Adjusted EBITDA margins have increased by 250 bps. In addition, our net loss went from $75.4 million for fiscal 2013 to $11.6 million for fiscal 2016. In our last three fiscal years, 2014 to 2016, we have successfully
10
Table of Contents
achieved operational and procurement savings of nearly $125 million, offsetting inflationary pressures while allowing us to continuously expand margins. In our operations, we have enhanced yields in our manufacturing process, lowered customer complaints, increased usage of non-virgin materials and optimized our operational headcount. In our procurement function, we have standardized our operations to drive savings and achieved additional indirect cost savings.
While growing our Adjusted EBITDA and expanding our margins, we have also demonstrated an ability to generate significant discretionary cash flow, with Adjusted Free Cash Flow of $86.4 million in fiscal 2016. This robust Adjusted Free Cash Flow enables us to make disciplined investments in organic growth initiatives and M&A. Our near-term capital expenditure projects have a high return threshold of over 20% internal rate of return and are primarily investments in capacity where we are operating at utilization of 90% or higher. For a reconciliation of Adjusted EBITDA and Adjusted Free Cash Flow to the closest comparable GAAP measures, see “—Summary Historical Consolidated Financial and Other Data.”
Proven Management Team Supported by a Long Tenured Production Team
We have a strong management team that has significant experience from blue chip, publicly listed, best-in-class global organizations. The company is led by our CEO and CFO. Our CEO, Wayne Hewett, who joined kp in September 2015, was formerly the President and CEO of Arysta LifeScience and led GE Momentive Performance Materials, and our CFO, R. Brent Jones, was formerly interim CFO of Pall Corporation. Our senior team is complemented by organizational continuity through a long tenured production team with deep process knowledge and on average over a decade of experience.
Our Strategies
We seek to continue to take advantage of our competitive strengths by pursuing the following business strategies to drive growth, expand our margins and generate significant Adjusted Free Cash Flow.
Enhance Commercial Initiatives to Grow Core Business
We have enjoyed significant continuity with our customers for many years. We believe we can expand these relationships by proactively marketing our full suite of solutions and addressing unmet customer needs. We believe there is additional volume upside from current customers through targeted actions and investments including key account management (“KAM”) (with a goal to increasing customer penetration), customer relations management (“CRM”) (realigned business units with dedicated sales teams equipped with enhanced technology tools and sales applications) and increased customer service personnel. We expect to continue to invest in and grow our sales team in order to support these initiatives.
Our current initiatives to accelerate further volume growth with both current and new customers include (i) a realignment of our salesforce by end-market to better understand customer needs, allowing us to prepare specific, tailored solutions; (ii) an increase in the size of our already industry-leading sales force, of approximately 340 sales and support employees by hiring approximately 20 additional sales staff; and (iii) changes in our sales force compensation with an increase in the variable component to focus on new customer wins and increased wallet share.
Accelerate Innovation in Response to Customer Needs
We have increased our focus on innovation in recent years in an effort to collaborate with and provide better solutions for our customers. We believe we can further drive net sales and Adjusted EBITDA growth through products originated in our stage-gate innovation process (i.e., products that are not yet in commercial
11
Table of Contents
production). We intend to open additional kp i.centers to continue to develop platforms in order to work with suppliers, customers and others in our ecosystem, such as universities, to develop new products and address the ongoing challenges our customers face.
Drive Continuous Operational Improvement
We believe we have established a solid framework based on Lean Six Sigma methodology to continuously improve our operational efficiency and effectiveness and offset the impact of inflation. Through this framework, we believe we can increase material efficiency, reduce procurement costs and improve quality.
In addition, we are reorganizing our people and processes into a global supply chain designed to take better advantage of scale in procurement and to shorten lead times, resulting in lower raw material costs and improved customer service.
Invest for Growth
We intend to make targeted investments to accelerate growth with attractive returns on capital. Our growth investments will be focused on (i) expansion of existing facilities such that we can take advantage of opportunities in our current markets; (ii) greenfield facilities that allow us to capitalize on regional demand where we do not have existing facilities or where we operate at or near optimal utilization; and (iii) investments in manufacturing equipment that continue to drive operational efficiencies within our manufacturing infrastructure.
Pursue Pipeline of Attractive Bolt-On M&A
In addition to our organic growth initiatives, we plan to pursue select M&A opportunities. We have a long history of M&A with over 20 acquisitions over our 50+ year history. We believe we are a natural consolidator in the fragmented rigid films industry and have demonstrated the ability to successfully integrate acquisitions and realize synergies. Our IT infrastructure and standardized global processes provide a stable environment to incorporate future acquisitions into our system. We believe that we have a clear acquisition strategy in place, targeting bolt-on acquisitions with significant synergies to drive long-term value creation for stockholders. To execute on our strategy, we have established an M&A-focused team to drive our strategic agenda following a recent period of internally-focused initiatives.
We intend to apply selective and disciplined acquisition criteria focused on: (i) acquisitions that consolidate our existing markets; (ii) acquisitions that offer geographic expansion in our existing business lines; (iii) acquisitions in attractive adjacencies, including licensing rights agreements; and (iv) acquisitions of new technologies, innovations or game-changing products. As part of this strategic agenda, we recently announced the acquisition of Farmamak, improving our market presence in Turkey and throughout the Middle East and enhancing our service capabilities in the region.
We believe that our track record of net sales growth and disciplined capital spending will enable us to generate excess Adjusted Free Cash Flow that can be re-deployed through accretive acquisitions that strengthen our core businesses and grow our company on a global basis.
Recent Developments
On October 31, 2016, we acquired Farmamak Ambalaj Maddeleri ve Ambalaj Makineleri Sanayi ve Tic. A.S. (“Farmamak”), a leading solutions provider for packaging solutions in the Turkish and European markets (the “Farmamak Acquisition”). Farmamak, located near Istanbul, Turkey, has approximately 55,000 tons of capacity across seven extrusion lines for PET, PP & PS as well as three PVC calender lines. Farmamak has multi-layer, lamination and metallization capabilities.
12
Table of Contents
In connection with the Farmamak Acquisition, we entered into an amendment to our existing credit agreement (the “First Amendment”), which provides for, among other things, an incremental term loan in an aggregate principal amount of €85 million. The proceeds from the incremental term loan were used, in part, to fund the Farmamak Acquisition, with the remainder to be used for working capital and general corporate purposes. For further information regarding our credit agreement and the incremental term loan, see “Description of Certain Indebtedness—Senior Secured Credit Facilities.”
Equity Sponsor
Strategic Value Partners, LLC (“SVPGlobal”) is a deep-value investment firm which was established in 2001 by Victor Khosla, with assets of approximately $4.9 billion across a hedge fund strategy and private equity vehicles. SVPGlobal has about 100 employees, including approximately 35 investment professionals, across its main offices in Greenwich (CT), London, Frankfurt and Tokyo. Its focus is on deep-value opportunities where it typically takes an active role in transactions. The team has also developed domain expertise in a select number of industries including infrastructure, power and industrials. SVPGlobal’s significant presence outside of the US as well as the extensive restructuring and operating experience of its professionals further support the firm’s investment approach and strategy.
Controlled Company
Following the consummation of this offering, approximately % of our outstanding common stock will be beneficially owned by Kleopatra Holdings 1 S.C.A. (“Kleopatra Holdings 1”), which is controlled by affiliates of SVPGlobal (or approximately % if the underwriters exercise their option to purchase additional shares in full). As a result, we will be a “controlled company” within the meaning of New York Stock Exchange corporate governance rules. For a discussion of the applicable limitations and risks that may result from our status as a controlled company, see “Risk Factors—Risks Related to this Offering and Ownership of Our Common Stock—Following the offering, we will be classified as a “controlled company” and, as a result, we will qualify for, and intend to rely on, exemptions from certain corporate governance requirements. You will not have the same protections afforded to stockholders of companies that are subject to such requirements.”
Risk Factors
An investment in our common stock involves a high degree of risk. Any of the factors set forth under “Risk Factors” may limit our ability to successfully execute our business strategy. You should carefully consider all of the information set forth in this prospectus and, in particular, should evaluate the specific factors set forth under “Risk Factors” in deciding whether to invest in our common stock. Among these important risks are the following:
| • | volatility in raw material prices utilized for our products or disruptions in the supply of raw materials may adversely impact our business; |
| • | global economic conditions, including sovereign debt and currency instability risks; |
| • | disruptions in the economy and the financial markets may adversely impact our business; |
| • | conducting operations in several different countries; |
| • | competition in our markets that could adversely affect our market position, sales and overall operations; |
| • | we are a “controlled company” within the meaning of New York Stock Exchange rules and, as a result, we will qualify for, and intend to rely on, exemptions from certain corporate governance requirements. Accordingly, our stockholders will not have the same protections as stockholders of companies that are subject to such requirements. |
13
Table of Contents
Migration and Continued Existence as a Delaware Corporation
Prior to the completion of this offering, we will migrate to Delaware by de-registering as a Luxembourg partnership limited by shares (société en commandite par actions), organized and existing under the laws of the Grand Duchy of Luxembourg, and registering by continuation as a Delaware corporation, which will be effected through the filing of a certificate of incorporation and a certificate of conversion in Delaware.
Upon the effectiveness of the certificate of incorporation: (i) each issued and outstanding ordinary share and management share of the Luxembourg partnership limited by shares (société en commandite par actions) will be converted into one share of common stock of the Delaware corporation; and (ii) the Delaware corporation will effect a one-for- stock split with respect to its outstanding common stock. In connection with the migration and continued existence as a Delaware corporation, the name of the Company will be changed to “Klöckner Pentaplast Inc.” and its authorized capital stock will consist of shares of common stock, par value $0.001 per share, and shares of undesignated preferred stock, par value $0.001 per share. Following the migration, each outstanding option to purchase common shares and each share of restricted stock will relate to shares of common stock of the Delaware corporation and otherwise be adjusted appropriately to give effect to the stock split. In addition, following the migration, the TPECs (as defined herein) will no longer be outstanding.
Our Corporate Information
The Issuer of the common stock in this offering was originally incorporated as a Luxembourg partnership limited by shares (société en commandite par actions), organized and existing under the laws of the Grand Duchy of Luxembourg, in 2012 and will migrate to Delaware and continue to exist as a Delaware corporation prior to completion of this offering. Our business was founded in Montabaur, Germany in 1965.
Prior to our migration to Delaware, our principal executive offices are located at 46A, Avenue J.F. Kennedy, L-1855 Luxembourg. Our telephone number is (+352) 26 428-1. The address of our main website is www.kpfilms.com. We also have offices at 187 Danbury Road, Wilton, Connecticut 06897. The information contained on our website does not constitute a part of this prospectus.
14
Table of Contents
The Offering
| Issuer |
Kleopatra Holdings 2 S.C.A. (to be renamed Klöckner Pentaplast Inc.). |
| Common stock offered by us |
shares. |
| Underwriters’ option to purchase additional shares |
We have granted the underwriters a 30-day option to purchase up to an additional shares at the public offering price less underwriting discounts and commissions. |
| Common stock to be outstanding immediately after completion of this offering |
Immediately following the consummation of this offering, we will have shares of common stock outstanding, or shares, if the underwriters’ option to purchase additional shares is exercised in full. |
| Use of proceeds |
We estimate that the proceeds to us from this offering, after deducting estimated underwriting discounts and commissions and offering expenses payable by us, will be approximately $ million, assuming the shares offered by us are sold for $ per share, the midpoint of the price range set forth on the cover of this prospectus. |
| We intend to use the net proceeds from the sale of common stock by us in this offering to repay outstanding indebtedness and for general corporate purposes. For additional information, see “Use of Proceeds.” |
| Principal stockholders |
Upon completion of this offering, affiliates of SVPGlobal will beneficially own a controlling interest in us. We currently intend to avail ourselves of the controlled company exemption under the corporate governance rules of the New York Stock Exchange. |
| Dividend policy |
We currently expect to retain all available funds and any future earnings to fund the development and growth of our business and to repay indebtedness; therefore, we do not anticipate paying any cash dividends in the foreseeable future. For additional information, see “Dividend Policy.” |
| Proposed symbol for trading on the New York Stock Exchange |
“KP.” |
| Risk factors |
Investing in our common stock involves a high degree of risk. See the “Risk Factors” section of this prospectus for a discussion of factors you should carefully consider before deciding to purchase shares of our common stock. |
15
Table of Contents
Unless otherwise indicated, all information in this prospectus:
| • | gives effect to the migration and continued existence as a Delaware corporation prior to the completion of this offering as described in “—Migration and Continued Existence as a Delaware Corporation”; |
| • | excludes shares of common stock issuable upon the exercise of outstanding stock options at a weighted average exercise price of $ per share; |
| • | assumes no exercise by the underwriters of their option to purchase up to additional shares from us; and |
| • | assumes an initial public offering price of $ per share, the midpoint of the price range set forth on the cover of this prospectus. |
16
Table of Contents
Summary Historical Consolidated Financial and Other Data
The following table presents our summary historical consolidated financial data and certain other financial data. The historical consolidated balance sheet data as of September 30, 2016 (“fiscal 2016”), September 30, 2015 (“fiscal 2015”) and September 30, 2014 (“fiscal 2014”), and the consolidated statement of operations data and consolidated statement of cash flows data for fiscal 2016, fiscal 2015 and fiscal 2014 have been derived from our historical audited consolidated financial statements, which are included in this prospectus. The consolidated balance sheet data as of fiscal 2014 are derived from our accounting records.
The historical consolidated financial data and other financial data presented below should be read in conjunction with our audited consolidated financial statements and the related notes thereto and our unaudited condensed consolidated financial statements and the related notes thereto, included elsewhere in this prospectus, and the section entitled “Management’s Discussion and Analysis of Financial Condition and Results of Operations.” Our historical consolidated financial data may not be indicative of our future performance.
| Fiscal Year Ended September 30, | ||||||||||||
| (in thousands) | 2016 | 2015 | 2014 | |||||||||
| Net Sales |
$ | 1,403,454 | $ | 1,480,313 | $ | 1,620,807 | ||||||
| Cost of Sales |
1,102,414 | 1,193,595 | 1,311,635 | |||||||||
|
|
|
|
|
|
|
|||||||
| Gross Profit |
301,040 | 286,718 | 309,172 | |||||||||
| Selling, general and administrative expenses |
171,098 | 186,054 | 174,754 | |||||||||
| Other expenses, net |
28,194 | 10,856 | 12,853 | |||||||||
|
|
|
|
|
|
|
|||||||
| Operating Income |
101,748 | 89,808 | 121,565 | |||||||||
| Interest and other debt expense, net |
93,260 | 482,333 | 158,853 | |||||||||
| Foreign currency gains and (losses) on financing |
(12,492 | ) | (6,941 | ) | 4,725 | |||||||
|
|
|
|
|
|
|
|||||||
| Loss before income taxes and equity income of equity method investees |
(4,004 | ) | (399,466 | ) | (32,563 | ) | ||||||
| Income tax expense/(benefit) |
8,425 | (38,037 | ) | 19,407 | ||||||||
|
|
|
|
|
|
|
|||||||
| Loss before equity income of equity method investees |
(12,429 | ) | (361,429 | ) | (51,970 | ) | ||||||
| Equity income of equity method investees |
832 | 317 | 635 | |||||||||
|
|
|
|
|
|
|
|||||||
| Net Loss |
$ | (11,597 | ) | $ | (361,112 | ) | $ | (51,335 | ) | |||
| Fiscal Year Ended September 30, | ||||||||||||
| (in thousands) | 2016 | 2015 | 2014 | |||||||||
| Other Operating and Financial Data |
||||||||||||
| EBITDA(a) |
$ | 199,431 | $ | 195,723 | $ | 233,886 | ||||||
| Adjusted EBITDA(a) |
242,911 | 241,857 | 249,185 | |||||||||
| Free cash flow(b) |
64,803 | 86,868 | 52,979 | |||||||||
| Adjusted free cash flow(b) |
$ | 84,050 | $ | 96,443 | $ | 64,195 | ||||||
| As of September 30, | ||||||||||||
| (in thousands) | 2016 | 2015 | 2014 | |||||||||
| Consolidated Balance Sheet Data |
||||||||||||
| Cash |
$ | 116,008 | $ | 103,906 | $ | 149,522 | ||||||
| Total assets |
1,351,856 | 1,361,908 | 1,579,205 | |||||||||
| Total shareholders’ deficit |
468,107 | 461,737 | 154,212 | |||||||||
| Total liabilities |
1,819,963 | 1,823,645 | 1,733,417 | |||||||||
| (a) | EBITDA (non-GAAP measure) is calculated as net loss excluding equity income of equity method investees, income tax expense/(benefit), foreign currency gains and (losses) on financing, interest and other |
17
Table of Contents
| debt expense, net, depreciation and amortization and impairment charges. We believe EBITDA is a useful financial metric to assess operating performance before the impact of investing and financing transactions, income taxes and non-cash impairment charges. It also facilitates comparison between the Company and our competitors. We believe that EBITDA provides investors with a useful tool for assessing the comparability between periods because it eliminates interest expense related to financings and debt restructurings. |
| Adjusted EBITDA (non-GAAP measure) is our key performance indicator for operating results. Adjusted EBITDA is also the basis for performance evaluation under our current executive compensation programs. Adjusted EBITDA is calculated as EBITDA excluding restructuring costs, share-based compensation, IPO preparation costs and other items that we do not consider indicative of our operating performance. As such, the Company believes that Adjusted EBITDA provides investors with a useful tool for assessing the comparability of the core business between periods because it excludes certain items that do not reflect the ongoing performance of the Company’s business. |
| EBITDA and Adjusted EBITDA are not GAAP measures and the use of these measures has certain limitations. The Company’s presentation of EBITDA and Adjusted EBITDA may be different from the presentation used by other companies and therefore comparability may be limited. The terms EBITDA and Adjusted EBITDA are not defined under GAAP and EBITDA and Adjusted EBITDA are not measures of net income, operating income, operating performance or liquidity presented in accordance with GAAP. When assessing the Company’s operating performance, you should not consider this data in isolation, or as a substitute for the Company’s net income, operating income or any other operating performance measure that is calculated in accordance with GAAP. |
| A reconciliation of net loss, the most directly comparable GAAP measure, to EBITDA and Adjusted EBITDA for each of the respective periods is as follows: |
| Fiscal Year Ended September 30, | ||||||||||||
| (in thousands) | 2016 | 2015 | 2014 | |||||||||
| Net Loss |
$ | (11,597 | ) | $ | (361,112 | ) | $ | (51,335 | ) | |||
| Equity income of equity method investees |
(832 | ) | (317 | ) | (635 | ) | ||||||
| Income tax expense/(benefit) |
8,425 | (38,037 | ) | 19,407 | ||||||||
| Foreign currency losses/(gains) on financing |
12,492 | 6,941 | (4,725 | ) | ||||||||
| Interest and other debt expense, net |
93,260 | 482,333 | 158,853 | |||||||||
| Depreciation and amortization |
97,683 | 105,916 | 112,320 | |||||||||
|
|
|
|
|
|
|
|||||||
| EBITDA |
199,431 | 195,723 | 233,886 | |||||||||
|
|
|
|
|
|
|
|||||||
| Restructuring costs(1) |
17,078 | 7,882 | 9,936 | |||||||||
| Share-based compensation(2) |
8,527 | — | — | |||||||||
| IPO preparation costs(3) |
8,286 | 1,502 | — | |||||||||
| Other(4) |
9,589 | 36,750 | 5,364 | |||||||||
|
|
|
|
|
|
|
|||||||
| Adjusted EBITDA |
$ | 242,911 | $ | 241,857 | $ | 249,185 | ||||||
|
|
|
|
|
|
|
|||||||
| (1) | Consists of fees and expenses related to operational restructuring. |
| (2) | Share-based compensation relates to restricted stock granted to certain employees. |
| (3) | In 2016, these consist of the GAAP financial statement preparation, Sarbanes-Oxley compliance preparation and other preparation. |
| (4) | Other non-recurring adjustments primarily consist of transaction costs, refinancing costs, exceptional litigations and other special items. |
| (b) | Adjusted free cash flow (non-GAAP measure) is calculated as net cash provided by (used in) operating activities less capital expenditures and adjusted for certain income (expenses) and gains (losses) that we do not consider indicative of our normal business. As such, the Company believes that Adjusted Free Cash |
18
Table of Contents
| Flow will provide investors with a useful tool for assessing the comparability of cash generated from the core business between periods because it excludes other non-operating expense (income that does not relate to the ongoing performance of the Company’s assets). |
| Adjusted free cash flow is not a GAAP measure and the use of this measure has certain limitations. The Company’s presentation of Adjusted free cash flow may be different from the presentation used by other companies and therefore comparability may be limited. Adjusted free cash flow is used in addition to and in conjunction with results presented in accordance with GAAP and should not be relied upon to the exclusion of GAAP financial measures. Management uses Adjusted free cash flow in tracking our business but compensates for the limitations when using this measure by looking at other GAAP measures, such as net cash provided (used in) by operating activities and net cash used in investing activities. In addition, we believe, securities analysts, investors and others frequently use Adjusted free cash flow in their evaluation of companies like ours. The term Adjusted free cash flow is not defined under GAAP and Adjusted free cash flow is not a measure of net cash provided (used in) by operating activities, operating performance or liquidity presented in accordance with GAAP. When assessing the Company’s operating performance or liquidity, you should not consider this data in isolation, or as a substitute for the Company’s net cash provided by (used in) operating activities, net cash used in investing activities or any other operating performance measure that is calculated in accordance with GAAP. |
| A reconciliation of net cash provided by (used in) operating activities, the most directly comparable GAAP measure, to Free Cash Flow for each of the respective periods is as follows: |
| Fiscal Year Ended September 30, | ||||||||||||
| (in thousands) | 2016 | 2015 | 2014 | |||||||||
| Cash flow from operations |
$ | 116,778 | $ | (367,678 | ) | $ | 106,505 | |||||
| Interests on subordinated shareholder loans |
11,706 | 441,188 | — | |||||||||
| Long-term incentive payments |
12,094 | 23,383 | — | |||||||||
| Withholding Tax |
— | 26,246 | — | |||||||||
|
|
|
|
|
|
|
|||||||
| Adjusted cash flow from operations |
140,578 | 123,139 | 106,505 | |||||||||
| Capital expenditures |
(75,775 | ) | (36,271 | ) | (53,526 | ) | ||||||
|
|
|
|
|
|
|
|||||||
| Free cash flow |
64,803 | 86,868 | 52,979 | |||||||||
| Restructuring costs(1) |
12,138 | 7,273 | 6,045 | |||||||||
| IPO preparation(2) |
3,088 | — | — | |||||||||
| Other(3) |
4,021 | 2,302 | 5,171 | |||||||||
|
|
|
|
|
|
|
|||||||
| Adjusted free cash flow |
$ | 84,050 | 96,443 | $ | 64,195 | |||||||
|
|
|
|
|
|
|
|||||||
| (1) | Consists of fees and expenses related to operational restructuring. |
| (2) | In 2016, these consist of the GAAP financial statement preparation, Sarbanes-Oxley compliance preparation and other preparation. |
| (3) | Other non-recurring adjustments primarily consist of transaction costs, refinancing costs, exceptional litigations and other special items. |
19
Table of Contents
| Fiscal Year Ended September 30,(1) | ||||||||||||
| (in thousands, other than percentages) | 2016 | 2015 | 2014 | |||||||||
| Net sales |
$ | 1,403,454 | $ | 1,480,313 | $ | 1,620,807 | ||||||
| Reported Growth |
(5.2 | )% | (8.7 | )% | 4.6 | % | ||||||
| FX Neutral Change |
(0.4 | )% | 0.7 | % | 4.8 | % | ||||||
| Gross profit |
301,040 | 286,718 | 309,172 | |||||||||
| Reported Growth |
5.0 | % | (7.3 | )% | 12.2 | % | ||||||
| FX Neutral Change |
10.0 | % | 0.7 | % | 12.7 | % | ||||||
| Operating income |
101,748 | 89,808 | 121,565 | |||||||||
| Reported Growth |
13.3 | % | (26.1 | )% | 60.3 | % | ||||||
| FX Neutral Change |
21.7 | % | (23.6 | )% | 63.5 | % | ||||||
| Adjusted EBITDA |
242,911 | 241,857 | 249,185 | |||||||||
| Reported Growth |
0.4 | % | (2.9 | )% | 10.4 | % | ||||||
| FX Neutral Change |
5.3 | % | 5.1 | % | 10.8 | % | ||||||
| (1) | The table above shows our reported growth and growth excluding foreign currency (“FX”) in net sales, gross profit, operating income, and Adjusted EBITDA growth on a consolidated level. Because of the impact of raw material costs on net sales, management focuses on gross profit rather than net sales to evaluate the operating performance of the segments. Adjusted EBITDA is our principal consolidated measure of profitability. |
| We have excluded the impact of fluctuations in foreign currency exchange rates by presenting the FX Neutral Change, which is a non-GAAP financial measure. We believe presenting the FX Neutral Change provides valuable supplemental information regarding our results of operations. We calculate the FX Neutral Change by converting our current period local currency financial information using the prior period foreign currency average exchange rates and comparing these adjusted amounts to our prior period reported results. This calculation may differ from similarly titled measures used by other companies and, accordingly, the FX Neutral Change is not meant to substitute for changes in recorded amounts presented in conformity with GAAP nor should such amounts be considered in isolation. |
20
Table of Contents
Investing in our common stock involves a number of risks. Before you purchase our common stock, you should carefully consider the risks described below and the other information contained in this prospectus, including our consolidated financial statements and accompanying notes. If any of the following risks actually occurs, our business, financial condition, results of operation or cash flows could be materially and adversely affected. In any such case, the trading price of our common stock could decline, and you could lose all or part of your investment.
Risks Relating to Our Business
We are impacted by volatility and uncertainty in raw material prices utilized for our products and disruptions in the supply of raw materials.
Cost of materials represent the single largest component of our operating costs and accounted for 52% of our net sales in fiscal 2016. The principal raw materials we use in our business are resins and additives. The price of resins and certain other raw materials is a function of many factors that are out of our control, including supply and demand, suppliers’ capacity utilization, industry and consumer sentiment and the price of crude oil, natural gas and other commodities. Our products are primarily based on PVC and PET, the prices of which often track the price of ethylene, which can be produced from materials derived from crude oil and natural gas, and is often affected by prices of those materials.
Similarly, if the availability of any of our raw materials is limited, we may be unable to produce some of our products in the quantities demanded by our customers, which could have an adverse effect on plant utilization and our sales of products requiring such raw materials. Furthermore, certain of our products are dependent on a limited or singled sourced raw material. Any supply interruption in limited or single sourced raw materials could materially harm our ability to manufacture our products until a new source of supply, if any, could be identified and qualified. We may be unable to find a sufficient alternative supply channel within a reasonable time or on commercially reasonable terms.
Our ability to pass on increases in the cost of raw materials to our customers is, to a large extent, dependent upon contractual terms with our existing customers and market conditions. The majority of our contacts do not have price escalation or cost pass through clauses and a pass on of an increase in the cost of raw materials can be achieved only through renegotiations. Our contracts that do include escalation or cost pass through clauses may not in all cases be effective to offset our increased costs and in almost all of these contracts there is a lag between the time we incur increased input costs and the time at which we are able to raise our prices. We also sell a substantial portion of our products based on purchase orders, in which pricing is based on market prices, and we seek to pass through raw material price increases by increasing the prices for our products. We may be unable to increase prices for our products if customers do not agree to a price increase, in particular in our markets where competition is intense.
We are exposed to global economic conditions, including sovereign debt and currency instability risks.
General global economic conditions and macroeconomic trends can affect overall demand for our products and the markets in which we operate. Beginning in 2008, a worldwide financial and economic downturn occurred that affected nearly all regions of the world and all business sectors. Ongoing struggles in Europe related to sovereign debt issues and currency instability, among other things, have contributed to a challenging economic environment. These sovereign debt issues and currency instability could become exacerbated, leading to a decline in the worldwide economy. Such a decline could adversely affect our business, financial condition and results of operations. Further, the announcement of the referendum on the United Kingdom’s membership in the European Union (the “EU”) (referred to as Brexit), advising for the exit of the U.K. from the EU caused significant volatility in global stock markets and currency exchange rate fluctuations that resulted in the
21
Table of Contents
strengthening of the U.S. dollar against foreign currencies in which we conduct business. The strengthening of the U.S. dollar relative to other currencies, as well as uncertainty in the global economy, has and may continue to adversely affect our business, financial condition or results of operations.
Disruptions in the economy and the financial markets may adversely impact our business.
Global market and economic conditions in the past several years have presented heightened volatility and risk perception. Disruptions in the overall economy and volatility in the financial markets could reduce consumer confidence, negatively affecting consumer spending, which could be harmful to our business, financial condition or results of operations. Furthermore, as our customers are often forced to reduce their prices during downturns, or to sell more lower priced items, many of our customers often seek to revise trade credit terms and aggressively negotiate prices. As a result, an economic slowdown may adversely affect our financial position and our cash flows.
Deterioration in economic conditions or disruptions in credit markets also pose a risk to our commercial relationships with our customers, suppliers and creditors. If economic conditions deteriorate significantly, or if our customers or raw material suppliers are not able to refinance their existing credit lines or otherwise are forced to cease doing business, our business would be materially adversely affected. The financial condition of some of our customers may expose us to credit risk. If our customers suffer financial difficulty, they may not pay us. In addition, if we are not able to secure working capital or other funding due to a lack of availability of credit, we may be unable to pay our suppliers who may cease doing business with us, which could affect our business, financial condition or results of operations.
We are exposed to the risk that the financial condition of our customers or suppliers or both could deteriorate.
Many economic and other factors are outside of our control, including but not limited to commercial credit availability. These factors also affect our customers who, in many cases, depend upon credit to finance their operations. If they are unable to secure financing, the financial condition of our customers could deteriorate and our customers could seek to change the terms on which we sell to them. In addition, we depend on suppliers based in numerous different countries for our raw materials and basic parts supplies. Should the financial condition of these suppliers deteriorate, or should suppliers cease operations, it may become more difficult for us to procure necessary supplies on favorable terms or at all. This could adversely affect our business, financial condition and results of operations.
We are exposed to risks related to conducting operations in many different countries.
A large portion of our manufacturing facilities are located outside of the U.S., as described in “Business—Our Strategies—Manufacturing and Operations.” In addition, we sell our products in over 80 countries. As a result, our business is subject to risks related to the differing legal, political, social and regulatory requirements and economic conditions of many jurisdictions. Risks inherent in international operations include the following:
| • | general economic, social or political conditions in the countries in which we operate; |
| • | compliance with a variety of laws and regulations in various jurisdictions may be burdensome; |
| • | inconsistent regulations, licensing and legal requirements may increase our cost of operations as we endeavor to comply with a myriad of laws that differ from one country to another in an unpredictable and adverse manner; |
| • | withholding taxes or other taxes or royalties on our income could be imposed or other restrictions on foreign trade or investment, including currency exchange controls could be adopted; |
| • | adverse changes in export duties, quotas and tariffs and difficulties in obtaining export licenses could occur; |
22
Table of Contents
| • | difficulty in enforcing intellectual property rights; |
| • | increase in transportation and other shipping costs; |
| • | staffing difficulties, national or regional labor strikes or other labor disputes; |
| • | imposition of price controls; and |
| • | difficulty in enforcing agreements and collecting receivables. |
Any of these and other factors could require us to change our current operational structure and could have a material adverse impact on our results of operations.
Significant competition in our markets may adversely affect our sales and overall operations.
The industry and markets in which we operate are highly competitive. The principal drivers for competition for our products include quality, product performance and characteristics, service and price. If new manufacturers enter our markets and/or produce alternative forms of packaging, including plastic, carton, glass and metal containers or packaging made from other materials, our business may be negatively affected. Inability to respond to technological advances introduced by our competitors would pose a serious risk to our future performance.
Our sales may also be negatively affected by variations in customer preference driven by the cost of various packaging products. Economic conditions may cause our customers to choose cheaper and less elaborate forms of packaging to follow perceived market trends, such as, awareness of environmental issues, which could have a material adverse effect on our business, financial condition or results of operations.
Competitors may have greater financial, marketing and other resources available and a greater geographic reach than we have and benefit from well-established relationships with customers. Our competitors could use these resources to increase their marketing efforts, develop new products or reduce their prices, which could have a material adverse effect on our business, financial condition or results of operations. Furthermore, certain products are also available from a number of local manufacturers specializing in the production of a limited group of products. These local manufacturers may have existing relationships with local customers and may be more familiar with local preference than we are. Competitors may develop new product manufacturing technology or processes that could allow them to offer packaging products at a cost or quality that has a significant advantage over our products, and we may not have sufficient resources or capital to match such innovation or react to changing customer preferences. If one or more of our competitors with manufacturing facilities in lower cost countries offers products of sufficient quality in our markets at lower prices, we may be forced to lower our prices to maintain our competitiveness, or we may be unable to continue to sell our products. In either case, our sales and our gross profit could decline and such decline could have a material adverse effect on our business, financial condition or results of operations.
In difficult market conditions, our high fixed costs combined with potentially lower net sales may negatively impact our results.
While the vast majority of our manufacturing costs are variable, a material amount of costs relating to our manufacturing operations are fixed costs. In periods of economic uncertainty and reduced demand for our products, we generally face a decline in the utilization rates of our manufacturing facilities. During such periods, our plants do not operate at full capacity. As a result, as our production and sales decrease, our margins will decline rapidly because our fixed costs will remain the same. We have limited ability to reduce these costs and we may be unable to reduce these costs in a timely manner.
Changes in packaging regulations and their enforcement may have a material impact on our operations.
Our products are used in a variety of end-uses that have specific regulatory requirements such as those relating to products that have contact with food or medical device end-uses. Our industry is regulated by various
23
Table of Contents
national and local rules, laws and regulations. Packaging for pharmaceutical products is heavily regulated in our markets and our facilities and products are often subject to testing in connection with the drug approval process. Changes in health and safety regulations in jurisdictions where we manufacture and sell our products could lead to a decrease in demand for our products. In addition to changes in regulations, health and safety concerns could increase the costs incurred by our customers to use our products and otherwise limit the use of these products, which could lead to decreased demand for these products. Such a decrease in demand likely would have an adverse effect on our business, financial condition or results of operations.
Our profitability and cash flows could deteriorate materially if we fail to keep up with product innovation.
Our profitability will depend, among other things, on our ability to introduce new products that offer value for our customers. We need to continue to identify, develop and market innovative products on a timely basis to replace existing products in order to maintain our profit margins and our competitive position. However, we may face challenges due to the production complexity and logistics of developing and launching new products. Product development and engineering require significant investment. Our product development and engineering efforts may fail to deliver competitive products that will translate into sales to customers. If we fail to keep pace with the evolving technological innovations in our markets, this may have a material adverse impact on our business, financial condition or results of operations.
We may not successfully develop new products or improve existing products, and we may experience delays in the development of new products.
Our success depends on meeting customer needs, and one of the ways in which we meet customer needs is through new product development. We aim to introduce products and new or improved production processes proactively to offset obsolescence and decreases in sales of existing products. As materials technology for packaging advances, we will be expected to upgrade and adapt our existing products and production processes and introduce new products in order to continue to provide products incorporating the latest commercial innovations and meet customer expectations. If this update fails to gain commercial acceptance, we may suffer a decline in our competitive position.
While we devote significant attention to the development of new products, we may not be successful in new product development, and our new products may not meet customer expectations or be commercially successful. To the extent we are not able to successfully develop new products, our future sales could be harmed. In addition, interruptions or delays in the development of new products and new or improved production processes could have an adverse effect on our business, financial condition and results of operations.
Any interruption in the operations of our manufacturing facilities may adversely affect our business.
All our manufacturing activities take place at facilities that we own or lease. Our manufacturing operations are subject to hazards inherent to operations using large amounts of chemicals in complex processes and the related use, storage, transportation and disposal of feedstocks, products and wastes, including but not limited to:
| • | pipeline leaks and ruptures; |
| • | fires and explosions; |
| • | accidents and mechanical failures; |
| • | severe weather and natural disasters; |
| • | energy supply interruptions; |
| • | unscheduled downtimes; |
| • | transportation interruptions; |
24
Table of Contents
| • | unpermitted discharges or releases of toxic or hazardous substances or gases; |
| • | other environmental risks; and |
| • | sabotage or terrorist attacks. |
The occurrence of any of these hazards can cause personal injury and loss of life, catastrophic damage to, or destruction of, property and equipment and environmental damage, and may result in a suspension of operations, litigation exposures, loss of market share and the imposition of civil or criminal penalties, which could have a material adverse effect on our business, financial condition or results of operations. Unplanned outages can affect our operating results. To the extent that we experience any breakdown of key manufacturing equipment or similar manufacturing problems, we may be required to make significant capital expenditures that we may be unable to meet. There can be no assurance that we will be able to secure alternative production capacity in the event of a major disruption of our operation, as a result of which we may be unable to meet customer demand.
We mainly use oil, natural gas and electricity in our manufacturing and operations. These energy sources are essential to our operations and we rely on their continuous supply to conduct our business. Frequent or prolonged power interruptions may have a material adverse effect on our operations. Certain locations in which we have operations, such as the United States, have experienced power shortages in the past and may continue to do so occasionally.
Our business requires ongoing capital investments, which we may be unable to fund.
Our business requires ongoing capital investments, including maintenance and growth expenditures and plant upgrades. Our total capital expenditures were $75.8 million for fiscal 2016, a substantial portion of which consists of expansion capital expenditures.
We may be unable to continue to make such capital expenditures if we do not generate sufficient cash flow from operations, have funds available for future borrowing under our credit facilities or were restricted from incurring additional debt to cover such expenditures or as a result of a combination of these factors. If we are unable to meet our capital expenditure plans, we may find it difficult to maintain or expand our manufacturing capacity, which may negatively impact our competitive position and ultimately, our net sales and profitability. Any failure to meet our capital expenditure plans may have a material adverse effect on our business, financial condition or results of operations.
We may not be able to successfully consummate acquisitions or integrate acquired businesses.
As part of our strategy, we continuously evaluate potential acquisition opportunities, including those that could be material in size and to our operations. Acquisitions involve a number of special risks, including:
| • | the diversion of management’s attention and resources to the assimilation of the acquired companies and their employees and to the management of expanding operations; |
| • | the incorporation of acquired products into our product line; |
| • | problems associated with maintaining relationships with employees, suppliers and customers of acquired businesses; |
| • | the increasing demands on our operational systems; |
| • | additional governmental restrictions and compliance requirements; |
| • | possible adverse effects on our reported operating results, particularly during the first several reporting periods after such acquisitions are completed; and |
| • | the loss of key employees and the difficulty of presenting a unified corporate image. |
25
Table of Contents
We may become responsible for unexpected liabilities that we failed or were unable to discover in the course of performing due diligence in connection with historical acquisitions and any future acquisitions. We have typically required selling stockholders to indemnify us against certain undisclosed liabilities. However, we cannot assure you that indemnification rights we have obtained, or will obtain in the future, will be enforceable, collectible or sufficient in amount, scope or duration to fully offset the possible liabilities associated with the business or property acquired. Any of these liabilities, individually or in the aggregate, could have a material adverse effect on our business, financial condition or results of operations.
In addition, we may be unable to successfully integrate future acquisitions at all or without substantial costs, delays or higher than projected costs. The costs of such integration could have a material adverse effect on our business, financial condition or results of operations. Although we conduct what we believe to be a prudent level of investigation regarding the businesses we purchase, in light of the circumstances of each transaction, an unavoidable level of risk remains regarding the actual condition of these businesses. Until we actually assume operating control of such businesses and their assets and operations, we may be unable to ascertain the actual value or understand the potential liabilities of the acquired entities and their operations. Furthermore, we may not realize all of the cost savings and synergies we expect to achieve from our current strategic initiatives due to a variety of risks, including, but not limited to, difficulties in integrating shared services with our business, higher than expected employee severance or retention costs, higher than expected overhead expenses, delays in the anticipated timing of activities related to our cost-saving plans and other unexpected costs associated with operating our business. If we are unable to achieve the cost savings or synergies that we expect to achieve from our strategic initiatives, it could adversely affect our business, financial condition or results of operations.
Current and future environmental, health and safety and other governmental requirements could adversely affect our financial condition and our ability to conduct our business.
Our operations, properties and products are subject to U.S. federal and state, EU, international, national and local environmental, health and safety (“EHS”) laws and regulations that impose limitations on the discharge of pollutants into the air, soil and water, establish standards for the treatment, storage and disposal of solid and hazardous wastes, require investigation and clean-up of contaminated sites, establish environmental standards for our products and raw materials inputs to our product processes, as well as determine the guidelines for workplace health and safety. Certain environmental laws in the jurisdictions in which we operate, including, but not limited to, the Comprehensive Environmental Response, Compensation, and Liability Act (“CERCLA”) in the United States, impose joint and several liability for cleanup costs, without regard to fault, on current and certain former owners and operators of property that has been impacted by a release of hazardous substance or on persons who have disposed of, arranged for the disposal of or released hazardous substances into the environment.
We cannot predict with any certainty our future capital expenditure requirements necessary to comply with applicable EHS laws and regulations due to changing environmental technologies and continually changing compliance standards, which have tended to become increasingly strict. From time to time, we could be subject to requests for information, notices of violation or investigations initiated by environmental regulatory agencies relating to our current or former operations and properties. Furthermore, violations or contaminated sites (including contamination caused by releases from our operations at current or former properties or by prior owners and operators of our sites that was not previously discovered) could result in additional compliance or remediation costs or other liabilities, which could be material. We may also assume significant EHS liabilities in future acquisitions. In addition, governments could enact laws or regulations concerning EHS matters that increase the cost of production, or otherwise adversely affect the demand, for plastic products.
Legislation that would prohibit, tax, restrict the sale or use of, or regulate the content of certain types of plastic and other containers, and would require diversion of solid wastes such as packaging materials from disposal in landfills, has been or may be introduced in the U.S. Congress, U.S. state legislatures, the EU or certain member states thereof, and legislative bodies of other jurisdictions. Container legislation has been adopted in a few jurisdictions and similar legislation has been defeated in public referenda in several states, local
26
Table of Contents
elections and many state and local legislative sessions. There can be no assurance that future legislation or regulation would not have a material adverse effect on our business, financial condition or results of operations.
We are also subject to regulations that establish specific requirements for the manufacture and marketing of plastic materials that are intended to or may come into contact with food. These regulations typically set out a list of authorized substances that may be used in the manufacture of such plastic materials and establish a limit on the transfer of constituent elements from the plastic to food. We may be required to incur additional costs or change raw materials or production process to comply with future food packaging legislation or regulation.
Additionally, our products and the raw materials we use in our production processes are subject to numerous environmental laws and regulations, including the EU’s Regulation on Registration, Evaluation, Authorization and Restriction of Chemical substances (“REACH”) (EU Directive No. 1907/2006), which can require a costly and time-consuming registration, safety analysis, and in some cases, authorization process for chemicals made or imported into the European Union. REACH may also require the phase-out or substitution of certain chemicals deemed to be dangerous with suitable alternatives. The EU is continuously adopting additional requirements related to product safety. Although REACH compliance is primarily the responsibility of our suppliers or the producers of chemical raw materials, we are also affected by REACH as a “downstream” user of REACH-regulated substances. It is possible that the authorization process or the marketing and use restrictions imposed by REACH could increase the cost of or affect the supplies of some chemicals that we use as raw materials or that are manufactured and/or imported into the EU by us or our suppliers, or require us to substitute current raw materials with alternative substances, and the failure to comply with these requirements could result in fines and penalties. Although we have systems in place to track and monitor the REACH status of our raw materials and our suppliers’ compliance with REACH, there can be no assurance that current or future REACH or similar regulations in other jurisdictions (such as the Toxic Substances Control Act (“TSCA”) in the U.S., to which modifications are expected, or new initiatives in Asia Pacific or other regions) would not have a material adverse effect on our business, financial condition or results of operations.
Concerns about greenhouse gas (“GHG”) emissions and climate change and the resulting governmental and market responses to these issues could increase costs that we incur and could otherwise affect our consolidated financial condition or results of operations.
Numerous legislative and regulatory initiatives have been enacted and proposed in response to concerns about GHG emissions and climate change. For example, several of the Company’s facilities in the EU are regulated under the EU Emission Trading System. China has begun pilot programs for carbon taxes and trading of GHG emissions in selected areas. Recently the U.S. EPA has begun to regulate certain GHG emissions from large stationary sources under the Clean Air Act. We are a manufacturing entity that utilizes petrochemical-based raw materials to produce many of our products, including plastic packaging materials. Increased environmental legislation or regulation could result in higher costs for us in the form of higher raw materials and freight and energy costs. We could also incur additional compliance costs for monitoring and reporting emissions and for maintaining permits. It is also possible that certain materials might cease to be permitted to be used in our processes.
We may be liable for damages based on product liability claims.
The sale of our products involves a risk of product liability claims against us. Potential claims may arise out of the use of, or exposure to, our products or allegations of illness stemming from exposure to our products. We have ongoing strict control measures and systems to ensure that the maximum safety and quality of our products is observed. Failure to meet these standards, particularly in Pharma, may require us to take substantial corrective action (including recalling products from consumers) and to reimburse customers or end consumers for losses that they may suffer as a result of this failure, which could result in substantial costs.
Although we maintain product liability insurance coverage, a successful product liability claim or series of claims against us in excess of our insurance coverage for payments for which we are not indemnified or have not
27
Table of Contents
otherwise covered could have a material adverse effect on our business, financial condition or results of operations. In particular, we could be required to increase our debt or divert resources from other investments in our business in order to discharge any such claims. Additionally, we could be affected by bad publicity, which may damage our reputation in the marketplace or adversely impact the value of our brands or our ability to sell our products in certain jurisdictions, which could have a material adverse effect on our business, financial condition or results of operations.
We are exposed to currency fluctuation risks in several countries that could adversely affect our profitability.
We have a global footprint, and operate 19 manufacturing facilities and sell products in more than 80 countries around the world. As a result, our results of operations may be affected by both the transaction and the translation effects of foreign currency exchange rate fluctuations. The primary currencies in which we generated net sales in fiscal 2016 were the Euro, the U.S. dollar and the British pound. We are, therefore, highly exposed to currency fluctuation when we convert currencies into currencies in which we purchase raw materials, pay for our fixed costs or services or have incurred debt, which could result in a loss depending on fluctuations in exchange rates. Where we are unable to match sales received in foreign currencies with costs paid in the same currency, our results of operations are consequently impacted by currency exchange rate fluctuations.
We are also exposed to foreign exchange risk through the translation of the financial statements of our subsidiaries outside the United States from their respective functional currencies into the U.S. dollar. We report our financial results in U.S. dollars and our results of operations would be adversely affected if local currencies depreciate significantly against the U.S. dollar, which may also affect the comparability of our financial results from period to period, as we convert our subsidiaries’ statements of financial position into U.S. dollars from local currencies at the period-end exchange rate, and income and cash flow statements at average exchange rates for the year. Therefore, our financial results in any given period are materially affected by fluctuations in the value of the U.S. dollar relative to the other currencies in which we have income and expenses. The exchange rates between these various local currencies and the U.S. dollar have changed substantially in recent years and may fluctuate substantially in the future. This could significantly affect the comparability of our results between financial periods or result in significant changes to the carrying value of our assets, liabilities and shareholders’ equity.
In addition, in all jurisdictions in which we operate, we are also subject to laws and regulations that govern foreign investment, foreign trade and currency exchange transactions. These laws and regulations may limit our ability to repatriate cash as dividends or otherwise to the U.S. and may limit our ability to convert foreign currency cash flows into U.S. dollars.
Volatility in energy prices may adversely affect our business to the extent that we are unable to pass resulting increased costs on to our customers.
We operate large manufacturing facilities and the fuels necessary to power our facilities and operations constitute a significant portion of our cost of sales. For fiscal 2016, for example, energy and fuels accounted for 2.4% of our net sales. Wide fluctuations in energy prices may result from relatively minor changes in supply and demand, market uncertainty, and other factors, globally, that are beyond our control. Future increases in energy costs could cause our operating costs to increase, which could have a material adverse effect on our business, financial condition and results of operations.
We may be unable to successfully implement our business strategies.
Our future financial performance and success largely depend on our ability to implement our business strategies. We may be unable to successfully implement the business strategies described in this prospectus or those otherwise developed by our business, and these strategies may not sustain or improve our results of operations. In particular, we may be unable to reduce our fixed costs, increase our manufacturing efficiency or
28
Table of Contents
asset utilization, achieve other fixed or variable cost savings or successfully implement intended operational improvements. In the process of implementing our business strategies, we may experience severe business disruption and loss of key personnel. In addition, the costs involved in implementing our strategies may be significantly greater that we currently anticipate.
We are continually actively pursuing acquisition opportunities of various sizes. These opportunities are also in various stages of development, and may become consummated in the near term, or may not be consummated at all.
We periodically assess our operations in order to manufacture and distribute our products in the most efficient manner. Based on our assessments, we may move capabilities from one production facility to another, discontinue manufacturing or distributing certain products or close or divest all or part of a production facility. The closure or divestiture of all or part of a production facility could result in unanticipated future charges that could be significant, including non-recurring losses from discontinued operations, and costs related to worker severance and resulting employee suits.
We rely in part on external transportation and warehousing providers to deliver our products and any disruption in their services could adversely affect our business.
Our business depends, in large part, upon the maintenance of a strong distribution network. We rely on independent transportation and warehousing companies to store and deliver our products to our customers. If any such transportation or storage provider fails to properly store or timely deliver our products to our customers, the results of our operations could be adversely affected. There can be no guarantee that we will maintain relationships with our current independent transportation and warehousing providers. A delay in distribution could, among other things, have an adverse impact on our reputation, result in return of an amount of our products that could not be shipped in a timely manner or require us to contract with alternative, and possibly more expensive, distributors. In addition, many of our current distributors have storage facilities located near our manufacturing plants, which provide us with convenient facilities in which to store our products and which reduce our costs of transportation. If we were required to change distributors, this could be disruptive to our business, which in turn could have a material adverse effect on our business, financial condition or results of operations.
Higher employment costs may have a material adverse effect on our business, financial condition or results of operations.
As of December 7, 2016, we had approximately 3,600 full time equivalent employees and for fiscal 2016 employee compensation expense accounted for 16.5% of our net sales. Labor costs in local currency and in general tend to steadily increase across our locations, with larger increases in the emerging markets in which we operate. Our labor costs may rise faster than expected in the future as a result of increased workforce activism, government decrees and changes in social and pension contribution rules meant to reduce government budget deficits or to increase welfare benefits to employees. A sustained increase in labor costs may result in some of our plants becoming less cost-competitive compared to manufacturers operating from countries with lower salary levels. Should labor costs increase further, and should we be unable to recover these cost increases from our customers through increased sales prices or offset them through productivity gains, our business, financial condition and results of operations may be materially adversely affected. If we expand our operations into new jurisdictions, we may be subject to increased operating costs, including higher employee benefits expenses in these new jurisdictions relative to our current operating costs, which could have a negative effect on our profit margin.
Furthermore, most of the countries in which we operate have labor laws which protect the interests of workers, including statutorily mandated minimum wage increases, legislation that imposes financial obligations on employers and laws governing the employment of workers. These labor laws in one or more of the key
29
Table of Contents
jurisdictions in which we operate may be modified in the future in a way that is detrimental to our business. Any increase in the stringency of these labor laws, continued increases in statutory minimum wages and increasing labor costs in the jurisdictions in which we operate, may make it more difficult for us to discharge employees, or cost-effectively downsize our operations, both of which would likely reduce have a material adverse effect on our business, financial condition and results of operations.
The failure of our patents, trademarks, models and confidentiality agreements to protect our intellectual property could adversely affect our business.
Protection of our proprietary processes and other technology is important to our business. The measures we take to protect our proprietary rights may be insufficient to prevent our competition or other third parties from developing similar products to ours. In addition, the laws and their enforcement in many foreign countries do not protect our intellectual property rights to the same extent as the laws of the EU and the United States. Furthermore, any pending patent application filed by us may not result in an issued patent, or if patents are issued to us, such patents may not provide meaningful protection against competitors and customers or against competitive technologies. Additionally, we may lose patents as a result of opposition proceedings brought by our customers, competitors, suppliers or other third parties. Furthermore, our competitors and any other third parties may obtain patents that restrict or preclude our ability to lawfully manufacture and market our products in a competitive manner, which could materially adversely affect our business, financial condition and results of operations.
We also rely upon unpatented proprietary know-how and continuing technological innovation and other trade secrets to develop and maintain our competitive position. While it is our policy to enter into confidentiality agreements with our employees and third parties to protect our intellectual property, there can be no assurances that our confidentiality agreements will not be breached, or will provide meaningful protection for our trade secrets or proprietary know-how and adequate remedies in the event of an unauthorized use or disclosure of these trade secrets and know-how. In addition, there can be no assurances that others will not obtain knowledge of these trade secrets through independent development or other access by legal means.
If we are unable to maintain the proprietary nature of our technologies, our profit margin could be reduced as competitors imitating our products could compete aggressively against us in the pricing of certain products and our business, results of operations and financial condition may be materially adversely affected.
Such claims, with or without merit, could subject us to costly litigation and divert our technical and management personnel from their regular responsibilities. Furthermore, if such claims are adversely determined against us, we could be forced to suspend the manufacturing of products using the contested intellectual property and our business, financial condition and results of operations could be adversely affected if any such products are material to our business.
Our success depends in large part upon the continued service of our senior management.
Our performance is substantially dependent on the performance of our senior management team, including Mr. Hewett, our Chief Executive Officer. In addition, our future growth and success also depends on our ability to attract, train, retain and motivate skilled managerial, sales, administration, operating and technical personnel. The number of people with the necessary skills to serve in these positions is limited. Therefore, the loss of one or more of our key management or operating personnel, or the failure to attract and retain additional key personnel, could have a material adverse impact on our business, financial condition and results of operations.
Failure to comply with the FCPA, trade and economic sanctions and other similar laws could subject us to penalties and damage our reputation.
Our global operations expose us to trade and economic sanctions and other restrictions imposed by the United States, the EU and other governments and organizations. The U.S. Departments of Justice, Commerce,
30
Table of Contents
State and Treasury and other federal agencies and authorities have a broad range of civil and criminal penalties they may seek to impose against corporations and individuals for violations of economic sanctions laws, export control laws, the Foreign Corrupt Practices Act (the “FCPA”) and other federal statutes and regulations, including those established by the Office of Foreign Assets Control (“OFAC”). Under these laws and regulations, as well as other anti-corruption laws, anti-money-laundering laws, export control laws, customs laws, sanctions laws and other laws governing our operations, various government agencies may require export licenses, may seek to impose modifications to business practices, including cessation of business activities in sanctioned countries or with sanctioned persons or entities and modifications to compliance programs, which may increase compliance costs, and may subject us to fines, penalties and other sanctions. A violation of these laws or regulations could adversely impact our business, results of operations and financial condition.
Although we have implemented policies and procedures in these areas, we cannot assure you that our policies and procedures are sufficient or that directors, officers, employees, representatives, distributors, consultants and agents have not engaged and will not engage in conduct for which we may be held responsible, nor can we assure you that our business partners have not engaged and will not engage in conduct that could materially affect their ability to perform their contractual obligations to us or even result in our being held liable for such conduct. Violations of the FCPA, OFAC restrictions or other export control, anti-corruption, anti-money-laundering and anti-terrorism laws or regulations may result in severe criminal or civil sanctions, and we may be subject to other liabilities, which could have a material adverse effect on our business, financial condition or results of operations.
We are involved in various legal proceedings from time to time.
From time to time we are involved in labor, tax, commercial and other legal and arbitration proceedings, the outcomes of which are difficult to predict. We could become involved in legal and arbitration disputes in the future, which may involve substantial claims for damages or other payments. Such proceedings, individually or in the aggregate, may have a material adverse effect on our business, financial condition or results of operations. See “Business—Legal Proceedings.”
In the event of a negative outcome of any material legal or arbitration proceeding, whether based on a judgment or a settlement agreement, we could be obligated to make substantial payments, which could have a material adverse effect on our business, financial condition or results of operations. In addition, the costs related to litigation and arbitration proceedings may be significant. Even if there is a positive outcome in such proceedings, we may still have to bear part or all of our advisory and other costs to the extent they are not reimbursable by other litigants, insurance or otherwise, which could have a material adverse effect on our business, financial condition or results of operations.
Taxing authorities could challenge our historical and future tax positions or our allocation of taxable income among our subsidiaries, and the tax laws to which we are subject could change in a manner adverse to us.
The amount of income taxes we pay is subject to our interpretation of applicable tax laws in the jurisdictions in which we file. We have taken and will continue to take tax positions based on our interpretation of such tax laws. There can be no assurance that a taxing authority will not have a different interpretation of applicable law and assess us with additional taxes. Similarly, the tax laws to which we are subject could change in a manner unfavorable to us. Additionally, in certain circumstances, we use estimates when calculating our tax liabilities. For example, because we conduct operations, including intercompany transactions, through subsidiaries in numerous tax jurisdictions around the world, we must establish a transfer pricing methodology to account for intercompany transactions. While the transfer pricing methodology we utilize is based on economic studies, it could be challenged by various tax authorities resulting in additional tax liability, interest and penalties. We are regularly under audit by tax authorities, and although we believe that our interpretation of applicable tax laws is correct and our tax estimates are reasonable, the final determinations of such audits could be materially different than those which are reflected in our historical financial statements provided elsewhere in this prospectus. Any
31
Table of Contents
imposition of additional tax liability for historical periods or any change in interpretations, law or our use of estimates in current and future tax periods could have a material adverse effect on our business, financial condition and results of operations.
Cyber risk and the failure to maintain the integrity of our operational or security systems or infrastructure, or those of third parties with which we do business, could have a material adverse effect on our business, financial condition and results of operations.
We are subject to an increasing number of information technology vulnerabilities, threats and targeted computer crimes which pose a risk to the security of our systems and networks and the confidentiality, availability and integrity of our data and trade secrets. Disruptions or failures in the physical infrastructure or operating systems that support our businesses and customers, or cyber attacks or security breaches of our networks or systems, could result in the loss of customers and business opportunities, legal liability, regulatory fines, penalties or intervention, reputational damage, reimbursement or other compensatory costs and additional compliance costs, any of which could materially adversely affect our business, financial condition and results of operations. While we attempt to mitigate these risks, our systems, networks, products, solutions and services remain potentially vulnerable to advanced and persistent threats.
We also maintain and have access to sensitive, confidential or personal data or information in certain of our businesses that is subject to privacy and security laws, regulations and customer controls. Despite our efforts to protect such sensitive, confidential or personal data or information, our facilities and systems and those of our customers and third-party service providers may be vulnerable to security breaches, theft, misplaced or lost data, programming and/or human errors that could lead to the compromising of sensitive, confidential or personal data or information, improper use of our systems, software solutions or networks, unauthorized access, use, disclosure, modification or destruction of information, defective products, production downtimes and operational disruptions, which in turn could adversely affect our consolidated, financial condition and results of operations.
We may be adversely affected by the loss of key customers for our products, and our customer concentration could increase due to industry consolidation.
We are dependent upon the business relationships we have developed with our customers. In addition, we have a concentration of customers in certain of our individual product types. There can be no assurance that our customers will not cease purchasing our products. A significant reduction in sales to customers or a significant change in the commercial terms of our relationship with customers could have a materially adverse effect on our business, financial condition or results of operations.
Some of our largest customers have acquired companies with similar or complementary product lines. This consolidation has increased the concentration of our net sales with our largest customers. In many cases, such consolidation may lead to pricing pressures, concentration of credit risk and fewer opportunities to introduce new products to the market. These consequences may have a material adverse effect on our business, financial condition or results of operations.
Our results could be affected by sudden fluctuations as well as by seasonal changes in demand for our customers’ products.
Some of our customers’ products can experience higher demand as part of their launch or as a result of promotions and advertising campaigns. As a result, our net sales may fluctuate as demand for our customers’ products fluctuate. Our limited ability to scale up production in a short period of time may lead us to lose potential sales or face claims from customers resulting from our inability to deliver higher than usual volumes in a timely manner. Furthermore, our business is subject to seasonal influences. In the first fiscal quarter of each year, we generally realize lower net sales and operating income due to the holiday seasons.
32
Table of Contents
Failure to maintain good employee relations may affect our operations and the success of our business.
As of December 7, 2016, we had approximately 3,600 full time equivalent employees located in 19 countries. Maintaining good relationships with our employees, unions and other employee representatives is important to our ability to successfully implement our business strategies. Any deterioration of the relationships with our employees, unions and other employee representatives could have an adverse effect on our business, financial condition or results of operations.
We estimate that, as of December 7, 2016, approximately 45% of our employees are represented by collective bargaining agreements. Some of our European employees are organized in local unions, and some of our German employees are represented by a chemical industry union. Our employees in the United States are not unionized. In addition, some of our employees are subject to company-level agreements. These agreements typically complement applicable statutory provisions in respect of, among other things, the general working conditions of our employees such as working time, holidays, termination, retirement, welfare and incentives.
We may be unable to extend existing company-specific agreements, renew them on their current terms, or, upon the expiration of such agreements, negotiate such agreements in a favorable and timely manner or without work stoppages, strikes or similar industrial actions. We may also become subject to additional company-specific agreements or amendments to the existing national collective bargaining agreements. Such additional company-specific agreements or amendments may increase our operating costs and have an adverse effect on our business, financial condition or results of operations.
Consultations with works councils, strikes, similar industrial actions or other disturbances by our workforce, particularly where there are union delegates, could disrupt our operations, result in a loss of reputation, increased wages and benefits or otherwise have a material adverse effect on our business, financial condition or results of operations.
We also face the risk of strikes called by employees of our key suppliers of raw materials that could result in interruptions in our production process, or of strikes by employees of our customers that could lead to a disruption of their operations and lead to a reduction in their demand. Any future labor disturbance or work stoppage may have an adverse effect on our business, financial condition or results of operations.
Our insurance coverage may not be adequate to cover all the risks we may face and if we were no longer covered by our existing insurance, it may be difficult to obtain replacement insurance on acceptable terms or at all.
Our insurance policies may not provide adequate coverage for the risks inherent in our business, as these insurance policies typically exclude certain risks, such as war risk and terrorist acts and are subject to certain deductibles, exceptions, thresholds and limits. We cannot assure you that our property, plant and equipment and inventories will not suffer damages due to unforeseen events or that our products may not be defective. Further, the proceeds available from our insurance policies may not be sufficient to protect us from all possible loss or damage resulting from such events. As a result, our insurance coverage may prove to be inadequate for events that may cause significant disruption to our operations or that may result in other losses, which may have a material adverse effect on our business, financial condition or results of operations.
Furthermore, we may be unable to renew insurance policies that are expired on commercially favorable terms, or at all, as a result of which our insurance premiums could increase and our coverage could decrease, both of which could have an adverse effect on our business, financial condition and results of operations.
We are subject to certain competition and antitrust laws.
Our business is subject to applicable competition and antitrust laws, rules and regulations of the United States, the EU and each of the countries in which we operate. As a result, our business could become subject to
33
Table of Contents
an investigation into the strength of our position in any of the product and geographic markets in which we are active, for example as a result of a third party complaint to a relevant national regulatory authority. Given our strong presence in at least some of our markets, such an investigation could give rise to certain obligations or restrictions if we are deemed to have a dominant position in the relevant markets. Such obligations could have a material adverse effect on our business, financial condition or results of operations. Additionally, any infringements of applicable antitrust law could result in fines or other forms of liability or otherwise damage out reputation. In addition, future acquisitions may be subject to merger control approval, which we may be unable to obtain. Any applicable antitrust laws and regulations or a failure to obtain necessary approvals could limit or prevent our ability in certain markets.
Our ability to develop our products depends in part upon the quality and reliability of the facilities, machinery and equipment provided by our technology and telecommunications providers and our reliance on a limited number of suppliers of such technology.
The success of our business depends in part on our ability to provide high quality and reliable products, which in part depends upon the proper functioning of facilities, machinery and equipment (including appropriate hardware and software and technological applications) provided by third parties and our reliance on a limited number of suppliers of such technology, and is, therefore, beyond our control. We are subject to information and communication technology related risks and our information technology landscape is fragmented, with parts centrally driven and other parts locally driven. The centralization of our global IT services increases our exposure to network outages, which might have a material impact on our local and global business. Our computer and data processing systems and related infrastructure (data center, hardware and wide and local area networks) are generally exposed to the risk of disturbances, damage, electricity failures, computer viruses, phishing, fire, other disasters, hacker attacks and similar events. Disruptions to operations or interruptions in operations involving the systems have occurred in individual cases in the past and may occur in the future. Although administration and production networks are secured, an interruption in the operations of computer or data processing could adversely affect our ability to efficiently maintain our production processes and to ensure adequate controls. Disruptions to or interruptions in operations could lead to production downtime, which, in turn, could result in lost net sales. Any one or more of these risks, if they were to materialize, could materially adversely affect our business, financial condition and results of operations.
Risk Factors Relating to Indebtedness
Our high leverage and debt service obligations could adversely affect our business.
We are highly leveraged and have significant debt service obligations. As of September 30, 2016, we had total consolidated debt of $1,307 million (excluding finance leases). In addition, as of September 30, 2016, we had €100 million available for borrowing under our revolving credit facility.
We anticipate that our high leverage will continue for the foreseeable future, which could have important consequences to you, including, but not limited to:
| • | increasing our vulnerability to a downturn in our business or economic and industry conditions; |
| • | limiting our ability to obtain additional financing and increasing the cost of any such financing to fund future working capital requirements, capital expenditures, business opportunities and other corporate requirements; |
| • | requiring the dedication of a substantial portion of our cash flow from operations to the payment of principal of, and interest on, our indebtedness, which means that this cash flow would not be available to fund our operations and for other corporate purposes; |
| • | limiting our flexibility in planning for, or reacting to, changes in our business, the competitive environment and our industry; and |
| • | placing us at a competitive disadvantage relative to a competitor with less leverage. |
34
Table of Contents
Moreover, we may incur substantial additional indebtedness in the future. The terms of the agreements governing our senior indebtedness restrict, but do not prohibit, us from incurring additional debt. If we incur additional indebtedness, the related risks that we now face, as described above and elsewhere in this section, could intensify.
We are subject to restrictive debt covenants, which may limit our operating flexibility.
The agreements governing our senior indebtedness contain covenants that impose significant restrictions on the way we can operate, including restrictions on our ability to:
| • | borrow or guarantee additional indebtedness and issue certain preferred shares; |
| • | layer debt; |
| • | pay dividends, repurchase shares, and make distributions and certain other payments and investments; |
| • | redeem or repurchase indebtedness; |
| • | create liens; |
| • | merge or consolidate with other entities; |
| • | enter into certain transactions with affiliates; and |
| • | sell, lease or transfer certain assets. |
These covenants could limit our ability to operate our business, to finance our future operations and capital needs and our ability to pursue acquisitions and other business activities that may be in our interest. A breach of any of these covenants or restrictions could result in an event of default under such agreement. Upon the occurrence of any event of default under our debt agreements, subject to applicable cure periods and other limitations on acceleration or enforcement, the relevant creditors could cancel the availability of the facility or elect to declare all amounts outstanding thereunder, together with accrued interest, immediately due and payable. In addition, any such default could lead to an event of default and acceleration under other debt instruments that contain cross default or cross acceleration provisions. We cannot assure you that our assets or cash flow would be sufficient to fully repay borrowings under our outstanding debt instruments if accelerated upon an event of default. Further, if we are unable to repay, refinance or restructure our indebtedness, the holders of such debt could proceed against the collateral securing that indebtedness.
The Senior Secured Credit Facilities bear interest at floating rates that could rise significantly, increasing our costs and reducing our cash flow.
Our first lien term loans and revolving credit facility (together, the “Senior Secured Credit Facilities”) bear interest at floating rates of a certain base rate, as adjusted periodically, plus a spread. These interest rates could rise significantly in the future. Although we may enter into and maintain certain hedging arrangements designed to fix a portion of these rates, there can be no assurances that hedging will continue to be available on commercially reasonable terms. Hedging itself carries certain risks, including that we may need to pay a significant amount (including costs) to terminate any hedging arrangement. To the extent interest rates were to rise significantly our interest expense associated with the Senior Secured Credit Facilities would correspondingly increase, reducing our cash flow and hindering our ability to make payments on the Notes.
We may not have enough cash available to service our debt and to sustain our operations.
Our ability to meet our debt service obligations when due and to fund our ongoing operations or to refinance our debt, depends on our future operating and financial performance and our ability to generate cash, which will be affected by our ability to successfully implement our business strategy as well as general economic, financial, competitive, regulatory, legal, technical and other factors, including those discussed in these “Risk Factors,” beyond
35
Table of Contents
our control. If we cannot generate sufficient cash to meet our debt service requirements, we may, among other things, need to refinance all or a portion of our debt, obtain additional financing, delay planned capital expenditures or sell assets. If we are not able to refinance any of our debt, obtain additional financing or sell assets on commercially reasonable terms or at all, we may be unable to satisfy our obligations with respect to our debt. In that event, borrowings under other debt agreements or instruments that contain cross-default or cross-acceleration provisions may become payable on demand, and we may not have sufficient funds to repay all of our debts.
We may be required to write down goodwill or identifiable intangible assets.
Under GAAP, if we determine goodwill or identifiable intangible assets are impaired, we will be required to write down these assets and record a non-cash impairment charge. As of September 30, 2016, we had goodwill of $199.6 million and other acquired intangible assets, net of accumulated amortization, of $362.1 million.
Determining whether an impairment exists and the amount of the potential impairment involves quantitative data and qualitative criteria that are based on estimates and assumptions requiring significant management judgment. Future events or new information may change management’s valuation of an intangible asset in a short amount of time. The timing and amount of impairment charges recorded in our consolidated statements of operations and other comprehensive income and write-downs recorded in our consolidated balance sheets could vary if management’s conclusions change. Any impairment of goodwill or intangible assets could have a material adverse effect on our financial condition and results of operations.
Risks Related to this Offering and Ownership of Our Common Stock
Following the offering, we will be classified as a “controlled company” and, as a result, we will qualify for, and intend to rely on, exemptions from certain corporate governance requirements. You will not have the same protections afforded to stockholders of companies that are subject to such requirements.
After the closing of this offering, SVPGlobal will continue to control a majority of our common stock. As a result, we will be a “controlled company” within the meaning of the applicable stock exchange corporate governance standards. Under the rules of the New York Stock Exchange, a company of which more than 50% of the outstanding voting power is held by an individual, group or another company is a “controlled company” and may elect not to comply with certain stock exchange corporate governance requirements, including:
| • | the requirement that a majority of the board of directors consists of independent directors; |
| • | the requirement that nominating and corporate governance matters be decided solely by independent directors; and |
| • | the requirement that employee and officer compensation matters be decided solely by independent directors. |
Following this offering, we intend to utilize these exemptions. As a result, we may not have a majority of independent directors and our nominating and corporate governance and compensation functions may not be decided solely by independent directors. Accordingly, you will not have the same protections afforded to stockholders of companies that are subject to all of the stock exchange corporate governance requirements.
An active trading market for our common stock may not develop.
Prior to this offering, there has been no public market for our common stock or the common stock of our subsidiaries. The initial public offering price for our common stock will be determined through negotiations between us and the underwriters, and market conditions, and may not be indicative of the market price of our common stock after this offering. If you purchase shares of our common stock, you may not be able to resell those shares at or above the initial public offering price. We cannot predict the extent to which investor interest in the Company will lead to the development of an active trading market on the New York Stock Exchange or how
36
Table of Contents
liquid that market might become. An active public market for our common stock may not develop or be sustained after the offering. If an active public market does not develop or is not sustained, it may be difficult for you to sell your shares of common stock at a price that is attractive to you, or at all.
Our stock price may be volatile or may decline regardless of our operating performance, and you may not be able to resell your shares at or above the initial public offering price.
After this offering, the market price for our common stock is likely to be volatile, in part because our shares have not been traded publicly. In addition, the market price of our common stock may fluctuate significantly in response to a number of factors, many of which we cannot control, including those described under “—Risks Related to Our Business” and the following:
| • | changes in financial estimates by any securities analysts who follow our common stock, our failure to meet these estimates or failure of those analysts to initiate or maintain coverage of our common stock; |
| • | downgrades by any securities analysts who follow our common stock; |
| • | future sales of our common stock by our officers, directors and significant stockholders; |
| • | market conditions or trends in our industry or the economy as a whole and, in particular, in the retail sales environment; |
| • | investors’ perceptions of our prospects; |
| • | announcements by us or our competitors of significant contracts, acquisitions, joint ventures or capital commitments; and |
| • | changes in key personnel. |
In addition, the stock markets have experienced extreme price and volume fluctuations that have affected and continue to affect the market prices of equity securities of many companies, including companies in our industry. In the past, stockholders have instituted securities class action litigation following periods of market volatility. If we were involved in securities litigation, we could incur substantial costs, and our resources and the attention of management could be diverted from our business.
Our majority stockholder will have the ability to control significant corporate activities after the completion of this offering and our majority stockholder’s interests may not coincide with yours.
After the consummation of this offering, Kleopatra Holdings 1, which is controlled by SVPGlobal, will beneficially own approximately % of our common stock, assuming the underwriters do not exercise their option to purchase additional shares. If the underwriters exercise in full their option to purchase additional shares, SVPGlobal will beneficially own approximately % of our common stock. As a result of its ownership, SVPGlobal, so long as it holds a majority of our outstanding shares, will have the ability to control the outcome of matters submitted to a vote of stockholders and, through our Board of Directors, the ability to control decision-making with respect to our business direction and policies. Matters over which SVPGlobal will, directly or indirectly, exercise control following this offering include:
| • | the election of our Board of Directors and the appointment and removal of our officers; |
| • | mergers and other business combination transactions, including proposed transactions that would result in our stockholders receiving a premium price for their shares; |
| • | other acquisitions or dispositions of businesses or assets; |
| • | incurrence of indebtedness and the issuance of equity securities; |
| • | repurchase of stock and payment of dividends; and |
| • | the issuance of shares to management under our equity incentive plans. |
37
Table of Contents
Even if SVPGlobal’s ownership of our shares falls below a majority, it may continue to be able to strongly influence or effectively control our decisions. Under our certificate of incorporation, SVPGlobal and its affiliates (including our directors who are employees of SVPGlobal and its affiliates) will not have any obligation to present to us, and SVPGlobal may separately pursue, corporate opportunities of which they become aware, even if those opportunities are ones that we would have pursued if granted the opportunity. See “Description of Capital Stock—Corporate Opportunity.”
Future sales of our common stock, or the perception in the public markets that these sales may occur, may depress our stock price.
Sales of substantial amounts of our common stock in the public market after this offering, or the perception that these sales could occur, could adversely affect the price of our common stock and could impair our ability to raise capital through the sale of additional shares. Upon completion of this offering, we will have shares of common stock outstanding. The shares of common stock offered in this offering will be freely tradable without restriction under the Securities Act of 1933, as amended (the “Securities Act”), except for any shares of our common stock that may be held or acquired by our directors, executive officers and other affiliates, as that term is defined in the Securities Act.
We, each of our officers and directors and our principal stockholder, Kleopatra Holdings 1, have agreed, subject to certain exceptions, with the underwriters not to dispose of or hedge any of the shares of common stock or securities convertible into or exchangeable for shares of common stock during the period from the date of this prospectus continuing through the date that is 180 days after the date of this prospectus. may, in its sole discretion, release any of these shares from these restrictions at any time without notice. See “Underwriting.”
All of our shares of common stock outstanding as of the date of this prospectus may be sold in the public market by existing stockholders 180 days after the date of this prospectus, subject to applicable volume and other limitations imposed under federal securities laws. In addition, see “Shares Eligible for Future Sale” for a more detailed description of the restrictions on selling shares of our common stock after this offering.
After this offering, subject to any lock-up restrictions described above with respect to certain holders, holders of approximately shares of our common stock will have the right to require us to register the sales of their shares under the Securities Act, under the terms of an agreement between us and the holders of these securities. See “Shares Eligible for Future Sale—Registration Rights” for a more detailed description of these rights.
In the future, we may also issue our securities in connection with investments or acquisitions. The amount of shares of our common stock issued in connection with an investment or acquisition could constitute a material portion of our then-outstanding shares of our common stock. Any common stock that we issue would dilute the percentage ownership held by the investors who purchase common stock in this offering.
As a public company, we will be subject to additional financial and other reporting and corporate governance requirements that may be difficult for us to satisfy and may divert management’s attention from our business.
As a public company, we will be required to file annual and quarterly reports and other information pursuant to the Securities Exchange Act of 1934, as amended (the “Exchange Act”), with the Securities and Exchange Commission (the “SEC”). We will be required to ensure that we have the ability to prepare consolidated financial statements that comply with SEC reporting requirements on a timely basis. We will also be subject to other reporting and corporate governance requirements, including the applicable stock exchange listing standards and certain provisions of the Sarbanes-Oxley Act and the regulations promulgated thereunder, which impose significant compliance obligations on us. Specifically, we will be required to:
| • | prepare and distribute periodic reports and other stockholder communications in compliance with our obligations under the federal securities laws and applicable stock exchange rules; |
38
Table of Contents
| • | create or expand the roles and duties of our Board of Directors and committees of the Board of Directors; |
| • | institute compliance and internal audit functions that are more comprehensive; |
| • | evaluate and maintain our system of internal control over financial reporting, and report on management’s assessment thereof, in compliance with the requirements of Section 404 of the Sarbanes-Oxley Act (“Section 404”) and the related rules and regulations of the SEC and the Public Company Accounting Oversight Board; |
| • | enhance our investor relations function; |
| • | maintain internal policies, including those relating to disclosure controls and procedures; and |
| • | involve and retain outside legal counsel and accountants in connection with the activities listed above. |
As a public company, we will be required to commit significant resources and management time and attention to the above-listed requirements, which will cause us to incur significant costs and which may place a strain on our systems and resources. As a result, our management’s attention might be diverted from other business concerns. In addition, we might not be successful in implementing these requirements. Compliance with these requirements will place significant demands on our legal, accounting and finance staff and on our accounting, financial and information systems and will increase our legal and accounting compliance costs as well as our compensation expense as we may be required to hire additional accounting, tax, finance and legal staff with the requisite technical knowledge.
In addition, the Sarbanes-Oxley Act requires that we maintain effective disclosure controls and procedures and internal control over financial reporting. To maintain and improve the effectiveness of our disclosure controls and procedures, significant resources and management oversight will be required. We will be implementing additional procedures and processes for the purpose of addressing the standards and requirements applicable to public companies. We expect to incur certain additional annual expenses related to these activities and, among other things, additional directors’ and officers’ liability insurance, director fees, reporting requirements, transfer agent fees, hiring additional accounting, legal and administrative personnel, increased auditing and legal fees and similar expenses.
Failure to comply with requirements to design, implement and maintain effective internal controls could have a material adverse effect on our business and stock price.
As a public company, we will have significant requirements for enhanced financial reporting and internal controls. The process of designing and implementing effective internal controls is a continuous effort that requires us to anticipate and react to changes in our business and the economic and regulatory environments and to expend significant resources to maintain a system of internal controls that is adequate to satisfy our reporting obligations as a public company. If we are unable to establish or maintain appropriate internal financial reporting controls and procedures, it could cause us to fail to meet our reporting obligations on a timely basis, result in material misstatements in our consolidated financial statements and harm our operating results. In addition, we will be required, pursuant to Section 404, to furnish a report by management on, among other things, the effectiveness of our internal control over financial reporting for the first fiscal year beginning after the effective date of this offering. This assessment will need to include disclosure of any material weaknesses identified by our management in our internal control over financial reporting, as well as a statement that our auditors have issued an attestation report on effectiveness of our internal controls. Testing and maintaining internal controls may divert our management’s attention from other matters that are important to our business. We may not be able to conclude on an ongoing basis that we have effective internal control over financial reporting in accordance with Section 404 or our independent registered public accounting firm may not issue an unqualified opinion. If either we are unable to conclude that we have effective internal control over financial reporting or our independent registered public accounting firm is unable to provide us with an unqualified report, investors could lose confidence in our reported financial information, which could have a material adverse effect on the trading price of our stock.
39
Table of Contents
Anti-takeover provisions in our charter documents and Delaware law might discourage or delay acquisition attempts for us that you might consider favorable.
Our certificate of incorporation and bylaws will contain provisions that may make the acquisition of the Company more difficult without the approval of our Board of Directors. These provisions:
| • | authorize the issuance of undesignated preferred stock, the terms of which may be established and the shares of which may be issued without stockholder approval, and which may include super voting, special approval, dividend, or other rights or preferences superior to the rights of the holders of common stock; |
| • | upon SVPGlobal no longer controlling a majority of the voting power of our common stock, prohibit stockholder action by written consent, requiring all stockholder actions be taken at a meeting of our stockholders; |
| • | provide that the Board of Directors will be elected to staggered terms; |
| • | require a supermajority vote of stockholders for certain amendments to the charter and bylaws; |
| • | provide that the Board of Directors is expressly authorized to make, alter or repeal our bylaws; and |
| • | establish advance notice requirements for nominations for elections to our Board of Directors or for proposing matters that can be acted upon by stockholders at stockholder meetings. |
These anti-takeover provisions and other provisions under Delaware law could discourage, delay or prevent a transaction involving a change in control of the Company, even if doing so would benefit our stockholders. These provisions could also discourage proxy contests and make it more difficult for you and other stockholders to elect directors of your choosing and to cause us to take other corporate actions you desire. For a further discussion of these and other such anti-takeover provisions, see “Description of Capital Stock—Anti-takeover Effects of Our Certificate of Incorporation and Bylaws.”
If you purchase shares of common stock sold in this offering, you will incur immediate and substantial dilution.
If you purchase shares of common stock in this offering, you will incur immediate and substantial dilution in the amount of $ per share because the initial public offering price of $ per share is substantially higher than the pro forma net tangible book value per share of our outstanding common stock. Dilution results from the fact that the initial public offering price per share of the common stock is substantially in excess of the book value per share of common stock attributable to the existing stockholders for the presently outstanding shares of common stock. In addition, you may also experience additional dilution upon future equity issuances or the exercise of stock options to purchase common stock granted to our employees and directors under our management incentive plan. See “Dilution.”
We will have broad discretion in how we use the proceeds of this offering and we may not use these proceeds effectively. This could affect our results of operations and cause the price of our common stock to decline.
Our management team will have considerable discretion in the application of the net proceeds of this offering, and you will not have the opportunity, as part of your investment decision, to assess whether we are using the proceeds appropriately. We currently intend to use the net proceeds that we receive from this offering to repay outstanding indebtedness and for general corporate purposes. We may use the net proceeds for corporate purposes that do not improve our results of operations or which cause our stock price to decline.
If securities or industry analysts do not publish research or publish inaccurate or unfavorable research about our business, our stock price and trading volume could decline.
The trading market for our common stock will depend in part on the research and reports that securities or industry analysts publish about us or our business. We may not obtain research coverage of our common stock by
40
Table of Contents
securities and industry analysts. If no securities or industry analysts commence coverage of our common stock, the trading price for our common stock would be negatively impacted. If we obtain securities or industry analyst coverage and if one or more of the analysts who covers us downgrades our common stock or publishes inaccurate or unfavorable research about our business, our stock price would likely decline. If one or more of these analysts ceases coverage of us or fails to publish reports on us regularly, demand for our common stock could decrease, which could cause our stock price and trading volume to decline.
Provisions of our certificate of incorporation could have the effect of preventing the Company from having the benefit of certain business opportunities that it may otherwise be entitled to pursue.
Our certificate of incorporation will provide that SVPGlobal and its affiliates (including but not limited to our directors who are employees of SVPGlobal and its affiliates) are not required to offer corporate opportunities of which they become aware to us and could, therefore, offer such opportunities instead to other companies including affiliates of SVPGlobal. In the event that SVPGlobal obtains business opportunities from which we might otherwise benefit but chooses not to present such opportunities to us, these provisions of our certificate of incorporation could have the effect of preventing us from pursuing transactions or relationships that would otherwise be in the best interests of our stockholders. See “Description of Capital Stock—Corporate Opportunity.”
Because we do not intend to pay cash dividends in the foreseeable future, you may not receive any return on investment unless you are able to sell your common stock for a price greater than your purchase price.
The continued operation and expansion of our business will require substantial funding. Accordingly, we do not anticipate that we will pay any cash dividends on shares of our common stock for the foreseeable future. Any determination to pay dividends in the future will be at the discretion of our Board of Directors and will depend upon results of operations, financial condition, contractual restrictions, including those under the Senior Secured Credit Facilities and the Indenture governing the Notes, any potential indebtedness we may incur, restrictions imposed by applicable law and other factors our Board of Directors deems relevant. Accordingly, if you purchase shares in this offering, realization of a gain on your investment will depend on the appreciation of the price of our common stock, which may never occur. Investors seeking cash dividends in the foreseeable future should not purchase our common stock.
We are a holding company with no operations of our own and depend on our subsidiaries for cash.
As a holding company, most of our assets are held by our direct and indirect subsidiaries and we will primarily rely on dividends and other payments or distributions from our subsidiaries to meet our debt service and other obligations and to enable us to pay dividends, if any. The ability of our subsidiaries to pay dividends or make other payments or distributions to us will depend on their respective operating results and may be restricted by, among other things, the laws of their jurisdiction of organization (which may limit the amount of funds available for the payment of dividends or other payments), agreements of those subsidiaries and the terms of any indebtedness we or our subsidiaries have incurred or may incur in the future.
Our certificate of incorporation will designate the Court of Chancery of the State of Delaware as the sole and exclusive forum for certain types of actions and proceedings that may be initiated by our stockholders, which could limit our stockholders’ ability to obtain a favorable judicial forum for disputes with us or our directors, officers or other employees.
Our certificate of incorporation will provide that, unless we consent in writing to the selection of an alternative forum, the Court of Chancery of the State of Delaware will be the exclusive forum for (a) any derivative action or proceeding brought on our behalf, (b) any action asserting a claim for breach of a fiduciary duty owed by any of our directors, officers, employees or agents to us or our stockholders, (c) any action asserting a claim arising pursuant to any provision of the DGCL, our certificate of incorporation or our bylaws;
41
Table of Contents
or (d) any action asserting a claim governed by the internal affairs doctrine. Any person or entity purchasing or otherwise acquiring any interest in shares of our capital stock is deemed to have received notice of and consented to the foregoing provisions. This choice of forum provision may limit a stockholder’s ability to bring a claim in a judicial forum that it finds more favorable for disputes with us or our directors, officers or other employees, which may discourage such lawsuits against us and our directors, officers and employees. Alternatively, if a court were to find this choice of forum provision inapplicable to, or unenforceable in respect of, one or more of the specified types of actions or proceedings, we may incur additional costs associated with resolving such matters in other jurisdictions.
42
Table of Contents
This prospectus contains forward-looking statements that are subject to risks and uncertainties. All statements other than statements of historical fact included in this prospectus are forward-looking statements. Forward-looking statements discuss our current expectations and projections relating to our financial condition, results of operations, plans, objectives, future performance and business. You can identify forward-looking statements by the fact that they do not relate strictly to historical or current facts. These statements may include words such as “aim,” “anticipate,” “believe,” “estimate,” “expect,” “forecast,” “outlook,” “potential,” “project,” “projection,” “plan,” “intend,” “seek,” “believe,” “may,” “could,” “would,” “will,” “should,” “can,” “can have,” “likely,” the negatives thereof and other words and terms of similar meaning in connection with any discussion of the timing or nature of future operating or financial performance or other events. For example, all statements we make relating to our estimated and projected earnings, revenues, costs, expenditures, cash flows, growth rates and financial results, our plans and objectives for future operations, growth or initiatives, strategies, or the expected outcome or impact of pending or threatened litigation are forward-looking statements. All forward-looking statements are subject to risks and uncertainties that may cause actual results to differ materially from those that we expected, including:
| • | volatility in raw material prices utilized for our products or disruptions in the supply of raw materials; |
| • | exposure to sovereign debt and currency instability risks; |
| • | disruptions in the economy and the financial markets; |
| • | financial condition of our customers or suppliers or both; |
| • | risks inherent in the conduct of operations in different countries; |
| • | significant competition in our markets; |
| • | high fixed costs combined with potentially lower net sales; |
| • | changes in packaging regulations and their enforcement; |
| • | our inability to maintain product innovation; |
| • | our inability to develop new products or improve existing products, and delays in the development of new products; |
| • | disruptions in the operations of our manufacturing facilities; |
| • | our inability to fund our relatively high levels of capital investments; |
| • | our inability to successfully consummate acquisitions or integrate acquired businesses; |
| • | our inability to comply with current or future environmental and other governmental requirements; |
| • | GHG emissions and climate change; |
| • | product liability claims; |
| • | detrimental fluctuations in currency exchange rates; |
| • | volatility in energy prices; |
| • | our inability to successfully implement our business and cost reduction strategies; |
| • | disruptions in external transportation or warehousing services; |
| • | higher employment costs; |
| • | failure of our patents, trademarks, models and confidentiality agreements to protect our intellectual property; |
| • | our inability to retain or attract key personnel; |
43
Table of Contents
| • | our inability to comply with the FCPA, trade and economic sanctions and other similar laws; |
| • | costs and liabilities arising from certain litigation in which we may be involved; |
| • | changes in taxation; |
| • | cyber risks and the failure to maintain the integrity of our operational or security systems or infrastructure, or those of third parties; |
| • | the loss of one or more of our major customers; |
| • | sudden fluctuations or seasonal changes in the demand for our customer’s products; |
| • | failure to maintain good employee relations; |
| • | inadequacy of our insurance coverage or inability to obtain a replacement on satisfactory terms in the event of loss of our coverage; |
| • | costs and liabilities imposed by competition and antitrust laws; |
| • | disruptions in our information and communication technology; |
| • | floating interest rates could rise significantly; and |
| • | other factors discussed in more detail under the captions “Risk Factors,” “Management’s Discussion and Analysis of Financial Condition and Results of Operations” and “Business.” |
While we believe that our assumptions are reasonable, we caution that it is very difficult to predict the impact of known factors, and it is impossible for us to anticipate all factors that could affect our actual results. Important factors that could cause actual results to differ materially from our expectations, or cautionary statements, are disclosed under “Risk Factors” and “Management’s Discussion and Analysis of Financial Condition and Results of Operations” in this prospectus. All forward-looking statements are expressly qualified in their entirety by these cautionary statements. You should evaluate all forward-looking statements made in this prospectus in the context of these risks and uncertainties.
We caution you that the important factors referenced above may not contain all of the factors that are important to you. In addition, we cannot assure you that we will realize the results or developments we expect or anticipate or, even if substantially realized, that they will result in the consequences we anticipate or affect us or our operations in the way we expect. The forward-looking statements included in this prospectus are made only as of the date hereof. We undertake no obligation to publicly update or revise any forward-looking statement as a result of new information, future events or otherwise, except as otherwise required by law. If we do update one or more forward-looking statements, no inference should be made that we will make additional updates with respect to those or other forward-looking statements.
44
Table of Contents
We estimate that the proceeds to us from this offering, after deducting estimated underwriting discounts and commissions and offering expenses payable by us, will be approximately $ million, assuming the shares offered by us are sold for $ per share, the midpoint of the price range set forth on the cover of this prospectus.
We intend to use the net proceeds from the sale of common stock by us in this offering to repay outstanding indebtedness and for general corporate purposes.
A $1.00 increase or decrease in the assumed initial public offering price of $ per share, the midpoint of the price range set forth on the cover of this prospectus, would increase or decrease the net proceeds we receive from this offering by approximately $ million, assuming the number of shares offered by us, as set forth on the cover of this prospectus, remains the same. Similarly, each increase or decrease of one million shares in the number of shares of common stock offered by us would increase or decrease the net proceeds we receive from this offering by approximately $ million, assuming the assumed initial public offering price remains the same.
Pending use of the net proceeds from this offering as described above, we may invest the net proceeds in short- and intermediate-term interest-bearing obligations, investment-grade instruments, certificates of deposit or direct or guaranteed obligations of the United States government.
45
Table of Contents
We currently intend to retain all available funds and any future earnings to fund the development and growth of our business, and therefore we do not anticipate paying any cash dividends in the foreseeable future. Additionally, our ability to pay dividends on our common stock will be limited by restrictions on the ability of our subsidiaries and us to pay dividends or make distributions under the terms of current and any future agreements governing our indebtedness. Any future determination to pay dividends will be at the discretion of our Board of Directors, subject to compliance with covenants in our current and future agreements governing our indebtedness, and will depend upon our results of operations, financial condition, capital requirements and other factors that our Board of Directors deems relevant.
In addition, since we are a holding company, substantially all of the assets shown on our consolidated balance sheet are held by our subsidiaries. Accordingly, our earnings, cash flow and ability to pay dividends are largely dependent upon the earnings and cash flows of our subsidiaries and the distribution or other payment of such earnings to us in the form of dividends.
46
Table of Contents
The following table sets forth our cash and cash equivalents, indebtedness and our capitalization as of September 30, 2016 on:
| • | an actual basis; and |
| • | an adjusted basis to give effect to the following: |
| i. | the sale of shares of our common stock in this offering by us at an assumed initial public offering price of $ per share, the midpoint of the price range set forth on the cover of this prospectus, after deducting estimated underwriting discounts and commissions and estimated offering expenses payable by us; |
| ii. | the application of the net proceeds from this offering to us as described under “Use of Proceeds;” and |
| iii. | our entry into the First Amendment to our existing credit agreement and the application of the proceeds therefrom. |
You should read the following table in conjunction with the sections entitled “Use of Proceeds,” “Selected Historical Consolidated Financial and Other Data,” “Management’s Discussion and Analysis of Financial Condition and Results of Operations” and our consolidated financial statements and related notes included elsewhere in this prospectus.
| September 30, 2016 | ||||||||
| Actual | As Adjusted (1) | |||||||
| (in thousands) | ||||||||
| Cash and cash equivalents |
$ | 116,008 | $ | |||||
|
|
|
|
|
|||||
| Debt: |
||||||||
| First Lien Term Loan |
$ | 958,460 | $ | |||||
| Revolving Credit Facility |
— | |||||||
| 7 1⁄8% Senior Notes due 2020 |
334,830 | |||||||
| Other Debt |
20,396 | |||||||
|
|
|
|
|
|||||
| Total debt |
1,313,686 | |||||||
| Stockholders’ Equity: |
||||||||
| Common shares, €1.00 par value; 100,000,000,000 shares authorized, 1,756,490 shares issued and outstanding, actual; no shares authorized, no shares issued and outstanding, on an as adjusted basis |
2,303 | |||||||
| Common stock, $0.001 par value; no shares authorized, no shares issued and outstanding, actual; shares authorized, shares issued and outstanding, on an as adjusted basis |
— | |||||||
| Additional paid-in capital |
10,832 | |||||||
| Accumulated deficit |
(520,535 | ) | ||||||
| Accumulated other comprehensive income |
39,293 | |||||||
| Treasury stock |
— | |||||||
|
|
|
|
|
|||||
| Total stockholders’ deficit |
(468,107 | ) | ||||||
|
|
|
|
|
|||||
| Total capitalization |
$ | 845,579 | $ | |||||
|
|
|
|
|
|||||
| (1) | A $1.00 increase or decrease in the assumed initial public offering price of $ per share, the midpoint of the price range set forth on the cover of this prospectus, would increase or decrease the amount of cash and cash equivalents, additional paid-in capital, total stockholders’ equity and total capitalization by approximately $ million, assuming the number of shares offered by us, as set forth on the cover of this prospectus, remains the same and after deducting underwriting discounts and commissions and estimated offering expenses payable by us. Similarly, each increase or decrease of one million shares in the number of shares of common stock offered by us would increase or decrease the amount of cash and cash equivalents, additional paid-in capital, total stockholders’ equity and total capitalization by approximately $ million, assuming the assumed initial public offering price remains the same. |
47
Table of Contents
If you invest in our common stock, your ownership interest will be immediately diluted to the extent of the difference between the initial public offering price per share of our common stock and the net tangible book value per share of our common stock after this offering. Dilution results from the fact that the initial public offering price per share of the common stock is substantially in excess of the book value per share of common stock attributable to the existing stockholders for the presently outstanding shares of common stock.
Our net tangible book deficit as of was $ million, or $ per share of common stock (after giving effect to this offering). Net tangible book value per share represents the amount of our total tangible assets (which for the purpose of this calculation excludes capitalized debt issuance costs) less total liabilities, divided by the basic weighted average number of shares of common stock outstanding.
After giving effect to the sale of the shares of common stock offered by us in this offering at an assumed initial public offering price of $ per share, which is the midpoint of the price range set forth on the cover of this prospectus, less estimated underwriting discounts and commissions and estimated offering expenses, our pro forma net tangible book value (deficit) as of would have been approximately $ million, or $ per share of common stock. This represents an immediate increase in net tangible book value to our existing stockholders of $ per share and an immediate dilution to new investors in this offering of $ per share. The following table illustrates this pro forma per share dilution in net tangible book value to new investors.
| Assumed initial public offering price per share |
$ | $ | ||||||
| Pro forma net tangible book value (deficit) per share as of |
||||||||
| Increase per share attributable to new investors |
||||||||
| Pro forma net tangible book value per share after this offering |
||||||||
|
|
|
|
|
|||||
| Dilution per share to new investors |
$ | $ | ||||||
|
|
|
|
|
A $1.00 increase or decrease in the assumed initial public offering price of $ per share, the midpoint of the price range set forth on the cover of this prospectus, would increase or decrease net tangible book value by $ million, or $ per share, and would increase or decrease the dilution per share to new investors by $ based on the assumptions set forth above.
The following table summarizes as of , on an as adjusted basis, the number of shares of common stock purchased, the total consideration paid and the average price per share paid by the equity grant recipients and by new investors, based upon an assumed initial public offering price of $ per share (the midpoint of the initial public offering price range), before deducting estimated underwriting discounts and commissions and offering expenses:
| Shares Purchased | Total Consideration | Average Price Per Share |
||||||||||||||||||
| Number | Percent | Amount | Percent | |||||||||||||||||
| Existing stockholders |
% | $ | % | $ | ||||||||||||||||
| New investors |
||||||||||||||||||||
|
|
|
|
|
|
|
|
|
|||||||||||||
| Total |
100 | % | $ | 100 | % | |||||||||||||||
|
|
|
|
|
|
|
|
|
|||||||||||||
Except as otherwise indicated, the discussion and tables above assume no exercise of the underwriters’ option to purchase additional shares and no exercise of any outstanding options. If the underwriters’ option to purchase additional shares is exercised in full, our existing stockholders would own approximately % and our new investors would own approximately % of the total number of shares of our common stock outstanding after this offering. If the underwriters exercise their option to purchase additional shares in full, the pro forma net tangible book value per share after this offering would be $ per share, and the dilution in the pro forma net tangible book value per share to new investors in this offering would be $ per share.
48
Table of Contents
The tables and calculations above are based on shares of common stock outstanding as of and assume no exercise by the underwriters of their option to purchase up to an additional shares from us. This number excludes, as of , an aggregate of shares of common stock reserved for issuance under our equity incentive plan that we intend to adopt in connection with this offering.
To the extent that any outstanding options are exercised, new investors will experience further dilution. As of , shares of common stock were issuable upon the exercise of outstanding options at a weighted-average exercise price of $ per share. If all of our outstanding options had been exercised as of , our pro forma net tangible book value as of would have been approximately $ million, or $ per share of our common stock, and the pro forma net tangible book value after giving effect to this offering would have been $ per share, representing dilution in our pro forma net tangible book value per share to new investors of $ .
49
Table of Contents
SELECTED HISTORICAL CONSOLIDATED FINANCIAL AND OTHER DATA
The following table presents selected historical consolidated financial data and certain other financial data. The historical consolidated balance sheet data for fiscal 2016 and fiscal 2015, and consolidated statement of operations data and consolidated statement of cash flows data for fiscal 2016, fiscal 2015 and fiscal 2014 have been derived from our historical audited consolidated financial statements which are included in this prospectus. The historical consolidated balance sheet data, statement of operations data and consolidated statement of cash flows data as of and for September 30, 2014, September 30, 2013, the period from July 1, 2012 to September 30, 2012 and the consolidated balance sheet data as of September 30, 2012 are derived from our accounting records.
The historical consolidated financial data and other financial data presented below should be read in conjunction with our audited consolidated financial statements and the related notes thereto and our unaudited condensed consolidated financial statements and the related notes thereto, included elsewhere in this prospectus, and the section entitled “Management’s Discussion and Analysis of Financial Condition and Results of Operations.” Our historical consolidated financial data may not be indicative of our future performance.
| Fiscal Year Ended September 30, | Three Months Ended September 30, |
|||||||||||||||||||
| (in thousands) | 2016 | 2015 | 2014 | 2013 | 2012 | |||||||||||||||
| Net Sales |
$ | 1,403,454 | $ | 1,480,313 | $ | 1,620,807 | 1,550,023 | 391,312 | ||||||||||||
| Cost of Sales |
1,102,414 | 1,193,595 | 1,311,635 | 1,274,538 | 326,253 | |||||||||||||||
|
|
|
|
|
|
|
|
|
|
|
|||||||||||
| Gross Profit |
301,040 | 286,718 | 309,172 | 275,485 | 65,059 | |||||||||||||||
| Selling, general and administrative expenses |
171,098 | 186,054 | 174,754 | 173,023 | 48,005 | |||||||||||||||
| Other expenses, net |
28,194 | 10,856 | 12,853 | 5,490 | 5,888 | |||||||||||||||
| Impairment charges |
— | — | — | 21,122 | — | |||||||||||||||
|
|
|
|
|
|
|
|
|
|
|
|||||||||||
| Operating Income |
101,748 | 89,808 | 121,565 | 75,849 | 11,166 | |||||||||||||||
| Interest and other debt expense, net |
93,260 | 482,333 | 158,853 | 136,557 | 44,272 | |||||||||||||||
| Foreign currency gains and (losses) on financing |
(12,492 | ) | (6,941 | ) | 4,725 | (790 | ) | 3,828 | ||||||||||||
|
|
|
|
|
|
|
|
|
|
|
|||||||||||
| Loss before income taxes and equity income of equity method investees |
(4,004 | ) | (399,466 | ) | (32,563 | ) | (61,498 | ) | (29,278 | ) | ||||||||||
| Income tax expense/(benefit) |
8,425 | (38,037 | ) | 19,407 | 14,580 | 7,886 | ||||||||||||||
|
|
|
|
|
|
|
|
|
|
|
|||||||||||
| Loss before equity income of equity method investees |
(12,429 | ) | (361,429 | ) | (51,970 | ) | (76,078 | ) | (21,393 | ) | ||||||||||
| Equity income of equity method investees |
832 | 317 | 635 | 727 | 253 | |||||||||||||||
|
|
|
|
|
|
|
|
|
|
|
|||||||||||
| Net Loss |
$ | (11,597 | ) | $ | (361,112 | ) | $ | (51,335 | ) | (75,351 | ) | (21,140 | ) | |||||||
| As of September 30, | ||||||||||||||||||||
| 2016 | 2015 | 2014 | 2013 | 2012 | ||||||||||||||||
| Consolidated Balance Sheet Data |
||||||||||||||||||||
| Cash |
$ | 116,008 | $ | 103,906 | $ | 149,522 | 186,908 | 122,196 | ||||||||||||
| Total assets |
1,351,856 | 1,361,908 | 1,579,205 | 1,705,285 | 1,696,005 | |||||||||||||||
| Total shareholders’ deficit |
468,107 | 461,737 | 154,212 | 113,237 | 26,501 | |||||||||||||||
| Total liabilities |
1,819,963 | 1,823,645 | 1,733,417 | 1,818,521 | 1,722,506 | |||||||||||||||
50
Table of Contents
MANAGEMENT’S DISCUSSION AND ANALYSIS OF FINANCIAL CONDITION
AND RESULTS OF OPERATIONS
The following discussion and analysis of our financial condition and results of operations should be read in conjunction with “Selected Historical Consolidated Financial and Other Data” and our audited and unaudited financial statements and related notes appearing elsewhere in this prospectus. Our results may not be indicative of our future performance. This discussion and analysis contains forward-looking statements and involves numerous risks and uncertainties, including, but not limited to, those discussed in “Forward-Looking Statements” and “Risk Factors.” Our actual results may differ materially from those contained in any forward-looking statements.
This Management’s Discussion and Analysis of Financial Condition and Results of Operations contains certain financial measures, in particular the presentation of EBITDA and Adjusted EBITDA, which are not presented in accordance with generally accepted accounting principles in the U.S. (“GAAP”). These non-GAAP financial measures are being presented because they provide the Company and readers of this prospectus with additional insight into our operational performance relative to earlier periods. We do not intend for these non-GAAP financial measures to be a substitute for any GAAP financial information. Readers of this prospectus should use these non-GAAP financial measures only in conjunction with the comparable GAAP financial measures. Reconciliations of such non-GAAP measures to the most comparable GAAP measure are provided, elsewhere in this prospectus. See Notes (a) and (b) in “Summary—Summary Historical Consolidated Financial and Other Data.”
In certain of our discussion of operating results, we have excluded the impact of fluctuations in foreign currency exchange rates by presenting the FX Neutral Change, which is a non-GAAP financial measure. We believe presenting the FX Neutral Change provides valuable supplemental information regarding our results of operations. We calculate the FX Neutral Change by converting our current period local currency financial information using the prior period foreign currency average exchange rates and comparing these adjusted amounts to our prior period reported results. This calculation may differ from similarly titled measures used by other companies and, accordingly, the FX Neutral Change is not meant to substitute for changes in recorded amounts presented in conformity with GAAP nor should such amounts be considered in isolation.
Net Price means the component of gross profit that reflects the favorable or unfavorable changes in the spread between selling prices and raw material prices.
Overview
We are the leading global provider in the rigid plastic film industry with highly complementary capabilities in semi-rigid and flexible films used in packaging and other protective film applications. Our primary end-markets include pharmaceutical, medical devices, and food and beverage, as well as applications for other consumer and industrial products. We sell a wide range of custom rigid plastic films, including many proprietary solutions, which we believe provide mission-critical safety and security functions and enhance performance or drive end-user pull-through on the shelf. We have established ourselves as a leading supplier of rigid plastic films in the value chain for packaging, label and surface protection, among others, due to our expertise in compounding, formulation, calendering, extrusion, surface treatment and converting. We believe we are the leader in many of our end-markets, with approximately 75% of our fiscal 2016 net sales from end-markets where we hold a top 3 market position.
Within the markets we serve, we have one of the broadest product portfolios across a variety of polymers. Our manufacturing footprint across North America, South America, Europe and Asia Pacific allows us to serve our customers locally, offering customized solutions while maintaining the highest production standards. Starting with over 250 base formulations, we have created more than 4,800 customer-driven formulations. In fiscal 2016 alone we completed more than 1,400 formulation changes, of which over 350 were on single customer requests. The application of value-added secondary processes has resulted in a product suite of more than 17,000 SKUs.
51
Table of Contents
The size and scope of our existing material science capabilities allow us to remain a leader of innovation in the industry and meet and exceed the unique requirements of our customers for highly technical applications.
We serve customers through four market-oriented segments: Pharma, Food & Consumer Packaging, Labels and Specialties. Our core end-markets have varying but complementary growth drivers and are generally non-cyclical in nature. In our Pharma segment, we benefit from the rising need for innovative packaging solutions, the aging global population and increasing generic penetration. In our Labels segment, the drive to enhance and differentiate the look and appearance of consumer products has led to increased demand for the more vibrant and flexible packaging capabilities provided by shrink sleeve films. In addition to end-market specific drivers, we expect to benefit from positive macro trends such as a growing middle class in emerging markets and increased spend on consumer and healthcare products.
Our Segments
Following a management reorganization effective October 1, 2016, the Company’s operations are organized into four reportable segments: Pharma, Food & Consumer Packaging, Labels and Specialties. Historically, the Company’s operations were organized on a geographic regional basis. The periods presented in these financial statements have been recast accordingly.
The Pharma segment manufactures an extensive range of pharmaceutical packaging rigid films, including multi-layer barrier films for blister packaging as well as mono-layer barrier and multi-layer polymer films for sterile packaging of medical devices, such as surgical tools.
The Food & Consumer Packaging segment product portfolio consists mainly of mono-layer and multi-layer rigid films based on a wide variety of polymers. We produce films used in the packaging of fresh and pre-prepared foods, including sandwiches, salads, pasta, meat, cheese and fish. Our films are designed to provide heat resistance and specialized barrier properties to protect against moisture and oxygen and to improve the appearance, appeal and shelf life of packaged food products. Our rigid plastic films are also used by our global customers in a broad range of other packaging applications, including packaging for electronic components, cosmetics, household goods, personal care and lighting products.
The Labels segment offers a broad range of label products for customers in the beverage and electronic battery end-markets. Our films are used for bottle wrap labels, tamper resistant closures, wine bottle capsules and battery wraps. With full color photographic images that wrap 360 degrees around containers, our customized products enhance the shelf appeal and marketability of the end product. In addition, our products can enhance the performance and functionality of the end product (such as UV protection in the case of full body shrink labels). We continue to introduce new products and build additional capacity to support this segment, with a focus on performance, differentiation and recyclability.
The Specialties segment consists of an actively managed portfolio of distinctive application solutions that require a high level of technical collaboration with our customer base. For example, we produce a full portfolio of core and overlay films for specific card applications (such as gift cards). These solutions need to provide extended durability, increased security and greater design flexibility. Our film solutions for decorative flooring were developed in response to customer needs for wear resistance and superior durability in Luxury Vinyl Tiles. Other application solutions can be found in areas such as specialized printing and other decorative surfaces.
Factors Affecting Our Results of Operations
Competition and Market Trends
We currently operate facilities in 13 countries and sell our products in approximately 80 countries in four key geographic regions: North America, Europe, South America and Asia Pacific. Net sales generated from
52
Table of Contents
North America, Europe, South America and Asia Pacific were $564.4 million, $604.1 million, $104.4 million and $130.6 million in fiscal 2016.
We serve customers in stable, steady growth markets in Europe and North America and emerging growth markets in Central and Eastern Europe. Our growth in these markets generally correlates to, among other things, economic conditions, overall demand in the market, our ability to take market share from our competitors, population growth and growth in consumer price indices. In these markets, we are competing with a number of manufacturers that produce similar types of packaging and alternative packaging solutions. Levels of competition, the ability of our competitors to address customer demands more effectively than us or the ability of our competitors to otherwise attract customers through competitive prices or other factors may affect our results of operations. While cost pressures in rigid packaging make it difficult for small players to compete on high-volume products, small- and medium-sized competitors frequently focus on niche products for household chemicals, personal care products, food, or automotive retail products to gain a competitive advantage. Smaller players can differentiate themselves in these areas through value-added services such as shrink-sleeve labeling and custom design. We primarily compete with smaller players in our segments in Europe and the Americas. Margins in our more steady growth markets in Europe and North America are typically driven by a well-balanced mix between lower-volume products with higher margins and higher-volume products with lower margins.
Growth in emerging markets, such as Asia (specifically, China and Thailand) and South America (specifically, Brazil), that are less mature, however, is characterized by an increasingly broad distribution of wealth, high population growth, a reduction of trade and other barriers, an increased amount of retail and distribution infrastructure and growth in local manufacturing capabilities. As a result, emerging markets have driven a large percentage of the global growth in polyvinyl chloride (“PVC”) and polyethylene terephthalate (“PET”) products in recent years. Our recently constructed manufacturing facility in China commenced operations in summer 2013 and we are making investments to increase capacity at our existing facilities in Brazil and Argentina in order to capture growth in these emerging markets. Our net sales will be affected from period to period by the continued growth of these emerging markets and our ability to penetrate these emerging markets and capture market share. In Asia Pacific and South America, margins are primarily driven by our more specialized product portfolio including pharma and labels.
Changes in Prices of Raw Materials and Fuels
We currently manufacture approximately 90% of our products in Europe, the United Kingdom, the United States and Canada.
Cost of materials represents the single largest component of our costs of sales and accounted for approximately 52% of our net sales in fiscal 2016. The principal raw materials we use to manufacture our products are resins and additives. The price of resins and certain other raw materials is a function of supply and demand, suppliers’ capacity utilization, industry and consumer sentiment and prices for crude oil, natural gas and other raw materials.
Changes in the prices of the raw materials that we use may affect our profitability. To mitigate our exposure to price fluctuation, we historically carried out raw material purchasing activities locally in the various regions in which we operate. We have recently globalized and streamlined our procurement process by establishing an integrated global purchasing organization to coordinate the purchase of our key raw materials, leverage our advantageous purchasing scale and establish new purchasing opportunities. In addition, some of our customer contracts contain escalator clauses with formulas linked to raw material indices. These arrangements typically allow for raw material pass-through pricing with a time lag depending on specific terms of the contract.
We take various actions to reduce overall raw materials and energy expense and exposure to price fluctuations. We generally seek to pass increased materials costs to our customers through a variety of means,
53
Table of Contents
which differ among our segments and product lines. Contractual relationships vary across product groups and geographies:
| • | Pharma: approximately 45% by volume of our Pharma contracts rely on escalator clauses where our agreements typically have a term of between one and three years with quarterly escalator reviews and generally include volatile resin clauses. |
| • | Food & Consumer Packaging: approximately 35% by volume of our Food & Consumer Packaging contracts rely on escalator clauses. The agreements typically have a term of six months, with the need to renegotiate the price at the end of each contract period. The lower percentage of contracts with escalator clauses leaves the potential to further implement contractual pass-through mechanisms. |
| • | Labels: approximately 15% by volume of our Labels contracts rely on escalator clauses. The agreements typically have a term of between one and three months, with the need to renegotiate the price at the end of each contract period. The lower percentage of contracts with escalator clauses leaves the potential to further implement contractual pass-through mechanisms. |
| • | Specialties: approximately 35% by volume of our Specialty contracts rely on escalator clauses. The agreements typically have a term of between one to three months, with the need to renegotiate the price at the end of each contract period. The lower percentage of contracts with clauses leaves the potential to further implement contractual pass-through mechanisms. |
Foreign Currency Exchange Rates
Our reported results of operation and financial condition are affected by exchange rate fluctuation and we are exposed to both transactional and translational risk due to these fluctuations. Transactional risk arises when our subsidiaries execute transactions in a currency other than their functional currency. Translation risk arises when we translate the assets, liabilities, income and expenses of all of our operations with a functional currency other than our reporting currency, the U.S. dollar, into the U.S. dollar at then-applicable exchange rates. These transaction and translation risks could significantly affect the comparability of our results between financial periods and result in significant changes to the carrying value of our assets, liabilities and stockholders’ equity. Refer to “Quantitative and Qualitative Disclosures about Market Risks and Operating Risk—Foreign Exchange Risk” for additional discussion of our risks around foreign currency exchange and how we manage that risk.
Recent Developments
On October 31, 2016, we acquired Farmamak Ambalag, a leading solutions provider for packaging solutions in the Turkish and European markets. Farmamak, located near Istanbul, Turkey, has approximately 55,000 tons of capacity across seven extrusion lines for PET, PP & PS as well as three PVC calender lines. Farmamak has multi-layer, lamination and metallization capabilities.
In connection with the Farmamak Acquisition, we entered into an amendment to our existing credit agreement (the “First Amendment”), which provides for, among other things, an incremental term loan in an aggregate principal amount of €85 million. The proceeds from the incremental term loan were used, in part, to fund the Farmamak Acquisition, with the remainder to be used for working capital and general corporate purposes. For further information regarding our credit agreement and the incremental term loan, see “Description of Certain Indebtedness—Senior Secured Credit Facilities.”
Key Components of Financial Results
Net Sales
Net sales comprise gross revenue net of provisions for product returns, discount and rebate agreements, and freight charged to customers and after eliminating intercompany sales.
54
Table of Contents
Cost of Sales
Cost of sales includes cost of materials and other manufacturing costs.
Cost of materials includes, among other costs, raw material costs (such as costs for the purchase of resins and additives), rework material costs and payments for outside services related to the manufacturing of film, freight costs related to the selling of our products, semi-finished goods and trading goods, adjusted for the change in finished goods inventory.
Other manufacturing costs include packaging, energy, production personnel, maintenance and depreciation. We refer to the sum of cost of materials and other manufacturing costs as cost of sales.
Selling, General and Administrative Expenses
Selling, general and administrative expenses consist primarily of personnel costs, including salaries, commissions, bonuses, share-based compensation and related benefits and taxes; professional fees, including consulting, legal and accounting services; and other supporting overhead costs, including facilities and depreciation.
Other Expenses, Net
Other income and expense consists primarily of certain restructuring costs and foreign exchange gains and losses attributable to fluctuations of the transactional currency against the local currencies.
Interest and Other Debt Expense, Net
Interest and other debt expense, net includes interest income and expense (including non-cash interest expense relating to our preferred equity certificates (“PECs”) and tracking preferred equity certificates (“TPECs”)), interest costs relating to defined benefit pension plans, amortization of ancillary costs incurred in connection with the arrangement of borrowings and lease finance charges.
Foreign Currency Gains and (Losses) on Financing
Foreign currency gains and (losses) on financing consists primarily of gains and losses resulting from foreign currency transactions related to the Company’s intercompany foreign currency debt.
Income Tax Expense/(Benefit)
Income tax expense comprises current and deferred tax expense.
Income tax expense is recognized in profit or loss except to the extent that it relates to items recognized directly in equity, in which case it is recognized in equity. Current tax is the expected tax payable on the taxable income for the period, using tax rates enacted or substantively enacted at the reporting date, and any adjustment to tax payable in respect of previous periods, adjusted by changes in deferred tax assets and liabilities attributable to temporary differences between the tax bases of assets and liabilities and their carrying amounts in the financial statements, and by the availability of unused tax losses.
Equity Income of Equity Method Investees
Equity income of equity method investees includes income from our investment in Vinyl Solutions LLC, a joint venture.
55
Table of Contents
Consolidated Results of Operations
The table below presents our results of operations for the respective periods.
| Fiscal Year Ended September 30, | ||||||||||||
| (in thousands) | 2016 | 2015 | 2014 | |||||||||
| Net Sales |
$ | 1,403,454 | $ | 1,480,313 | $ | 1,620,807 | ||||||
| Cost of Sales |
1,102,414 | 1,193,595 | 1,311,635 | |||||||||
|
|
|
|
|
|
|
|||||||
| Gross Profit |
301,040 | 286,718 | 309,172 | |||||||||
| Selling, general and administrative expenses |
171,098 | 186,054 | 174,754 | |||||||||
| Other expenses, net |
28,194 | 10,856 | 12,853 | |||||||||
|
|
|
|
|
|
|
|||||||
| Operating Income |
101,748 | 89,808 | 121,565 | |||||||||
| Interest and other debt expense, net |
93,260 | 482,333 | 158,853 | |||||||||
| Foreign currency gains and (losses) on financing |
(12,492 | ) | (6,941 | ) | 4,725 | |||||||
|
|
|
|
|
|
|
|||||||
| Loss before income taxes and equity income of equity method investees |
(4,004 | ) | (399,466 | ) | (32,563 | ) | ||||||
| Income tax expense/(benefit) |
8,425 | (38,037 | ) | 19,407 | ||||||||
|
|
|
|
|
|
|
|||||||
| Loss before equity income of equity method investees |
(12,429 | ) | (361,429 | ) | (51,970 | ) | ||||||
| Equity income of equity method investees |
832 | 317 | 635 | |||||||||
|
|
|
|
|
|
|
|||||||
| Net Loss |
$ | (11,597 | ) | $ | (361,112 | ) | $ | (51,335 | ) | |||
Set forth below is a table reconciling net income to EBITDA and Adjusted EBITDA for the respective periods. See “Prospectus Summary—Summary Historical Consolidated Financial and Other Data” for additional detail on these metrics and the limitations on usefulness.
| Fiscal Year Ended September 30, | ||||||||||||
| (in thousands) | 2016 | 2015 | 2014 | |||||||||
| Net Loss |
$ | (11,597 | ) | $ | (361,112 | ) | $ | (51,335 | ) | |||
| Equity income of equity method investees |
(832 | ) | (317 | ) | (635 | ) | ||||||
| Income tax expense/(benefit) |
8,425 | (38,037 | ) | 19,407 | ||||||||
| Foreign currency losses/(gains) on financing |
12,492 | 6,941 | (4,725 | ) | ||||||||
| Interest and other debt expense, net |
93,260 | 482,333 | 158,853 | |||||||||
| Depreciation and amortization |
97,683 | 105,916 | 112,320 | |||||||||
|
|
|
|
|
|
|
|||||||
| EBITDA |
199,431 | 195,723 | 233,886 | |||||||||
|
|
|
|
|
|
|
|||||||
| Restructuring costs(1) |
17,078 | 7,882 | 9,936 | |||||||||
| Share-based compensation(2) |
8,527 | — | — | |||||||||
| IPO preparation(3) |
8,286 | 1,502 | — | |||||||||
| Other(4) |
9,589 | 36,750 | 5,364 | |||||||||
|
|
|
|
|
|
|
|||||||
| Adjusted EBITDA |
$ | 242,911 | $ | 241,857 | $ | 249,185 | ||||||
|
|
|
|
|
|
|
|||||||
| (1) | Consists of fees and expenses related to operational restructuring. |
| (2) | Share-based compensation relates to restricted stock granted to certain employees. |
| (3) | In 2016, these consist of the GAAP financial statement preparation, Sarbanes-Oxley compliance preparation and other preparation. |
| (4) | Other non-recurring adjustments consist primarily of transaction costs, refinancing costs, exceptional litigations and other special items. |
The table below shows our reported growth and growth excluding foreign currency in net sales, gross profit, operating income, and Adjusted EBITDA growth on a consolidated level and our reported growth and growth excluding translation in net sales and gross profit on a segment level. Because of the impact of raw material costs
56
Table of Contents
on net sales, management focuses on gross profit rather than net sales to evaluate the operating performance of the segments. Adjusted EBITDA is our principal consolidated measure of profitability.
| Fiscal Year Ended September 30, | ||||||||||||
| (in thousands, other than percentages) | 2016 | 2015 | 2014 | |||||||||
| Consolidated net sales |
$ | 1,403,454 | $ | 1,480,313 | $ | 1,620,807 | ||||||
| Reported Growth |
(5.2 | )% | (8.7 | )% | 4.6 | % | ||||||
| FX Neutral Change* |
(0.4 | )% | 0.7 | % | 4.8 | % | ||||||
| Consolidated gross profit |
301,040 | 286,718 | 309,172 | |||||||||
| Reported Growth |
5.0 | % | (7.3 | )% | 12.2 | % | ||||||
| FX Neutral Change* |
10.0 | % | 0.7 | % | 12.7 | % | ||||||
| Consolidated operating income |
101,748 | 89,808 | 121,565 | |||||||||
| Reported Growth |
13.3 | % | (26.1 | )% | 60.3 | % | ||||||
| FX Neutral Change* |
21.7 | % | (23.6 | )% | 63.5 | % | ||||||
| Consolidated adjusted EBITDA |
242,911 | 241,857 | 249,185 | |||||||||
| Reported Growth |
0.4 | % | (2.9 | )% | 10.4 | % | ||||||
| FX Neutral Change* |
5.3 | % | 5.1 | % | 10.8 | % | ||||||
| Pharma |
||||||||||||
| Net sales |
$ | 369,084 | $ | 370,543 | $ | 407,101 | ||||||
| Reported Growth |
(0.4 | )% | (9.0 | )% | 6.1 | % | ||||||
| FX Neutral Change* |
9.2 | % | 1.9 | % | 9.2 | % | ||||||
| Gross profit |
94,987 | 92,255 | 99,322 | |||||||||
| Reported Growth |
3.0 | % | (7.1 | )% | 8.4 | % | ||||||
| FX Neutral Change* |
18.0 | % | 4.4 | % | 14.1 | % | ||||||
| Food and Consumer Packaging |
||||||||||||
| Net sales |
$ | 514,620 | $ | 548,486 | $ | 602,699 | ||||||
| Reported Growth |
(6.2 | )% | (9.0 | )% | 4.9 | % | ||||||
| FX Neutral Change* |
(2.5 | )% | 1.9 | % | 4.3 | % | ||||||
| Gross profit |
97,585 | 90,059 | 94,966 | |||||||||
| Reported Growth |
8.4 | % | (5.2 | )% | 10.9 | % | ||||||
| FX Neutral Change* |
9.0 | % | 4.5 | % | 9.6 | % | ||||||
| Labels |
||||||||||||
| Net sales |
$ | 193,570 | $ | 209,208 | $ | 207,982 | ||||||
| Reported Growth |
(7.5 | )% | 0.6 | % | 3.4 | % | ||||||
| FX Neutral Change* |
(4.4 | )% | 7.1 | % | 3.3 | % | ||||||
| Gross profit |
41,590 | 38,048 | 33,732 | |||||||||
| Reported Growth |
9.3 | % | 12.8 | % | 4.3 | % | ||||||
| FX Neutral Change* |
10.0 | % | 15.6 | % | 3.5 | % | ||||||
| Specialties |
||||||||||||
| Net sales |
$ | 307,724 | $ | 323,550 | $ | 374,801 | ||||||
| Reported Growth |
(4.9 | )% | (13.7 | )% | 3.0 | % | ||||||
| FX Neutral Change* |
(2.3 | )% | (5.9 | )% | 1.6 | % | ||||||
| Gross profit |
76,437 | 82,416 | 93,382 | |||||||||
| Reported Growth |
(7.3 | )% | (11.7 | )% | 18.8 | % | ||||||
| FX Neutral Change* |
(7.6 | )% | (5.0 | )% | 15.2 | % | ||||||
| Corporate/other |
||||||||||||
| Net sales |
$ | 18,456 | $ | 28,526 | $ | 28,224 | ||||||
| Reported Growth |
(35.3 | )% | 1.1 | % | 6.2 | % | ||||||
| Gross profit |
(9,559 | ) | (16,060 | ) | (12,230 | ) | ||||||
| Reported Growth |
(40.5 | )% | 31.3 | % | (4.0 | )% | ||||||
57
Table of Contents
| * | We calculate the FX Neutral Change by converting our current period local currency financial information using the prior period foreign currency average exchange rates and comparing these adjusted amounts to our prior period reported results. This calculation may differ from similarly titled measures used by other companies and, accordingly, the FX Neutral Change is not meant to substitute for changes in recorded amounts presented in conformity with GAAP nor should such amounts be considered in isolation. |
Fiscal Year Ended September 30, 2016 Compared to Fiscal Year Ended September 30, 2015
The following table presents selected consolidated comparative results of operations from our audited condensed consolidated financial statements for the fiscal year ended September 30:
| Fiscal Year Ended September 30, | ||||||||||||||||
| (in thousands, other than percentages) | 2016 | % of Net Sales (1) |
2015 | % of Net Sales (1) |
||||||||||||
| Net sales |
$ | 1,403,454 | 100 | % | $ | 1,480,313 | 100 | % | ||||||||
| Cost of sales |
1,102,414 | 79 | % | 1,193,595 | 81 | % | ||||||||||
|
|
|
|
|
|
|
|
|
|||||||||
| Gross profit |
301,040 | 21 | % | 286,718 | 19 | % | ||||||||||
| Selling, general and administrative expenses |
171,098 | 12 | % | 186,054 | 13 | % | ||||||||||
| Other expenses, net |
28,194 | 2 | % | 10,856 | 1 | % | ||||||||||
|
|
|
|
|
|
|
|
|
|||||||||
| Operating income |
101,748 | 7 | % | 89,808 | 6 | % | ||||||||||
| Interest and other debt expense, net |
93,260 | 7 | % | 482,333 | 33 | % | ||||||||||
| Foreign currency losses on financing |
(12,492 | ) | 1 | % | (6,941 | ) | — | |||||||||
|
|
|
|
|
|
|
|
|
|||||||||
| Loss before income taxes and equity income of equity method investees |
(4,004 | ) | — | (399,466 | ) | 27 | % | |||||||||
| Income tax expense/(benefit) |
8,425 | 1 | % | (38,037 | ) | 3 | % | |||||||||
|
|
|
|
|
|
|
|
|
|||||||||
| Loss before equity income of equity method investees |
(12,429 | ) | 1 | % | (361,429 | ) | 24 | % | ||||||||
| Equity income of equity method investees |
832 | — | 317 | — | ||||||||||||
|
|
|
|
|
|
|
|
|
|||||||||
| Net loss |
$ | (11,597 | ) | 1 | % | $ | (361,112 | ) | 24 | % | ||||||
|
|
|
|
|
|
|
|
|
|||||||||
| (1) | Percentages may not add due to rounding. |
Net Sales
| Fiscal Year Ended September 30, |
Variation | |||||||||||||||
| (in thousands) | 2016 | 2015 | $ | % | ||||||||||||
| Net sales |
$ | 1,403,454 | $ | 1,480,313 | $ | (76,859 | ) | (5 | )% | |||||||
Net sales were $1,403.4 million for fiscal 2016, a decrease of $76.9 million, or 5%, compared to $1,480.3 million for fiscal 2015. Excluding the impact of foreign currency translation, net sales decreased by 0.5%. The 0.5% decrease in net sales excluding the impact of foreign currency translation was driven through a 1% decline in average selling price, partially offset by an increase in volumes. On a segment basis the 0.5% decrease in net sales was driven by declines of 4% in Labels, 2% in Food & Consumer Products, and 2% in Specialties, offset by a 9% increase in Pharma.
58
Table of Contents
Net Sales by Segment
The following table shows our net sales by segment for the:
| Fiscal Year Ended September 30, |
Variation | |||||||||||||||
| (in thousands) | 2016 | 2015 | $ | % | ||||||||||||
| Pharma |
$ | 369,084 | $ | 370,543 | $ | (1,459 | ) | (0 | )% | |||||||
| Food & Consumer Packaging |
514,620 | 548,486 | (33,866 | ) | (6 | )% | ||||||||||
| Labels |
193,570 | 209,208 | (15,638 | ) | (7 | )% | ||||||||||
| Specialties |
307,724 | 323,550 | (15,826 | ) | (5 | )% | ||||||||||
| Total net sales by segment |
1,384,998 | 1,451,787 | (66,789 | ) | (5 | )% | ||||||||||
|
|
|
|
|
|
|
|
|
|||||||||
| Corporate/other |
18,456 | 28,526 | (10,070 | ) | (35 | )% | ||||||||||
|
|
|
|
|
|
|
|
|
|||||||||
| Consolidated net sales |
$ | 1,403,454 | $ | 1,480,313 | $ | (76,859 | ) | (5 | )% | |||||||
|
|
|
|
|
|
|
|
|
|||||||||
Pharma. Net sales for Pharma were $369.1 million for fiscal 2016, a decrease of $1.5 million, or 0.4%, compared to $370.5 million for fiscal 2015. Excluding the impact of foreign currency translation, net sales increased by 9%. This increase in net sales was driven through an 8% increase in average selling prices and a 1% increase in volumes.
Food & Consumer Packaging. Net sales for Food & Consumer Packaging were $514.6 million for fiscal 2016, a decrease of $33.9 million, or 6%, compared to $548.5 million for fiscal 2015. Excluding the impact of foreign currency translation, net sales decreased by 2%, in fiscal 2016. This decrease in net sales was driven through a 3% decline in average selling prices, partially offset by a 1% increase in volume.
Labels. Net sales were $193.6 million for fiscal 2016, a decrease of $15.6 million, or 7%, compared to $209.2 million for fiscal 2015. Excluding the impact of foreign currency translation, net sales decreased by 4%. This decrease in net sales was driven entirely through a decline in average selling prices.
Specialties. Net sales were $307.7 million for fiscal 2016, a decrease of $15.8 million, or 5%, compared to $323.6 million for fiscal 2015. Excluding the impact of foreign currency translation, net sales decreased by 2%. This decrease in net sales was driven through a 4% decline in average selling prices, partially offset by a 2% increase in volumes.
Corporate/other. Net sales were $18.5 million for fiscal 2016, a decrease of $10.1 million, or 35%, compared to $28.5 million for fiscal 2015.
Gross Profit
| Fiscal Year Ended September 30, |
Variation | |||||||||||||||
| (in thousands, except for percentages) | 2016 | 2015 | $ | % | ||||||||||||
| Cost of sales |
$ | 1,102,414 | $ | 1,193,595 | $ | (91,181 | ) | (8 | )% | |||||||
| Gross profit |
$ | 301,040 | $ | 286,718 | $ | 14,322 | 5 | % | ||||||||
| Gross profit (as a percentage of net sales) |
21 | % | 19 | % | ||||||||||||
Gross profit was $301.0 million for fiscal 2016, an increase of $14.3 million, or 5%, compared to $286.7 million in fiscal 2015. Excluding the impact of foreign currency translation, gross profit increased by 10%. Excluding the impact of foreign currency translation, gross profit was favorably impacted by Net Price. As a result, our gross profit margin increased by 200 basis points from 19.4% in fiscal 2015 to 21.4% in fiscal 2016. This increase in margin was primarily driven by improvements in Pharma, Food & Consumer Products and Labels, respectively.
59
Table of Contents
Gross Profit by Segment
The following table shows our gross profit by segment for the fiscal year ended September 30:
| Fiscal Year Ended September 30, |
Variation | |||||||||||||||
| (in thousands, other than percentages) | 2016 | 2015 | $ | % | ||||||||||||
| Pharma |
$ | 94,987 | $ | 92,255 | $ | 2,732 | 3 | % | ||||||||
| Food & Consumer Packaging |
97,585 | 90,059 | 7,526 | 8 | ||||||||||||
| Labels |
41,590 | 38,048 | 3,542 | 9 | ||||||||||||
| Specialties |
76,437 | 82,416 | (5,979 | ) | (7 | ) | ||||||||||
|
|
|
|
|
|
|
|
|
|||||||||
| Total gross profit by segment |
310,599 | 302,778 | 7,821 | 3 | ||||||||||||
|
|
|
|
|
|
|
|
|
|||||||||
| Corporate/other |
(9,559 | ) | (16,060 | ) | 6,501 | 40 | ||||||||||
|
|
|
|
|
|
|
|
|
|||||||||
| Consolidated gross profit |
$ | 301,040 | $ | 286,718 | $ | 14,322 | 5 | % | ||||||||
|
|
|
|
|
|
|
|
|
|||||||||
Pharma. Gross profit for Pharma was $95.0 million for fiscal 2016, an increase of $2.7 million, or 3%, compared to $92.3 million in fiscal 2015. Excluding the impact of foreign currency translation, gross profit increased by 18%. This increase in gross profit was primarily driven through favorable Net Price. As a result, our gross profit margin increased by 200 basis points from 24.9% in fiscal 2015 to 26.9% in fiscal 2016.
Food & Consumer Packaging. Gross profit for Food & Consumer Packaging was $97.6 million for fiscal 2016, an increase of $7.5 million, or 8%, compared to $90.1 million in fiscal 2015. Excluding the impact of foreign currency translation, gross profit increased by 9%. This increase in gross profit was primarily driven through favorable Net Price. As a result, our gross profit margin increased by 190 basis points from 16.4% in fiscal 2015 to 18.3% in fiscal 2016.
Labels. Gross profit for Labels was $41.6 million for fiscal 2016, an increase of $3.5 million, or 9%, compared to $38.0 million in fiscal 2015. Excluding the impact of foreign currency translation, gross profit increased by 10%. This increase in gross profit was primarily driven through improving operational efficiency. As a result, our gross profit margin increased by 270 basis points from 18.2% in fiscal 2015 to 20.9% in fiscal 2016.
Specialties. Gross profit for Specialties was $76.4 million for fiscal 2016, a decrease of $6.0 million, or 7%, compared to $82.4 million in fiscal 2015. Excluding the impact of foreign currency translation, gross profit decreased by 8%. This decline in gross profit was primarily driven through unfavorable Net Price. As a result, our gross profit margin decreased by 140 basis points from 25.5% in fiscal 2015 to 24.1% in fiscal 2016.
Corporate/other. Gross profit for Corporate/other was $(9.6) million for fiscal 2016, an increase of $6.5 million, or 40%, compared to $(16.1) million in fiscal 2015.
Selling, General and Administrative Expenses
| Fiscal Year Ended September 30, |
Variation | |||||||||||||||
| (in thousands, other than percentages) | 2016 | 2015 | $ | % | ||||||||||||
| Selling, general and administrative expenses |
$ | 171,098 | $ | 186,054 | $ | (14,956 | ) | (8 | )% | |||||||
Selling, general and administrative expenses were $171.1 million for fiscal 2016, a decrease of $15.0 million, or 8%, compared to $186.1 million for fiscal 2015. The decrease of $15.0 million was primarily driven by a $25.3 million compensation expense to management in connection with the recapitalization transactions during fiscal 2015. This decrease was partially offset by stock-based compensation expense of $8.5 million related to restricted stock granted to certain employees in fiscal 2016 and by the foreign currency translation. Excluding the impact of foreign currency translation, selling, general and administrative expenses decreased by 5%, in fiscal 2016.
60
Table of Contents
Other Expenses, Net
| Fiscal Year Ended September 30, |
Variation | |||||||||||||||
| (in thousands, other than percentages) | 2016 | 2015 | $ | % | ||||||||||||
| Other expenses, net |
$ | 28,194 | $ | 10,856 | $ | 17,338 | 160 | % | ||||||||
Other expenses, net were $28.2 million for fiscal 2016, an increase of $17.3 million, or 160%, compared to $10.9 million for fiscal 2015. The increase was driven by higher non-operational expenses for restructuring and IPO preparation compared to the prior year. Excluding the impact of foreign currency translation, other expenses increased by 167%, in fiscal 2016.
Operating Income
| Fiscal Year Ended September 30, |
Variation | |||||||||||||||
| (in thousands, other than percentages) | 2016 | 2015 | $ | % | ||||||||||||
| Operating income |
$ | 101,748 | $ | 89,808 | $ | 11,940 | 13 | % | ||||||||
| Operating income (as a percentage of net sales) |
7% | 6% | ||||||||||||||
Excluding the impact of foreign currency translation, operating income increased by 22%, in fiscal 2016. The changes within operating income were driven by the factors highlighted previously, for example pricing initiatives and increases in volumes.
Interest and Other Debt Expense, Net
| Fiscal Year Ended September 30, |
Variation | |||||||||||||||
| (in thousands, other than percentages) | 2016 | 2015 | $ | % | ||||||||||||
| Interest and other debt expense, net |
$ | 93,260 | $ | 482,333 | $ | (389,073 | ) | (81 | )% | |||||||
Interest and other debt expense, net, was $482.3 million for fiscal 2015, and primarily relates to interest incurred on the TPECs of $320.9 million, on the PECs of $35.2 million and on debt arrangements of $111.5 million, of which $300.4 million TPEC expenses, $23.9 million prepayment penalty and $24.2 million extraordinary release of deferred debt issuance costs were incurred upon the refinancing.
Interest and other debt expense, net, was $93.3 million for fiscal 2016, and primarily relates to interest incurred on the TPECs of $2.1 million, on the PECs of $2.1 million and on debt arrangements of $82.1 million.
Foreign Currency Losses on Financing
| Fiscal Year Ended September 30, |
Variation | |||||||||||||||
| (in thousands, other than percentages) | 2016 | 2015 | $ | % | ||||||||||||
| Foreign currency losses on financing |
$ | 12,492 | $ | 6,941 | $ | 5,551 | 80 | % | ||||||||
For fiscal 2016, the Company recorded a foreign currency loss on financing of $12.5 million compared to a foreign currency loss on financing of $6.9 million for fiscal 2015. These losses are primarily reflective of the FX impact of movements in CHF and GBP against the EUR for certain intercompany loans during a given period.
61
Table of Contents
Income Tax Expense/(Benefit)
| Fiscal Year Ended September 30, |
Variation | |||||||||||||||
| (in thousands, other than percentages) | 2016 | 2015 | $ | % | ||||||||||||
| Income tax expense/(benefit) |
$ | 8,425 | $ | (38,037 | ) | $ | 46,462 | — | ||||||||
The income tax expense for fiscal 2016 was the result of the loss before taxes and after equity income of equity method investees in the period of $3.2 million offset by changes in valuation allowances of $16.8 million on deferred tax assets and effects of different tax rates to the Luxembourg tax rate of $1.0 million.
The income tax benefit for fiscal 2015 was the result of loss before taxes and after equity income of equity method investees in the period of $399.1 million offset by adjustments for non-deductible items of $16.8 million, withholding taxes of $26.2 million and changes in valuation allowances of $33.3 million.
Equity Income of Equity Method Investees
| Fiscal Year Ended September 30, |
Variation | |||||||||||||||
| (in thousands, other than percentages) | 2016 | 2015 | $ | % | ||||||||||||
| Equity income of equity method investees |
$ | 832 | $ | 317 | $ | 515 | 162 | % | ||||||||
Equity income of equity method investees recorded in any given period is dependent on income from our investment in Vinyl Solutions LLC, a joint venture, which was immaterial for both periods presented.
Fiscal Year Ended September 30, 2015 Compared to Fiscal Year Ended September 30, 2014
The following table presents selected consolidated comparative results of operations from our consolidated financial statements for the:
| Fiscal Year Ended September 30, | ||||||||||||||||
| (in thousands, other than percentages) | 2015 | % of Net Sales (1) |
2014 | % of Net Sales (1) |
||||||||||||
| Net sales |
$ | 1,480,313 | 100 | % | $ | 1,620,807 | 100 | % | ||||||||
| Cost of sales |
1,193,595 | 81 | % | 1,311,635 | 81 | % | ||||||||||
|
|
|
|
|
|
|
|
|
|||||||||
| Gross profit |
286,718 | 19 | % | 309,172 | 19 | % | ||||||||||
| Selling, general and administrative expenses |
186,054 | 13 | % | 174,754 | 11 | % | ||||||||||
| Other expenses, net |
10,856 | 1 | % | 12,853 | 1 | % | ||||||||||
|
|
|
|
|
|
|
|
|
|||||||||
| Operating income |
89,808 | 6 | % | 121,565 | 8 | % | ||||||||||
| Interest and other debt expense, net |
482,333 | 33 | % | 158,853 | 10 | % | ||||||||||
| Foreign currency gains and (losses) on financing |
(6,941 | ) | — | 4,725 | — | |||||||||||
|
|
|
|
|
|
|
|
|
|||||||||
| Loss before income taxes and equity income of equity method investees |
(399,466 | ) | 27 | % | (32,563 | ) | 2 | % | ||||||||
| Income tax expense/(benefit) |
(38,037 | ) | 3 | % | 19,407 | 1 | % | |||||||||
|
|
|
|
|
|
|
|
|
|||||||||
| Loss before equity income of equity method investees |
(361,429 | ) | 24 | % | (51,970 | ) | 3 | % | ||||||||
| Equity income of equity method investees |
317 | — | 635 | — | ||||||||||||
|
|
|
|
|
|
|
|
|
|||||||||
| Net loss |
$ | (361,112 | ) | 24 | % | $ | (51,335 | ) | 3 | % | ||||||
|
|
|
|
|
|
|
|
|
|||||||||
| (1) | Percentages may not add due to rounding. |
62
Table of Contents
Net Sales
| Fiscal Year Ended September 30, |
Variation | |||||||||||||||
| (in thousands, other than percentages) | 2015 | 2014 | $ | % | ||||||||||||
| Net sales |
$ | 1,480,313 | $ | 1,620,807 | $ | (140,494 | ) | (9 | )% | |||||||
Net sales were $1,480 million for fiscal 2015, a decrease of $140.5 million, or 9%, compared to $1,621 million for fiscal 2014. Excluding the impact of foreign currency translation, net sales increased by 1%. This increase in net sales was driven through a 2% increase in volumes, partially offset by a 1% decline in average selling prices. On a segment basis, excluding the impact of foreign currency translation, the 1% increase in net sales was driven by a 2% increase in Pharma, a 2% increase in Food & Consumer Packaging, and a 7% increase in Labels offset by a decline of 6% in Specialties.
Net Sales by Segment
The following table shows our net sales by segment for the:
| Fiscal Year Ended September 30, |
Variation | |||||||||||||||
| (in thousands, other than percentages) | 2015 | 2014 | $ | % | ||||||||||||
| Pharma |
$ | 370,543 | $ | 407,101 | $ | (36,558 | ) | (9 | )% | |||||||
| Food & Consumer Packaging |
548,486 | 602,699 | (54,213 | ) | (9 | )% | ||||||||||
| Labels |
209,208 | 207,982 | 1,226 | 1 | % | |||||||||||
| Specialties |
323,550 | 374,801 | (51,251 | ) | (14 | )% | ||||||||||
| Total net sales by segment |
1,451,787 | 1,592,583 | (140,796 | ) | (9 | )% | ||||||||||
|
|
|
|
|
|
|
|
|
|||||||||
| Corporate/other |
28,526 | 28,224 | 302 | 1 | % | |||||||||||
|
|
|
|
|
|
|
|
|
|||||||||
| Consolidated net sales |
$ | 1,480,313 | $ | 1,620,807 | $ | (140,494 | ) | (9 | )% | |||||||
|
|
|
|
|
|
|
|
|
|||||||||
Pharma. Net sales for Pharma were $370.5 million for fiscal 2015, a decrease of $36.6 million, or 9%, compared to $407.1 million for fiscal 2014. Excluding the impact of foreign currency translation, net sales increased by 2%. This increase in net sales was driven through a 1% increase in volumes and a 1% increase in average selling prices.
Food & Consumer Packaging. Net sales for Food & Consumer Packaging were $548.5 million for fiscal 2015, a decrease of $54.2 million, or 9%, compared to $602.7 million for fiscal 2014. Excluding the impact of foreign currency translation, net sales increased by 2%. This increase in net sales was driven through a 5% increase in volumes, partially offset by a 3% decline in average selling prices.
Labels. Net sales were $209.2 million for fiscal 2015, an increase of $1.2 million, or 1%, compared to $208.0 million for fiscal 2014. Excluding the impact of foreign currency translation, net sales increased by 7%. This increase in net sales was driven through an 8% increase in volumes, partially offset by a 1% decline in average selling prices.
Specialties. Net sales were $323.6 million for fiscal 2015, a decrease of $51.3 million, or 14%, compared to $374.8 million for fiscal 2014. Excluding the impact of foreign currency translation, net sales decreased by 6%. This decrease in net sales was driven through a 6% decline in volumes.
Corporate/other. Net sales were $28.5 million for fiscal 2015, an increase of $0.3 million, or 1%, compared to $28.2 million for fiscal 2014.
63
Table of Contents
Gross Profit
| Fiscal Year Ended September 30, |
Variation | |||||||||||||||
| (in thousands) | 2015 | 2014 | $ | % | ||||||||||||
| Cost of sales |
$ | 1,193,595 | $ | 1,311,635 | $ | (118,040 | ) | (9 | )% | |||||||
| Gross profit |
$ | 286,718 | $ | 309,172 | $ | (22,454 | ) | (7 | )% | |||||||
| Gross profit (as a percentage of net sales) |
19 | % | 19 | % | ||||||||||||
Gross profit was $286.7 million for fiscal 2015, a decrease of $22.5 million or 7% compared to $309.2 million in fiscal 2014. Excluding the impact of foreign currency translation, gross profit increased by 1%. This increase in gross profit was primarily driven through favorable Net Price. As a result, our gross profit margin increased by 30 basis points from 19.1% in fiscal 2014 to 19.4% in fiscal 2015. This increase in margin was primarily driven by margin expenses in each of our four operating segments.
Gross Profit by Segment
The following table shows our gross profit by segment for the fiscal year ended September 30:
| Fiscal Year Ended September 30, |
Variation | |||||||||||||||
| (in thousands, other than percentages) | 2015 | 2014 | $ | % | ||||||||||||
| Pharma |
$ | 92,255 | $ | 99,322 | $ | (7,067 | ) | (7 | )% | |||||||
| Food & Consumer Packaging |
90,059 | 94,966 | (4,907 | ) | (5 | )% | ||||||||||
| Labels |
38,048 | 33,732 | 4,316 | 13 | % | |||||||||||
| Specialties |
82,416 | 93,382 | (10,966 | ) | (12 | )% | ||||||||||
| Total gross profit by segment |
302,778 | 321,402 | (18,624 | ) | (6 | )% | ||||||||||
|
|
|
|
|
|
|
|
|
|||||||||
| Corporate/other |
(16,060 | ) | (12,230 | ) | (3,830 | ) | (31 | )% | ||||||||
|
|
|
|
|
|
|
|
|
|||||||||
| Consolidated gross profit |
$ | 286,718 | $ | 309,172 | $ | (22,454 | ) | (7 | )% | |||||||
|
|
|
|
|
|
|
|
|
|||||||||
Pharma. Gross profit for Pharma was $92.3 million for fiscal 2015, a decrease of $7.1 million, or 7%, compared to $99.3 million in fiscal 2014. Excluding the impact of foreign currency translation, gross profit increased by 4%. This increase in gross profit was primarily driven through favorable Net Price. As a result, our gross profit margin increased by 120 basis points from 23.8% in fiscal 2014 to 25.0% in the fiscal 2015.
Food & Consumer Packaging. Gross profit for Food & Consumer Packaging was $90.1 million for fiscal 2015, a decrease of $4.9 million or 5% compared to $95.0 million in fiscal 2014. Excluding the impact of foreign currency translation, gross profit increased by 5%. This increase in gross profit was primarily driven through higher volumes. As a result, our gross profit margin increased by 180 basis points from 14.4% in fiscal 2014 to 16.2% in fiscal 2015.
Labels. Gross profit for Labels was $38.0 million for fiscal 2015, an increase of $4.3 million, or 13%, compared to $33.7 million in fiscal 2014. Excluding the impact of foreign currency translation, gross profit increased by 16%. This increase in gross profit was primarily driven through an increase in volume and operational performance and partially offset by unfavorable Net Price. As a result, our gross profit margin increased by 130 basis points from 16.2% in fiscal 2014 to 17.5% in fiscal 2015.
Specialties. Gross profit for Specialties was $82.4 million for fiscal 2015, a decrease of $11.0 million, or 12%, compared to $93.4 million in fiscal 2014. Excluding the impact of foreign currency translation, gross profit decreased by 5%. This decrease in gross profit was primarily driven through a decline in volume, partially offset by favorable Net Price. As a result, our gross profit margin increased by 20 basis points from 24.9% in fiscal 2014 to 25.1% in fiscal 2015.
64
Table of Contents
Corporate/other. Gross profit for Corporate/other was $(16.1) million for fiscal 2015, a decrease of $3.8 million, or 31%, compared to $(12.2) million in fiscal 2014.
Selling, General and Administrative Expenses
| Fiscal Year Ended September 30, |
Variation | |||||||||||||||
| (in thousands, other than percentages) | 2015 | 2014 | $ | % | ||||||||||||
| Selling, general and administrative expenses |
$ | 186,054 | $ | 174,754 | $ | 11,300 | 6 | % | ||||||||
Selling, general and administrative expenses were $186.1 million for fiscal 2015, an increase of $11.3 million, or 6%, compared to $174.8 million for fiscal 2014. The increase of $11.3 million was primarily driven by a $25.3 million distribution to management in connection with the recapitalization transactions. Excluding the impact of foreign currency translation, selling, general and administrative expenses increased by 18.1%, in fiscal 2015.
Other Expenses, Net
| Fiscal Year Ended September 30, |
Variation | |||||||||||||||
| (in thousands, other than percentages) | 2015 | 2014 | $ | % | ||||||||||||
| Other expenses, net |
$ | 10,856 | $ | 12,853 | $ | (1,997 | ) | (16 | )% | |||||||
Other expenses, net were $10.9 million for fiscal 2015, a decrease of $2.0 million, or 16%, compared to $12.9 million for fiscal 2014. The decrease was primarily driven by lower restructuring costs. Excluding the impact of foreign currency translation, other expenses decreased by 18.3%, in fiscal 2015.
Operating Income
| Fiscal Year Ended September 30, |
Variation | |||||||||||||||
| (in thousands, other than percentages) | 2015 | 2014 | $ | % | ||||||||||||
| Operating income |
$ | 89,808 | $ | 121,565 | $ | (31,757 | ) | (26 | )% | |||||||
| Operating income (as a percentage of net sales) |
6% | 8% | ||||||||||||||
The changes within operating income were driven by the factors highlighted previously. Excluding the impact of foreign currency translation, operating income decreased by 24%, in fiscal 2015.
Interest and Other Debt Expense, Net
| Fiscal Year Ended September 30, |
Variation | |||||||||||||||
| (in thousands, other than percentages) | 2015 | 2014 | $ | % | ||||||||||||
| Interest and other debt expense, net |
$ | 482,333 | $ | 158,853 | $ | 323,480 | 204 | % | ||||||||
Interest and other debt expense, net, was $482.3 million for fiscal 2015, and primarily relates to interest incurred on the TPECs of $320.9 million, on the PECs of $35.2 million and on debt arrangements of $111.5 million, of which $300.4 million TPEC expenses, $23.9 million prepayment penalty and $24.2 million extraordinary release of deferred debt issuance costs were incurred upon the refinancing in April 2015. Interest and other debt expense, net, was $158.9 million for fiscal 2014, and primarily relates to interest incurred on the TPECs of $15.7 million, on the PECs of $62.9 million and on debt arrangements of $73.7 million.
65
Table of Contents
Foreign Currency Gains and (Losses) on Financing
| Fiscal Year Ended September 30, |
Variation | |||||||||||||||
| (in thousands, other than percentages) | 2015 | 2014 | $ | % | ||||||||||||
| Foreign currency gains/(losses) on financing |
$ | (6,941 | ) | $ | 4,725 | $ | (11,666 | ) | — | |||||||
For fiscal 2015, the Company recorded a foreign currency loss on financing of $(6.9) million compared to a foreign currency gain on financing of $4.7 million for fiscal 2014. These (losses) and gains are entirely reflective of the FX impact of movements in CHF and GBP against the EUR for certain intercompany loans during a given period.
Income Tax Expense/(Benefit)
| Fiscal Year Ended September 30, |
Variation | |||||||||||||||
| (in thousands, other than percentages) | 2015 | 2014 | $ | % | ||||||||||||
| Income tax expense/(benefit) |
$ | (38,037 | ) | $ | 19,407 | $ | (57,444 | ) | — | |||||||
The income tax benefit for fiscal 2015 was the result of tax benefits related to the loss before taxes in the period of $399.1 million offset by adjustments for non-deductible items of $16.8 million, withholding taxes of $26.2 million and changes in valuation allowances of $33.3 million.
The income tax benefit for fiscal 2014 was the result of tax benefits related to the loss before taxes in the period of $31.9 million offset by adjustments for non-deductible items of $12.8 million and changes in valuation allowances of $21.3 million.
Equity Income of Equity Method Investees
| Fiscal Year Ended September 30, |
Variation | |||||||||||||||
| (in thousands, other than percentages) | 2015 | 2014 | $ | % | ||||||||||||
| Equity income of equity method investees |
$ | 317 | $ | 635 | $ | (318 | ) | (50 | )% | |||||||
Equity income of equity method investees recorded in any given period is dependent on income from our investment in Vinyl Solutions LLC, a joint venture, which was immaterial for both periods presented.
Liquidity and Capital Resources
Cash Flows
Our primary sources of liquidity are net cash generated from our operations and borrowings under our credit facilities. Our primary uses of cash include operating expenses, principal and interest payments on financings and capital expenditures related to maintenance, infrastructure and IT investments, on top of new facilities and expansion on existing facilities to increase production capacity to meet customer demand. Our operating performance has historically enabled us to generate positive cash flow. We have a stable customer and supplier base that provides us with meaningful net sales and cost visibility which, when combined with our scalable and stable cost structure, helps us to maximize cash flow and efficiency through economic cycles.
Short-Term and Long-Term Liquidity Requirements
On April 28, 2015, Klöckner Pentaplast of America, Inc. (“KPA”), our wholly owned indirect subsidiary, issued €300.0 million aggregate principal amount of senior secured notes (“2015 Senior Secured Notes”)
66
Table of Contents
pursuant to an indenture, dated April 28, 2015, among KPA, the guarantors signatory thereto and Deutsche Trustee Company Limited, governing the 2015 Senior Secured Notes. The 2015 Senior Secured Notes are senior unsecured obligations of KPA and are guaranteed on a senior basis by Kleopatra Holdings 2 and each of its subsidiaries to the extent such guarantor is a guarantor of KPA’s obligations under our credit agreement.
The 2015 Senior Secured Notes will mature on November 1, 2020. Interest on the 2015 Senior Secured Notes accrues at a rate of 7.125% per annum and is payable semi-annually in arrears on May 1 and November 1 of each year. Interest is computed on the basis of a 360-day year comprised of twelve 30-day months. Prior to May 1, 2017, we may redeem some or all of the 2015 Senior Secured Notes at a price equal to 100% of the principal amount of the notes redeemed plus accrued and unpaid interest, if any, plus an applicable premium. On or after May 1, 2017, we may redeem all or a part of the 2015 Senior Secured Notes at our option, upon not less than 10 nor more than 60 days’ notice, at the redemption prices (expressed as a percentage of the principal amount) set forth below, plus accrued and unpaid interest and additional amounts, if any, on the 2015 Senior Secured Notes to be redeemed to the applicable redemption date if redeemed during the twelve-month period beginning on May 1 of the years indicated below:
| Period Redemption Price |
||||
| 2017 |
103.563 | % | ||
| 2018 |
101.782 | % | ||
| 2019 and thereafter |
100.000 | % | ||
In addition, at any time prior to May 1, 2017, we may repay up to 40% of the 2015 Senior Secured Notes with the net proceeds of certain equity offerings, at a redemption price of 107.125% of the principal amount thereof plus accrued and unpaid interest.
The indenture governing the 2015 Senior Secured Notes contains covenants that, among other things, restrict the ability of KPA and certain of its subsidiaries to: incur, assume or guarantee additional indebtedness; pay dividends or redeem or repurchase capital stock; make other restricted payments; incur liens; redeem debt that is junior in right of payment to the 2015 Senior Secured Notes; sell or otherwise dispose of assets, including capital stock of subsidiaries; enter into mergers or consolidations; and enter into transactions with affiliates. These covenants are subject to a number of important exceptions and qualifications. In addition, in certain circumstances, if KPA sells assets or experiences certain changes of control, it must offer to purchase the 2015 Senior Secured Notes.
On April 28, 2015, we, through our various subsidiaries, entered into a senior secured term loan (“2015 Senior Secured Term Loan”) with gross proceeds of €213 million (“EUR tranche”) and $733 million (“USD tranche”). The interest on the 2015 Senior Secured Term Loan is LIBOR + 400 bps (subject to a floor of 100 bps) for both the EUR tranche and USD tranche. We are required to make repayments before the maturity date of April 28, 2020 subject to having excess cash, as defined in the agreement. The 2015 Senior Secured Term Loan has affirmative and negative covenants customary for facilities of its type, including a financial covenant that is triggered in the event that the 2015 Revolving Credit Facility is drawn by more than 32.5%. The 2015 Senior Secured Term Loan is fully and unconditionally guaranteed on a joint and several basis by certain subsidiaries as defined in the Credit Agreement and is secured by first priority liens on collateral. The 2015 Senior Secured Term Loan is secured through pledges of essentially all material assets of the guaranteeing legal entities.
On April 28, 2015, the Company entered into a revolving credit facility (“2015 Revolving Credit Facility”) in the amount of €100 million. The 2015 Revolving Credit Facility has not been drawn and matures on January 28, 2020.
Our ability to make principal and interest payments on any borrowings under our 2015 Senior Secured Notes, 2015 Senior Secured Term Loan and 2015 Revolving Credit Facility and our ability to fund planned
67
Table of Contents
capital expenditures will depend on our ability to generate cash in the future, which, to a certain extent, is subject to general economic, financial, competitive, regulatory and other conditions. Based on our current level of operations, we believe that our existing cash balances and expected cash flows generated from operations will be sufficient to meet our operating requirements for at least the next 12 months. However, we may require borrowings under our 2015 Revolving Credit Facility and alternative forms of financings or investments to achieve our longer-term strategic plans. The Company is in compliance with its debt covenants.
Fiscal Year Ended September 30, 2016 Compared to Fiscal Year Ended September 30, 2015
The following table presents selected data from our unaudited condensed consolidated statements of cash flows for the:
| Fiscal Year Ended September 30, |
||||||||
| (in thousands) | 2016 | 2015 | ||||||
| Net cash provided by (used in) operating activities |
$ | 116,778 | $ | (367,678 | ) | |||
| Net cash used in investing activities |
(75,326 | ) | (32,714 | ) | ||||
| Net cash provided by (used in) financing activities |
(30,127 | ) | 364,230 | |||||
| Effect of exchange rate changes on cash |
777 | (9,454 | ) | |||||
| Net changes in cash |
12,102 | (45,616 | ) | |||||
|
|
|
|
|
|||||
| Balance at beginning of period |
103,906 | 149,522 | ||||||
|
|
|
|
|
|||||
| Balance at end of period |
$ | 116,008 | $ | 103,906 | ||||
|
|
|
|
|
|||||
Cash Flows Provided by (Used in) Operating Activities
Net cash provided by operating activities increased by $484.5 million to cash inflow of $116.8 million for fiscal 2016 compared to a cash outflow of $367.7 million for fiscal 2015. The increase in cash inflows were primarily driven by a reduction of interest and debt payments in the amount of $415.2.
For fiscal 2016, the interest and other debt payments were $91.5 million compared to $506.7 million for fiscal 2015, of which $441.2 million were associated with PECs and TPECs interest payments in fiscal 2015 compared to $11.7 million in fiscal 2016. The cash flow from operating activities was impacted by long-term incentive payments to the management in the amount of $12.1 million in fiscal 2016 compared to $23.4 million in fiscal 2015 triggered by payments to the shareholder.
Cash Flows Used in Investing Activities
Our net cash used in investing activities was higher by $42.6 million, resulting in a cash outflow of $75.3 million for fiscal 2016 compared to a cash outflow of $32.7 million for fiscal 2015. The increase was mainly attributable to higher capital expenditures, which increased by $39.5 million to $75.8 million for fiscal 2016 as compared to $36.3 million for fiscal 2015.
The impact of the higher cash used on capital expenditures was partially offset by restricted cash movements in fiscal 2016 and 2015. In fiscal 2015, we provided a financial guarantee of $3.3 million to participate in a bidding process. This financial guarantee was released back to cash upon an unsuccessful bid on the target, which resulted in a period over period increase in net cash provided by investing activities of $3.3 million.
Cash Flows Provided by (Used in) Financing Activities
Our net cash used in financing activities was lower by $394.4 million, resulting in a cash outflow of $30.1 million for fiscal 2016 compared to a cash inflow of $364.2 million for fiscal 2015. In fiscal 2016, the cash
68
Table of Contents
outflow of $30.1 million was primarily the result of repayments of $9.7 million on the 2015 Senior Secured Term Loan and the redemption of the remaining PECs outstanding of $15.5 million. In fiscal 2015, we used cash proceeds of $963.4 million from the 2015 Senior Secured Term Loan and $324.7 million from the 2015 Senior Secured Notes to partially redeem the PECs and TPECs and repay related accrued yield for a combined outflow of $704.3 million, to repay in full both a senior secured term loan we entered into on June 21, 2012 (“2012 Senior Secured Term Loan”) for $313.0 million and senior secured notes issued by our subsidiary, KP Germany Erste GmbH, on July 20, 2012 (“2012 Senior Secured Notes”) for $276.0 million, and to pay other refinancing-related costs, including prepayment penalties, transaction fees, withholding taxes and bank fees, totaling $86.5 million. Additionally, we made net repayments, on other borrowings of $6.2 million and capital lease obligations of $2.0 million.
Fiscal Year Ended September 30, 2015 Compared to Fiscal Year Ended September 30, 2014
The following table presents selected data from our consolidated statements of cash flows for the:
| Fiscal Year Ended September 30, |
||||||||
| (in thousands) | 2015 | 2014 | ||||||
| Net cash provided by (used in) operating activities |
$ | (367,678 | ) | $ | 106,505 | |||
| Net cash used in investing activities |
(32,714 | ) | (53,660 | ) | ||||
| Net cash provided by (used in) financing activities |
364,230 | (83,599 | ) | |||||
| Effect of exchange rate changes on cash |
(9,454 | ) | (6,632 | ) | ||||
| Net changes in cash |
(45,616 | ) | (37,386 | ) | ||||
|
|
|
|
|
|||||
| Balance at beginning of period |
149,522 | 186,908 | ||||||
|
|
|
|
|
|||||
| Balance at end of period |
$ | 103,906 | $ | 149,522 | ||||
|
|
|
|
|
|||||
Cash Flows Provided by (Used in) Operating Activities
Net cash provided by operating activities decreased by $474.2 million to cash outflow of $367.7 million for fiscal 2015 compared to a cash inflow of $106.5 million for fiscal 2014. The decrease in cash inflows was primarily driven by an increase of interest and debt payments in the amount of $439.7 million.
For fiscal 2014, the interest and other debt payments were $91.5 million compared to $506.7 million for fiscal 2015 of which $441.2 million were associated with PECs and TPECs interest payments in fiscal 2015. The cash flow from operating activities was impacted by long-term incentive payments to the management in the amount of $23.4 million in fiscal 2015 triggered by payments to the shareholder.
Net Cash Used in Investing Activities
Our net cash used in investing activities was lower by $21.0 million, resulting in a cash outflow of $32.7 million for fiscal 2015 compared to a cash outflow of $53.7 million for fiscal 2014. The change was mainly attributable to reductions in cash used on capital expenditures of $17.3 million and cash provided from the sale of long-lived assets of $3.0 million. Cash used on capital expenditures was lower by $17.3 million, resulting in a cash outflow for capital expenditures of $36.3 million for fiscal 2015 as compared to a cash outflow of $53.5 million for fiscal 2014.
Cash provided from the sale of long-lived assets decreased by $3.0 million to $0.2 million for fiscal 2015 as compared to $3.2 million for fiscal 2014. Cash proceeds received in fiscal 2014 was the result of the sale of non-current assets related to the divestiture of the old Santo Tirso site in Portugal, and land and property in Graben-Neudorf, Germany.
69
Table of Contents
The impact of the decreases in cash used on capital expenditures and cash provided from the sale of long-lived assets was partially offset by restricted cash movements in fiscal 2015 and 2014. In fiscal 2014, we provided a financial guarantee of $3.3 million to participate in a bidding process. This financial guarantee was released back to cash during fiscal 2015 upon an unsuccessful bid on the target, which resulted in a period over period increase in net cash provided by investing activities of $6.6 million.
Net Cash Provided by (Used in) Financing Activities
Net cash provided by financing activities increased by $447.8 million to a cash inflow of $364.2 million for fiscal 2015 compared to a cash outflow of $83.6 million for fiscal 2014. In fiscal 2015, we used cash proceeds of $963.4 million from the 2015 Senior Secured Term Loan and $324.7 million from the 2015 Senior Secured Notes to partially redeem the PECs and TPECs and repay related accrued yield for a combined outflow of $704.3 million, to repay in full both the 2012 Senior Secured Term Loan for $313.0 million and the 2012 Senior Secured Notes for $276.0 million, and to pay other refinancing-related costs, including prepayment penalties, transaction fees, withholding taxes and bank fees, totaling $86.5 million. Additionally, we made net repayments, on other borrowings of $6.21 million and capital lease obligations of $2.0 million.
In fiscal 2014, we made payments of principal on the 2012 Senior Secured Term Loan for $74.4 million and other borrowings (net) of $4.4 million and capital lease obligations of $1.9 million. Further, we paid financing-related costs, including transaction fees, bank fees and restricted cash requirements, totaling $3.0 million.
Contractual Obligations (1)
The following table presents our contractual obligations as of September 30, 2016 ($ in millions):
| Payments Due by Period | ||||||||||||||||||||
| Total | Less than 1 Year |
1 to 3 Years |
3 to 5 Years |
More Than 5 Years |
||||||||||||||||
| Senior secured term loan, including interest (2) |
$ | 1,124,077 | $ | 58,639 | $ | 115,801 | $ | 949,637 | $ | — | ||||||||||
| Senior secured notes, including interest (3) |
442,185 | 23,857 | 47,713 | 370,615 | — | |||||||||||||||
| Operating leases (4) |
32,776 | 6,067 | 7,137 | 3,843 | 15,729 | |||||||||||||||
| Capital Lease Obligations, including interest (5) |
5,541 | 2,003 | 1,547 | 1,027 | 964 | |||||||||||||||
| Retirement benefit obligations |
46,886 | 2,474 | 5,098 | 5,445 | 33,868 | |||||||||||||||
| Other Debt, including interest (6) |
15,172 | 6,801 | 3,112 | 1,339 | 3,919 | |||||||||||||||
|
|
|
|
|
|
|
|
|
|
|
|||||||||||
| Total |
$ | 1,666,636 | $ | 99,841 | $ | 180,408 | $ | 1,331,907 | $ | 54,480 | ||||||||||
|
|
|
|
|
|
|
|
|
|
|
|||||||||||
| (1) | Excludes obligations related to PECs and TPECs. |
| (2) | Includes aggregate principal payments on our 2015 Senior Secured Term Loan. The EUR tranche was translated at the EUR to USD spot rate as of September 30, 2016. Additionally, amounts include expected cash payments of the variable rate interest at the prevailing interest rate at September 30, 2016 and exclude interest rate swap agreements entered into in connection with the 2015 Senior Secured Term Loan. |
| (3) | Includes aggregate principal payments on our 2015 Senior Secured notes. The principal and interest were translated at the EUR to USD spot rate as of September 30, 2016. |
| (4) | Consists of payments under our operating leases for various property and equipment, which consist mainly of production and office equipment, warehouses and premises. |
| (5) | Consists of payments under our finance leases for various property and equipment. |
| (6) | Consists of other bank borrowings by local subsidiaries in Thailand, Brazil and Germany. |
We have also entered into the 2015 Revolving Credit Facility which allows for incremental borrowings of up to €100 million. This revolving credit facility is currently undrawn and matures on January 28, 2020.
70
Table of Contents
You should also read Notes 6, 7, 9 and 12 to our consolidated financial statements for fiscal 2015 and Notes 4, 5, 7 and 10 to our condensed consolidated financial statements for fiscal 2016 included elsewhere in this prospectus.
Off-Balance Sheet Arrangements
The Company has an obligation under German legislation to fund potential shortfalls in the multi-employer plan such that the negotiated level of benefit coverage is maintained. The Company’s best estimate of such increases in benefit payments as of September 30, 2016 amounts to approximately $5.2 million.
We do not have any other relationships with unconsolidated entities or financial partnerships, including entities sometimes referred to as structured finance or special purpose entities that were established for the purpose of facilitating off-balance sheet arrangements or other contractually narrow or limited purposes. We do not engage in off-balance sheet financing arrangements. In addition, we do not engage in trading activities involving non-exchange traded contracts.
Critical Accounting Policies and Estimates
The preparation of financial statements in conformity with GAAP requires management to make estimates and assumptions that affect the reported amounts of assets and liabilities at the date of the financial statements and the reported amounts of net sales and expenses during the reporting period. Significant estimates include useful lives of assets, realization of deferred tax assets, valuation of goodwill, assumptions related to pension and postretirement obligations and the estimated asset retirement obligation. Actual results could differ from those estimates.
The following is a summary of certain critical accounting policies that may require a higher level of judgment, estimates and complexity. For additional information regarding critical accounting policies affecting our financial statements, see Note 2 of the accompanying audited financial statements.
Net Sales Recognition
Net sales is recognized when title and risk of ownership pass to the customer, persuasive evidence of an arrangement exists, delivery has occurred or services have been rendered, the sales price to the customer is fixed or determinable and collectability is reasonably assured. We deem that delivery has occurred when goods have been dispatched to the customer and that title and risk of ownership have passed to the customer when the goods have reached either the shipping point or destination in accordance with the respective contractual terms. Provisions for product returns are provided in the same period the related sales are recognized and accounted for as reductions of sales.
We have discount and rebate agreements with certain customers which are recorded as reductions of sales in the same period the related sales are recognized based on the contract terms. Accrued customer rebates are included in “Other accrued liabilities” in our Consolidated Balance Sheets.
Shipping and handling expenses are included in “Cost of sales,” and freight charged to customers is included in “Net sales” in our Consolidated Statements of Operations.
Inventories, net
Inventories, including finished goods, work in progress, raw materials, supplies and spare parts are stated at the lower of cost and net realizable value. Cost for raw materials is principally determined on the average cost method. Work in progress and finished goods inventories are valued at the cost of raw material consumed plus direct manufacturing costs (such as labor, utilities and supplies) as incurred and an applicable portion of manufacturing overhead.
71
Table of Contents
We write down the carrying value of inventory for estimated obsolescence when warranted by an amount equal to the difference between the cost of inventory and the estimated market value based on assumptions of future demand. We also review our inventory value to determine if it reflects the lower of cost or market based on factors such as inventory items sold at negative gross margins. Our estimates of future product demand may prove to be inaccurate.
Income Taxes
Income taxes are accounted for under the asset and liability approach. Deferred tax assets and liabilities are recognized for the future tax consequences attributable to differences between the financial statement carrying amounts of assets and liabilities and their respective tax bases and operating loss and tax credit carryforwards. Assets and liabilities are measured using the enacted tax rates and laws that will be in effect when the differences are expected to reverse.
We establish a valuation allowance if, based on the weight of available evidence, it is more likely than not that some portion of all or the deferred tax assets will not be realized.
Uncertain tax positions are recognized when it is more likely than not that the tax position will be sustained upon examination by relevant taxing authorities, based on the technical merits of the position. The amount recognized is measured as the largest amount of benefit that is greater than 50% likely of being realized upon ultimate settlement.
We are subject to income taxes in numerous jurisdictions. The effective tax rate is dependent on enacted tax laws in jurisdictions in which we operate, the amount of taxable income by jurisdiction, and the ability to utilize interest and tax losses carried forward and foreign tax credits related to foreign taxes paid on foreign earnings.
Impairment of long-lived assets
We assess long-lived assets, including property, plant and equipment and intangible assets with definite lives, for impairment whenever events or changes in circumstances indicate the carrying amount of the assets may not be fully recoverable. For the purposes of impairment testing, the assets are grouped at the lowest levels for which there are separately identifiable cash flows. An impairment exists if the estimate of future undiscounted cash flows generated by the assets is less than the carrying value of the assets. If impairment is determined to exist, any related impairment loss is then measured by comparing the fair value of the assets to their carrying amount.
We did not recognize any impairment of long-lived assets in the year ended September 30, 2016, and in the years ended September 30, 2015 and 2014.
Goodwill
Goodwill is reviewed annually for impairment as of August 31 and more frequently if circumstances indicate a possible impairment. Goodwill is tested for impairment at the reporting unit level, which for us is the operating segment level.
In performing the impairment test, we use either a qualitative evaluation or a quantitative test. The qualitative evaluation considers factors such as the macroeconomic environment, business strategy changes and significant customer wins and losses. The first step of the quantitative test considers whether the fair value of a reporting unit exceeds its carrying value. The fair value of a reporting unit reflects a number of significant management assumptions and estimates including our forecast of sales volumes and prices, profit margins, income taxes, capital expenditures and changes in working capital requirements. Changes in these assumptions and/or discount rates could materially impact the estimated fair values and result in an impairment of goodwill.
72
Table of Contents
When we estimate the fair value of a reporting unit, we do so using a discounted cash flow model based on management’s best estimate of projections of future years’ operating results and associated cash flows. Management’s projections related to net sales growth and/or margin improvements arise from a combination of factors, including expectations for volume growth with existing customers, product expansion, changes in raw material prices and labor costs, productivity gains, improvement in general economic conditions, increased operational capacity, and customer retention. Projected future cash flows are then discounted to present value using a discount rate management believes is commensurate with the risks inherent in the cash flows.
If the fair value of a reporting unit exceeds the carrying value of the reporting unit’s net assets, including goodwill, there is no impairment. If not, and the carrying value of the reporting unit’s goodwill exceeds the implied fair value of that goodwill calculated in the second step of the quantitative test, an impairment charge is recognized for the excess.
Prior to the reorganization of our segments to product segments, we organized our segments on a geographic basis. We applied the qualitative assessment for the Europe and Americas reporting units in 2015 and 2014 and determined that it is more likely than not that the fair value of those reporting units exceeded their respective carrying values for each year. We reached this conclusion based on projected future operating results and increased common stock prices within the packaging industry.
Following our IPO, our goodwill will also include a comparison of the aggregate estimated fair value of our reporting units to our total market capitalization. Therefore, our stock may trade below our book value and a significant and sustained decline in our stock price and market capitalization could result in goodwill impairment charges. During times of financial market volatility, significant judgment will be used to determine the underlying cause of the decline and whether stock price declines are short-term in nature or indicative of an event or change in circumstances. Impairment charges, if any, resulting from the periodic testing are non-cash.
Pensions and other employee benefits
We sponsor pension and other employee-related defined benefit plans (collectively, postretirement benefit plans) for employees.
Defined benefit plans are accounted for using the projected unit credit method. Under this method, the cost of providing pensions is charged to the statement of operations, so as to attribute the total pension cost over the service lives of employees in accordance with the benefit formula of the plan. Obligations under defined retirement benefit plans are calculated separately for each defined benefit plan by discounting the amounts of future benefits that employees have already earned through their service in the current and prior periods.
The following assumptions are used in the measurement of defined benefit plan obligations and net periodic benefit cost: discount rates, compensation increase rates, long-term expected rates of return on plan assets, mortality, disability and termination rates, and other factors. Assumptions are developed using relevant Company-experience and market-related data for the countries in which the plans exist. The discount rate applied to the amounts of future benefits represents the yield of high-quality fixed-income investments. The expected long-term rates of return on plan assets are based on long-term expected inflation, interest rates, risk premiums and asset category allocations. The fair value of plan assets is estimated based on market prices or estimated fair value at the measurement date.
For unfunded plans, a pension liability is recognized, which is equal to the projected benefit obligation. For funded plans, the fair value of the plan assets is offset with the projected benefit obligations resulting in the net amount of pension liability. The market value of plan assets is measured at each reporting date.
Actuarial gains and losses and prior service costs or credits that have not yet been recognized through net income are recorded in accumulated other comprehensive income within shareholders’ equity, net of taxes, until they are amortized as a component of net periodic benefit cost.
73
Table of Contents
Stock-based compensation
Stock-based compensation expense is measured as the grant date fair value of the award multiplied by the number of awards expected to vest at each reporting date. This expense is recognized ratably over the requisite service period of the award. The Company grants restricted stock of Kleopatra Holdings 1 to employees. The fair value of the restricted stock is determined using the fair value of the related class of Kleopatra Holdings 1’s stock on the date of grant.
In addition to the assumptions used in determining the fair value of the related class of Kleopatra Holdings 1’s stock, the Company must estimate a forfeiture rate to calculate the stock-based compensation for the Company’s awards. The Company’s forfeiture rate is based on an analysis of its actual forfeitures. The Company will continue to evaluate the appropriateness of the forfeiture rate based on actual forfeiture experience, analysis of employee turnover and other factors. Quarterly changes in the estimated forfeiture rate can have a significant impact on the stock-based compensation expense as the cumulative effect of adjusting the rate is recognized in the period the forfeiture estimate is changed. If a revised forfeiture rate is higher than the previously estimated forfeiture rate, an adjustment is made that will result in a decrease to the stock-based compensation expense recognized in the financial statements. If a revised forfeiture rate is lower than the previously estimated forfeiture rate, an adjustment is made that will result in an increase to the stock-based compensation expense recognized in the financial statements.
Common Stock Valuation Methodology
On December 18, 2015, Kleopatra Holdings granted and issued 19,056 Class B SCA shares of Kleopatra Holding 1 (“Class B SCA Shares”) to certain employees at a subscription price of €0.10 per share for total proceeds of €1,906. On February 9, 2016, Kleopatra Holdings granted and issued 40,667 Class C1 SCA shares of Kleopatra Holdings 1 (“Class C1 SCA Shares”) and 50,622 Class C2 SCA Shares of Kleopatra Holdings 1 (“Class C2 SCA Shares”) to certain employees at a subscription price of €0.10 per share for total proceeds of €9,129. On July 29, 2016, Kleopatra Holdings 1 granted and issued 54,220 Class C1 SCA Shares and 54,516 Class C2 SCA Shares to certain employees at a subscription price of €0.10 per share for total proceeds of €10,874. On September 30, 2016, Kleopatra Holdings 1 granted and issued 968 Class C1 SCA Shares and 973 Class C2 SCA Shares to certain employees at a subscription price of €0.10 per share for total proceeds of €194.
Historically, the fair values of the each of the classes of the Kleopatra Holding 1’s restricted stock were estimated on each grant date. In order to determine the fair value of the restricted stock, Kleopatra Holdings considered a number of objective and subjective factors to determine the best estimate of the fair value of the related class of Kleopatra Holdings 1’s stock, including: (i) contemporaneous and, in certain cases retrospective, valuations of each of the classes of Kleopatra Holdings 1’s stock performed by unrelated third-party valuation firms; (ii) the rights, preferences and privileges of Kleopatra Holdings 1’s and the Company’s different classes of stock relative to those of Kleopatra Holdings 1’s restricted stock; (iii) Kleopatra Holdings 1’s and the Company’s results of operations, financial position and capital resources; (iv) current business conditions and projections; (v) the lack of marketability of Kleopatra Holdings 1’s restricted stock prior to a liquidity event, such as an initial public offering or sale of the Company; (vi) the lack of transferability and other restrictions on the Kleopatra Holdings 1 restricted stock post-vesting; (vii) the hiring of key personnel and the experience of management; (viii) the introduction of new products; (ix) the risk inherent in the development and expansion of the Company’s products; (x) Kleopatra Holdings 1’s and the Company’s stage of development and material risks related to its business; (xi) the fact that the restricted stock involves illiquid securities in a private company; and (xii) the likelihood of achieving a liquidity event, such as an initial public offering or sale of the Company, in light of prevailing market conditions. This approach is consistent with methods outlined in the AICPA Practice Aid, Valuation of Privately-held-Company Equity Securities Issued as Compensation.
The Practice Aid prescribes several valuation approaches for estimating the value of an enterprise, such as the cost, market and income approaches, and various methodologies for allocating the value of an enterprise to its
74
Table of Contents
common stock. The Practice Aid identifies various available methods for allocating enterprise value across classes and series of capital stock to determine the estimated fair value of common stock at each valuation date. For the Class B SCA Shares, Class C1 SCA Shares and Class C2 SCA Shares, a third-party valuation analysis was performed as of December 18, 2015, which is based on a combination of market and income approaches. The Hybrid Method, which is a combination of the Probability-Weighted Expected Return Method (PWERM) and the Option-Pricing Method (“OPM”), was used to allocate the estimated enterprise value of Kleopatra Holding 1’s restricted stock, given the option-like payoff of certain securities within Kleopatra Holdings 1’s capital structure, and the probability of a Kleopatra Holdings 2 sale or potential initial public offering, which would result in returns to the holders of Kleopatra Holdings 1 stock. Our Hybrid Method was based upon the timing and likelihood of various potential future liquidity scenarios, each equally weighted, at the applicable valuation date.
Kleopatra Holdings concluded that no material events or changes in circumstances had occurred since the December 18, 2015 valuation date that would indicate a need to revise the per share value of Class C1 SCA Shares and Class C2 SCA Shares subsequently granted on February 9, 2016, July 23, 2016 and September 30, 2016.
PECs
On June 21, 2012, we issued 25,020,834,000 Series 1 PECs at a par value of €0.01 per certificate for a total euro aggregate amount of €250.2 million (translated at the transaction date to $315.0 million). All PECs are held by Kleopatra Holdings 1, a principal shareholder of the Company. The PECs are entitled to a preference return of 15% per annum (capitalized annually) with preference over the TPECs, see below, and the common stock of the Company.
The PECs mature thirty years from the issuance date on June 21, 2042. The PECs do not require mandatory payment prior to their maturity other than in connection with any distribution to the holders of our equity securities, or as otherwise determined by us. Upon retirement of the PEC, the repayment owed by us to the holders of the PECs equals the (i) par value, plus (ii) unpaid yield accrued to the repayment date, plus (iii) the repayment premium of $7.7 million. The PECs are classified as long-term liabilities on the balance sheet and measured at cost on the date of issuance, which approximated fair value based on Level 2 inputs. The repayment premium is accreted to the final retirement amount of $287.2 million using the effective interest method.
Upon the refinancing on April 28, 2015, we redeemed 23,624,287,623 PECs at a total par value of €236.2 million ($255.7 million), repaid outstanding yield as of the date of the financing of $129.2 million and paid in full the redemption premium of $7.5 million for a total payment of $392.3 million. After the partial redemption, 1,396,546,376 PECs remained outstanding as of September 30, 2015.
On May 30, 2016, we redeemed the remaining 1,396,546,376 PECs outstanding at a total par value of €14.0 million ($15.5 million) and repaid outstanding yield as of the date of the redemption of €6.0 million ($6.7 million) for a total payment of €20.0 million ($22.3 million). Following the redemption, no Series 1 PECs remained outstanding except for accrued unpaid yield of €1.0 million ($1.1 million). The remaining outstanding accrued but unpaid yield continued to compound at a rate of 15% per annum until repaid on September 28, 2016.
Interest expense for the PECs, including the amortization of the repayment premium, for each of the years ended September 30, 2016, 2015 and 2014 amounted to $2.1 million, $42.3 million and $62.9 million, respectively.
TPECs
On June 21, 2012, we issued 2,098,900 TPECs at a par value of € 0.01 per certificate for a total aggregate amount of €0.02 million (translated on the date of the transaction to $0.03 million). All TPECs issued by us are currently held by Kleopatra Holdings 1. The TPECs are contractually subordinated to all of our future and present obligations.
75
Table of Contents
The TPEC holders are entitled to a return equal to approximately the net income arising from our applicable tracked underlying investments during such accrual period, before Luxembourg taxes, minus the margin amount (10 BPS calculated on the average amount outstanding under the relevant loans during an accrual period) minus the annual costs and minus the additional interest amount outstanding on the PECs for that period. If such amount is negative, the return shall be zero. Included in this return are gains to be achieved through repayment of the 2012 Senior Secured Notes and mezzanine facilities by KP Germany Erste GmbH, a subsidiary of the Company, of €259.0 million (translated to U.S. dollar) upon the maturity date of July 16, 2017 and payment in full, or part, of the repayment premium on the income sharing preferred equity certificates (“IS PECs”) by Kleopatra Lux 2 S.à r.l, a subsidiary of the Company, amounting to the difference of $233.4 million less €21.8 million (translated to U.S. dollar on the repayment date), on or after July 16, 2017.
The TPECs mature thirty years from the issuance date on June 21, 2042. The TPECs do not require mandatory payment prior to their maturity other than in connection with any distribution to the holders of our equity securities, or as otherwise determined by us. Upon retirement of the TPECs, the repayment owed by us to the holders of the TPECs equals the (i) par value plus (ii) unpaid yield accrued to the repayment date. The TPECs are classified as long-term liabilities on the balance sheet and are measured at fair value, which approximates cost based on Level 3 inputs.
In connection with the refinancing, we issued a TPECs yield repayment notice on April 28, 2015 and, accordingly, made a full repayment of the unpaid yield at that time to the TPEC holders in the amount of $312.0 million (translated to U.S. dollar on the date of payment). This repayment included (i) the gain of $280.3 million upon the repayment in full of the 2012 Senior Secured Notes and mezzanine facilities by KP Germany Erste, (ii) the gain of $9.2 million upon partial repayment of the IS PEC repayment premium and (iii) our profits above the margin amount of $29.1 million offset by the release of the PECs redemption premium in the amount of $6.6 million. After the refinancing, 2,098,900 series 1 TPECs remained outstanding as of September 30, 2016.
If there are no earlier repayments, and no additional returns are incurred upon the achievement of the aforementioned events, the mandatory redemption price at the mandatory retirement date of June 21, 2042 is $5.0 million, of which $0.02 million relates to the par value of the TPECs and $5.0 million relates to unpaid yield as of September 30, 2016. Additional yield could be incurred on redemption if specified income is greater than a certain margin in any given period.
Interest expense for the TPECs for the years ended September 30, 2016, 2015 and 2014 amounted to $2.1 million, $320.9 million and $15.6 million, respectively.
Quantitative and Qualitative Disclosures about Market Risks and Operating Risk
Our operations are exposed to various financial risks such as liquidity, currency, interest rate, credit, and procurement market (commodity) risks all of which could affect our net assets, financial position and results of operations. We use derivative financial instruments to reduce our exposure to these risks. Our financial risk management is coordinated by our group treasury department, which identifies, evaluates and hedges financial risks in close cooperation with our senior management and local subsidiaries.
Liquidity Risk
Liquidity risk is the risk that we become unable to meet our financial obligations when they fall due. We manage our liquidity risk and generate liquidity through cash provided from operating activities as well as through drawings on revolving credit facilities both on group and local level. Each month our operating subsidiaries provide our group treasury department with forecasts of their individual cash positions over the subsequent six-month period, split by currency-denomination. In addition, our group treasury department monitors our cash position on a daily basis. We seek to maintain sufficient liquidity reserves in the form of revolving credit facilities and to concentrate our cash positions through efficient cash management structures
76
Table of Contents
such as zero balancing cash pools. The ability to use our principal financing facilities is conditioned on our compliance with certain financial covenants and other restrictions included in the underlying credit facility agreements.
Foreign Exchange Risk
Our functional currency is the U.S. dollar and a significant portion of our net sales and expenses are denominated in U.S. dollars. As a result of our operations in various countries, we generate a significant portion of our sales and incur a significant portion of our expenses in currencies other than the U.S. dollar, primarily with respect to the Euro and British pound, but also with respect to the Swiss Franc, Thai Baht, Brazilian Real and Chinese Yuan, among others. Furthermore, certain of our debt obligations are denominated in the Euro. Therefore, our results are impacted by both transaction and translation currency effects. Transaction currency effects occur when our subsidiaries incur costs or earn net sales in a currency different from their functional currency. Where we are unable to match sales received in foreign currencies with costs paid in the same currency, our results of operations are potentially exposed to adverse as well as beneficial movements in foreign currency exchange rates. For example, a hypothetical 10% adverse change in exchange rates could have the net effect of reducing our operating profit for the year ended September 30, 2016 by approximately $1 million impacted by currency exchange rate fluctuations. We engage in only limited financial hedging of our foreign exchange exposure since we try to align our net receivables with our net payables in the form of a natural hedge at the local functional currency and legal entity level. We enter into forward exchange contracts, generally with terms of 180 days or less, to manage some of our foreign currency exposures. These exposures include net sales and anticipated purchase transactions, including foreign currency capital expenditures, forecasted to occur within 180 days. We also seek to manage our exposure to exchange rate changes with respect to our borrowings by borrowing in U.S. dollars, euros and in local currencies.
Our foreign exchange forward contracts are entered into with large financial institutions. These contracts are designated as either cash flow hedges or fair value hedges intended to offset the effect of exchange rate fluctuations on forecasted net sales or purchases of raw materials. The effective portion of changes in the fair value of derivatives designated and qualifying as cash flow hedges is recorded in accumulated other comprehensive loss and is subsequently reclassified into earnings in the period in which the hedged forecasted transaction affects earnings. Changes in the fair value of derivatives designated and qualifying as fair value hedges is recorded in earnings. As of September 30, 2016, the notional amounts of our outstanding contracts that are designated as cash flow and fair value hedges were approximately $10.1 million. Based on our analysis, a hypothetical adverse foreign exchange rate movement of 10% against our contracts would not have a material impact on the fair value of these contracts.
We have certain investments in foreign operations whose net assets are exposed to foreign currency translation risk. Translation currency effects occur when the results of our subsidiaries outside the United States, as measured in their non-dollar currencies, are translated in U.S. dollar using the exchange rates prevailing during the relevant period. For example, a stronger dollar will reduce the reported results of operations of the non-dollar businesses and conversely a weaker dollar will increase the reported results of operations of the non-dollar businesses. These translations could affect the comparability of our results between financial periods or result in changes to the carrying value of our assets, liabilities and stockholders’ equity. These risks are not hedged. However, the currency composition of our borrowing has been structured to reduce the risk of changes in foreign exchange rates. Currency exposure arising from the net assets of our foreign operations in Europe and in other non-dollar countries is managed to a certain extent through borrowings denominated in the relevant foreign currencies (such as the euro, Thai Baht and Brazilian Real).
Interest Rate Risk
Our primary interest-rate risk arises from long-term borrowings. Borrowings issued at variable rates expose us to cash flow interest-rate risk. Borrowings issued at fixed rates expose us to fair value interest-rate risk.
77
Table of Contents
Consolidated earnings depend on the interest rate on our floating rate financial liabilities. A change in the level of interest will alter our earnings. Additional factors could arise that would affect equity due to the change in fair value of our outstanding liabilities in the context of interest cash flow hedge accounting.
Borrowings under the 2015 Senior Secured Term Loan and the revolving credit facility bear interest at floating rates. We use interest rate derivatives (interest rate caps) to hedge variable rate U.S. dollar LIBOR and Euro LIBOR based borrowings from interest rate risk. As of September 30, 2016, we held interest rate caps with the notional value of $368.6 million and €140.1 million. The strike price on all of the interest rate caps is 2.0%. Borrowings under our 2015 Senior Secured Notes bear interest at a fixed rate. For fixed rate debt, interest rate changes only affect the fair market value of such debt, but not earnings or cash flow.
Credit Risk
Credit risk is the risk that a customer or counterparty to a financial instrument will fail to perform or fail to pay amounts due causing financial loss to us. This risk arises principally from outstanding customer receivables, derivative financial instruments and deposits with financial institutions.
We have no significant concentrations of customers. All customers with whom we intend to conclude business are subject to credit screening. The assessment process takes into account all available qualitative and quantitative information about the counterparty and the group, if any, to which the counterparty belongs. Furthermore, receivables are monitored continuously on a decentralized basis. A list of higher-risk counterparties is maintained and monitored. We are not able to eliminate credit risk entirely and expect to experience a certain level of credit losses. Depending on the creditworthiness of the counterparty, we may require credit enhancements such as cash deposits.
In the current economic environment we have placed increased emphasis on the management of credit risks. We implemented credit systems and processes to ensure that counterparties are rated and credit limits set, to monitor exposure against limits, to report regularly and immediately on those exposures and on any excesses, and to track and report credit losses. Our receivables management is handled as part of active risk management. The maximum perceived default risk is reflected by the carrying amounts of the trade receivables scheduled in the statement of financial position.
Procurement (Commodity) Market Risk
We are exposed to risks associated with both the movements in the price of raw materials and sourcing of our raw materials.
The price of polymers and other raw materials is a function of supply and demand, suppliers’ capacity utilization, industry and consumer sentiment, as well as the price of crude oil, natural gas and other feedstocks in the value chain. As such, the future development of raw material prices is difficult to predict. Our procurement activities are generally geared towards improving our pricing position relative to prior years and to the overall market price level. This is generally measured by comparing discounts we are able to obtain from our suppliers compared to industry indices. Our procurement department seeks to optimize pricing through the opportunistic entry into long-term supply agreements with select suppliers. At the same time, we continuously analyze whether we can further improve our raw material costs through the substitution of materials or suppliers or outsourcing of supplies to lower cost countries.
Recent Accounting Pronouncements
On May 28, 2014, the FASB issued ASU No. 2014-09, Net sales from Contracts with Customers (Topic 606). Adoption of this ASU requires that an entity recognize net sales at an amount that reflects the consideration to which the entity expects to be entitled in exchange for transferring goods or services. When applying the
78
Table of Contents
principles of the ASU, entities will use a five-step model to 1) identify the contract(s) with a customer, 2) identify the performance obligations in the contract, 3) determine the transaction price, 4) allocate the transaction price to the performance obligations in the contract and 5) recognize net sales when (or as) the entity satisfies a performance obligation. On July 9, 2015, the FASB deferred the effective date by one year to December 15, 2017 for interim and annual reporting periods beginning after that date and permitted early adoption of the standard but not before the original effective date of December 15, 2016. The Company is currently evaluating the impact of adoption on the Company’s financial position, results of operations and cash flows.
On February 25, 2016, the FASB issued ASU No. 2016-02, Leases (Topic 842). Adoption of this ASU requires lessees to recognize assets and liabilities for most leases. For public business entities the guidance is effective for financial statements issued for annual periods beginning after December 15, 2018, and interim periods within those annual periods and early adoption is permitted. The Company is currently evaluating the impact of adoption on the Company’s financial position, results of operations and cash flows.
On August 26, 2016, the FASB issued ASU No. 2016-15, Statement of Cash Flows (Topic 230), Classification of Cash Receipts and Cash Payments, which is intended to reduce diversity in practice as it relates to how certain transactions are classified in the statement of cash flows, as previous guidance was either omitted or unclear. The new standard is effective for annual periods, and interim periods within those annual periods, beginning after December 15, 2017. We are in the process of evaluating the impact of adopting this new guidance on our consolidated financial statements.
On June 16, 2016, the FASB issued ASU No. 2016-13, Credit Losses (Topic 326), Measurement of Credit Losses on Financial Instruments. The standard replaces the current “incurred loss” approach with an “expected loss” model for instruments measured at amortized cost. For public business entities that meet the definition of an SEC filer, the standard is effective for annual periods beginning after December 15, 2019, and interim periods therein. The Company is currently evaluating the impact of adoption on the Company’s financial position, results of operations and cash flows.
On March 30, 2016, the FASB issued ASU No. 2016-09, Improvements to Employee Share-Based Payment Accounting, which simplifies several aspects of the accounting for employee share-based payment transactions for both public and nonpublic entities, including the accounting for income taxes, forfeitures, and statutory tax withholding requirements, as well as classification in the statement of cash flows. The guidance is effective for annual and interim reporting periods beginning after December 15, 2016, with early adoption permitted. We are in the process of evaluating the impact of adopting this new guidance on our consolidated financial statements.
On June 19, 2014, the FASB issued ASU No. 2014-12, Accounting for Share-Based Payments When the Terms of an Award Provide That a Performance Target Could Be Achieved after the Requisite Service Period. The amendments in the ASU clarify the proper method of accounting for share-based payments when the terms of an award provide that a performance target could be achieved after the requisite service period. ASU 2014-12 is effective for all entities for annual periods beginning after December 15, 2015 and interim periods within those annual periods and early adoption is permitted. The Company is currently evaluating the impact of adoption on the Company’s financial position, results of operations and cash flows.
79
Table of Contents
Company Overview
We are the leading global provider in the rigid plastic film industry with highly complementary capabilities in semi-rigid and flexible films used in packaging and other protective film applications. Our primary end-markets include pharmaceutical, medical devices, and food and beverage, as well as applications for other consumer and industrial products. We sell a wide range of custom rigid plastic films, including many proprietary solutions, which we believe provide mission-critical safety and security functions and enhance performance or drive end-user pull-through on the shelf. We have established ourselves as a leading supplier of rigid plastic films in the value chain for packaging, label and surface protection, among others, due to our expertise in compounding, formulation, calendering, extrusion, surface treatment and converting. We believe we are the leader in many of our end-markets, with approximately 75% of our fiscal 2016 net sales from end-markets where we hold a top 3 market position.
Within the markets we serve, we have one of the broadest product portfolios across a variety of polymers. Our manufacturing footprint across North America, South America, Europe and Asia Pacific allows us to serve our customers locally, offering customized solutions while maintaining the highest production standards. Starting with over 250 base formulations, we have created more than 4,800 customer-driven formulations. In fiscal 2016 alone we completed more than 1,400 formulation changes, of which over 350 were on single customer requests. The application of value-added secondary processes has resulted in a product suite of more than 17,000 SKUs. The size and scope of our existing material science capabilities allow us to remain a leader of innovation in the industry and meet and exceed the unique requirements of our customers for highly technical applications.
Our material science expertise relates to PVC and PET, which are two of the most important polymers in the rigid film industry. We complement our rigid film capabilities with semi-rigid and flexible films, manufactured from other polymers such as PP and PS.
We are able to innovate and differentiate our products through our long-standing (50+ year history) technical expertise and know-how in developing formulations and customized products to meet customer needs. Our films are developed in close collaboration with our customers to meet their specific performance requirements to preserve, protect or otherwise enhance the value of their products and their manufacturing productivity. Typically, our products represent less than 5% of our customers’ total product cost.
We serve customers through four market-oriented segments: Pharma, Food & Consumer Packaging, Labels and Specialties. Our core end-markets have varying, yet complementary growth drivers and are generally non-cyclical in nature. In our Pharma segment, we benefit from the increasing need for innovative packaging solutions, the aging global population and increasing generic penetration. In our Labels segment, the drive to enhance and differentiate the look and appearance of consumer products has led to increased demand for the more vibrant and flexible packaging capabilities provided by shrink sleeve films. In addition to end-market specific drivers, we expect to benefit from positive macro trends such as a growing middle class in emerging markets and increasing spending on consumer and healthcare products.
We have a diverse mix of approximately 3,700 customers ranging from multinational companies to mid-size regional and local specialty companies. We enjoy long-term relationships with our customers and continue to serve 96% of our top 50 customers from 2012. In addition, each of our top 10 customers has been a customer for over 10 years, and no single customer represented more than 4% of fiscal 2016 revenue.
We believe that we are the only rigid plastic film manufacturer with a global operating platform complemented by local capabilities, evidenced by our 19 manufacturing facilities across North America, South America, Europe and Asia Pacific. As of September 30, 2016, including the Farmamak Acquisition, we had approximately 600,000 tons of capacity for calendering and extruding and approximately 110,000 additional tons
80
Table of Contents
of capacity for secondary processes such as laminating and coating. Our manufacturing footprint is supported by a global network of technical innovation engineers developing solutions in partnership with our commercial sales organization. Our global presence, capabilities and scale help ensure consistency and certainty of supply of our products.
We are led by our CEO, Wayne Hewett, formerly President and CEO of Arysta LifeScience, and CFO, R. Brent Jones, formerly interim CFO of Pall Corporation. We do business in approximately 80 countries worldwide, and our long tenured and well trained workforce of approximately 3,600 associates has an average tenure of more than a decade at the Company.
For fiscal 2016, net sales were $1,403 million, net loss was $11.6 million and Adjusted EBITDA was $242.9. Excluding the impact of foreign currency translation, net sales decreased by 0.5% and Adjusted EBITDA increased by 5.3%. For fiscal 2016, net cash provided by operating activities was $116.8 million and Adjusted Free Cash Flow was $86.4 million. For a reconciliation of Adjusted EBITDA and Adjusted Free Cash Flow to the closest comparable GAAP measures, see “Prospectus Summary—Summary Historical Consolidated Financial and Other Data.”
The charts below illustrate the breakdown of our net sales by segment and geography in fiscal 2016:
| Fiscal 2016 Net Sales Breakdown | ||
| Net Sales by Segment |
Net Sales by Geography | |
|
|
[CHART] | |
Our Products and Innovations
Our product portfolio includes diverse packaging film solutions such as rigid barrier films, shrink sleeve films for labels and specialty niche films for decorative surfaces, gift cards and other specialty printing and label applications. Our products play an integral role in the customer value chain by enhancing product graphics and protecting product integrity, food safety, UV protection, consumer health and, ultimately, brand reputation. For example, our specially formulated films for the pharmaceutical industry adhere to strict regulatory requirements set by the FDA and protect products against moisture, gas (e.g., oxygen) and UV rays, enabling maximum product efficacy and increased shelf life. Similarly, our highly engineered label films allow customers to cover the entire body of their product with high-resolution graphics and vibrant color, increasing product appeal while at the same time providing enhanced product protection through tamper evident features.
We believe our experience in the rigid films industry positions us to drive growth through our strong product innovation platform. Recent product launches include clikPET, an innovative yogurt packaging film that extends product shelf life, reduces waste and increases product convenience, and Luxury Vinyl Tile films, which deliver superior durability and wear resistance. We are building on the momentum from recent innovation successes by increasing our investment in research and development capabilities. In 2015, we opened our first kp i.center, a new front-end facility, to strengthen co-creation and collaboration with suppliers and customers. The kp i.center was created to decrease time-to-market and increase our hit-rate for new product innovations. We have also grown our Research & Development team to approximately 80 people as of December 7, 2016. In addition to creating new product formulations, our innovation team also supports customers seeking regulatory
81
Table of Contents
approval in high-value areas such as pharma and certain food applications, as well as improving product appearance in consumer products.
| Recent Innovations | ||
| clikPET |
Luxury Vinyl Tile films | |
|
|
| |
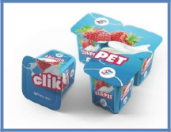

Our Differentiated Business Model
We manufacture rigid film from raw materials (e.g., resin, flakes and additives) and sell our products directly to brand owners and end packers, or to other companies for conversion into packaging or other products in accordance with customers’ and end-user specifications. Our sales to converters are often guided by our relationships with the ultimate brand owners who specify that converters use our film for the end products they manufacture.
| kp Value Chain Overview |
|
|
82
Table of Contents
Manufacturing
Nearly all of our film formulations are developed in-house. We believe our ability to create bespoke, customized film solutions is a key differentiator in the markets we serve. Our core production processes consist of calendering and extruding polymers, adding chemical additives as necessary and further processing to customer specifications. Our process includes complex mixing of various raw materials and ingredients to produce homogenous products. Calendering and extrusion are industrial scale processes to manufacture rigid plastic film using different types of polymers formulated to deliver various performance benefits. Our products are further customized to fit customer specifications through late stage differentiation techniques, as illustrated in the diagram below.
| Manufacturing Process Overview |
|
|
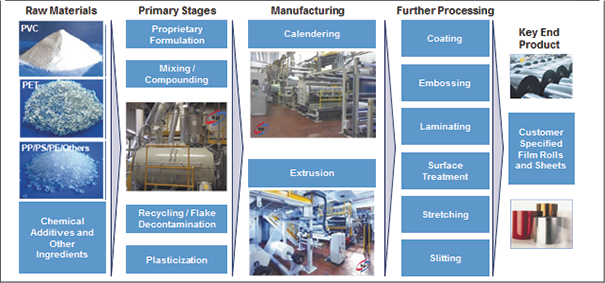
Sales
We have a dedicated commercial team of approximately 340 associates, organized by our segments, across North America, Europe, Asia Pacific and South America. Our sales force works closely with our customers to create value added product solutions and to service our customers based on quality, timeliness of delivery and steadiness of supply. Our sales force is supported by a team of approximately 80 research and development personnel who we believe provide industry-leading support services directly to our customers. Our technical support team lowers overall costs for our customers by maximizing our customers’ machine uptime, throughput and yield. We believe our sales force and technical support teams are key differentiators of our “go-to-market” strategy.
83
Table of Contents
Segments
Our business operates through four segments: Pharma, Food & Consumer Packaging, Labels and Specialties. Each segment has a dedicated commercial and innovation team aligned by market to promote greater sales force effectiveness and customer focus.
| End-Market Overview | ||||||||
| Pharma |
Food & Consumer |
Labels |
Specialties | |||||
| % of our Fiscal 2016 Net Sales |
• 25% |
• 37% |
• 14% |
• 22% | ||||
| Est. Market Growth |
• 3-5% |
• 2-3% |
• 4-6% |
• 2-5% | ||||
| Applications | • Pharmaceuticals
• Medical devices |
• Food
• Dairy
• Consumer products |
• Bottles
• Bottle cap
• Batteries |
• Decorative surfaces
• Card films (e.g., gift and ID)
• Stationery films
• Industrial and Construction | ||||
| Key Growth |
• Aging population in developed markets
• Drug safety/integrity
• Evolution of packaging solutions to extend product shelf life
• Expanding generic drug market
• Growing middle class in emerging markets
• Increase in capsule-based applications |
• Increased penetration of pre-packaged foods
• Increased food safety requirements
• Innovative packaging alternatives driven by market demand
• Secular trend to single serving and smaller food packs
• Millennial consumption habits (snacking)
• Strong growth in select sub-segments (yogurts) |
• Label conversion towards high margin shrink sleeve market
• Increasing demand for smart labels for safety and product tracking
• Shrink film continues to displace traditional flexible label alternatives
• Introduction of new polymer (polyolefin) |
• Diverse blend of global market exposures
• Attractive niche applications with superior performance characteristics relative to existing technology
• Surface protection for high value goods (flooring)
• Gift cards and ID card products expected to further proliferate worldwide | ||||
| Select Product Images |

|

|

|

| ||||
Pharma
We manufacture an extensive range of pharmaceutical packaging rigid films, including multi-layer barrier films for blister packaging as well as mono-layer barrier and multi-layer polymer films for sterile packaging of medical
84
Table of Contents
devices, such as surgical tools. As a result of strict regulatory specifications, our products and processes are required to be certified by various regulatory authorities, such as the FDA, as part of the initial drug approval process and are typically included in the drug master file. With an average overall certification process length of 6 to 12 months, we believe that these production requirements, along with our scale in the global market, create a significant competitive advantage.
Food & Consumer Packaging
Our Food & Consumer Packaging product portfolio consists mainly of mono-layer and multi-layer rigid films based on a wide variety of polymers. We produce films used in the packaging of fresh and pre-prepared foods, including sandwiches, salads, pasta, meat, cheese and fish. Our films are designed to provide heat resistance and specialized barrier properties to protect against moisture and oxygen and to improve the appearance, appeal and shelf life of packaged food products. Our rigid plastic films are also used by our global customers in a broad range of other packaging applications, including packaging for electronic components, cosmetics, household goods, personal care and lighting products.
Labels
We offer a broad range of label products for customers in the beverage and electronic battery end-markets. Our films are used for bottle wrap labels, tamper resistant closures, wine bottle capsules and battery wraps. With full color photographic images that wrap 360 degrees around containers, our customized products enhance the shelf appeal and marketability of the end product. In addition, our products can enhance the performance and functionality of the end product (such as UV protection in the case of full body shrink labels). We continue to introduce new products and build additional capacity to support this segment, with a focus on performance, differentiation and recyclability.
Specialties
We actively manage a portfolio of distinctive application solutions that require a high level of technical collaboration with our customers. For example, we produce a full portfolio of core and overlay films for specific card applications (such as gift cards). These solutions need to provide extended durability, increased security and greater design flexibility. Our film solutions for decorative flooring were developed in response to customer needs for wear resistance and superior durability in luxury vinyl tiles. Other application solutions apply to areas such as specialized printing and other decorative surfaces.
Industry and End-Markets
The packaging industry encompasses a wide variety of materials (plastic, glass, metal and paper) and applications (food and beverage, consumer, industrial and pharmaceutical). We estimate that the current size of the overall global packaging industry exceeds $850 billion, growing at approximately 3% annually.
We primarily operate within the approximately $190 billion rigid plastic packaging segment of the wider packaging market, with complementary applications in attractive semi-rigid and flexible films for products such as shrink sleeve labels. According to Smithers Pira, the rigid plastic market, which includes rigid plastic films, is expected to grow between 2015 and 2020 at an approximately 4% CAGR, which is above the global packaging industry. Growth in the rigid plastic market is driven by numerous factors which include increasing demand for light weight, re-sealable, convenient and portable packaging. The expanded market for packaged food in retail outlets is also driving increased demand for on-the-go packaging solutions, highly decorative and eye-catching packaging. Finally, the focus on food and drug safety and sustainability, with demographic changes through an aging and urbanizing population, is creating additional demand for our products, which is being further driven by
85
Table of Contents
the increasing need for innovation and customization through more complex packaging applications on a global scale.
| Global Rigid Plastics Industry (million tons) |
|
|
Source: Smithers Pira
Packaged goods utilizing PET and PVC, our primary base polymers, have seen consistent and stable growth in our largest developed markets. PET growth is expected to outpace PVC growth modestly as a result of selected areas of industry migration towards PET. Within developing economies, demand growth for PET-based and PVC-based packaging products is expected to grow at higher rates as the middle class grows and overall consumption of related goods increases. In our core end-markets, we expect volume growth in Pharma and Labels will outpace the broader global rigid plastics industry with growth rates of 3% to 5% and 4% to 6%, respectively, while Food & Consumer Packaging and Specialties are more likely to see volume growth of 2% to 5% annually, on average.
As a large global producer of rigid plastic films, we believe we hold a top 3 position in the majority of our end-markets across Europe and the Americas. We estimate that we are more than double the size of our nearest global competitor in terms of volume supplied. Our key competitors tend to focus on films based on a specific polymer, either PET or PVC, as well as specific end-markets.
We believe that we are the global leader in the PVC market. Our competitors that focus on PVC include Bilcare, Nan Ya, Tekni-Plex, Alfatherm and Perlen. While the PET market is more fragmented than the PVC market, over the last decade, we have established ourselves as a global leader in PET applications as well. Key competitors in the PET market include Octal and Hagner.
86
Table of Contents
We believe we enjoy market leading positions across a majority of our products across the end-markets and geographies we serve.
| Western Europe | North America | South America | ||||||
| Pharma | Mono | #1 | #1 | #1 | ||||
| Barrier | Top 3 | #1 | #1 | |||||
| Medical Devices | Top 3 | Top 3 | — | |||||
| Food & Consumer Packaging |
Multi-Layer | #1 | — | — | ||||
| Mono-Layer | Top 3 | Top 3 | Top 3 | |||||
| PP/PS | — | — | — | |||||
| Labels | Shrink Sleeve | Top 3 | Top 3 | — | ||||
| Roll Sleeve | Top 3 | #1 | — | |||||
| Battery | #1 | #1 | — | |||||
| Specialties | Cards | #1 | #1 | — | ||||
| Decorative Surfaces | Top 3 | — | — | |||||
| Tape | #1 | — | — |
Our Competitive Strengths
Market Leading Positions Across Key Geographies and End-Markets
We are the global leader in the rigid plastic film industry with highly complementary capabilities in semi-rigid and flexible films. Our market leadership is a function of our technical and material science capabilities, which allow us to provide customized solutions and services to customers. With $1.4 billion of net sales in fiscal 2016, we have 19 production sites servicing customers in approximately 80 countries and capacity of approximately 600,000 tons, we believe we are substantially larger than our nearest competitors in PVC and PET. We are the only rigid film manufacturer with in-house sales and manufacturing capabilities across North America, South America, Europe and Asia Pacific. We believe approximately 75% of our net sales comes from end-markets where we are a top 3 market leader.
Growing, Resilient End-Markets with Strong Secular Growth Drivers
We continue to benefit from a trend of increasing demand for rigid packaging in our segments. According to Smithers Pira, the rigid packaging market has experienced growth in 14 of the last 15 years. Currently, Smithers Pira projects that the market will grow at a CAGR of approximately 4% through 2020. Our business further benefits from trends in our core Pharma and Food & Consumer Packaging markets, in particular toward conversion from other packaging types to rigid film. Our success in capitalizing on this growing demand is a function of our ability to anticipate changing consumer preferences, such as trends towards light weighting, sustainability, smaller, more affordable and convenient product sizes and smart and aesthetically-pleasing packaging.
While organized as four segments, we operate in a number of distinct end-markets with varying yet complementary growth drivers. Our end-markets are generally non-cyclical in nature, and include pharmaceuticals, medical devices, food and beverage, fresh dairy, batteries, gift cards, decorative flooring, specialty printing and other consumer and industrial product categories. Our geographic footprint and end-market diversification has led to increased resilience, improved stability and limited cyclicality in our business.
87
Table of Contents
Leading Technical Expertise and Material Science Capabilities
Over our 50+ year history, we have developed industry-leading technical, manufacturing and material science capabilities that allow us to provide our customers with a broad range of proprietary film formulations, product solutions and services.
We have over 250 base formulations developed in-house through in-depth knowledge of chemistry and material interactions, and differentiated secondary processes of coating, embossing and laminating, which we use to create bespoke products for our customers, providing protection, durability, clarity and color, among other things. This unique expertise is evidenced through our product portfolio of more than 17,000 SKUs. Our manufacturing operations comply with the required regulatory certifications, and all of our sites and clean rooms are ISO 9001-14001 certified and approved by various food and drug agencies, such as the FDA and European Medicines Agency. These certifications are particularly important as we are a key supplier to the pharmaceutical and food end-markets.
Product quality, innovation, regulatory and customer certifications, delivery time and degree of customization create significant competitive advantages that we believe help us drive growth and profitability in our business.
Commitment to Innovation
We believe that we are an innovator and process leader in the rigid plastic films industry, and our business has historically benefitted from a strong technology platform. Our technological leadership is the result of our operational and engineering experience that we have built up over the past 50+ years, embedded process knowledge, product development efforts and efficient machinery base, a significant portion of which we custom engineer in-house.
To enhance our innovation efforts, within our 80 person Research and Development team we have (i) created a dedicated innovation team of approximately 40 associates and a VP of Innovation; (ii) hired dedicated product development directors for each segment; (iii) created a Chief Engineering Officer position; (iv) partnered with universities to bolster ongoing product development; and (v) opened a kp i.center for our Pharma segment. We believe these additional capabilities will enable us to maintain our competitive advantage as an innovation leader and drive growth throughout the organization.
Longstanding Relationships with a Diverse Global Customer Base
Our ability to provide bespoke products, meeting our customers’ stringent qualifications, has led to sticky and long-term relationships with a diverse customer base. Each of our top 10 customers has been our customer for over 10 years. Since 2012, we have retained 96% of our top 50 customers. In addition, we believe that we maintain the majority of most of our key customers’ wallet share.
Track Record of Growth and Cash Flow Generation
Excluding the impact of foreign currency translation, we have delivered consistent Adjusted EBITDA growth and margin improvement, which has translated into significant Adjusted Free Cash Flow generation and value creation for our stockholders. Over the past 4 years, our Adjusted EBITDA has increased at a CAGR of 2.5% and Adjusted EBITDA margins have increased by approximately 270 bps. Over the same period and excluding the impact of foreign currency translation, our Adjusted EBITDA has increased at a CAGR of 8.1% and Adjusted EBITDA margins have increased by 250 bps. In addition, our net loss went from $75.4 million for fiscal 2013 to $11.6 million for fiscal 2016. In our last three fiscal years, 2014 to 2016, we have successfully achieved operational and procurement savings of nearly $125 million, offsetting inflationary pressures while allowing us to continuously expand margins. In our operations, we have enhanced yields in our manufacturing process, lowered customer complaints, increased usage of non-virgin materials and optimized our operational headcount. In our procurement function, we have standardized our operations to drive savings and achieved additional indirect cost savings.
88
Table of Contents
While growing our Adjusted EBITDA and expanding our margins, we have also demonstrated an ability to generate significant discretionary cash flow, with Adjusted Free Cash Flow of $86.4 million in fiscal 2016. This robust Adjusted Free Cash Flow enables us to make disciplined investments in organic growth initiatives and M&A. Our near-term capital expenditure projects have a high return threshold of over 20% internal rate of return and are primarily investments in capacity where we are operating at utilization of 90% or higher. For a reconciliation of Adjusted EBITDA and Adjusted Free Cash Flow to the closest comparable GAAP measures, see “Prospectus Summary—Summary Historical Consolidated Financial and Other Data.”
Proven Management Team Supported by a Long Tenured Production Team
We have a strong management team that has significant experience from blue chip, publicly listed, best-in-class global organizations. The company is led by our CEO and CFO. Our CEO, Wayne Hewett, who joined kp in September 2015, was formerly the President and CEO of Arysta LifeScience and led GE Momentive Performance Materials, and our CFO, R. Brent Jones, was formerly interim CFO of Pall Corporation. Our senior team is complemented by organizational continuity through a long tenured production team with deep process knowledge and on average over a decade of experience.
Our Strategies
We seek to continue to take advantage of our competitive strengths by pursuing the following business strategies to drive growth, expand our margins and generate significant Adjusted Free Cash Flow.
Enhance Commercial Initiatives to Grow Core Business
We have enjoyed significant continuity with our customers for many years. We believe we can expand these relationships by proactively marketing our full suite of solutions and addressing unmet customer needs. We believe there is additional volume upside from current customers through targeted actions and investments including KAM (with a goal to increasing customer penetration), CRM (realigned business units with dedicated sales teams equipped with enhanced technology tools and sales applications) and increased customer service personnel. We expect to continue to invest in and grow our sales team in order to support these initiatives.
Our current initiatives to accelerate further volume growth with both current and new customers include (i) a realignment of our salesforce by end-market to better understand customer needs, allowing us to prepare specific, tailored solutions; (ii) an increase in the size of our already industry-leading sales force, of approximately 340 sales and support employees by hiring approximately 20 additional sales staff; and (iii) changes in our sales force compensation with an increase in the variable component to focus on new customer wins and increased wallet share.
Accelerate Innovation in Response to Customer Needs
We have increased our focus on innovation in recent years in an effort to collaborate with and provide better solutions for our customers. We believe we can further drive net sales and Adjusted EBITDA growth through products originated in our stage-gate innovation process (i.e., products that are not yet in commercial production). We intend to open additional kp i.centers to continue to develop platforms in order to work with suppliers, customers and others in our ecosystem, such as universities, to develop new products and address the ongoing challenges our customers face.
Drive Continuous Operational Improvement
We believe we have established a solid framework based on Lean Six Sigma methodology to continuously improve our operational efficiency and effectiveness and offset the impact of inflation. Through this framework, we believe we can increase material efficiency, reduce procurement costs and improve quality.
89
Table of Contents
In addition, we are reorganizing our people and processes into a global supply chain designed to take better advantage of scale in procurement and to shorten lead times, resulting in lower raw material costs and improved customer service.
Invest for Growth
We intend to make targeted investments to accelerate growth with attractive returns on capital. Our growth investments will be focused on (i) expansion of existing facilities such that we can take advantage of opportunities in our current markets; (ii) greenfield facilities that allow us to capitalize on regional demand where we do not have existing facilities or where we operate at or near optimal utilization; and (iii) investments in manufacturing equipment that continue to drive operational efficiencies within our manufacturing infrastructure.
Pursue Pipeline of Attractive Bolt-On M&A
In addition to our organic growth initiatives, we plan to pursue select M&A opportunities. We have a long history of M&A with over 20 acquisitions over our 50+ year history. We believe we are a natural consolidator in the fragmented rigid films industry and have demonstrated the ability to successfully integrate acquisitions and realize synergies. Our IT infrastructure and standardized global processes provide a stable environment to incorporate future acquisitions into our system. We believe that we have a clear acquisition strategy in place, targeting bolt-on acquisitions with significant synergies to drive long-term value creation for stockholders. To execute on our strategy, we have established an M&A-focused team to drive our strategic agenda following a recent period of internally-focused initiatives.
We intend to apply selective and disciplined acquisition criteria focused on: (i) acquisitions that consolidate our existing markets; (ii) acquisitions that offer geographic expansion in our existing business lines; (iii) acquisitions in attractive adjacencies, including licensing rights agreements; and (iv) acquisitions of new technologies, innovations or game-changing products. As part of this strategic agenda, we recently announced the acquisition of Farmamak, improving our market presence in Turkey and throughout the Middle East and enhancing our service capabilities in the region.
We believe that our track record of net sales growth and disciplined capital spending will enable us to generate excess Adjusted Free Cash Flow that can be re-deployed through accretive acquisitions that strengthen our core businesses and grow our company on a global basis.
Customers
We sell our products to a diverse base of over 3,700 customers, including major packaging converters, end packagers and brand owners, ranging from global to regionally-oriented food and beverage, consumer products and pharmaceutical companies in Europe, the Americas and Asia Pacific. Our customers represent a diverse mix of multinational companies and mid-size regional and local specialty companies. Our customers generally select suppliers based on product quality, innovation capabilities, delivery, service reliability, technical support, global sourcing capabilities and price. We believe that we have provided a reliable supply of high-quality products to our customers over decades, which has helped us establish longstanding customer relationships.
Our customer base includes brand owners, end packagers and packaging converters. For brand owners, our products are typically produced according to the brand owner’s specifications. End packagers are typically food packagers who will use our films to package their products before sale to a distributor or retailer. Converters are processors who convert our films into final packaging solutions. Converters then sell the final packaging products to end-customers such as medical manufacturers, food processors and consumer goods companies.
Many of our customers pursue a dual sourcing strategy in which they rely on one primary and one secondary supplier. This allows our customers to maintain a back-up source of supply in periods of high demand
90
Table of Contents
or in the event there is a disruption in the primary supply. We believe our customers typically use a limited amount of suppliers because the additional security of supply is not considered as important as achieving volume discounts. For example, a typical Pharma customer will have a primary supplier and a secondary supplier. We believe that we maintain a majority of most of our key customers’ wallet share. Technically-oriented and time-consuming certification requirements for certain products in our Pharma segment also support the long-term consistency of our relationships.
| % of Sales from Top 10
|
# of Top 10 Customers
| |||
| Consolidated | 15%
|
10 of 10
| ||
| Pharma
|
34%
|
9 of 10
| ||
| Food & Consumer Packaging
|
26%
|
9 of 10
| ||
| Labels
|
39%
|
7 of 10
| ||
| Specialties
|
29%
|
10 of 10
|
Contractual Relationships
Many of our sales are made through our contractual agreements with our customers, which are intended to protect us and the customers from volatility and short-term fluctuations in the marketplace. Specifically, our agreements contain arrangements concerning volume forecasts, pricing mechanisms, service levels and possible product developments. When raw material prices increase, we try to pass through price increase to our customers. However, our ability to pass through increases in raw material prices is a function of the degree of competition in the relevant market, customers’ willingness to pay and contract structures. Typically, our fixed contracts contain pricing mechanisms with formulas linked to industry indices. These arrangements typically allow for raw material pass-through pricing with a time lag depending on specific terms of the contract. We have three types of contracts with material price changes:
| • | contracts with escalators: prices are adjusted automatically, in many cases every three months based on raw material price changes in the past months; |
| • | contracts with volatile resin clauses (“VRC”): typically combined with escalator clauses and allow for an adjustment of prices, effective immediately or as of the end of the then-current month, if raw materials change beyond a certain value; and |
| • | contracts subject to price negotiation: price level is negotiated and fixed for a certain period; at the end of the period the price is renegotiated for the next period. |
In recent years we have increasingly altered our pass-through methodology for certain customer contracts to include material price clauses. Specifically, this has given us the opportunity to target more specific price movements and enabled us to pass through material price changes more rapidly (typically a three-month lag with escalator clauses). New clauses in the contracts typically permit 80% to 100% pass through of material price changes compared to an average of approximately 50% as recently as three years ago.
While material price clauses provide more margin certainty, they also limit spot pricing flexibility, when resin costs are increasing, thus maintaining a more stable profit margin as resin prices fluctuate. Given our importance to our customers, we strive to have a balanced mix between contracted and non-contracted based sales in order to opportunistically take advantage of all pricing conditions. Currently, approximately 35% of net sales volumes are covered with such contracts. Contractual relationships vary across product groups and geographies.
91
Table of Contents
Marketing Strategy
Our marketing strategy involves continuously building and expanding long-term relationships with our customers based on product quality, innovation capabilities, delivery, service reliability, technical support, global sourcing capabilities and price.
We have a dedicated sales force of approximately 340 associates, organized by our segments, across North America, Europe, Asia Pacific and South America. Our sales efforts also include working with select independent sales agencies. We incentivize and compensate our dedicated sales force and the independent sales agents we work with based on sales or profit margins to further drive future growth.
It is critical in our industry to provide superior customer service. We therefore approach sales and marketing with interdisciplinary teams comprised of a sales force, who has specialized product and end-market knowledge, and a technical support team, which is critical in coordinating sales and production activities to meet specific customer and market demands. Our technical support team also provides customers with ongoing technical assistance and advice concerning the most efficient method of processing our film products on their machines. Our direct sales force and technical support team are key differentiators of our “go-to-market” strategy.
Research and Development
Our research and development organization is comprised of approximately 80 dedicated employees and engineers. These technical personnel, together with our operations and sales teams, work closely with current and potential customers to develop customized products that meet our customers’ specific performance requirements and to assist them in using our products most efficiently on their equipment. In addition, we work closely with a number of key suppliers to develop differentiated products that offer competitive advantages to our customers. We believe that continued research and development activities and our technical expertise will help to ensure that we maintain a leading position in product and production technology.
In 2015, we opened our first kp i.center, a new front-end facility, to strengthen co-creation and collaboration with suppliers and customers. The kp i.center was created to decrease time-to-market and hit-rate for new product innovations. One of the projects developed at our kp i.center is hot filled gummies that allow content to be inserted directly into packaging mold at 120°C. The hot filled gummies innovation results in packages that do not warp under high temperatures while the contents maintain proper moisture levels. We intend to open additional kp i.centers to increase customer involvement.
Our research and development efforts continue to lead to new innovative solutions to meet customer challenges. Recent successful product launches also include clikPET, an innovative yogurt packaging that extends product shelf life, reduces waste and increases product convenience, and Luxury Vinyl Tile films, which delivers superior durability and wear resistance.
92
Table of Contents
Raw Materials and Procurement
The raw materials we use to manufacture our films include various resins and additives. While PVC accounts for the majority of our business, we have increased the use of PET resin in certain parts of our business in recent years in response to increasing demand from our food packaging customers, primarily in Europe. For fiscal 2016, raw materials accounted for 67% of cost of goods sold.
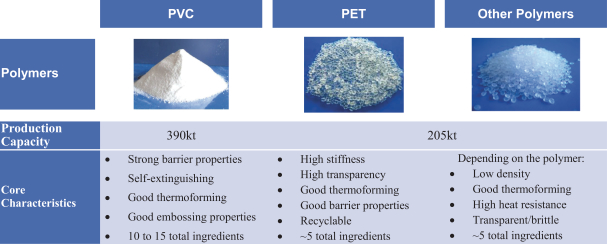
Demand for PVC is largely driven by the construction industry, while demand for PET is largely driven by the textile and bottles industries. As a consequence, prices tend to broadly track supply and demand characteristics in these end-markets. PET prices tend to follow price fluctuations in the two raw materials used in its production, purified terephthalic acid and monoethylene glycol.
Changes in the prices of the raw materials that we use may affect our profitability. To mitigate our exposure to price fluctuation, we have sought to enhance our purchasing techniques. In addition, some of our customer contracts contain pricing mechanisms with formulas linked to industry indices. These arrangements typically allow for raw material pass-through pricing with a time lag depending on specific terms of the contract. While we historically carried out raw material purchasing activities locally in the various regions in which we operate, we are in the early stages of globalizing and streamlining our procurement process by establishing an integrated global purchasing organization to coordinate the purchase of our key raw materials, leverage our advantageous purchasing scale and establish new purchasing opportunities.
We have also consolidated our supplier base, which has increased our bargaining power and resulted in significantly improved pricing in Europe and the United States for both PVC and PET. Supply base consolidation, along with our position as one of the largest consumers of both PVC and PET resins within rigid plastic film, allows us to achieve discounts compared to market price indices, in particular for PVC.
It is our sourcing strategy to be dual sourced, at a minimum. Historically, we have not experienced any significant disruptions in supply as a result of shortages in raw materials. However, some of the specialized raw materials we now purchase and that we may purchase in the future may be proprietary to specific suppliers. If any of these specific suppliers become subject to a production disruption or become otherwise unable to meet our requirements, we may be unable to obtain raw materials of the same standard, quality or price. To mitigate this risk, we seek to reduce our dependency on single source suppliers by approving additional sources and engaging our suppliers to jointly develop alternative materials over the medium to long-term.
Manufacturing and Operations
Our production network principally consists of 19 fully operating manufacturing and conversion facilities in 13 countries throughout the world. In these facilities, we operate 38 PET extrusion lines, 41 PVC calender lines,
93
Table of Contents
and 23 machines for secondary processes. As of September 30, 2016 and including the recent Farmamak Acquisition, we had approximately 600,000 tons of capacity for calendering and extruding and approximately 110,000 additional tons of capacity for secondary processes such as laminating and coating.
We use state of the art equipment at our manufacturing facilities to manufacture primarily rigid plastic film products. Our key manufacturing technologies are known as calendering, extrusion and—mainly in the case of pharmaceutical films—coating and lamination. Calendering is the optimal process choice for PVC wherein large volumes of high quality vinyl sheets and film rolls can be produced through the process. The calendering manufacturing process is split into five stages, which are raw material handling, compounding, calendering, tempering and winding. After compounding the PVC formulation, the polymers are melted in a kneader or extruder, after which the film is formed by applying pressure and heat on the calender rolls. The outcome, a continuous film, is either rolled or sheeted, depending on product attributes. Extrusion technology is more suitable for PET. Extrusion entails the transformation of plastic powder or pellets into a melt, which can then be shaped through dies as required. End products for this process are usually custom profiles, sheets, pipes, tubes, fibers, films, coatings and pellets. Through cast extrusion, film can be spread onto a roll where it can be processed in coating, laminating, stretching and embossing steps. PET film can also be manufactured through blow film extrusion where the material is rapidly expanded and cooled by air to drive the shape of the final product.
The following diagram demonstrates our base film manufacturing processes:

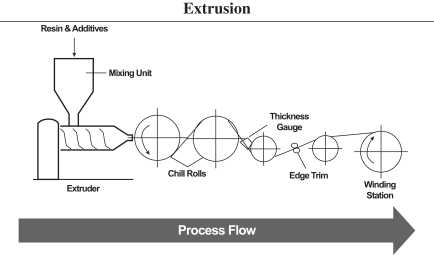
94
Table of Contents
We believe that our in-house engineering of calendering lines and technical development of manufacturing processes have provided us with a significant advantage over our competitors. We believe that our years of experience, commitment to capital investment and industry and expertise have allowed us to obtain and maintain a leading technological position in the industry, particularly with respect to PVC calendering, enhanced machine efficiency, greater product quality and a greater ability to meet product specifications. In addition, we seek to improve efficiency by continuously improving our enterprise resource planning and other systems on a global scale. Generally, our manufacturing plants operate 24 hours a day, seven days a week. Our extensive machine base allows us to dedicate individual production lines to specific products, which we believe results in fewer changeovers, higher quality products and improved capacity utilization.
The following chart provides an overview of our manufacturing plants as of December 7, 2016:
| Manufacturing Plant |
Country | Segments Served | Owned / Leased |
Primary Production Capacity (t) |
Secondary Processes Capacity (t) |
|||||||||||||||
| Heiligenroth (Montabaur) | Germany | FCP, PH, SP | Owned | 116,410 | — | |||||||||||||||
| Burgkirchen (Gendorf) | Germany | LA, SP | Leased(1) | 55,900 | 19,120 | |||||||||||||||
| Sant Feliu de Buixalleu (Girona) | Spain | FCP | Leased | 24,469 | — | |||||||||||||||
| St. Petersburg | Russia | FCP, PH, SP | Owned | 11,900 | — | |||||||||||||||
| Liebefeld (Bern) | Switzerland | PH | Owned | — | 10,208 | |||||||||||||||
| Santo Tirso | Portugal | FCP, PH | Leased | 43,058 | — | |||||||||||||||
| Crumlin | Great Britain | FCP | Owned | 35,520 | — | |||||||||||||||
| Rayong | Thailand | LA, PH | Owned | 18,950 | 16,200 | |||||||||||||||
| Suzhou | China | LA | Leased(2) | 6,600 | 6,851 | |||||||||||||||
| Gordonsville | USA, Virginia | LA, FCP, PH, SP | Owned | 72,722 | — | |||||||||||||||
| Gordonsville Barrier | USA, Virginia | PH | Owned | — | 7,500 | |||||||||||||||
| Rural Retreat | USA, Virginia | LA, FCP, PH, SP | Owned | 79,536 | 27,235 | |||||||||||||||
| Beaver | USA, West Virginia | FCP, SP | |
Finance Lease |
|
19,551 | — | |||||||||||||
| Franklin | USA, Ohio | SP | Leased | — | 2,809 | |||||||||||||||
| Greenville | USA, Ohio | FCP, PH, SP | Leased | 24,090 | — | |||||||||||||||
| Montreal (Quebec) | Canada | FCP | Leased | 12,014 | — | |||||||||||||||
| Villa Del Totoral | Argentina | FCP, PH, SP | Owned | 6,810 | 979 | |||||||||||||||
| Cotia | Brazil | FCP, PH | Leased | 15,706 | 6,835 | |||||||||||||||
| Gebze (Istanbul) | Turkey | FCP, PH | Leased | 55,000 | 12,000 | |||||||||||||||
|
|
|
|
|
|||||||||||||||||
| Total |
598,236 | 109,737 | ||||||||||||||||||
| (1) | Hereditary building right. |
| (2) | 50-year usage right of land, facility is owned by us. |
Logistics
We have access to a comprehensive transportation network and associated logistics infrastructure through a combination of ownership and long-term contracts. We believe that this network enables us to move raw materials and products at industry-leading rates. In Europe and Asia Pacific, third party transportation companies ship our products. In the Americas, we ship the majority of our products using our own fleet of delivery vehicles, which also takes on third party products to improve capacity utilization. Third party transportation companies ship the remainder of our products in North America and South America.
Intellectual Property Rights
We consider our patents, patent licenses and trademarks, in the aggregate, to be important to our business and seek to protect this proprietary knowledge, in part, through German, U.S., and other foreign patent and trademark registrations and the World Intellectual Property Organization. Some of our patents are also important individually. As of September 30, 2016, we maintained more than 200 patents and pending patent applications belonging to more than 40 patent families, more than 600 trademarks by country, 20 European Community
95
Table of Contents
Trademarks and 30 international trademarks. Our patent portfolio is an important asset that differentiates us from our competitors, in particular for our Pharma segment. Our Food & Consumer, Labels and Specialty segments are less driven by patents but rather by know-how. However, we generally pursue an active patent filing strategy across all our segments in order to secure and strengthen our market position. Most of our patents were filed after 2002. In addition, we maintain trade secrets for which we have not sought patent protection in order to maintain maximum confidentiality. We routinely enter into confidentiality and non-compete agreements with our senior employees to protect our trade secrets and proprietary knowledge.
Employees
As of December 7, 2016, we had approximately 3,600 employees worldwide, with more than 1,800 in Europe, nearly 1,300 in the Americas and more than 500 in Asia Pacific. Our experienced production team has on average over 10 years of experience at the Company.
We estimate that, as of September 30, 2016, including the Farmamak Acquisition, approximately 45% of our employees are represented by collective bargaining agreements. Some of our European employees are organized in local unions, and some of our German employees are represented by a chemical industry union. Our employees in the United States are not unionized. Based on agreements with our unions, we are allowed to introduce flexible working conditions and currently operate a five-shift system throughout all of our major European manufacturing facilities. Historically, we have enjoyed good labor relations, and we are committed to maintaining these relationships. There have been no work stoppages or strikes at any of our facilities during the past five years. We take a constructive approach to union relationships where there are unionized facilities, and have been able to secure the cooperation of our unions and our workforce with regard to significant changes in those facilities. See “Risk Factors—Risks Relating to Our Business—Failure to maintain good employee relations may affect our operations and the success of our business.”
| Overview of Global and Diversified Workforce | ||
| Employees by Region |
Employees by Function | |
|
|
| |
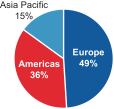
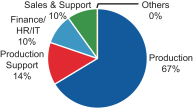
Insurance
We carry an all-risk insurance policy for our assets, as well as policies for consequential loss of profits and payments of fixed costs as a consequence of fire, explosion, electrical damage, machinery breakdown, flooding or fuel or power shortages, third party liability insurance, transport insurance, computer insurance and life insurance for all of our employees. While we factor many of our receivables, we do have credit insurance for customer defaults through our factoring agent. We believe that our policies are in accordance with customary industry practices, including deductibles and coverage amounts. Our broker, lead insurers and underwriters monitor fire and explosion risks and inspect all assets routinely. See “Risk Factors—Risks Relating to our Business—Our insurance coverage may not be adequate to cover all the risks we may face and if we were no longer covered by our existing insurance, it may be difficult to obtain replacement insurance on acceptable terms or at all.”
Licenses, Permits, Authorizations, Concessions and Certifications
As a global manufacturing company, we are subject to a number of licenses, permits, authorizations, concessions and certifications in each of the jurisdictions in which we operate, and such certifications can vary
96
Table of Contents
widely between jurisdictions. We believe that we hold all material licenses, permits, authorizations, concessions and certifications necessary to operate our business. Certifications for one of our 19 production plants is currently being reviewed by the local authorities. See “Regulations.”
Quality Control
Our quality control and assurance programs are designed to enable us to maintain strict compliance with all applicable governmental mandates regarding the safe manufacture of pharmaceutical and food packaging. Quality control policies and procedures are strictly monitored and enforced at all of our manufacturing locations. All plants ensure product consistency to a designed standard of product quality. Our customers demand high quality standards and visit our premises regularly, including unannounced visits.
Seasonality
Our business is subject to seasonal influences. In the first fiscal quarter of each year, we generally realize lower net sales and operating income due to the holiday seasons.
Legal Proceedings
At any given time, we may be a party to litigation or be subject to non-litigated claims arising out of the normal operation of our business. Although our legal and financial liability with respect to such proceedings cannot be estimated with certainty, we believe that any ultimate liability in connection with such matters that are currently pending would not be material to our financial condition.
97
Table of Contents
Overview
Our businesses are highly regulated in all of the jurisdictions in which we operate and we are required to hold a wide variety of licenses and permits. Our manufacturing facilities and operations are subject to both national and international regulatory regimes. In the member states of the European Union (the “Member States”), the regulatory environment of our business activities is shaped by EU directives and regulations, which are either implemented in the individual Member States through national legislation or have direct application to the states or individuals. In the United States, our facilities are subject to federal, state and local environmental laws and regulations. Regulations that affect our operations mostly relate to areas of environmental protection, product safety and quality, occupational health and safety, industrial hygiene and plant safety.
EHS laws and regulations govern our facilities and our operations, including: (i) the storage, handling, treatment and disposal of hazardous substances and wastes; (ii) water discharges; (iii) air emissions; (iv) human health and safety; (v) the remediation of releases of hazardous substances and of contaminated facilities; and (vi) the manufacture, sale and use of our products. Many of our operations require permits and controls to monitor or prevent pollution. We have incurred, and will continue to incur, substantial ongoing capital and operating expenditures to ensure compliance with current and future EHS laws and regulations, which tend to become more stringent over time.
Our environmental management systems are intended to ensure that we both comply with applicable environmental requirements and minimize environmental risk. We actively address EHS issues in connection with our operations and properties, and we believe that we have systems in place to ensure that EHS costs and liabilities will not have a material adverse impact on us. Nevertheless, estimates of future EHS costs and liabilities are inherently imprecise, and the imposition of new or unanticipated costs or obligations could have a material adverse effect on our business, financial condition or results of operations.
The following summary highlights some of the key EHS laws and regulations that apply to our business.
REACH Classification, Labeling and Packaging and Similar Regulations
The European Union requires control of the use of chemical products within the European Union by imposing on all affected industries the responsibility for ensuring and demonstrating the safe manufacture, use and disposal of chemicals. The REACH regulation requires the registration of all chemicals manufactured in or imported into the European Union (either alone, in mixtures or in articles). Although REACH compliance is primarily the responsibility of our suppliers or the producers of chemical raw materials, we are also affected by REACH as a “downstream” user of REACH-regulated substances.
In the U.S., TSCA ensures that chemicals manufactured, imported, processed, or distributed in commerce, or used or disposed of in the United States do not pose unreasonable risks to human health or the environment. Chemicals not listed on the TSCA registry or otherwise exempted cannot be imported into or sold in the United States until registered with the EPA. TSCA sets forth specific reporting, record keeping, and testing rules for chemicals (including requirements for the import and export of certain chemicals), as well as other restrictions relevant to our business.
Air Emissions
Our U.S. facilities are subject to the Clean Air Act, which addresses threats to human health and the environment from emissions of pollutants into the air. The Clean Air Act establishes air quality standards and sets emission limits principally for carbon monoxide, lead, nitrogen oxides, particulate matter, ground level ozone, and sulfur dioxide and regulates the emission of certain designated hazardous air pollutants. It authorizes
98
Table of Contents
EPA to regulate hazardous air pollutant emissions from major stationary and mobile sources, such as large industrial sources, and phases out the production of substances that deplete stratospheric ozone. Recently EPA has also begun to regulate certain greenhouse gas emissions under the Clean Air Act.
Our facilities in the European Union are subject to the EU Emissions Trading System (the “EU ETS”), which is an EU-wide system of trading allowances that are issued by Member States to cover industrial GHG emissions and which has been implemented in Germany by the Greenhouse Gas Emission Trading Act (Treibhausemissionshandelsgesetz) (“TEHG”). Industrial facilities to which the EU ETS applies receive a certain number of allowances to emit greenhouse gases and must surrender one allowance for each ton of greenhouse gases emitted. Facilities that emit fewer tons of greenhouse gases than their allocated allowances cover sell their excess allowances in the open market, whereas those that emit more than their currently held allowances must buy additional allowances through the EU ETS.
Further, in respect of our operations in the United Kingdom, we are affected by the UK government’s “Electricity Market Reform” provisions to set a “carbon floor price,” below which the price of CO2 allowances in the UK will not be permitted to fall.
Contamination, Environmental Remediation and Closure Liabilities
Some of our facilities have an extended history of industrial chemical processing, storage and related activities. Under the requirements of permits or pursuant to certain EHS laws and regulations we may be required to investigate and remediate contamination at certain facilities, which we use or have used in the past, particularly if we close an operational facility. In connection with contaminated properties, as well as our operations generally, we also could be subject to claims by government authorities, individuals and other third parties seeking damages for alleged personal injury or property damage resulting from hazardous substance contamination or exposure caused by our operations, facilities or products.
Some of our facilities have been the subject of limited investigations for contamination in the past. Based on current knowledge of facility conditions and existing law and practice, we do not believe we currently have any material obligations or costs for investigation or remediation activities at our facilities except with respect to our facility in Gendorf, Germany. We are currently conducting remediation of contaminated soil discovered during the course of a facility expansion at our Gendorf, Germany facility. We have a reserve of approximately $1.5 million as of September 30, 2016 for this matter. Spills or releases of hazardous materials, the discovery of previously unknown contamination, or the imposition of new obligations to investigate or remediate contamination at our facilities, could result in substantial unanticipated costs. We could be required to establish or substantially increase financial reserves for such obligations or liabilities and, if we fail to accurately predict the amount or timing of such costs, the related impact on our business, financial condition or results of operations in any period in which those costs need to be incurred could be material.
Laws and regulations of many of the jurisdictions in which we operate oblige us to prevent contamination of the soil by taking adequate precautions. The relevant governmental authorities may require responsible parties to take remediation measures, or do so themselves, placing the costs for such action on the responsible parties.
In the U.S., the Comprehensive Environmental Response, Compensation, and Liability Act (“CERCLA”) as amended by the Superfund Amendments and Reauthorization Act of 1986 (“SARA”), and commonly known as the “Superfund,” as well as similar state laws, govern the remediation of contaminated sites and establish joint and several liability for site owners and individuals and entities responsible for disposing of or releasing hazardous substances at, or operating, such sites. In some cases, a party that sent waste to a contaminated site can be held liable for the entire cost of remediation regardless of fault, the lawfulness of disposal or the actions of other parties.
99
Table of Contents
Food Packaging Regulation
Our products are subject to the European Commission Regulation on Plastic Materials and Articles Intended to Come into Contact with Food (the “Food Packaging Regulation”), which is directly applicable to all Member States without transposition into national law. This Regulation establishes specific requirements for the manufacture and marketing of plastic materials and articles that are intended to come into contact with food, are already in contact with food or can reasonably be expected to come into contact with food. The Food Packaging Regulation sets out the rules to follow in order to be able to introduce food packaging products into the market.
This Food Packaging Regulation sets out a list of authorized substances (some of which, due to specific restrictions, must be of a specific purity and quality), which may be used in the manufacture of plastic layers in plastic materials and articles. Additionally, plastic materials and articles must not transfer their constituents to food in quantities exceeding the specific migration limits, as provided by the Food Packaging Regulation.
Occupational Safety and Health
In the U.S., the Occupational Safety and Health Act of 1970 (“OSHA”) addresses safety and health in workplace environments. OSHA’s “general duty” clause requires an employer to furnish to its employees a place of employment free from recognized hazards that are likely to cause death or serious physical harm. In addition to the federal standards, states may design their own job safety and health programs, as long as they are at least as effective as the federal standards. OSHA’s hazard communication standard requires chemical processers to employ a hazard communication program utilizing labels and other forms of warnings, as well as material safety data sheets, setting forth safety and hazardous materials information to employees and customers. OSHA’s hazard communication standard covers both physical hazards (such as flammability or the potential for explosions) and health hazards. Employers must provide their employees with a minimum level of training on proper chemical handling procedures. Our U.S. facilities provide basic training to employees and visitors who have access to chemical handling areas.
Under OSHA, we also must conduct workplace assessments to determine whether hazards are present that require the use of personal protective equipment. If such hazards are present, we must provide appropriate equipment to our employees at our cost and expense, and must require employees to use such protective equipment. OSHA also establishes workplace chemical exposure levels for indoor air quality.
100
Table of Contents
Set forth below is the name, age (as of December 21, 2016), and positions of the persons who will serve as our directors and executive officers upon the consummation of this offering:
| Name |
Age | Position(s) | ||
| Wayne M. Hewett |
52 | Chief Executive Officer and Director | ||
| R. Brent Jones |
47 | Chief Financial Officer | ||
| Richard J. Widden |
55 | Chief Commercial Officer | ||
| Peter Heinze |
51 | Chief Operating Officer | ||
| Marc Setzen |
47 | Chief Engineering Officer | ||
| Bruno Deschamps |
65 | Chairman and Director | ||
| Jason Clarke |
46 | Director | ||
| Florian Kawohl |
44 | Director | ||
| Alexis Pourchet |
37 | Director |
Background of Executive Officers and Directors
Wayne M. Hewett—Chief Executive Officer and Director. Wayne M. Hewett has been the Chief Executive Officer of the Klöckner Pentaplast Group since August 2015. Upon the completion of this offering, Mr. Hewett will serve as Chief Executive Officer and Director of the Company. From 2010 to February 2015, Mr. Hewett served as President and Chief Executive Officer and as a member of the board of directors of Arysta LifeScience Corporation, one of the world’s largest privately held crop protection and life science companies. In February 2015, Arysta LifeScience was acquired by Platform Specialty Products Corporation, a global producer of high technology specialty chemical products and provider of technical services, and Mr. Hewett served as President of Platform Specialty Products until August 2015. Prior to joining Arysta LifeScience in 2009, Mr. Hewett served as a senior consultant to GenNx360, a private equity firm focused on sponsoring buyouts of middle market companies, from February to August 2009. Mr. Hewett’s career has also included over 20 years with General Electric Company, including roles as GE’s Vice-President, Supply Chain and Operations; President and Chief Executive Officer of GE Advanced Materials; President of GE Plastics Pacific; and membership on GE’s Corporate Executive Council. Mr. Hewett currently serves on the board of directors of The Home Depot and previously served on the board of directors of Ingredion Incorporated (2010 to 2015). Mr. Hewett brings to our Board extensive experience in general management, finance, supply chain, operational and international matters.
R. Brent Jones—Chief Financial Officer. R. Brent Jones has been the Chief Financial Officer of the Klöckner Pentaplast Group since April 2016. Upon the completion of this offering, Mr. Jones will serve as Chief Financial Officer of the Company. Prior to joining the Klöckner Pentaplast Group, he served as interim CFO at Pall Corporation from May 2015 until September 2015. At Pall Corporation, Mr. Jones also served as Senior Vice President, Corporate Development & Treasurer from March 2014 to May 2015, as Vice President Finance & Treasurer from January 2013 to March 2014 and Vice President Finance from May 2012 to January 2013. Prior to this, Mr. Jones was a Managing Director in the Corporate Finance & Restructuring Group at Bank of America Merrill Lynch’s investment bank.
Richard J. Widden—Chief Commercial Officer. Richard J. Widden has been the Chief Commercial Officer of the Klöckner Pentaplast Group since February 2016. Upon the completion of this offering, Mr. Widden will serve as Chief Commercial Officer of the Company. Before joining the Klöckner Pentaplast Group, he served as Vice President & General Manager at Avery Dennison from January 2010 until August 2015, where he led the standalone Performance Tapes business, with assignments in Belgium and the United States. Prior to that, Mr. Widden spent nearly 14 years of his career, from 1996 to 2009, at Honeywell International Inc., where he held a number of leadership roles in its Performance Material and Transportation business. Prior to that, Mr. Widden held various management positions at General Electric Supply.
101
Table of Contents
Peter Heinze—Chief Operating Officer. Peter Heinze has been the Chief Operating Officer of the Klöckner Pentaplast Group since April 2016. Upon the completion of this offering, Mr. Heinze will serve as Chief Operating Officer of the Company. Prior to joining the Klöckner Pentaplast Group, Mr. Heinze was the CEO of the Galley Division of Zodiac Aerospace Group, a world leader in aerospace equipment and systems for commercial aircraft, from January 2013 until September 2015. Mr. Heinze also served as a Managing Director of the Catering Equipment Division of Zodiac Aerospace Group from January 2008 until January 2013. Prior to joining Zodiac Aerospace Group, Mr. Heinze served as Regional Operations Director of Stahl Asia Pacific from 2004 to 2007 and in various management positions with General Electric from 1995 to 2004.
Marc Setzen—Chief Engineering Officer. Marc Setzen has been the Chief Engineering Officer of the Klöckner Pentaplast Group since April 2016. Upon the completion of this offering, Mr. Setzen will serve as Chief Engineering Officer of the Company. From May 2014 until March 2016, Mr. Setzen served as Chief Technology Officer of the Klöckner Pentaplast Group, and, from November 2011 to May 2014, he served as Vice President, Operations Europe & Asia of the Klöckner Pentaplast Group. From April 2010 until November 2011, Mr. Setzen was Senior Vice President, Sales & Marketing Central Europe of nkt cables, a global provider of cables and solutions for electrical infrastructure. Prior to that time, Mr. Setzen held various management positions with the IAC Group and PolyOne International.
Bruno Deschamps—Chairman and Director. Bruno Deschamps has served as the Chairman and Director of the Klöckner Pentaplast Group since October 2012. Upon the completion of this offering, Mr. Deschamps will serve as a Director of the Company. He is also Founder, Chairman & Chief Executive Officer of Entrepreneurs Partners LLP and EP Capital Ltd. Prior to joining the Klöckner Pentaplast Group, Mr. Deschamps was Managing Partner at 3i plc in London from 2008 to 2011, in charge of continental Europe and operational capabilities. He joined 3i plc in 2008 from Clayton, Dubilier & Rice (New York and London), where he had been Operating Partner since 2002. Prior to this, Mr. Deschamps had been President and Chief Operating Officer of Ecolab, President and Chief Executive Officer of Henkel Ecolab (Germany), Executive Vice President of Henkel KGaA, Industrial Adhesives, President and Chief Executive Officer of Teroson GmbH (Germany) and Chairman and Chief Executive Officer of SAIM SA (France). Mr. Deschamps was contracted as a consultant from September 2011 to November 2011 and employed from November 2011 to February 2012, in each case by Arcapita. Mr. Deschamps brings a broad range of industrial and global experience both as a former chief executive officer and investment partner of leading private equity firms and industrial global leaders, which led to the conclusion that he should serve as a director of the Company.
Jason Clarke—Director. Jason Clarke has been a Director of the Klöckner Pentaplast Group since May 2013. Upon the completion of this offering, Dr. Clarke will serve as a Director of the Company. Dr. Clarke is a Managing Director at Strategic Value Partners (UK) LLP, where he has been employed since 2004. From 1999 to 2004, Dr. Clarke was an Assistant Director at Close Brothers, a U.K. advisory firm. From 1995 to 1999, Dr. Clarke qualified as an accountant (ACA) with Arthur Andersen in the corporate tax department. Dr. Clarke is on the Board of Directors of Eggborough Holdco 1 S.a.r.l., Jeyes Holdings Ltd. and on the Supervisory Board of Pfleiderer Group SA. Dr. Clarke’s extensive financial and business experience qualify him to fulfill his role as a member of the Board of Directors.
Florian Kawohl—Director. Florian Kawohl has been a Director of the Klöckner Pentaplast Group since March 2013. Upon the completion of this offering, Mr. Kawohl will serve as a Director of the Company. Since 2005, Mr. Kawohl has been employed at Strategic Value Partners (Deutschland) GmbH, where he currently serves as Managing Director and as a senior member of the European investment team with a focus on building products, media and industrials. From 2003 to 2005, Mr. Kawohl was an Associate Director of The Carlyle Group in Munich, Germany in the European Buyout team. Prior to that, Mr. Kawohl was a Principal at Earlybird Venture Capital in Hamburg, Germany, a venture capital fund focused on technology and bio-tech, and a Senior Associate at McKinsey & Co. Mr. Kawohl brings to our board extensive experience on boards of private equity owned companies since 2000, which led to the conclusion that he should serve as a director of the Company.
102
Table of Contents
Alexis Pourchet—Director. Alexis Pourchet has been a Director of the Klöckner Pentaplast Group since March 2013. Upon the completion of this offering, Mr. Pourchet will serve as a Director of the Company. Mr. Pourchet is a Director and Operating Partner at Strategic Value Partners, LLC, where he has been employed since 2012. He has been a Director of Jeyes Holdings Ltd since May 2014 and previously held the same position from May 2012 to April 2013. Prior to joining Strategic Value Partners, LLC, Mr. Pourchet served as a restructuring specialist for Alvarez & Marsal from 2006 to 2012, most recently as a Senior Director in London, involved in operational and financial restructuring mandates. Mr. Pourchet also served as interim Chief Financial Officer of Diam Group from 2009 to 2010. Prior to that, Mr. Pourchet was an Associate with Deutsche Bank Inc.’s mergers and acquisitions practice in New York. Mr. Pourchet’s experience in our industry and collective board experience, financial experience, and diverse personal background led to the conclusion that he should serve as a director of the Company.
Controlled Company
Upon completion of this offering, SVPGlobal will continue to control a majority of the voting power of our outstanding common stock. As a result, we will be a “controlled company” under New York Stock Exchange corporate governance standards. As a controlled company, exemptions under the standards will free us from the obligation to comply with certain corporate governance requirements, including the requirements:
| • | that a majority of our Board of Directors consists of “independent directors,” as defined under the rules of the New York Stock Exchange; |
| • | that we have, to the extent applicable, a corporate governance and nominating committee that is composed entirely of independent directors with a written charter addressing the committee’s purpose and responsibilities; |
| • | that we have a compensation committee that is composed entirely of independent directors with a written charter addressing the committee’s purpose and responsibilities; and |
| • | for an annual performance evaluation of the nominating and governance committees and compensation committee. |
Since we intend to avail ourselves of the “controlled company” exception under New York Stock Exchange rules, our Nominating and Corporate Governance Committee and our Compensation Committee will not be composed entirely of independent directors. These exemptions do not modify the independence requirements for our Audit Committee, and we intend to comply with the requirements of Rule 10A-3 of the Exchange Act and the rules of the New York Stock Exchange within the applicable time frame. These rules require that our Audit Committee be composed of at least three members, a majority of whom will be independent within 90 days of the date of this prospectus, and all of whom will be independent within one year of the date of this prospectus.
Board Committees
Upon completion of this offering, our Board of Directors will have three standing committees: an Audit Committee, a Compensation Committee and a Nominating and Corporate Governance Committee. Each of the committees will report to the Board of Directors as they deem appropriate, and as the Board of Directors may request. The expected composition, duties and responsibilities of these committees are set forth below. In the future, our Board of Directors may establish other committees, as it deems appropriate, to assist it with its responsibilities.
Audit Committee
The Audit Committee is responsible for, among other matters: (1) appointing, compensating, retaining, evaluating, terminating and overseeing our independent registered public accounting firm; (2) discussing with
103
Table of Contents
our independent registered public accounting firm their independence from management; (3) reviewing with our independent registered public accounting firm the scope and results of their audit; (4) approving all audit and permissible non-audit services to be performed by our independent registered public accounting firm; (5) overseeing the financial reporting process and discussing with management and our independent registered public accounting firm the interim and annual consolidated financial statements that we file with the SEC; (6) reviewing and monitoring our accounting principles, accounting policies, financial and accounting controls and compliance with legal and regulatory requirements; (7) establishing procedures for the confidential anonymous submission of concerns regarding questionable accounting, internal controls or auditing matters; and (8) reviewing and approving related person transactions.
Upon completion of this offering, our Audit Committee will consist of , and . The SEC rules and the New York Stock Exchange rules require us to have one independent Audit Committee member upon the listing of our common stock on New York Stock Exchange, a majority of independent directors on the Audit Committee within 90 days of the date of the completion of this offering and all independent Audit Committee members within one year of the date of the completion of this offering. Our Board of Directors has affirmatively determined that and meet the definition of “independent directors” for purposes of serving on an Audit Committee under applicable SEC and New York Stock Exchange rules, and we intend to comply with these independence requirements within the time periods specified. In addition, will qualify as our “audit committee financial expert,” as such term is defined in Item 407 of Regulation S-K.
Our Board of Directors will adopt a new written charter for the Audit Committee, which will be available on our corporate website at www.kpfilms.com upon the completion of this offering. Our website is not part of this prospectus.
Compensation Committee
The Compensation Committee will be responsible for, among other matters: (1) reviewing key employee compensation goals, policies, plans and programs; (2) reviewing and approving the compensation of our directors, chief executive officer and other executive officers; (3) reviewing and approving employment agreements and other similar arrangements between us and our executive officers; and (4) administering our stock plans and other incentive compensation plans.
Upon completion of this offering, our Compensation Committee will consist of and .
Our Board of Directors will adopt a new written charter for the Compensation Committee, which will be available on our corporate website at www.kpfilms.com upon the completion of this offering. The information contained on our website does not constitute a part of this prospectus.
Nominating and Corporate Governance Committee
The Nominating and Corporate Governance Committee will be responsible for developing and recommending to the Board of Directors criteria for identifying and evaluating candidates for directorships and making recommendations to the Board of Directors regarding candidates for election or reelection to the Board of Directors at each annual stockholders’ meeting. In addition, the Nominating and Corporate Governance Committee will be responsible for overseeing our corporate governance guidelines and reporting and making recommendations to the board of directors concerning corporate governance matters. The Nominating and Corporate Governance Committee will be also responsible for making recommendations to the Board of Directors concerning the structure, composition and function of the Board of Directors and its committees. Upon completion of this offering, our Nominating and Corporate Governance Committee will consist of , and .
Our Board of Directors will adopt a new written charter for the Nominating and Corporate Governance Committee, which will be available on our corporate website at www.kpfilms.com upon the completion of this offering. The information contained on our website does not constitute a part of this prospectus.
104
Table of Contents
Risk Oversight
Our Board of Directors is currently responsible for overseeing our risk management process. The Board of Directors focuses on our general risk management strategy and the most significant risks facing us, and ensures that appropriate risk mitigation strategies are implemented by management. The Board of Directors is also apprised of particular risk management matters in connection with its general oversight and approval of corporate matters and significant transactions.
Following the completion of this offering, our Board of Directors will delegate to the Audit Committee oversight of our risk management process. Our other board committees will also consider and address risk as they perform their respective committee responsibilities. All committees will report to the full Board of Directors as appropriate, including when a matter rises to the level of a material or enterprise level risk.
Our management is responsible for day-to-day risk management. This oversight includes identifying, evaluating, and addressing potential risks that may exist at the enterprise, strategic, financial, operational, compliance and reporting levels.
Compensation Committee Interlocks and Insider Participation
None of our executive officers currently serves, or in the past year has served, as a member of the board of directors or compensation committee of any entity that has one or more executive officers serving on our Board of Directors or Compensation Committee.
Code of Ethics
We have adopted a written Code of Business Conduct and Ethics (“Code of Business Conduct”) which applies to all of our directors, officers and other employees, including our principal executive officer, principal financial officer and controller. In addition, we have adopted a written Code of Ethics for the Chief Executive Officer and Senior Financial Officers (“Code of Ethics”) which applies to our principal executive officer, principal financial officer, controller and other designated members of our management. Copies of each code will be available on our corporate website at www.kpfilms.com upon completion of this offering. The information contained on our website does not constitute a part of this prospectus. We will provide any person, without charge, upon request, a copy of our Code of Business Conduct or Code of Ethics. Such requests should be made in writing to the attention of our at the following address: .
105
Table of Contents
Compensation Discussion and Analysis
The purpose of this compensation discussion and analysis section is to provide information about the material elements of compensation that are paid to, awarded to, or earned by, our “named executive officers,” who are our most highly compensated executive officers. For fiscal 2016, our named executive officers, were:
| • | Wayne M. Hewett, Chief Executive Officer; |
| • | R. Brent Jones, Chief Financial Officer (1); |
| • | Markus Hölzl, Former Chief Financial Officer (2); |
| • | Richard J. Widden, Chief Commercial Officer (3); |
| • | Marc Setzen, Chief Engineering Officer; |
| • | Peter Heinze, Chief Operating Officer (4); and |
| • | Stefan Brandt, Former Chief Operating Officer (5). |
| (1) | Mr. Jones was hired on April 4, 2016. |
| (2) | Mr. Hölzl was our Chief Financial Officer until April 4, 2016 and will perform advisory services until April 4, 2017. From April 4, 2017 until September 30, 2017, Mr. Hölzl will, upon request of the Company, be available for relevant queries and questions relevant to his expertise as the former Chief Financial Officer. |
| (3) | Mr. Widden was hired on February 22, 2016. |
| (4) | Mr. Heinze was hired on April 4, 2016. |
| (5) | Mr. Brandt went on garden leave on October 27, 2015. His employment (and the garden leave period) terminated on October 31, 2016 after the Company consented to Mr. Brandt’s acceptance and commencement of a position with a new company. |
Compensation Decisions and Process
Our compensation approach is necessarily tied to our stage of development. Prior to this offering, our compensation decisions for executive officers were made by the Remuneration Committee of Klöckner Pentaplast Group (our “Remuneration Committee”) in consultation with our Chief Executive Officer. The Remuneration Committee would, following such consultation and discussion with our Chief Executive Officer, consider and, as applicable, approve the compensation arrangements of our named executive officers other than our Chief Executive Officer, whose compensation arrangements were considered and, as applicable, approved outside the presence of our Chief Executive Officer. Going forward, we expect this process to continue. Under the direction of a newly formed Compensation Committee, as discussed below, we have engaged compensation consultants and will continue to do so to assist us in this process. As we mature as a public company, we expect that our executive compensation programs will evolve and, accordingly, the compensation decisions and processes described herein with respect to fiscal 2016 may not necessarily reflect the approach we will take with respect to our executive compensation decisions and processes moving forward, and, similarly, the resulting compensation pay practices may not correspond to our past practices and arrangements set forth below.
Compensation Philosophy and Objectives
Prior to this offering, we have focused our executive compensation arrangements on balancing short-term and long-term payment arrangements, as well as fixed and contingent payment arrangements, in ways that we believe are most appropriate to motivate our named executive officers. Our executive compensation arrangements are designed to:
| • | attract and retain talented and experienced executives; |
106
Table of Contents
| • | reward executives whose knowledge, skills and performance are critical to our success; |
| • | align the interests of our executive officers and stockholders by motivating executive officers to increase stockholder value and rewarding executive officers when stockholder value increases; |
| • | ensure fairness among the executive management team by recognizing the contributions each executive makes to our success; |
| • | foster a shared commitment among executives by aligning their individual goals with the goals of the executive management team and our Company; and |
| • | compensate our executives in a manner that incentivizes them to manage our business to meet our long-range objectives. |
Currently, our executive compensation program rewards team accomplishments while promoting individual accountability and depends on Company results as well as business unit results and individual accomplishments. A portion of total compensation is placed at risk through annual performance bonuses, while other portions are paid through our long-term cash programs, equity and equity-based incentive programs. The combination of incentives is designed to balance annual operating objectives and Company earnings performance with longer-term stockholder value creation. We also seek to retain our executives by providing competitive compensation that is commensurate with performance. We generally target base compensation at a competitive range to market and calibrate incentive opportunities to generate above market cash compensation when goals are exceeded. Moreover, we seek to promote a long-term commitment to the Company by our executives, as we believe that there is great value to the Company in having a team of long-tenured, seasoned managers. Our team-focused culture and management processes are designed to foster this commitment.
Compensation Consultant
In preparation for becoming a public company, and in order to ensure that we continue to remunerate our executives appropriately, the Company retained Willis Towers Watson to review our executive compensation practices and, as necessary, assist us in tailoring our practices to our goals. With Willis Towers Watson’s assistance, the Remuneration Committee is continuing to review the compensation of our named executive officers and we expect that following this review, the specific direction, emphasis and components of our executive compensation program will change to more closely align our named executives’ compensation with market practices, our compensation philosophy and our performance as a Company. For example, over time we may reduce our reliance upon subjective determinations made by our Chief Executive Officer and/or the Remuneration Committee in favor of a more empirical approach that involves relying more heavily on benchmarking against peer companies. Accordingly, the compensation paid to our named executive officers for fiscal year 2016 is not necessarily indicative of how we will compensate our named executive officers after this offering.
The Remuneration Committee retains the right to modify or terminate its relationship with Willis Towers Watson or select other outside advisors to assist the Remuneration Committee in carrying out its responsibilities.
Elements of Compensation
Our current executive compensation program consists of the following components:
| • | base salary; |
| • | annual cash plans linked to our overall performance, including EBITDA; |
| • | grants of long-term equity and equity-based compensation; |
| • | certain additional executive benefits and perquisites; and |
| • | employment agreements, which contain termination benefits. |
107
Table of Contents
We combine these elements in order to formulate compensation packages that provide competitive pay, reward the achievement of financial, operational and strategic objectives and align the interests of our executive officers and other senior personnel with those of our stockholders. We utilize the particular elements of compensation described above because we believe that it provides a well-proportioned mix of secure compensation, retention value and at-risk compensation which produces short-term and long-term performance incentives and rewards. Each component of our executive compensation program is further described below.
Base Salary
The primary component of compensation of our named executive officers has historically been base salary, which is intended to reflect each individual’s responsibilities, experience, prior performance and other discretionary factors deemed relevant by our Chief Executive Officer or, with respect to our Chief Executive Officer, the Remuneration Committee. The Remuneration Committee and our Chief Executive Officer work together to determine market level base compensation for similarly situated executives in other companies of similar size in the plastic packaging industry. Base salaries are reviewed annually and may be adjusted from time to time based on the results of this review. In past years, our Chief Executive Officer and the Remuneration Committee reviewed the performance of all named executive officers, and, based on this review and any relevant informal competitive market data made available to him or them during the past year, set the executive compensation package for each named executive officer for the coming year. Upon the completion of this offering, the Remuneration Committee will take a more significant role in this annual review and decision-making process.
The base salaries paid to our named executive officers in fiscal 2016 are set forth in the Summary Compensation Table below.
Annual Cash Bonus Plans
Our annual cash bonuses are intended to offer incentive compensation by rewarding the achievement of corporate and individual performance objectives. On an annual basis (or at the commencement of a named executive officer’s employment with us), our Chief Executive Officer and the Remuneration Committee typically sets a target level of bonus compensation that is structured as a percentage of such named executive officer’s annual base salary. Depending upon corporate and individual performance, a named executive officer may receive between 0% and 200% of his target bonus amount. The various corporate and individual performance objectives considered by our Chief Executive Officer and Remuneration Committee when making our executive officers’ annual cash bonus determinations are different for each individual, depending upon that officer’s duties and areas of responsibility. In making bonus determinations, our Chief Executive Officer and Remuneration Committee consider general performance metrics, such as EBITDA, and individual targets that he or they believe most appropriately reflect such named executive officer’s impact on our overall corporate performance. These corporate and individual performance objectives are designed to be challenging but achievable.
For fiscal year 2016, Messrs. Hewett, Jones, Hölzl, Widden, Setzen, Heinze and Brandt were eligible to receive annual cash bonuses up to 100%, 90%, 100%, 90%, 100%, 90% and 100%, respectively, at 100% target achievement, of their fiscal year 2016 base salaries. For fiscal year 2016, Messrs. Hewett, Jones, Widden and Heinze’s were paid on EBITDA achievement with a guaranteed of 100%. Their bonus payout was calculated prorated to their start date. The payout amounts were $975,000, $211,000, $218,307 and $153,104, respectively.
For fiscal year 2016, Messrs, Hölzl, Setzen and Brandt’s bonuses were paid on EBITDA, cash flow and sales growth metrics, which resulted in a 60% funding. Their bonus payout amounts were $299,534, $232,974 and $299,534, respectively. In fiscal year 2016, Mr. Hewett received a retention bonus of $750,000 pursuant to his employment agreement.
108
Table of Contents
Long-Term Equity, Equity-Based and Other Compensation
We believe that equity and equity-based compensation is an important component of our executive compensation program and that providing a significant portion of our executive officers’ total compensation package in equity-based compensation balances the total compensation package, engages our executives in the Company and aligns the incentives of our executives with the interests of our stockholders and with our long-term corporate success. We also believe that equity-based compensation awards enable us to attract, motivate, retain and adequately compensate executive talent.
As such, Messrs. Hewett, Jones, Widden and Heinze hold shares in Kleopatra Holdings 1 (the “C Shares”) that generally time-vest on a pro rata, monthly basis, beginning on the first anniversary of the grant date and lasting until the fifth anniversary of the grant date, at which point the awards will be fully vested. The primary purposes of the C Shares, which are generally granted to our U.S. named executive officers upon joining the Company, are to retain our named executive officers while also encouraging them to drive stockholder value. Our named executive officers’ respective C Share holdings are set forth below in the “Outstanding Equity Awards at 2016 Fiscal Year End” table; provided, that upon the consummation of this offering, such C Shares will be converted to awards under the 2017 Equity Plan (defined below) with substantially similar vesting terms.
In addition, Messrs. Hölzl, Setzen and Brandt have been granted awards in our value creation participation plan (the “Value Creation Participation Plan”).
2017 Equity Incentive Plan
Prior to the completion of this offering, we plan to implement the Klöckner Pentaplast 2017 Omnibus Incentive Plan (the “2017 Equity Plan”). Our 2017 Equity Plan will allow for the grant of equity incentives, such as grants of stock options, restricted stock, restricted stock units and stock appreciation rights, other stock-based awards and other cash-based awards. Directors, officers and other employees of our Company, as well as others performing consulting or advisory services for us, are eligible for grants under the 2017 Equity Plan.
Other Executive Benefits and Perquisites
We provide the following benefits to our executive officers on the same basis as other eligible employees:
| • | health insurance; |
| • | vacation, personal holidays and sick days; |
| • | life insurance and supplemental life insurance; |
| • | short-term and long-term disability; |
| • | for German executives only, Company contributions to certain pension plans; |
| • | for U.S. executives only, a 401(k) plan with matching contributions; and |
| • | U.S. Profit Share Plan. |
We believe these benefits are generally consistent with those offered by other companies and specifically with those companies with which we compete for employees.
Employment Agreements and Severance and Change of Control Benefits
We recognize that the possibility of a change in control could arise and that such a possibility could result in the departure or distraction of members of the management team to the detriment of the Company and our shareholders. Therefore, we have entered into employment agreements with the named executive officers in order to minimize employment security concerns arising in the course of negotiating and completing a significant
109
Table of Contents
transaction. The benefits provided under these agreements, which are generally payable only if the named executive officer is terminated by the Company without cause or the executive resigns for good reason, are enumerated and quantified in the section below entitled, “Executive Compensation—Employment Agreements.”
Section 162(m) Compliance
Section 162(m) of the Internal Revenue Code (“Section 162(m)”) limits us to a deduction for federal income tax purposes of no more than $1 million of compensation paid to certain executive officers in a taxable year. Compensation above $1 million may be deducted if it is “performance-based compensation” within the meaning of the Internal Revenue Code. Following this offering, our Remuneration Committee will consider the effects of Section 162(m) in its decisions as to how to structure our compensation arrangements, provided that it will also consider additional elements of the cost to us of providing such compensation. The Remuneration Committee believes that the potential deductibility of the compensation payable under those plans and arrangements should be only one of a number of relevant factors taken into consideration, and not the sole governing factor. As a result, the Remuneration Committee reserves the discretion to approve compensation arrangements that may not be tax deductible for us, such as base salary, cash incentive awards tied to our financial performances or equity incentive awards with time-based vesting requirements, or which do not comply with an exemption from the deductibility limit when it believes that such arrangements are appropriate to attract and retain executive talent.
Section 409A Considerations
Another section of the Internal Revenue Code, Section 409A (“Section 409A”), affects the manner by which “non-qualified deferred compensation” opportunities are offered to our employees by requiring such amounts be structured in a manner that limits employees’ abilities to accelerate or further defer the time of payment beyond the schedule set forth in the initial agreement. We intend to operate our existing compensation arrangements that are covered by Section 409A in accordance with the applicable rules thereunder, and we will continue to review and amend our compensation arrangements where necessary to comply with Section 409A.
Stockholder Say-on-Pay Votes
Section 951 of the Dodd-Frank Wall Street Reform and Consumer Protection Act of 2010 (“Dodd-Frank Act”) requires publicly traded companies to give their stockholders a non-binding vote on executive compensation and “golden parachute” compensation arrangements (“say-on-pay”). As such, following this offering we will begin providing our stockholders the opportunity to vote on our executive compensation pay program as well as an opportunity to vote on how often we will conduct such a vote, in each case, in accordance with applicable law. We will report the results of the say-on-pay vote and how frequently we will conduct such a vote by filing an amendment to our prior Form 8-K filing under Item 5.07. For the avoidance of doubt, as a private company during the last fiscal year, we did not hold a say-on-pay vote for our stockholders.
Compensation Recovery Policy
Pursuant to the proposed rules under Section 954 of the Dodd-Frank Act, the Company intends to adopt a general compensation recovery (or “clawback”) policy for certain incentive arrangements paid to our executive officers and certain other executives.
Anti-Hedging Policy
Pursuant to the proposed rules under Section 955 of the Dodd-Frank Act, and following the Company’s initial public offering, the Company will meet to determine the Company’s policy toward employees or members of the board acquiring, selling, or trading our securities in order to hedge or offset any decrease in the market value of equity securities granted to such employee or board member as compensation, or held directly or indirectly by such persons.
110
Table of Contents
2016 Summary Compensation Table
The following table sets forth certain information with respect to compensation for the year ended September 30, 2016 earned by, awarded to or paid to our named executive officers.
| Name and Principal Position (1) |
Year | Salary ($) |
Bonus ($)(2) |
Stock Awards ($)(3) |
Non-Equity Incentive Plan Compensation ($)(4) |
Change in Pension Value and Nonqualified Deferred Compensation Earnings ($) |
All Other Compensation ($)(5) |
Total | ||||||||||||||||||||||||
| Wayne M. Hewett Chief Executive Officer |
2016 | 900,000 | 750,000 | 475,468 | 993,458 | — | 66,920 | |
3,185,846 |
| ||||||||||||||||||||||
| R. Brent Jones Chief Financial Officer |
2016 | 234,453 | — | 78,527 | 211,534 | — | 28,462 | 552,976 | ||||||||||||||||||||||||
| Markus Hölzl Former Chief Financial Officer |
2016 | 502,245 | — | — | 299,534 | — | 146,263 | |
948,042 |
| ||||||||||||||||||||||
| Richard J. Widden Chief Commercial Officer |
2016 | 242,564 | — | 39,263 | 218,308 | — | 20,033 | 520,168 | ||||||||||||||||||||||||
| Marc Setzen Chief Engineering Officer |
2016 | 390,639 | — | — | 232,974 | 12,188 | 100,559 | 736,360 | ||||||||||||||||||||||||
| Peter Heinze Chief Operating Officer |
2016 | 170,116 | 39,064 | 39,263 | 153,104 | — | 86,595 | 448,142 | ||||||||||||||||||||||||
| Stefan Brandt Former Chief Operating Officer |
2016 | 502,245 | — | — | 299,534 | 14,317 | 169,334 | 985,430 | ||||||||||||||||||||||||
| (1) | Messrs. Hölzl, Setzen, Heinze, and Brandt were paid in Euros during fiscal year 2016. Their compensation above has been converted into USD based on an exchange rate of 1.11610, which was the rate in effect on September 30, 2016, the final day of our fiscal year. |
| (2) | Mr. Hewett’s bonus of $750,000 was a retention bonus earned pursuant to his employment agreement. Mr. Heinze’s bonus of $39,064 was a sign-on bonus earned upon his hire to the Company. |
| (3) | The amounts reported in this column reflect the aggregate dollar amounts recognized for incentive shares for financial statement reporting purposes for fiscal year 2016 (disregarding any estimate of forfeitures related to service-based vesting conditions) in accordance with FASB ASC 718. Messrs. Hewett, Jones, Widden, and Heinze were granted C Shares in fiscal year 2016. |
| (4) | The amounts in this column include non-equity incentive compensation pursuant to our annual cash bonus plans. Mr. Hewett’s annual bonus of $975,000 was calculated based on 13 months because he did not receive a pro-rated bonus for fiscal year 2015. Mr. Hewett also received a discretionary bonus of $18,458. |
| (5) | This column includes 401(k) Plan contributions for our American named executive officers, Company contributions to the pension plans of our German named executive officers, C Shares or VCPP Plan dividends, term life insurance, long-term care insurance and other personal benefits. The amounts included in that column include the following: |
| Name |
401(k)/Pension Match ($) |
C Shares/VCPP Plan Dividend ($) |
Automobile Allowance ($) |
Other Personal Benefits (a) ($) |
||||||||||||
| Wayne M. Hewett |
11,888 | 51,035 | — | 3,997 | ||||||||||||
| R. Brent Jones |
2,945 | 25,517 | — | — | ||||||||||||
| Markus Hölzl |
9,260 | 117,905 | 19,098 | — | ||||||||||||
| Richard J. Widden |
7,276 | 12,757 | — | — | ||||||||||||
| Marc Setzen |
9,487 | 77,156 | 13,916 | — | ||||||||||||
| Peter Heinze |
13,420 | 12,890 | 4,480 | 55,805 | ||||||||||||
| Stefan Brandt |
9,487 | 117,906 | 26,786 | 15,155 | ||||||||||||
| (a) | Other personal benefits include: $3,997 in cash benefits for Mr. Hewett; a school allowance of $55,805 for Mr. Heinze; and housing benefits of $3,155 and $12,000 for the Leadership at the Peak Training at the Center for Creative Leadership for Mr. Brandt. |
111
Table of Contents
2016 Grants of Plan-Based Awards
The following table sets forth certain information with respect to grants of plan-based awards for the year ended September 30, 2016 with respect to our named executive officers.
| Estimated Future Payouts Under Non-Equity Incentive Plan Awards |
All Other Stock Awards: Number of Shares of Stock or Units (#) |
Grant Date Fair Value of Stock Awards ($)(2) |
||||||||||||||||||||||
| Name (1) |
Grant Date |
Threshold ($) |
Target ($) |
Maximum ($) |
||||||||||||||||||||
| Wayne M. Hewett |
2/9/16 | 0 | 900,000 | 1,800,000 | 87,406 | 3,566,008 | ||||||||||||||||||
| R. Brent Jones |
7/26/16 | 0 | 427,500 | 855,000 | 38,835 | 2,355,821 | ||||||||||||||||||
| Markus Hölzl |
— | — | — | — | — | — | ||||||||||||||||||
| Richard J. Widden |
7/26/16 | 0 | 360,000 | 720,000 | 19,417 | 1,177,877 | ||||||||||||||||||
| Marc Setzen |
— | 0 | 390,635 | 781,270 | — | — | ||||||||||||||||||
| Peter Heinze |
7/26/16 | 0 | 311,392 | 622,784 | 19,417 | 1,177,877 | ||||||||||||||||||
| Stefan Brandt |
— | — | — | — | — | — | ||||||||||||||||||
| (1) | Messrs. Hewett, Jones, Widden and Heinze were granted C Shares when they were hired by the Company. |
| (2) | Represents FASB ASC 718 grant date fair value of awards of C Shares. |
Outstanding Equity Awards at 2016 Fiscal Year End
The following table sets forth certain information with respect to outstanding equity awards of our named executive officers as of September 30, 2016. The market value of the shares in the following table is the fair value of such shares at July 29, 2016. As a private company, we did not perform a separate valuation at September 30, 2016.
| Stock Awards | ||||||||
| Name |
Number of Shares or Units of Stock That Have Not Vested (#) |
Market Value of Shares or Units of Stock That Have Not Vested ($) (1) |
||||||
| Wayne M. Hewett |
85,585 | 5,121,343 | ||||||
| R. Brent Jones |
38,835 | 2,355,821 | ||||||
| Richard J. Widden |
19,417 | 1,177,877 | ||||||
| Peter Heinze |
19,417 | 1,177,877 | ||||||
| (1) | Market value of unvested C Shares is based on management’s retrospective determination of the fair market value of such C Shares as of July 29, 2016. |
Stock Vested
In fiscal year 2016, 2% of Mr. Hewett’s C Shares vested. Mr. Hewett’s vesting commencement date was August 31, 2015. Accordingly, his C Shares vested for one month of fiscal year 2016.
112
Table of Contents
Pension Benefits
Our named executive officers in the United States did not participate in or have account balances in qualified or nonqualified defined benefit plans sponsored by us. Our Board of Directors or Remuneration Committee may elect to adopt qualified or nonqualified benefit plans in the future if it determines that doing so is in our best interest. Messrs. Hölzl, Setzen and Brandt, however, do participate in the Company pension plan, and their respective participation levels for fiscal year 2016 are set forth below.
| Name |
Plan Name |
Number of Years Credited Service (#) |
Present Value of Accumulated Benefit ($) |
Payments During Last Fiscal Year ($) |
||||||
| Markus Hölzl |
Höchster Pensionskasse (Penka II) | — | — | 9,260 | (1) | |||||
| Marc Setzen |
Höchster Pensionskasse (Penka II) | 5 | 29,811 | 9,487 | ||||||
| Stefan Brandt |
Höchster Pensionskasse (Penka II) | 5 | 24,213 | 9,487 | ||||||
| (1) | Mr. Hölzl’s pension was paid as a lump sum into a third party pension plan. |
Nonqualified Deferred Compensation
Our named executive officers did not participate in or have account balances in nonqualified defined contribution plans or other nonqualified deferred compensation plans maintained by us. Our Board or Remuneration Committee may elect to provide our named executive officers and other employees with nonqualified defined contribution or other nonqualified deferred compensation benefits in the future if it determines that doing so is in our best interest.
Employment Agreements
We have employment agreements with each of our currently tenured named executive officers, in each case, as described below.
Wayne M. Hewett, Chief Executive Officer
Klöckner Pentaplast of America, Inc., the wholly-owned U.S. subsidiary of the Company, entered into an employment agreement with Mr. Hewett on August 19, 2015, with a hire date of August 31, 2015, and amended on April 20, 2016, in connection with Mr. Hewett’s assumption of the role of Chief Executive Officer on August 31, 2015. The employment agreement is effective for an initial period of two years and is automatically renewed for one year periods on each anniversary of the effective date unless either party elects not to extend the agreement by providing adequate written notice prior to each successive anniversary date. If we decide not to extend the agreement, terminate Mr. Hewett without cause, or if Mr. Hewett terminates his employment for good reason, we will pay Mr. Hewett 100% of his annual bonus (based on the attainment of applicable performance goals), base salary for the remainder of the applicable period, and COBRA benefits for six months, subject to his execution of a general release and compliance with the restrictive covenants and cooperation provisions in his employment agreement.
In the event of an IPO (or for other reasons, as explained below), Mr. Hewett will be entitled to a Transaction Award and a Long Term Incentive Award (each defined below). The Company will grant Mr. Hewett a restricted stock award of 200% of his salary on an IPO of the Company or on a sale of the Company (“Transaction Award”). Mr. Hewett will also be granted a restricted stock unit award (“RSU”) of 150% of his salary and a performance stock award (“PSU”) of 300% of his salary (together, the “Long Term Incentive Award”) immediately upon an IPO. Pursuant to Mr. Hewett’s employment agreement, his base salary is $900,000 and he is eligible for bonus payments of up to 200% of his base salary.
R. Brent Jones, Chief Financial Officer
R. Brent Jones also entered into an offer of employment with Klöckner Pentaplast of America, Inc. on March 19, 2016, with a hire date of April 4, 2016, pursuant to which his employment with the Company will
113
Table of Contents
continue until it is terminated by either party giving to the other at least 90 days’ prior written notice. Mr. Jones is eligible for a one-time bonus equal to the sum of his annual salary and his target bonus if there is a change of control or an IPO within one year of the start of his employment. If Mr. Jones is terminated without cause, we will pay him nine months’ base salary and COBRA benefits, subject to his execution of a general release and compliance with the Confidential Technical and Business Protection Employment Agreement and Non-Competition Covenant. Mr. Jones is eligible for a target bonus of 90% of his annual salary. Mr. Jones’ annual salary is $475,000.
Richard J. Widden, Chief Commercial Officer
Richard Widden entered into an offer of employment with Klöckner Pentaplast on February 12, 2016, with a hire date of February 22, 2016, pursuant to which his employment with the Company will continue until it is terminated by either party giving to the other at least 90 days’ prior written notice. If Mr. Widden is terminated without cause, we will pay him nine months’ base salary and COBRA benefits, subject to his execution of a general release and compliance with the Confidential Technical and Business Protection Employment Agreement and Non-Competition Covenant. Mr. Widden is eligible for a target bonus of 90% of his annual salary. Mr. Widden’s annual salary is $400,000.
Marc Setzen, Chief Engineer Officer
Marc Setzen entered into a service agreement with Klöckner Pentaplast GmbH & Co. KG on May 12, 2014, pursuant to which his employment with the Company will continue until March 31, 2018, unless the parties agree to extend the agreement. Pursuant to an amendment to his service agreement, Mr. Setzen is eligible for a one-time payment of €350,000 if there is a change of control or IPO before April 4, 2017. If Mr. Setzen is terminated without good cause prior to the end of the contract, we will pay him base salary continuation until the end of the contract and any portion of the annual bonus that he is entitled to, based on the Company’s achievement of predetermined goals. Mr. Setzen is eligible for a target bonus of 100% of his annual salary. Mr. Setzen’s annual salary is €350,000.
Peter Heinze, Chief Operating Officer
Peter Heinze entered into a service agreement with Klöckner Pentaplast GmbH & Co. KG on March 15, 2016, with a hire date of April 4, 2016, pursuant to which his employment with the Company will continue until April 3, 2019, and will be automatically extended for one year if it is not terminated by either party at least six months prior to April 3, 2019. If Mr. Heinze is terminated without good cause prior to the end of the contract, we will pay him base salary continuation until the end of the contract. Mr. Heinze was guaranteed a pro rata bonus through September 30, 2016, and is eligible for a target bonus of 90% of his annual salary. Mr. Heinze’s annual salary is €310,000, and he is entitled to reimbursement for up to €50,000 per year spent on international school for his children.
Markus Hölzl, Former Chief Financial Officer
Pursuant to an amendment to his employment agreement dated April 1, 2016, Mr. Hölzl resigned as the Chief Financial Officer, effective April 4, 2016. Mr. Hölzl is entitled to receive his annual base salary of €450,000 and his target bonus of 100% of his annual salary until March 31, 2018.
Stefan Brandt, Former Chief Operating Officer
Pursuant to an amendment to his employment agreement dated October 15, 2015, Mr. Brandt resigned as the Chief Operating Officer of the Company, effective October 27, 2015. Mr. Brandt was entitled to receive his annual base salary of €450,000, annual pension contribution, and his target bonus of 100% of his annual salary until October 31, 2016.
114
Table of Contents
Non-Competition and Non-Solicitation
Pursuant to the restrictive covenants contained in their employment agreements, equity award agreements, and/or the Confidential Technical and Business Protection Employment Agreement and Non-Competition Covenant (“Restrictive Covenant Agreement”), each named executive officer has agreed not to disclose confidential information of the Company. In addition, Mr. Hewett is subject to 12-month post-termination non-competition and non-solicitation restrictive covenants, which are included in his employment agreement. Messrs. Jones and Widden are party to the Restrictive Covenant Agreement, which provides for nine month post-termination non-competition and non-solicitation restrictive covenants. Messrs. Setzen and Heinze are subject to 24- and 12-month post-termination non-competition and non-solicitation restrictive covenants, respectively. For Messrs. Setzen and Heinze, we will continue to pay their base salary for the duration of the respective non-competition and non-solicitation periods; provided, that if we choose to waive the non-competition provision, we will pay their base salary for six months following such waiver.
Potential Payments Upon Termination Without Cause or for Good Reason
The following table sets forth quantitative estimates of the benefits that would have accrued to each of our named executive officers if his employment had been terminated without cause or, if applicable, upon a resignation for good reason on September 30, 2016. Amounts below reflect potential payments pursuant to the amended employment agreements for such named executive officers. For the avoidance of doubt, the benefits below will not be enhanced or otherwise modified in the event of a termination in connection with a change in control.
| Name of Executive Officer |
Cash Severance Benefits ($)(2) |
Continued Health Benefits ($) |
||||||
| Wayne M. Hewett(1) |
1,875,000 | 8,516 | ||||||
| R. Brent Jones |
356,250 | 8,540 | ||||||
| Richard J. Widden |
300,000 | 4,294 | ||||||
| Marc Setzen |
585,953 | — | ||||||
| Peter Heinze |
864,978 | — | ||||||
| (1) | As described above, Mr. Hewett is entitled to his annual base salary and his annual bonus payment. |
| (2) | Amounts for Messrs. Setzen and Heinze have been converted to USD based on an exchange rate of 1.11610, which was the rate on September 30, 2016, the final day of our fiscal year. |
Director Compensation
To date, we have not provided cash compensation to directors for their services as directors or members of committees of the Board of Directors. We have reimbursed and will continue to reimburse our non-employee directors for their reasonable expenses incurred in attending meetings of our Board of Directors and committees of the Board of Directors.
Upon consummation of the initial public offering, each non-employee director will receive an annual cash retainer of $60,000 and an annual grant of restricted stock with a fair market value of $100,000. The chairs of the Audit Committee, Compensation Committee and Nominating and Corporate Governance Committee will each receive a supplemental annual cash retainer of $15,000.
115
Table of Contents
The following table shows information about the beneficial ownership of our common stock, as of , 2016, after giving to our migration and continued existence as a Delaware corporation and our one-for- stock split of our outstanding common stock, by:
| • | each person known by us to beneficially own 5% or more of our outstanding common stock; |
| • | each of our directors and named executive officers; and |
| • | all of our directors and executive officers as a group. |
For further information regarding material transactions between us and certain of our stockholders, see “Certain Relationships and Related Party Transactions.”
The numbers listed below are based on shares of our common stock outstanding as of , 2016.
Upon the completion of this offering, Kleopatra Holdings 1, which will be controlled by SVPGlobal, will own approximately % of our common stock, assuming that the underwriters do not exercise their option to buy additional shares, and % of our common stock, assuming that the underwriters exercise their option to buy additional shares. As a result, we expect to be a “controlled company” within the meaning of the corporate governance rules of the New York Stock Exchange.
| Common stock owned before the offering |
Common stock owned after the offering (no option exercise) |
Common stock owned after the offering (full option exercise) |
||||||||||||||||||||||
| Name and Address of Beneficial Owner (1) |
Number | Percentage | Number | Percentage | Number | Percentage | ||||||||||||||||||
| Principal Stockholder: |
||||||||||||||||||||||||
| Kleopatra Holdings 1 S.C.A. (2) |
||||||||||||||||||||||||
| Executive Officers and Directors: |
||||||||||||||||||||||||
| Wayne M. Hewett |
||||||||||||||||||||||||
| R. Brent Jones |
||||||||||||||||||||||||
| Dr. Markus Hölzl |
||||||||||||||||||||||||
| Richard J. Widden |
||||||||||||||||||||||||
| Peter Heinze |
||||||||||||||||||||||||
| Marc Setzen |
||||||||||||||||||||||||
| Stefan Brandt |
||||||||||||||||||||||||
| Bruno Deschamps |
||||||||||||||||||||||||
| Jason Clarke (3) |
||||||||||||||||||||||||
| Florian Kawohl (4) |
||||||||||||||||||||||||
| Alexis Pourchet (5) |
||||||||||||||||||||||||
| Executive Officers and Directors as a Group (9 persons) |
||||||||||||||||||||||||
| * | Less than 1% |
| (1) | A “beneficial owner” of a security is determined in accordance with Rule 13d-3 under the Exchange Act and generally means any person who, directly or indirectly, through any contract, arrangement, understanding, relationship, or otherwise, has or shares: |
| • | voting power which includes the power to vote, or to direct the voting of, such security; or |
| • | investment power which includes the power to dispose, or to direct the disposition of, such security. |
Unless otherwise indicated, each person named in the table above has sole voting and investment power, or shares voting and investment power with his spouse (as applicable), with respect to all shares of stock listed
116
Table of Contents
as owned by that person. Shares issuable upon the exercise of options exercisable on , 2016 or within 60 days thereafter are considered outstanding and to be beneficially owned by the person holding such options for the purpose of computing such person’s percentage beneficial ownership, but are not deemed outstanding for the purposes of computing the percentage of beneficial ownership of any other person. Unless otherwise indicated, the address of each of our executive officers and directors is c/o Kleopatra Holdings 2 S.C.A., 46A, Avenue J.F. Kennedy, L-1855 Luxembourg.
| (2) | Kleopatra Holdings I S.C.A. is controlled by SVPGlobal, with (i) % of the units held by Brookside S.à r.l. (“Brookside”), (ii) % of the units held by Strategic Value Special Situations Master Fund II, L.P. (SVP II”), (iii) % of the units held by Field Point I-A S.à r.l. (“Field I”), (iv) % of the units held by Field Point IV S.à r.l. (“Field IV”), (v) % of the units held by Field Point V S.à r.l. (“Field V”), (vi) % of the units held by Kings Forest S.à r.l. (“Kings”) and (vii) % of the units held by Yellow Sapphire S.à r.l. (“Yellow” and together with Brookside, SVP II, Field I, Field IV, Field V and Kings, the “SVP Funds”). Strategic SVPGlobal (together with the SVP Funds, the “SVP Entities”) is the investment manager of the SVP Funds and as a result may be deemed to share beneficial ownership of the shares held by each of the SVP Funds. The address of each of the SVP Entities is c/o Strategic Value Partners, LLC, 100 West Putnam Avenue, Greenwich, CT 06830. |
| (3) | Does not include shares of common stock held by the SVP Funds. Mr. Clarke is a Managing Director and Co-Head Europe Corporate Investments at SVPGlobal and as a result of the relationships described in footnote (2) above, may be deemed to share beneficial ownership of the shares held by the SVP Funds. The address for Mr. Clarke is c/o Strategic Value Partners, LLC, 100 West Putnam Avenue, Greenwich, CT 06830. |
| (4) | Does not include shares of common stock held by the SVP Funds. Mr. Kawohl is a Managing Director at SVPGlobal and as a result of the relationships described in footnote (2) above, may be deemed to share beneficial ownership of the shares held by the SVP Funds. The address for Mr. Kawohl is c/o Strategic Value Partners, LLC, 100 West Putnam Avenue, Greenwich, CT 06830. |
| (5) | Does not include shares of common stock held by the SVP Funds. Mr. Pourchet is a Director and Operating Partner at SVPGlobal and as a result of the relationships described in footnote (2) above, may be deemed to share beneficial ownership of the shares held by the SVP Funds. The address for Mr. Pourchet is c/o Strategic Value Partners, LLC, 100 West Putnam Avenue, Greenwich, CT 06830. |
117
Table of Contents
CERTAIN RELATIONSHIPS AND RELATED PARTY TRANSACTIONS
2017 Omnibus Incentive Plan
We intend to adopt the 2017 Incentive Plan effective prior to and in connection with this offering. The plan will provide for grants of stock options, restricted stock and performance awards. Our directors, officers and other employees and persons who engage in services for us are eligible for grants under the plan. The purpose of the plan is to provide these individuals with incentives to maximize stockholder value and otherwise contribute to our success and to enable us to attract, retain and reward the best available persons for positions of responsibility. shares of our common stock will be authorized for issuance under the plan, subject to adjustment in the event of a reorganization, stock split, merger or similar change in our corporate structure or the outstanding shares of common stock. Our Compensation Committee will administer the plan. The Board of Directors also has the authority to administer the plan and to take all actions that our Compensation Committee is otherwise authorized to take under the plan. The terms and conditions of each award made under the plan, including vesting requirements, will be set forth consistent with the plan in a written agreement with the grantee. See “Executive Compensation—2017 Equity Incentive Plan.”
Registration Rights Agreement
Prior to the consummation of this offering, we intend to enter into a registration rights agreement whereby we will grant certain registration rights to SVPGlobal, and its affiliates and certain of their transferees, including the right, under certain circumstances and subject to certain restrictions, to require us to register under the Securities Act our common stock held by them. In addition, we will commit to file as promptly as possible after receiving a request from SVPGlobal, a shelf registration statement registering secondary sales of our common stock held by SVPGlobal. SVPGlobal also will have the ability to exercise certain piggyback registration rights in respect of common stock held by them in connection with registered offerings requested by other registration rights holders or initiated by us. We will be responsible for paying certain expenses in connection with any such registrations.
Cost Allocation Agreement
Effective June 30, 2013, the Company entered into a cost allocation agreement with Kleopatra Holdings 1 relating to management, consulting and professional services. Pursuant to the cost allocation agreement, in fiscal 2016, the Company paid Kleopatra Holdings 1 $0.9 million for management fees, and $1.5 million for administration fees.
Indemnification Agreements
We intend to enter into indemnification agreements with each of our current directors and executive officers. These agreements will require us to indemnify these individuals to the fullest extent permitted under Delaware law against liabilities that may arise by reason of their service to us, and to advance expenses incurred as a result of any proceeding against them as to which they could be indemnified. We also intend to enter into indemnification agreements with our future directors and executive officers.
Transactions with Portfolio Companies
SVPGlobal, either directly or through affiliates, has ownership interests in a broad range of companies (“Portfolio Companies”) with whom we may from time to time enter into commercial transactions in the ordinary course of business, primarily for the purchase of goods and services. We believe that none of our transactions or arrangements with Portfolio Companies is significant enough to be considered material to SVPGlobal or to our business.
118
Table of Contents
Policies and Procedures with Respect to Related Party Transactions
Upon the closing of this offering, we intend to adopt policies and procedures whereby our Audit Committee will be responsible for reviewing and approving related party transactions. In addition, our Code of Ethics will require that all of our employees and directors inform the Company of any material transaction or relationship that comes to their attention that could reasonably be expected to create a conflict of interest. Further, at least annually, each director and executive officer will complete a detailed questionnaire that asks questions about any business relationship that may give rise to a conflict of interest and all transactions in which we are involved and in which the executive officer, a director or a related person has a direct or indirect material interest.
119
Table of Contents
DESCRIPTION OF CERTAIN INDEBTEDNESS
The following is a summary of certain indebtedness that we will have following the completion of this offering.
7 1⁄8% Senior Notes due 2020
On April 28, 2015, KPA, our wholly owned indirect subsidiary, issued €300.0 million aggregate principal amount of our 7 1⁄8% Senior Notes due 2020 (the “Notes”) pursuant to an indenture (the “Indenture”), dated April 28, 2015, among KPA, the Guarantors and Deutsche Trustee Company Limited, governing the Notes. The Notes are senior unsecured obligations of KPA except for structural security in the form of the Collateral (as defined in the Indenture), and are guaranteed on a senior basis by the Company and each of its subsidiaries to the extent such guarantor is a guarantor of KPA’s obligations under our Credit Agreement (as defined below).
The Notes will mature on November 1, 2020. Interest on the Notes accrues at a rate of 7.125% per annum and is payable semi-annually in arrears on May 1 and November 1 of each year. Interest is computed on the basis of a 360-day year comprised of 12 30-day months. Prior to May 1, 2017, we may redeem some or all of the Notes at a price equal to 100% of the principal amount of the notes redeemed plus accrued and unpaid interest, if any, plus an applicable premium. On or after May 1, 2017, we may redeem all or a part of the Notes at its option, upon not less than 10 nor more than 60 days’ notice, at the redemption prices (expressed as a percentage of the principal amount) set forth below, plus accrued and unpaid interest and “Additional Amounts,” if any, on the Notes to be redeemed to the applicable redemption date if redeemed during the 12 month period beginning on May 1 of the years indicated below:
| Period |
Redemption Price | |||
| 2017 |
103.563 | % | ||
| 2018 |
101.782 | % | ||
| 2019 and thereafter |
100.000 | % | ||
In addition, at any time prior to May 1, 2017, we may repay up to 40% of the Notes with the net proceeds of certain equity offerings, at a redemption price of 107.125% of the principal amount thereof plus accrued and unpaid interest.
The Indenture governing the Notes contains covenants that, among other things, restrict the ability of KPA and certain of its subsidiaries to: incur, assume or guarantee additional indebtedness; pay dividends or redeem or repurchase capital stock; make other restricted payments; incur liens; redeem debt that is junior in right of payment to the Notes; sell or otherwise dispose of assets, including capital stock of subsidiaries; enter into mergers or consolidations; and enter into transactions with affiliates. These covenants are subject to a number of important exceptions and qualifications. In addition, in certain circumstances, if KPA sells assets or experiences certain changes of control, it must offer to purchase the Notes.
Senior Secured Credit Facilities
General
On April 28, 2015, we entered into a senior secured credit agreement, by and among the Company, KP Holding GmbH & Co. KG, the borrowers party thereto, the other guarantors party thereto and Credit Suisse AG, Cayman Island Branch, as administrative agent (the “Original Credit Agreement”). The Original Credit Agreement provided for (A) the first lien term loans in an original aggregate principal amount of €881.0 million (equivalent), consisting of a U.S. dollar facility of the equivalent of €668.0 million and a facility of €213.0 million available in euros (the “First Lien Term Loans”) and (B) the revolving credit facility in an aggregate principal amount of up to €100.0 million (the “Revolving Credit Facility”). On October 20, 2016, in connection with the Farmamak Acquisition, we entered into an amendment to the Original Credit Agreement (the “First Amendment” and, together with the Original Credit Agreement, the “Credit Agreement”). Pursuant to the First Amendment, outstanding First Lien Term Loans were repriced at a lower interest rate. The First Amendment also
120
Table of Contents
provides for an incremental term loan in an original aggregate principal amount of €85 million, the proceeds of which were used to fund the Farmamak Acquisition, with the remainder to be used for working capital and general corporate purposes.
The First Lien Term Loans mature 60 months following the closing date of the Original Credit Agreement and the Revolving Credit Facility matures 57 months following the closing date of the Original Credit Agreement.
Interest
Loans denominated in Euro bear interest based on the European Interbank Offered Rate (“EURIBOR”), loans denominated in any other currency bear interest based on the London Interbank Offered Rate (“LIBOR”) (together the “Eurocurrency Loans”) and, at the option of the relevant borrower, loans denominated in U.S. dollars bear interest at LIBOR or the Base Rate, as described below, in each case, plus a customary margin following the First Amendment of (x) with respect to the First Lien Term Loans (i) denominated in U.S. dollar, 3.25% per annum in the case of Eurocurrency Loans and 2.25% per annum in the case of Base Rate Loans and (ii) denominated in Euro, 3.00% per annum and (y) with respect to the Revolving Credit Facility subject to a leverage ratio based pricing grid ranging from (i) 3.50%-4.00% per annum in the case of Eurocurrency Loans and 2.50%-3.00% per annum in the case of Base Rate Loans, in each case denominated in U.S. dollar and (ii) 3.75-3.25% per annum if denominated in a currency other than U.S. dollars.
The Base Rate is defined, for any day, as a fluctuating rate per annum equal to the highest of (x) the “Federal Funds Rate,” as published by the Federal Reserve Bank of New York, plus 1/2 of 1.00%, (y) the “prime rate” publicly announced by the administrative agent under the New Senior Secured Credit Facilities as its prime rate in effect in its principal office in New York City and (z) LIBOR for an interest period of one month beginning on such day plus 1.00% (such highest rate being, the “Base Rate”); provided that with respect to the First Lien Term Loans denominated in U.S. dollars, the Base Rate shall be deemed to be not less than 2.00% per annum.
Interest in respect of loans bearing interest at the Base Rate will be payable quarterly in arrears. Interest in respect of Eurocurrency Loans will be determined for periods to be selected by our representative (“Interest Periods”) of one, three, six or, if available to all relevant affected lenders, 12 months will be paid at the end of each Interest Period and, in the case of Interest Periods longer than three months, at the end of each three-month period in such Interest Period, and will be calculated on the basis of the actual number of days elapsed in a year of 360 days.
Default interest will accrue on overdue principal amounts at a rate equal to 2.00% in excess of the then applicable interest rate.
Prepayments
Mandatory Prepayments
The Senior Secured Credit Facilities are required (subject to thresholds and exceptions) to be prepaid in an amount equal to:
| • | 100% of the net proceeds received from certain sales or other dispositions of the assets of the Company or any of its restricted subsidiaries, or any casualty and condemnation proceeds received by the Company or any of its restricted subsidiaries, after the closing date of the Original Credit Agreement, in each case, in excess of the thresholds stipulated in the Credit Agreement, provided that such amounts may be reinvested in assets to be used in the group’s business within 365 days or 545 days, if contractually committed within the 365-day period, of such disposition and subject to other exceptions set forth in the Credit Agreement; |
121
Table of Contents
| • | 100% of the net proceeds received by the Company or any of its subsidiaries from the issuance or incurrence of debt after the closing of the Original Credit Agreement (other than any debt permitted to be issued or incurred pursuant to the negative covenants set forth in the Credit Agreement (other than certain refinancing indebtedness)); and |
| • | 50% of excess cash flow of the Company and its restricted subsidiaries (as defined in the Credit Agreement) commencing with fiscal 2016, stepping down to 25% and 0% when the total net leverage ratio of the Company and its restricted subsidiaries is at or below 5.00:1.00 and 4.50:1.00, respectively, provided that voluntary prepayments of the First Lien Term Loans, the Revolving Credit Facility (to the extent resulting in permanent reduction in commitments), and any incremental First Lien Term Loans or Revolving Credit Facility (to the extent resulting in a permanent reduction in commitments), except to the extent financed with long-term indebtedness (other than revolving indebtedness) shall be credited against excess cash flow prepayment obligations on a dollar-for-dollar basis. |
Optional Prepayments
Optional prepayments are permitted in whole or in part, with prior notice but without premium or penalty (except breakage costs and a prepayment fee of 1.00% in respect of, on or prior to the date that is six months after the closing date of the First Amendment, (x) any prepayment, repayment, refinancing, substitution or replacement of any First Lien Term Loans in connection with a Repricing Transaction (as defined in the Credit Agreement) or (y) any amendment, modification or waiver of, or consent under, the Credit Agreement resulting in a Repricing Transaction (including in connection with any “yank-a-bank” assignment but in each case other than in connection with indebtedness incurred for a change of control, a transformative acquisition or an IPO (each as defined in the Credit Agreement)) and including accrued and unpaid interest, subject to limitations as to minimum amounts of prepayments.
Security and Guarantees
The Senior Secured Credit Facilities are fully and unconditionally guaranteed on a joint and several basis by the Guarantors (collectively the “Loan Parties”), subject to the agreed security principles and guarantor coverage test.
Our Credit Agreement defines our material subsidiaries as each subsidiary that has not been designated by our representative as an “Immaterial Subsidiary,” provided that the total assets of all Immaterial Subsidiaries shall not equal or exceed 5.0% of our consolidated total assets and the gross revenue of all Immaterial Subsidiaries shall not equal or exceed 5.0% of our consolidated EBITDA. The Credit Agreement contains limitations on our ability to transfer assets to, and incur indebtedness at, our non-guarantor subsidiaries.
The Senior Secured Credit Facilities and any hedging or cash management obligations to which a lender or an affiliate of a lender is a counterparty are secured by perfected first priority pledges of all the equity or partnership interests of the KPA, Lux 2, KP Holding GmbH & Co. KG, Klöckner Pentaplast German Holding GmbH & Co. KG, KP Holding Verwaltungs GmbH, KP Erste, KP Germany, Klöckner Pentaplast Europe GmbH & Co. KG, KP International Holding GmbH, Klöckner Pentaplast Verwaltungs GmbH, Kleopatra UK Limited, Klöckner Pentaplast Limited, Klöckner Pentaplast Schweiz AG, Klöckner Pentaplast of America/Witt Plastics, Inc., InterTrans Carrier Company and kp Investment Holdings, LLC, and perfected first priority security interests in all tangible and intangible assets (including, without limitation, accounts receivable, inventory, equipment, general intangibles, intercompany notes, insurance policies, investment property, intellectual property, cash and proceeds of the foregoing) of Lux 2, the KPA and the Guarantors, wherever located, currently or hereafter owned, except to the extent such pledge would be prohibited by applicable law and subject to the agreed security principles and other customary exceptions.
122
Table of Contents
Certain Covenants and Events of Default
The Credit Agreement contains a number of customary affirmative and negative covenants that, among other things and subject to certain significant exceptions, limit the Company’s and the restricted subsidiaries’ ability to:
| • | incur indebtedness or make guarantees; |
| • | incur liens or engage in sale-leaseback transactions; |
| • | make investments, loans and acquisitions; |
| • | merge, liquidate or dissolve; |
| • | sell assets, including capital stock of our subsidiaries; |
| • | pay dividends on our capital stock or redeem, repurchase or retire our capital stock; |
| • | alter the business we conduct; |
| • | amend, prepay, redeem or purchase subordinated debt; |
| • | engage in transactions with our affiliates; |
| • | enter into agreements limiting subsidiary dividends and distributions; |
| • | change our fiscal year; |
| • | amend our organizational documents if such amendment would be materially adverse to the lenders; |
| • | change our center of main interest; and |
| • | in the case of the Parent Companies, as defined therein, conduct themselves other than as passive holding companies. |
In addition, under the Revolving Credit Facility, we are required to comply with a specified first lien net leverage ratio to the extent the aggregate amount of any loans outstanding under the Revolving Credit Facility (excluding cash collateralized bank guarantees and letters of credit and any ancillary facilities) exceed 32.5% of the commitments with respect to the Revolving Credit Facility as of the end of any fiscal quarter.
The Credit Agreement also contains customary events of default (subject to certain materiality levels, default triggers, cure periods and other exceptions), including nonpayment of amounts due; inaccuracy of a representation, warranty or statement; breach of covenants and other obligations; cross defaults; loss of lien on collateral; invalidity of guarantees, collateral or loan documents (or the assertion thereof by a loan party); bankruptcy and insolvency events; breach of ERISA obligations; judgments; and change of control.
123
Table of Contents
The following summary of certain provisions of our capital stock does not purport to be complete and is subject to our certificate of incorporation, our bylaws and the provisions of applicable law. Copies of our certificate of incorporation and bylaws will be filed as exhibits to the registration statement, of which this prospectus is a part.
Authorized Capitalization
General
Upon the closing of this offering, the total amount of our authorized capital stock will consist of shares of common stock, par value $0.001 per share, and shares of undesignated preferred stock.
After giving effect to this offering, we will have shares of common stock and no shares of preferred stock outstanding. The following summary describes all material provisions of our capital stock. We urge you to read our certificate of incorporation and our bylaws, which are included as exhibits to the registration statement of which this prospectus forms a part.
Common Stock
Our common stock is not entitled to preemptive or other similar subscription rights to purchase any of our securities. Our common stock is neither convertible nor redeemable.
Preferred Stock
We do not have any shares of preferred stock outstanding. Our Board of Directors has the authority to issue shares of preferred stock from time to time on terms it may determine, to divide shares of preferred stock into one or more series and to fix the designations, preferences, privileges, and restrictions of preferred stock, including dividend rights, conversion rights, voting rights, terms of redemption, liquidation preference, sinking fund terms, and the number of shares constituting any series or the designation of any series to the fullest extent permitted by the General Corporation Law of the State of Delaware (the “DGCL”). The issuance of our preferred stock could have the effect of decreasing the trading price of our common stock, restricting dividends on our capital stock, diluting the voting power of our common stock, impairing the liquidation rights of our capital stock, or delaying or preventing a change in control of our company.
Voting Rights
Each holder of our common stock is entitled to one vote per share on each matter submitted to a vote of stockholders. Our bylaws provide that the presence, in person or by proxy, of holders of shares representing a majority of the outstanding shares of capital stock entitled to vote at a stockholders’ meeting shall constitute a quorum. When a quorum is present, the affirmative vote of a majority of the votes cast is required to take action, unless otherwise specified by law or our certificate of incorporation, and except for the election of directors, which is determined by a plurality vote. There are no cumulative voting rights.
Dividend Rights
Each holder of shares of our capital stock will be entitled to receive such dividends and other distributions in cash, stock or property as may be declared by our Board of Directors from time to time out of our assets or funds legally available for dividends or other distributions. See the section entitled “Dividend Policy.” These rights are subject to the preferential rights of any other class or series of our preferred stock.
124
Table of Contents
Other Rights
Each holder of common stock is subject to, and may be adversely affected by, the rights of the holders of any series of preferred stock that we may designate and issue in the future. This offering is not subject to pre-emptive rights.
Liquidation Rights
If our company is involved in a consolidation, merger, recapitalization, reorganization, or similar event, each holder of common stock will participate pro rata in all assets remaining after payment of liabilities, subject to prior distribution rights of preferred stock, if any, then outstanding.
Anti-Takeover Effects of Our Certificate of Incorporation and Bylaws
Our certificate of incorporation and our bylaws will contain provisions that may delay, defer or discourage another party from acquiring control of us. We expect that these provisions, which are summarized below, will discourage coercive takeover practices or inadequate takeover bids. These provisions are also designed to encourage persons seeking to acquire control of us to first negotiate with the Board of Directors, which we believe may result in an improvement of the terms of any such acquisition in favor of our stockholders. However, they also give the Board of Directors the power to discourage acquisitions that some stockholders may favor.
Action by Written Consent, Special Meeting of Stockholders and Advance Notice Requirements for Stockholder Proposals
Our certificate of incorporation will provide that stockholder action can be taken only at an annual or special meeting of stockholders and cannot be taken by written consent in lieu of a meeting once SVPGlobal ceases to beneficially own more than 50% of our outstanding shares. Our certificate of incorporation and bylaws will also provide that, except as otherwise required by law, special meetings of the stockholders can be called only pursuant to a resolution adopted by a majority of the total number of directors that we would have if there were no vacancies or, until the date that SVPGlobal ceases to beneficially own more than 50% of our outstanding shares, at the request of holders of 50% or more of our outstanding shares. Except as described above, stockholders will not be permitted to call a special meeting or to require the board of directors to call a special meeting.
In addition, our bylaws require advance notice procedures for stockholder proposals to be brought before an annual meeting of the stockholders, including the nomination of directors. Stockholders at an annual meeting may only consider the proposals specified in the notice of meeting or brought before the meeting by or at the direction of the Board of Directors, or by a stockholder of record on the record date for the meeting, who is entitled to vote at the meeting and who has delivered a timely written notice in proper form to our secretary, of the stockholder’s intention to bring such business before the meeting.
These provisions could have the effect of delaying until the next stockholder meeting any stockholder actions, even if they are favored by the holders of a majority of our outstanding voting securities.
Classified Board
Our certificate of incorporation will provide that our Board of Directors will be divided into three classes of directors, with the classes as nearly equal in number as possible. As a result, approximately one-third of our Board of Directors will be elected each year. The classification of directors will have the effect of making it more difficult for stockholders to change the composition of our board. In addition, because our board will be classified, under the DGCL, directors may only be removed for cause.
125
Table of Contents
Removal of Directors
Our Certificate of Incorporation will provide that directors may only be removed from office only for cause and only upon the affirmative vote of at least 75% of the voting power of our outstanding shares of common stock.
Amendment to Certificate of Incorporation and Bylaws
The DGCL provides generally that the affirmative vote of a majority of the outstanding stock entitled to vote on amendments to a corporation’s certificate of incorporation or bylaws is required to approve such amendment, unless a corporation’s certificate of incorporation or bylaws, as the case may be, requires a greater percentage. Our bylaws may be amended, altered, changed or repealed by a majority vote of our Board of Directors, provided that, in addition to any other vote otherwise required by law, after the date on which SVPGlobal ceases to beneficially own more than 50% of our outstanding shares, the affirmative vote of at least 75% of the voting power of our outstanding shares of common stock will be required to amend, alter, change or repeal our bylaws. Additionally, after the date on which SVPGlobal ceases to beneficially own more than 50% of our outstanding shares, the affirmative vote of at least 75% of the voting power of the outstanding shares of capital stock entitled to vote on the adoption, alteration, amendment or repeal of our certificate of incorporation, voting as a single class, will be required to amend or repeal or to adopt any provision inconsistent with specified provisions of our certificate of incorporation. This requirement of a supermajority vote to approve amendments to our certificate of incorporation and bylaws could enable a minority of our stockholders to exercise veto power over any such amendments.
Delaware Anti-Takeover Statute
Section 203 of the DGCL provides that if a person acquires 15% or more of the voting stock of a Delaware corporation, such person becomes an “interested stockholder” and may not engage in certain “business combinations” with the corporation for a period of three years from the time such person acquired 15% or more of the corporation’s voting stock, unless: (1) the board of directors approves the acquisition of stock or the merger transaction before the time that the person becomes an interested stockholder; (2) the interested stockholder owns at least 85% of the outstanding voting stock of the corporation at the time the merger transaction commences (excluding voting stock owned by directors who are also officers and certain employee stock plans); or (3) the merger transaction is approved by the board of directors and by the affirmative vote at a meeting, not by written consent, of stockholders of 2/3 of the holders of the outstanding voting stock which is not owned by the interested stockholder. A Delaware corporation may elect in its certificate of incorporation or bylaws not to be governed by this particular Delaware law.
Under our certificate of incorporation, we will opt out of Section 203 of the DGCL, and will therefore not be subject to Section 203.
Corporate Opportunity
Our certificate of incorporation provides that we renounce any interest or expectancy in, or in being offered an opportunity to participate in, any business opportunity that may from time to time be presented to SVPGlobal or any of its officers, directors, employees (including but not limited to its employees who are our directors), agents, stockholders, members, partners, affiliates and subsidiaries (other than us and our subsidiaries) and that may be a business opportunity for SVPGlobal, even if the opportunity is one that we might reasonably have pursued or had the ability or desire to pursue if granted the opportunity to do so. No such person will be liable to us for breach of any fiduciary or other duty, as a director or officer or otherwise, by reason of the fact that such person, acting in good faith, pursues or acquires any such business opportunity, directs any such business opportunity to another person or fails to present any such business opportunity, or information regarding any such business opportunity, to us unless, in the case of any such person who is our director or officer, any such
126
Table of Contents
business opportunity is expressly offered to such director or officer solely in his or her capacity as our director or officer. Neither SVPGlobal, nor any of its representatives has any duty to refrain from engaging directly or indirectly in the same or similar business activities or lines of business as us or any of our subsidiaries.
Limitations on Liability and Indemnification of Officers and Directors
Our certificate of incorporation will limit the liability of our directors to the fullest extent permitted by the DGCL, and our bylaws will provide that we will indemnify them to the fullest extent permitted by such law. We expect to enter into indemnification agreements with our current directors and executive officers prior to the completion of this offering and expect to enter into a similar agreement with any new directors or executive officers.
Exclusive Jurisdiction of Certain Actions
Our certificate of incorporation requires, to the fullest extent permitted by law, that derivative actions brought in the name of the Company, actions against directors, officers and employees for breach of fiduciary duty and other similar actions may be brought only in the Court of Chancery in the State of Delaware. Although we believe this provision benefits the Company by providing increased consistency in the application of Delaware law in the types of lawsuits to which it applies, the provision may have the effect of discouraging lawsuits against our directors and officers.
Registration Rights
See “Certain Relationships and Related Party Transactions—Registration Rights Agreement.”
Transfer Agent and Registrar
The transfer agent and registrar for our common stock will be .
Listing
We will apply for listing of our common stock on the New York Stock Exchange under the trading symbol “KP.”
127
Table of Contents
SHARES ELIGIBLE FOR FUTURE SALE
Prior to this offering, there has been no public market for our common stock. Future sales of substantial amounts of our common stock in the public market, or the perception that such sales may occur, could adversely affect the prevailing market price of our common stock. No prediction can be made as to the effect, if any, future sales of shares, or the availability of shares for future sales, will have on the market price of our common stock prevailing from time to time. The sale of substantial amounts of our common stock in the public market, or the perception that such sales could occur, could harm the prevailing market price of our common stock.
Sale of Restricted Shares
Upon completion of this offering, we will have shares of common stock outstanding. Of these shares of common stock, the shares of common stock being sold in this offering, plus any shares sold upon exercise of the underwriters’ option to purchase additional shares, will be freely tradable without restriction under the Securities Act, except for any such shares which may be acquired by an “affiliate” of ours, as that term is defined in Rule 144 promulgated under the Securities Act (“Rule 144”), which shares will be subject to the volume limitations and other restrictions of Rule 144 described below. The remaining shares of common stock held by our existing stockholders upon completion of this offering will be “restricted securities,” as that term is defined in Rule 144, and may be resold only after registration under the Securities Act or pursuant to an exemption from such registration, including, among others, the exemptions provided by Rule 144 and Rule 701 under the Securities Act, which rules are summarized below. Subject to certain restrictions on transfer pursuant to the Stockholders Agreement, these remaining shares of common stock held by our existing stockholders upon completion of this offering will be available for sale in the public market (after the expiration of the lock-up agreements described below) only if registered or if they qualify for an exemption from registration under Rule 144 or Rule 701 under the Securities Act, as described below.
Rule 144
In general, under Rule 144 as currently in effect, persons who are not one of our affiliates at any time during the three months preceding a sale may sell shares of our common stock beneficially held upon the earlier of (1) the expiration of a six-month holding period, if we have been subject to the reporting requirements of the Exchange Act and have filed all required reports for at least 90 days prior to the date of the sale, or (2) a one-year holding period.
At the expiration of the six-month holding period, a person who was not one of our affiliates at any time during the three months preceding a sale would be entitled to sell an unlimited number of shares of our common stock provided current public information about us is available, and a person who was one of our affiliates at any time during the three months preceding a sale would be entitled to sell within any three-month period a number of shares of common stock that does not exceed the greater of either of the following:
| • | 1% of the number of shares of our common stock then outstanding, which will equal approximately shares immediately after this offering, based on the number of shares of our common stock outstanding as of ; or |
| • | the average weekly trading volume of our common stock on during the four calendar weeks preceding the filing of a notice on Form 144 with respect to the sale. |
At the expiration of the one-year holding period, a person who was not one of our affiliates at any time during the three months preceding a sale would be entitled to sell an unlimited number of shares of our common stock without restriction. A person who was one of our affiliates at any time during the three months preceding a sale would remain subject to the volume restrictions described above.
Sales under Rule 144 by our affiliates are also subject to manner of sale provisions and notice requirements and to the availability of current public information about us.
128
Table of Contents
Rule 701
In general and subject to certain restrictions under the Stockholders Agreement, and expiration of the applicable lock-up restrictions, under Rule 701 promulgated under the Securities Act, any of our employees, directors or officers who purchased shares from us in connection with a qualified compensatory stock or option plan or other written agreement before the effective date of this offering, or who purchased shares from us after that date upon the exercise of options granted before that date, are eligible to resell such shares in reliance upon Rule 144 beginning 90 days after the date of this prospectus. If such person is not an affiliate, the sale may be made under Rule 144 without compliance with the holding periods of Rule 144 and subject only to the manner-of-sale restrictions of Rule 144. If such a person is an affiliate, the sale may be made under Rule 144 without compliance with its one-year minimum holding period, but subject to the other Rule 144 restrictions.
Stock Plans
We intend to file one or more registration statements on Form S-8 under the Securities Act to register shares of our common stock issued or reserved for issuance under our existing option plan and the new equity incentive plan we intend to adopt in connection with this offering. The first such registration statement is expected to be filed soon after the date of this prospectus and will automatically become effective upon filing with the SEC. Accordingly, shares registered under such registration statement will be available for sale in the open market following the effective date, unless such shares are subject to vesting restrictions with us, Rule 144 restrictions applicable to our affiliates or the lock-up restrictions described below.
Lock-Up Agreements
We, and each of our directors, officers and the holders of approximately shares of our common stock have agreed, subject to certain exceptions, not to offer, sell, contract to sell, pledge or otherwise dispose of, directly or indirectly, any shares of our common stock or securities convertible into or exchangeable or exercisable for any shares of our common stock, enter into a transaction that would have the same effect, or enter into any swap, hedge or other arrangement that transfers, in whole or in part, any of the economic consequences of ownership of our common stock, whether any of these transactions are to be settled by delivery of our common stock or other securities, in cash or otherwise, or publicly disclose the intention to make any offer, sale, pledge or disposition, or to enter into any transaction, swap, hedge or other arrangement, without, in each case, the prior written consent of for a period of 180 days after the date of this prospectus (subject to extension in certain circumstances). For additional information, see “Underwriting.” The holders of approximately % of our outstanding shares of common stock as of have executed such lock-up agreements.
Registration Rights
Upon completion of this offering, the holders of an aggregate of shares of our common stock, or their transferees, will be entitled to certain rights with respect to the registration of their shares under the Securities Act. Except for shares purchased by affiliates, registration of their shares under the Securities Act would result in these shares becoming freely tradable without restriction under the Securities Act immediately upon effectiveness of the registration, subject to the expiration of the lock-up period, with respect to certain of the shares, described under “Underwriting” in this prospectus, and to the extent such shares have been released from any repurchase option that we may hold. See “Certain Relationships and Related Party Transactions—Registration Rights Agreement” for more information.
129
Table of Contents
CERTAIN U.S. FEDERAL INCOME AND ESTATE TAX CONSIDERATIONS FOR NON-U.S. HOLDERS
Overview
The following is a general summary of certain U.S. federal income and estate tax consequences to non-U.S. holders, as defined below, of the ownership and disposition of shares of our common stock. This summary deals only with shares of common stock purchased in this offering that are held as capital assets (generally, property held for investment) by a non-U.S. holder.
For purposes of this discussion, a “non-U.S. holder” means a beneficial owner of shares of our common stock that, for U.S. federal income tax purposes, is not any of the following:
| • | an individual who is a citizen or resident of the United States; |
| • | a corporation (or any other entity treated as a corporation for U.S. federal income tax purposes) created or organized in or under the laws of the United States, any state thereof or the District of Columbia; |
| • | any entity or arrangement treated as a partnership for U.S. federal income tax purposes; |
| • | an estate the income of which is subject to U.S. federal income taxation regardless of its source; or |
| • | a trust if it (1) is subject to the primary supervision of a court within the United States and one or more U.S. persons have the authority to control all substantial decisions of the trust or (2) has a valid election in effect under applicable U.S. Treasury regulations to be treated as a U.S. person for U.S. federal income tax purposes. |
If any entity or arrangement treated as a partnership for U.S. federal income tax purposes holds shares of our common stock, the tax treatment of a partner in such partnership generally will depend upon the status of the partner and the activities of the partner and the partnership. If you are a partner of a partnership considering an investment in shares of our common stock, you should consult your own tax advisors.
This summary is based upon provisions of the U.S. Internal Revenue Code of 1986, as amended (the “Code”), applicable U.S. Treasury regulations, rulings and other administrative pronouncements and judicial decisions, all as of the date hereof. Those authorities are subject to different interpretations and may be changed, perhaps retroactively, so as to result in U.S. federal income and estate tax consequences different from those summarized below. We cannot assure you that a change in law will not alter significantly the tax considerations described in this summary.
This summary does not address all aspects of U.S. federal income and estate taxation, does not address any aspects of the unearned income Medicare contribution tax pursuant to the Health Care and Education Reconciliation Act of 2010 and does not deal with the alternative minimum tax or other federal taxes (such as gift tax) or with foreign, state or local tax considerations that may be relevant to non-U.S. holders in light of their particular circumstances. In addition, this summary does not describe the U.S. federal income tax consequences applicable to you if you are subject to special treatment under U.S. federal income tax laws (including, but not limited to, if you are a U.S. expatriate, a financial institution, an insurance company, a tax-exempt organization, a trader, broker or dealer in securities or currencies, a “controlled foreign corporation,” a “passive foreign investment company,” an entity treated as a partnership or other pass-through entity for U.S. federal income tax purposes (or an investor in such a pass-through entity), a person who acquired shares of our common stock as compensation or otherwise in connection with the performance of services, or a person who has acquired shares of our common stock as part of a straddle, hedge, conversion transaction or other integrated investment or persons that hold their stock through non-U.S. brokers or other non-U.S. intermediaries).
We have not sought and do not expect to seek any rulings from the U.S. Internal Revenue Service (the “IRS”) regarding the matters discussed below. There can be no assurance that the IRS will not take positions concerning the tax consequences of the ownership or disposition of shares of our common stock that differ from those discussed below.
130
Table of Contents
This summary is for general information only and is not intended to constitute a complete description of all U.S. federal income and estate tax consequences for non-U.S. holders relating to the ownership and disposition of shares of our common stock. If you are considering the purchase of shares of our common stock, you should consult your own tax advisors concerning the particular U.S. federal income and estate tax consequences to you of the ownership and disposition of shares of our common stock, as well as the consequences to you arising under other U.S. federal tax laws and the laws of any other applicable taxing jurisdiction in light of your particular circumstances.
This discussion generally assumes that a non-U.S. holder will structure its investment in shares of our common stock so as to avoid the additional withholding tax described below under “—Legislation Affecting Taxation of Common Stock Held by or Through Foreign Entities.”
Dividends
In general, cash distributions on shares of our common stock will constitute dividends for U.S. federal income tax purposes to the extent paid from our current or accumulated earnings and profits, as determined under U.S. federal income tax principles. To the extent any such distributions exceed both our current and our accumulated earnings and profits, they will first be treated as a return of capital reducing your tax basis in our common stock (determined on a share-by-share basis), but not below zero, and then will be treated as capital gain from the sale of stock.
As discussed under “Dividend Policy” above, we do not currently expect to pay dividends. In the event that we do pay dividends, dividends paid to a non-U.S. holder generally will be subject to a U.S. federal withholding tax at a 30% rate, or such lower rate as may be specified by an applicable income tax treaty. However, dividends that are effectively connected with the conduct of a trade or business within the United States by a non-U.S. holder (and, if required by an applicable income tax treaty, are attributable to a U.S. permanent establishment) generally will not be subject to such withholding tax, provided certain certification and disclosure requirements are satisfied (including the provision of a properly completed IRS Form W-8 ECI or other applicable form). Instead, unless an applicable income tax treaty provides otherwise, such dividends will generally be subject to U.S. federal income tax on a net income basis in the same manner as if the non-U.S. holder were a U.S. person as defined under the Code. A corporate non-U.S. holder may be subject to an additional “branch profits tax” at a 30% rate (or such lower rate as may be specified by an applicable income tax treaty) on its earnings and profits (subject to adjustments) attributable to such dividends that are effectively connected with its conduct of a U.S. trade or business (and, if an income tax treaty applies, are attributable to its U.S. permanent establishment).
A non-U.S. holder of shares of our common stock who wishes to claim the benefit of an applicable treaty rate and avoid backup withholding, as discussed below, for dividends will be required (a) to complete IRS Form W-8BEN or IRS Form W-8BEN-E (or other applicable form) and certify under penalty of perjury that such holder is not a United States person as defined under the Code and is eligible for treaty benefits, or (b) if shares of our common stock are held through certain foreign intermediaries, satisfy the relevant certification requirements of applicable United States Treasury regulations.
A non-U.S. holder of shares of our common stock eligible for a reduced rate of United States federal withholding tax pursuant to an income tax treaty may obtain a refund of any excess amounts withheld by timely filing an appropriate claim for refund with the IRS.
Gain on Taxable Disposition of Shares of Common Stock
Subject to the discussions below of the backup withholding tax and the FATCA legislation, any gain realized by a non-U.S. holder on the sale or other taxable disposition of shares of our common stock generally will not be subject to United States federal income tax unless:
| • | the gain is effectively connected with a trade or business of the non-U.S. holder in the United States (and, if required by an applicable income tax treaty, is attributable to a U.S. permanent establishment); |
131
Table of Contents
| • | the non-U.S. holder is an individual who is present in the United States for 183 days or more in the taxable year of that disposition, and certain other conditions are met; or |
| • | we are or have been a U.S. real property holding corporation (a “USRPHC”) for U.S. federal income tax purposes at any time during the shorter of the five-year period ending on the date of the disposition or the period that the non-U.S. holder held shares of our common stock (the “applicable period”). |
In the case of a non-U.S. holder described in the first bullet point above, any gain generally will be subject to U.S. federal income tax on a net income basis in the same manner as if the non-U.S. holder were a U.S. person as defined under the Code (unless an applicable income tax treaty provides otherwise). A non-U.S. holder that is a foreign corporation may also be subject to the branch profits tax at a rate of 30% on its effectively connected earnings and profits (subject to adjustments), unless an applicable income tax treaty provides otherwise. Except as otherwise provided by an applicable income tax treaty, an individual non-U.S. holder described in the second bullet point above will be subject to a 30% tax on any gain derived from the sale, which may be offset by certain U.S. source capital losses, even though the individual is not considered a resident of the United States under the Code.
We believe we are not and do not anticipate becoming a USRPHC. However, because the determination of whether we are a USRPHC depends on the fair market value of our U.S. real property relative to the fair market value of other business assets, there can be no assurance that we are not currently or will not become a USRPHC in the future. Even if we are or become a USRPHC, so long as our common stock is regularly traded on an established securities market, a non-U.S. holder will be subject to U.S. federal income tax on any gain not otherwise taxable only if such non-U.S. holder actually or constructively owned more than five percent of our outstanding common stock at some time during the applicable period. You should consult your own tax advisor about the consequences that could result if we are, or become, a USRPHC.
Information Reporting and Backup Withholding
The amount of dividends paid to each non-U.S. holder, and the tax withheld with respect to such dividends will be reported annually to the IRS and to each such holder, regardless of whether withholding was reduced or eliminated by an applicable tax treaty. Copies of the information returns reporting such dividends and withholding may also be made available to the tax authorities in the country in which the non-U.S. holder resides or is established under the provisions of an applicable income tax treaty or agreement.
A non-U.S. holder generally will be subject to backup withholding with respect to dividends paid to such holder unless such holder certifies under penalty of perjury (usually on an IRS Form W-8BEN or IRS W-8BEN-E) that it is a non-U.S. person (and the payor does not have actual knowledge or reason to know that such holder is a U.S. person as defined under the Code), or such holder otherwise establishes an exemption.
Information reporting and, depending on the circumstances, backup withholding (currently at a rate of 28%) will apply to the proceeds of a sale or other disposition by a non-U.S. holder of shares of our common stock within the United States or conducted through certain U.S.-related financial intermediaries unless such non-U.S. holder certifies under penalty of perjury that it is not a U.S. person (as defined under the Code), and the payor does not have actual knowledge or reason to know that the non-U.S. holder is a U.S. person, or such non-U.S. holder otherwise establishes an exemption.
Backup withholding is not an additional tax. Any amounts withheld under the backup withholding rules may be allowed as a refund or a credit against a non-U.S. holder’s U.S. federal income tax liability provided the required information is timely furnished to the IRS.
Legislation Affecting Taxation of Common Stock Held by or Through Foreign Entities
Legislation enacted in 2010, known as the “FATCA” legislation, generally will impose a withholding tax of 30% on dividend income from our common stock and on the gross proceeds of a sale or other disposition of our
132
Table of Contents
common stock paid to a “foreign financial institution” (as specifically defined for this purpose), unless such institution enters into an agreement with the U.S. government to collect and provide to the U.S. tax authorities substantial information regarding U.S. account holders of such institution (which would include certain equity and debt holders of such institution, as well as certain account holders that are foreign entities with U.S. owners). Absent any applicable exception, this legislation generally will impose a withholding tax of 30% on dividend income from our common stock and the gross proceeds of a sale or other disposition of our common stock paid to a foreign entity that is not a foreign financial institution unless such entity provides the applicable withholding agent with either (i) a certification identifying the substantial U.S. owners of the entity, which generally includes any U.S. person who directly or indirectly owns more than 10% of the entity (or more than zero percent in the case of some entities) or (ii) a certification that the entity does not have any substantial U.S. owners. Under certain circumstances, a non-U.S. holder of our common stock might be eligible for refunds or credits of such withholding taxes, and a non-U.S. holder might be required to file a U.S. federal income tax return to claim such refunds or credits. Under final Treasury regulations and IRS Notice 2015-66, this legislation only applies to payments of dividends made on or after July 1, 2014 and payments of gross proceeds made after December 31, 2018. Non-U.S. holders should consult their own tax advisors regarding the implications of this legislation on their investment in our common stock.
U.S. Federal Estate Tax
Shares of our common stock that are owned (or deemed to be owned) at the time of death by a non-U.S. holder who is an individual will be includable in such non-U.S. holder’s taxable estate for U.S. federal estate tax purposes, unless an applicable estate tax treaty provides otherwise.
THE SUMMARY OF CERTAIN U.S. FEDERAL INCOME AND ESTATE TAX CONSIDERATIONS ABOVE IS INCLUDED FOR GENERAL INFORMATION PURPOSES ONLY. POTENTIAL PURCHASERS OF OUR COMMON STOCK ARE URGED TO CONSULT THEIR OWN TAX ADVISORS TO DETERMINE THE U.S. FEDERAL, STATE AND LOCAL AND NON-U.S. INCOME, ESTATE AND OTHER TAX CONSIDERATIONS OF OWNING AND DISPOSING OF OUR COMMON STOCK.
133
Table of Contents
The Company and the underwriters named below have entered into an underwriting agreement with respect to the shares being offered. Subject to certain conditions, each underwriter has severally agreed to purchase the number of shares indicated in the following table. Citigroup Global Markets Inc., Credit Suisse Securities (USA) LLC and Goldman, Sachs & Co. are the representatives of the underwriters.
| Underwriters |
Number of Shares | |||
| Citigroup Global Markets Inc |
||||
| Credit Suisse Securities (USA) LLC |
||||
| Goldman, Sachs & Co. |
||||
| Merrill Lynch, Pierce, Fenner &
Smith |
||||
| Robert W. Baird & Co. Incorporated |
||||
| Jefferies LLC |
||||
| Total |
||||
The underwriters are committed to take and pay for all of the shares being offered, if any are taken, other than the shares covered by the option described below unless and until this option is exercised.
The underwriters have an option to buy up to an additional shares from the Company to cover sales by the underwriters of a greater number of shares than the total number set forth in the table above. They may exercise that option for 30 days. If any shares are purchased pursuant to this option, the underwriters will severally purchase shares in approximately the same proportion as set forth in the table above.
The following tables show the per share and total underwriting discounts and commissions to be paid to the underwriters by the Company. Such amounts are shown assuming both no exercise and full exercise of the underwriters’ option to purchase additional shares.
| Paid by the Company |
No Exercise | Full Exercise | ||||||
| Per Share |
||||||||
| Total |
||||||||
Shares sold by the underwriters to the public will initially be offered at the initial public offering price set forth on the cover of this prospectus. Any shares sold by the underwriters to securities dealers may be sold at a discount of up to $ per share from the initial public offering price. After the initial offering of the shares, the representatives may change the offering price and the other selling terms. The offering of the shares by the underwriters is subject to receipt and acceptance and subject to the underwriters’ right to reject any order in whole or in part.
The Company and its officers, directors, and holders of all of the Company’s common stock have agreed with the underwriters, subject to certain exceptions, not to sell, transfer or dispose of or hedge, directly or indirectly, any of shares of the Company’s common stock or securities convertible into or exchangeable for shares of the Company’s common stock during the period from the date of this prospectus continuing through the date 180 days after the date of this prospectus, except with the prior written consent of the representatives. This agreement does not apply to any existing employee benefit plans. See “Shares Eligible for Future Sale” for a discussion of certain transfer restrictions.
Prior to the offering, there has been no public market for the shares. The initial public offering price has been negotiated among the Company and the representatives. Among the factors to be considered in determining the initial public offering price of the shares, in addition to prevailing market conditions, will be the Company’s historical performance, estimates of the business potential and earnings prospects of the Company, an assessment of the Company’s management and the consideration of the above factors in relation to market valuation of companies in related businesses.
134
Table of Contents
We intend to list the common stock on the New York Stock Exchange under the symbol “KP.”
In connection with the offering, the underwriters may purchase and sell shares of common stock in the open market. These transactions may include short sales, stabilizing transactions and purchases to cover positions created by short sales. Short sales involve the sale by the underwriters of a greater number of shares than they are required to purchase in the offering, and a short position represents the amount of such sales that have not been covered by subsequent purchases. A “covered short position” is a short position that is not greater than the amount of additional shares for which the underwriters’ option described above may be exercised. The underwriters may cover any covered short position by either exercising their option to purchase additional shares or purchasing shares in the open market. In determining the source of shares to cover the covered short position, the underwriters will consider, among other things, the price of shares available for purchase in the open market as compared to the price at which they may purchase additional shares pursuant to the option described above. “Naked” short sales are any short sales that create a short position greater than the amount of additional shares for which the option described above may be exercised. The underwriters must cover any such naked short position by purchasing shares in the open market. A naked short position is more likely to be created if the underwriters are concerned that there may be downward pressure on the price of the common stock in the open market after pricing that could adversely affect investors who purchase in the offering. Stabilizing transactions consist of various bids for or purchases of common stock made by the underwriters in the open market prior to the completion of the offering.
The underwriters may also impose a penalty bid. This occurs when a particular underwriter repays to the underwriters a portion of the underwriting discount received by it because the representatives have repurchased shares sold by or for the account of such underwriter in stabilizing or short covering transactions.
Purchases to cover a short position and stabilizing transactions, as well as other purchases by the underwriters for their own accounts, may have the effect of preventing or retarding a decline in the market price of the Company’s stock, and together with the imposition of the penalty bid, may stabilize, maintain or otherwise affect the market price of the common stock. As a result, the price of the common stock may be higher than the price that otherwise might exist in the open market. The underwriters are not required to engage in these activities and may end any of these activities at any time. These transactions may be effected on the New York Stock Exchange or relevant exchange, in the over-the-counter market or otherwise.
European Economic Area
In relation to each Member State of the European Economic Area, an offer to the public of our common shares may not be made in that Member State, except that an offer to the public in that Member State of our common shares may be made at any time under the following exemptions under the Prospectus Directive:
| • | to any legal entity which is a qualified investor as defined in the Prospectus Directive; |
| • | to fewer than 150 natural or legal persons (other than qualified investors as defined in the Prospectus Directive), subject to obtaining the prior consent of the representatives for any such offer; or |
| • | in any other circumstances falling within Article 3(2) of the Prospectus Directive; |
provided that no such offer or shares of our common stock shall result in a requirement for the publication by us or any Underwriter of a prospectus pursuant to Article 3 of the Prospectus Directive.
For the purposes of this provision, the expression an “offer to public” in relation to our common shares in any Member State means the communication in any form and by any means of sufficient information on the terms of the offer and our common shares to be offered so as to enable an investor to decide to purchase our common shares, as the same may be varied in that Member State by any measure implementing the Prospectus Directive in that Member State, the expression “Prospectus Directive” means Directive 2003/71/EC (as amended), including by Directive 2010/73/EU and includes any relevant implementing measure in such Member State.
135
Table of Contents
This European Economic Area selling restriction is in addition to any other selling restrictions set out below.
United Kingdom
In the United Kingdom, this prospectus is only addressed to and directed as qualified investors who are (i) investment professionals falling within Article 19(5) of the Financial Services and Markets Act 2000 (Financial Promotion) Order 2005 (the Order); or (ii) high net worth entities and other persons to whom it may lawfully be communicated, falling within Article 49(2)(a) to (d) of the Order (all such persons together being referred to as “relevant persons”). Any investment or investment activity to which this prospectus relates is available only to relevant persons and will only be engaged with relevant persons. Any person who is not a relevant person should not act or relay on this prospectus or any of its contents.
Switzerland
The shares may not be publicly offered in Switzerland and will not be listed on the SIX Swiss Exchange (“SIX”) or on any other stock exchange or regulated trading facility in Switzerland. This document has been prepared without regard to the disclosure standards for issuance prospectuses under art. 652a or art. 1156 of the Swiss Code of Obligations or the disclosure standards for listing prospectuses under art. 27 ff. of the SIX Listing Rules or the listing rules of any other stock exchange or regulated trading facility in Switzerland. Neither this document nor any other offering or marketing material relating to the shares or the offering may be publicly distributed or otherwise made publicly available in Switzerland.
Neither this document nor any other offering or marketing material relating to the offering, the Company or the shares have been or will be filed with or approved by any Swiss regulatory authority. In particular, this document will not be filed with, and the offer of shares will not be supervised by, the Swiss Financial Market Supervisory Authority FINMA (FINMA), and the offer of shares has not been and will not be authorized under the Swiss Federal Act on Collective Investment Schemes (“CISA”). The investor protection afforded to acquirers of interests in collective investment schemes under the CISA does not extend to acquirers of shares.
Canada
The securities may be sold in Canada only to purchasers purchasing, or deemed to be purchasing, as principal that are accredited investors, as defined in National Instrument 45-106 Prospectus Exemptions or subsection 73.3(1) of the Securities Act (Ontario), and are permitted clients, as defined in National Instrument 31-103 Registration Requirements, Exemptions, and Ongoing Registrant Obligations. Any resale of the securities must be made in accordance with an exemption form, or in a transaction not subject to, the prospectus requirements of applicable securities laws.
Securities legislation in certain provinces or territories of Canada may provide a purchaser with remedies for rescission or damages if this offering memorandum (including any amendment thereto) contains a misrepresentation, provided that the remedies for rescission or damages are exercised by the purchaser within the time limit prescribed by the securities legislation of the purchaser’s province or territory. The purchaser should refer to any applicable provisions of the securities legislation of the purchaser’s province or territory for particulars of these rights or consult with a legal advisor.
Pursuant to section 3A.3 of National Instrument 33-105 Underwriting Conflicts (NI 33-105), the underwriters are not required to comply with the disclosure requirements of NI 33-105 regarding underwriter conflicts of interest in connection with this offering.
Australia
No placement document, prospectus, product disclosure statement or other disclosure document has been lodged with the Australian Securities and Investments Commission (“ASIC”), in relation to the offering. This
136
Table of Contents
prospectus does not constitute a prospectus, product disclosure statement or other disclosure document under the Corporations Act 2001 (the “Corporations Act”), and does not purport to include the information required for a prospectus, product disclosure statement or other disclosure document under the Corporations Act.
Any offer in Australia of the shares may only be made to persons (the “Exempt Investors”) who are “sophisticated investors” (within the meaning of section 708(8) of the Corporations Act), “professional investors” (within the meaning of section 708(11) of the Corporations Act) or otherwise pursuant to one or more exemptions contained in section 708 of the Corporations Act so that it is lawful to offer the shares without disclosure to investors under Chapter 6D of the Corporations Act.
The shares applied for by Exempt Investors in Australia must not be offered for sale in Australia in the period of 12 months after the date of allotment under the offering, except in circumstances where disclosure to investors under Chapter 6D of the Corporations Act would not be required pursuant to an exemption under section 708 of the Corporations Act or otherwise or where the offer is pursuant to a disclosure document which complies with Chapter 6D of the Corporations Act. Any person acquiring shares must observe such Australian on-sale restrictions.
This prospectus contains general information only and does not take account of the investment objectives, financial situation or particular needs of any particular person. It does not contain any securities recommendations or financial product advice. Before making an investment decision, investors need to consider whether the information in this prospectus is appropriate to their needs, objectives and circumstances, and, if necessary, seek expert advice on those matters.
Hong Kong
The shares may not be offered or sold in Hong Kong by means of any document other than (i) in circumstances which do not constitute an offer to the public within the meaning of the Companies (Winding Up and Miscellaneous Provisions) Ordinance (Cap. 32 of the Laws of Hong Kong) (“Companies (Winding Up and Miscellaneous Provisions) Ordinance”) or which do not constitute an invitation to the public within the meaning of the Securities and Futures Ordinance (Cap. 571 of the Laws of Hong Kong) (“Securities and Futures Ordinance”), or (ii) to “professional investors” as defined in the Securities and Futures Ordinance and any rules made thereunder, or (iii) in other circumstances which do not result in the document being a “prospectus” as defined in the Companies (Winding Up and Miscellaneous Provisions) Ordinance, and no advertisement, invitation or document relating to the shares may be issued or may be in the possession of any person for the purpose of issue (in each case whether in Hong Kong or elsewhere), which is directed at, or the contents of which are likely to be accessed or read by, the public in Hong Kong (except if permitted to do so under the securities laws of Hong Kong) other than with respect to shares which are or are intended to be disposed of only to persons outside Hong Kong or only to “professional investors” in Hong Kong as defined in the Securities and Futures Ordinance and any rules made thereunder.
Singapore
This prospectus has not been registered as a prospectus with the Monetary Authority of Singapore. Accordingly, this prospectus and any other document or material in connection with the offer or sale, or invitation for subscription or purchase, of the shares may not be circulated or distributed, nor may the shares be offered or sold, or be made the subject of an invitation for subscription or purchase, whether directly or indirectly, to persons in Singapore other than (i) to an institutional investor (as defined under Section 4A of the Securities and Futures Act, Chapter 289 of Singapore (the “SFA”)) under Section 274 of the SFA, (ii) to a relevant person (as defined in Section 275(2) of the SFA) pursuant to Section 275(1) of the SFA, or any person pursuant to Section 275(1A) of the SFA, and in accordance with the conditions specified in Section 275 of the SFA or (iii) otherwise pursuant to, and in accordance with the conditions of, any other applicable provision of the SFA, in each case subject to conditions set forth in the SFA.
137
Table of Contents
Where the shares are subscribed or purchased under Section 275 of the SFA by a relevant person which is a corporation (which is not an accredited investor (as defined in Section 4A of the SFA)) the sole business of which is to hold investments and the entire share capital of which is owned by one or more individuals, each of whom is an accredited investor, the securities (as defined in Section 239(1) of the SFA) of that corporation shall not be transferable for 6 months after that corporation has acquired the shares under Section 275 of the SFA except: (1) to an institutional investor under Section 274 of the SFA or to a relevant person (as defined in Section 275(2) of the SFA), (2) where such transfer arises from an offer in that corporation’s securities pursuant to Section 275(1A) of the SFA, (3) where no consideration is or will be given for the transfer, (4) where the transfer is by operation of law, (5) as specified in Section 276(7) of the SFA, or (6) as specified in Regulation 32 of the Securities and Futures (Offers of Investments) (Shares and Debentures) Regulations 2005 of Singapore (“Regulation 32”).
Where the shares are subscribed or purchased under Section 275 of the SFA by a relevant person which is a trust (where the trustee is not an accredited investor (as defined in Section 4A of the SFA)) whose sole purpose is to hold investments and each beneficiary of the trust is an accredited investor, the beneficiaries’ rights and interest (howsoever described) in that trust shall not be transferable for 6 months after that trust has acquired the shares under Section 275 of the SFA except: (1) to an institutional investor under Section 274 of the SFA or to a relevant person (as defined in Section 275(2) of the SFA), (2) where such transfer arises from an offer that is made on terms that such rights or interest are acquired at a consideration of not less than $200,000 (or its equivalent in a foreign currency) for each transaction (whether such amount is to be paid for in cash or by exchange of securities or other assets), (3) where no consideration is or will be given for the transfer, (4) where the transfer is by operation of law, (5) as specified in Section 276(7) of the SFA, or (6) as specified in Regulation 32.
Japan
The securities have not been and will not be registered under the Financial Instruments and Exchange Act of Japan (Act No. 25 of 1948, as amended), or the FIEA. The securities may not be offered or sold, directly or indirectly, in Japan or to or for the benefit of any resident of Japan (including any person resident in Japan or any corporation or other entity organized under the laws of Japan) or to others for reoffering or resale, directly or indirectly, in Japan or to or for the benefit of any resident of Japan, except pursuant to an exemption from the registration requirements of the FIEA and otherwise in compliance with any relevant laws and regulations of Japan.
Dubai International Financial Centre
This prospectus relates to an Exempt Offer in accordance with the Offered Securities Rules of the Dubai Financial Services Authority (“DFSA”). This prospectus is intended for distribution only to persons of a type specified in the Offered Securities Rules of the DFSA. It must not be delivered to, or relied on by, any other person. The DFSA has no responsibility for reviewing or verifying any documents in connection with Exempt Offers. The DFSA has not approved this prospectus nor taken steps to verify the information set forth herein and has no responsibility for the prospectus. The shares to which this prospectus relates may be illiquid and/or subject to restrictions on their resale. Prospective purchasers of the shares offered should conduct their own due diligence on the shares. If you do not understand the contents of this prospectus you should consult an authorized financial advisor.
The Company estimates that its share of the total expenses of the offering, excluding underwriting discounts and commissions, will be approximately $ .
The Company has agreed to indemnify the several underwriters against certain liabilities, including liabilities under the Securities Act of 1933.
138
Table of Contents
The underwriters and their respective affiliates are full service financial institutions engaged in various activities, which may include sales and trading, commercial and investment banking, advisory, investment management, investment research, principal investment, hedging, market making, brokerage and other financial and non-financial activities and services. Certain of the underwriters and their respective affiliates have provided, and may in the future provide, a variety of these services to the issuer and to persons and entities with relationships with the issuer, for which they received or will receive customary fees and expenses. In addition, certain of the underwriters or their affiliates are agents, lenders and arrangers under the Senior Secured Credit Facilities.
In the ordinary course of their various business activities, the underwriters and their respective affiliates, officers, directors and employees may purchase, sell or hold a broad array of investments and actively trade securities, derivatives, loans, commodities, currencies, credit default swaps and other financial instruments for their own account and for the accounts of their customers, and such investment and trading activities may involve or relate to assets, securities and/or instruments of the issuer (directly, as collateral securing other obligations or otherwise) and/or persons and entities with relationships with the issuer. The underwriters and their respective affiliates may also communicate independent investment recommendations, market color or trading ideas and/or publish or express independent research views in respect of such assets, securities or instruments and may at any time hold, or recommend to clients that they should acquire, long and/or short positions in such assets, securities and instruments.
139
Table of Contents
Kirkland & Ellis LLP, New York, New York will pass upon the validity of the common stock offered hereby on our behalf. The underwriters are represented by Shearman & Sterling LLP, New York, New York.
The financial statements as of September 30, 2016 and 2015 and for each of the years then ended included in this Prospectus and in the Registration Statement have been so included in reliance on the report of BDO USA, LLP, an independent registered public accounting firm, appearing elsewhere herein and in the Registration Statement, given on the authority of said firm as experts in auditing and accounting.
The financial statements for the year ended September 30, 2014 included this in Prospectus and in the Registration Statement have been so included in reliance on the report of BDO AG Wirtschaftsprüfungsgesellschaft, an independent registered public accounting firm, appearing elsewhere herein and in the Registration Statement, given on the authority of said firm as experts in auditing and accounting.
WHERE YOU CAN FIND MORE INFORMATION
We have filed with the SEC a registration statement on Form S-1, including exhibits and schedules, under the Securities Act with respect to the shares of our common stock offered hereby. This prospectus, which constitutes a part of the registration statement, does not contain all of the information set forth in the registration statement or the exhibits and schedules filed therewith. For further information with respect to us and the common stock offered hereby, reference is made to the registration statement and the exhibits and schedules filed therewith. Statements contained in this prospectus regarding the contents of any contract or any other document that is filed as an exhibit to the registration statement are not necessarily complete, and each such statement is qualified in all respects by reference to the full text of such contract or other document filed as an exhibit to the registration statement.
Upon completion of this offering, we will become subject to the information and periodic and current reporting requirements of the Exchange Act, and, in accordance therewith, will file periodic and current reports, proxy statements and other information with the SEC. Such periodic and current reports, proxy statements and other information will be available to the public on the SEC’s website at www.sec.gov and free of charge through our website at www.kpfilms.com. To receive copies of public records not posted to the SEC’s website at prescribed rates, you may complete an online form at www.sec.gov, send a fax to (202) 772-9337 or submit a written request to the SEC, Office of FOIA/PA Operations, 100 F Street, N.E., Washington, D.C. 20549. Please call the SEC at 1-800-SEC-0330 for further information. Please note that our website address is provided as an inactive textual reference only. The information contained on, or accessible through, our website is not part of this prospectus and is therefore not incorporated by reference.
140
Table of Contents
INDEX TO CONSOLIDATED FINANCIAL STATEMENTS
F-1
Table of Contents
Report of Independent Registered Public Accounting Firm
Board of Directors and Stockholders
Kleopatra Holdings 2 S.C.A
Luxembourg
We have audited the accompanying consolidated balance sheets of Kleopatra Holdings 2 S.C.A. as of September 30, 2016 and 2015 and the related consolidated statements of operations, comprehensive income (loss), changes in shareholders’ deficit, and cash flows for the years then ended. These financial statements are the responsibility of the Company’s management. Our responsibility is to express an opinion on these financial statements based on our audits.
We conducted our audits in accordance with the standards of the Public Company Accounting Oversight Board (United States). Those standards require that we plan and perform the audit to obtain reasonable assurance about whether the financial statements are free of material misstatement. The Company is not required to have, nor were we engaged to perform, an audit of its internal control over financial reporting. Our audits included consideration of internal control over financial reporting as a basis for designing audit procedures that are appropriate in the circumstances, but not for the purpose of expressing an opinion on the effectiveness of the Company’s internal control over financial reporting. Accordingly, we express no such opinion. An audit also includes examining, on a test basis, evidence supporting the amounts and disclosures in the financial statements, assessing the accounting principles used and significant estimates made by management, as well as evaluating the overall financial statement presentation. We believe that our audits provide a reasonable basis for our opinion.
In our opinion, the consolidated financial statements referred to above present fairly, in all material respects, the financial position of Kleopatra Holdings 2 S.C.A. at September 30, 2016 and 2015, and the results of its operations and its cash flows for the years then ended, in conformity with accounting principles generally accepted in the United States of America.
/s/BDO USA, LLP
Richmond, Virginia
December 21, 2016
F-2
Table of Contents
Report of Independent Registered Public Accounting Firm
To the Board of Directors and Stockholders of
Kleopatra Holdings 2 S.C.A.
Luxembourg
We have audited the accompanying consolidated statements of operations, comprehensive income (loss), changes in shareholders’ deficit, and cash flows of Kleopatra Holdings 2 S.C.A. for the year ended September 30, 2014. These financial statements are the responsibility of the Company’s management. Our responsibility is to express an opinion on these financial statements based on our audit.
We conducted our audit in accordance with the standards of the Public Company Accounting Oversight Board (United States). Those standards require that we plan and perform the audit to obtain reasonable assurance about whether the financial statements are free of material misstatement. The Company is not required to have, nor were we engaged to perform, an audit of its internal control over financial reporting. Our audit included consideration of internal control over financial reporting as a basis for designing audit procedures that are appropriate in the circumstances, but not for the purpose of expressing an opinion on the effectiveness of the Company’s internal control over financial reporting. Accordingly, we express no such opinion. An audit also includes examining, on a test basis, evidence supporting the amounts and disclosures in the financial statements, assessing the accounting principles used and significant estimates made by management, as well as evaluating the overall financial statement presentation. We believe that our audit provides a reasonable basis for our opinion.
In our opinion, the consolidated financial statements referred to above present fairly, in all material respects, the results of operations and cash flows for Kleopatra Holdings 2 S.C.A. for the year ended September 30, 2014, in conformity with accounting principles generally accepted in the United States of America.
/s/ BDO AG Wirtschaftsprüfungsgesellschaft
Frankfurt am Main, Germany
December 21, 2016
F-3
Table of Contents
CONSOLIDATED STATEMENTS OF OPERATIONS
For the years ended September 30, 2016, 2015 and 2014
(US Dollars in thousands, except per share data)
| 2016 | 2015 | 2014 | ||||||||||
| Net sales |
$ | 1,403,454 | $ | 1,480,313 | $ | 1,620,807 | ||||||
| Cost of sales |
1,102,414 | 1,193,595 | 1,311,635 | |||||||||
|
|
|
|
|
|
|
|||||||
| Gross profit |
301,040 | 286,718 | 309,172 | |||||||||
| Selling, general and administrative expenses |
171,098 | 186,054 | 174,754 | |||||||||
| Other expenses, net |
28,194 | 10,856 | 12,853 | |||||||||
|
|
|
|
|
|
|
|||||||
| Operating income |
101,748 | 89,808 | 121,565 | |||||||||
| Interest and other debt expense, net |
93,260 | 482,333 | 158,853 | |||||||||
| Foreign currency gains and (losses) on financing |
(12,492 | ) | (6,941 | ) | 4,725 | |||||||
|
|
|
|
|
|
|
|||||||
| Loss before income taxes and equity income of equity method investees |
(4,004 | ) | (399,466 | ) | (32,563 | ) | ||||||
| Income tax expense/ (benefit) |
8,425 | (38,037 | ) | 19,407 | ||||||||
|
|
|
|
|
|
|
|||||||
| Loss before equity income of equity method investees |
(12,429 | ) | (361,429 | ) | (51,970 | ) | ||||||
| Equity income of equity method investees |
832 | 317 | 635 | |||||||||
|
|
|
|
|
|
|
|||||||
| Net loss |
$ | (11,597 | ) | $ | (361,112 | ) | $ | (51,335 | ) | |||
|
|
|
|
|
|
|
|||||||
| Basic and diluted net loss per share |
$ | (6.60 | ) | $ | (205.59 | ) | $ | (29.23 | ) | |||
|
|
|
|
|
|
|
|||||||
The notes form an integral part of these Consolidated Financial Statements
F-4
Table of Contents
CONSOLIDATED STATEMENTS OF COMPREHENSIVE LOSS
For the years ended September 30, 2016, 2015 and 2014
(US Dollars in thousands)
| 2016 | 2015 | 2014 | ||||||||||
| Net loss |
$ | (11,597 | ) | $ | (361,112 | ) | $ | (51,335 | ) | |||
| Other comprehensive income/(loss), net of tax: |
||||||||||||
| Defined benefit plans |
(10,934 | ) | (1,751 | ) | (5,861 | ) | ||||||
| Currency translation adjustments |
7,864 | 55,225 | 16,262 | |||||||||
| Derivative financial instruments |
(17 | ) | 113 | (42 | ) | |||||||
|
|
|
|
|
|
|
|||||||
| Total other comprehensive income/(loss), net of tax |
(3,087 | ) | 53,587 | 10,359 | ||||||||
|
|
|
|
|
|
|
|||||||
| Total comprehensive loss |
$ | (14,684 | ) | $ | (307,525 | ) | $ | (40,976 | ) | |||
|
|
|
|
|
|
|
|||||||
The notes form an integral part of these Consolidated Financial Statements
F-5
Table of Contents
CONSOLIDATED BALANCE SHEETS
As of September 30, 2016 and 2015
(US Dollars in thousands, except share data)
| 2016 | 2015 | |||||||
| Assets |
||||||||
| Current Assets: |
||||||||
| Cash |
$ | 116,008 | $ | 103,906 | ||||
| Restricted cash |
522 | 1,682 | ||||||
| Accounts receivable, net |
71,992 | 99,394 | ||||||
| Inventories, net |
106,926 | 106,590 | ||||||
| Other current assets |
89,381 | 57,122 | ||||||
|
|
|
|
|
|||||
| Total current assets |
384,829 | 368,694 | ||||||
| Property, plant and equipment, net |
385,170 | 361,993 | ||||||
| Goodwill |
199,577 | 199,680 | ||||||
| Intangible assets, net |
362,059 | 410,539 | ||||||
| Deferred income taxes |
13,428 | 5,438 | ||||||
| Restricted cash |
3,808 | 2,307 | ||||||
| Other assets |
2,985 | 13,257 | ||||||
|
|
|
|
|
|||||
| Total Assets |
$ | 1,351,856 | $ | 1,361,908 | ||||
|
|
|
|
|
|||||
| Liabilities & Shareholders’ Deficit |
||||||||
| Current Liabilities: |
||||||||
| Accounts payable |
$ | 167,330 | $ | 155,179 | ||||
| Short-term debt and current portion of long-term debt |
15,369 | 17,318 | ||||||
| Accrued compensation and related costs |
48,811 | 42,987 | ||||||
| Other accrued liabilities |
102,064 | 88,229 | ||||||
|
|
|
|
|
|||||
| Total current liabilities |
333,574 | 303,713 | ||||||
| Long term debt, net |
1,268,090 | 1,268,164 | ||||||
| Preferred equity certificates and tracking preferred equity certificates |
4,983 | 28,089 | ||||||
| Pension and other postretirement benefits |
46,568 | 38,713 | ||||||
| Deferred income taxes |
151,950 | 167,613 | ||||||
| Other long-term liabilities |
14,798 | 17,353 | ||||||
| Commitments and contingencies (Note 17) |
||||||||
| Shareholders’ equity: |
||||||||
| Common shares (€1.00 par value per share; 100,000,000,000 shares authorized, 1,756,490 shares issued and outstanding as at September 30, 2016 and 2015) |
2,303 | 2,303 | ||||||
| Additional paid-in capital |
10,832 | 2,518 | ||||||
| Accumulated deficit |
(520,535 | ) | (508,938 | ) | ||||
| Accumulated other comprehensive income |
39,293 | 42,380 | ||||||
|
|
|
|
|
|||||
| Total shareholders’ deficit |
(468,107 | ) | (461,737 | ) | ||||
|
|
|
|
|
|||||
| Total Liabilities & Shareholders’ Deficit |
$ | 1,351,856 | $ | 1,361,908 | ||||
|
|
|
|
|
|||||
The notes form an integral part of these Consolidated Financial Statements
F-6
Table of Contents
CONSOLIDATED STATEMENTS OF CHANGES IN SHAREHOLDERS’ DEFICIT
For the years ended September 30, 2016, 2015 and 2014
(US Dollars and shares in thousands)
|
Common shares |
Additional paid-in capital |
Accumulated deficit |
Accumulated other comprehensive income (loss) |
Total | ||||||||||||||||||||
| Shares | Amount | |||||||||||||||||||||||
| Balance as of September 30, 2013 |
1,756 | $ | 2,303 | $ | 2,518 | $ | (96,491 | ) | $ | (21,566 | ) | $ | (113,236 | ) | ||||||||||
| Net loss |
— | — | — | (51,335 | ) | — | (51,335 | ) | ||||||||||||||||
| Other comprehensive income |
— | — | — | — | 10,359 | 10,359 | ||||||||||||||||||
|
|
|
|
|
|
|
|
|
|
|
|
|
|||||||||||||
| Balance as of September 30, 2014 |
1,756 | 2,303 | 2,518 | (147,826 | ) | (11,207 | ) | (154,212 | ) | |||||||||||||||
| Net loss |
— | — | — | (361,112 | ) | — | (361,112 | ) | ||||||||||||||||
| Other comprehensive income |
— | — | — | — | 53,587 | 53,587 | ||||||||||||||||||
|
|
|
|
|
|
|
|
|
|
|
|
|
|||||||||||||
| Balance as of September 30, 2015 |
1,756 | 2,303 | 2,518 | (508,938 | ) | 42,380 | (461,737 | ) | ||||||||||||||||
| Net loss |
— | — | — | (11,597 | ) | — | (11,597 | ) | ||||||||||||||||
| Other comprehensive loss |
— | — | — | — | (3,087 | ) | (3,087 | ) | ||||||||||||||||
| Stock-based compensation |
— | — | 8,314 | — | — | 8,314 | ||||||||||||||||||
|
|
|
|
|
|
|
|
|
|
|
|
|
|||||||||||||
| Balance as of September 30, 2016 |
1,756 | $ | 2,303 | $ | 10,832 | $ | (520,535 | ) | $ | 39,293 | $ | (468,107 | ) | |||||||||||
|
|
|
|
|
|
|
|
|
|
|
|
|
|||||||||||||
The notes form an integral part of these Consolidated Financial Statements
F-7
Table of Contents
CONSOLIDATED STATEMENTS OF CASH FLOWS
For the years ended September 30, 2016, 2015 and 2014
(US Dollars in thousands)
| 2016 | 2015 | 2014 | ||||||||||
| Cash flows from operating activities: |
||||||||||||
| Net loss |
$ | (11,597 | ) | $ | (361,112 | ) | $ | (51,335 | ) | |||
| Adjustments to reconcile net loss to net cash provided by (used in) operating activities: |
||||||||||||
| Deferred income tax benefit |
(19,244 | ) | (102,232 | ) | (15,381 | ) | ||||||
| Depreciation, amortization and impairments |
97,683 | 105,916 | 112,320 | |||||||||
| Net (gain)/loss on sale of long-lived assets |
266 | (139 | ) | (702 | ) | |||||||
| Non-cash financing costs |
11,423 | (10,594 | ) | 81,806 | ||||||||
| Share based compensation |
8,527 | — | — | |||||||||
| Changes in operating assets and liabilities: |
||||||||||||
| Accounts receivable, net |
15,441 | 1,291 | (23,793 | ) | ||||||||
| Inventories |
6,845 | (3,125 | ) | 596 | ||||||||
| Accounts payable |
(1,151 | ) | (477 | ) | 6,013 | |||||||
| Other positions |
8,585 | 2,794 | (3,019 | ) | ||||||||
|
|
|
|
|
|
|
|||||||
| Net cash provided by/(used in) operating activities: |
116,778 | (367,678 | ) | 106,505 | ||||||||
|
|
|
|
|
|
|
|||||||
| Cash flows from investing activities: |
||||||||||||
| Capital expenditures |
(75,775 | ) | (36,271 | ) | (53,526 | ) | ||||||
| (Increase)/decrease in restricted cash related to investing activities |
— | 3,347 | (3,347 | ) | ||||||||
| Proceeds from sale of long-lived assets |
449 | 210 | 3,213 | |||||||||
|
|
|
|
|
|
|
|||||||
| Net cash used in investing activities |
(75,326 | ) | (32,714 | ) | (53,660 | ) | ||||||
|
|
|
|
|
|
|
|||||||
| Cash flows from financing activities |
||||||||||||
| Proceeds—senior secured term loan |
— | 963,371 | — | |||||||||
| Repayment—senior secured term loan |
(9,694 | ) | (317,043 | ) | (74,350 | ) | ||||||
| Proceeds from other borrowings |
33,728 | 3,439 | 2,896 | |||||||||
| Repayment of other borrowings |
(33,414 | ) | (9,635 | ) | (7,299 | ) | ||||||
| Capital lease payments |
(2,130 | ) | (2,049 | ) | (1,870 | ) | ||||||
| Proceeds—senior secured notes |
— | 324,661 | — | |||||||||
| Repayment—senior secured notes |
— | (275,961 | ) | — | ||||||||
| Proceeds—preferred equity certificates |
— | 781 | — | |||||||||
| Repayment—preferred equity certificates |
(15,542 | ) | (263,133 | ) | — | |||||||
| Refinancing costs |
(2,028 | ) | (27,408 | ) | — | |||||||
| Debt issuance and financing costs |
(1,047 | ) | (32,793 | ) | (1,778 | ) | ||||||
| Increase in restricted cash relating to financing activities |
— | — | (1,198 | ) | ||||||||
|
|
|
|
|
|
|
|||||||
| Net cash provided by/(used in) financing activities |
(30,127 | ) | 364,230 | (83,599 | ) | |||||||
|
|
|
|
|
|
|
|||||||
| Effect of exchange rate changes on cash |
777 | (9,454 | ) | (6,632 | ) | |||||||
| Cash: |
||||||||||||
| Net changes in cash |
12,102 | (45,616 | ) | (37,386 | ) | |||||||
| Balance at beginning of period |
103,906 | 149,522 | 186,908 | |||||||||
|
|
|
|
|
|
|
|||||||
| Balance at end of period |
$ | 116,008 | $ | 103,906 | $ | 149,522 | ||||||
|
|
|
|
|
|
|
|||||||
| Interest paid |
$ | 91,543 | $ | 506,702 | $ | 66,972 | ||||||
| Income taxes paid, net of refunds |
29,735 | 68,003 | 42,563 | |||||||||
The notes form an integral part of these Consolidated Financial Statements
F-8
Table of Contents
NOTES TO CONSOLIDATED FINANCIAL STATEMENTS
September 30, 2016, 2015 and 2014
(All monetary amounts in thousands, except per share data)
NOTE 1 NATURE OF THE BUSINESS AND SUMMARY OF SIGNIFICANT ACCOUNTING POLICIES
Nature of the Business
Kleopatra Holdings 2 S.C.A. (together with its subsidiaries, the “Company” or “Group”) is a producer of rigid plastic films used in the pharmaceutical industry, labelling, packaging and other specialty niche markets. The Group consists of 18 manufacturing facilities and 20 sales offices.
The Company was formed on June 21, 2012, when a group of investors led by Strategic Value Partners LLC (“SVP Investor Group”) acquired the rigid film business of Kleopatra Lux 2 S.à r.l via newly established Kleopatra Holdings 2 S.C.A.
As of September 30, 2016 and 2015, 1,756,489 common shares of Kleopatra Holdings 2 S.C.A. are held by Kleopatra Holdings 1 S.C.A. and 1 management share is held by Kleopatra Holdings GP S.A. Kleopatra Holdings 1 S.C.A. and Kleopatra Holdings GP S.A. are controlled by affiliates of funds managed by the SVP Investor Group.
Basis of Presentation
The Company’s consolidated financial statements include all subsidiaries in which Kleopatra Holdings 2 S.C.A. has the ability to exercise direct or indirect control over operating and financial policies. Intercompany transactions and balances are eliminated in consolidation.
The Company holds 50% of the voting rights in Vinyl Solutions LLC, Atlanta, Georgia, USA, a joint venture, which is accounted for using the equity method of accounting in accordance with ASC 323 Investments.
Use of Estimates
The preparation of consolidated financial statements in conformity with U.S. generally accepted accounting principles, or GAAP, requires management to make estimates and assumptions that affect the reported amount of assets and liabilities at the date of the financial statements as well as the reported amounts of revenue and expense during the reporting period. Estimates are used, among other things, for impairment testing of goodwill and long-lived assets, determining useful lives for depreciation and amortization of long-lived assets, measuring fair value of derivative financial instruments, pension plan assets and share-based compensation, accounting for pension and other postemployment benefits, slow-moving and obsolete inventory, allowance for doubtful accounts, deferred income tax assets, uncertain tax positions, bonuses due to employees, the fair value of Series 1 tracking preferred equity certificates (“TPECs”) and loss contingencies. Actual results may differ from those estimates.
Foreign Currency
The functional currency of Kleopatra Holdings 2 S.C.A. is the Euro and the functional currency of each subsidiary is the local currency for the country in which the subsidiaries conduct their primary operations.
Upon consolidation, assets and liabilities of subsidiaries that use a functional currency other than the U.S. Dollar, the reporting currency, are translated using the respective period-end exchange rate, and consolidated sales and expenses are translated using the respective average exchange rate. Foreign currency translation gains
F-9
Table of Contents
KLEOPATRA HOLDINGS 2 S.C.A.
NOTES TO CONSOLIDATED FINANCIAL STATEMENTS
September 30, 2016, 2015 and 2014
(All monetary amounts in thousands, except per share data)
and losses are included as a component of accumulated other comprehensive income (loss) within shareholders’ equity (deficit). Gains and losses resulting from foreign currency transactions, except those related to the Company’s foreign currency debt, are included in Other expense, net in the Consolidated Statements of Operations. Gains and losses resulting from foreign currency transactions related to the Company’s foreign currency debt are recognized in Foreign currency gains and (losses) on financing in the Consolidated Statements of Operations.
Revenue Recognition
Revenue is recognized when title and risk of ownership pass to the customer, persuasive evidence of an arrangement exists, delivery has occurred or services have been rendered, the sales price to the customer is fixed or determinable and collectability is reasonably assured. The Company deems that delivery has occurred when goods have been dispatched to the customer and that title and risk of ownership have passed to the customer when the goods have either reached the shipping point or destination in accordance with the respective contractual terms. Provisions for product returns are provided in the same period the related sales are recognized and accounted for as reductions of sales.
The Company has discount and rebate agreements with certain customers which are recorded as reductions of sales in the same period the related sales are recognized based on the contract terms. Accrued customer rebates are included in “Other accrued liabilities” in the Company’s Consolidated Balance Sheets.
Shipping and handling expenses are included in “Cost of sales,” and freight charged to customers is included in “Net sales” in the Company’s Consolidated Statements of Operations.
Research and Development
Research and development costs for new products are expensed as incurred and include salaries and other directly related expenses. Research and development costs for the years ended September 30, 2016, 2015, and 2014 were $11,259, $12,138 and $13,417, respectively, and are included in “Selling, general and administrative expenses” in the Company’s Consolidated Statements of Operations.
Income Taxes
Income taxes are accounted for under the asset and liability approach. Deferred tax assets and liabilities are recognized for the future tax consequences attributable to differences between the financial statement carrying amounts of assets and liabilities and their respective tax basis and operating loss and tax credit carryforwards. Assets and liabilities are measured using the enacted tax rates and laws that will be in effect when the differences are expected to reverse. The Company applies ASU No. 2015-17, Income taxes (Topic 740): Balance Sheet Classification of Deferred Taxes. As a result, deferred tax assets and liabilities are classified as noncurrent in a classified statement of financial position.
The company establishes a valuation allowance if, based on the weight of available evidence, it is more likely than not that some portion or all of the deferred tax assets will not be realized.
Uncertain tax positions are recognized when it is more likely than not that the tax position will be sustained upon examination by relevant taxing authorities, based on the technical merits of the position. The amount recognized is measured as the largest amount of benefit that is greater than 50% likely of being realized upon ultimate settlement.
F-10
Table of Contents
KLEOPATRA HOLDINGS 2 S.C.A.
NOTES TO CONSOLIDATED FINANCIAL STATEMENTS
September 30, 2016, 2015 and 2014
(All monetary amounts in thousands, except per share data)
The Company is subject to income taxes in numerous jurisdictions. The effective tax rate is dependent on enacted tax laws in jurisdictions in which it operates, the amount of taxable income by jurisdiction, and the ability to utilize interest and tax losses carried forward and foreign tax credits related to foreign taxes paid on foreign earnings.
Restricted Cash
Restricted cash comprises cash which is not available for immediate use and may not be utilized for any purpose until a certain event or events take place. A designation for short-term or long-term restricted cash is made based on the expected time of release or distribution.
Accounts Receivable, net
Accounts receivable are stated at the amount owed by the customer, net of an allowance for estimated uncollectible accounts, returns and cash discounts.
The allowance for doubtful accounts represents the Company’s best estimate of the amount of probable credit losses in existing accounts receivable. Accounts receivable and related allowances are based on analysis of amounts due from significant customers, historical write-off experience and current economic conditions. Receivables are charged to the allowance when determined to be no longer collectible.
The Company has entered into various factoring agreements which qualify for sale accounting in accordance with the Transfers and Servicing topic of the FASB codification.
Concentration of Credit Risk
The Company’s cash, cash equivalents and accounts receivable are potentially subject to concentration of credit risk. Cash and cash equivalents are placed with financial institutions that management believes are of high credit quality. Accounts receivable are derived from revenue earned from customers located in the U.S. and internationally and generally do not require collateral.
Financial Instruments, Derivatives and Hedging Activities
The Company enters into derivative instruments for risk management purposes only, including derivatives designated as hedging instruments under the ASC 815 Derivatives and Hedging and those not designated as hedging instruments for accounting purposes. From time to time, the Company uses foreign currency forward contracts, foreign currency options and interest rate swaps. For more information refer to Note 7. The Company does not engage in trading or other speculative uses of financial instruments.
Derivative financial instruments are recorded at fair value. Changes in fair values of derivatives are recognized in each period in earnings or other comprehensive income, depending on whether a derivative is designated as part of a hedge transaction and, if it is, the type of hedge transaction.
For derivative instruments that are designated and qualify as cash flow hedges, the effective portion of the gain or loss on the derivative instrument is reported as a component of “Accumulated other comprehensive income” (AOCI) and reclassified into earnings in the same line item associated with the forecasted transaction and in the same period or periods during which the hedged transaction affects earnings. If the hedging instrument no
F-11
Table of Contents
KLEOPATRA HOLDINGS 2 S.C.A.
NOTES TO CONSOLIDATED FINANCIAL STATEMENTS
September 30, 2016, 2015 and 2014
(All monetary amounts in thousands, except per share data)
longer meets the criteria for hedge accounting, expires or is sold, terminated or exercised, hedge accounting is discontinued prospectively. Amounts recorded in other comprehensive income are reclassified into earnings if it becomes probable that the hedged forecasted transaction will not occur by the end of the originally specified time period or within an additional two months.
For derivative instruments that are designated and qualify as fair value hedges, gains or losses from a derivative are recognized in income, in the period that the changes in fair value occur and simultaneously with the changes in the fair value of the hedged item attributable to the risk being hedged.
Inventories, Net
Inventories, including finished goods, work in progress, raw materials, supplies and spare parts are stated at the lower of cost and net realizable value. Cost for raw materials is principally determined on the average cost method. Work in progress and finished goods inventories are valued at the cost of raw material consumed plus direct manufacturing costs (such as labor, utilities and supplies) as incurred and an applicable portion of manufacturing overhead.
Inventories are stated net of an allowance for slow-moving and obsolete inventory.
Long-Lived Assets
Property, plant and equipment are stated at cost less accumulated depreciation and impairment. Enhancements and renewals that extend the life of the asset are capitalized; other repairs and maintenance charges are expensed as incurred. Depreciation is computed using the straight-line method over the estimated useful lives of the assets ranging from 15 to 50 years for buildings and improvements, 10 to 25 years for machinery and equipment, 3 to 10 years for internal use software and 3 to 10 years for other office and factory equipment. Land is not depreciated.
Definite-lived intangible assets are amortized over their estimated useful lives on a basis that corresponds to the respective asset’s use. The weighted average life for customer relationships is approximately 13 years, for the trademark 15 years and for technology approximately 9 years. The Company has no intangibles with indefinite lives other than goodwill.
Impairment of Long-lived Assets
The Company assesses long-lived assets, including property, plant and equipment and intangible assets with definite lives, for impairment whenever events or changes in circumstances indicate the carrying amount of the assets may not be fully recoverable. For the purposes of impairment testing, the assets are grouped at the lowest levels for which there are separately identifiable cash flows. An impairment exists if the estimate of future undiscounted cash flows generated by the assets is less than the carrying value of the assets. If impairment is determined to exist, any related impairment loss is then measured by comparing the fair value of the assets to their carrying amount.
Goodwill
Goodwill is reviewed annually for impairment as of August 31 and more frequently if circumstances indicate a possible impairment. Goodwill is tested for impairment at the reporting unit level, which for the Company is the operating segment level.
F-12
Table of Contents
KLEOPATRA HOLDINGS 2 S.C.A.
NOTES TO CONSOLIDATED FINANCIAL STATEMENTS
September 30, 2016, 2015 and 2014
(All monetary amounts in thousands, except per share data)
In performing the impairment test, the Company uses either a qualitative evaluation or a quantitative test. The qualitative evaluation considers factors such as the macroeconomic environment, business strategy changes and significant customer wins and losses. The first step of the quantitative test considers whether the fair value of a reporting unit exceeds its carrying value. The fair value of a reporting unit reflects a number of significant management assumptions and estimates including the Company’s forecast of sales volumes and prices, profit margins, income taxes, capital expenditures and changes in working capital requirements. Changes in these assumptions and/or discount rates could materially impact the estimated fair values.
When the Company estimates the fair value of a reporting unit, it does so using a discounted cash flow model based on management’s best estimate of projections of future years’ operating results and associated cash flows. Management’s projections related to revenue growth and/or margin improvements arise from a combination of factors, including expectations for volume growth with existing customers, product expansion, changes in raw material prices and labor costs, productivity gains, improvement in general economic conditions, increased operational capacity and customer retention. Projected future cash flows are then discounted to present value using a discount rate management believes is commensurate with the risks inherent in the cash flows.
If the fair value of a reporting unit exceeds the carrying value of the reporting unit’s net assets, including goodwill, there is no impairment. If not, and the carrying value of the reporting unit’s goodwill exceeds the implied fair value of that goodwill calculated in the second step of the quantitative test, an impairment charge is recognized for the excess. There was no impairment of Goodwill in the years ended September 30, 2016, 2015 and 2014.
Leases
The Company leases certain land and buildings and trucks, which qualify as capital leases. Capital leases are recorded at the lease’s inception at the lower of the fair value of the leased asset and the present value of the minimum lease payments. Liabilities under capital lease liabilities are classified into non-current and current portions based on the agreed payment schedule and discounted using the lessee’s implicit interest rate. Assets under capital lease are depreciated on a straight line basis over the lease term or the asset’s useful life if shorter.
Payments made under operating leases are charged to the Consolidated Statement of Operations on a straight-line basis over the period of the lease.
Borrowings
Borrowings are recognized initially at the amount of proceeds received, net of transaction costs incurred. Borrowings are subsequently stated at amortized cost, and any difference between proceeds (net of transaction costs) and the redemption value is recognized in the Consolidated Statement of Operations over the period of the borrowings using the effective interest method. Debt issuance costs including bank fees, original issuance discounts and transaction costs which are directly attributable to a borrowing arrangement are deducted from the carrying amount of the debt balance and are amortized using the effective interest method over the term of the related borrowing. The unamortized debt issuance costs related to the Company’s Senior Notes and Senior Secured Term Loan facilities (see Note 6—Debt) amounted to $23,233 and $29,831, respectively, as of September 30, 2016 and 2015, respectively.
Additionally, debt issuance costs relating to line-of-credit arrangements are deferred as an asset and subsequently amortized ratably over the term of the line-of-credit arrangement, regardless of whether there are
F-13
Table of Contents
KLEOPATRA HOLDINGS 2 S.C.A.
NOTES TO CONSOLIDATED FINANCIAL STATEMENTS
September 30, 2016, 2015 and 2014
(All monetary amounts in thousands, except per share data)
any outstanding borrowings on the line-of-credit arrangement. As a result, debt issuance costs incurred on the 2015 Revolving Credit Facility were capitalized during the year ended September 30, 2015 (see Note 6—Debt) and are being amortized over the remaining term of the facility.
Borrowings are classified as current liabilities when due on demand or due within 12 months from the balance sheet date.
Stock-Based Compensation
Stock-based compensation expense is measured as the grant date fair value of the award multiplied by the number of awards expected to vest at each reporting date. This expense is recognized ratably over the requisite service period of the award. Kleopatra Holdings 1, S.C.A grants restricted stock to employees of the cCompany. The fair value of the restricted stock is determined using the fair value of the related class of Kleopatra Holdings 1, S.C.A.’s stock on the date of grant.
The fair values of each of the classes of the Kleopatra Holding 1, S.C.A.’s restricted stock were estimated on each grant date. In order to determine the fair value of the restricted stock, a number of objective and subjective factors to determine the best estimate of the fair value of the related class of Kleopatra Holdings 1, S.C.A.’s stock were considered, including: (i) contemporaneous and, in certain cases retrospective, valuations of each of the classes of Kleopatra Holdings 1, S.C.A.’s stock performed by unrelated third-party valuation firms; (ii) the rights, preferences and privileges of Kleopatra Holdings 1, S.C.A.’s and the Company’s different classes of stock relative to those of Kleopatra Holdings 1, S.C.A.’s restricted stock; (iii) Kleopatra Holdings 1, S.C.A.’s and the Company’s results of operations, financial position and capital resources; (iv) current business conditions and projections; (v) the lack of marketability of Kleopatra Holdings 1, S.C.A.’s restricted stock prior to a liquidity event, such as an initial public offering or sale of the Company; (vi) the lack of transferability and other restrictions on the Kleopatra Holdings 1, S.C.A restricted stock post-vesting; (vii) the hiring of key personnel and the experience of management; (viii) the introduction of new products; (ix) the risk inherent in the development and expansion of the Company’s products; (x) Kleopatra Holdings 1, S.C.A.’s and the Company’s stage of development and material risks related to its business; and (xi) the likelihood of achieving a liquidity event, such as an initial public offering or sale of the Company, in light of prevailing market conditions. This approach is consistent with methods outlined in the AICPA Practice Aid, Valuation of Privately-held-Company Equity Securities Issued as Compensation.
In addition to the assumptions used in determining the fair value of the related class of the Kleopatra Holdings 1, S.C.A.’s stock, the Company must estimate a forfeiture rate to calculate the stock-based compensation for the Company’s awards. The Company’s forfeiture rate is based on an analysis of its actual forfeitures. The Company will continue to evaluate the appropriateness of the forfeiture rate based on actual forfeiture experience, analysis of employee turnover and other factors. Quarterly changes in the estimated forfeiture rate can have a significant impact on the stock-based compensation expense as the cumulative effect of adjusting the rate is recognized in the period the forfeiture estimate is changed. If a revised forfeiture rate is higher than the previously estimated forfeiture rate, an adjustment is made that will result in a decrease to the stock-based compensation expense recognized in the financial statements. If a revised forfeiture rate is lower than the previously estimated forfeiture rate, an adjustment is made that will result in an increase to the stock-based compensation expense recognized in the financial statements.
F-14
Table of Contents
KLEOPATRA HOLDINGS 2 S.C.A.
NOTES TO CONSOLIDATED FINANCIAL STATEMENTS
September 30, 2016, 2015 and 2014
(All monetary amounts in thousands, except per share data)
Pensions and Other Employee Benefits
The Company sponsors pension and other employee-related defined benefit plans (collectively, postretirement benefit plans) for employees.
Defined benefit plans are accounted for using the projected unit credit method. Under this method, the cost of providing pensions is charged to the statement of operations, so as to attribute the total pension cost over the service lives of employees in accordance with the benefit formula of the plan. Obligations under defined retirement benefit plans are calculated separately for each defined benefit plan by discounting the amounts of future benefits that employees have already earned through their service in the current and prior periods.
The following assumptions are used in the measurement of defined benefit plan obligations and net periodic benefit cost: discount rates, compensation increase rates, long-term expected rates of return on plan assets, mortality, disability and termination rates and other factors. Assumptions are developed using relevant Company-experience and market-related data for the countries in which the plans exist. The discount rate applied to the amounts of future benefits represents the yield of high-quality fixed-income investments. The expected long-term rates of return on plan assets are based on long-term expected inflation, interest rates, risk premiums and asset category allocations. The fair value of plan assets is estimated based on market prices or estimated fair value at the measurement date.
For unfunded plans, a pension liability is recognized, which is equal to the projected benefit obligation. For funded plans, the fair value of the plan assets is offset with the projected benefit obligations resulting in the net amount of pension liability. The market value of plan assets is measured at each reporting date.
Actuarial gains and losses and prior service costs or credits that have not yet been recognized through net income are recorded in accumulated other comprehensive income within shareholders’ equity, net of taxes, until they are amortized as a component of net periodic benefit cost.
Grants
The Company receives grants from government agencies in relation to property, plant and equipment for production purposes. Grant income is deferred on the balance sheet and released to the Consolidated Statement of Operations in accordance with the grant term and conditions.
Recently Adopted Accounting Pronouncements
The Company adopted Accounting Standard Update (ASU) No. 2015-03, Interest-Imputation of Interest (Subtopic 835-30): Simplifying the Presentation of Debt Issuance Costs and applied it to all periods presented in these financial statements. The amendments in this ASU require that debt issuance costs related to a recognized debt liability be presented in the balance sheet as a direct deduction from the carrying amount of that debt liability, consistent with debt discounts. ASU 2015-03 does not change the recognition and measurement requirements for debt issuance costs.
The Company adopted ASU No. 2015-15, Interest—Imputation of Interest (Subtopic 835-30), Presentation and Subsequent Measurement of Debt Issuance Costs Associated with Line-of-Credit Arrangements—Amendments to SEC Paragraphs Pursuant to Staff Announcement at June 18, 2015 EITF Meeting and applied it to all periods presented in these financial statements. The amendments in this ASU incorporate the SEC staff
F-15
Table of Contents
KLEOPATRA HOLDINGS 2 S.C.A.
NOTES TO CONSOLIDATED FINANCIAL STATEMENTS
September 30, 2016, 2015 and 2014
(All monetary amounts in thousands, except per share data)
announcement permitting debt issuance costs relating to line-of-credit arrangements to be deferred as an asset and subsequently amortized ratably over the term of the line-of-credit arrangement, regardless of whether there are any outstanding borrowings on the line-of-credit arrangement. The Company has elected to duly follow this presentation with regard to debt issuance costs incurred on the 2015 Revolving Credit Facility which were capitalized during the year ended September 30, 2015 (see Note 6—Debt).
The Company adopted ASU No. 2015-11, Inventory (Topic 330): Simplifying the Measurement of Inventory and applied it to all periods presented in these financial statements. This ASU simplifies the guidance on the subsequent measurement of inventory, excluding inventory measured using last-in, first out (LIFO) or the retail inventory method. Under the new standard, inventory is to be measured at the lower of cost and net realizable value. The Company did not previously use the LIFO or retail inventory method, and the valuation of inventory at the lower of cost and net realizable value did not change the Company’s current practice.
The Company adopted ASU No. 2015-17, Income taxes (Topic 740): Balance Sheet Classification of Deferred Taxes and applied it to all periods presented in these financial statements. Current GAAP requires an entity to separate deferred income tax assets and liabilities into current and noncurrent amounts in a classified statement of financial position. To simplify the presentation of deferred income taxes, the amendments in this ASU require that deferred tax assets and liabilities be classified as noncurrent in a classified statement of financial position.
The Company has adopted ASU No. 2016-16, Income taxes (Topic 740): Intra-Entity Transfers of Assets Other Than Inventory and applied it to all periods presented in these financial statements. Current GAAP requires an entity to defer the income tax effects of intercompany transfers of assets until the asset has been sold to an outside party or otherwise recognized. The new guidance within this ASU will require companies to defer the income tax effects only of intercompany transfers of inventory.
Recently Issued Accounting Pronouncements
On May 28, 2014, the FASB issued ASU No. 2014-09, Revenue from Contracts with Customers (Topic 606). Adoption of this ASU requires that an entity recognize revenue at an amount that reflects the consideration to which the entity expects to be entitled in exchange for transferring goods or services. When applying the principles of the ASU, entities will use a five-step model to 1) identify the contract(s) with a customer, 2) identify the performance obligations in the contract, 3) determine the transaction price, 4) allocate the transaction price to the performance obligations in the contract and 5) recognize revenue when (or as) the entity satisfies a performance obligation. On July 9, 2015, the FASB deferred the effective date by one year to December 15, 2017 for annual reporting periods beginning after that date and interim periods therein and permitted early adoption of the standard but not before the original effective date of December 15, 2016. The Company is currently evaluating the impact of adoption on the Company’s financial position, results of operations and cash flows.
On February 25, 2016, the FASB issued ASU No. 2016-02, Leases (Topic 842). Adoption of this ASU requires lessees to recognize assets and liabilities for most leases. For public business entities the guidance is effective for financial statements issued for annual periods beginning after December 15, 2018, and interim periods within those annual periods and early adoption is permitted. The Company is currently evaluating the impact of adoption on the Company’s financial position, results of operations and cash flows.
On June 16, 2016, the FASB issued ASU No. 2016-13, Credit Losses (Topic 326), Measurement of Credit Losses on Financial Instruments. The standard replaces the current “incurred loss” approach with an “expected
F-16
Table of Contents
KLEOPATRA HOLDINGS 2 S.C.A.
NOTES TO CONSOLIDATED FINANCIAL STATEMENTS
September 30, 2016, 2015 and 2014
(All monetary amounts in thousands, except per share data)
loss” model for instruments measured at amortized cost. For public business entities that meet the definition of an SEC filer, the standard is effective for annual periods beginning after December 15, 2019, and interim periods therein. The Company is currently evaluating the impact of adoption on the Company’s financial position, results of operations and cash flows.
On March 30, 2016, the FASB issued ASU No. 2016-09, Improvements to Employee Share-Based Payment Accounting, which simplifies several aspects of the accounting for employee share-based payment transactions for both public and nonpublic entities, including the accounting for income taxes, forfeitures and statutory tax withholding requirements, as well as classification in the statement of cash flows. The guidance is effective for annual and interim reporting periods therein beginning after December 15, 2016, with early adoption permitted. The Company is currently evaluating the impact of adoption on the Company’s financial position, results of operations and cash flows.
On August 26, 2016, the FASB issued ASU No. 2016-15, Statement of Cash Flows (Topic 230), Classification of Cash Receipts and Cash Payments , which is intended to reduce diversity in practice as it relates to how certain transactions are classified in the statement of cash flows, as previous guidance was either omitted or unclear. The new standard is effective for annual periods and interim periods within those annual periods, beginning after December 15, 2017. The Company is currently evaluating the impact of adoption on the Company’s consolidated financial statements. Other recently issued accounting pronouncements are not expected to have a material impact on the Company’s financial position, results of operations and cash flows.
NOTE 2 SUPPLEMENTAL INCOME STATEMENT INFORMATION
Other Expenses, Net
The Company recorded a net foreign exchange gain/ (loss) on operating activities in the line item “Other expenses, net” of $459, $744 and $(300) for the years ended September 30, 2016, 2015, and 2014, respectively.
Personnel expenses in the amount of $13,713, $5,760 and $6,845 for the years ended September 30, 2016, 2015 and 2014, respectively, relate to termination benefits. The termination benefits are primarily related to the re-organization of senior management.
NOTE 3 SUPPLEMENTAL BALANCE SHEET INFORMATION
Receivables, Net
All accounts receivable are due within one year and are non-interest bearing. Accounts receivable net of allowances was as follows as of September 30:
| 2016 | 2015 | |||||||
| Trade receivables |
$ | 77,739 | $ | 105,841 | ||||
| Less allowance |
(5,747 | ) | (6,447 | ) | ||||
|
|
|
|
|
|||||
| Accounts receivable, net |
$ | 71,992 | $ | 99,394 | ||||
|
|
|
|
|
|||||
F-17
Table of Contents
KLEOPATRA HOLDINGS 2 S.C.A.
NOTES TO CONSOLIDATED FINANCIAL STATEMENTS
September 30, 2016, 2015 and 2014
(All monetary amounts in thousands, except per share data)
The changes in the allowance for doubtful accounts were as follows for the years ended September 30:
| 2016 | 2015 | 2014 | ||||||||||
| Allowance for doubtful accounts, beginning |
$ | 6,447 | $ | 6,180 | $ | 5,121 | ||||||
| Bad debt expense |
418 | 2,016 | 2,350 | |||||||||
| Write-offs against allowance |
(1,024 | ) | (1,207 | ) | (1,025 | ) | ||||||
| Foreign currency translation |
(94 | ) | (542 | ) | (266 | ) | ||||||
|
|
|
|
|
|
|
|||||||
| Allowance for doubtful accounts, ending |
$ | 5,747 | $ | 6,447 | $ | 6,180 | ||||||
|
|
|
|
|
|
|
|||||||
As of September 30, 2016, the Company derecognized $172,209 of accounts receivable as a result of factoring arrangements ($142,758 as of September 30, 2015) and realized cash proceeds thereon of $146,665 ($121,051 as of September 30, 2015). The Company factors its receivables without recourse while retaining immaterial servicing obligations. The Company provides a separate reserve (purchase price retention reserve) to satisfy potential non-bad debt related deductions such as cash discounts. The purchase price retention reserve as of September 30, 2016 was $25,543 ($21,706 as of September 30, 2015) and is presented in “Other current assets.” Cash proceeds related to the sales are included in cash from operating activities in the Consolidated Statements of Cash Flows in changes in Accounts receivables, net. The Company incurred fees and interest expense relating to these factoring arrangements of $3,796, $3,836 and $4,272 for the years ended September 30, 2016, 2015 and 2014, respectively. Such fees and interest expense are recognized in Interest and other debt expense within the Statement of Operations.
As of September 30, 2016, $35,917 of accounts receivables are pledged as collateral for credit facilities and senior notes ($74,962 as of September 30, 2015).
Cash
As of September 30, 2016, $88,780 of cash was pledged as collateral for credit facilities and senior notes ($88,709 as of September 30, 2015).
Restricted Cash
As of September 30, 2016, restricted cash consists primarily of long-term cash collateral of $1,602 related to two workers’ compensation insurance programs ($1,600 as of September 30, 2015), classified as long-term in the Consolidated Balance Sheet and as an operating activity in the Consolidated Statement of Cash Flows, and a financial guarantee for a development loan provided to Pentaplast S.A. Portugal of $706, of which $282 ($707 as of September 30, 2015) is classified as long-term and $424 ($353 as of September 30, 2015) as short-term in the Consolidated Balance Sheet and is classified as a financing activity in the Consolidated Statement of Cash Flows.
Inventories, Net
The components of Inventories, net were as follows at September 30:
| 2016 | 2015 | |||||||
| Finished goods |
$ | 42,596 | $ | 42,792 | ||||
| Work in progress |
21,153 | 21,031 | ||||||
| Raw materials |
43,177 | 42,767 | ||||||
|
|
|
|
|
|||||
| Inventories, net |
$ | 106,926 | $ | 106,590 | ||||
|
|
|
|
|
|||||
F-18
Table of Contents
KLEOPATRA HOLDINGS 2 S.C.A.
NOTES TO CONSOLIDATED FINANCIAL STATEMENTS
September 30, 2016, 2015 and 2014
(All monetary amounts in thousands, except per share data)
The changes in the allowance for slow-moving and obsolete inventory were as follows for the years ended September 30:
| 2016 | 2015 | 2014 | ||||||||||
| Allowance for slow-moving and obsolete inventory, beginning |
$ | 12,086 | $ | 13,070 | $ | 15,483 | ||||||
| Additions to allowance |
1,119 | 1,008 | 1,064 | |||||||||
| Write-offs against allowance |
(117 | ) | (1,190 | ) | (3,047 | ) | ||||||
| Foreign currency translation |
349 | (802 | ) | (430 | ) | |||||||
|
|
|
|
|
|
|
|||||||
| Allowance for slow-moving and obsolete inventory, ending |
$ | 13,437 | $ | 12,086 | $ | 13,070 | ||||||
|
|
|
|
|
|
|
|||||||
As of September 30, 2016, $80,673 of inventories were pledged as collateral for credit facilities ($67,495 as of September 30, 2015).
Other Current Assets
As of September 30, 2016, $10,182 of other current assets (including certain amounts due from suppliers, recoverable taxes and prepayments) were pledged as security for credit facilities and senior notes ($5,100 as of September 30, 2015).
Other Noncurrent Liabilities
Other non-current liabilities include public and private grants received for investments in Portugal, China, UK and Brazil in the amount of $3,329 ($3,626 as of September 30, 2015), which are released as a gain to “Other expenses, net” in accordance with the respective grant terms. Other non-current liabilities also includes a non-interest bearing loan received from the Agency for Investment and External Commerce of Portugal in the amount of $3,464 ($3,843 as of September 30, 2015).
NOTE 4 PROPERTY, PLANT AND EQUIPMENT
The components of property, plant and equipment at September 30 were as follows:
| 2016 | 2015 | |||||||
| Land and buildings |
$ | 134,422 | $ | 134,014 | ||||
| Technical equipment and machinery |
369,855 | 345,828 | ||||||
| Factory and office equipment |
10,996 | 8,301 | ||||||
| Acquired software |
33,786 | 28,825 | ||||||
| Advance payments and construction-in-progress |
52,947 | 14,670 | ||||||
|
|
|
|
|
|||||
| Subtotal |
602,006 | 531,638 | ||||||
| Accumulated depreciation |
216,836 | 169,645 | ||||||
|
|
|
|
|
|||||
| Property, plant and equipment, net |
$ | 385,170 | $ | 361,993 | ||||
|
|
|
|
|
|||||
Land and buildings include amounts under capital lease of $7,061 ($8,327 as of September 30, 2015). The combined agreements require annual payments of approximately $515. See to Note 17 Commitments and Contingencies for information regarding future payment commitments for capital lease contracts.
F-19
Table of Contents
KLEOPATRA HOLDINGS 2 S.C.A.
NOTES TO CONSOLIDATED FINANCIAL STATEMENTS
September 30, 2016, 2015 and 2014
(All monetary amounts in thousands, except per share data)
Technical equipment and machinery include trucks under capital lease of $3,250 ($5,022 as of September 30, 2015) with initial lease terms of 3 to 5 years.
Depreciation expense, including the depreciation expense of assets under capital leases, for the years ended September 30, 2016, 2015 and 2014 amounted to $48,940, $56,197 and $57,300, respectively.
NOTE 5 GOODWILL AND OTHER INTANGIBLE ASSETS
Goodwill
The changes in the carrying amount of goodwill for the years ended September 30, 2016, 2015 and 2014 were as follows:
| Pharma | Labels | Specialties | Food & Consumer Packaging |
Total | ||||||||||||||||
| Balance as of October 1, 2013 |
$ | 68,897 | $ | 10,870 | $ | 53,344 | $ | 88,008 | $ | 221,119 | ||||||||||
| Foreign currency translation |
(2,681 | ) | 140 | (2,074 | ) | (3,420 | ) | (8,035 | ) | |||||||||||
|
|
|
|
|
|
|
|
|
|
|
|||||||||||
| Balance as of September 30, 2014 |
66,216 | 11,010 | 51,270 | 84,588 | 213,084 | |||||||||||||||
| Foreign currency translation |
(4,461 | ) | 233 | (3,460 | ) | (5,716 | ) | (13,404 | ) | |||||||||||
|
|
|
|
|
|
|
|
|
|
|
|||||||||||
| Balance as of September 30, 2015 |
61,755 | 11,243 | 47,810 | 78,872 | 199,680 | |||||||||||||||
| Foreign currency translation |
(34 | ) | 2 | (27 | ) | (44 | ) | (103 | ) | |||||||||||
|
|
|
|
|
|
|
|
|
|
|
|||||||||||
| Balance as of September 30, 2016 |
$ | 61,721 | $ | 11,245 | $ | 47,783 | $ | 78,828 | $ | 199,577 | ||||||||||
|
|
|
|
|
|
|
|
|
|
|
|||||||||||
The goodwill results solely from the acquisition of the Company in June 2012.
Other intangible assets
The components of other intangible assets, net were as follows at September 30:
| 2016 | 2015 | |||||||||||||||
| Gross amount |
Accumulated amortization |
Gross amount |
Accumulated amortization |
|||||||||||||
| Covenant not to compete |
$ | 201 | $ | 201 | $ | 200 | $ | 196 | ||||||||
| Customer list |
423,808 | 135,079 | 423,892 | 103,839 | ||||||||||||
| Patent, license and trademark |
38,268 | 10,842 | 38,305 | 8,298 | ||||||||||||
| Technology |
107,483 | 61,665 | 107,547 | 47,187 | ||||||||||||
| Other |
700 | 613 | 700 | 585 | ||||||||||||
|
|
|
|
|
|
|
|
|
|||||||||
| Total Other intangible assets |
$ | 570,460 | $ | 208,400 | $ | 570,644 | $ | 160,105 | ||||||||
|
|
|
|
|
|
|
|
|
|||||||||
Amortization expense for the years ended September 30, 2016, 2015 and 2014 amounted to $48,743, $49,719 and $55,020, respectively. Amortization expense is expected to be $46,629, $40,185, $38,690, $34,088 and $33,972 in each year from September 30, 2017 to September 30, 2021, respectively.
F-20
Table of Contents
KLEOPATRA HOLDINGS 2 S.C.A.
NOTES TO CONSOLIDATED FINANCIAL STATEMENTS
September 30, 2016, 2015 and 2014
(All monetary amounts in thousands, except per share data)
NOTE 6 DEBT
The Company had the following debt arrangements in place as of September 30:
| 2016 | 2015 | |||||||
| Current |
||||||||
| Senior secured term loan |
$ | 9,706 | $ | 9,709 | ||||
| Deferred debt issuance costs—senior secured term loan |
(162 | ) | (213 | ) | ||||
| Other bank borrowings |
5,825 | 7,822 | ||||||
|
|
|
|
|
|||||
| Short-term debt and current portion of long-term debt |
15,369 | 17,318 | ||||||
|
|
|
|
|
|||||
| Non-Current |
||||||||
| Senior secured notes |
334,830 | 335,166 | ||||||
| Deferred debt issuance costs—senior secured notes |
(7,203 | ) | (8,700 | ) | ||||
| Senior secured term loan |
948,754 | 958,694 | ||||||
| Deferred debt issuance costs—senior secured term loan |
(15,868 | ) | (20,918 | ) | ||||
| Other bank borrowings |
7,577 | 3,922 | ||||||
|
|
|
|
|
|||||
| Non-current Long-term debt |
1,268,090 | 1,268,164 | ||||||
|
|
|
|
|
|||||
| Total debt |
$ | 1,283,459 | $ | 1,285,482 | ||||
|
|
|
|
|
|||||
Senior Secured Term Loan
On April 28, 2015, various subsidiaries of the Company entered into a senior secured term loan (“2015 Senior Secured Term Loan”) with gross proceeds of €213,000 and $732,862 in conjunction with a refinancing.
The interest on the 2015 Senior Secured Term Loan is Libor + 400 bps (subject to a floor of 100 bps) for both the USD and the EUR tranches. The maturity date is April 28, 2020 and the Company is required to make repayments before this date subject to having excess cash, as defined in the agreement. The effective interest rate is 5.49%.
The 2015 Senior Secured Term Loan has affirmative and negative covenants customary for facilities of this type, for which the Company was in compliance with as of September 30, 2016 and 2015. The financial covenant is only in effect in the event that the 2015 Revolving Credit Facility (described below) is drawn by more than 32.5%.
The 2015 Senior Secured Term Loan is fully and unconditionally guaranteed on a joint and several basis by certain subsidiaries as defined in the Credit Agreement and is secured by first priority liens on collateral. The 2015 Senior Secured Term Loan is secured through pledges of essentially all material assets of the guaranteeing legal entities.
On June 21, 2012, various subsidiaries of the Company entered into a senior secured term loan (“2012 Senior Secured Term Loan”) with gross proceeds of $435,000. The interest on the 2012 Senior Secured Term Loan was most recently amended on February 11, 2014 to Libor + 375 bps subject to a floor of 100 bps with a maturity date of December 21, 2016. This loan was repaid on April 28, 2015 in conjunction with the Refinancing described below.
F-21
Table of Contents
KLEOPATRA HOLDINGS 2 S.C.A.
NOTES TO CONSOLIDATED FINANCIAL STATEMENTS
September 30, 2016, 2015 and 2014
(All monetary amounts in thousands, except per share data)
Senior Secured Notes
On April 28, 2015 as part of the Refinancing, the Company’s subsidiary, Klöckner Pentaplast of America, Inc., issued senior secured notes (“2015 Senior Secured Notes”) in the amount of €300,000 on a second priority basis with an interest of 7.125% per annum, due semi-annually, which mature on November 1, 2020. The notes are traded on the Euro MTF market of the Luxembourg Stock Exchange. The effective interest rate is 7.76%.
On July 20, 2012, the Company’s subsidiary, KP Germany Erste GmbH issued senior secured notes (“2012 Senior Secured Notes”) in the amount of €255,000 bearing interest of 11.625% per annum, due semi-annually, with a maturity date of July 20, 2017. The notes were traded on the Euro MTF market of the Luxembourg Stock Exchange. These notes were repaid in 2015 in conjunction with the Refinancing described below.
Revolving Credit Facility
On April 28, 2015, the Company entered into a revolving credit facility (“2015 Revolving Credit Facility”) in the amount of €100,000. The 2015 Revolving Credit Facility has not been drawn and matures on January 28, 2020.
On June 21, 2012, the Company entered into a revolving credit facility (“2012 Revolving Credit Facility”) in the amount of $65,000. As of September 30, 2014, the 2012 Revolving Credit Facility had not been drawn and had a maturity date of June 21, 2016. This facility was cancelled on April 28, 2015 in conjunction with the Refinancing described below.
The Refinancing
The gross proceeds from the issuance of the 2015 Senior Secured Term Loans and 2015 Senior Secured Notes and cash on hand were used to repay the 2012 Senior Secured Term Loan ($313,037), the 2012 Senior Secured Notes (€255,000) as well as prepayment penalties ($23,896) and accrued interest (€8,481 and $1,115), bank fees and original issuance discounts (€9,971 and $12,458), withholding taxes ($26,246), transaction fees and other expenses related to 2015 Senior Secured Term Loans and 2015 Senior Secured Notes and to repay certain PECs and TPECs ($704,320) owing to the equity holders (see Note 12).
No deferred debt issuance costs were capitalized during the year ended September 30, 2016. The following amounts have been capitalized in the year ended September 30, 2015 as deferred debt issuance costs as a result of the 2015 Senior Secured Term Loan and 2015 Senior Secured Notes:
| Currency | Dollar amount | |||||||
| Senior secured term loan |
USD tranche | $ | 17,863 | |||||
| Senior secured term loan |
EUR tranche | 5,797 | ||||||
| Senior secured notes |
EUR | 9,378 | ||||||
|
|
|
|||||||
| Deferred debt issuance costs |
$ | 33,038 | ||||||
|
|
|
|||||||
Deferred debt issuance costs in the amount of $1,778 were capitalized for the year ended September 30, 2014. The unamortized deferred debt issuance costs amounted to $23,233 and $29,831 as of September 30, 2016 and 2015, respectively.
F-22
Table of Contents
KLEOPATRA HOLDINGS 2 S.C.A.
NOTES TO CONSOLIDATED FINANCIAL STATEMENTS
September 30, 2016, 2015 and 2014
(All monetary amounts in thousands, except per share data)
Interest expense incurred on debt was as follows for the years ended September 30:
| 2016 | 2015 | 2014 | ||||||||||
| Senior secured term loan |
49,560 | $ | 30,889 | $ | 18,905 | |||||||
| Senior secured notes |
24,122 | 29,758 | 40,205 | |||||||||
| Amortization of deferred debt issuance costs |
7,177 | 25,659 | 13,244 | |||||||||
| Prepayment penalty |
— | 23,896 | — | |||||||||
| Other |
1,187 | 1,326 | 1,368 | |||||||||
|
|
|
|
|
|
|
|||||||
| Interest expenses |
$ | 82,046 | $ | 111,528 | $ | 73,722 | ||||||
|
|
|
|
|
|
|
|||||||
Of the total amortization recorded for the year ended September 30, 2015, $12,714 related to the early repayment of 2012 Senior Secured Term Loan and $4,520 related to the early repayment of the 2012 Senior Secured Notes.
The prepayment penalty incurred in the year ended September 30, 2015 is primarily related to the early repayment of the 2012 Senior Secured Notes.
Other borrowings represent facilities entered into locally by subsidiaries of the Company, including loan facilities, revolving credit facilities and overdrafts. A loan facility agreement entered into by the Company’s subsidiary in Thailand contains covenants including a debt to equity ratio not exceeding 1.5:1 and a debt service coverage ratio of no less than 1:1. The outstanding amount of the term loan was fully repaid on April 29, 2016. There are no other material covenants associated with other local facilities.
The Company’s debt was denominated in the following currencies:
| 2016 | 2015 | |||||||
| US Dollar |
$ | 723,701 | $ | 731,931 | ||||
| Euro |
575,749 | 572,538 | ||||||
| Brazilian Real |
7,242 | 7,211 | ||||||
| Thai Baht |
— | 3,040 | ||||||
| Argentinian Peso |
— | 592 | ||||||
|
|
|
|
|
|||||
| Debt (before unamortized deferred issuance costs) |
$ | 1,306,692 | $ | 1,315,312 | ||||
|
|
|
|
|
|||||
Maturity
Future maturities of long-term debt as of September 30, 2016 are as follows:
| Year ended September 30: |
Dollar Amount |
|||
| 2017 |
$ | 15,531 | ||
| 2018 |
11,959 | |||
| 2019 |
10,251 | |||
| 2020 |
929,901 | |||
| 2021 and thereafter |
339,050 | |||
|
|
|
|||
| $ | 1,306,692 | |||
|
|
|
|||
F-23
Table of Contents
KLEOPATRA HOLDINGS 2 S.C.A.
NOTES TO CONSOLIDATED FINANCIAL STATEMENTS
September 30, 2016, 2015 and 2014
(All monetary amounts in thousands, except per share data)
NOTE 7 DERIVATIVES AND HEDGING ACTIVITIES
The Company uses derivative financial instruments, such as foreign currency forward contracts and interest rate derivatives to hedge its exposure to interest rate and foreign currency risks. The Company does not use financial derivative instruments for speculative purposes.
The Company enters into foreign currency forward contracts to hedge transactions denominated in foreign currencies. These transactions are primarily forecasted revenues or purchases of raw materials. Foreign currency price risks are hedged for periods from four to six months within defined maturity bands. The foreign currency forward contracts are designated as the hedging instrument for cash flow hedges, fair value hedges, or not designated for hedge accounting as appropriate.
The Company enters into interest rate caps in order to manage interest rate risk exposure under the 2012 and 2015 Senior Secured Term Loans (see Note 6). As of September 30, 2016, the caps have strike rates of 2% to mitigate rising EUR and USD Libor rates and expire on September 30, 2018. The interest rate caps have not been designated for hedge accounting.
The following table sets forth the classification and fair values of the Company’s derivative instruments as of September 30:
| 2016 | 2015 | |||||||||||||||||||
| Balance sheet location |
Notional amount |
Fair value | Notional amount |
Fair value | ||||||||||||||||
| Derivatives designated as hedging instruments: |
||||||||||||||||||||
| Foreign currency forward contracts—cash flow hedge |
|
Other current assets |
|
$ | 3,480 | $ | 29 | $ | 3,403 | $ | 96 | |||||||||
| Foreign currency forward contracts—fair value hedges |
|
Other current liabilities |
|
— | — | 840 | (6 | ) | ||||||||||||
|
|
|
|
|
|
|
|
|
|||||||||||||
| $ | 3,480 | $ | 29 | $ | 4,243 | $ | 90 | |||||||||||||
|
|
|
|
|
|
|
|
|
|||||||||||||
| Derivatives not designated as hedging instruments: |
||||||||||||||||||||
| Foreign currency forward contracts |
|
Other current assets |
|
$ | 6,588 | $ | 222 | $ | 835 | $ | 69 | |||||||||
| Interest rate caps |
|
Other non- current assets |
|
524,963 | 107 | 774,722 | 1,753 | |||||||||||||
| Foreign currency forward contracts |
|
Other current liabilities |
|
5,055 | (22 | ) | 1,134 | (4 | ) | |||||||||||
|
|
|
|
|
|
|
|
|
|||||||||||||
| $ | 536,606 | $ | 307 | $ | 776,691 | $ | 1,818 | |||||||||||||
|
|
|
|
|
|
|
|
|
|||||||||||||
Losses on interest rate caps for the years ended September 30, 2016, 2015 and 2014 amounted to $1,642, $2,216 and $452, respectively, and are included in “Interest and other debt expense.”
F-24
Table of Contents
KLEOPATRA HOLDINGS 2 S.C.A.
NOTES TO CONSOLIDATED FINANCIAL STATEMENTS
September 30, 2016, 2015 and 2014
(All monetary amounts in thousands, except per share data)
NOTE 8 FAIR VALUE MEASUREMENTS
ASC 820 Fair Value Measurements and Disclosures establishes a valuation hierarchy for disclosure of the inputs to valuation used to measure fair value. This hierarchy prioritizes the inputs into three broad levels as follows:
| • | Level 1 inputs—quoted prices (unadjusted) in active markets for identical assets or liabilities. |
| • | Level 2 inputs—quoted prices for similar assets and liabilities in active markets or inputs that are observable for the asset or liability, either directly or indirectly through market corroboration, for substantially the full term of the financial instrument. |
| • | Level 3 inputs—unobservable inputs based on the Company’s own assumptions used to measure assets and liabilities at fair value. |
An asset or liability’s classification within the hierarchy is determined based on the lowest level input that is significant to the fair value measurement.
The following tables set forth information regarding the Company’s financial assets and financial liabilities that are measured at fair value on a recurring basis:
| Fair value as of September 30, 2016 |
Level 1 | Level 2 | Level 3 | |||||||||||||
| Derivatives designated as hedging instruments, net |
$ | 29 | $ | — | $ | 29 | $ | — | ||||||||
| Derivatives not designated as hedging instruments, net |
307 | — | 307 | — | ||||||||||||
| TPECs |
(4,983 | ) | — | — | (4,983 | ) | ||||||||||
| Postretirement benefit plan assets: |
||||||||||||||||
| Cash and short-term investments |
4,996 | 4,996 | — | — | ||||||||||||
| Debt securities |
21,585 | — | 21,585 | — | ||||||||||||
| Equity securities |
14,763 | 14,763 | — | — | ||||||||||||
| Real estate / property |
16,986 | — | — | 16,986 | ||||||||||||
|
|
|
|
|
|
|
|
|
|||||||||
| Total postretirement benefit plan assets |
$ | 58,330 | $ | 19,759 | $ | 21,585 | $ | 16,986 | ||||||||
|
|
|
|
|
|
|
|
|
|||||||||
| Fair value as of September 30, 2015 |
Level 1 | Level 2 | Level 3 | |||||||||||||
| Derivatives designated as hedging instruments, net |
$ | 90 | $ | — | $ | 90 | $ | — | ||||||||
| Derivatives not designated as hedging instruments, net |
1,818 | — | 1,818 | — | ||||||||||||
| TPECs |
(3,356 | ) | — | — | (3,356 | ) | ||||||||||
| Postretirement benefit plan assets: |
||||||||||||||||
| Cash and short-term investments |
4,975 | 4,975 | — | — | ||||||||||||
| Insurance contracts |
4,659 | — | 4,659 | — | ||||||||||||
| Debt securities |
19,525 | — | 19,525 | — | ||||||||||||
| Equity securities |
15,068 | 15,068 | — | — | ||||||||||||
| Real estate / property |
17,145 | — | — | 17,145 | ||||||||||||
|
|
|
|
|
|
|
|
|
|||||||||
| Total postretirement benefit plan assets |
$ | 61,372 | $ | 20,043 | $ | 24,184 | $ | 17,145 | ||||||||
|
|
|
|
|
|
|
|
|
|||||||||
The fair value of interest rate swaps is calculated based on the present value of the estimated future cash flows. The fair value of foreign currency forward contracts is determined using forward exchange market rates at the balance sheet date.
F-25
Table of Contents
KLEOPATRA HOLDINGS 2 S.C.A.
NOTES TO CONSOLIDATED FINANCIAL STATEMENTS
September 30, 2016, 2015 and 2014
(All monetary amounts in thousands, except per share data)
The fair value of the TPECs is calculated using significant unobservable inputs (Level 3) and is based on the present value of the estimated future cash flows using the yield method, which is determined to equal the principal plus interest as of each measurement date due to the Company’s incentive and ability to repay the TPECs prior to incurring additional returns upon the achievement of events described in Note 12. Changes in the fair value of the TPECs relate entirely to interest incurred and payments made during each measurement period. Refer to Note 12 for further information of the TPECs.
Postretirement benefit plan assets include cash and short term investments, debt and equity securities and directly held real estate/property. Refer to Note 9 for more information on the Company’s investment strategies.
Fair value of debt and equity securities is based on market values for identical or similar instruments. Real estate comprises of leased residential properties, for which fair value is determined using discounted cash flow model based on future rental income.
The change in value of the plan assets using significant unobservable inputs (Level 3) is related entirely to changes in fair value measurements as of September 30, 2016 and 2015. There were no purchases or sales of real estate and no transfer to or from Level 3 for the year ended September 30, 2016 and 2015.
The following table sets forth the carrying amounts and fair values of the Company’s significant financial instruments where the carrying amount differs from the fair value.
The fair value of financial assets and liabilities as of September 30 were as follows:
| 2016 | 2015 | |||||||||||||||
| Carrying amount |
Fair value | Carrying amount |
Fair value | |||||||||||||
| Long-term debt |
||||||||||||||||
| Senior secured term loans |
$ | 942,430 | $ | 968,940 | $ | 947,272 | $ | 971,023 | ||||||||
| Senior secured notes |
327,627 | $ | 353,246 | 326,466 | 343,166 | |||||||||||
The fair value of long-term debt is based on level 1 inputs and is calculated as the outstanding principal amount multiplied by the price quotations at the reporting date. The fair value of the senior secured notes is based on level 1 inputs and is calculated as the nominal value multiplied by the price quotations at the reporting date.
The carrying value of cash and cash equivalents, accounts receivable, accounts payable and PECs approximates fair value. The fair value of the PECs were estimated using inputs derived principally from market observable data, including current rates offered to the Company for debt of the same or similar remaining maturities. Within the hierarchy of fair value measurements, these are level 2 inputs.
NOTE 9 PENSIONS AND OTHER POSTRETIREMENT BENEFITS
Defined Benefit Plans
The Company provides various defined benefit pension plans, with the most significant plans being non-contributory plans in Germany and contributory plans in Switzerland and the Netherlands, representing 99% of the Company’s defined benefit liability and 100% of benefit plan assets. The Company uses September 30 as a measurement date for these retirement plans. On December 31, 2015, the defined benefit plan in the Netherlands was reclassified as a defined contribution plan due to a change implemented by the Company in the way plan participants are remunerated.
F-26
Table of Contents
KLEOPATRA HOLDINGS 2 S.C.A.
NOTES TO CONSOLIDATED FINANCIAL STATEMENTS
September 30, 2016, 2015 and 2014
(All monetary amounts in thousands, except per share data)
The components of net periodic benefit cost for the years ended September 30 include the following:
| 2016 | 2015 | 2014 | ||||||||||
| Service cost |
$ | 1,930 | $ | 2,146 | $ | 2,123 | ||||||
| Interest cost |
1,362 | 1,888 | 2,687 | |||||||||
| Expected return on plan assets |
(1,285 | ) | (1,818 | ) | (2,171 | ) | ||||||
| Amortization: |
||||||||||||
| Prior service cost |
(80 | ) | (55 | ) | (67 | ) | ||||||
| Actuarial loss/(gain) |
44 | (13 | ) | 5 | ||||||||
| Other |
— | — | 8 | |||||||||
|
|
|
|
|
|
|
|||||||
| Net periodic benefit cost |
$ | 1,971 | $ | 2,148 | $ | 2,585 | ||||||
|
|
|
|
|
|
|
|||||||
The following tables set forth the defined benefit plans’ obligations and assets at September 30:
| 2016 | 2015 | |||||||
| Change in Benefit Obligation |
||||||||
| Benefit obligation at October 1 |
$ | (100,346 | ) | $ | (105,769 | ) | ||
| Service cost |
(1,930 | ) | (2,146 | ) | ||||
| Interest cost |
(1,362 | ) | (1,888 | ) | ||||
| Plan participant contributions |
(542 | ) | (596 | ) | ||||
| Plan amendments |
— | 264 | ||||||
| Plan settlement |
11,694 | — | ||||||
| Actuarial loss |
(15,487 | ) | (3,744 | ) | ||||
| Benefits paid |
4,250 | 6,195 | ||||||
| Impact of foreign exchange rates |
(735 | ) | 7,321 | |||||
| Other |
— | 17 | ||||||
|
|
|
|
|
|||||
| Benefit obligation at September 30 |
$ | (104,458 | ) | $ | (100,346 | ) | ||
|
|
|
|
|
|||||
| 2016 | 2015 | |||||||
| Change in Plan Assets |
||||||||
| Plan assets at October 1 |
$ | 61,633 | $ | 63,488 | ||||
| Actual return on plan assets |
2,244 | 2,941 | ||||||
| Company contributions |
910 | 981 | ||||||
| Plan participant contributions |
542 | 596 | ||||||
| Benefits paid |
(2,729 | ) | (4,589 | ) | ||||
| Plan settlement |
(4,695 | ) | — | |||||
| Expenses paid |
— | (5 | ) | |||||
| Impact of foreign exchange rates |
(15 | ) | (1,779 | ) | ||||
|
|
|
|
|
|||||
| Plan assets at September 30 |
$ | 57,890 | $ | 61,633 | ||||
|
|
|
|
|
|||||
| Net funded status |
$ | (46,568 | ) | $ | (38,713 | ) | ||
|
|
|
|
|
|||||
| Net defined benefit plan assets of overfunded plans |
$ | 539 | $ | 5,238 | ||||
| Net defined benefit obligation of underfunded plans |
$ | (47,107 | ) | $ | (43,951 | ) | ||
|
|
|
|
|
|||||
F-27
Table of Contents
KLEOPATRA HOLDINGS 2 S.C.A.
NOTES TO CONSOLIDATED FINANCIAL STATEMENTS
September 30, 2016, 2015 and 2014
(All monetary amounts in thousands, except per share data)
Plan assets as at October 1, 2015 does not include those attributable to the Company’s defined benefit plan in the Netherlands, since the Company converted that plan from a defined benefit plan to a defined contribution plan
| 2016 | 2015 | |||||||
| Total Recognized Amounts in the Consolidated Balance Sheets |
||||||||
| Noncurrent assets |
$ | 539 | $ | 5,238 | ||||
| Current liabilities |
(1,586 | ) | (1,577 | ) | ||||
| Noncurrent liabilities |
(45,521 | ) | (42,374 | ) | ||||
|
|
|
|
|
|||||
| Total |
$ | (46,568 | ) | $ | (38,713 | ) | ||
|
|
|
|
|
|||||
Items not yet recognized as a component of net periodic benefit cost that are included in Accumulated Other Comprehensive Income/ (Loss) as of September 30 are as follows:
| 2016 | 2015 | |||||||
| Net actuarial loss |
$ | (9,725 | ) | $ | (3,366 | ) | ||
| Prior service cost |
(114 | ) | (188 | ) | ||||
|
|
|
|
|
|||||
| Total |
$ | (9,839 | ) | $ | (3,554 | ) | ||
|
|
|
|
|
|||||
The amounts recognized in Other Comprehensive Income/ (Loss) for the years ended September 30 include the following:
| 2016 | 2015 | 2014 | ||||||||||
| Adjustments arising during the period: |
||||||||||||
| Net actuarial loss |
$ | (14,527 | ) | $ | (2,621 | ) | $ | (9,045 | ) | |||
| Prior service credit |
— | 381 | 457 | |||||||||
| Reversal of amortization: |
||||||||||||
| Net actuarial (gain)/loss |
44 | (13 | ) | 5 | ||||||||
| Prior service credit |
(80 | ) | (55 | ) | (66 | ) | ||||||
|
|
|
|
|
|
|
|||||||
| Total recognized in other comprehensive loss |
$ | (14,563 | ) | $ | (2,308 | ) | $ | (8,649 | ) | |||
|
|
|
|
|
|
|
|||||||
| Total recognized in net periodic benefit cost and other comprehensive loss |
$ | (16,534 | ) | $ | (4,456 | ) | $ | (11,234 | ) | |||
|
|
|
|
|
|
|
|||||||
Of the amounts included in Accumulated Other Comprehensive Income/(Loss) as of September 30, 2016, the portions the Company expects to recognize as components of net periodic benefit cost in 2017 are as follows:
| Amount | ||||
| Net actuarial loss |
$ | (901 | ) | |
| Prior service cost |
(80 | ) | ||
|
|
|
|||
| Total |
$ | (981 | ) | |
|
|
|
|||
F-28
Table of Contents
KLEOPATRA HOLDINGS 2 S.C.A.
NOTES TO CONSOLIDATED FINANCIAL STATEMENTS
September 30, 2016, 2015 and 2014
(All monetary amounts in thousands, except per share data)
The benefits expected to be paid from our pension and other postretirement benefit plans, which reflect future years of service, are as follows:
| Year ended September 30, |
Amount | |||
| 2017 |
$ | 4,173 | ||
| 2018 |
4,195 | |||
| 2019 |
4,239 | |||
| 2020 |
4,297 | |||
| 2021 |
4,302 | |||
| Five year period ended September 30, 2026 |
21,540 | |||
The Company made contributions of $910 and $981 to its pension plans during 2016 and 2015, respectively. For 2017, the Company expects to make contributions of $695 to its pension plans.
The following tables set forth the major actuarial assumptions used in determining the benefit obligations, plan assets and net periodic cost:
| Weighted-average assumptions used to determine benefit |
Germany | Switzerland | Netherlands | |||||||||
| Discount rate |
||||||||||||
| 2016 |
1.25 | % | 0.10 | % | n/a | |||||||
| 2015 |
2.25 | % | 0.80 | % | 2.25 | % | ||||||
| Rate of compensation increase |
||||||||||||
| 2016 |
1.75 | % | 2.00 | % | n/a | |||||||
| 2015 |
2.50 | % | 2.20 | % | 2.75 | % | ||||||
| Weighted-average assumptions used to determine net periodic |
Germany | Switzerland | Netherlands | |||||||||
| Discount rate |
||||||||||||
| 2016 |
1.25 | % | 0.10 | % | n/a | |||||||
| 2015 |
2.75 | % | 1.40 | % | 3.00 | % | ||||||
| 2014 |
3.50 | % | 2.30 | % | 3.40 | % | ||||||
| Expected long-term rate of return |
||||||||||||
| 2016 |
2.50 | % | 2.30 | % | n/a | |||||||
| 2015 |
2.75 | % | 2.90 | % | 2.25 | % | ||||||
| 2014 |
3.50 | % | 3.50 | % | 3.00 | % | ||||||
| Rate of compensation increase |
||||||||||||
| 2016 |
1.75 | % | 2.00 | % | n/a | |||||||
| 2015 |
2.50 | % | 2.20 | % | 2.75 | % | ||||||
| 2014 |
2.75 | % | 2.50 | % | 2.75 | % | ||||||
The Company adjusts its discount rates at the end of each fiscal year based on yield curves of high-quality debt instruments over durations that match the expected benefit payouts of each plan. In evaluating the expected return on plan assets, the Company considered its historical assumptions compared with actual results, an analysis of current market conditions, asset allocations and the views of advisors. The return on plan assets is derived from target allocations and historical yield by asset type. The assumed rate of compensation increase reflects historical experience and management’s expectations regarding future salary and incentive increases.
F-29
Table of Contents
KLEOPATRA HOLDINGS 2 S.C.A.
NOTES TO CONSOLIDATED FINANCIAL STATEMENTS
September 30, 2016, 2015 and 2014
(All monetary amounts in thousands, except per share data)
The following table sets forth the weighted-average asset allocations of the Company’s retirement plans at September 30 by asset category:
| 2016 | 2015 | |||||||||||||||||||||
| Asset Category |
Germany | Switzerland | Netherlands |
Germany | Switzerland | Netherlands | ||||||||||||||||
| Cash and short-term investments |
100 | % | 0 | % | n/a | 100 | % | 0 | % | 0 | % | |||||||||||
| Insurance contracts |
0 | % | 0 | % | n/a | 0 | % | 0 | % | 100 | % | |||||||||||
| Debt securities |
0 | % | 36 | % | n/a | 0 | % | 35 | % | 0 | % | |||||||||||
| Equity securities |
0 | % | 26 | % | n/a | 0 | % | 27 | % | 0 | % | |||||||||||
| Real estate / property |
0 | % | 30 | % | n/a | 0 | % | 32 | % | 0 | % | |||||||||||
| Other |
0 | % | 8 | % | n/a | 0 | % | 6 | % | 0 | % | |||||||||||
|
|
|
|
|
|
|
|
|
|
|
|
||||||||||||
| Total |
100 | % | 100 | % | n/a | 100 | % | 100 | % | 100 | % | |||||||||||
|
|
|
|
|
|
|
|
|
|
|
|
||||||||||||
The Pension Fund of Klöckner Pentaplast AG (Swiss pension fund) employs a total return investment approach whereby a diversified blend of directly-held, leased residential property in Switzerland, fixed income and equity investments are used to maximize the long-term return of plan assets for a prudent level of risk. Risk tolerance is established through careful consideration of plan liabilities and the plan funded status. Furthermore, equity investments are diversified across markets, as well as growth, value and small and large capitalizations. Investment risk is measured and monitored on an ongoing basis through plan investment rules, semi-annual investment portfolio reviews, annual liability measurements and periodic asset/liability studies.
The Company’s approach to developing the expected long-term rate of return on pension plan assets is based on fair values and combines an analysis of historical investment performance by asset class, the Company’s investment guidelines and current and expected economic fundamentals.
The Company also provides early retirement benefits and long term service awards to employees in Germany. The early retirement benefit obligation is covered by an insurance plan, with the surplus being $690 and $1,931 for the years ending September 30, 2016 and 2015, respectively.
Employees in Germany who joined prior to September 1, 1996 are entitled to the long term service awards. The accrual for these awards was $2,037 and $2,023 for the years ending September 30, 2016 and 2015, respectively.
Defined Contribution Plans
The Company sponsors several defined contribution plans, the most significant of which are 401(k) in the USA, registered retirement saving plan (RRSP) in Canada, life insurance benefits to management employees in the USA and a pension plan in Germany funded by contributions to a third party pension fund (Höchster Pensionskasse). The Company also participates in a multi-employer defined contribution plan (Höchster Pensionskasse VVaG) in Germany. Contribution expense for these plans was $4,129, $3,888 and $4,263 for the years ended September 30, 2016, 2015 and 2014, respectively, of which contribution expense for the multi-employer plan was $293, $263 and $316 for the years ended September 30, 2016, 2015 and 2014, respectively.
F-30
Table of Contents
KLEOPATRA HOLDINGS 2 S.C.A.
NOTES TO CONSOLIDATED FINANCIAL STATEMENTS
September 30, 2016, 2015 and 2014
(All monetary amounts in thousands, except per share data)
NOTE 10 INCOME TAXES
Income/(loss) before taxes, including equity income from equity method investees, was categorized by jurisdiction as follows:
| Luxembourg | Non-Luxembourg | Total | ||||||||||
| For the year ended |
||||||||||||
| September 30, 2016 |
$ | (16,639 | ) | $ | 13,467 | $ | (3,172 | ) | ||||
| September 30, 2015 |
(368,226 | ) | (30,923 | ) | (399,149 | ) | ||||||
| September 30, 2014 |
(69,312 | ) | 37,384 | (31,928 | ) | |||||||
The provision for (benefit from) income taxes was categorized by jurisdiction as follows:
| Luxembourg | Non-Luxembourg | Total | ||||||||||
| For the year ended |
||||||||||||
| September 30, 2016 |
||||||||||||
| Current |
$ | 281 | $ | 27,388 | $ | 27,669 | ||||||
| Deferred |
(175 | ) | (19,069 | ) | (19,244 | ) | ||||||
|
|
|
|
|
|
|
|||||||
| Total |
$ | 106 | $ | 8,319 | $ | 8,425 | ||||||
|
|
|
|
|
|
|
|||||||
| September 30, 2015 |
||||||||||||
| Current |
$ | 369 | $ | 63,826 | $ | 64,195 | ||||||
| Deferred |
(79,332 | ) | (22,900 | ) | (102,232 | ) | ||||||
|
|
|
|
|
|
|
|||||||
| Total |
$ | (78,963 | ) | $ | 40,926 | $ | (38,037 | ) | ||||
|
|
|
|
|
|
|
|||||||
| September 30, 2014 |
||||||||||||
| Current |
$ | 191 | $ | 34,597 | $ | 34,788 | ||||||
| Deferred |
(903 | ) | (14,478 | ) | (15,381 | ) | ||||||
|
|
|
|
|
|
|
|||||||
| Total |
$ | (712 | ) | $ | 20,119 | $ | 19,407 | |||||
|
|
|
|
|
|
|
|||||||
Deferred income tax charged directly to equity, other comprehensive income, amounted to $6,137, $1,822 and $1,745 for the years ended September 30, 2016, 2015 and 2014, respectively.
F-31
Table of Contents
KLEOPATRA HOLDINGS 2 S.C.A.
NOTES TO CONSOLIDATED FINANCIAL STATEMENTS
September 30, 2016, 2015 and 2014
(All monetary amounts in thousands, except per share data)
Effective Tax Rate Reconciliation
The domestic tax rate of Luxembourg was used in the effective tax rate reconciliation because the Company is headquartered in Luxembourg. The principal reconciling items from income tax computed at the Luxembourg statutory tax rate of 29.22% for the years ended September 30 were as follows:
| 2016 | 2015 | 2014 | ||||||||||
| Tax computed at weighted statutory rate |
$ | (927 | ) | $ | (116,631 | ) | $ | (9,330 | ) | |||
| Changes in valuation allowances on deferred tax assets |
16,818 | 33,305 | 21,280 | |||||||||
| Non-deductible items |
1,608 | 16,841 | 12,788 | |||||||||
| Non-taxable items |
(985 | ) | — | — | ||||||||
| Tax valuation change |
(11,978 | ) | — | (4,130 | ) | |||||||
| Effects from different tax rates to Luxembourg rate |
1,052 | 1,765 | (2,537 | ) | ||||||||
| Adjustments for current tax of prior periods |
1,881 | (1,153 | ) | 1,336 | ||||||||
| Withholding taxes |
— | 26,246 | — | |||||||||
| Other |
956 | 1,590 | — | |||||||||
|
|
|
|
|
|
|
|||||||
| Income tax expense/(benefit) |
$ | 8,425 | $ | (38,037 | ) | $ | 19,407 | |||||
|
|
|
|
|
|
|
|||||||
A significant portion of tax expense for the year ended September 30, 2016 is related to additional valuation expense of $16,818 (€15,128) recorded against the additional net operating losses and carried forward interest that were recorded during the year.
A significant portion of tax expense for the year ended September 30, 2015 is related to withholding taxes of $26,246 on the dividend payment of Klöckner Pentaplast of America, Inc. as a prerequisite for the refinancing of the group. Additionally, there was additional valuation expense of $33,305 (€28,982) recorded against the additional net operating losses and carried forward interest that were recorded during the same year.
The Company operates in several jurisdictions outside of Luxembourg. The US is typically one of the larger jurisdictions; however, in 2014 the UK, which has an effective tax rate lower than the Luxembourg rate, had a large amount of income which caused an overall decrease in the effective tax rate.
In the year ended September 30, 2016 and September 30, 2014, Klöckner Pentaplast Schweiz AG, a subsidiary of the Company, incurred a valuation change of which the tax effect was $11,978 and $4,130, respectively, on its investment in Klöckner Pentaplast Ltd, another subsidiary of the Company. The change on the valuation was a tax deductible item in Switzerland.
F-32
Table of Contents
KLEOPATRA HOLDINGS 2 S.C.A.
NOTES TO CONSOLIDATED FINANCIAL STATEMENTS
September 30, 2016, 2015 and 2014
(All monetary amounts in thousands, except per share data)
Deferred Income Tax Assets and Liabilities
The primary components of deferred income tax assets and liabilities as of September 30 were as follows:
| 2016 | 2015 | |||||||
| Deferred tax assets: |
||||||||
| Accounts receivable |
$ | 587 | $ | 181 | ||||
| Inventories |
4,161 | 1,197 | ||||||
| Financial instruments |
2,882 | 196 | ||||||
| Other current assets |
5,593 | 2,947 | ||||||
| Intangible assets |
8,469 | 1,070 | ||||||
| Property, plant and equipment |
6,316 | 1,808 | ||||||
| Accounts payable |
1,492 | 914 | ||||||
| Provision for pensions |
7,875 | 4,409 | ||||||
| Other provisions |
11,894 | 13,544 | ||||||
| Other liabilities |
9,912 | 7,788 | ||||||
| Carryforward interest expense deduction |
43,231 | 57,041 | ||||||
| Tax loss and other tax loss carryforward |
46,694 | 42,165 | ||||||
|
|
|
|
|
|||||
| Deferred tax assets |
149,106 | 133,260 | ||||||
|
|
|
|
|
|||||
| Valuation allowance |
(88,913 | ) | (95,765 | ) | ||||
|
|
|
|
|
|||||
| Total deferred tax assets |
$ | 60,193 | $ | 37,495 | ||||
|
|
|
|
|
|||||
| Deferred tax liabilities: |
||||||||
| Accounts receivable |
$ | 58 | $ | 442 | ||||
| Inventories |
5,503 | 204 | ||||||
| Financial instruments |
12,544 | 7,827 | ||||||
| Financing |
587 | 764 | ||||||
| Other current assets |
1,135 | 512 | ||||||
| Intangible assets |
126,333 | 139,544 | ||||||
| Property, plant and equipment |
43,499 | 43,640 | ||||||
| Accounts payable |
97 | 4 | ||||||
| Provision for pensions |
262 | 239 | ||||||
| Other provisions |
7,998 | 6,247 | ||||||
| Other liabilities |
699 | 247 | ||||||
|
|
|
|
|
|||||
| Total deferred tax liabilities |
198,715 | 199,670 | ||||||
|
|
|
|
|
|||||
| Net deferred tax asset/(liability) position |
$ | (138,522 | ) | $ | (162,175 | ) | ||
|
|
|
|
|
|||||
F-33
Table of Contents
KLEOPATRA HOLDINGS 2 S.C.A.
NOTES TO CONSOLIDATED FINANCIAL STATEMENTS
September 30, 2016, 2015 and 2014
(All monetary amounts in thousands, except per share data)
The following table illustrates the gross and net deferred tax positions after the application of jurisdictional netting.
| 2016 | 2015 | |||||||
| Deferred tax assets: |
||||||||
| Gross deferred tax assets |
$ | 60,193 | $ | 37,495 | ||||
| Net deferred tax assets |
13,428 | 5,438 | ||||||
| Deferred tax liabilities: |
||||||||
| Gross deferred tax liabilities |
198,715 | 199,670 | ||||||
| Net deferred tax liabilities |
151,950 | 167,613 | ||||||
| Net deferred tax asset / (liabilities) position |
(138,522 | ) | (162,175 | ) | ||||
As of September 30, 2016 the Company has $46,694 of cumulative tax effected net operating losses ($42,165 as of September 30, 2015). The majority of these tax losses arise in tax jurisdictions where they do not expire. In jurisdictions where they do expire, losses of $8,020 are set to expire between 2017 and 2018. Based upon all available evidence, the Company recorded a valuation allowance in the amount of $45,682 ($38,724 as of September 30, 2015) related to net operating losses of both expiring and non-expiring losses because they are not projected to be utilized. The deferred tax asset attributed to the carried forward interest expense deduction amounted to $43,231 ($57,041 as of September 30, 2015). A valuation allowance of $43,231 ($57,041 as of September 30, 2015) was recorded against this balance. Both the decrease of the carried forward interest expense as well as the corresponding decrease of the valuation allowance was caused by an indirect change of ownership of the relevant entity.
As of September 30, 2016, there were unremitted earnings from foreign subsidiaries that are permanently reinvested for continued use in foreign operations, accordingly, no provision for income taxes has been provided thereon. If distributed, those earnings would result in additional income tax expense at approximately the Luxembourg statutory rate. Determination of the amount of unrecognized deferred income tax liability is not practicable due to the complexities associated with this hypothetical calculation.
As of September 30, 2016, provisions of $7,143 were made for temporary differences relating to investments in the Company’s Canadian and Argentine subsidiaries ($7,425 as of September 30, 2015).
Our major tax jurisdictions include Luxembourg, Germany, Switzerland, the US, and the UK. These jurisdictions generally remain open to examination by the relevant tax authority for the years ended September 30, 2008 through 2016.
Unrecognized Tax Benefits
The Company assesses at each reporting date whether a reserve should be made for positions taken in the Company’s tax returns. No material uncertain tax positions were recorded as of September 30, 2016 and 2015. Penalty and interest incurred on uncertain tax positions is recognized within income tax expense.
NOTE 11 STOCK BASED COMPENSATION
On December 18, 2015, Kleopatra Holdings 1, S.C.A. granted and issued 19,056 Class B SCA shares of Kleopatra Holdings 1, S.C.A. (“Class B SCA Shares”) to certain employees of the Company at a subscription price of € 0.10 per share for total proceeds of €2 ($2). The shares were fully vested upon grant. The terms of the awards restrict the sale or disposition of the restricted stock held by the employees.
F-34
Table of Contents
KLEOPATRA HOLDINGS 2 S.C.A.
NOTES TO CONSOLIDATED FINANCIAL STATEMENTS
September 30, 2016, 2015 and 2014
(All monetary amounts in thousands, except per share data)
On February 9, 2016, Kleopatra Holdings 1, S.C.A. granted and issued 40,667 Class C1 SCA shares of Kleopatra Holdings 1, S.C.A. (“Class C1 SCA Shares”) and 50,622 Class C2 SCA Shares of Kleopatra Holdings 1, S.C.A. (“Class C2 SCA Shares”) to certain employees at a subscription price of € 0.10 per share for total proceeds of €9($10). On July 29, 2016, Kleopatra Holdings 1, S.C.A. granted and issued 54,220 Class C1 SCA Shares and 54,516 Class C2 SCA Shares to certain employees at a subscription price of € 0.10 per share for total proceeds of €11 ($12). On September 30, 2016, Kleopatra Holdings 1, S.C.A. granted and issued 968 Class C1 SCA shares and 973 Class C2 SCA Shares to certain employees at a subscription price of €0.10 per share for total proceeds of €0.2 ($0.2). The shares vest over five years provided that the employee remains employed by the Company. The terms of the awards restrict the sale or disposition of the restricted stock held by the employees.
Upon termination of employment, the Company has the right to repurchase an employee’s restricted stock during the 6 months following the employee’s termination or in certain other circumstances. For vested restricted stock, the purchase price is the then-current market value of the shares unless the employee is determined to be a bad leaver, a determination that is at the full discretion of the Company, in which case the purchase price is equal to the lesser of the then-current market value or the original purchase price. For unvested restricted stock, the purchase price is the lesser of the original purchase price of the shares or its then-current market value.
For the Class B SCA Shares, Class C1 SCA Shares and Class C2 SCA Shares, the Company recognizes compensation expense ratably over the vesting period based on the fair value of the stock at the grant date. Restricted stock compensation expense totaled $8,527, $0 and $0 for the years ended September 30, 2016, 2015 and 2014, respectively, and is reported in selling, general and administrative expenses in the consolidated statement of operations, which corresponds to the applicable employee’s compensation expense. The fair values of restricted stock awards that vested totaled $7,814, $0 and $0 during the years ended September 30, 2016, 2015 and 2014, respectively. As of September 30, 2016, unrecognized compensation expense related to non-vested restricted stock totaled $9,722, and is expected to be recognized over the weighted average period of 4.67 years.
The changes in restricted stock are as follows:
| Class B SCA Restricted Stock |
Class C1 SCA Restricted Stock |
Class C2 SCA Restricted Stock |
Total Restricted Stock |
Weighted Average Grant-Date Fair Value ($ per share) |
||||||||||||||||
| Non-vested as of October 1, 2015 |
— | — | — | — | — | |||||||||||||||
| Granted |
19,056 | 95,855 | 106,111 | 221,022 | $ | 82.38 | ||||||||||||||
| Vested |
(19,056 | ) | — | — | (19,056 | ) | $ | 410.06 | ||||||||||||
| Forfeited |
— | — | — | — | — | |||||||||||||||
|
|
|
|
|
|
|
|
|
|
|
|||||||||||
| Non-vested as of September 30, 2016 |
— | 95,855 | 106,111 | 201,966 | ||||||||||||||||
|
|
|
|
|
|
|
|
|
|
|
|||||||||||
NOTE 12 PREFERRED EQUITY CERTIFICATES
On June 21, 2012, the Company issued 25,020,834,000 Series 1 preferred equity certificates (PECs) at a par value of € 0.01 per certificate for a total euro aggregate amount of €250,208 (translated on the transaction date to $315,012). Subsequent to a holding company reorganization completed on April 30, 2013, all PECs are currently held by Kleopatra Holdings 1 S.C.A., a principal shareholder of Kleopatra Holdings 2 S.C.A. The PECs are entitled to a preference return of 15% per annum (capitalized annually) with preference over the tracking preferred equity certificates (TPECs), see below, and the common stock of the Company.
F-35
Table of Contents
KLEOPATRA HOLDINGS 2 S.C.A.
NOTES TO CONSOLIDATED FINANCIAL STATEMENTS
September 30, 2016, 2015 and 2014
(All monetary amounts in thousands, except per share data)
The PECs mature thirty years from the issuance date on June 21, 2042. The PECs do not require mandatory payment prior to their maturity other than (i) in connection with any distribution to the holders of equity securities of the Company, (ii) on the occurrence of certain insolvency events, or (iii) as otherwise determined by the Company. Upon retirement of the PEC, the repayment owed by the Company to the holders of the PECs equals the (i) par value, plus (ii) unpaid yield accrued to the repayment date, plus (iii) the repayment premium of $7,711. The PECs are classified as long-term liabilities on the balance sheet and measured at cost on the date of issuance, which approximated fair value based on Level 2 inputs (refer to Note 8). The repayment premium is accreted to the final retirement amount of $287,248 using the effective interest method.
Upon the refinancing on April 28, 2015, the Company redeemed 23,624,287,623 PECs at a total par value of €236,244 ($255,663), repaid outstanding yield as of the date of the financing of $129,173 and paid in full the redemption premium of $7,470 for a total payment of $392,306. After the partial redemption, 1,396,546,376 PECs remained outstanding as of September 30, 2015.
On May 30, 2016, the Company redeemed the remaining 1,396,546,376 PECs outstanding at a total par value of €13,965 ($15,542) and repaid outstanding yield as of the date of the redemption of €6,035 ($6,717) for a total payment of €20,000 ($22,259). Following the redemption, no Series 1 PECs remained outstanding except for accrued and unpaid yield in the amount of €1,000 ($1,110). The remaining outstanding accrued but unpaid yield continued to compound at a rate of 15% per annum until repaid on September 28, 2016.
Interest expense for the PECs, including the amortization of the repayment premium, for each of the years ended September 30, 2016, 2015 and 2014 amounted to $2,102, $42,305 and $62,857, respectively.
A summary of the PECs and related interest as of September 30, 2016 and 2015 is as follows:
| Preferred Equity Certificates |
Accrued but unpaid yield |
Accrued interest |
||||||||||
| Balance as of October 1, 2015 |
$ | 15,602 | $ | 8,136 | $ | 995 | ||||||
| Interest |
— | — | 2,102 | |||||||||
| Payment |
(15,542 | ) | (8,053 | ) | (3,101 | ) | ||||||
| Amortization of repayment premium |
— | — | — | |||||||||
| Foreign currency translation |
(60 | ) | (83 | ) | 4 | |||||||
|
|
|
|
|
|
|
|||||||
| Balance as of September 30, 2016 |
$ | — | $ | — | $ | — | ||||||
|
|
|
|
|
|
|
|||||||
| Preferred Equity Certificates |
Accrued but unpaid yield |
Accrued interest |
||||||||||
| Balance as of October 1, 2014 |
$ | 316,316 | $ | 104,425 | $ | 17,847 | ||||||
| Interest |
— | — | 35,184 | |||||||||
| Payment |
(263,133 | ) | (81,590 | ) | (47,583 | ) | ||||||
| Amortization of repayment premium |
7,121 | — | — | |||||||||
| Foreign currency translation |
(44,702 | ) | (14,699 | ) | (4,453 | ) | ||||||
|
|
|
|
|
|
|
|||||||
| Balance as of September 30, 2015 |
$ | 15,602 | $ | 8,136 | $ | 995 | ||||||
|
|
|
|
|
|
|
|||||||
F-36
Table of Contents
KLEOPATRA HOLDINGS 2 S.C.A.
NOTES TO CONSOLIDATED FINANCIAL STATEMENTS
September 30, 2016, 2015 and 2014
(All monetary amounts in thousands, except per share data)
Tracking Preferred Equity Certificates
On June 21, 2012, the Company issued 2,098,900 TPECs at a par value of € 0.01 per certificate for a total aggregate amount of €21 (translated on the date of the transaction to $26). Subsequent to a holding company reorganization completed on April 30, 2013, all TPECs issued by the Company are currently held by Kleopatra Holdings 1 S.C.A. The TPECs are contractually subordinated to all future and present obligations of the Company, but as debt instruments rank in priority to distributions on common stock.
The TPEC holders are entitled to a return equal to approximately the net income arising from the applicable tracked underlying investments of the Company during such accrual period, before Luxembourg taxes, minus the margin amount (10 BPS calculated on the average amount outstanding under the relevant loans during an accrual period) minus the annual costs and minus the additional interest amount outstanding on the PECs for that period. If such amount is negative, the return shall be zero. Included in this return are gains to be achieved through repayment of the 2012 Senior Secured Notes and mezzanine facilities by KP Germany Erste GmbH, a subsidiary of the Company, of €258,968 (translated to USD) upon the maturity date of July 16, 2017 and payment in full, or part, of the repayment premium on the income sharing preferred equity certificates (“IS PECs”) by Kleopatra Lux 2 S.à r.l, a subsidiary of the Company, amounting to the difference of $233,351 less €21,804 (translated to USD on the repayment date), on or after July 16, 2017.
The TPECs mature thirty years from the issuance date on June 21, 2042. The TPECs do not require mandatory payment prior to their maturity other than (i) in connection with any distribution to the holders of equity securities of the Company, (ii) on the occurrence of certain insolvency events, or (iii) as otherwise determined by the Company. Upon retirement of the TPECs, the repayment owed by the Company to the holders of the TPECs equals the (i) par value plus (ii) unpaid yield accrued to the repayment date. The TPECs are classified as long-term liabilities on the balance sheet and are measured at fair value, which approximates cost based on Level 3 inputs (refer to note 8).
In connection with the refinancing, the Company issued a TPECs yield repayment notice on April 28, 2015 and, accordingly made a full repayment of the unpaid yield (without redemption of any TPECs) at that time to the TPEC holders in the amount of $312,013 (translated into USD on the date of payment). This repayment included (i) the gain of $280,255 upon the repayment in full of the 2012 Senior Secured Notes and mezzanine facilities by KP Germany Erste, (ii) the gain of $9,220 upon partial repayment of the IS PEC repayment premium and (iii) profits of the Company above the margin amount of $29,096 offset by the release of the PECs redemption premium in the amount of $6,558. After the refinancing, 2,098,900 series 1 TPECs remained outstanding as of September 30, 2016.
If there are no earlier repayments, and no additional returns are incurred upon the achievement of the aforementioned events, the mandatory redemption price at the mandatory retirement date of June 21, 2042 is $4,983, of which $23 relates to the par value of the TPECs and $4,960 relates to unpaid yield as of September 30, 2016. Additional yield could be incurred on redemption if specified income is greater than a certain margin in any given period.
Interest expense for the TPECs for the years ended September 30, 2016, 2015 and 2014 amounted to $2,143, $320,909 and $15,644, respectively.
F-37
Table of Contents
KLEOPATRA HOLDINGS 2 S.C.A.
NOTES TO CONSOLIDATED FINANCIAL STATEMENTS
September 30, 2016, 2015 and 2014
(All monetary amounts in thousands, except per share data)
A breakdown of the TPECs and related interest as of September 30, 2016 and 2015 is as follows:
| TPECs | Return | |||||||
| Balance as of October 1, 2015 |
$ | 23 | $ | 3,333 | ||||
| Return |
— | 2,143 | ||||||
| Payment |
— | (521 | ) | |||||
| Foreign currency translation |
— | 5 | ||||||
|
|
|
|
|
|||||
| Balance as of September 30, 2016 |
$ | 23 | $ | 4,960 | ||||
|
|
|
|
|
|||||
| TPECs | Return | |||||||
| Balance as of October 1, 2014 |
$ | 27 | $ | 15,213 | ||||
| Return |
— | 320,909 | ||||||
| Payment |
— | (312,013 | ) | |||||
| Foreign currency translation |
(4 | ) | (20,776 | ) | ||||
|
|
|
|
|
|||||
| Balance as of September 30, 2015 |
$ | 23 | $ | 3,333 | ||||
|
|
|
|
|
|||||
NOTE 13 SHAREHOLDERS’ DEFICIT AND NET LOSS PER SHARE
The issued and subscribed share capital of Kleopatra Holdings 2 S.C.A. amounts to €1,756 (converted to $2,303) and is divided into 1,756,489 common shares with a nominal value of €1.00 and one management share with a nominal value of €1.00.
Kleopatra Holdings GP S.A. as the sole manager of Kleopatra Holdings 2 S.C.A. is permitted, for a period of five years from February 2013, to issue new shares up to the limit of authorized share capital in the amount of €1,000,000,000.
The weighted average number of shares to calculate net loss per share for years ended September 30, 2016, 2015 and 2014 was 1,756,490, for all periods. For all financial statement periods presented the number of basic and diluted weighted average shares outstanding was the same because any increase in the number of shares for any period presented would be antidilutive based on the net loss for the period.
There were no dilutive instruments outstanding for the years ended September 30, 2016, 2015 and 2014.
NOTE 14 BUSINESS SEGMENT AND GEOGRAPHIC AREA INFORMATION
Following a management reorganization during 2016, beginning October 1, 2016, the Company’s operations are organized into four reportable segments: Pharma, Labels, Food & Consumer Packaging and Specialties. Historically the Company’s operations were organized on a geographic regional basis. The periods presented in these financial statements have been recast accordingly.
The Pharma segment manufactures an extensive range of pharmaceutical packaging films, including mono-barrier (i.e., single layer) and high-barrier (i.e., multi-layer) films for blister packaging as well as mono-barrier and multi-polymer films for sterile packaging of medical devices, such as surgical tools.
The Labels segment produces films that are used for bottle wrap labels, tamper resistant closures, wine bottle capsules and battery wraps. These are rigid films which are either stretched longitudinally, for the production of labels, battery wraps and adhesive tapes, or latitudinally, for the production of sleeves and capsules.
F-38
Table of Contents
KLEOPATRA HOLDINGS 2 S.C.A.
NOTES TO CONSOLIDATED FINANCIAL STATEMENTS
September 30, 2016, 2015 and 2014
(All monetary amounts in thousands, except per share data)
The Food & Consumer Packaging segment manufactures mono- and multi-layer primary films used for general thermoforming conversion. Mono-layer films are single-layer protective films that are mainly sold to thermoformers to produce trays, blisters and containers for the food and non-food markets, including packaging for electronic components and consumer goods. Multi-layer films are protective films for customers who require a higher level of protection for the end product and also sealing capability to a flexible top film.
The Specialties segment produces a range of specialty film products focused on various niche markets, including, among others, cards, decorative surfaces, print films, box packaging films and technical products.
The Company has determined that the segment measure of profit or loss is Gross Profit because that is the measure provided to the CODM internally to assess performance and allocate resources. There are no differences in the measurement basis of segment gross profit and consolidated gross profit.
Information for our reportable segments as of and for the years ended September 30 was as follows:
| 2016 | 2015 | 2014 | ||||||||||
| Net sales |
||||||||||||
| Pharma |
$ | 369,084 | $ | 370,543 | $ | 407,101 | ||||||
| Labels |
193,570 | 209,208 | 207,982 | |||||||||
| Specialties |
307,724 | 323,550 | 374,801 | |||||||||
| Food & Consumer Packaging |
514,620 | 548,486 | 602,699 | |||||||||
| Corporate/other* |
18,456 | 28,526 | 28,224 | |||||||||
|
|
|
|
|
|
|
|||||||
| Total net sales |
$ | 1,403,454 | $ | 1,480,313 | $ | 1,620,807 | ||||||
|
|
|
|
|
|
|
|||||||
| Gross Profit |
||||||||||||
| Pharma |
$ | 94,987 | $ | 92,255 | $ | 99,322 | ||||||
| Labels |
41,590 | 38,048 | 33,732 | |||||||||
| Specialties |
76,437 | 82,416 | 93,382 | |||||||||
| Food & Consumer Packaging |
97,585 | 90,059 | 94,966 | |||||||||
| Corporate/other** |
(9,559 | ) | (16,060 | ) | (12,230 | ) | ||||||
|
|
|
|
|
|
|
|||||||
| Total gross profit |
$ | 301,040 | $ | 286,718 | $ | 309,172 | ||||||
|
|
|
|
|
|
|
|||||||
| Depreciation & amortization |
||||||||||||
| Pharma |
$ | 9,158 | $ | 9,787 | $ | 10,916 | ||||||
| Labels |
11,251 | 13,700 | 13,974 | |||||||||
| Specialties |
9,015 | 9,901 | 10,488 | |||||||||
| Food & Consumer Packaging |
13,526 | 14,269 | 15,877 | |||||||||
| Corporate/other *** |
54,733 | 58,259 | 61,067 | |||||||||
|
|
|
|
|
|
|
|||||||
| Total depreciation & amortization |
$ | 97,683 | $ | 105,916 | $ | 112,320 | ||||||
|
|
|
|
|
|
|
|||||||
| * | Net sales, corporate/other includes secondary business sales (mainly sales of scrap materials) and third party trucking revenues less the consolidation impact of any sales between segments. |
| ** | Gross profit, corporate/other includes net sales plus corporate overhead manufacturing expenses related to functions not allocated to a segment. |
| *** | Depreciation & amortization, corporate/other includes amortization expense recognized in Cost of sales related to intangible assets recognized in the June 2012 acquisition of the Company, and depreciation and amortization expense recognized in Selling, general and administrative expenses. This creates a different |
F-39
Table of Contents
KLEOPATRA HOLDINGS 2 S.C.A.
NOTES TO CONSOLIDATED FINANCIAL STATEMENTS
September 30, 2016, 2015 and 2014
(All monetary amounts in thousands, except per share data)
| allocation basis to segment assets, which include assets (including intangible assets recognized in the June 2012 acquisition of the Company) for which the related depreciation and/or amortization expense is allocated to corporate/other. |
| 2016 | 2015 | |||||||
| Assets |
||||||||
| Pharma |
$ | 353,509 | $ | 351,057 | ||||
| Labels |
196,126 | 200,282 | ||||||
| Specialties |
263,534 | 271,657 | ||||||
| Food & Consumer Packaging |
435,273 | 432,703 | ||||||
| Corporate/other* |
103,414 | 106,209 | ||||||
|
|
|
|
|
|||||
| Total assets |
$ | 1,351,856 | $ | 1,361,908 | ||||
|
|
|
|
|
|||||
| * | Includes cash, other current assets, deferred income tax assets and the derecognition of accounts receivable under factoring programs, since those items are managed at the Corporate level. |
Net sales based on geographic area for the years ended September 30 was as follows:
| 2016 | 2015 | 2014 | ||||||||||
| Net Sales |
||||||||||||
| Germany |
$ | 101,107 | $ | 111,723 | $ | 140,666 | ||||||
| Rest of Europe* |
502,992 | 526,551 | 616,081 | |||||||||
| USA |
479,452 | 525,423 | 531,073 | |||||||||
| Rest of North America |
84,909 | 83,508 | 84,971 | |||||||||
| South America |
104,363 | 107,297 | 110,382 | |||||||||
| Asia |
71,644 | 72,075 | 71,084 | |||||||||
| Rest of World |
58,987 | 53,736 | 66,550 | |||||||||
|
|
|
|
|
|
|
|||||||
| Total net sales |
$ | 1,403,454 | $ | 1,480,313 | $ | 1,620,807 | ||||||
|
|
|
|
|
|
|
|||||||
| * | Net sales generated from Luxembourg, our country of domicile, was nil for all periods presented |
| 2016 | 2015 | |||||||
| Property, plant and equipment, net |
||||||||
| Germany |
$ | 135,840 | $ | 111,463 | ||||
| Rest of Europe |
51,563 | 52,512 | ||||||
| USA |
123,709 | 124,392 | ||||||
| Rest of North America |
3,313 | 2,986 | ||||||
| South America |
23,562 | 21,282 | ||||||
| Asia |
47,180 | 49,346 | ||||||
| Rest of World |
3 | 12 | ||||||
|
|
|
|
|
|||||
| Total Property, plant and equipment, net |
$ | 385,170 | $ | 361,993 | ||||
|
|
|
|
|
|||||
The Company did not have any customers which accounted for 10% or more of the Company’s net sales during the years ended September 30, 2016, 2015 or 2014.
F-40
Table of Contents
KLEOPATRA HOLDINGS 2 S.C.A.
NOTES TO CONSOLIDATED FINANCIAL STATEMENTS
September 30, 2016, 2015 and 2014
(All monetary amounts in thousands, except per share data)
NOTE 15 ACCUMULATED OTHER COMPREHENSIVE INCOME/ (LOSS)
Amounts included in accumulated other comprehensive loss, net of tax, for the years ended September 30 were as follows:
| Defined benefit plans |
Currency translation adjustments |
Derivative financial instruments |
Total | |||||||||||||
| Balance as of October 1, 2013 |
$ | 2,606 | $ | (24,172 | ) | $ | — | $ | (21,566 | ) | ||||||
| Other comprehensive income/(loss) before reclassifications |
(5,800 | ) | 16,262 | (140 | ) | 10,322 | ||||||||||
| Amounts reclassified from accumulated other comprehensive loss |
(61 | ) | — | 98 | 37 | |||||||||||
|
|
|
|
|
|
|
|
|
|||||||||
| Other comprehensive income/(loss) |
(5,861 | ) | 16,262 | (42 | ) | 10,359 | ||||||||||
|
|
|
|
|
|
|
|
|
|||||||||
| Balance as of September 30, 2014 |
(3,255 | ) | (7,910 | ) | (42 | ) | (11,207 | ) | ||||||||
| Other comprehensive income/(loss) before reclassifications |
(1,683 | ) | 55,225 | (223 | ) | 53,319 | ||||||||||
| Amounts reclassified from accumulated other comprehensive loss |
(68 | ) | — | 336 | 268 | |||||||||||
|
|
|
|
|
|
|
|
|
|||||||||
| Other comprehensive income/(loss) |
(1,751 | ) | 55,225 | 113 | 53,587 | |||||||||||
|
|
|
|
|
|
|
|
|
|||||||||
| Balance as of September 30, 2015 |
(5,006 | ) | 47,315 | 71 | 42,380 | |||||||||||
| Other comprehensive income/(loss) before reclassifications |
(10,898 | ) | 7,864 | 157 | (2,877 | ) | ||||||||||
| Amounts reclassified from accumulated other comprehensive loss |
(36 | ) | — | (174 | ) | (210 | ) | |||||||||
|
|
|
|
|
|
|
|
|
|||||||||
| Other comprehensive income/(loss) |
(10,934 | ) | 7,864 | (17 | ) | (3,087 | ) | |||||||||
|
|
|
|
|
|
|
|
|
|||||||||
| Balance as of September 30, 2016 |
$ | (15,940 | ) | $ | 55,179 | $ | 54 | $ | 39,293 | |||||||
|
|
|
|
|
|
|
|
|
|||||||||
Reclassifications out of accumulated other comprehensive loss were as follows:
| Components of Accumulated Other Comprehensive Loss |
2016 | 2015 | 2014 | Reclassification to Consolidated | ||||||||||
| Gains & losses on cash flow hedges |
||||||||||||||
| Foreign currency forward contracts |
$ | 251 | $ | (501 | ) | $ | (184 | ) | Other expense, net | |||||
| Interest rate swaps |
— | — | 19 | Interest and other debt expense | ||||||||||
|
|
|
|
|
|
|
|||||||||
| 251 | (501 | ) | (165 | ) | Total before tax | |||||||||
| (77 | ) | 165 | 67 | Tax benefit | ||||||||||
|
|
|
|
|
|
|
|||||||||
| 174 | (336 | ) | (98 | ) | Net of tax | |||||||||
|
|
|
|
|
|
|
|||||||||
| Defined benefit pension items |
||||||||||||||
| Amortization of actuarial gains and losses |
(44 | ) | 13 | (5 | ) | Cost of sales | ||||||||
| Amortization of past service costs |
80 | 55 | 66 | Cost of sales | ||||||||||
|
|
|
|
|
|
|
|||||||||
| 36 | 68 | 61 | Total before tax | |||||||||||
| — | — | — | Tax benefit | |||||||||||
|
|
|
|
|
|
|
|||||||||
| 36 | 68 | 61 | Net of tax | |||||||||||
|
|
|
|
|
|
|
|||||||||
| Total reclassifications for the period |
$ | 210 | $ | (268 | ) | $ | (37 | ) | Net of tax | |||||
|
|
|
|
|
|
|
|||||||||
F-41
Table of Contents
KLEOPATRA HOLDINGS 2 S.C.A.
NOTES TO CONSOLIDATED FINANCIAL STATEMENTS
September 30, 2016, 2015 and 2014
(All monetary amounts in thousands, except per share data)
The tax expense/(benefit) on defined benefit plans was $3,660, $491 and $1,910 for the years ended September 30, 2016, 2015 and 2014, respectively. The tax expense/(benefit) on derivative financial instruments was $26, $55 and $(34) for the years ended September 30, 2016, 2015 and 2014, respectively.
NOTE 16 RELATED PARTY TRANSACTIONS
Related parties include Kleopatra Holdings 1 S.C.A. and Kleopatra Holdings GP S.A. as our immediate shareholders, affiliates of funds managed by Strategic Value Partners and its affiliates as our principal owner, Vinyl Solutions, LLC as our equity method investee, our subsidiaries and our management.
The Company has a 0.8% shareholding in Kleopatra Holdings 1 S.C.A. and a 0.7% shareholding in Kleopatra Holdings GP S.A. The carrying value of these investments totaled €14 as at September 30, 2016 and 2015.
Services are usually negotiated with related parties on a cost-plus basis. Goods are bought on the basis of price lists in place with non-related parties. Refer to Note 12 for details of the preferred equity certificates.
Transactions with related parties for the years ended September 30 were as follows:
Kleopatra Holdings 1 S.C.A.
| 2016 | 2015 | 2014 | ||||||||||
| Interest income |
$ | — | $ | 206 | $ | — | ||||||
| Interest expense |
4,247 | 359,566 | 78,182 | |||||||||
| Management fees |
914 | 965 | 1,028 | |||||||||
| Administration fees |
1.531 | 706 | 715 | |||||||||
Vinyl Solutions, LLC
| 2016 | 2015 | 2014 | ||||||||||
| Net sales |
$ | 5,764 | $ | 6,743 | $ | 6,416 | ||||||
| Interest income |
265 | 247 | 220 | |||||||||
Receivables and payables to and from related parties were as follows:
| 2016 | 2015 | |||||||
| Kleopatra Holdings 1 S.C.A. |
||||||||
| Accounts Payable |
$ | — | $ | 109 | ||||
| Kleopatra Holdings GP S.A. |
||||||||
| Other current liabilities |
390 | 1,954 | ||||||
| Vinyl Solutions, LLC |
||||||||
| Accounts receivable |
5,145 | 3,001 | ||||||
| Accounts payable |
166 | 30 | ||||||
Management of the Company participates in a program by which they will receive a success-based bonus based on equity proceeds payable to the investors of the Company in case of certain future events. As a condition
F-42
Table of Contents
KLEOPATRA HOLDINGS 2 S.C.A.
NOTES TO CONSOLIDATED FINANCIAL STATEMENTS
September 30, 2016, 2015 and 2014
(All monetary amounts in thousands, except per share data)
to this participation entitlement, certain members of management granted a loan to the Company, between January 8, 2013 and January 10, 2014 in the total euro amount of €1,410 which earns interest equal to the PECs. On May 29, 2015 these loans were fully repaid as part of the Refinancing (see Note 6). The total loan amount including accrued interest as of September 30, 2014 was $2,202.
NOTE 17 COMMITMENTS AND CONTINGENCIES
Contingencies: Accruals for estimated losses are recorded at the time information becomes available indicating that losses are probable and that the amounts can be reasonably estimated. As is the case with other companies in similar industries, the Company faces exposure from actual or potential claims and legal proceedings from a variety of sources.
The Company has an obligation under German legislation to fund potential shortfalls in the multi-employer plan such that the negotiated level of benefit coverage is maintained. The Company’s best estimate of such increases in benefit payments amounts to $10,700 as of September 30, 2016 ($4,500 as of September 30, 2015).
Legal claims: From time to time, the Company may become involved in legal proceedings. Litigation is subject to inherent uncertainties which require the Company to make a best estimate of any likely adverse result from such matters. The Company is currently not aware of any legal proceedings or claims that will have a material adverse effect on the Company’s business, financial condition or results of operations.
Capital commitments: The Company has commitments for capital expenditures at September 30, 2016 but not yet incurred of $24,561 ($6,551 as at September 30, 2015), all expected to be paid within one year of the balance sheet date. The Company has no other long-term capital commitments.
Operating and capital lease commitments: The Company is a lessee of various plant, equipment and cars that are accounted for as operating leases. The lease contracts have varying terms and renewal rights. The lease expense incurred was $8,462, $8,612 and $9,911 for the years ended September 30, 2016, 2015 and 2014, respectively.
Refer to Note 4 Property, Plant and Equipment for details of assets leased under capital leases. The future minimum operating and capital lease payments under non-cancellable contracts are as follows:
| Year ended September 30 |
Operating lease payments |
Capital lease payments |
||||||
| 2017 |
$ | 6,067 | $ | 2,003 | ||||
| 2018 |
4,282 | 996 | ||||||
| 2019 |
2,855 | 550 | ||||||
| 2020 |
2,306 | 514 | ||||||
| 2021 |
1,537 | 514 | ||||||
| Thereafter |
15,729 | 964 | ||||||
|
|
|
|
|
|||||
| Total |
$ | 32,776 | $ | 5,541 | ||||
|
|
|
|
|
|||||
| Less: Amount Representing Interest |
— | (513 | ) | |||||
|
|
|
|
|
|||||
| Present Value of Net Minimum Leases |
$ | 32,776 | $ | 5,028 | ||||
|
|
|
|
|
|||||
F-43
Table of Contents
KLEOPATRA HOLDINGS 2 S.C.A.
NOTES TO CONSOLIDATED FINANCIAL STATEMENTS
September 30, 2016, 2015 and 2014
(All monetary amounts in thousands, except per share data)
NOTE 18 SUBSEQUENT EVENTS
The Company has evaluated subsequent events through to December 21, 2016, being the date these consolidated financial statements were available to be issued.
During September 2016, the Company signed a Sale and Purchase Agreement (SPA) to acquire 100% of the outstanding share capital of Farmamak Ambalaj Maddeleri ve Ambalaj Makineleri Sanayi ve Tic. A.S., a rigid plastic foil and sheet manufacturer based in Turkey. The SPA closed on October 31, 2016.
On October 14, 2016, the Company borrowed an additional €85,000 ($97,680) under the 2015 Senior Secured Term Loan. The margin was decreased from 4% for USD Dollar denominated loans to 3.25% and for EUR denominated loans to 3%.
F-44
Table of Contents
Table of Contents
Shares
KLEOPATRA HOLDINGS 2 S.C.A.
(to be renamed Klöckner Pentaplast Inc.)
Common Stock
Citigroup
Credit Suisse
Goldman, Sachs & Co.
BofA Merrill Lynch
Baird
Jefferies
Through and including (the 25th day after the date of this prospectus), all dealers effecting transactions in these securities, whether or not participating in this offering, may be required to deliver a prospectus. This is in addition to a dealer’s obligation to deliver a prospectus when acting as an underwriter and with respect to an unsold allotment or subscription.
Table of Contents
INFORMATION NOT REQUIRED IN PROSPECTUS
Item 13. Other Expenses of Issuance and Distribution
The following table sets forth all costs and expenses, other than the underwriting discounts and commissions payable by us, in connection with the offer and sale of the securities being registered. All amounts shown are estimates except for the SEC registration fee and the Financial Industry Regulatory Authority, Inc. (“FINRA”) filing fee.
| Amount | ||||
| SEC registration fee |
$ | 11,590 | ||
| FINRA filing fee |
15,500 | |||
| Listing fee |
* | |||
| Printing expenses |
* | |||
| Accounting fees and expenses |
* | |||
| Legal fees and expenses |
* | |||
| Blue Sky fees and expenses |
* | |||
| Transfer Agent and Registrar fees and expenses |
* | |||
| Miscellaneous expenses |
* | |||
|
|
|
|||
| Total |
$ | * | ||
|
|
|
|||
| * | To be provided by amendment. |
Item 14. Indemnification of Officers and Directors
Section 102(b)(7) of the DGCL allows a corporation to provide in its certificate of incorporation that a director of the corporation will not be personally liable to the corporation or its stockholders for monetary damages for breach of fiduciary duty as a director, except where the director breached the duty of loyalty, failed to act in good faith, engaged in intentional misconduct or knowingly violated a law, authorized the payment of a dividend or approved a stock repurchase in violation of Delaware corporate law or obtained an improper personal benefit. Our certificate of incorporation will provide for this limitation of liability.
Section 145 of the DGCL (“Section 145”), provides that a Delaware corporation may indemnify any person who was, is or is threatened to be made, party to any threatened, pending or completed action, suit or proceeding, whether civil, criminal, administrative or investigative (other than an action by or in the right of such corporation), by reason of the fact that such person is or was an officer, director, employee or agent of such corporation or is or was serving at the request of such corporation as a director, officer, employee or agent of another corporation or enterprise. The indemnity may include expenses (including attorneys’ fees), judgments, fines and amounts paid in settlement actually and reasonably incurred by such person in connection with such action, suit or proceeding, provided such person acted in good faith and in a manner he or she reasonably believed to be in or not opposed to the corporation’s best interests and, with respect to any criminal action or proceeding, had no reasonable cause to believe that his or her conduct was illegal. Where an officer or director is successful on the merits or otherwise in the defense of any action referred to above, the corporation must indemnify him or her against the expenses which such officer or director has actually and reasonably incurred.
Section 145 further authorizes a corporation to purchase and maintain insurance on behalf of any person who is or was a director, officer, employee or agent of the corporation or is or was serving at the request of the corporation as a director, officer, employee or agent of another corporation or enterprise, against any liability asserted against him or her and incurred by him or her in any such capacity, or arising out of his or her status as such, whether or not the corporation would otherwise have the power to indemnify him under Section 145.
Our certificate of incorporation will provide that we must indemnify our directors and officers to the fullest extent authorized by the DGCL and must also pay expenses incurred in defending any such proceeding in
II-1
Table of Contents
advance of its final disposition upon delivery of an undertaking, by or on behalf of an indemnified person, to repay all amounts so advanced if it should be determined ultimately that such person is not entitled to be indemnified under this section or otherwise.
We intend to enter into indemnification agreements with each of our current directors and officers. These agreements will require us to indemnify these individuals to the fullest extent permitted under Delaware law against liabilities that may arise by reason of their service to us, and to advance expenses incurred as a result of any proceeding against them as to which they could be indemnified.
The indemnification rights set forth above shall not be exclusive of any other right which an indemnified person may have or hereafter acquire under any statute, provision of our certificate of incorporation, our bylaws, agreement, vote of stockholders or disinterested directors or otherwise.
We maintain standard policies of insurance that provide coverage (1) to our directors and officers against loss rising from claims made by reason of breach of duty or certain other wrongful act and (2) to us with respect to indemnification payments that we may make to such directors and officers.
The proposed form of underwriting agreement to be filed as Exhibit 1.1 to this Registration Statement provides for indemnification to our directors and officers by the underwriters against certain liabilities.
Item 15. Recent Sales of Unregistered Securities
None
Item 16. Exhibits
| (1) | Exhibits |
The exhibit index attached hereto is incorporated herein by reference.
Item 17. Undertakings
The undersigned registrant hereby undertakes to provide to the underwriters at the closing specified in the underwriting agreement certificates in such denominations and registered in such names as required by the underwriters to permit prompt delivery to each purchaser.
Insofar as indemnification for liabilities arising under the Securities Act of 1933, as amended, may be permitted to directors, officers and controlling persons of the registrant pursuant to the foregoing provisions, or otherwise, the registrant has been advised that in the opinion of the Securities and Exchange Commission such indemnification is against public policy as expressed in the Securities Act and is, therefore, unenforceable. In the event that a claim for indemnification against such liabilities (other than the payment by the registrant of expenses incurred or paid by a director, officer or controlling person of the registrant in the successful defense of any action, suit or proceeding) is asserted by such director, officer or controlling person in connection with the securities being registered, the registrant will, unless in the opinion of its counsel the matter has been settled by controlling precedent, submit to a court of appropriate jurisdiction, the question whether such indemnification by it is against public policy as expressed in the Securities Act and will be governed by the final adjudication of such issue.
The undersigned registrant hereby further undertakes that:
| (1) | For purposes of determining any liability under the Securities Act of 1933, as amended, the information omitted from the form of prospectus filed as part of this registration statement in reliance upon Rule 430A and contained in a form of prospectus filed by the registrant pursuant to Rule 424(b)(1) or (4) or 497(h) under the Securities Act shall be deemed to be part of this registration statement as of the time it was declared effective. |
II-2
Table of Contents
| (2) | For the purpose of determining any liability under the Securities Act of 1933, as amended, each post-effective amendment that contains a form of prospectus shall be deemed to be a new registration statement relating to the securities offered therein, and the offering of such securities at that time shall be deemed to be the initial bona fide offering thereof. |
II-3
Table of Contents
SIGNATURES
Pursuant to the requirements of the Securities Act of 1933, as amended, the registrant has duly caused this registration statement to be signed on its behalf by the undersigned, thereunto duly authorized in the City of Luxembourg, Grand Duchy of Luxembourg, on December 21, 2016.
| Kleopatra Holdings GP S.A., in its capacity as general partner and sole manager of Kleopatra Holdings 2 S.C.A. | ||
| By: | /s/ Julien Goffin | |
| Name: Julien Goffin | ||
| Title: Permanent Representative | ||
POWER OF ATTORNEY
KNOW ALL MEN BY THESE PRESENTS, that each officer and director of Kleopatra Holdings GP S.A., acting as general partner and sole manager of Kleopatra Holdings 2 S.C.A., and each officer and representative of Kleopatra Holdings 2 S.C.A. whose signature appears below constitutes and appoints R. Brent Jones and Robert B. Lence, and each of them, his or her true and lawful attorney-in-fact and agent, with full power of substitution and revocation, for him or her and in his or her name, place and stead, in any and all capacities, to execute any or all amendments including any post-effective amendments and supplements to this Registration Statement, and any additional Registration Statement filed pursuant to Rule 462(b), and to file the same, with all exhibits thereto, and other documents in connection therewith, with the Securities and Exchange Commission, granting unto said attorney-in-fact and agent full power and authority to do and perform each and every act and thing requisite and necessary to be done, as fully to all intents and purposes as he or she might or could do in person, hereby ratifying and confirming all that said attorney-in-fact and agent, or his or her substitute or substitutes, may lawfully do or cause to be done by virtue hereof.
* * * *
Pursuant to the requirements of the Securities Act of 1933, as amended, this Registration Statement has been signed by the following persons in the capacities indicated and on the date indicated below:
| Name |
Title |
Date | ||
| /s/ Wayne M. Hewett Wayne M. Hewett |
Chief Executive Officer (principal executive officer) |
December 21, 2016 | ||
| /s/ R. Brent Jones R. Brent Jones |
Chief Financial Officer (principal financial officer) |
December 21, 2016 | ||
| /s/ Ina Hannen Ina Hannen |
Group Vice President Finance & (principal accounting officer) |
December 21, 2016 | ||
| /s/ Bruno Deschamps Bruno Deschamps |
Chairman and Class A Director of Kleopatra Holdings GP S.A. |
December 21, 2016 | ||
| /s/ Jason Clarke Jason Clarke |
Class A Director of Kleopatra Holdings GP S.A. |
December 21, 2016 | ||
II-4
Table of Contents
| Name |
Title |
Date | ||
| /s/ Patrick van Denzen Patrick van Denzen |
Class A Director of Kleopatra Holdings GP S.A. |
December 21, 2016 | ||
| /s/ Florian Kawohl Florian Kawohl |
Class A Director of Kleopatra Holdings GP S.A. |
December 21, 2016 | ||
| /s/ Alexis Pourchet Alexis Pourchet |
Class A Director of Kleopatra Holdings GP S.A. |
December 21, 2016 | ||
| /s/ Julien Goffin Julien Goffin |
Class B Director of Kleopatra Holdings GP S.A. |
December 21, 2016 | ||
| /s/ Sebastien Rimlinger Sebastien Rimlinger |
Class B Director of Kleopatra Holdings GP S.A. |
December 21, 2016 | ||
| /s/ Christoph Tschepe Christoph Tschepe |
Class B Director of Kleopatra Holdings GP S.A. |
December 21, 2016 | ||
| /s/ Gwenaëlle Cousin Gwenaëlle Cousin |
Class B Director of Kleopatra Holdings GP S.A. |
December 21, 2016 | ||
| /s/ Fabrice Rota Fabrice Rota |
Class B Director of Kleopatra Holdings GP S.A. |
December 21, 2016 | ||
II-5
Table of Contents
EXHIBIT INDEX
| Exhibit No. |
Description | |
| 1.1* | Form of Underwriting Agreement. | |
| 3.1* | Constitution of Kleopatra Holdings 2 S.C.A. | |
| 3.2* | Articles of Association of Kleopatra Holdings 2 S.C.A. | |
| 3.3* | Form of Certificate of Incorporation of Klöckner Pentaplast Inc. | |
| 3.4* | Form of Bylaws of Klöckner Pentaplast Inc. | |
| 4.1* | Indenture, dated April 28, 2015, among Klöckner Pentaplast of America, Inc., the guarantors signatory thereto and Deutsche Trustee Company Limited. | |
| 4.2* | Form of 7 1⁄8% Senior Notes due 2020 (included in Exhibit 4.1). | |
| 5.1* | Opinion of Kirkland & Ellis LLP. | |
| 10.1* | Senior Secured Credit Agreement, dated as of April 28, 2015, by and among Kleopatra Holdings 2 S.C.A., KP Holding GmbH & Co. KG, the borrowers party thereto, the other guarantors party thereto and Credit Suisse AG, Cayman Island Branch, as administrative agent. | |
| 10.2* | First Amendment, dated as of October 20, 2016, relating to (i) the Credit Agreement dated as of April 28, 2015 by and among Kleopatra Holdings 2, KP Holding GmbH & Co. KG, Klöckner Pentaplast German Holding GmbH & Co. KG, KP International Holding GmbH, KP Germany Erste GmbH, Klöckner Pentaplast GmbH, Klöckner Pentaplast of America, Inc., certain subsidiaries of KP Holding GmbH & Co. KG, as guarantors, the lenders party thereto and Credit Suisse AG, Cayman Islands Branch, as administrative agent for the Lenders and (ii) the Security Agreement dated as of April 28, 2015 among Klöckner Pentaplast of America, Inc., certain of its subsidiaries, as grantors, and Credit Suisse AG, Cayman Islands Branch, as collateral trustee. | |
| 10.3* | Form of Stockholders Agreement by and among Klöckner Pentaplast Inc. and certain of its stockholders. | |
| 10.4* | Form of Registration Rights Agreement by and among Klöckner Pentaplast Inc. and certain of its stockholders. | |
| 10.5*+ | Employment Agreement, dated August 19, 2015, by and between Kloeckner Pentaplast of America, Inc. and Wayne Hewett. | |
| 10.6*+ | Amendment to Employment Agreement, dated April 20, 2016, by and between Kloeckner Pentaplast of America, Inc. and Wayne Hewett. | |
| 10.7*+ | Offer Letter, dated March 18, 2016, by and between Klöckner Pentaplast (kp) and R. Brent Jones. | |
| 10.8*+ | Confidential Technical and Business Protection Employment Agreement and Non-Competition Covenant, dated March 18, 2016, by and between Kloeckner Pentaplast of America, Inc. and R. Brent Jones. | |
| 10.9*+ | Offer Letter, dated February 9, 2016, by and between Klöckner Pentaplast (kp) and Richard Widden. | |
| 10.10*+ | Confidential Technical and Business Protection Employment Agreement and Non-Competition Covenant, dated February 12, 2016, by and between Kloeckner Pentaplast of America, Inc. and Richard Widden. | |
| 10.11*+ | Service Agreement, dated May 12, 2014, by and between KP Holding GmbH & Co. KG and Marc Setzen. | |
II-6
Table of Contents
| Exhibit No. |
Description | |
| 10.12*+ | Amendment Agreement to the Service Agreement, dated March 6, 2015, by and between KP Holding GmbH & Co. KG and Marc Setzen. | |
| 10.13*+ | Second Amendment Agreement to the Service Agreement, dated May 18, 2015, by and between KP Holding GmbH & Co. KG and Marc Setzen. | |
| 10.14*+ | Employment Agreement, dated March 15, 2016, by and between KP Holding GmbH & Co. KG and Peter Heinze. | |
| 10.15*+ | Service Agreement, dated April 12, 2016, by and between KP Holding GmbH & Co. KG and Peter Heinze. | |
| 10.16*+ | Service Agreement, dated January 7, 2013, by and between Klöckner Pentaplast GmbH & Co. KG and Stefan Brandt. | |
| 10.17*+ | Service Agreement Assignment, Extension & Amendment, dated April 11, 2014, by and among KP Holding GmbH & Co. KG, Klöckner Pentaplast GmbH and Stefan Brandt. | |
| 10.18*+ | Service Agreement, dated as of January 1, 2013, by and between KP Germany Erste GmbH and Dr. Markus Hölzl. | |
| 10.19* | Form of Directors and Officers Indemnification Agreement. | |
| 10.20*+ | 2017 Omnibus Incentive Plan. | |
| 10.21* | Cost Allocation Agreement, dated as of June 30, 2013, by and between Kleopatra Holdings 1 S.C.A. and Kleopatra Holdings 2 S.C.A. | |
| 21.1* | List of Subsidiaries of Kleopatra Holdings 2 S.C.A. | |
| 23.1 | Consent of BDO USA, LLP Independent Registered Public Accounting Firm. | |
| 23.2 | Consent of BDO AG Wirtschaftsprüfungsgesellschaft Independent Registered Public Accounting Firm. | |
| 23.3* | Consent of Kirkland & Ellis LLP (included in Exhibit 5.1). | |
| 24.1 | Power of Attorney (included on the signature page of this Registration Statement). | |
| * | To be filed by amendment. |
| + | Management Contract or Compensatory Plan or Arrangement. |
II-7