Attached files
| file | filename |
|---|---|
| 8-K - 8-K - METLIFE INC | d313112d8k.htm |
| Exhibit 99.1
|
MetLife Navigating life together
MetLife 2016 Outlook Call
December 16, 2016
|
|

Introduction
John A. Hall
Senior Vice President, Investor Relations
|
|
Cautionary Statement on Forward-
Looking Statements and Non-GAAP
Financial Information
|
|

Safe Harbor Statement
This presentation may contain or incorporate by reference information that includes or is based upon forward-looking statements within the meaning of the Private Securities Litigation
Reform Act of 1995. Forward-looking statements give expectations or forecasts of future events. These statements can be identified by the fact that they do not relate strictly to historical or
current facts. They use words and terms such as “anticipate,” “estimate,” “expect,” “project,” “intend,” “plan,” “believe“, “target,” “could,” “continue,” “will,” “would,” “to come,” “guidance,”
“on track,” “movement”, “outlook,” “forecast,” “translates to,” “growth,” “impact,” “forward,” “decline,” “revisions” and other words and terms of similar meaning, or are tied to future periods,
in connection with a discussion of future operating or financial performance. In particular, these include statements relating to future actions, prospective services or products, future
performance or results of current and anticipated services or products, sales efforts, expenses, the outcome of contingencies such as legal proceedings, trends in operations and financial
results. Statements labeled “Key Sensitivities” and “Near-Term Guidance” are also forward-looking, unless they expressly relate strictly to historical or current facts.
Any or all forward-looking statements may turn out to be wrong. They can be affected by inaccurate assumptions or by known or unknown risks and uncertainties. Many such factors will
be important in determining the actual future results of MetLife, Inc., its subsidiaries and affiliates. These statements are based on current expectations and the current economic
environment. They involve a number of risks and uncertainties that are difficult to predict. These statements are not guarantees of future performance. Actual results could differ materially
from those expressed or implied in the forward-looking statements. Risks, uncertainties, and other factors that might cause such differences include the risks, uncertainties and other
factors identified in MetLife, Inc.’s filings with the U.S. Securities and Exchange Commission. These factors include: (1) difficult conditions in the global capital markets; (2) increased
volatility and disruption of the global capital and credit markets, which may affect our ability to meet liquidity needs and access capital, including through our credit facilities, generate fee
income and market-related revenue and finance statutory reserve requirements and may require us to pledge collateral or make payments related to declines in value of specified assets,
including assets supporting risks ceded to certain of our captive reinsurers or hedging arrangements associated with those risks; (3) exposure to global financial and capital market risks,
including as a result of the pending withdrawal of the United Kingdom from the European Union, other disruption in Europe and possible withdrawal of one or more countries from the Euro
zone; (4) impact on us of comprehensive financial services regulation reform, including potential regulation of MetLife, Inc. as a non-bank systemically important financial institution, or
otherwise; (5) numerous rulemaking initiatives required or permitted by the Dodd-Frank Wall Street Reform and Consumer Protection Act which may impact how we conduct our business,
including those compelling the liquidation of certain financial institutions; (6) regulatory, legislative or tax changes relating to our insurance, international, or other operations that may affect
the cost of, or demand for, our products or services, or increase the cost or administrative burdens of providing benefits to employees; (7) adverse results or other consequences from
litigation, arbitration or regulatory investigations; (8) unanticipated developments that could delay, prevent or otherwise adversely affect the separation of Brighthouse Financial; (9) our
ability to address difficulties, unforeseen liabilities, asset impairments, or rating agency actions arising from (a) business acquisitions and integrating and managing the growth of such
acquired businesses, (b) dispositions of businesses via sale, initial public offering, spin-off or otherwise, including failure to achieve projected operational benefit from such transactions; (c)
entry into joint ventures, or (d) legal entity reorganizations; (10) potential liquidity and other risks resulting from our participation in a securities lending program and other transactions,
including any separated business’ incurrence of debt in connection with such a separation; (11) investment losses and defaults, and changes to investment valuations; (12) changes in
assumptions related to investment valuations, deferred policy acquisition costs, deferred sales inducements, value of business acquired or goodwill; (13) impairments of goodwill and
realized losses or market value impairments to illiquid assets; (14) defaults on our mortgage loans; (15) the defaults or deteriorating credit of other financial institutions that could adversely
affect us; (16) economic, political, legal, currency and other risks relating to our international operations, including with respect to fluctuations of exchange rates; (17) downgrades in our
claims paying ability, financial strength or credit ratings; (18) a deterioration in the experience of the closed block established in connection with the reorganization of Metropolitan Life
3(i)
|
|
Safe Harbor Statement (Continued)
Insurance Company; (19) availability and effectiveness of reinsurance, hedging, or indemnification arrangements, as well as any default or failure of counterparties to perform;
(20) differences between actual claims experience and underwriting and reserving assumptions; (21) ineffectiveness of risk management policies and procedures; (22) catastrophe losses;
(23) increasing cost and limited market capacity for statutory life insurance reserve financings; (24) heightened competition, including with respect to pricing, entry of new competitors,
consolidation of distributors, the development of new products by new and existing competitors, and for personnel; (25) exposure to losses related to variable annuity guarantee benefits,
including from significant and sustained downturns or extreme volatility in equity markets, reduced interest rates, unanticipated policyholder behavior, mortality or longevity, and any
adjustment for nonperformance risk; (26) legal, regulatory and other restrictions affecting MetLife, Inc.’s ability to pay dividends and repurchase common stock; (27) MetLife, Inc.’s and its
subsidiary holding companies’ primary reliance, as holding companies, on dividends from its subsidiaries to meet its free cash flow targets and debt payment obligations and the applicable
regulatory restrictions on the ability of the subsidiaries to pay such dividends; (28) the possibility that MetLife, Inc.’s Board of Directors may influence the outcome of stockholder votes
through the voting provisions of the MetLife Policyholder Trust; (29) changes in accounting standards, practices and/or policies; (30) increased expenses relating to pension and
postretirement benefit plans, as well as health care and other employee benefits; (31) inability to protect our intellectual property rights or claims of infringement of the intellectual property
rights of others; (32) difficulties in marketing and distributing products through our distribution channels; (33) provisions of laws and our incorporation documents may delay, deter or
prevent takeovers and corporate combinations involving MetLife; (34) the effects of business disruption or economic contraction due to disasters such as terrorist attacks, cyberattacks,
other hostilities, or natural catastrophes, including any related impact on the value of our investment portfolio, our disaster recovery systems, cyber- or other information security systems
and management continuity planning; (35) any failure to protect the confidentiality of client information; (36) the effectiveness of our programs and practices in avoiding giving our
associates incentives to take excessive risks; (37) restrictions, liabilities, losses or indemnification obligations arising from any transitional services or tax arrangements related to the
separation of any business, or from the failure of such a separation to qualify for any intended tax-free treatment; and (38) other risks and uncertainties described from time to time in
MetLife, Inc.’s filings with the U.S. Securities and Exchange Commission.
MetLife, Inc. does not undertake any obligation to publicly correct or update any forward-looking statement if MetLife, Inc. later becomes aware that such statement is not likely to be
achieved. Please consult any further disclosures MetLife, Inc. makes on related subjects in reports to the U.S. Securities and Exchange Commission.
3(ii)
|
|
Explanatory Note on Non-GAAP Financial
Information
In this presentation, MetLife, Inc. presents certain measures of its performance that are not calculated in accordance with accounting principles generally accepted in the United States of
America (“GAAP”). MetLife believes that these non-GAAP financial measures enhance the understanding of MetLife’s performance by highlighting the results of operations and the
underlying profitability drivers of the business.
The following non-GAAP financial measures should not be viewed as substitutes for the most directly comparable financial measures calculated in accordance with GAAP:
Reconciliations of these measures to the most directly comparable GAAP measures are included in this presentation. A reconciliation of these non-GAAP measures to the most directly
comparable GAAP measures is not accessible on a forward-looking basis because we believe it is not possible without unreasonable efforts to provide other than a range of net
investment gains and losses and net derivative gains and losses, which can fluctuate significantly within or outside the range and from period to period and may have a material impact on
net income.
MetLife’s definitions of the various non-GAAP and other financial measures discussed in this presentation may differ from those used by other companies:
Any references in this presentation (except in this Cautionary Statement on
Forward-Looking Statements and Non-GAAP Financial Information) to: should be read as, respectively:
(i) operating earnings; and (i) operating earnings available to common shareholders; and
(ii) reported operating earnings (ii) operating earnings available to common shareholders.
3(iii)
Non-GAAP financial measures: Comparable GAAP financial measures:
(i) baseline operating earnings (i) operating earnings available to common shareholders
|
|
Operating earnings and related measures:
• operating earnings; and
• operating earnings available to common shareholders
These measures are used by management to evaluate performance and allocate resources. Consistent with GAAP guidance for segment reporting, operating earnings is also MetLife’s
GAAP measure of segment performance. Operating earnings and other financial measures based on operating earnings are also the measures by which MetLife senior management’s
and many other employees’ performance is evaluated for the purposes of determining their compensation under applicable compensation plans. Operating earnings and other financial
measures based on operating earnings allow analysis of our performance relative to our business plan and facilitate comparisons to industry results.
Operating earnings is defined as operating revenues less operating expenses, both net of income tax. Operating earnings available to common shareholders is defined as operating
earnings less preferred stock dividends.
Operating revenues and operating expenses
These financial measures, along with the related operating premiums, fees and other revenues, focus on our primary businesses principally by excluding the impact of market volatility,
which could distort trends, and revenues and costs related to non-core products and divested businesses and certain entities required to be consolidated under GAAP. Also, these
measures exclude results of discontinued operations and other businesses that have been or will be sold or exited by MetLife and are referred to as divested businesses. In addition,
for the three months ended March 31, 2016 and for the nine months ended September 30, 2016, operating revenues and operating expenses exclude the financial impact of
converting MetLife’s Japan operations to calendar-year end reporting without retrospective application of this change to prior periods and is referred to as lag elimination. Operating
revenues also excludes net investment gains (losses) (“NIGL”) and net derivative gains (losses) (“NDGL”). Operating expenses also excludes goodwill impairments.
The following additional adjustments are made to revenues, in the line items indicated, in calculating operating revenues:
• Universal life and investment-type product policy fees excludes the amortization of unearned revenue related to NIGL and NDGL and certain variable annuity guaranteed
minimum income benefits (“GMIB”) fees (“GMIB Fees”);
• Net investment income: (i) includes earned income on derivatives and amortization of premium on derivatives that are hedges of investments or that are used to replicate
certain investments but do not qualify for hedge accounting treatment, (ii) excludes post-tax operating earnings adjustments relating to insurance joint ventures accounted for
under the equity method, (iii) excludes certain amounts related to contractholder-directed unit-linked investments, and (v) excludes certain amounts related to securitization
entities that are variable interest entities (“VIEs”) consolidated under GAAP; and
• Other revenues are adjusted for settlements of foreign currency earnings hedges.
Explanatory Note on Non-GAAP Financial
Information (Continued)
3(iv)
|
|
Explanatory Note on Non-GAAP Financial
Information (Continued)
The following additional adjustments are made to expenses, in the line items indicated, in calculating operating expenses:
• Policyholder benefits and claims and policyholder dividends excludes: (i) changes in the policyholder dividend obligation related to NIGL and NDGL, (ii) inflation-indexed benefit
adjustments associated with contracts backed by inflation-indexed investments and amounts associated with periodic crediting rate adjustments based on the total return of a
contractually referenced pool of assets and other pass through adjustments, (iii) benefits and hedging costs related to GMIBs (GMIB costs), and (iv) market value adjustments
associated with surrenders or terminations of contracts (Market Value Adjustments);
• Interest credited to policyholder account balances includes adjustments for earned income on derivatives and amortization of premium on derivatives that are hedges of
policyholder account balances but do not qualify for hedge accounting treatment and excludes amounts related to net investment income earned on contractholder-directed
unit-linked investments;
• Amortization of deferred policy acquisition costs (“DAC”) and value of business acquired (“VOBA”) excludes amounts related to: (i) NIGL and NDGL, (ii) GMIB fees and GMIB
costs and (iii) Market Value Adjustments;
• Amortization of negative VOBA excludes amounts related to Market Value Adjustments;
• Interest expense on debt excludes certain amounts related to securitization entities that are VIEs consolidated under GAAP; and
• Other operating expenses excludes costs related to: (i) noncontrolling interests, (ii) implementation of new insurance regulatory requirements, and (iii) acquisition, integration
and other costs.
Operating earnings also excludes the recognition of certain contingent assets and liabilities that could not be recognized at acquisition or adjusted for during the measurement period under
GAAP business combination accounting guidance.
The tax impact of the adjustments mentioned are calculated net of the U.S. or foreign statutory tax rate, which could differ from MetLife’s effective tax rate. Additionally, the provision for
income tax (expense) benefit also includes the impact related to the timing of certain tax credits, as well as certain tax reforms.
3(v)
|
|
Explanatory Note on Non-GAAP Financial
Information (Continued)
Baseline operating earnings
MetLife also refers to segment-level baseline operating earnings in this presentation. MetLife believes that this presentation of baseline operating earnings enhances the
understanding of its performance by providing a level of operating earnings that investors should consider in evaluating and forecasting operating earnings.
Baseline operating earnings is operating earnings, adjusted for total notable items as well as other noteworthy items, if applicable:
• Total notable items, as reported and disclosed quarterly in our filings, are impacts to operating earnings that management believes affect the operating earnings trend at the
total consolidated enterprise level.
• Other noteworthy items are additional impacts to operating earnings that are segment-specific and unique in nature to the region that management believes affect the
operating earnings trend at the segment level only.
The following additional information is relevant to an understanding of MetLife’s performance results:
• Statistical sales information for U.S. and MetLife Holdings are calculated (i) for life sales using the LIMRA definition of sales for core direct sales, excluding companysponsored
internal exchanges, corporate-owned life insurance, bank-owned life insurance, and private placement variable universal life insurance, and (ii) annuity sales
consist of statutory premiums direct and assumed, excluding company sponsored internal exchanges. Sales statistics do not correspond to revenues under GAAP, but are
used as relevant measures of business activity.
• Statistical sales information for Latin America, Asia and EMEA is calculated using 10% of single-premium deposits (mainly from retirement products such as variable annuity,
fixed annuity and pensions), 20% of single-premium deposits from credit insurance and 100% of annualized full-year premiums and fees from recurring-premium policy sales
of all products (mainly from risk and protection products such as individual life, accident & health and group). Sales statistics do not correspond to revenues under GAAP,
but are used as relevant measures of business activity.
• All comparisons on a constant currency basis reflect the impact of changes in foreign currency exchange rates and are calculated using the average foreign currency
exchange rates for the current period and are applied to each of the comparable periods.
3(vi)
|
|
Explanatory Note on Non-GAAP Financial
Information (Continued)
• MetLife uses a measure of free cash flow to facilitate an understanding of its ability to generate cash for reinvestment into its businesses or use in discretionary capital
actions. MetLife defines free cash flow as the sum of cash available at MetLife’s holding companies from dividends from operating subsidiaries, expenses and other net
flows of the holding companies (including capital contributions to subsidiaries), and net contributions from debt to be at or below target leverage ratios. This measure of free
cash flow is prior to discretionary capital deployment, including common stock dividends and repurchases, debt reduction and mergers and acquisitions. Free cash flow
should not be viewed as a substitute for net cash provided by (used in) operating activities calculated in accordance with GAAP. The free cash flow ratio is typically
expressed as a percentage of annual operating earnings available to common shareholders.
3(vii)
|
|

Agenda
1. Overview
Steven A. Kandarian, Chairman, President & Chief Executive Officer
2. U.S.
Maria Morris, Executive Vice President, Global Employee Benefits & Interim Head of U.S.
3. Asia
Christopher Townsend, President, Asia
4. Latin America
Oscar Schmidt, Executive Vice President, Latin America
5. EMEA
Michel Khalaf, President, Europe, Middle East and Africa
6. MetLife Holdings
Frank Cassandra, Senior Vice President, MetLife Holdings
7. Financial Update
John C. R. Hele, Chief Financial Officer
8. Q&A
9. Closing Remarks
Steven A. Kandarian, Chairman, President & Chief Executive Officer
4
|
|

Overview
Steven A. Kandarian
Chairman, President & Chief Executive Officer
|
|

• Refreshed strategy driving shareholder value creation
• Striking the right balance between cash and growth
• Returning excess capital to shareholders
• Today’s call will aid multi-year forecasting
6
Overview
|
|
U.S.
Maria Morris
Executive Vice President
Global Employee Benefits & Interim Head of U.S.
|
|
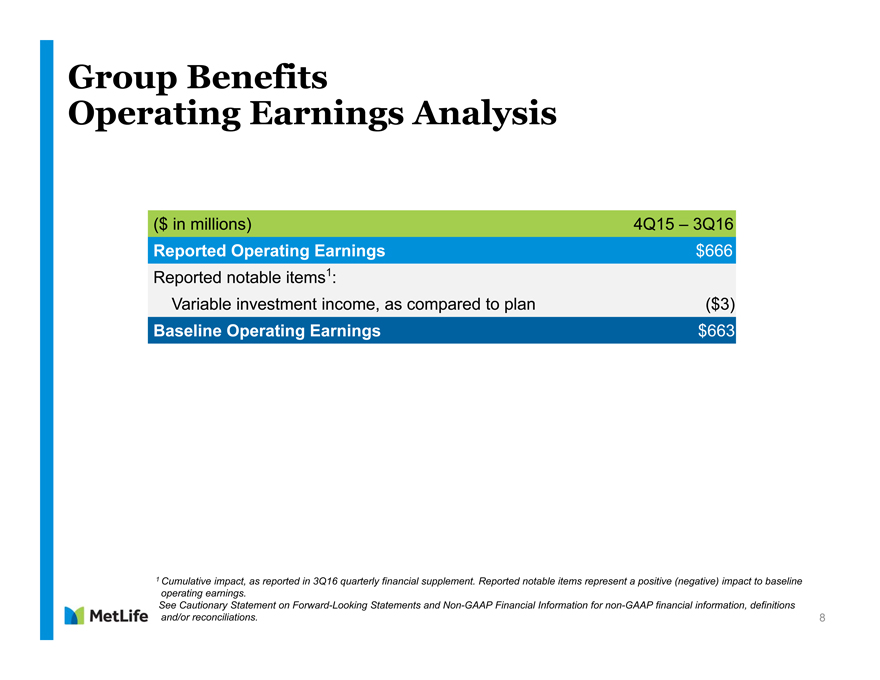
Group Benefits
Operating Earnings Analysis
($ in millions) 4Q15 – 3Q16
Reported Operating Earnings $666
Reported notable items1:
Variable investment income, as compared to plan ($3)
Baseline Operating Earnings $663
1 Cumulative impact, as reported in 3Q16 quarterly financial supplement. Reported notable items represent a positive (negative) impact to baseline
operating earnings.
See Cautionary Statement on Forward-Looking Statements and Non-GAAP Financial Information for non-GAAP financial information, definitions
and/or reconciliations. 8
|
|
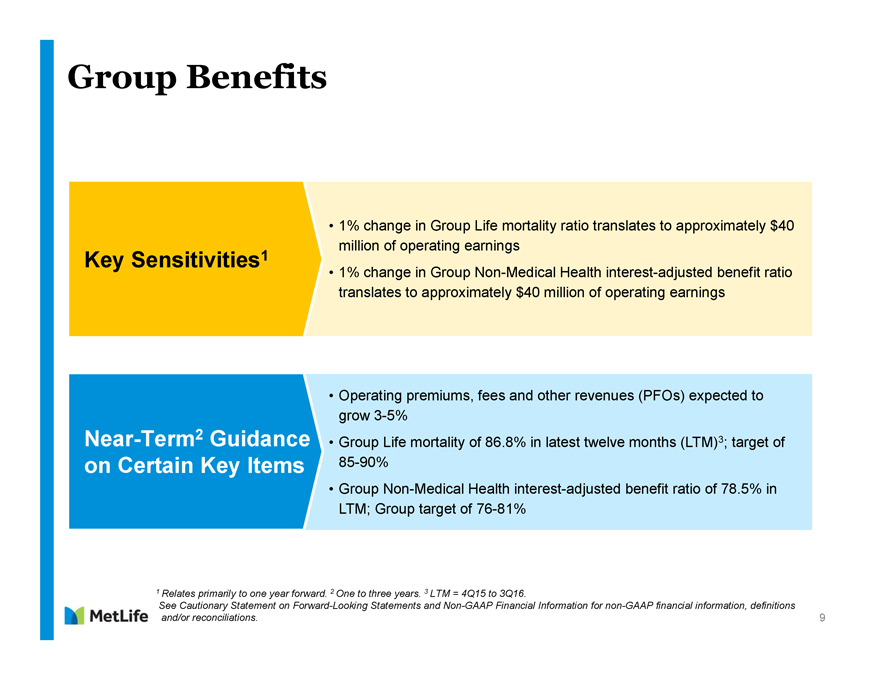
Group Benefits
Key Sensitivities1
Near-Term2 Guidance
on Certain Key Items
1 Relates primarily to one year forward. 2 One to three years. 3 LTM = 4Q15 to 3Q16.
See Cautionary Statement on Forward-Looking Statements and Non-GAAP Financial Information for non-GAAP financial information, definitions
and/or reconciliations.
1% change in Group Life mortality ratio translates to approximately $40
million of operating earnings
1% change in Group Non-Medical Health interest-adjusted benefit ratio translates to approximately $40 million of operating earnings
Operating premiums, fees and other revenues (PFOs) expected to
grow 3-5%
Group Life mortality of 86.8% in latest twelve months (LTM)3; target of
85-90%
Group Non-Medical Health interest-adjusted benefit ratio of 78.5% in
LTM; Group target of 76-81%
9
|
|
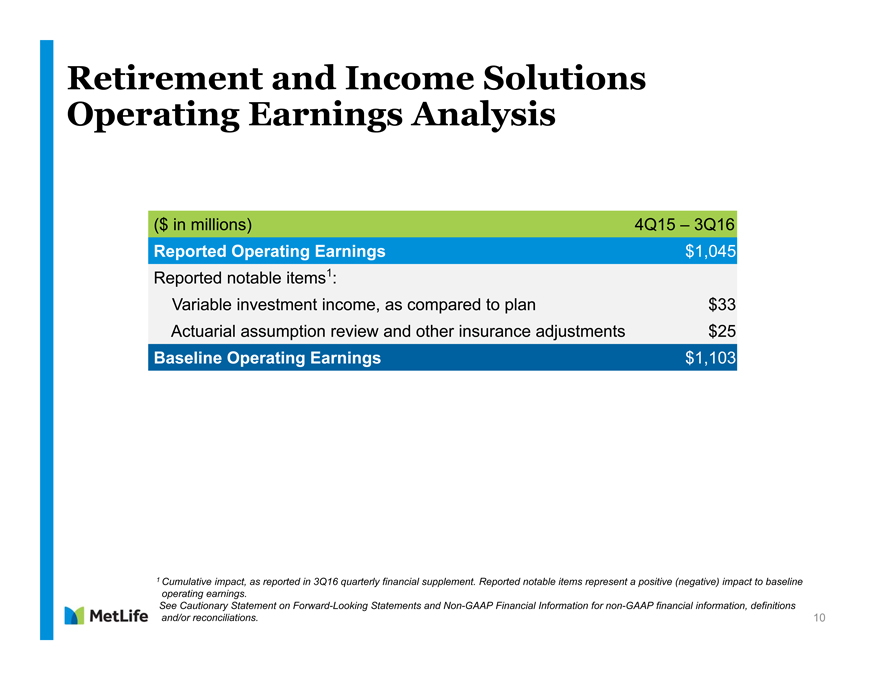
Retirement and Income Solutions
Operating Earnings Analysis
($ in millions) 4Q15 – 3Q16
Reported Operating Earnings $1,045
Reported notable items1:
Variable investment income, as compared to plan $33
Actuarial assumption review and other insurance adjustments $25
Baseline Operating Earnings $1,103
1 Cumulative impact, as reported in 3Q16 quarterly financial supplement. Reported notable items represent a positive (negative) impact to baseline
operating earnings.
See Cautionary Statement on Forward-Looking Statements and Non-GAAP Financial Information for non-GAAP financial information, definitions
and/or reconciliations. 10
|
|
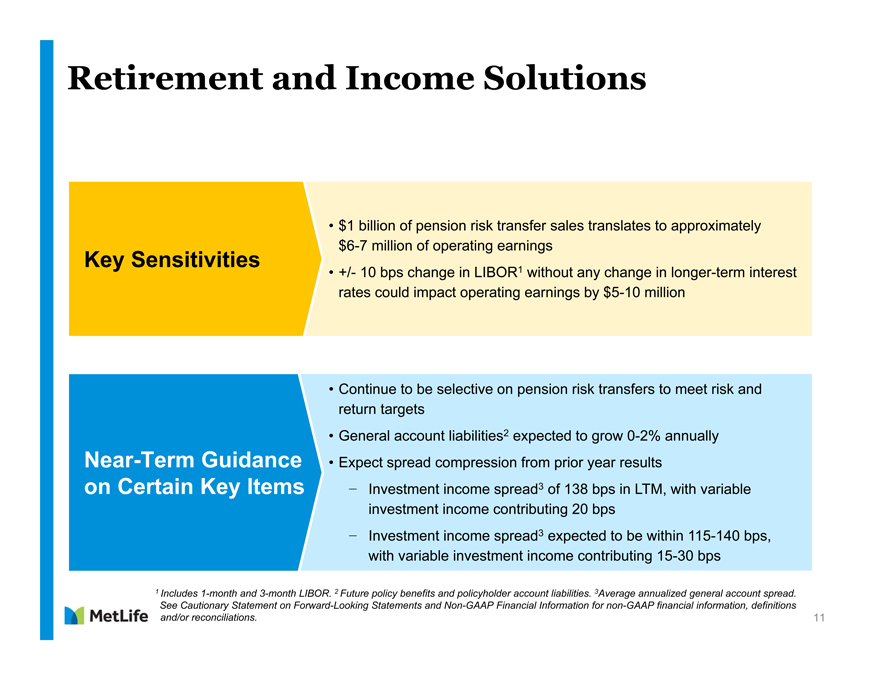
• Continue to be selective on pension risk transfers to meet risk and
return targets
• General account liabilities2 expected to grow 0-2% annually
• Expect spread compression from prior year results
- Investment income spread3 of 138 bps in LTM, with variable
investment income contributing 20 bps
- Investment income spread3 expected to be within 115-140 bps,
with variable investment income contributing 15-30 bps
• $1 billion of pension risk transfer sales translates to approximately
$6-7 million of operating earnings
• +/- 10 bps change in LIBOR1 without any change in longer-term interest
rates could impact operating earnings by $5-10 million
Retirement and Income Solutions
Key Sensitivities
Near-Term Guidance
on Certain Key Items
1 Includes 1-month and 3-month LIBOR. 2 Future policy benefits and policyholder account liabilities. 3Average annualized general account spread.
See Cautionary Statement on Forward-Looking Statements and Non-GAAP Financial Information for non-GAAP financial information, definitions
and/or reconciliations. 11
|
|
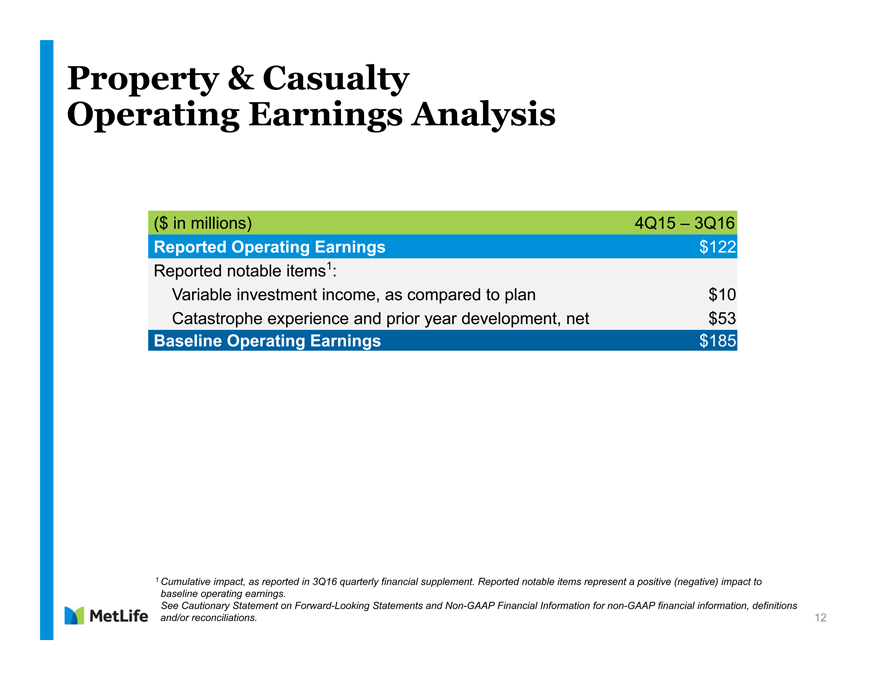
($ in millions) 4Q15 – 3Q16
Reported Operating Earnings $122
Reported notable items1:
Variable investment income, as compared to plan $10
Catastrophe experience and prior year development, net $53
Baseline Operating Earnings $185
Property & Casualty
Operating Earnings Analysis
1 Cumulative impact, as reported in 3Q16 quarterly financial supplement. Reported notable items represent a positive (negative) impact to
baseline operating earnings.
See Cautionary Statement on Forward-Looking Statements and Non-GAAP Financial Information for non-GAAP financial information, definitions
and/or reconciliations. 12
|
|
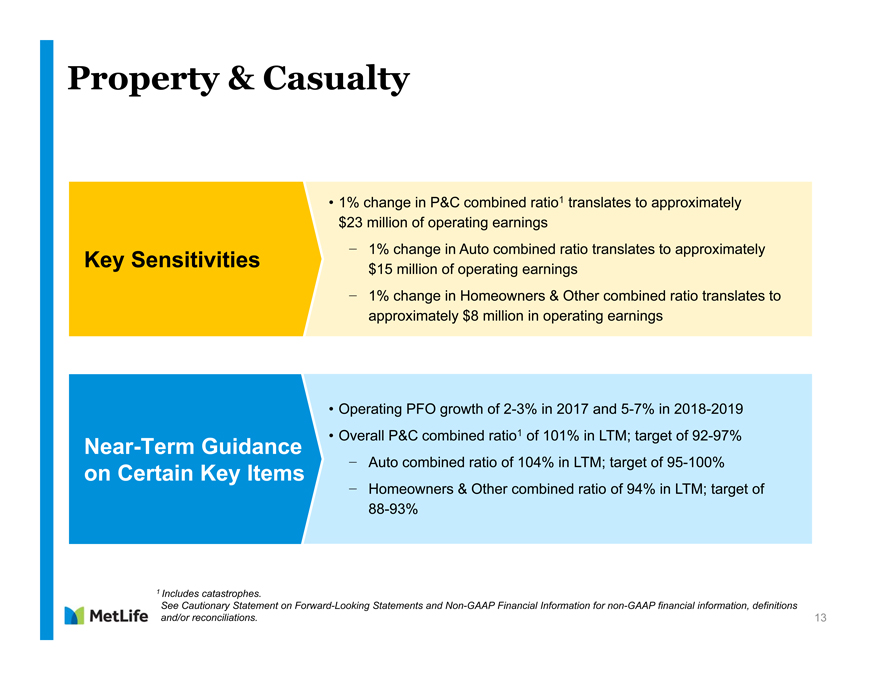
• Operating PFO growth of 2-3% in 2017 and 5-7% in 2018-2019
• Overall P&C combined ratio1 of 101% in LTM; target of 92-97%
- Auto combined ratio of 104% in LTM; target of 95-100%
- Homeowners & Other combined ratio of 94% in LTM; target of
88-93%
• 1% change in P&C combined ratio1 translates to approximately
$23 million of operating earnings
- 1% change in Auto combined ratio translates to approximately
$15 million of operating earnings
- 1% change in Homeowners & Other combined ratio translates to
approximately $8 million in operating earnings
Property & Casualty
Key Sensitivities
Near-Term Guidance
on Certain Key Items
13
1 Includes catastrophes.
See Cautionary Statement on Forward-Looking Statements and Non-GAAP Financial Information for non-GAAP financial information, definitions
and/or reconciliations.
|
|

Asia
Christopher Townsend
President, Asia
|
|
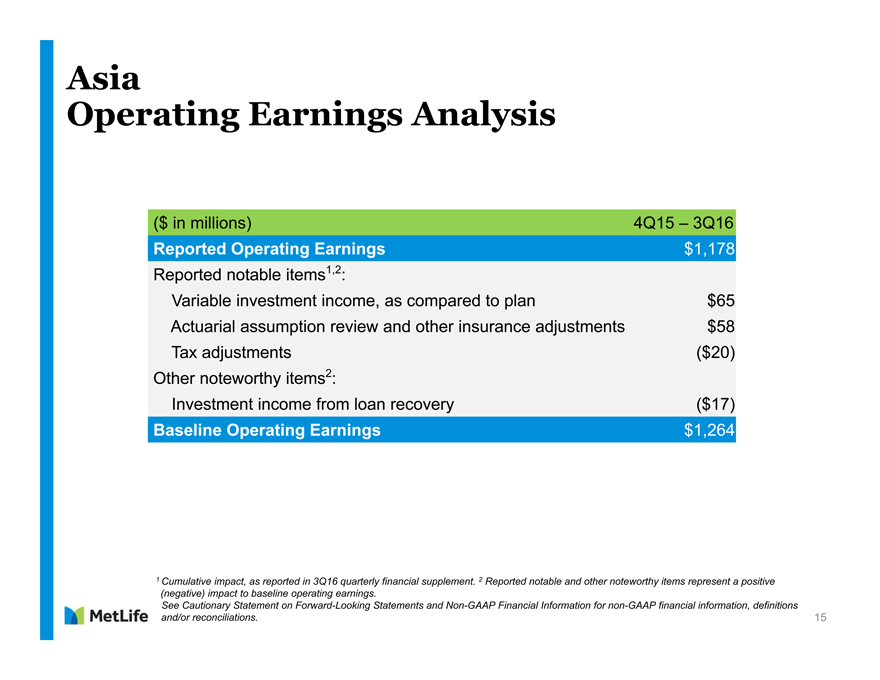
($ in millions) 4Q15 – 3Q16
Reported Operating Earnings $1,178
Reported notable items1,2:
Variable investment income, as compared to plan $65
Actuarial assumption review and other insurance adjustments $58
Tax adjustments ($20)
Other noteworthy items2:
Investment income from loan recovery ($17)
Baseline Operating Earnings $1,264
15
Asia
Operating Earnings Analysis
1 Cumulative impact, as reported in 3Q16 quarterly financial supplement. 2 Reported notable and other noteworthy items represent a positive
(negative) impact to baseline operating earnings.
See Cautionary Statement on Forward-Looking Statements and Non-GAAP Financial Information for non-GAAP financial information, definitions
and/or reconciliations.
|
|
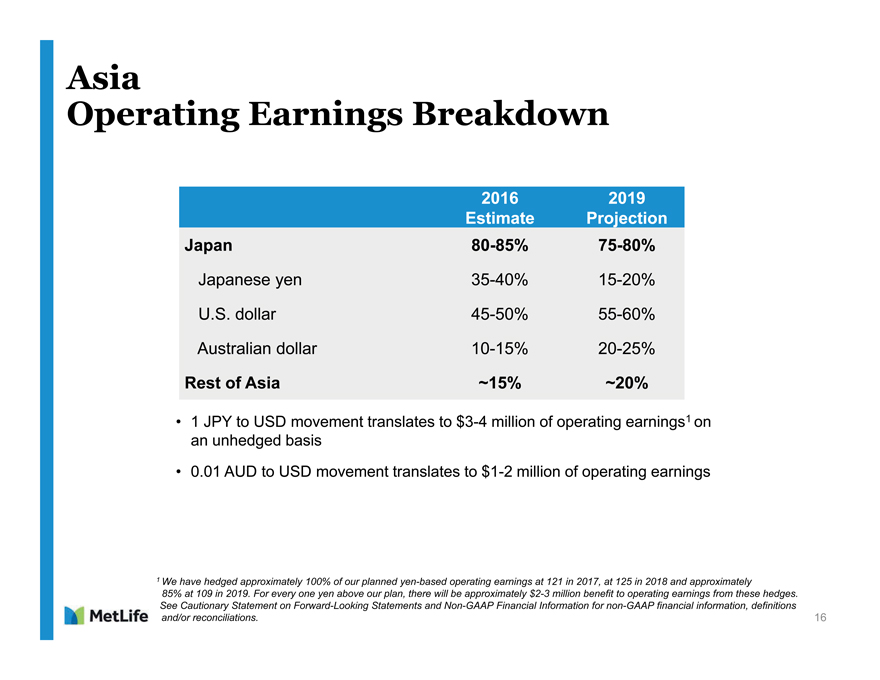
Asia Operating Earnings Breakdown 2016 2019 Estimate Projection Japan 80-85% 75-80% Japanese yen 35-40% 15-20% U.S. dollar 45-50% 55-60% Australian dollar 10-15% 20-25 Rest of Asia ~15% ~20%• 1 JPY to USD movement translates to $3-4 million of operating earnings 1 on an unhedged basis• 0.01 AUD to USD movement translates to $1-2 million of operating earnings 1 We have hedged approximately 100% of our planned yen-based operating earnings at 121 in 2017, at 125 in 2018 and approximately 85% at 109 in 2019. For every one yen above our plan, there will be approximately $2-3 million benefit to operating earnings from these hedges. See Cautionary Statement on Forward-Looking Statements and Non-GAAP Financial Information for non-GAAP financial information, definitions and/or reconciliations. 16 Metlife
|
|
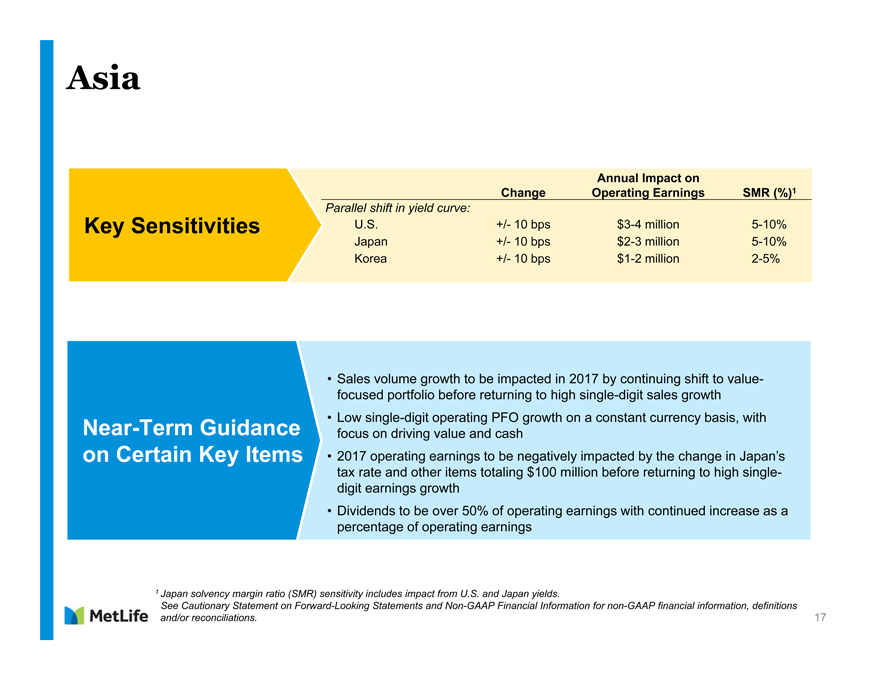
Change
Annual Impact on
Operating Earnings SMR (%)1
Parallel shift in yield curve:
U.S. +/- 10 bps $3-4 million 5-10%
Japan +/- 10 bps $2-3 million 5-10%
Korea +/- 10 bps $1-2 million 2-5%
17
Asia
• Sales volume growth to be impacted in 2017 by continuing shift to valuefocused
portfolio before returning to high single-digit sales growth
• Low single-digit operating PFO growth on a constant currency basis, with
focus on driving value and cash
• 2017 operating earnings to be negatively impacted by the change in Japan’s
tax rate and other items totaling $100 million before returning to high singledigit
earnings growth
• Dividends to be over 50% of operating earnings with continued increase as a
percentage of operating earnings
Near-Term Guidance
on Certain Key Items
1 Japan solvency margin ratio (SMR) sensitivity includes impact from U.S. and Japan yields.
See Cautionary Statement on Forward-Looking Statements and Non-GAAP Financial Information for non-GAAP financial information, definitions
and/or reconciliations.
Key Sensitivities
|
|

Latin America
Oscar Schmidt
Executive Vice President, Latin America
|
|
19
Latin America
Operating Earnings Analysis
1 Cumulative impact, as reported in 3Q16 quarterly financial supplement. 2 Reported notable and other noteworthy items represent a positive
(negative) impact to baseline operating earnings.
See Cautionary Statement on Forward-Looking Statements and Non-GAAP Financial Information for non-GAAP financial information, definitions
and/or reconciliations.
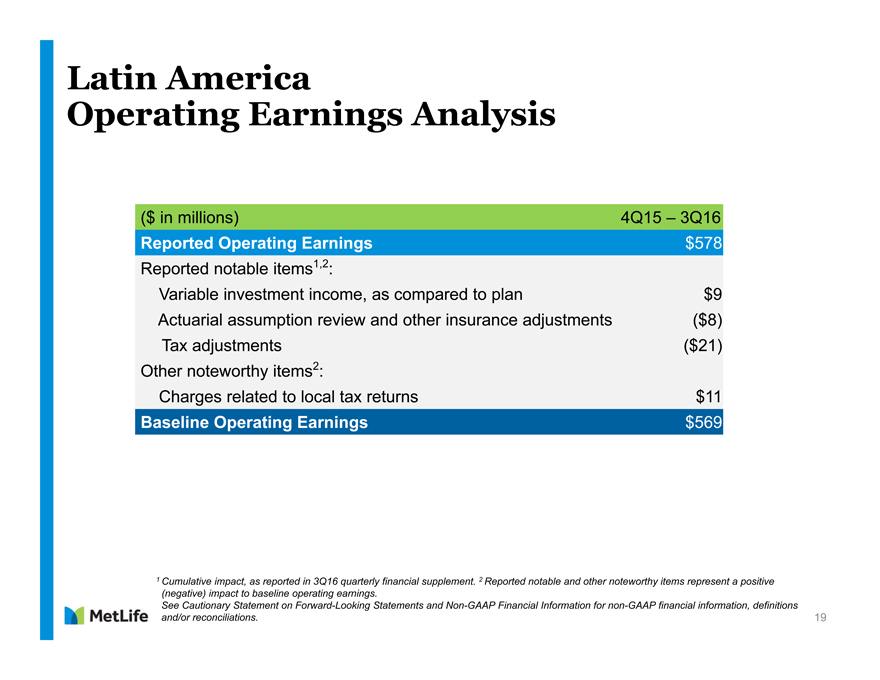
($ in millions) 4Q15 – 3Q16
Reported Operating Earnings $578
Reported notable items1,2:
Variable investment income, as compared to plan $9
Actuarial assumption review and other insurance adjustments ($8)
Tax adjustments ($21)
Other noteworthy items2:
Charges related to local tax returns $11
Baseline Operating Earnings $569
|
|
Latin America
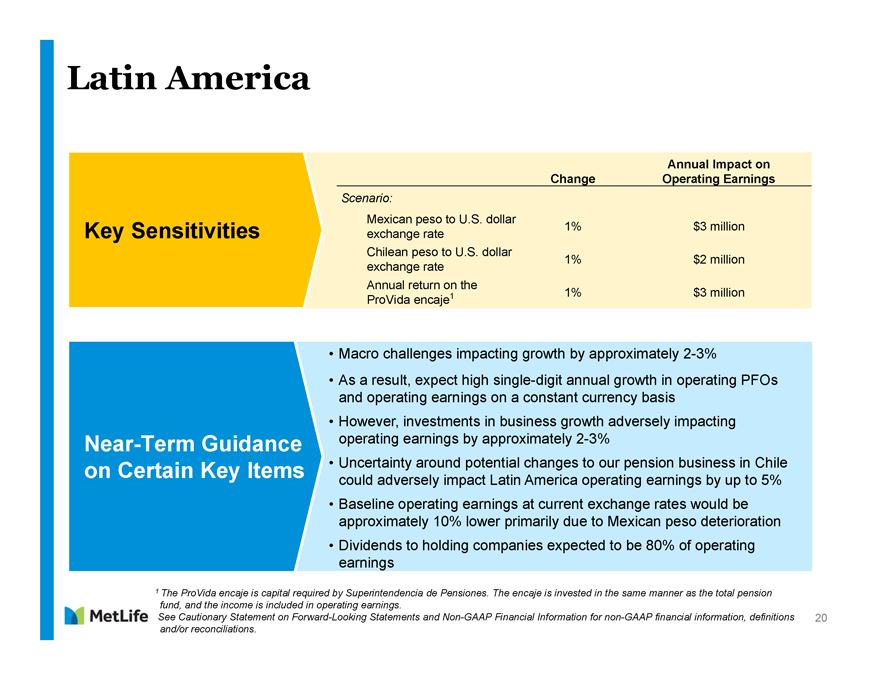
Macro challenges impacting growth by approximately 2-3%
As a result, expect high single-digit annual growth in operating PFOs
and operating earnings on a constant currency basis
However, investments in business growth adversely impacting
operating earnings by approximately 2-3%
Uncertainty around potential changes to our pension business in Chile
could adversely impact Latin America operating earnings by up to 5%
Baseline operating earnings at current exchange rates would be
approximately 10% lower primarily due to Mexican peso deterioration
Dividends to holding companies expected to be 80% of operating
Earnings
Scenario:
Mexican peso to U.S. dollar
exchange rate 1% $3 million
Chilean peso to U.S. dollar
exchange rate 1% $2 million
Annual return on the
ProVida encaje1 1% $3 million
Change
Annual Impact on
Operating Earnings
Key Sensitivities
Near-Term Guidance
on Certain Key Items
1 The ProVida encaje is capital required by Superintendencia de Pensiones. The encaje is invested in the same manner as the total pension
fund, and the income is included in operating earnings.
See Cautionary Statement on Forward-Looking Statements and Non-GAAP Financial Information for non-GAAP financial information, definitions and/or reconciliations.
20
|
|

EMEA
Michel Khalaf
President, Europe, Middle East and Africa
|
|
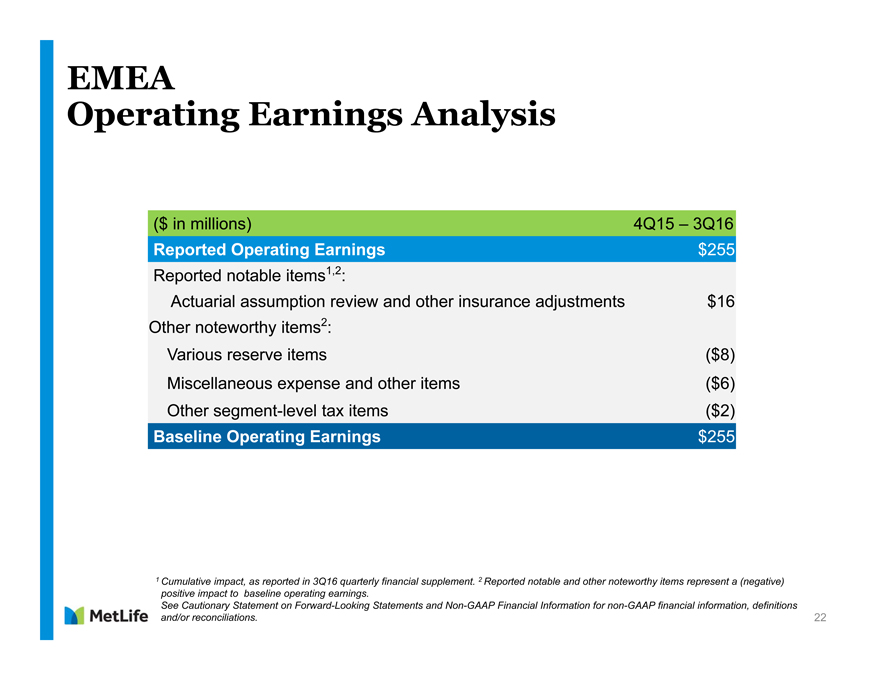
($ in millions) 4Q15 – 3Q16
Reported Operating Earnings $255
Reported notable items1,2:
Actuarial assumption review and other insurance adjustments $16
Other noteworthy items2:
Various reserve items ($8)
Miscellaneous expense and other items ($6)
Other segment-level tax items ($2)
Baseline Operating Earnings $255
22
EMEA
Operating Earnings Analysis
1 Cumulative impact, as reported in 3Q16 quarterly financial supplement. 2 Reported notable and other noteworthy items represent a (negative)
positive impact to baseline operating earnings.
See Cautionary Statement on Forward-Looking Statements and Non-GAAP Financial Information for non-GAAP financial information, definitions
and/or reconciliations.
|
|
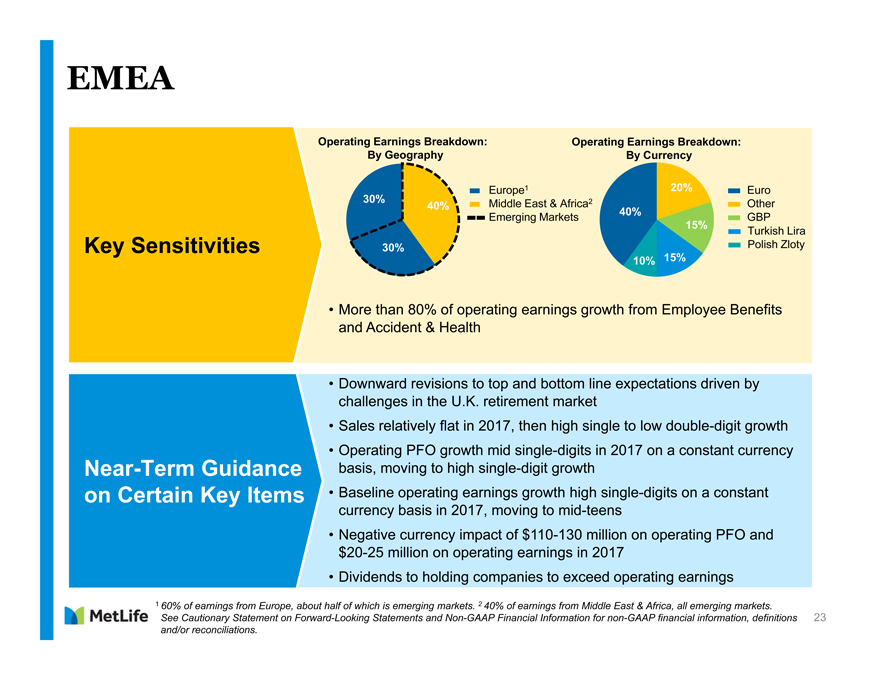
• Downward revisions to top and bottom line expectations driven by
challenges in the U.K. retirement market
• Sales relatively flat in 2017, then high single to low double-digit growth
• Operating PFO growth mid single-digits in 2017 on a constant currency
basis, moving to high single-digit growth
• Baseline operating earnings growth high single-digits on a constant
currency basis in 2017, moving to mid-teens
• Negative currency impact of $110-130 million on operating PFO and
$20-25 million on operating earnings in 2017
• Dividends to holding companies to exceed operating earnings
• More than 80% of operating earnings growth from Employee Benefits
and Accident & Health
EMEA
Key Sensitivities
Near-Term Guidance
on Certain Key Items
23
1 60% of earnings from Europe, about half of which is emerging markets. 2 40% of earnings from Middle East & Africa, all emerging markets.
See Cautionary Statement on Forward-Looking Statements and Non-GAAP Financial Information for non-GAAP financial information, definitions
and/or reconciliations.
40%
Emerging Markets
Middle East & Africa2
Europe1
GBP
Other
Euro
Polish Zloty
Turkish Lira
40%
20%
15%
10% 15%
30%
30%
Operating Earnings Breakdown:
By Geography
Operating Earnings Breakdown:
By Currency
|
|

MetLife Holdings
Frank Cassandra
Senior Vice President, MetLife Holdings
|
|
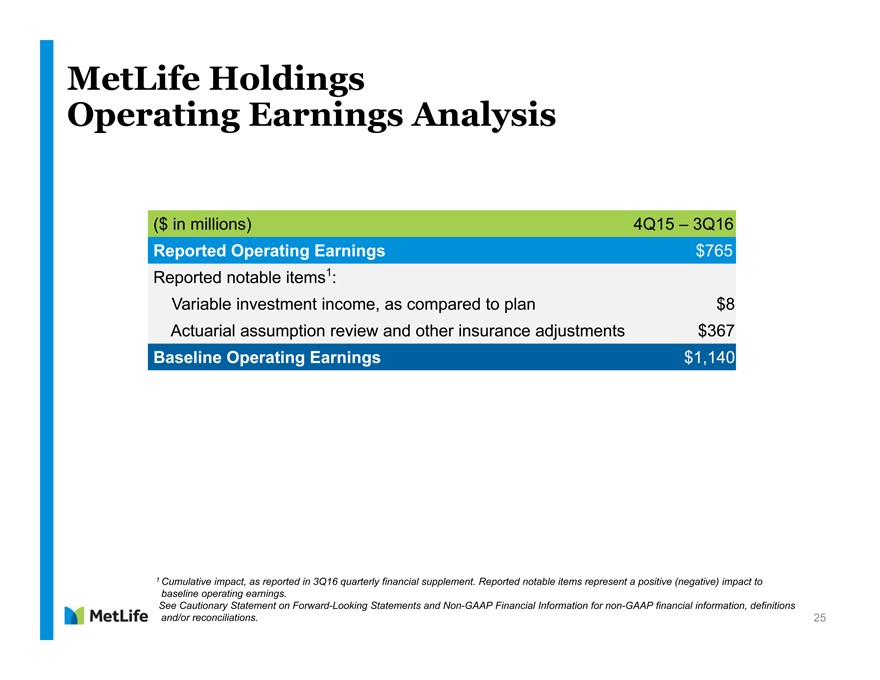
MetLife Holdings
Operating Earnings Analysis
($ in millions) 4Q15 – 3Q16
Reported Operating Earnings $765
Reported notable items1:
Variable investment income, as compared to plan $8
Actuarial assumption review and other insurance adjustments $367
Baseline Operating Earnings $1,140
1 Cumulative impact, as reported in 3Q16 quarterly financial supplement. Reported notable items represent a positive (negative) impact to
baseline operating earnings.
See Cautionary Statement on Forward-Looking Statements and Non-GAAP Financial Information for non-GAAP financial information, definitions
and/or reconciliations. 25
|
|
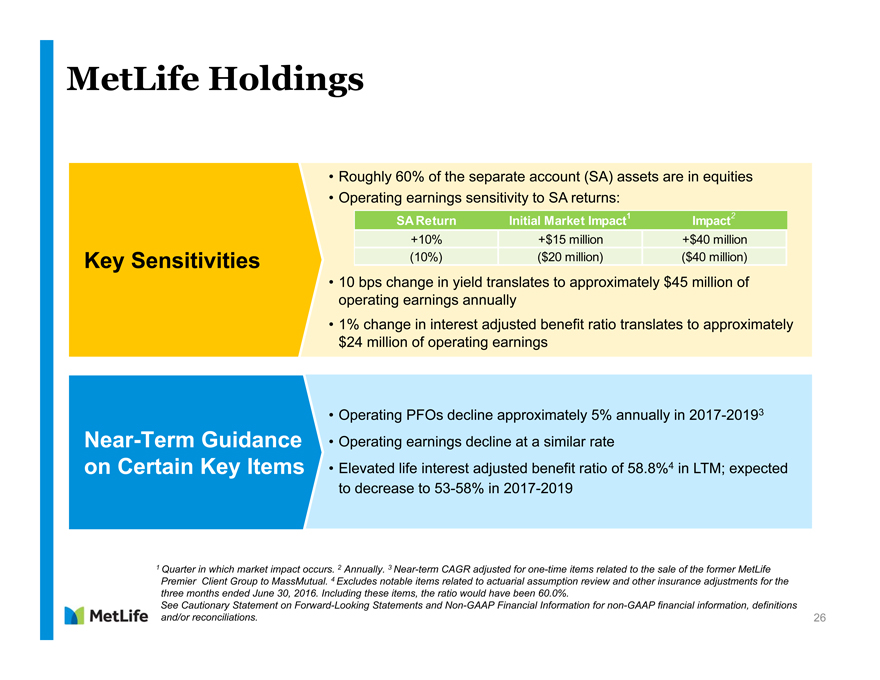
• Operating PFOs decline approximately 5% annually in 2017-20193
• Operating earnings decline at a similar rate
• Elevated life interest adjusted benefit ratio of 58.8%4 in LTM; expected
to decrease to 53-58% in 2017-2019
• Roughly 60% of the separate account (SA) assets are in equities
• Operating earnings sensitivity to SA returns:
• 10 bps change in yield translates to approximately $45 million of
operating earnings annually
• 1% change in interest adjusted benefit ratio translates to approximately
$24 million of operating earnings
MetLife Holdings
Key Sensitivities
Near-Term Guidance
on Certain Key Items
1 Quarter in which market impact occurs. 2 Annually. 3 Near-term CAGR adjusted for one-time items related to the sale of the former MetLife
Premier Client Group to MassMutual. 4 Excludes notable items related to actuarial assumption review and other insurance adjustments for the
three months ended June 30, 2016. Including these items, the ratio would have been 60.0%.
See Cautionary Statement on Forward-Looking Statements and Non-GAAP Financial Information for non-GAAP financial information, definitions
and/or reconciliations. 26
SA Return Initial Market Impact1 Impact2
+10% +$15 million +$40 million
(10%) ($20 million) ($40 million)
|
|

Financial Update
John C. R. Hele
Chief Financial Officer
|
|
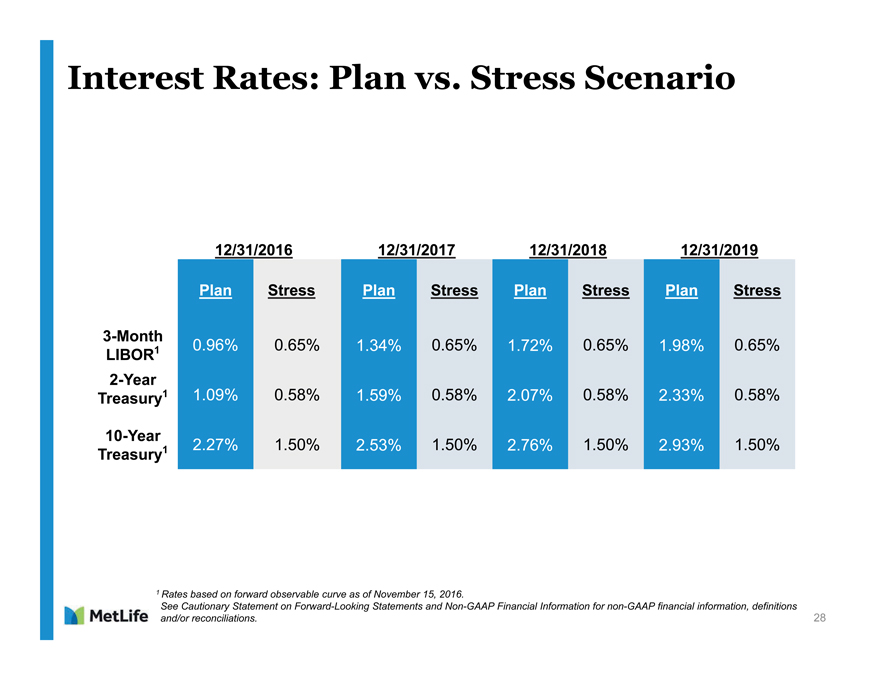
Interest Rates: Plan vs. Stress Scenario 12/31/2016 12/31/2017 12/31/2018 12/31/2019 Plan Stress Plan Stress Plan Stress Plan Stress 3-Month LIBOR 1 0.96% 0.65% 1.34% 0.65% 1.72% 0.65% 1.98% 0.65% 2-Year Treasury 1 1.09% 0.58% 1.59% 0.58% 2.07% 0.58% 2.33% 0.58% 10-Year Treasury 1 2.27% 1.50% 2.53% 1.50% 2.76% 1.50% 2.93% 1.50% 1 Rates based on forward observable curve as of November 15, 2016. See Cautionary Statement on Forward-Looking Statements and Non-GAAP Financial Information for non-GAAP financial information, definitions and/or reconciliations. 28 MetLife
|
|
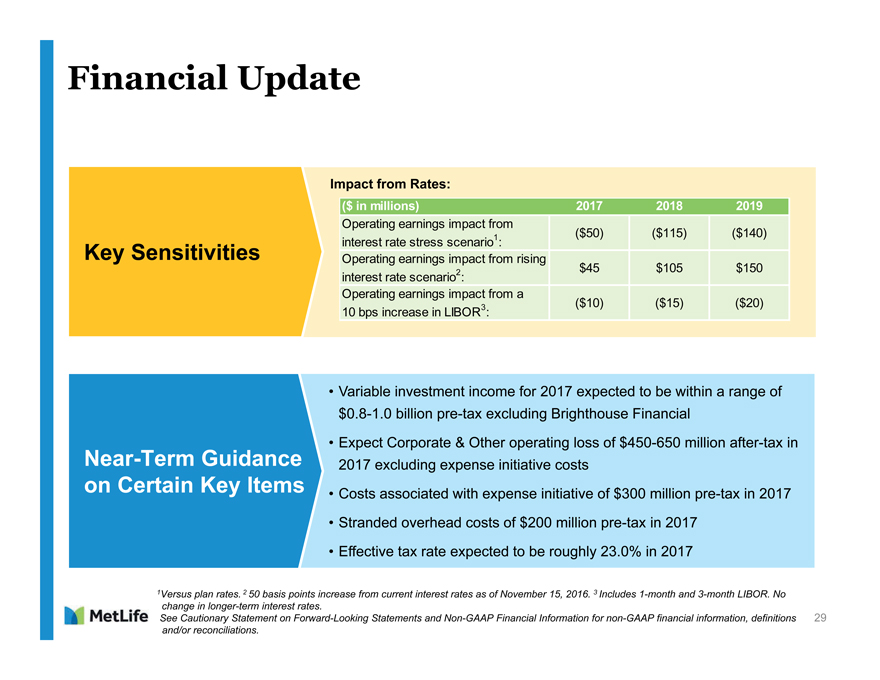
Financial Update Impact from Rates:($ in millions) 2017 2018 2019 Operating earnings impact from 1 ($50) ($115) ($140) Key Sensitivities interest rate stress scenario : Operating earnings impact from rising 2 $45 $105 $150 interest rate scenario : Operating earnings impact from a 3 ($10) ($15) ($20) 10 bps increase in LIBOR :• Variable investment income for 2017 expected to be within a range of $0.8-1.0 billion pre-tax excluding Brighthouse Financial• Expect Corporate & Other operating loss of $450-650 million after-tax in Near-Term Guidance 2017 excluding expense initiative costs on Certain Key Items • Costs associated with expense initiative of $300 million pre-tax in 2017 • Stranded overhead costs of $200 million pre-tax in 2017 • Effective tax rate expected to be roughly 23.0% in 20171 Versus plan rates. 2 50 basis points increase from current interest rates as of November 15, 2016. 3 Includes 1-month and 3-month LIBOR. No change in longer-term interest rates. See Cautionary Statement on Forward-Looking Statements and Non-GAAP Financial Information for non-GAAP financial information, definitions 29 and/or reconciliations. 29 Metlife
|
|

MetLife Navigating life together