Attached files
| file | filename |
|---|---|
| EX-99.1 - EXHIBIT 99.1 - Primis Financial Corp. | t1603065_ex99-1.htm |
| 8-K - FORM 8-K - Primis Financial Corp. | t1603065_8k.htm |

Southern National Bancorp of Virginia, Inc. and Eastern Virginia Bankshares , Inc. Announce Transformational Merger of Equals Exhibit 99.2
2 This investor presentation contains “forward - looking statements” within the meaning of the Private Securities Litigation Reform Act of 1995 regarding Southern National Bancorp of Virginia, Inc . ’s (“Southern National” or “SONA”) and Eastern Virginia Bankshares , Inc . ’s (“Eastern Virginia” or “EVBS”) expectations or predictions of future financial or business performance or conditions . These forward - looking statements are based on the current beliefs and expectations of the management of SONA or EVBS and are inherently subject to significant business, economic, and competitive uncertainties and contingencies, many of which are beyond their control . In addition, these forward - looking statements are subject to assumptions with respect to future business strategies and decisions that are subject to change . Forward - looking statements may be identified by words such as “may,” “could,” “will,” “expect,” “believe,” “anticipate,” “forecast,” “intend,” “plan,” “prospects,” “estimate,” “potential,” or by variations of such words or by similar expressions . Forward - looking statements in this report (including in the exhibits hereto) may include, but are not limited to, statements about projected impacts of and financial results generated by the transaction . Forward - looking statements speak only as of the date they are made and SONA and EVBS assume no duty to update forward - looking statements, except as required by law . In addition to factors previously disclosed in SONA’s and EVBS’ reports filed with the SEC and those identified elsewhere in this report, the following factors, among others, could cause actual results to differ materially from the results expressed in or implied by forward - looking statements and historical performance : ability to obtain regulatory approvals and meet other closing conditions to the transaction ; delays in closing the transaction ; changes in asset quality and credit risk ; changes in interest rates and capital markets ; the introduction, timing and success of business initiatives ; competitive conditions ; and the inability to recognize cost savings or revenues or to implement integration plans associated with the transaction . Annualized, pro forma, projected, and estimated numbers are used for illustrative purposes only, may not reflect actual results and may not be relied upon . Forward - Looking Statements
3 Investors are urged to review carefully and consider all public filings by SONA and EVBS with the SEC, including but not limited to their Annual Reports on Form 10 - K, their proxy statements, their Quarterly Reports on Form 10 - Q, and their Current Reports on Form 8 - K . The documents filed with the SEC may be obtained free of charge at the SEC’s website at www . sec . gov . The documents filed by SONA with the SEC may also be obtained free of charge at SONA’s website at www . sonabank . com or by requesting them in writing to Southern National Bancorp of Virginia, Inc . , 6830 Old Dominion Drive, McLean, VA 22101 , Attention : Investor Relations . The documents filed by EVBS with the SEC may also be obtained free of charge at EVBS’ website at www . evb . org or by requesting them in writing to Eastern Virginia Bankshares , Inc . , 10900 Nuckols Road , Suite 325 , Glen Allen, Virginia 23060 , Attention : Investor Relations . In connection with the proposed transaction, SONA intends to file a registration statement on Form S - 4 with the SEC which will include a joint proxy statement of SONA and EVBS and a prospectus of SONA . A definitive joint proxy statement/prospectus will be sent to the shareholders of each company seeking the required shareholder approvals . This report does not constitute an offer to sell or the solicitation of an offer to buy any securities or a solicitation of any vote or approval . Before making any voting or investment decision, investors and security holders of SONA and EVBS are urged to read carefully the entire registration statement and joint proxy statement/prospectus when they become available, including any amendments thereto, because they will contain important information about the proposed transaction . Free copies of these documents may be obtained as described above . SONA, EVBS, and certain of their directors and executive officers may be deemed participants in the solicitation of proxies from SONA and EVBS shareholders in connection with the proposed transaction . Information about the directors and officers of SONA and their ownership of SONA common stock is set forth in the definitive proxy statement for SONA’s 2016 annual meeting of shareholders, as previously filed with the SEC on March 21 , 2016 . Information about the directors and officers of EVBS and their ownership of EVBS common stock is set forth in the definitive proxy statement for EVBS’ 2016 annual meeting of shareholders, as previously filed with the SEC on April 21 , 2016 . Investors may obtain additional information regarding the interests of such participants by reading the registration statement and the joint proxy statement/prospectus when they become available . Free copies of these documents may be obtained as described above . Additional Information
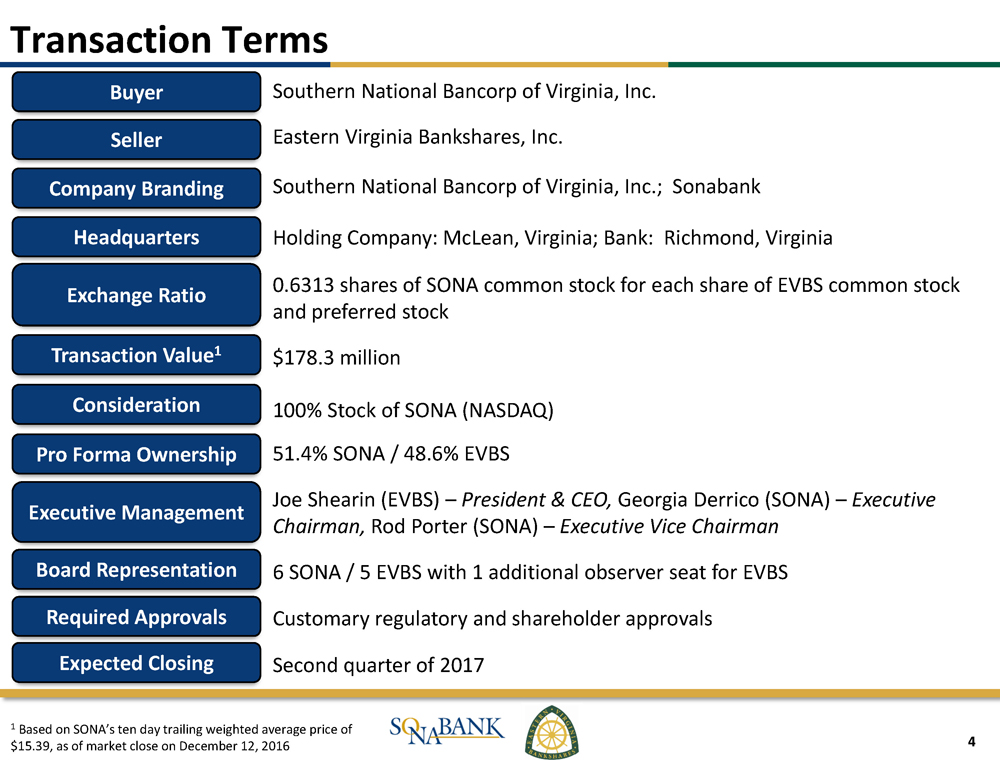
4 Buyer Southern National Bancorp of Virginia, Inc. Seller Eastern Virginia Bankshares, Inc. Headquarters Southern National Bancorp of Virginia, Inc.; Sonabank Exchange Ratio Holding Company: McLean, Virginia ; Bank: Richmond, Virginia Transaction Value 0.6313 shares of SONA common stock for each share of EVBS common stock and preferred stock Consideration $178.3 million Shares Issued 100% Stock of SONA (NASDAQ) Pro F orma Ownership 51.4% SONA / 48.6% EVBS Executive Management Joe Shearin (EVBS) – President & CEO, Georgia Derrico (SONA) – Executive Chairman, Rod Porter (SONA) – Executive Vice Chairman Board Representation 6 SONA / 5 EVBS with 1 additional observer seat for EVBS Required Approvals Customary regulatory and shareholder approvals Expected Closing Second quarter of 2017 Buyer Transaction Terms Seller Company Branding Headquarters Exchange Ratio Transaction Value 1 Consideration Pro Forma Ownership Executive Management Board Representation Required Approvals Expected Closing 1 Based on SONA’s ten day trailing weighted average price of $15.39, as of market close on December 12, 2016
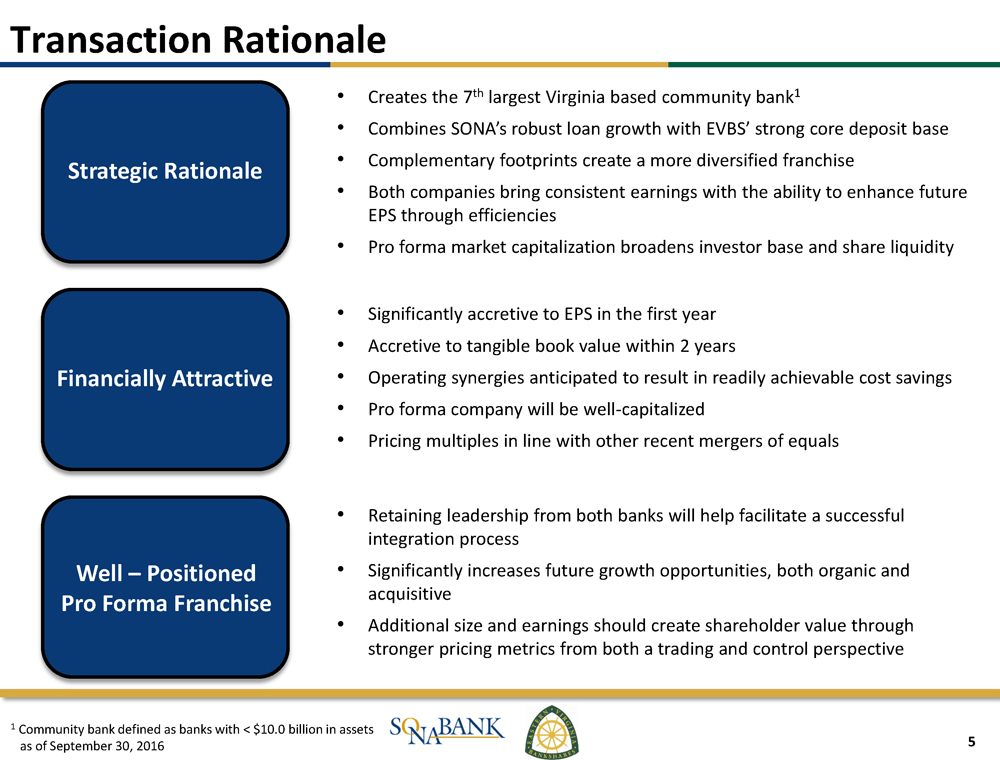
5 Transaction Rationale • Significantly accretive to EPS in the first year • Accretive to tangible book value within 2 years • Operating synergies anticipated to result in readily achievable cost savings • Pro forma company will be well - capitalized • Pricing multiples in line with other recent mergers of equals Financially Attractive • Retaining leadership from both banks will help facilitate a successful integration process • Significantly increases future growth opportunities, both organic and acquisitive • Additional size and earnings should create shareholder value through stronger pricing metrics from both a trading and control perspective Well – Positioned Pro Forma Franchise Strategic Rationale • Creates the 7 th largest Virginia based community bank 1 • Combines SONA’s robust loan growth with EVBS’ strong core deposit base • Complementary footprints create a more diversified franchise • Both companies bring consistent earnings with the ability to enhance future EPS through efficiencies • Pro forma market capitalization broadens investor base and share liquidity 1 Community bank defined as banks with < $10.0 billion in assets as of September 30, 2016
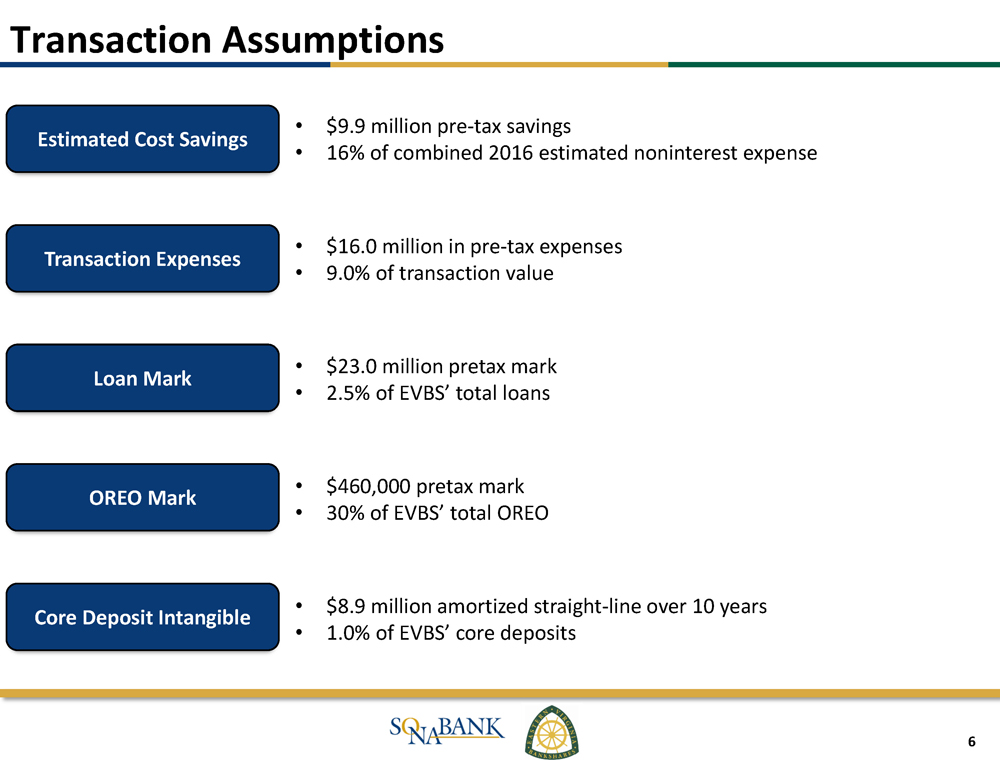
6 Transaction Assumptions Estimated Cost Saves • $9.9 million pre - tax savings • 16% of combined 2016 estimated noninterest expense Transaction Expenses • $16.0 million in pre - tax expenses • 9.0% of transaction value Loan Mark • $23.0 million pretax mark • 2.5% of EVBS’ total loans OREO Mark • $460,000 pretax mark • 30% of EVBS’ total OREO Core Deposit Intangible • $8.9 million amortized straight - line over 10 years • 1.0% of EVBS’ core deposits Estimated Cost Savings Transaction Expenses Loan Mark OREO Mark Core Deposit Intangible
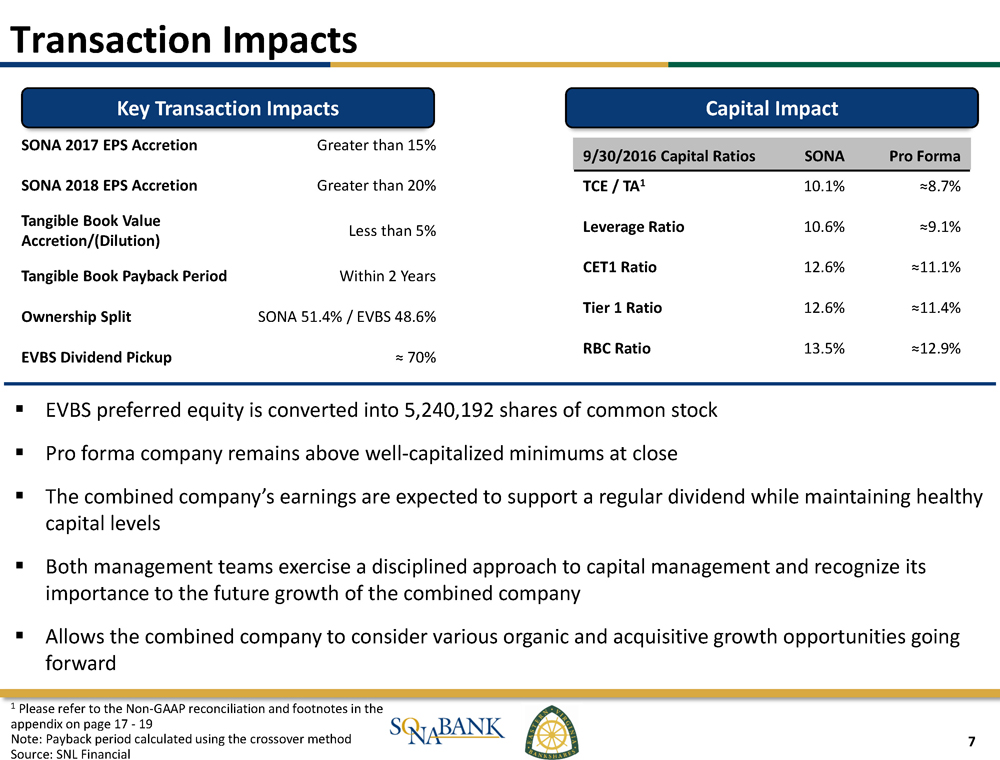
7 Transaction Impacts 1 Please refer to the Non - GAAP reconciliation and footnotes in the appendix on page 17 - 19 Note: Payback period calculated using the crossover method Source: SNL Financial Key Transaction Impacts Capital Impact 9/30/2016 Capital Ratios SONA Pro Forma TCE / TA 1 10.1% ≈8.7% Leverage Ratio 10.6% ≈9.1% CET1 Ratio 12.6% ≈11.1% Tier 1 Ratio 12.6% ≈11.4% RBC Ratio 13.5% ≈12.9% SONA 2017 EPS Accretion Greater than 15% SONA 2018 EPS Accretion Greater than 20% Tangible Book Value Accretion/(Dilution) Less than 5% Tangible Book Payback Period Within 2 Years Ownership Split SONA 51.4% / EVBS 48.6% EVBS Dividend Pickup ≈ 70% ▪ EVBS preferred equity is converted into 5,240,192 shares of common stock ▪ Pro forma company remains above well - capitalized minimums at close ▪ The combined company’s earnings are expected to support a regular dividend while maintaining healthy capital levels ▪ Both management teams exercise a disciplined approach to capital management and recognize its importance to the future growth of the combined company ▪ Allows the combined company to consider various organic and acquisitive growth opportunities going forward
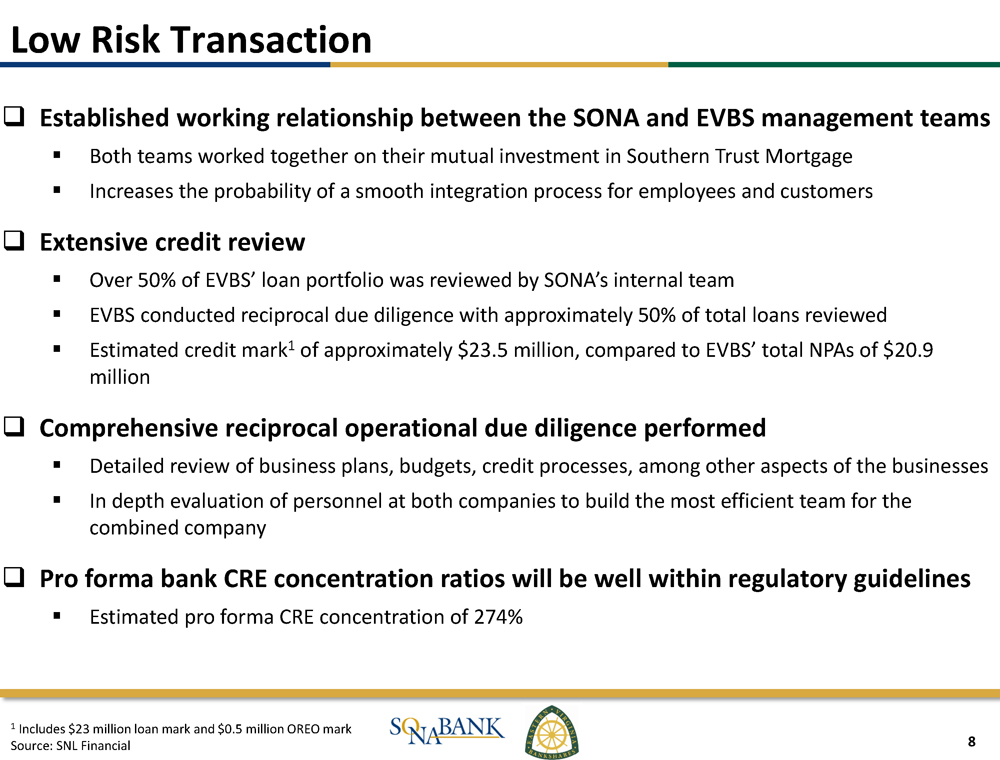
8 Low Risk Transaction 1 Includes $23 million loan mark and $0.5 million OREO mark Source: SNL Financial □ Established working relationship between the SONA and EVBS management teams ▪ Both teams worked together on their mutual investment in Southern Trust Mortgage ▪ Increases the probability of a smooth integration process for employees and customers □ Extensive credit review ▪ Over 50% of EVBS’ loan portfolio was reviewed by SONA’s internal team ▪ EVBS conducted reciprocal due diligence with approximately 50% of total loans reviewed ▪ Estimated credit mark 1 of approximately $23.5 million, compared to EVBS’ total NPAs of $20.9 million □ Comprehensive reciprocal operational due diligence performed ▪ Detailed review of business plans, budgets, credit processes, among other aspects of the businesses ▪ In depth evaluation of personnel at both companies to build the most efficient team for the combined company □ Pro forma bank CRE concentration ratios will be well within regulatory guidelines ▪ Estimated pro forma CRE concentration of 274%

9 Headquarters: 6830 Old Dominion Drive Suite 100 McLean, VA 22101 Executive Management: Georgia S. Derrico – Chairman & CEO Assets ($000): 1,135,436 Market Cap ($M): 188.7 TCE / TA 1 (%): 10.11 Tangible Book Value 1 ($): 9.27 LTM ROAA (%) : 0.99 LTM ROAE (%): 8.60 LTM Efficiency Ratio (%): 55.54 LTM Net Interest Margin (%): 4.05 NPAs / Assets (%): 1.08 NCOs / Loans (%): 0.49 Reserves / Loans (%): 0.93 Headquarters: 10900 Nuckols Road Suite 325 Glen Allen, VA 23060 Executive Management: Joe A Shearin - President & CEO Assets ($000): 1,314,896 Market Cap ($M): 172.6 TCE / TA 1,2 (%): 9.02 Tangible Book Value 1,2 ($): 6.37 LTM ROAA (%) : 0.65 LTM ROAE (%): 6.37 LTM Efficiency Ratio (%): 76.72 LTM Net Interest Margin (%): 3.72 NPAs / Assets (%): 1.59 NCOs / Loans (%): 0.17 Reserves / Loans (%): 1.12 Company Overviews 1 Please refer to the Non - GAAP reconciliation and footnotes in the appendix on page 17 - 19 2 Assumes EVBS’ preferred equity is converted into 5,240,192 shares of common stock Source: SNL Financial
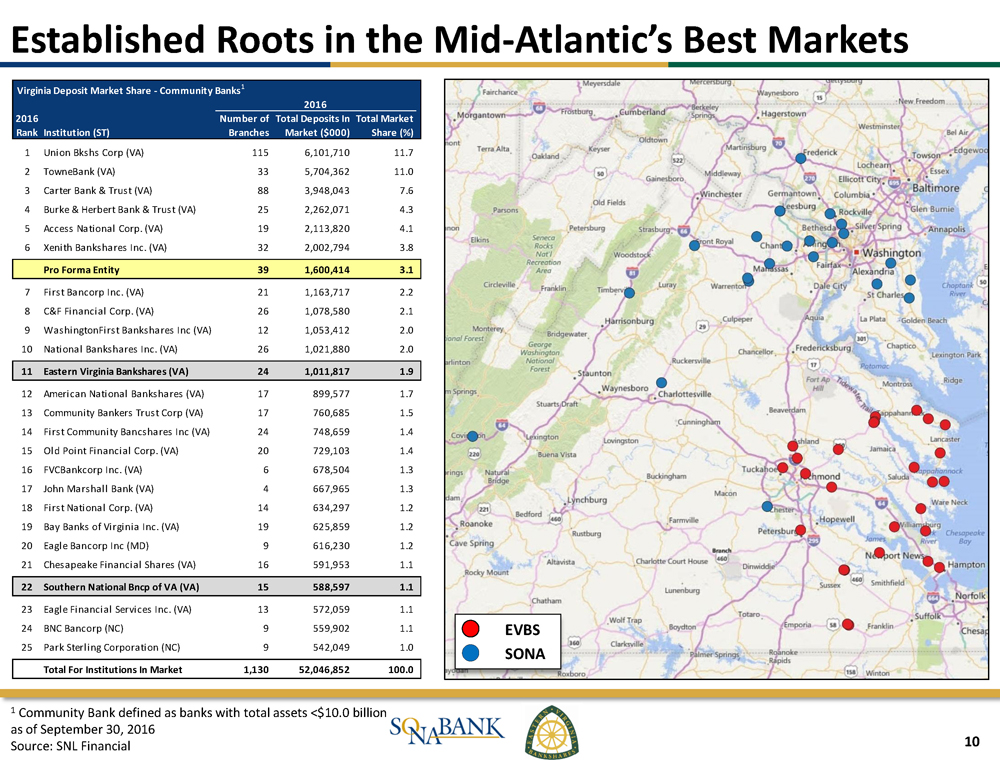
10 Established Roots in the Mid - Atlantic’s Best Markets EVBS SONA 1 Community Bank defined as banks with total assets <$10.0 billion as of September 30, 2016 Source: SNL Financial Virginia Deposit Market Share - Community Banks 1 Number of Branches Total Deposits In Market ($000) Total Market Share (%) 1 Union Bkshs Corp (VA) 115 6,101,710 11.7 2 TowneBank (VA) 33 5,704,362 11.0 3 Carter Bank & Trust (VA) 88 3,948,043 7.6 4 Burke & Herbert Bank & Trust (VA) 25 2,262,071 4.3 5 Access National Corp. (VA) 19 2,113,820 4.1 6 Xenith Bankshares Inc. (VA) 32 2,002,794 3.8 Pro Forma Entity 39 1,600,414 3.1 7 First Bancorp Inc. (VA) 21 1,163,717 2.2 8 C&F Financial Corp. (VA) 26 1,078,580 2.1 9 WashingtonFirst Bankshares Inc (VA) 12 1,053,412 2.0 10 National Bankshares Inc. (VA) 26 1,021,880 2.0 11 Eastern Virginia Bankshares (VA) 24 1,011,817 1.9 12 American National Bankshares (VA) 17 899,577 1.7 13 Community Bankers Trust Corp (VA) 17 760,685 1.5 14 First Community Bancshares Inc (VA) 24 748,659 1.4 15 Old Point Financial Corp. (VA) 20 729,103 1.4 16 FVCBankcorp Inc. (VA) 6 678,504 1.3 17 John Marshall Bank (VA) 4 667,965 1.3 18 First National Corp. (VA) 14 634,297 1.2 19 Bay Banks of Virginia Inc. (VA) 19 625,859 1.2 20 Eagle Bancorp Inc (MD) 9 616,230 1.2 21 Chesapeake Financial Shares (VA) 16 591,953 1.1 22 Southern National Bncp of VA (VA) 15 588,597 1.1 23 Eagle Financial Services Inc. (VA) 13 572,059 1.1 24 BNC Bancorp (NC) 9 559,902 1.1 25 Park Sterling Corporation (NC) 9 542,049 1.0 Total For Institutions In Market 1,130 52,046,852 100.0 2016 RankInstitution (ST) 2016
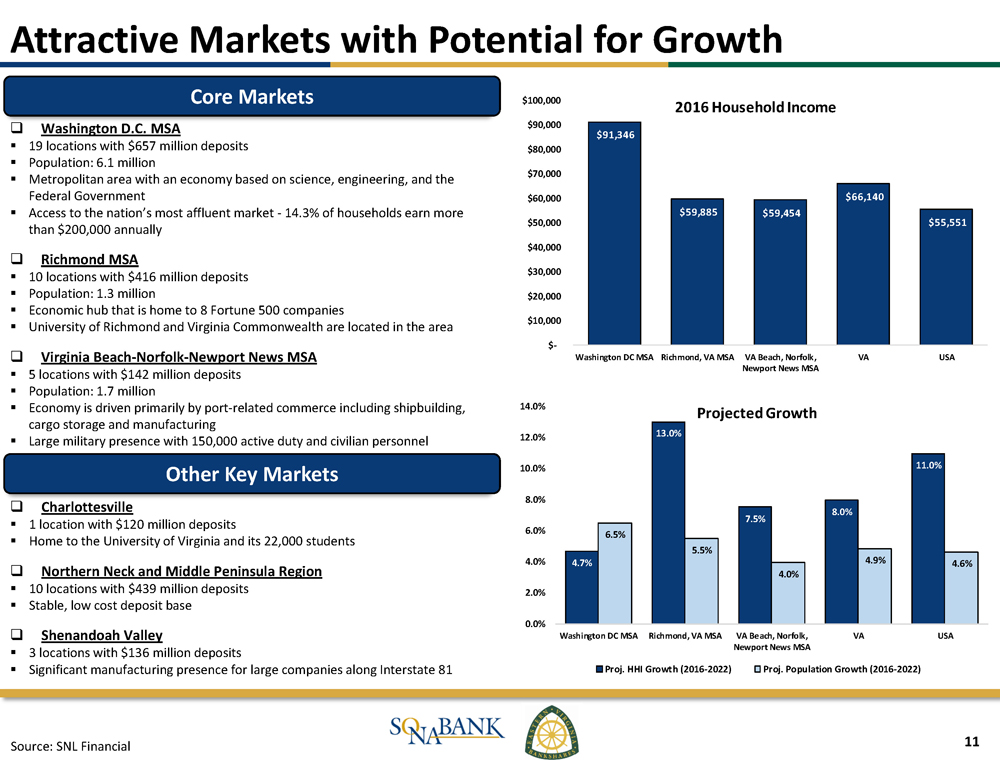
11 Attractive Markets with Potential for Growth Source: SNL Financial Core Markets Other Key Markets □ Charlottesville ▪ 1 location with $120 million deposits ▪ Home to the University of Virginia and its 22,000 students □ Northern Neck and Middle Peninsula Region ▪ 10 locations with $439 million deposits ▪ Stable, low cost deposit base □ Shenandoah Valley ▪ 3 locations with $136 million deposits ▪ Significant manufacturing presence for large companies along Interstate 81 □ Washington D.C. MSA ▪ 19 locations with $657 million deposits ▪ Population: 6.1 million ▪ M etropolitan area with an economy based on science, engineering, and the Federal Government ▪ Access to the nation’s most affluent market - 14.3 % of households earn more than $ 200,000 annually □ Richmond MSA ▪ 10 locations with $416 million deposits ▪ Population: 1.3 million ▪ Economic hub that is home to 8 Fortune 500 companies ▪ University of Richmond and Virginia Commonwealth are located in the area □ Virginia Beach - Norfolk - Newport News MSA ▪ 5 locations with $142 million deposits ▪ Population: 1.7 million ▪ Economy is driven primarily by port - related commerce including shipbuilding, cargo storage and manufacturing ▪ Large military presence with 150,000 active duty and civilian personnel 4.7% 13.0% 7.5% 8.0% 11.0% 6.5% 5.5% 4.0% 4.9% 4.6% 0.0% 2.0% 4.0% 6.0% 8.0% 10.0% 12.0% 14.0% Washington DC MSA Richmond, VA MSA VA Beach, Norfolk, Newport News MSA VA USA Projected Growth Proj. HHI Growth (2016-2022) Proj. Population Growth (2016-2022) $91,346 $59,885 $59,454 $66,140 $55,551 $- $10,000 $20,000 $30,000 $40,000 $50,000 $60,000 $70,000 $80,000 $90,000 $100,000 Washington DC MSA Richmond, VA MSA VA Beach, Norfolk, Newport News MSA VA USA 2016 Household Income
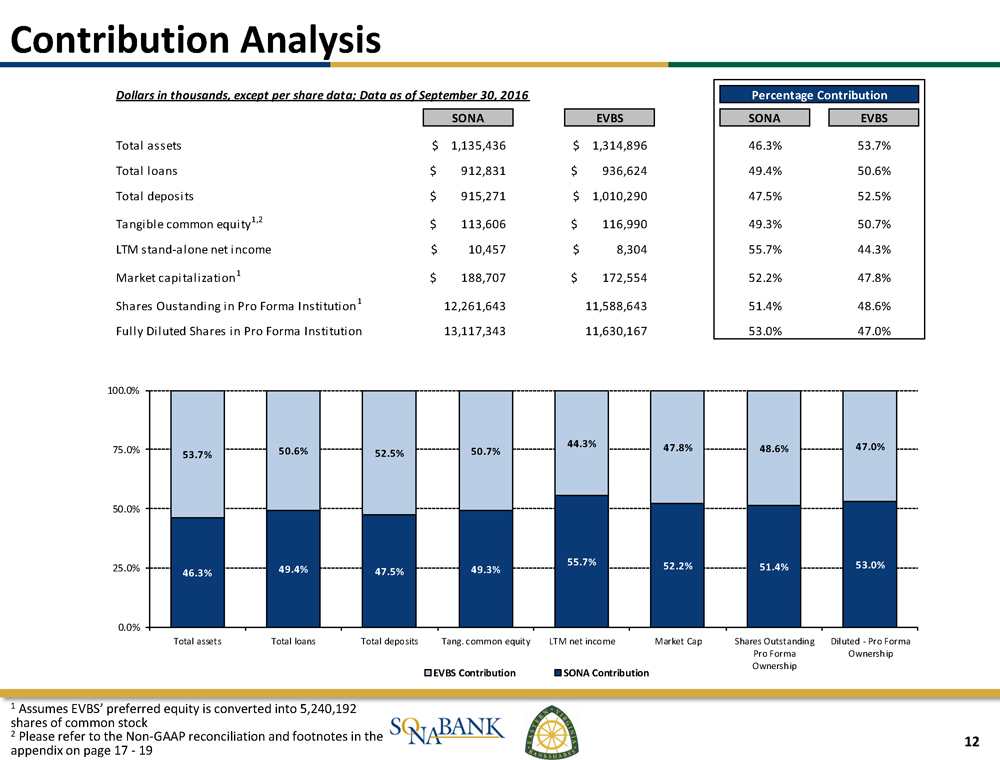
12 Contribution Analysis 1 Assumes EVBS’ preferred equity is converted into 5,240,192 shares of common stock 2 Please refer to the Non - GAAP reconciliation and footnotes in the appendix on page 17 - 19 Dollars in thousands, except per share data; Data as of September 30, 2016 Percentage Contribution SONA EVBS SONA EVBS Total assets 1,135,436$ 1,314,896$ 46.3% 53.7% Total loans 912,831$ 936,624$ 49.4% 50.6% Total deposits 915,271$ 1,010,290$ 47.5% 52.5% Tangible common equity 1,2 113,606$ 116,990$ 49.3% 50.7% LTM stand-alone net income 10,457$ 8,304$ 55.7% 44.3% Market capitalization 1 188,707$ 172,554$ 52.2% 47.8% Shares Oustanding in Pro Forma Institution 1 12,261,643 11,588,643 51.4% 48.6% Fully Diluted Shares in Pro Forma Institution 13,117,343 11,630,167 53.0% 47.0% 46.3% 49.4% 47.5% 49.3% 55.7% 52.2% 51.4% 53.0% 53.7% 50.6% 52.5% 50.7% 44.3% 47.8% 48.6% 47.0% 0.0% 25.0% 50.0% 75.0% 100.0% Total assets Total loans Total deposits Tang. common equity LTM net income Market Cap Shares Outstanding Pro Forma Ownership Diluted - Pro Forma Ownership EVBS Contribution SONA Contribution
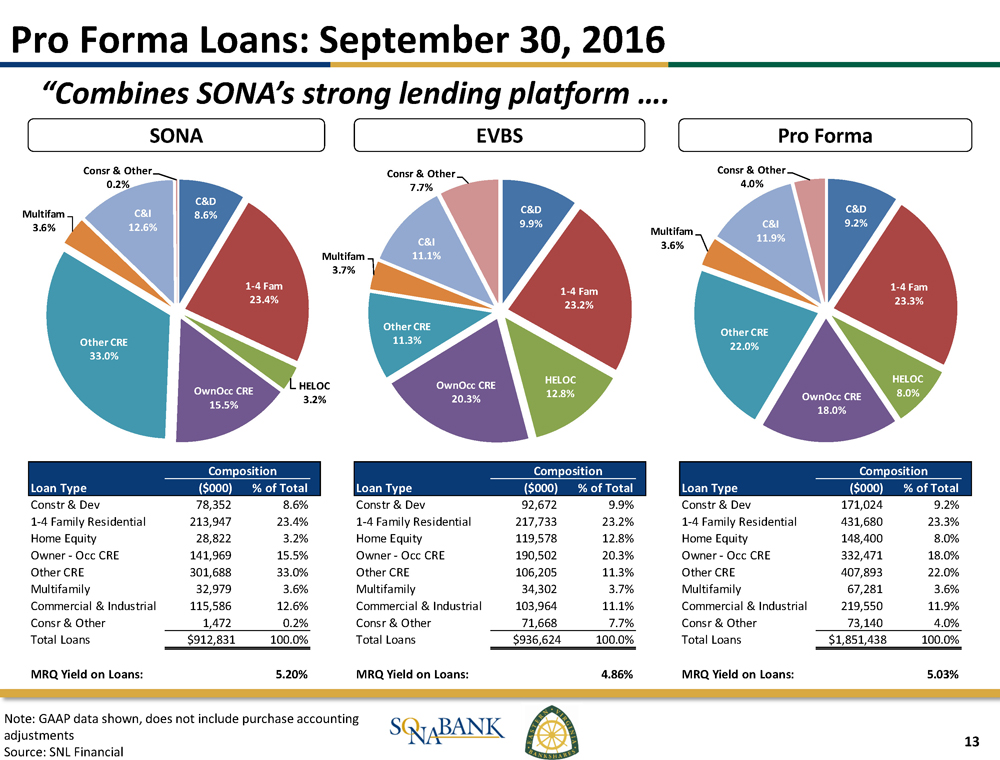
13 SONA Pro Forma EVBS Note: GAAP data shown, does not include purchase accounting adjustments Source: SNL Financial C&D 8.6% 1 - 4 Fam 23.4% HELOC 3.2% OwnOcc CRE 15.5% Other CRE 33.0% Multifam 3.6% C&I 12.6% Consr & Other 0.2% C&D 9.9% 1 - 4 Fam 23.2% HELOC 12.8% OwnOcc CRE 20.3% Other CRE 11.3% Multifam 3.7% C&I 11.1% Consr & Other 7.7% C&D 9.2% 1 - 4 Fam 23.3% HELOC 8.0% OwnOcc CRE 18.0% Other CRE 22.0% Multifam 3.6% C&I 11.9% Consr & Other 4.0% Pro Forma Loans: September 30, 2016 “Combines SONA’s strong lending platform …. Composition Composition Composition Loan Type ($000) % of Total Loan Type ($000) % of Total Loan Type ($000) % of Total Constr & Dev 78,352 8.6% Constr & Dev 92,672 9.9% Constr & Dev 171,024 9.2% 1-4 Family Residential 213,947 23.4% 1-4 Family Residential 217,733 23.2% 1-4 Family Residential 431,680 23.3% Home Equity 28,822 3.2% Home Equity 119,578 12.8% Home Equity 148,400 8.0% Owner - Occ CRE 141,969 15.5% Owner - Occ CRE 190,502 20.3% Owner - Occ CRE 332,471 18.0% Other CRE 301,688 33.0% Other CRE 106,205 11.3% Other CRE 407,893 22.0% Multifamily 32,979 3.6% Multifamily 34,302 3.7% Multifamily 67,281 3.6% Commercial & Industrial 115,586 12.6% Commercial & Industrial 103,964 11.1% Commercial & Industrial 219,550 11.9% Consr & Other 1,472 0.2% Consr & Other 71,668 7.7% Consr & Other 73,140 4.0% Total Loans $912,831 100.0% Total Loans $936,624 100.0% Total Loans $1,851,438 100.0% MRQ Yield on Loans: 5.20% MRQ Yield on Loans: 4.86% MRQ Yield on Loans: 5.03%
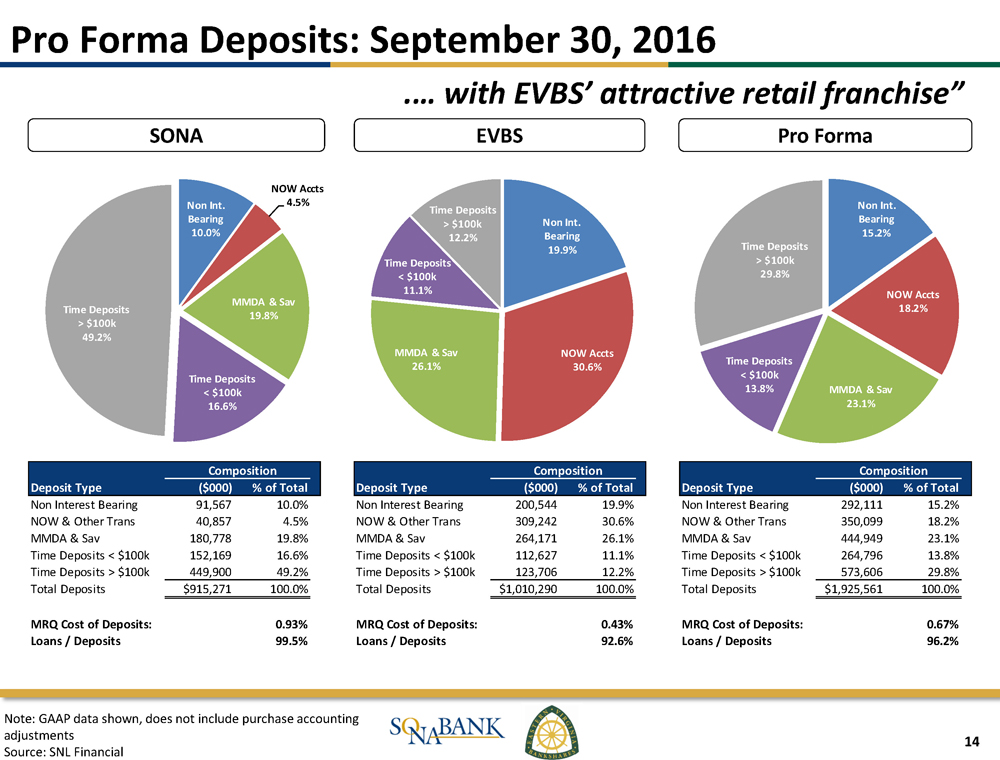
14 SONA Pro Forma EVBS Composition Composition Composition Deposit Type ($000) % of Total Deposit Type ($000) % of Total Deposit Type ($000) % of Total Non Interest Bearing 91,567 10.0% Non Interest Bearing 200,544 19.9% Non Interest Bearing 292,111 15.2% NOW & Other Trans 40,857 4.5% NOW & Other Trans 309,242 30.6% NOW & Other Trans 350,099 18.2% MMDA & Sav 180,778 19.8% MMDA & Sav 264,171 26.1% MMDA & Sav 444,949 23.1% Time Deposits < $100k 152,169 16.6% Time Deposits < $100k 112,627 11.1% Time Deposits < $100k 264,796 13.8% Time Deposits > $100k 449,900 49.2% Time Deposits > $100k 123,706 12.2% Time Deposits > $100k 573,606 29.8% Total Deposits $915,271 100.0% Total Deposits $1,010,290 100.0% Total Deposits $1,925,561 100.0% MRQ Cost of Deposits: 0.93% MRQ Cost of Deposits: 0.43% MRQ Cost of Deposits: 0.67% Loans / Deposits 99.5% Loans / Deposits 92.6% Loans / Deposits 96.2% Non Int. Bearing 10.0% NOW Accts 4.5% MMDA & Sav 19.8% Time Deposits < $100k 16.6% Time Deposits > $100k 49.2% Non Int. Bearing 19.9% NOW Accts 30.6% MMDA & Sav 26.1% Time Deposits < $100k 11.1% Time Deposits > $100k 12.2% Non Int. Bearing 15.2% NOW Accts 18.2% MMDA & Sav 23.1% Time Deposits < $100k 13.8% Time Deposits > $100k 29.8% Pro Forma Deposits: September 30, 2016 .… with EVBS’ attractive retail franchise” Note: GAAP data shown, does not include purchase accounting adjustments Source: SNL Financial
15 Transaction Summary Southern National Bancorp of Virginia and Eastern Virginia Bankshares are joining forces to create a premier Virginia - based community bank x Combination of complementary markets to create a more diversified franchise x Fusion of SONA’s dynamic lending platform with EVBS’ strong core deposit base x Significantly accretive to EPS in the first year x Pro forma institution remains well - capitalized with the ability to support future growth x Highly experienced management team with an established working relationship x Higher capital base will increase lending limit to better serve customers x Realistic assumptions minimize risk x Continued focus on maximizing shareholder value

16 Appendix
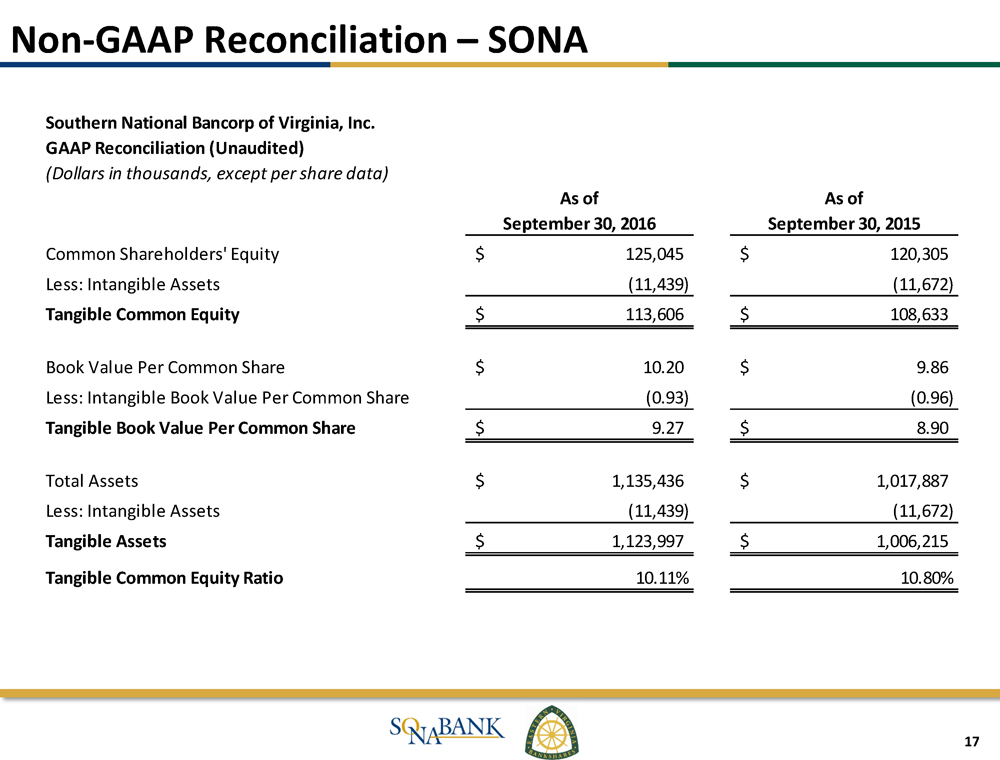
17 Non - GAAP Reconciliation – SONA Southern National Bancorp of Virginia, Inc. GAAP Reconciliation (Unaudited) (Dollars in thousands, except per share data) As of September 30, 2016 As of September 30, 2015 Common Shareholders' Equity 125,045$ 120,305$ Less: Intangible Assets (11,439) (11,672) Tangible Common Equity 113,606$ 108,633$ Book Value Per Common Share 10.20$ 9.86$ Less: Intangible Book Value Per Common Share (0.93) (0.96) Tangible Book Value Per Common Share 9.27$ 8.90$ Total Assets 1,135,436$ 1,017,887$ Less: Intangible Assets (11,439) (11,672) Tangible Assets 1,123,997$ 1,006,215$ Tangible Common Equity Ratio 10.11% 10.80%

18 Non - GAAP Reconciliation – EVBS Eastern Virginia Bankshares, Inc. GAAP Reconciliation (Unaudited) (Dollars in thousands, except per share data) As of September 30, 2016 As of September 30, 2015 Common Shareholders' Equity 134,645$ 124,943$ Less: Intangible Assets (17,655) (17,882) Tangible Common Equity 116,990$ 107,061$ Book Value Per Common Share 7.33$ 6.84$ Less: Intangible Book Value Per Common Share (0.96) (0.98) Tangible Book Value Per Common Share 6.37$ 5.86$ Total Assets 1,314,896$ 1,242,387$ Less: Intangible Assets (17,655) (17,882) Tangible Assets 1,297,241$ 1,224,505$ Tangible Common Equity Ratio 9.02% 8.74% Note: Assumes EVBS ’ preferred equity is converted into 5,240,192 shares of common stock
19 Non - GAAP Reconciliation Footnotes 1 Tangible common equity to tangible assets (“the tangible common equity ratio”) and tangible book value per common share are non - GAAP financial measures derived from GAAP - based amounts . The Company calculates the tangible common equity ratio by excluding the balance of intangible assets from common shareholders’ equity and dividing by total assets . The Company calculates tangible book value per common share by dividing tangible common equity by common shares outstanding, as compared to book value per common share, which the Company calculates by dividing common shareholders’ equity by common shares outstanding . The Company considers this information important to shareholders’ as tangible equity is a measure that is consistent with the calculation of capital for bank regulatory purposes, which excludes intangible assets from the calculation of risk based ratios and as such is useful for investors, regulators, management, and others to evaluate capital adequacy and to compare against other financial institutions .