Attached files
| file | filename |
|---|---|
| 8-K - FORM 8-K - FIFTH THIRD BANCORP | d307689d8k.htm |
 Goldman
Sachs U.S. Financial Services Conference
Greg D. Carmichael President & Chief Executive Officer December 7, 2016 Exhibit 99.1 © Fifth Third Bank | All Rights Reserved |
 Cautionary
statement This presentation contains statements that we believe are
“forward-looking statements” within the meaning of Section 27A of the Securities Act of 1933, as amended, and Rule 175 promulgated thereunder, and Section 21E of the Securities Exchange Act of 1934, as amended, and Rule 3b-6 promulgated thereunder. These
statements relate to our financial condition, results of operations,
plans, objectives, future performance or business. They usually can be identified by the use of forward-looking language such as “will likely result,” “may,” “are expected to,” “anticipates,” “potential,” “estimate,”
“forecast,” “projected,” “intends to,” or may include other similar words or phrases such as “believes,” “plans,” “trend,” “objective,” “continue,” “remain,” or similar expressions, or future or
conditional verbs such as “will,” “would,” “should,” “could,” “might,” “can,” or similar verbs. You should not place undue reliance on these statements, as they are subject to risks and uncertainties, including but not limited to the risk
factors set forth in our most recent Annual Report on Form 10-K as
updated from time to time by our Quarterly Reports on Form 10-Q. When considering these forward-looking statements, you should keep in mind these risks and uncertainties, as well as any cautionary statements we may make. Moreover, you should treat these statements as speaking
only as of the date they are made and based only on information then
actually known to us. There is a risk that additional information may become known during the company’s quarterly closing process or as a result of subsequent events that could affect the accuracy of the statements and financial information contained herein.
There are a number of important factors that could cause future results to differ
materially from historical performance and these forward-looking statements. Factors that might cause such a difference include, but are not limited to: (1) general economic or real estate market conditions, either nationally or in the
states in which Fifth Third, one or more acquired entities and/or the
combined company do business, weaken or are less favorable than expected; (2) deteriorating credit quality; (3) political developments, wars or other hostilities may disrupt or increase volatility in securities markets or other economic conditions; (4) changes in the interest rate
environment reduce interest margins; (5) prepayment speeds, loan
origination and sale volumes, charge-offs and loan loss provisions; (6) Fifth Third’s ability to maintain required capital levels and adequate sources of funding and liquidity; (7) maintaining capital requirements and adequate sources of funding and liquidity may limit Fifth Third’s operations
and potential growth; (8) changes and trends in capital markets; (9)
problems encountered by larger or similar financial institutions may adversely affect the banking industry and/or Fifth Third; (10) competitive pressures among depository institutions increase significantly; (11) effects of critical accounting policies and judgments; (12)
changes in accounting policies or procedures as
may be required by the Financial Accounting Standards Board (FASB) or other regulatory
agencies; (13) legislative or regulatory changes or actions, or significant litigation, adversely affect Fifth Third, one or more acquired entities and/or the combined company or the businesses in which Fifth Third, one or more
acquired entities and/or the combined company are engaged, including the
Dodd-Frank Wall Street Reform and Consumer Protection Act; (14) ability to maintain favorable ratings from rating agencies; (15) fluctuation of Fifth Third’s stock price; (16) ability to attract and retain key personnel; (17) ability to receive dividends from its
subsidiaries; (18) potentially dilutive effect of future acquisitions on
current shareholders’ ownership of Fifth Third; (19) effects of accounting or financial results of one or more acquired entities; (20) difficulties from Fifth Third’s investment in, relationship with, and nature of the operations of Vantiv, LLC; (21) loss of income from any sale or potential sale
of businesses; (22) difficulties in separating the operations of any
branches or other assets divested; (23) losses or adverse impacts on the carrying values of branches and long-lived assets in connection with their sales or anticipated sales; (24) inability to achieve expected benefits from branch consolidations and planned sales within desired
timeframes, if at all; (25) ability to secure confidential information
and deliver products and services through the use of computer systems and telecommunications networks; and (26) the impact of reputational risk created by these developments on such matters as business generation and retention, funding and liquidity.
You should refer to our periodic and current reports filed with the Securities and
Exchange Commission, or “SEC,” for further information on other
factors, which could cause actual results to be significantly different
from those expressed or implied by these forward-looking statements.
In this presentation, we may sometimes provide non-GAAP financial information.
Please note that although non-GAAP financial measures provide useful insight to analysts, investors and regulators, they should not be considered in isolation or relied upon as a substitute for analysis using GAAP measures. We provide
GAAP reconciliations for non- GAAP measures in a later slide in this
presentation as well as in our earnings release, both of which are available in the investor relations section of our website, www.53.com. Management has provided forward-looking guidance on certain Non-GAAP measures in connection with this presentation in order to facilitate
comparability with the Bancorp’s historical performance and
financial condition as reflected in these Non-GAAP measures. Such forward-looking Non-GAAP measures include return on tangible common equity; net interest margin (FTE); net interest income (FTE); and noninterest income, excluding certain transactions and adjustments related to
the Bancorp’s investment in Vantiv, Visa total return swap, and
branch sales, closures and consolidations. Bancorp’s management does not estimate on a forward-looking basis the impact of items similar to those that it has excluded to generate these Non-GAAP measures on a historical basis because the occurrence and amounts of items such as
these are difficult to predict. As a result, the Bancorp has not provided
reconciliations of its forward-looking Non-GAAP measures.
2 © Fifth Third Bancorp | All Rights Reserved |
 3 • $143B Total Assets (#13) 1 • $94B Total Loans 2 • 61% Commercial • 39% Consumer • $99B Core Deposits • $27B AUM • 115% LCR • Tier 1: 11.3%, CET 1: 10.2%, Leverage Ratio: 9.8% Sources: SNL Financial – regulatory filing as of 3Q16, Earnings Release as of 3Q16; EOP Loans including loans HFS 3 EY 2015 Cash Management Services Surveys, 4 Oliver Wyman 2016 Survey of Consumers, The 2015 Monitor Top Bank 50 & Technology Issue, and 6 Experian Auto Count US States originations for traditional banks in units 2016 through 06/30/2016, FDIC 2016 Summary of Deposits, ranking by MSA, Mitek – 2016 Mobile Deposits Benchmark Report, and University of Michigan American Customer Satisfaction (ASCI) Index #10 Equipment Finance 5 Treasury Management 3 #8 #9 Commercial & Industrial Well-positioned franchise and focused footprint #9 #11 Non-Captive Prime Auto Originator 6 Retail Bank 4 In footprint markets National commercial hub cities 3Q16 Bancorp Overview Franchise Rankings #3 - Banking Industry Customer Satisfaction Rating 9 2016 Javelin Mobile Banking Leader: Comprehensive Alerts #4 - Mobile Deposit Customer Experience Rankings 8 Top 5 share in 11 of our 15 largest markets 7 © Fifth Third Bank | All Rights Reserved Lending 1 7 5 8 1 9 2 |
 Post-election expectations continue to evolve
• Potential changes in fiscal policy may boost GDP growth and change the course of monetary policy • We believe it is more likely that the current credit cycle will continue beyond 2017
• Our 2017 guidance will not assume any Fed actions beyond the expected Dec-16 move
• Our asset sensitive balance sheet position is expected to continue to support further NII
growth if we see multiple interest rate increases in 2017
• Direction of credit spreads is uncertain • Overall, there is more post-election uncertainty than usual Industry loan spreads continue to tighten as balances are growing Long-end has steepened dramatically; short-end up only ~5 - 10 bps 1 Bloomberg as of 12/1/16 2 Spreads - Federal Reserve E.2 Survey of Terms of Business Lending, all C&I loans, 4Q moving average; Balances -
Federal Reserve H.8 C&I
balances for all domestic commercial banks, seasonally adjusted.
Overnight Fed funds rate expectations
0.63 0.94 1.86 2.40 1ML 3ML 6ML 12ML 2YS 3YS 4YS 5YS 7YS 10YS 15YS 20YS 30YS 0.71 0.83 0.93 1.11 1.60 1.82 2016 2017 2018 2019 1,507 1,543 1,564 1,592 1,649 1,675 1,685 1Q15 2Q15 3Q15 4Q15 1Q16 2Q16 3Q16 1/7/16 12/1/16 FOMC Minutes - 9/21/16 Market expectations - 9/21/16 Market expectations - 12/1/16 C&I Balances ($B) C&I Spreads (%) 4 © Fifth Third Bancorp | All Rights Reserved Yield curve change since the election results Fed funds rate expectations have
also changed Banking industry loan spreads and balances 1 2 1 0.54 0.89 1.33 2.05 1.13 1.88 2.63 2.56 2.23 |
 Actions
taken in 2016 should help us achieve our long-term financial
targets •
Balance sheet optimization
• Reduced auto loan originations to optimize return on capital • Continue to target C&I loans with appropriate risk/return profiles • Efficient capital utilization • 73% capital distribution YTD • Optimization of Vantiv ownership • Emphasizing direct investments that drive growth via partnerships • Focused risk management • Maintaining credit discipline as reflected in asset quality metrics • Balanced interest rate and liquidity risk management • Continuous progress toward operational and regulatory excellence • Improving operational efficiency • Lower than anticipated expense growth YTD • Targeting positive operating leverage in 2017 • Making investments to utilize technology for higher efficiency 5 © Fifth Third Bancorp | All Rights Reserved |
 Decrease
in branch network Branch count to be down ~12% from
announced consolidations
Top 10 contracts renegotiated to
benefit Fifth Third beyond 2016
Re-allocating resources from
retail to other areas • Reinvesting savings from branch rationalization into digital technologies to lower
operating expenses and grow revenues in retail network
• $50 million in direct 2017 pre-tax benefit from top ten 2016 contract re-negotiations
• Rationalizing non-branch facilities and enhancing workspace options • Utilizing data and technology infrastructure for headcount and resource re-allocation
• Targeting significant savings from end-to-end redesign in commercial lending
Lowering expense growth to drive positive
operating leverage 6 -4.5% 19.3% -1.3% Retail IT Total Bancorp FTE count: 3Q16 vs. 3Q15 3Q15 4Q15 1Q16 2Q16 3Q16 Banking Centers 3Q16 announced $48 $50 $63 $85 2016 2017 2018 2019 Projected pre-tax impact of top ten 2016 contract re-negotiations relative to 2015 ($s millions) © Fifth Third Bancorp | All Rights Reserved |
 • North Star designed to enhance profitability with stable long-term growth - Seeking balanced growth between commercial and consumer businesses - Targeting controlled operating expenses and accelerating revenue growth • Some initiatives have short-term payoffs; many will impact results beyond 2017
year-end 2017 Select North Star Initiatives Expanded mortgage capacity via new system Teller automation Omni-channel distribution investments New credit card products and investments in analytics GreenSky - originations Specialty and Asset-Based Lending growth New vertical build-outs End-to-end process re-design Continued capital markets growth Enhanced profitability measurement capabilities Treasury Mgmt. product expansion and optimization Compensation plan re-design / headcount rationalization Renegotiate major vendor contracts Automation and robotics initiatives Non-branch rationalization and workspace management Primary Focus Revenue / Expense Focused on enhancing long-term profitability R + E E R + E R R R R R + E R R + E E E E E Ongoing initiatives <50% 50-75% 76-100% R year-end 2018 year-end 2019 Progress towards full financial run-rate impact GreenSky - full channel integration & digital capabilities R 7 |
 Optimizing
the use of capital •
Focused on disciplined market share growth without compromising returns
• Reducing capital allocation to single-product, low-utilization investment grade
corporate relationships; redeploying capital to strategic growth areas
• Targeting opportunities in consumer lending to optimize returns in areas with high
growth potential – Personal lending and credit card growth in footprint As a result of our focus on profitability, our loan yields have outperformed peers Cumulative change FITB: +10 bps Peers: +4 bps Note: Peer Median includes BBT, CFG, CMA, MTB, PNC, RF, STI, USB, and ZION; Company filings.
C&I Loans and Yields
Expanding yields in portfolios
largely concentrated in fixed
rate products 8 0.00% 0.10% -0.01% 0.01% -0.04% 0.13% -0.05% 0.00% 4Q15 1Q16 2Q16 3Q16 Q-Q change in loan yields since the 4Q15 Fed funds rate hike FITB Peer Median $56.98 $57.17 $57.15 $58.16 $57.81 $0.63 $1.53 $2.32 3.09% 3.09% 3.21% 3.22% 3.25% 3Q15 4Q15 1Q16 2Q16 3Q16 Average Commercial Balances ex deliberate runoff. ($BN) Average Balance Ex. 2016 Runoff FITB Yield 2.62% 2.67% 2.65% 2.68% 2.71% 3.23% 3.16% 3.14% 3.16% 3.18% 3Q15 4Q15 1Q16 2Q16 3Q16 Auto Securities © Fifth Third Bancorp | All Rights Reserved |
 9 © Fifth Third Bancorp | All Rights Reserved Credit discipline is a top priority • Growing loans while maintaining credit discipline • Disciplined underwriting standards for CRE client selection • Criticized assets at lowest level since Q3 2007; outperforming peers • Growth in SNC balances helped achieve profitability with higher credit quality Note: Peer Median includes BBT, CFG, CMA, HBAN, KEY, MTB, PNC, RF, STI, USB, and ZION
1 Source: Company 10-Q filings as of 6/30/14 and 9/30/16; CFG excluded as criticized asset data was not publicly disclosed as of 6/30/14 2 NPA ratios on a comparable basis to Fifth Third (Nonperforming portfolio assets as a percent of portfolio loans and leases and OREO)
3 Source: OCC/Federal Reserve Shared National Credit Review: 1 st Quarter 2016 Review 4 Source: Moody’s Investors Service. 2013 2014 2015 2016 YTD Regionals 20% 28% 19% 16% FITB 19% 17% 12% 9% • 3.3% of SNC commitments criticized compared to 10.3% for industry 3 • Vertical growth can result in additional SNC commitments • SNC balance growth by year 4 : Credit quality of SNC portfolio higher than industry Declining non performing asset levels Decrease in criticized assets Primarily driven by energy-related NPAs Change in commercial criticized asset ratio from 2Q14 to 3Q16 -1.5% -0.5% 0.5% 1.5% 2.5% 3.5% FITB MTB BBT PNC HBAN USB RF ZION STI KEY CMA 0.67% 0.65% 0.70% 0.88% 0.86% 0.75% 2Q15 3Q15 4Q15 1Q16 2Q16 3Q16 Nonperforming asset ratio FITB Peer Median 1 2 |
 10 Targeting growth in scale and scope within risk appetite Committed to higher profitability and attractive returns relative to peer-group Well-positioned to achieve long-term targets under various economic conditions In summary Will create additional shareholder value Profitability Growth Stability 10 © Fifth Third Bancorp | All Rights Reserved |
 11 © Fifth Third Bancorp | All Rights Reserved Appendix |
 • 4Q16 warrant net exercise and share sale successfully executed; expected to result in ~$6MM after-tax gain and 4 bps increase in CET1 • Vantiv gains monetized from Fifth Third actions since 4Q15 resulting in ~$493MM in after-tax value to shareholders: • 4Q15: $32MM related to TRA termination and settlement • 4Q15: $273MM related to warrant cancellation and share sale gains • 3Q16: $182MM related to TRA termination and settlement • 4Q16: $6MM warrant net exercise and share sale gains • Still hold 17.9% ownership interest in Vantiv Holdings LLC; retaining 1 board seat
• Will continue to account for ownership under equity method of accounting • Significant contractual arrangements between Fifth Third and Vantiv Continuing to monetize our Vantiv stake © Fifth Third Bancorp | All Rights Reserved 12 |
 • NII increased $5MM sequentially while NIM remained stable at 2.88% • Reported noninterest income up 40% sequentially primarily driven by Vantiv TRA-related items • Stable underlying fee revenue • Adjusted : down 1% sequentially primarily due to the change in MSR valuation adjustments • Tightly controlled operating expenses • Reported noninterest expenses down $10 million sequentially • Adjusted expenses down 1% sequentially • Strategic investments on-track • Overall credit conditions benign and in-line with expectations Third Quarter 2016 Highlights 1 Non-GAAP measure: see Reg G reconciliation on page 21 of this presentation and use of non-GAAP measures on page 33 of the 3Q16 earnings release 2 See page 14 of this presentation for impact of certain items Diluted EPS Reported $0.65 Included $0.22 net positive impact from certain items Net Income to Common $501 million LCR 115% 13 © Fifth Third Bancorp | All Rights Reserved 1 1 2 1 |
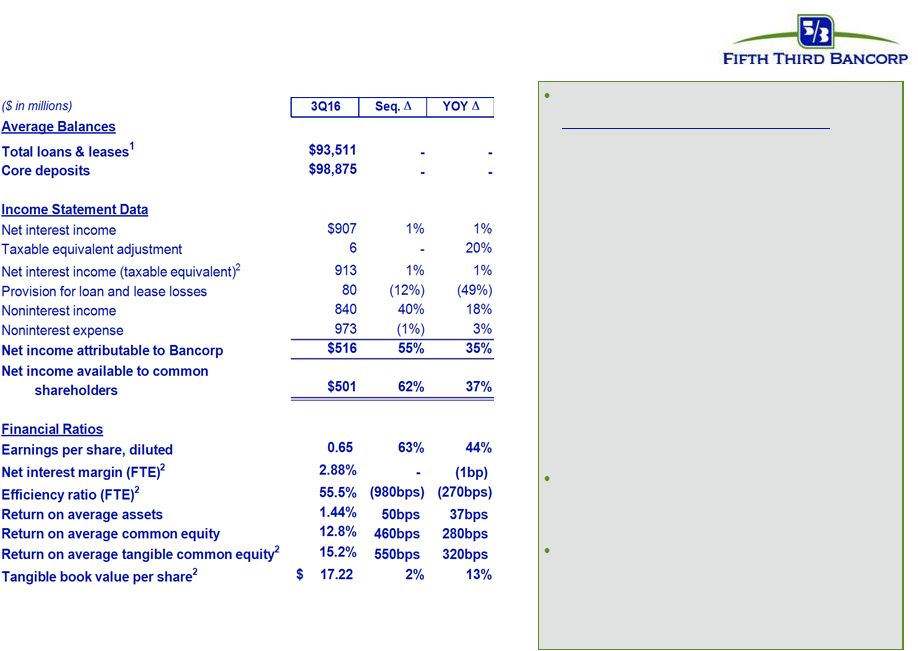 14 Significant pre-tax items in 3Q16 results ($0.22 net positive after-tax EPS impact): — $280MM pre-tax (~$182MM after-tax) gain from the termination and settlement of gross cash flows from Vantiv TRA — $28MM pre-tax (~$18MM after-tax) non-cash impairment charge related to previously announced changes to the branch network — $12MM pre-tax (~$8MM after-tax) charge related to the Visa total return swap — $11MM pre-tax (~$7MM after-tax) gain on the sale of a non-branch facility — $9MM pre-tax (~$6MM after-tax) charge from the transfer of certain nonconforming investments affected by the Volcker Rule to held-for-sale — $8MM beneficial tax impact in connection with certain commercial lease terminations Core businesses showed solid results given challenging market conditions — Mortgage origination volumes up 7% QoQ Credit trends — NCO ratio of 45 bps; up 8 bps sequentially — NPA ratio of 75 bps; down 11 bps sequentially 3Q16 in review 1 Excludes loans held-for-sale 2 Non-GAAP measure: see Reg G reconciliation on pages 20 and 21 of this presentation and use of non-GAAP measures on page 33 of the 3Q16 earnings release © Fifth Third Bancorp | All Rights Reserved |
 15 Pre-tax pre-provision earnings and efficiency ratio trend 1 1 Non-GAAP measures: see Reg G reconciliation on page 21 of this presentation and use of non-GAAP measures on page 33 of the 3Q16 earnings release
2 Prior quarters include similar adjustments. Adjusted PPNR up 1% sequentially – Due to increases in net interest income and service charges on deposits Adjusted PPNR down 4% YoY – Driven by personnel expenses and changes in net MSR valuation adjustments PPNR reconciliation © Fifth Third Bancorp | All Rights Reserved |
 $250
$500 $500 $500 $1,100 $2,312 $0 $500 $1,000 $1,500 $2,000 $2,500 2016 2017 2018 2019 2020 2021 on Fifth Third Bancorp Fifth Third Capital Trust (Bancorp) $1,750 $650 $1,850 $2,600 $2,850 $0 $500 $1,000 $1,500 $2,000 $2,500 $3,000 2016 2017 2018 2019 2020 2021 On Fifth Third Bank 1 Available and contingent borrowing capacity (3Q16): – FHLB ~$11.5B available, ~$14.9B total – Federal Reserve ~$25.5B Holding Company: Bancorp LCR of 115% at 9/30/16 Holding Company cash at 9/30/16: $2.3B Cash currently sufficient to satisfy all fixed obligations in a stressed environment for ~20 months (debt maturities, common and preferred dividends, interest and other expenses) without accessing capital markets; relying on dividends from subsidiaries or any other discretionary actions Bank Entity: No long-term debt maturities in 3Q16. During the quarter the Bank delivered notice of redemption of $1.75B of senior notes to be redeemed on 10/19/16. These notes had an original maturity date of 11/18/16 Also during the quarter the Bank issued $1.0B of 3-year senior debt in two tranches - $750MM fixed and $250MM of floating rate securities 2016 Funding Plans: As of 9/30/16, Fifth Third has completed the refinancing of all 2016 debt maturities and believes these actions are sufficient to satisfy Moody’s Loss Given Failure (LGF) methodology Holding company unsecured debt maturities ($MM) Bank unsecured debt maturities ($MM – excl. Retail Brokered & Institutional CDs) Heavily core funded as of 9/30/16 Strong liquidity profile S-T wholesale 4% 1 Represents remaining debt maturities in 2016 © Fifth Third Bancorp | All Rights Reserved 16 1 Demand 25% Interest checking 17% Savings/ MMDA 24% Consumer time 3% Foreign Office 0% Non-Core Deposits 2% S-T borrowings 2% Other liabilities 3% Equity 12% L-T debt 12% |
 35% 46% 19% Balance sheet positioning Commercial Loans 1,2 Investment Portfolio Consumer Note: All data as of 9/30/16 1 Includes HFS Loans & Leases 2 Fifth Third had $4.48BN 1ML receive-fix swaps outstanding against C&I loans, which are now being included in fixed
3 Fifth Third had $3.46BN 3ML receive-fix swaps outstanding against long term debt, which are now being included in floating
• Fixed: $14.3B 1, 2 • Float: $43.3B 1, 2 • 1ML based: 61% (of total commercial) • 3ML based: 8% (of total
commercial) • 6ML based: 1% (of total
commercial) •
Prime based: 5% (of total
commercial) • Weighted Avg. Life: 1.78 years • 48% allocation to bullet/locked-out cash flow securities • Investment portfolio yield: 3.18% • Duration: 4 years • Net unrealized pre-tax gain: $1.2B • 98% AFS • Fixed: $26.5B • Float: $10.2B • 12ML based: 4% (of total
consumer) • Prime based: 24% (of total consumer) • Weighted Avg. Life: 3.32 years • Avg. duration of Auto book: 1.30 years Long Term Key Characteristics Balance Sheet Mix Fixed vs. Floating Level 1 100% Fix / 0% Float Level 2A 100% Fix / 0% Float Non-HQLA 75% Fix / 25% Float C&I 20% Fix / 80% Float Commercial Mortgage 24% Fix / 76% Float 4% Fix / 96% Float Commercial Construction 100% Fix / 0% Float Commercial Lease Resi Mtg & Construction 90% Fix / 10% Float Auto 100% Fix / 0% Float 10% Fix / 90% Float Home Equity 30% Fix / 70% Float Credit Card 100% Fix / 0% Float Other • Fixed: $11.8B • Float: $5.1B • 1ML based: <1% (of total
long term debt) • 3ML based: 30% (of total long
term debt) •
Weighted Avg. Life: 4.59 years
Senior Debt 30% Fix / 70% Float Sub Debt 94% Fix / 6% Float 96% Fix / 4% Float Auto Securiz. Proceeds 0% Fix / 100% Float TRUPS 100% Fix / 0% Float Other 65% 25% 8% 1% <1% © Fifth Third Bancorp | All Rights Reserved 17 1 3 3 1 Debt 1 Loans 3 7% 12% 74% 7% 21% 28% 43% 6% 2% |
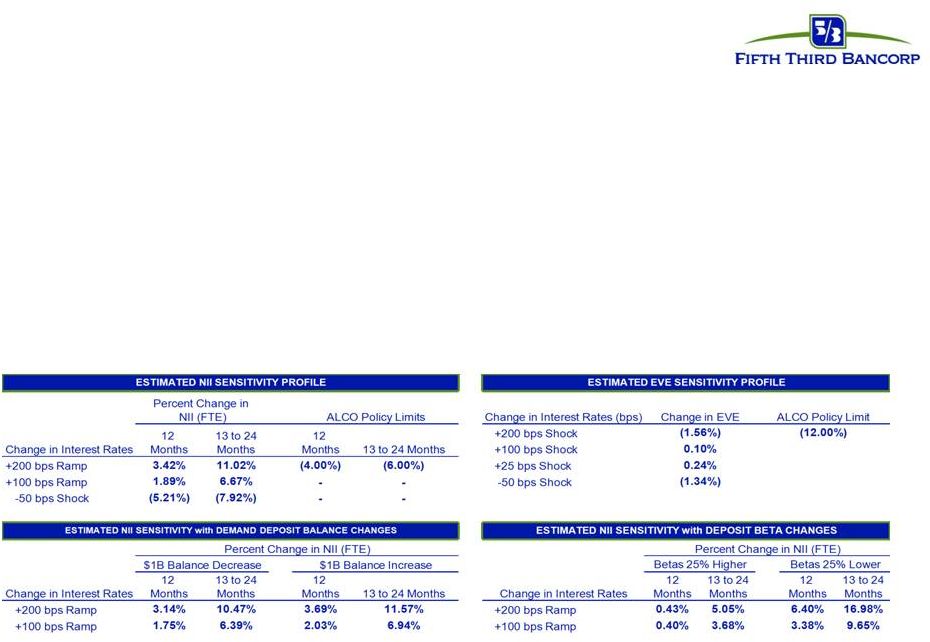 Interest
rate risk management Note: Data as of 9/30/16
1. Actual results may vary from these simulated results due to differences between forecasted and actual balance sheet composition,
timing, magnitude, and frequency of interest rate
changes, as well as other changes in market conditions and management strategies.
2. Re-pricing percentage or “beta” is the estimated change in yield over 12 months as a result of a shock or ramp 100 bps parallel
shift in the yield curve •
NII benefits from asset rate reset in a rising rate environment
– 57% of total loans are floating rate (75% of commercial considering impacts of interest rate swaps and 28% of consumer)
– Investment portfolio duration of 4 years – Short-term wholesale funding represents approximately 12% of total wholesale funding, or 2% of total funding
– Approximately $12B in non-core funding matures beyond one year • Interest rate sensitivity tables are based on conservative deposit assumptions – 70% beta on all interest-bearing deposit and sweep balances (~50% betas experienced in 2004
– 2006 Fed tightening cycle) – No modeled re-pricing lag – Modeled non-interest bearing commercial DDA runoff of approximately $2.5B (about 10%) for each 100 bps increase in
rates – DDA runoff rolls into an interest bearing product with a 100% beta 18 © Fifth Third Bancorp | All Rights Reserved |
 19 © Fifth Third Bancorp | All Rights Reserved Credit trends Residential Mortgage Commercial & Industrial Home Equity & Automobile Commercial Real Estate * Excludes loans held-for-sale. |
 Regulation G Non-GAAP reconciliation
See page 33 of the 3Q16 earnings release for a discussion on the use of non-GAAP
financial measures. 20
©
Fifth Third Bancorp | All Rights Reserved |
 Regulation G non-GAAP reconciliation
See page 33 of the 3Q16 earnings release for a discussion on the use of non-GAAP
financial measures. 21
©
Fifth Third Bancorp | All Rights Reserved
Fifth Third Bancorp and Subsidiaries
Regulation G Non-GAAP Reconciliation
$ and shares in millions
(unaudited) September June March December September 2016 2016 2016 2015 2015 Net interest income (U.S. GAAP) $907 $902 $903 $899 $901 Add: FTE Adjustment 6 6 6 5 5 Net interest income on an FTE basis
(a) $913 $908 $909 $904 $906 Net interest income on an FTE basis (annualized) (b) $3,632 $3,652 $3,656 $3,587 $3,594 Noninterest income (U.S. GAAP) (c) $840 $599 $637 $1,104 $713 Gain on sale of Vantiv shares - - - (331) - Gain on Vantiv warrant actions - - - (89) - Vantiv TRA-related transactions (280) - - (49) - Gain from the sale of a non-branch facility (11) - - - - Branch / land impairment charge 28 - - - - Valuation of 2009 Visa total return swap 12 50 (1) 10 8 Transfer of certain nonconforming investments under Volcker to held-for-sale
9 - - - - Vantiv warrant valuation 2 (19) (47) (21) (130) Gain on sale of certain branches - (11) (8) - - Gain on sale of the non-strategic agented bankcard loan portfolio - (11) - - - Securities (gains) / losses (4) (6) (3) (1) - Adjusted noninterest income
(d) $596 $602 $578 $623 $591 MSR valuation adjustments (9) 6 11 13 8 Adjusted noninterest income, excluding MSR valuation adjustments $605 $596 $567 $610 $583 Noninterest expense (U.S. GAAP)
(e) $973 $983 $986 $963 $943 Contribution for Fifth Third Foundation (3) - - (10) - Severance expense (4) (3) (15) (2) (3) Retirement eligibility changes - (9) - - - Executive retirements - - - - (6) Adjusted noninterest expense (f) $966 $971 $971 $951 $934 Average interest-earning assets (g) 126,092 126,847 125,651 125,843 124,431 Average assets (h) 142,726 142,920 141,582 141,973 140,706 Net interest margin (b) / (g) 2.88% 2.88% 2.91% 2.85% 2.89% Efficiency ratio (e) / [(a) + (c)] 55.5% 65.2% 63.8% 48.0% 58.2% Adjusted efficiency ratio (f) / [(a) + (d)] 64.0% 64.3% 65.3% 62.2% 62.4% PPNR (FTE) (a) + (e) - (c) $780 $524 $560 $1,045 $676 Adjusted PPNR (a) + (d) - (f) $543 $539 $516 $576 $563 Net income attributable to Bancorp (U.S. GAAP) (i) $516 $333 $327 $657 $381 Net income to common shareholders (U.S. GAAP) (j) $501 $310 $312 $634 $366 Combined pre-tax PPNR adjustments (d) - (c) + (e) - (f) (237) 15 (44) (469) (113) Less: Impact of assumed 35% rate on adjustments (83) 5 (15) (164) (40) After-tax impacts of certain items (k) (154) 10 (29) (305) (73) Core net income available to common shareholders (j) + (k) $347 $320 $283 $329 $293 Core net income available to common shareholders (annualized) (l) $1,380 $1,287 $1,138 $1,305 $1,162 Core net income (i) + (k) $362 $343 $298 $352 $308 Core net income (annualized) (m) $1,440 $1,380 $1,199 $1,397 $1,222 Average tangible common equity, including unrealized gains & losses, prior 4 quarters (n)
12,750 Core return on average tangible common equity, prior 4 quarters of (j) + (k) / (n)
10.0% Average Bancorp common shareholders' equity (U.S. GAAP) (o) 15,552 15,253 15,045 14,651 14,484 Core return on assets (annualized) (m) / (h) 1.01% 0.97% 0.85% 0.98% 0.87% Core return on equity (annualized) (l) / (o) 8.88% 8.44% 7.57% 8.91% 8.03% For the Three Months Ended |