Attached files
| file | filename |
|---|---|
| 8-K - 8-K - CITIZENS FINANCIAL GROUP INC/RI | d279952d8k.htm |
  Bruce Van Saun
Chief Executive Officer
Goldman Sachs US Financial Services Conference 2016
December 2016 Exhibit 99.1 |
 Forward-looking statements and use of key performance metrics and Non-GAAP
Financial Measures 1
This document contains forward-looking statements within the Private Securities Litigation Reform Act of 1995. Any statement that does not describe historical or current facts is a forward-looking statement. These statements often include the words “believes,” “expects,” “anticipates,” “estimates,” “intends,” “plans,” “goals,” “targets,” “initiatives,” “potentially,” “probably,” “projects,” “outlook” or similar expressions or future conditional verbs such as “may,” “will,” “should,” “would,” and “could.” Forward-looking statements are based upon the current beliefs and expectations of management, and on information currently available to management. Our statements speak as of the date hereof, and we do not assume any obligation to update these statements or to update the reasons why actual results could differ from those contained in such statements in light of new information or future events. We caution you, therefore, against relying on any of these forward-looking statements. They are neither statements of historical fact nor guarantees or assurances of future performance. While there is no assurance that any list of risks and uncertainties or risk factors is complete, important factors that could cause actual results to differ materially from those in the forward-looking statements include the following, without limitation: negative economic conditions that adversely affect the general economy, housing prices, the job market, consumer confidence and spending habits which may affect, among other things, the level of nonperforming assets, charge-offs and provision expense; the rate of growth in the economy and employment levels, as well as general business and economic conditions; our ability to implement our strategic plan, including the cost savings and efficiency components, and achieve our indicative performance targets; our ability to remedy regulatory deficiencies and meet supervisory requirements and expectations; liabilities and business restrictions resulting from litigation and regulatory investigations; our capital and liquidity requirements (including under regulatory capital standards, such as the Basel III capital standards) and our ability to generate capital internally or raise capital on favorable terms; the effect of the current low interest rate environment or changes in interest rates on our net interest income, net interest margin and our mortgage originations, mortgage servicing rights and mortgages held for sale; changes in interest rates and market liquidity, as well as the magnitude of such changes, which may reduce interest margins, impact funding sources and affect the ability to originate and distribute financial products in the primary and secondary markets; the effect of changes in the level of checking or savings account deposits on our funding costs and net interest margin; financial services reform and other current, pending or future legislation or regulation that could have a negative effect on our revenue and businesses, including the Dodd-Frank Act and other legislation and regulation relating to bank products and services; a failure in or breach of our operational or security systems or infrastructure, or those of our third party vendors or other service providers, including as a result of cyber attacks; and management’s ability to identify and manage these and other risks. In addition to the above factors, we also caution that the amount and timing of any future common stock dividends or share repurchases will depend on our financial condition, earnings, cash needs, regulatory constraints, capital requirements (including requirements of our subsidiaries), and any other factors that our board of directors deems relevant in making such a determination. Therefore, there can be no assurance that we will pay any dividends to holders of our common stock, or as to the amount of any such dividends. More information about factors that could cause actual results to differ materially from those described in the forward-looking statements can be found under “Risk Factors” in Part I, Item 1A in our Annual Report on Form 10-K for the year ended December 31, 2015, filed with the United States Securities and Exchange Commission on February 26, 2016. Key performance metrics and Non-GAAP Financial Measures Key performance metrics: Our management team uses certain key performance metrics (“KPMs”) to gauge our performance and progress over time in achieving our strategic and operational goals and also in comparing our performance against our peers. In connection with our path to becoming an independent public company, we established the following financial targets, in addition to others, as KPMs. These KPMs are utilized by our management in measuring our progress against financial goals and as a tool in helping assess performance for compensation purposes. These KPMs can largely be found in our Registration Statements on Form S-1 and our periodic reports, which are filed with the Securities and Exchange Commission, and are supplemented from time to time with additional information in connection with our quarterly earnings releases. Our key performance metrics include: Return on average tangible common equity (“ROTCE”); Return on average total tangible assets (“ROTA”); Efficiency ratio; Operating leverage; and Common equity tier 1 capital ratio (Basel III fully phased-in basis). In establishing goals for these KPMs, we determined that they would be measured on a management-reporting basis, or an operating basis, which we refer to externally as “Adjusted” results. We believe that these “Adjusted” results, which exclude restructuring charges, special items and and/or notable items, as applicable, provide the best representation of our underlying financial progress toward these goals as they exclude items that our management does not consider indicative of our on-going financial performance. We have consistently shown these metrics on this basis to investors since our initial public offering in September of 2014. Adjusted KPMs are considered Non-GAAP Financial Measures. Non-GAAP Financial Measures: This document contains Non-GAAP Financial Measures. The tables in the appendix present reconciliations of certain Non-GAAP Financial Measures. These reconciliations exclude restructuring charges, special items and/or notable items, which are included, where applicable, in the financial results presented in accordance with GAAP. Restructuring charges and special items include expenses related to our efforts to improve processes and enhance efficiencies, as well as rebranding, separation from RBS and regulatory expenses. Notable items include certain revenue or expense items that may occur in a reporting period, which management does not consider indicative of on-going financial performance. The Non-GAAP Financial Measures presented in the appendix include “noninterest income”, “total revenue”, “noninterest expense”, “pre-provision profit”, “income before income tax expense”, “income tax expense”, “net income”, “net income available to common stockholders”, “other income”, “salaries and employee benefits”, “outside services”, “occupancy”, “equipment expense”, “other operating expense”, “net income per average common share”, “return on average common equity”, “return on average total assets”, “noninterest income adjusted for card reward accounting change”, “total revenues adjusted for card reward accounting change”, “noninterest expense adjusted for card reward accounting change” and “efficiency ratio adjusted for card reward accounting change”. We believe these Non-GAAP Financial Measures provide useful information to investors because these are among the measures used by our management team to evaluate our operating performance and make day-to-day operating decisions. In addition, we believe restructuring charges, special items and/or notable items in any period do not reflect the operational performance of the business in that period and, accordingly, it is useful to consider these line items with and without restructuring charges, special items and/or notable items. We believe this presentation also increases comparability of period-to-period results. Other companies may use similarly titled Non-GAAP Financial Measures that are calculated differently from the way we calculate such measures. Accordingly, our Non-GAAP Financial Measures may not be comparable to similar measures used by other companies. We caution investors not to place undue reliance on such Non-GAAP Financial Measures, but instead to consider them with the most directly comparable GAAP measure. Non-GAAP Financial Measures have limitations as analytical tools and should not be considered in isolation, or as a substitute for our results as reported under GAAP. |
 Dimension (1) Rank (3) Assets: $147.0 billion #12 Loans: $106.0 billion (4) #11 Deposits: $108.3 billion #12 Branches: ~1,200 #12 ATM network: ~3,200 #7 Mortgage: $14.6 billion #17 nationally Student: $6.0 billion Top 4 rank nationally Deposits: $108.3 billion Top 5 rank: 9/10 markets HELOC: $14.5 billion Top 5 rank: 9/9 markets Middle market lead/joint lead bookrunner #5 (5) Leading deposit market share of 12.0% in top 10 MSAs – #2 deposit market share in New England Relatively diverse economies/affluent demographics Serve 5 million+ individuals, institutions and companies ~17,600 colleagues Retail presence in 11 states Top 5 deposit market share in 9 of 10 largest MSAs Solid franchise with leading positions in attractive markets 2 Source: SNL Financial. Data as of 9/30/2016, unless otherwise noted. 1) CFG data as of September 30, 2016. 2) Reflects branches with reported FDIC deposits as of 06/30/2016; individual branch deposits capped at $500 million and exclude non-retail banks. 3) Ranking based on 9/30/2016 data, unless otherwise noted; excludes non-retail depository institutions, includes U.S. subsidiaries of foreign banks. 4) Includes held for sale. 5) Thomson Reuters LPC, Loan syndications 2Q16 ranking based on number of deals for Overall Middle Market (defined as Borrower Revenues <
$500MM and Deal Size < $500MM). 6)
According to IMF bank-only origination rank; volume as of 3Q16.
7) CFG estimate, based on published company reports, where available; private student loan origination data as of 9/30/2016.
8) According to Equifax; origination volume as of 3Q16. Buffalo, NY: #5 Albany, NY: #3 Pittsburgh, PA: #2 Cleveland, OH: #5 Manchester, NH: #1 Boston, MA: #2 Rochester, NY: #5 Philadelphia, PA: #4 Detroit, MI: #6 Providence, RI: #1 (2) (2) (6) (7) (2) (8) |
 Aspire to be a top-performing regional bank, delivering well for all
stakeholders 3
Colleagues Regulators Investors Communities & Society Customer-centric culture Customers |
 Our
plan has clear objectives for each stakeholder 4
Achieve current targets, then raise the bar
Strive for consistency in performance, limit tail risk
Target attractive high payout ratio; steady and growing dividend
Investors Customers Colleagues Community Regulators Continue to improve customer satisfaction Top 10 in JD Power for Consumer segment Top performer in RM quality, value of ideas in Commercial Gain market share in targeted businesses within Consumer & Commercial
Achieve top-quartile Organizational Health rating
Continue to develop talent and enhance culture
Achieve heightened volunteer and financial giving aspirations
Use our position to improve the well-being of the communities we
serve Achieve and sustain heightened standards across broad
regulatory agenda and earn the respect of our
regulators Steady progress across all elements in 2016
|
 We
are making steady progress without rate hikes 5
Capturing revenue
potential of
franchise Using strong balance sheet and targeted hiring to grow loans Self funding necessary investments through efficiency initiatives Disciplined capital management Medium- term target 10% + low 60’s -- -- 1) Please see important information on Key Performance Metrics and Non-GAAP Financial Measures at the beginning of this presentation for
an explanation of their use and the appendix for their
calculation and/or reconciliation to GAAP Financial Measures, as applicable. Adjusted results exclude restructuring charges, special items and/or notable items as applicable. Where disclosed, peer results adjusted for similar unusual or special revenue, expense and acquisition items.
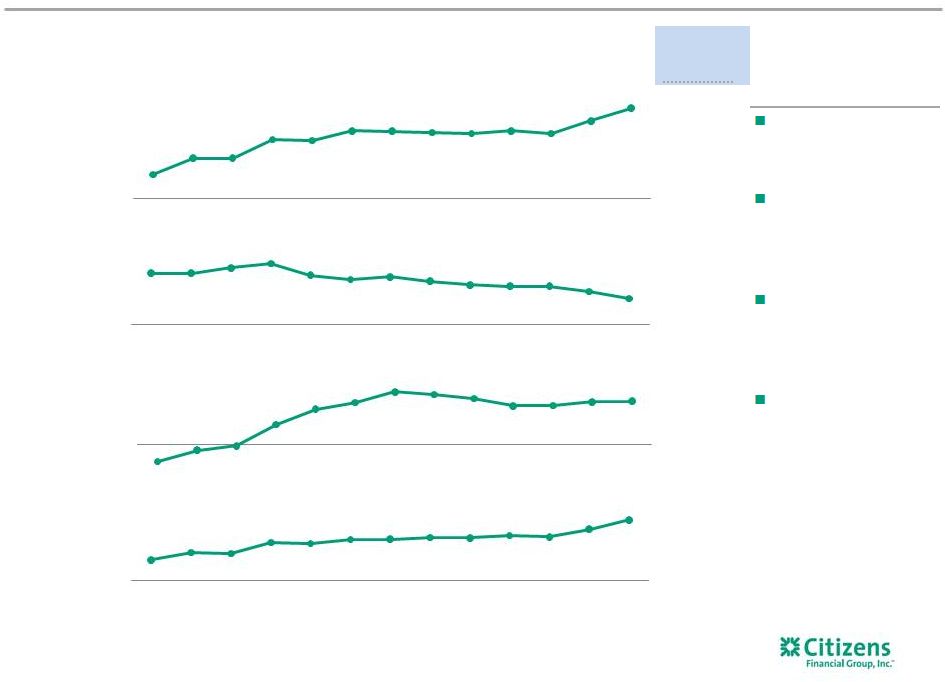
Key points ROTCE Adjusted ROTCE (1) Efficiency ratio Adjusted efficiency ratio (1) YoY average loan growth EPS Adjusted diluted EPS (1) 4.34% 5.24% 5.24% 6.28% 6.22% 6.76% 6.73% 6.67% 6.60% 6.75% 6.61% 7.30% 8.02% 68% 68% 69% 70% 68% 67% 68% 67% 66% 66% 66% 65% 63% (2.9)% (0.9)% (0.2)% 3.5% 6.1% 7.3% 9.1% 8.6% 8.0% 6.7% 6.7% 7.4% 7.5% $0.26 $0.30 $0.30 $0.37 $0.36 $0.39 $0.39 $0.40 $0.40 $0.42 $0.41 $0.46 $0.52 3Q13 4Q13 1Q14 2Q14 3Q14 4Q14 1Q15 2Q15 3Q15 4Q15 1Q16 2Q16 3Q16 |
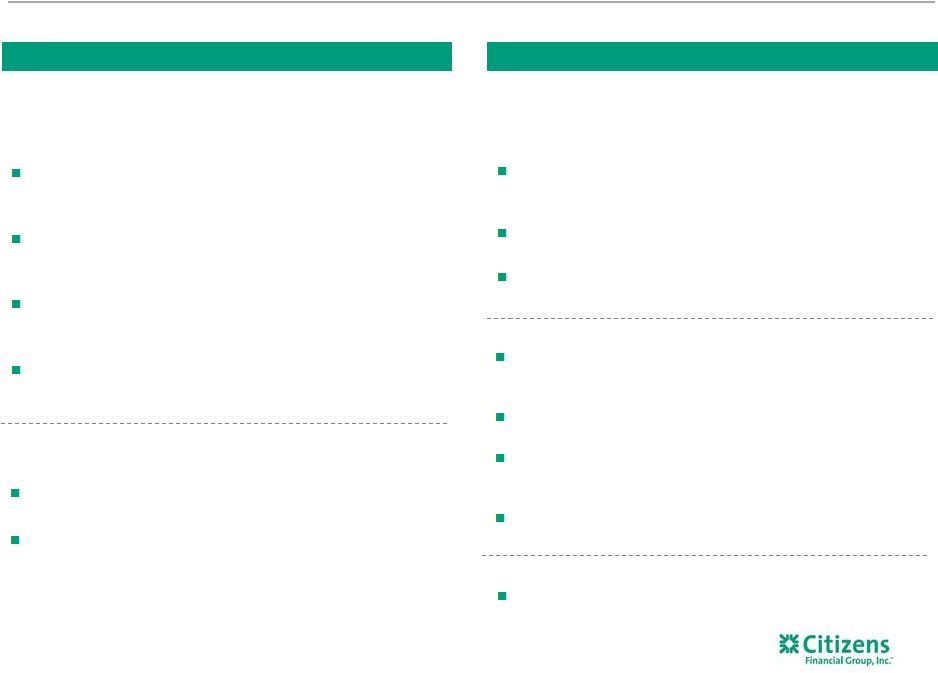
 5.8% 4.6% A strong platform well positioned to drive value Good execution of plan is driving balance sheet and revenue momentum Growing revenues faster (Adjusted revenue growth (1) ) 6 3Q16 vs. 3Q15 379 bps above peers Source: SNL Financial and Company filings. Peers include CMA, FITB, PNC, RF, STI and USB. Unless otherwise noted, due to recent
acquisitions BBT, KEY and MTB excluded from the peer average.
1) Please see important information on Key Performance Metrics and Non-GAAP Financial Measures at the beginning of this presentation for
an explanation of their use and the appendix for their calculation
and/or reconciliation to GAAP Financial Measures, as applicable. Adjusted results exclude restructuring charges, special items and/or notable items, as applicable. Where disclosed, peer results adjusted for similar unusual or special revenue, expense and acquisition items.
2) Reflects net interest income sensitivity to forward yield curve changes. Peer data as of 3Q16 10-Q filing. Peer estimates based on
public disclosures and utilize a 200 basis point gradual increase
above the 12-month forward curve except PNC, which is based on a 100 basis
point gradual increase and STI, which is based on 200 basis point shock. PNC and STI excluded from peer median. 14.1% Fee income growth (Adjusted noninterest income growth (1) ) 247 bps below peers CFG results Peer average CFG Adjusted results (1) (1) Peer median Asset-sensitive balance sheet (200 bps gradual increase over forward curve (2) ) Higher NIM expansion (Net interest margin change) 8 bps 8 bps above peers Strong loan growth (Average total loan growth) Robust NII growth (Net interest income growth) 683 bps above peers Flat 7.5% 3.1% CFG Peer average 8.6% 4.8% 4.2% 6.7% 23.2% 10.4% 3.6% |
 198 bps 17 bps 1,717 bps above peers 8 bps above peers 108 bps above peers Well-controlled expenses; investing for growth (Adjusted noninterest expense (1) change) With continued focus on positive operating leverage and improving returns 3Q16 vs. 3Q15 7 8.6% Efficiency improvement (Adjusted efficiency ratio (1) change) Strong operating leverage (YoY Adjusted Operating Leverage (1) ) 417 bps better than peers 549 bps 29 bps (19) bps 252 bps better than peers Improving ROA as assets grow (Adjusted return on average total assets (1) change) Return on equity (Adjusted return on average tangible common equity (1) change) Accelerating profitability (Adjusted net income available to common stockholders (1) change) (314) bps 39 bps better than peers Source: SNL Financial and Company filings. Peers include CMA, FITB, PNC, RF, STI and USB. Unless otherwise noted, due to recent
acquisitions BBT, KEY and MTB excluded from the peer average.
1) Please see important information on Key Performance Metrics and Non-GAAP Financial Measures at the beginning of this presentation for
an explanation of their use and the appendix for their calculation
and/or reconciliation to GAAP Financial Measures, as applicable. Adjusted results exclude restructuring charges, special items and/or notable items, as applicable. Where disclosed, peer
results adjusted for similar unusual or special revenue, expense and acquisition
items. 4.1%
4.5% CFG Peer average 446 bps (271) bps 27.2% 10.0% 36.2% 12 bps 4 bps CFG results Peer average CFG Adjusted results (1) (1) 142 bps 34 bps |
 1) “Tapping our Potential” Phase I efficiency initiatives launched first half 2014, Phase II revenue and efficiency initiatives
launched mid 2015 and Phase III revenue, efficiency and tax initiatives launched mid 2016. 8 We are focused on continuous improvement Delivering for the customer Optimizing the balance sheet Investing for the future Heighten focus on end-to-end customer experience
Further improve segment value propositions and how colleagues deliver against them Increase customer retention through targeted strategies Continue to redeploy capital toward better risk-adjusted return portfolios
Increase discipline and rigor around allocation of capital
Intensify focus on low-cost core deposit gathering
Continue to enhance product offerings
with a focus on target segments Prioritize
technology investments that emphasize digital and mobile solutions and benefits to customers Continue recruiting efforts to add capabilities and scale in select areas such
as mortgage, wealth management and capital markets Improving efficiency Continuous improvement via TOP I, II & III programs (1) Focus on better balancing the mix of revenue and non-revenue
generating colleagues
Accelerate branch rationalizations and introduce more efficient formats through ‘branch of the future’ |
 TOP II Program TOP II Program TOP III Program TOP III Program Revenue initiatives Target ~$60-$65 million Citizens Checkup: Launched with more than 210k customer
appointments kept to-date; customer satisfaction has been
positive with 78% very to completely satisfied
Consumer Retention: Initiative underway and showing strength in deposit retention; successful platinum launch driving retention with the Mass Affluent customer segment Middle Market Share of Wallet: Opportunity pipeline remains
~2X larger than historical levels
(1) leading to stronger capital markets penetration Commercial Pricing: Re-priced 12,000 cash management
accounts; improved loan pricing discipline and increased lending
revenue by 13% and improved IRP spreads
(2) Revenue initiatives Target ~$60-$65 million Citizens Checkup: Launched with more than 210k customer
appointments kept to-date; customer satisfaction has been
positive with 78% very to completely satisfied
Consumer Retention: Initiative underway and showing strength in deposit retention; successful platinum launch driving retention with the Mass Affluent customer segment Middle Market Share of Wallet: Opportunity pipeline remains
~2X larger than historical levels
(1) leading to stronger capital markets penetration Commercial Pricing: Re-priced 12,000 cash management
accounts; improved loan pricing discipline and increased lending
revenue by 13% and improved IRP spreads
(2) Expense initiatives Target ~$40 million Operations Transformation: Streamlining of organization
complete; focused on next wave of opportunities
Supply Chain Services: 2016 run-rate savings achieved driven
by reduction in external resources and tightening of internal
travel and office supplies policies
Expense initiatives
Target ~$40 million
Operations Transformation: Streamlining of
organization complete; focused on next wave of
opportunities Supply Chain
Services: 2016 run-rate savings achieved driven
by reduction in external resources and tightening of
internal travel and office supplies policies
Revenue initiatives
Target ~$25-$30 million
Commercial Attrition: Predictive tool is now in the hands of our RMs that identifies at-risk clients and allows them to proactively develop retention plans for those clients Unsecured Lending: Initiative launched with good initial
customer responses; early read on performance is positive
Business Banking Share of
Wallet: Realignment of
salesforce complete; executing on plans to deepen
relationships Revenue initiatives
Target ~$25-$30 million
Commercial Attrition: Predictive tool is now in the hands of our RMs that identifies at-risk clients and allows them to proactively develop retention plans for those clients Unsecured Lending: Initiative launched with good initial
customer responses; early read on performance is positive
Business Banking Share of
Wallet: Realignment of
salesforce complete; executing on plans to deepen
relationships Expense initiatives
Target ~$55-$65 million
Consumer Efficiencies: First phase of
streamlining non-revenue staff is complete; focus on branch optimization and efficiencies in the mortgage business Commercial Efficiencies: Streamlining end-to-end processing and portfolio management; actions are largely complete Functional Efficiencies: Good progress on reengineering
processes; streamlining forecasting and reporting in
finance and recruiting and training in HR
Fraud: Project underway; initial focus on improving algorithms and enhancing chargeback processes Expense initiatives Target ~$55-$65 million Consumer Efficiencies: First phase of streamlining
non-revenue staff is complete; focus on branch optimization and efficiencies in the mortgage business Commercial Efficiencies: Streamlining end-to-end processing and portfolio management; actions are largely complete Functional Efficiencies: Good progress on reengineering
processes; streamlining forecasting and reporting in
finance and recruiting and training in HR
Fraud: Project underway; initial focus on improving algorithms and enhancing chargeback processes Tax efficiencies Target ~$20 million (3) Tax-Rate Optimization: Aligning tax rate to peer levels;
beginning to see benefit in 3Q16; seeing strength in investment
and historic tax credits
Tax efficiencies
Target ~$20 million
(3) Tax-Rate Optimization: Aligning tax rate to peer levels;
beginning to see benefit in 3Q16; seeing strength in investment
and historic tax credits
Launched mid 2015 —
On track to deliver
$100 -$105 million annual pre-tax benefit by end of 2016
Launched mid 2016 —
Targeted run-rate
benefit of $100-$115 million by end of 2017
9 Tapping Our Potential (TOP) programs remain on track Self funding necessary investments through our efficiency initiatives 1) Represents opportunities per product specialist as of October 2016 vs. March 2015.
2) Improved lending revenue and IRP (interest-rate products) pricing, as well as improved lending revenue on in-scope deals,
which exclude syndicated transactions, select franchise finance
customers, asset-based lending deals and letters of
credit.” 3)
~$20 million pre-tax benefit; noninterest income pre-tax impact ~($20)
million; tax expense benefit of ~$40 million on a pre-tax equivalent basis. |
 13.9% 12.9% 11.8% 11.3% 11.0% 3Q13 3Q14 3Q15 3Q16 Target 2Q17 10 Prudently deploying excess capital to further enhance returns 1) Target 2016 CCAR window implied payout ratio based on CFG GAAP net income for 3Q16, 4Q16-2Q17 S&P CapitalIQ consensus estimates for CFG GAAP net income as of 11/11/16 and 2016 CCAR Plan capital actions. Periods prior to 2015 represent tier 1 common equity ratios. CET1 ratio of 11.3% versus 10.3% peer average offers significant flexibility Glide path down permits both strong loan growth and capital returns to shareholders Favorable 2016 CCAR results further support our capital normalization plan and CET1 glide path 2016 Capital Plan includes $690 million in common share repurchases; ability to increase dividend 17% in 1Q17 In 3Q16, repurchased $250 million of common shares at an average price of $22.60; returned $313 million to shareholders, including common dividends Highest post-stress CET1 minimum relative to peers Lower-than-peer average CET1 erosion and total loan loss rate under stress Second consecutive non-objection Tactical Priorities Payout-composition objectives Target 25-30% dividend payout Continue to repurchase shares all four quarters, while being sensitive to valuation Limit preferred issuance until ROTCE improves Capital-normalization strategy represents prudent CET1 glide path, though still above peer targets CET1 ratio 2016 CCAR Window Implied Payout Ratio of 91% (1) RBS sell down completed (2) 2) |
 Market expects…
Potential impact
Potential impact
Higher likelihood of fiscal stimulus
Higher likelihood of fiscal stimulus
11 Potential benefits from U.S. election results Greater economic activity, demand for loans and services Greater economic activity, demand for loans and services Still early days! Steepening of yield curve; greater confidence in Fed short rate hike Steepening of yield curve; greater confidence in Fed short rate hike Corporate tax reform Corporate tax reform Less and more effective regulation Less and more effective regulation Individual tax reduction Individual tax reduction Benefit to NIM, though less refinancing opportunity; no short-term impact on credit costs Benefit to NIM, though less refinancing opportunity; no short-term impact on credit costs More economic activity; lower corporate tax rate More economic activity; lower corporate tax rate More economic activity More economic activity Potential flexibility on capital, expense base Potential flexibility on capital, expense base |
 12 Key messages 12 Will continue to stay focused on execution of turnaround plan Positioned for continued momentum in 4Q16 and 2017 Key to financial results is to grow the balance sheet smartly with continued focus on building out fee
businesses and delivering positive operating leverage
Citizens delivered strong results in 3Q16
Financial results continue to improve and meet expectations. Strong EPS growth,
robust operating leverage, improving efficiency ratio, active
capital management Adjusted ROTCE
(1) of 8.0%, up from 4.3% three years ago in 3Q13; 3.7% improvement with no rate benefit
Delivering against strategic initiatives with strong growth in Capital Markets
and improving results in Mortgage Banking
Continued execution on balance sheet optimization strategies providing
underlying strength and momentum Capital and credit position
remain strong Peer-leading CET1 ratio permits both strong loan
growth and returns to shareholders Pro-growth U.S. economic
policies could provide a tailwind, but we will remain focused on what we can control 1) Please see important information on Key Performance Metrics and Non-GAAP Financial Measures at the beginning of this presentation
for an explanation of their use and the appendix for their
calculation and/or reconciliation to GAAP Financial Measures, as applicable.
Adjusted results exclude restructuring charges, special items and/or notable items, as applicable. Where disclosed, peer results adjusted for similar unusual or special revenue, expense and acquisition items. |
 Appendix 13 |
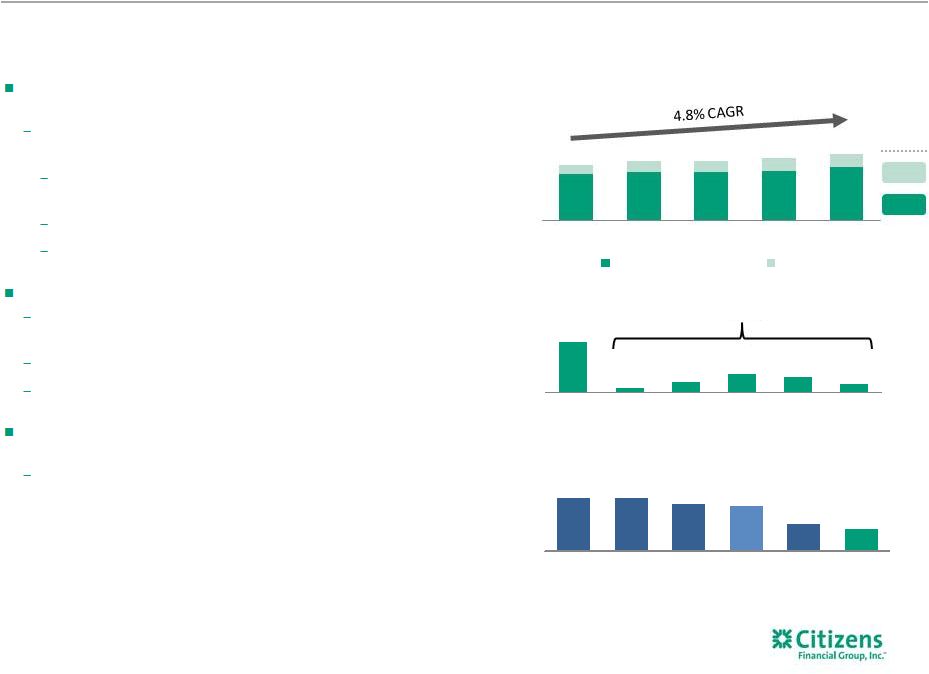
 Driving revenue improvement
Consumer Banking Deposits $70.5 $70.9 $70.9 $71.9 $72.1 2.3% 14 $s in billions Delivering on a multi-year targeted growth strategy – Continuing to leverage “Bank Better” initiatives to drive primary household growth – Utilizing segmentation strategies to attract, retain and deepen customer relationships – Driving product innovation and marketing strategies: Platinum mass affluent offering, Citizens Checkup, iUp, Education Refinance Loans Combining analytics and targeting capabilities with customized product and service offerings to improve customer acquisition and cross-sell outcomes Driving continued improvement in fee income growth opportunities such as mortgage and wealth – Enhancing onboarding and talent management processes to improve retention Continuing to improve efficiency and effectiveness of branch network and evolve distribution to better meet our customers’ needs as their expectations and behaviors change (2.6)% 11.7% Growth rate Strong loan growth (1) Growth driven by strong loan growth, NIM expansion, and investment in talent, infrastructure,
product and advisory capabilities
(7.4)% 71.9% Growth rate 2.2% 17.2% (3.3)% 8.3% 0.9% Noninterest income growth excluding card reward impact (2) 8.6% $s in millions Revenue growth excluding card reward impact (2) Efficiency ratio excluding card reward impact (2) 78.5% $51.6 $52.5 $53.5 $54.0 $55.0 3Q15 4Q15 1Q16 2Q16 3Q16 Home equity Auto Mortgage Student Business banking Other Efficiency ratio (2) 78.6% Noninterest income Net interest income 3Q15 4Q15 1Q16 2Q16 3Q16 78.7% 78.9% 78.1% 77.0% 76.5% $791 $791 $789 $821 $850 1) Excludes Consumer loans held for sale. 2) Please see important information on Key Performance Metrics and Non-GAAP Financial Measures at the beginning of this presentation for
an explanation of their use and the appendix for their calculation and/or reconciliation to GAAP Financial Measures, as applicable. Adjusted results exclude restructuring charges, special items and/or notable items, as applicable. Where disclosed, peer results adjusted
for similar unusual or special revenue, expense and acquisition items. |
 Large wealth opportunity with focused strategy to pursue
1) Source: Company 3Q16 10-Q filings, which utilize Company-disclosed fees. PNC comprises trust income, which equates to asset
management and trust; KEY comprises trust income, which equates to
trust and investment services income; MTB & USB comprise trust income; CFG,
RF comprise trust and investment services fees; FITB, & STI comprise trust income, which equates to trust and investment management income + trust income + fees and commissions + fiduciary trust; BBT comprises trust income, which equates to trust
and investment advisory revenue; CMA comprises trust income, which
equates to trust fees. 15
Accelerate the growth of clients into our value proposition in order to deepen
product penetration and share of wallet and drive fee income
growth Strategy
Scaling advisor base to opportunity and
enhancing alignment between Bankers & FCs
Platinum Premier Private Designing products and experiences tailored to target segments Launched “Platinum” offering in 2016 for mass affluent segment Tailoring loan, deposit and investment products to customer segments Strengthening sales processes to drive towards an integrated advisory model and more managed accounts 360° view of the customer Citizens Checkup/Retirement Checkup Dedicated Premier RM/FC partnerships (50 teams by year end) Developing digital investment solutions Primary Focus Opportunity to drive fee income growth (Wealth Fees/Average Earning Assets (1) ) 0.48% 0.48% 0.48% 0.41% 0.39% 0.37% 0.33% 0.32% 0.32% 0.14% 0.12% KEY PNC MTB USB RF Peer avg STI FITB CMA BBT CFG |
 Deposits $24.6 $24.6 $24.8 $25.1 $27.8 13.0% Commercial Banking – Solid track record of delivering organic growth 16 1) Includes Business Capital, Govt. & Professional Banking, Corporate Finance & Global Markets, Treasury Solutions, Corporate and
Commercial Banking Admin; excludes loans held for sale.
2) Thomson Reuters LPC, ranking based on number of deals for Overall Middle Market (defined as Borrower Revenues < $500MM and Deal Size
< $500MM). 3)
Please see important information on Key Performance Metrics and Non-GAAP
Financial Measures at the beginning of this presentation for an explanation of their use and the appendix for their calculation and/or reconciliation to GAAP Financial Measures, as applicable. Adjusted results exclude restructuring charges, special items and/or notable items, as applicable.
Where disclosed, peer results adjusted for similar unusual or special revenue, expense and acquisition items. $s in billions Driving revenue improvement Delivering on a multi-year growth strategy – Focus on enhancing product and service capabilities with selective extension into attractive growth areas – Mid-corporate and Industry Verticals, Franchise Finance and previously underpenetrated Commercial Real Estate – Investing in key infrastructure and technology platforms – Scalable, compliant, industry standard solutions for loan originations, servicing, syndications, foreign exchange, interest rate products and market-risk systems Commitment to uptiering leadership and talent – Added ~91 professionals with industry, corporate finance, capital markets, sales & trading and leveraged finance expertise since YE 2012 Continue to drive growth in lead client relationships with 25% CAGR since 2010 – Consistent Top 10 Overall Middle Market loan syndications league table status during past 10 quarters, up from #15 in 2009 (2); #5 in 3Q16 23.0% 9.4% Growth rate Strong loan growth (1) Growth driven by robust loan and deposit growth, investment in talent, and broadening of capabilities
(0.1)% 13.2% Growth rate 16.1% -2.8% 35.9% 37.8% (1) Middle Market Asset Finance CRE Mid-corporate Franchise Finance Industry Verticals $41.8 Other 14.9% $42.5 $46.5 $45.9 $43.8 $s in millions 3Q15 4Q15 1Q16 2Q16 3Q16 $399 $408 $399 $436 $450 3Q15 4Q15 1Q16 2Q16 3Q16 Net interest income Noninterest income 43.8% Efficiency ratio (3) 44.0% 46.7% 42.9% 40.2% |
 17 3+ products cross-sold Middle Market and Mid-corporate (2) 51% 73% 95% Participant JLA Lead left Global Markets Capital and Global Markets fee income 1) Syndication transactions where CFG is the Joint Lead Arranger or Lead Left Arranger/Total syndication transactions.
2) Products defined as deposits, debt capital markets, cash management, corporate card, equity capital markets, foreign exchange,
international cash management, interest rate protection, loans,
leases, standby letters of credit, trade, wealth management.
3) As of December 31, 2015. Source: Company filings. Capital Markets fees defined as trading revenue, investment banking, advisory and
underwriting fees. Peers includes BBT, CMA, KEY, MTB, RF and STI.
Leveraging strong relationships and experienced team through solutions-based
orientation and growing product and advisory
capabilities Corporate Finance professionals key to supporting
solutions-oriented model
Added 19 professionals in the past 28 months, resulting in
incremental fees by delivering expanded suite of Capital
and Global Markets capabilities
Proven strength in loan syndications
Lead relationships deliver more fee income and are
more profitable
Opportunity to drive improved client penetration by building
out advisory and fixed income capabilities
Gained broker/dealer capabilities in 1Q16, which provide
opportunity to capture CFG-sourced deal fees historically
shared with strategic partners, principally RBS
Ability to continue to drive enhanced penetration of existing
portfolio, particularly in proprietary middle market by
increasing cross sell to credit-only clients
Monetize credit growth of recent years
Expand suite of Corporate Finance solutions
Continued growth opportunities in Capital Markets
Capital Markets revenue potential
(FY 2015 Capital Markets fees/FY 2015 Average Commercial loans)
Peer average (3) 1.0% 0.9% 0.7% 0.5% 0.4% 0.2% 0.2% 0.1% Regional Peer 1 Regional Peer 2 Regional Peer 3 CFG Regional Peer 4 Regional Peer 5 Regional Peer 6 $s in millions Every 0.1% of Capital Markets fees/loans improvement could drive an estimated ~$50 million in annual fee income $93 $114 $116 $154 $174 $177 2010 2011 2012 2013 2014 2015 IRP FX Capital Markets Lead deals/ total deals (1) 71% 71% 71% 79% 70% 73% |
 Treasury Solutions fee income up 14% YTD in 2016 versus 2015 with
good momentum vs. estimated 2015 industry growth of
~2.5% (3)
Recent investments in platform, products and customer-facing talent
providing underlying momentum
Improved go-to-market strategy and client-facing model with
uptiered
sales organization
Launched dedicated cards team
Improved customer experience through streamlined interaction and
operations transformation
Opportunity to drive improved cross-sell/client penetration
Differentiated product offerings for client segments, including
Franchise Finance and CRE
Deploying analytical tools to improve client usage/retention
Refined segmentation strategies to capture more Middle Market and Mid-corporate clients Currently underpenetrated with~1% share of an estimated $40 billion revenue market (3) Achieving Treasury Solutions peer average could deliver ~$400 million in annual revenue given $44.8 billion CFG commercial loan portfolio Treasury Solutions opportunity Investing to drive continued revenue growth with focus on improving client penetration and
market share 18 Cash Management cross-sell opportunity (2) 53% $s in millions Treasury Solutions Commercial Banking fees (1) 11.5% 3.3% CAGR Treasury Solutions revenue potential (2015 NII & Fee income/$1 billion of commercial loans (3) ) Products utilized $s in millions $96 $103 $102 $107 $116 2011 2012 2013 2014 2015 Cash Management Cards 47% 4% 10% 17% 14% 8% None 1-2 3-4 5-6 7-8 9+ 1) Cash Management includes Trade Fees. Cards includes Sponsorship Management. 2) Middle Market & Mid-corporate/Vertical client
distribution by number of Cash Management products used. Treasury
Strategies, Inc. for benchmarks and public filings, estimate of 2015 market
share of ~$40B revenue, NII and fees market based on benchmarks and public filings. TS peers include STI, FITB, PNC and USB. Treasury Solutions revenue includes Treasury Management, Accounts Receivable, Payables, Procurement and related Risk and Financial Control
activities. 2015 estimated growth rates based on fee income only. 3) Treasury Strategies, Inc. for benchmarks and public filings, estimate of 2015 market share of ~$40B revenue, NII and fees-market based
on benchmarks and public filings. TS peers include STI, FITB, PNC and USB. Treasury Solutions revenue includes Treasury Management, Accounts Receivable, Payables, Procurement and related Risk and Financial Control
activities. 2015 estimated growth rates based on fee income only.
$21 $21 $19 $18 $11 $9 Regional Peer 1 Regional Regional Peer 2 Peer 3 TS Peer Regional Average Peer 4 CFG |
 Key Performance Metrics, Non-GAAP Financial Measures and
Reconciliations 19
3Q16 3Q15 3Q16 Change from 3Q15 $/bps %/bps Noninterest income, adjusted: Noninterest income (GAAP) $435 $353 $82 23.2% Less: Notable items 67 — 67 Noninterest income, adjusted (non-GAAP) $368 $353 $15 4.2% Total revenue, adjusted: Total revenue (GAAP) A $1,380 $1,209 $171 14.1% Less: Notable items 67 — 67 Total revenue, adjusted (non-GAAP) B $1,313 $1,209 $104 8.6% Noninterest expense, adjusted: Noninterest expense (GAAP) C $867 $798 $69 8.6% Less: Notable items 36 — 36 Noninterest expense, adjusted (non-GAAP) D $831 $798 $33 4.1% Net income, adjusted: Net income (GAAP) E $297 $220 $77 35.0% Add: Notable items, net of income tax expense (benefit) (19) — (19) Net income, adjusted (non-GAAP) F $278 $220 $58 26.4% Net income available to common stockholders, adjusted: Net income available to common stockholders (GAAP) G $290 $213 $77 36.2% Add: Notable items, net of income tax expense (benefit) (19) — (19) Net income available to common stockholders, adjusted (non-GAAP) H $271 $213 $58 27.2% Net income per average common share - basic and diluted, adjusted: Average common shares outstanding - basic (GAAP) I Average common shares outstanding - diluted (GAAP) J Net income per average common share - basic (GAAP) G/I $0.56 $0.40 $0.16 Net income per average common share - diluted (GAAP) G/J 0.56 0.40 0.16 Net income per average common share - basic, adjusted (non-GAAP) H/I 0.52 0.40 0.12 Net income per average common share - diluted, adjusted (non-GAAP) H/J 0.52 0.40 0.12 Operating leverage: Total revenue (GAAP) A $1,380 $1,209 $171 14.14 % Less: Noninterest expense (GAAP) C 867 798 69 8.65 Operating leverage 5.49 % 549 bps Operating leverage, adjusted: Total revenue, adjusted (non-GAAP) B $1,313 $1,209 $104 8.60 % Less: Noninterest expense, adjusted (non-GAAP) D 831 798 33 4.14 Operating leverage, adjusted (non-GAAP) 4.46 % 446 bps Efficiency ratio and efficiency ratio, adjusted: Efficiency ratio C/A 62.88 % 66.02 % (314) bps Efficiency ratio, adjusted (non-GAAP) D/B 63.31 66.02 (271) bps Adjusted – excluding restructuring charges, special items and/or notable items (dollars in millions, except per-share data) (11,526,279) (12,275,692) 530,985,255 533,398,158 519,458,976 521,122,466 |
 Key Performance Metrics, Non-GAAP Financial Measures and
Reconciliations 20
QUARTERLY TRENDS
3Q16 3Q15 3Q16 Change from 3Q15 $/bps Return on average tangible common equity and return on average tangible common equity, adjusted:
Average common equity (GAAP)
$19,810 $19,261 $549 Less: Average goodwill (GAAP) 6,876 6,876 — Less: Average other intangibles (GAAP) 1 4 (3) Add: Average deferred tax liabilities related to goodwill (GAAP) 509 453 56 Average tangible common equity K $13,442 $12,834 $608 Return on average tangible common equity G/K 8.58 % 6.60 % 198 bps Return on average tangible common equity, adjusted (non-GAAP) H/K 8.02 6.60 142 bps Return on average total assets and return on average total assets, adjusted:
Average total assets (GAAP)
L $144,399 $135,103 $9,296 Return on average total assets E/L 0.82 % 0.65 % 17 bps Return on average total assets, adjusted (non-GAAP) F/L 0.77 0.65 12 bps Tangible book value per common share: Common shares - at end of period (GAAP) M 518,148,345 527,636,510 (9,488,165) Common stockholders' equity (GAAP) $19,934 $19,353 $581 Less: Goodwill (GAAP) 6,876 6,876 — Less: Other intangible assets (GAAP) 1 3 (2) Add: Deferred tax liabilities related to goodwill (GAAP) 519 465 54 Tangible common equity N $13,576 $12,939 $637 Tangible book value per common share N/M $26.20 $24.52 $1.68 Adjusted – excluding restructuring charges, special items and/or notable items (dollars in millions, except per-share data) |
 Key Performance Metrics, Non-GAAP Financial Measures and
Reconciliations 21
SEP. 30, JUNE 30, MAR. 31, DEC. 31, SEP. 30, JUNE 30, MAR. 31, DEC. 31, SEP. 30, JUNE 30, MAR. 31, DEC. 31, SEP. 30, 2016 2016 2016 2015 2015 2015 2015 2014 2014 2014 2014 2013 2013 Total revenue, adjusted: Total revenue (GAAP) A $1,380 $1,278 $1,234 $1,232 $1,209 $1,200 $1,183 $1,179 $1,161 $1,473 $1,166 $1,158 $1,153 Less: Special items - - - - - - - - - 288 - - - Less: Notable items 67 - - - - - - - - - - - - Total revenues, adjusted (non-GAAP) B $1,313 $1,278 $1,234 $1,232 $1,209 $1,200 $1,183 $1,179 $1,161 $1,185 $1,166 $1,158 $1,153 Noninterest expense, adjusted: Noninterest expense (GAAP) C $867 $827 $811 $810 $798 $841 $810 $824 $810 $948 $810 $818 $788 Less: Restructuring charges and special items - - - - - 40 10 33 21 115 - 26 - Less: Notable items 36 - - - - - - - - - - - - Noninterest expense, adjusted (non-GAAP) D $831 $827 $811 $810 $798 $801 $800 $791 $789 $833 $810 $792 $788 Efficiency ratio and efficiency ratio, adjusted: Efficiency ratio C/A 63% 65% 66% 66% 66% 70% 68% 70% 70% 64% 69% 71% 68% Efficiency ratio, adjusted (non-GAAP) D/B 63% 65% 66% 66% 66% 67% 68% 67% 68% 70% 69% 68% 68% Net income per average common share - diluted, and net income per average common share - diluted, adjusted Net income available to common stockholders (GAAP) G $290 $243 $216 $221 $213 $190 $209 $197 $189 $313 $166 $152 $144 Add: Restructuring charges and special items, net of income tax expense (benefit) - - - - - 25 6 20 13 (108) - 17 - Add: Notable items, net of income tax expense (benefit) (19) - - - - - - - - - - - - Net income available to common stockholders, adjusted (non-GAAP) H $271 $243 $216 $221 $213 $215 $215 $217 $202 $205 $166 $169 $144 Average common shares outstanding - diluted (GAAP) J 521,122,466 530,365,203 530,446,188 530,275,673 533,398,158 539,909,366 549,798,717 550,676,298 560,243,747 559,998,324 559,998,324 559,998,324 559,998,324 Net income per average common share - diluted G/J $0.56 $0.46 $0.41 $0.42 $0.40 $0.35 $0.38 $0.36 $0.34 $0.56 $0.30 $0.27 $0.26 Net income per average common share - diluted, adjusted (non-GAAP) H/J 0.52 0.46 0.41 0.42 0.40 0.40 0.39 0.39 0.36 0.37 0.30 0.30 0.26 Return on average tangible common equity and return on average tangible common equity, adjusted: Average common equity (GAAP) $19,810 $19,768 $19,567 $19,359 $19,261 $19,391 $19,407 $19,209 $19,411 $19,607 $19,370 $19,364 $19,627 Less: Average goodwill (GAAP) 6,876 6,876 6,876 6,876 6,876 6,876 6,876 6,876 6,876 6,876 6,876 6,876 6,876 Less: Average other intangibles (GAAP) 1 2 3 3 4 5 5 6 6 7 7 8 9 Add: Average deferred tax liabilities related to goodwill (GAAP) 509 496 481 468 453 437 422 403 384 369 351 342 325 Average tangible common equity K $13,442 $13,386 $13,169 $12,948 $12,834 $12,947 $12,948 $12,730 $12,913 $13,093 $12,838 $12,822 $13,067 Return on average tangible common equity G/K 8.58% 7.30% 6.61% 6.75% 6.60% 5.90% 6.53% 6.12% 5.81% 9.59% 5.24% 4.71% 4.34% Return on average tangible common equity, adjusted (non-GAAP) H/K 8.02% 7.30% 6.61% 6.75% 6.60% 6.67% 6.73% 6.76% 6.22% 6.28% 5.24% 5.24% 4.34% Adjusted – excluding restructuring charges, special items and/or notable items (dollars in millions, except per-share data) |
 Key Performance Metrics, Non-GAAP Financial Measures and
Reconciliations 22
Adjusted – excluding restructuring charges, special items and/or notable items (dollars in millions) FOR THE THREE MONTHS ENDED SEP. 30, JUNE 30, MAR. 31, DEC. 31, SEP. 30, 2016 2016 2016 2015 2015 Commercial Segment Total revenue (GAAP) O $450 $436 $399 $408 $399 Noninterest expense (GAAP) P $181 $186 $187 $180 $175 Efficiency ratio P/O 40.2% 42.9% 46.7% 44.0% 43.8% Consumer Segment Noninterest income, adjusted for card reward accounting change: Noninterest income (GAAP) $229 $219 $208 $226 $235 Less: Card reward accounting change - - - 8 8 Noninterest income, adjusted for card reward accounting change (non-GAAP)
$229 $219 $208 $218 $227 Total revenue, adjusted for card reward accounting change: Total revenue (GAAP) Q $850 $821 $789 $791 $791 Less: Card reward accounting change - - - 8 8 Total revenues, adjusted for card reward accounting change (non-GAAP)
S $850 $821 $789 $783 $783 Noninterest expense, adjusted for card reward accounting change: Noninterest expense (GAAP) R $650 $632 $616 $624 $623 Less: Card reward accounting change - - - 8 8 Noninterest expense, adjusted for card reward accounting change (non-GAAP)
T $650 $632 $616 $616 $615 Efficiency ratio R/Q 76.5% 77.0% 78.1% 78.9% 78.7% Efficiency Ratio, excluding card reward accounting change (non-GAAP)
T/S 76.5% 77.0% 78.1% 78.6% 78.5% 3Q16 vs. 3Q15 Noninterest Income Growth, excluding card reward accounting change (non-GAAP)
0.9% Revenue Growth, excluding card reward accounting change (non-GAAP) 8.6% |
 23 |