Attached files
| file | filename |
|---|---|
| EX-99.1 - EX-99.1 - PARKER HANNIFIN CORP | d295621dex991.htm |
| EX-2.1 - EX-2.1 - PARKER HANNIFIN CORP | d295621dex21.htm |
| 8-K - FORM 8-K - PARKER HANNIFIN CORP | d295621d8k.htm |
Parker’s Acquisition of CLARCOR to Enhance Filtration Platform December 1, 2016 Exhibit 99.2
Forward-Looking Statements Forward-looking statements contained in this and other written and oral reports are made based on known events and circumstances at the time of release, and as such, are subject in the future to unforeseen uncertainties and risks. These statements may be identified from use of forward-looking terminology such as “anticipates,” “believes,” “may,” “should,” “could,” “potential,” “continues,” “plans,” “forecasts,” “estimates,” “projects,” “predicts,” “would,” “intends,” “anticipates,” “expects,” “targets,” “is likely,” “will,” or the negative of these terms and similar expressions, and include all statements regarding future performance, earnings projections, events or developments. CLARCOR and Parker caution readers not to place undue reliance on these statements. The risks and uncertainties in connection with such forward-looking statements related to the proposed transaction include, but are not limited to, the occurrence of any event, change or other circumstances that could delay the closing of the proposed transaction; the possibility of non-consummation of the proposed transaction and termination of the merger agreement; the failure to obtain CLARCOR stockholder approval of the proposed transaction or to satisfy any of the other conditions to the merger agreement; the possibility that a governmental entity may prohibit, delay or refuse to grant a necessary regulatory approval in connection with the proposed transaction; the risk that stockholder litigation in connection with the proposed transaction may affect the timing or occurrence of the proposed transaction or result in significant costs of defense, indemnification and liability; adverse effects on CLARCOR’s common stock or Parker’s common stock because of the failure to complete the proposed transaction; CLARCOR’s or Parker’s respective businesses experiencing disruptions due to transaction-related uncertainty or other factors making it more difficult to maintain relationships with employees, business partners or governmental entities; the parties being unable to successfully implement integration strategies; and significant transaction costs related to the proposed transaction. It is possible that the future performance and earnings projections of Parker and/or CLARCOR, including projections of any individual segments, may differ materially from current expectations, depending on economic conditions within each company’s key markets, and each company’s ability to maintain and achieve anticipated benefits associated with announced realignment activities, strategic initiatives to improve operating margins, actions taken to combat the effects of the current economic environment, and growth, innovation and global diversification initiatives. A change in the economic conditions in individual markets may have a particularly volatile effect on segment performance. Among other factors which may affect future performance of Parker and/or CLARCOR are, as applicable: changes in business relationships with and purchases by or from major customers, suppliers or distributors, including delays or cancellations in shipments; CLARCOR’s potential inability to realize the anticipated benefits of the strategic supply partnership with GE; disputes regarding contract terms or significant changes in financial condition, changes in contract cost and revenue estimates for new development programs and changes in product mix; ability to identify acceptable strategic acquisition targets; uncertainties surrounding timing, successful completion or integration of acquisitions and similar transactions; the ability to successfully divest businesses planned for divestiture and realize the anticipated benefits of such divestitures; the determination to undertake business realignment activities and the expected costs thereof and, if undertaken, the ability to complete such activities and realize the anticipated cost savings from such activities; ability to implement successfully capital allocation initiatives, including timing, price and execution of share repurchases; availability, limitations or cost increases of raw materials, component products and/or commodities that cannot be recovered in product pricing; ability to manage costs related to insurance and employee retirement and health care benefits; compliance costs associated with environmental laws and regulations; potential labor disruptions; threats associated with and efforts to combat terrorism and cyber-security risks; uncertainties surrounding the ultimate resolution of outstanding legal proceedings, including the outcome of any appeals; competitive market conditions and resulting effects on sales and pricing; and global economic factors, including manufacturing activity, air travel trends, currency exchange rates, difficulties entering new markets and general economic conditions such as inflation, deflation, interest rates and credit availability. Additional information about the risks related to Parker and its business may be found in Parker’s Annual Report on Form 10-K for the fiscal year ended June 30, 2016 filed on August 26, 2016. Additional information about the risks related to CLARCOR and its business may be found in CLARCOR’s Annual Report on Form 10-K for the fiscal year ended November 28, 2015 filed on January 22, 2016. Parker and/or CLARCOR make these statements as of the date of this disclosure, and undertake no obligation to update them unless otherwise required by law. This presentation contains references to EBITDA and adjusted EBITDA. EBITDA is defined as earnings before interest, taxes, depreciation and amortization. Adjusted EBITDA is defined as EBITDA before restructuring charges and settlement amounts. Although EBITDA and Adjusted EBITDA are not measures of performance calculated in accordance with GAAP, we believe that it is useful to an investor in evaluating the transactions proposed in this presentation. Please visit www.PHstock.com for more information
Agenda Transaction Overview Introduction to CLARCOR Strategic Fit Summary and Q&A Synergies and Financials
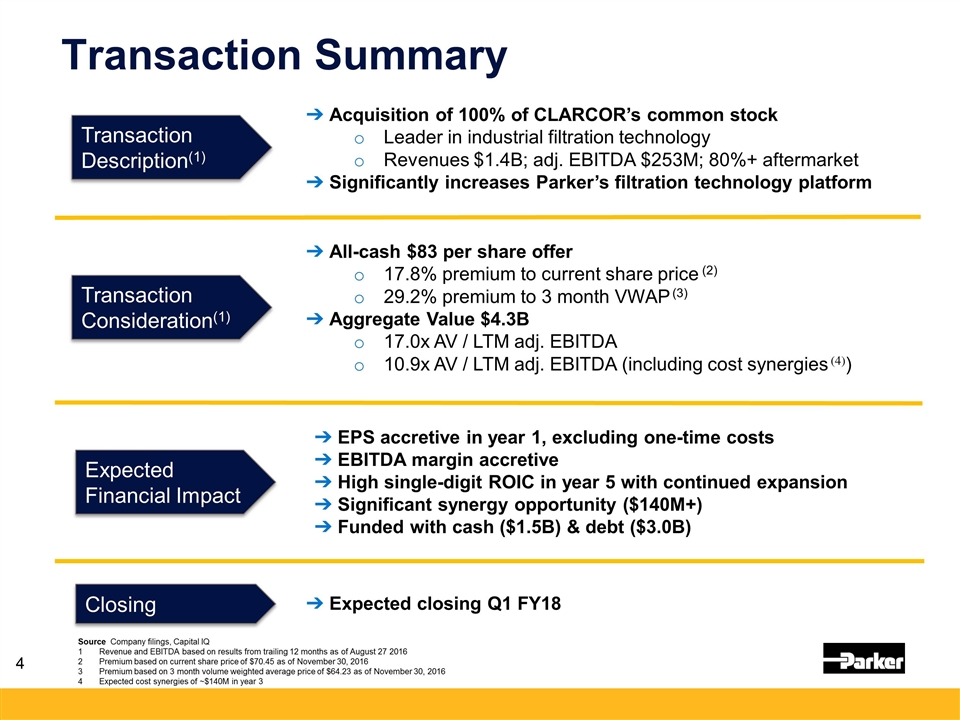
Source Company filings, Capital IQ Revenue and EBITDA based on results from trailing 12 months as of August 27 2016 Premium based on current share price of $70.45 as of November 30, 2016 Premium based on 3 month volume weighted average price of $64.23 as of November 30, 2016 Expected cost synergies of ~$140M in year 3 Transaction Summary Transaction Description(1) Transaction Consideration(1) Expected Financial Impact Closing Acquisition of 100% of CLARCOR’s common stock Leader in industrial filtration technology Revenues $1.4B; adj. EBITDA $253M; 80%+ aftermarket Significantly increases Parker’s filtration technology platform All-cash $83 per share offer 17.8% premium to current share price (2) 29.2% premium to 3 month VWAP (3) Aggregate Value $4.3B 17.0x AV / LTM adj. EBITDA 10.9x AV / LTM adj. EBITDA (including cost synergies (4)) EPS accretive in year 1, excluding one-time costs EBITDA margin accretive High single-digit ROIC in year 5 with continued expansion Significant synergy opportunity ($140M+) Funded with cash ($1.5B) & debt ($3.0B) Expected closing Q1 FY18
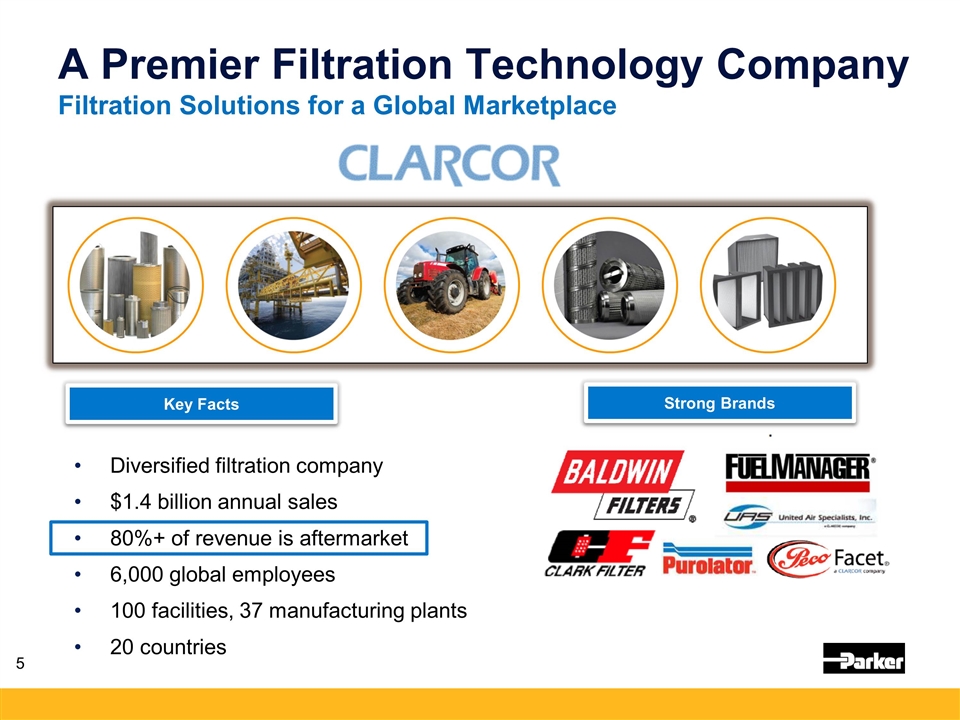
A Premier Filtration Technology Company Filtration Solutions for a Global Marketplace Diversified filtration company $1.4 billion annual sales 80%+ of revenue is aftermarket 6,000 global employees 100 facilities, 37 manufacturing plants 20 countries Strong Brands Key Facts 5
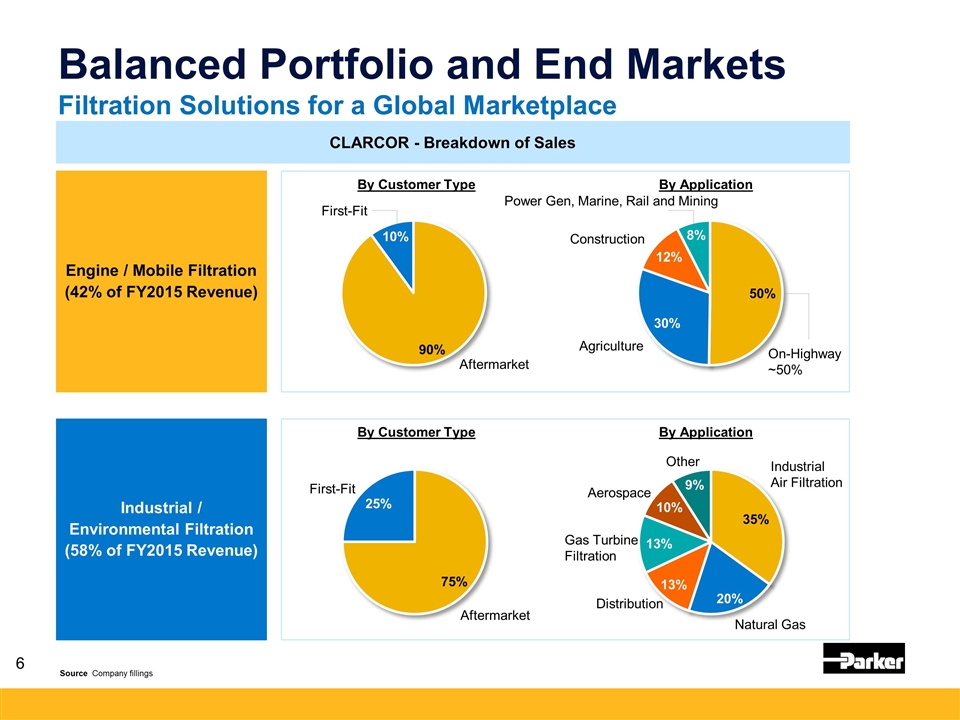
Balanced Portfolio and End Markets Filtration Solutions for a Global Marketplace 6 CLARCOR - Breakdown of Sales By Customer Type First-Fit By Application Aftermarket Gas Turbine Filtration Industrial Air Filtration By Customer Type By Application Aerospace Natural Gas Distribution Other Industrial / Environmental Filtration (58% of FY2015 Revenue) Engine / Mobile Filtration (42% of FY2015 Revenue) Agriculture Construction Power Gen, Marine, Rail and Mining On-Highway ~50% First-Fit Aftermarket Source Company fillings
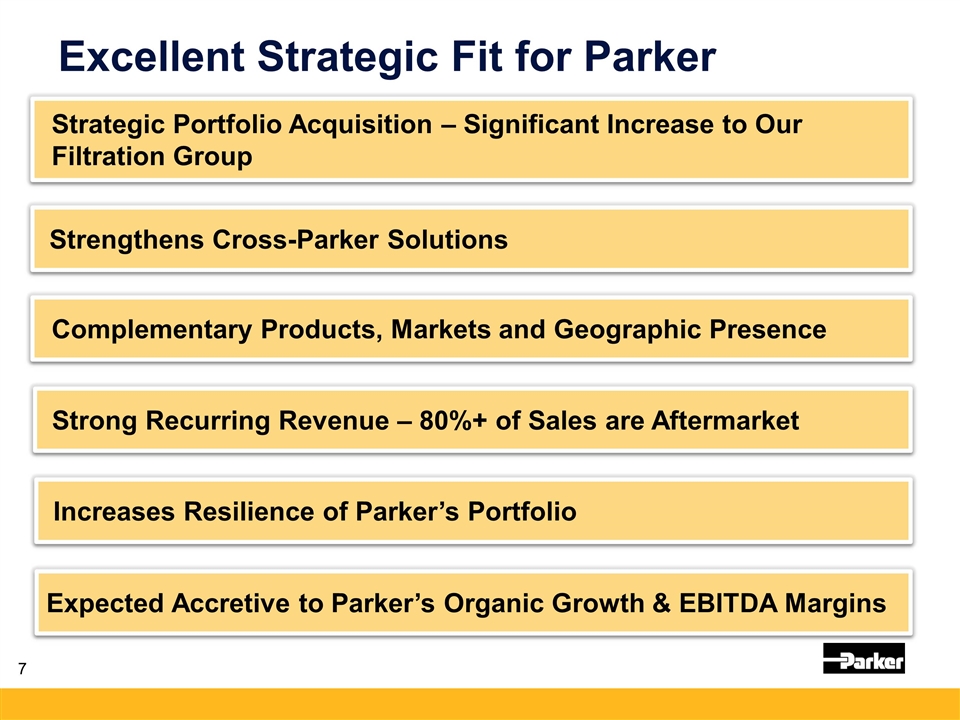
20% Market Share Strategic Portfolio Acquisition – Significant Increase to Our Filtration Group Strengthens Cross-Parker Solutions Complementary Products, Markets and Geographic Presence Strong Recurring Revenue – 80%+ of Sales are Aftermarket Increases Resilience of Parker’s Portfolio Excellent Strategic Fit for Parker Expected Accretive to Parker’s Organic Growth & EBITDA Margins
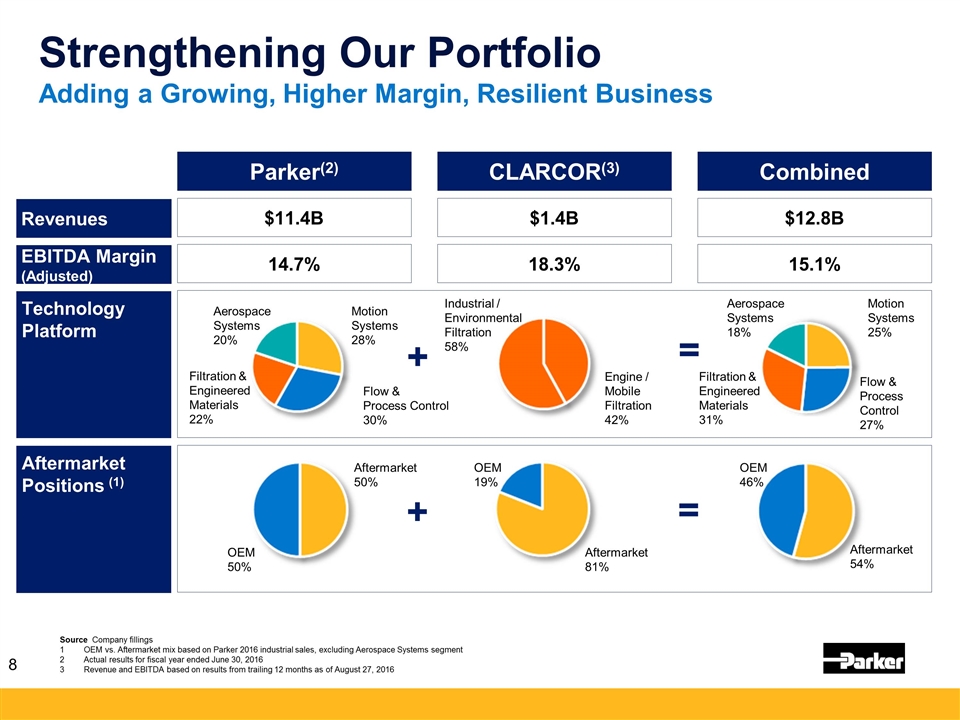
Strengthening Our Portfolio Adding a Growing, Higher Margin, Resilient Business Source Company fillings OEM vs. Aftermarket mix based on Parker 2016 industrial sales, excluding Aerospace Systems segment Actual results for fiscal year ended June 30, 2016 Revenue and EBITDA based on results from trailing 12 months as of August 27, 2016 Engine / Mobile Filtration 42% + = Motion Systems 28% Flow & Process Control 30% Filtration & Engineered Materials 22% Aerospace Systems 20% Motion Systems 25% Flow & Process Control 27% Filtration & Engineered Materials 31% Aerospace Systems 18% Industrial / Environmental Filtration 58% Parker(2) CLARCOR(3) Combined OEM 50% Aftermarket 50% OEM 19% Aftermarket 81% OEM 46% Aftermarket 54% + = $1.4B $11.4B $12.8B 18.3% 14.7% 15.1% Technology Platform Aftermarket Positions (1) Revenues EBITDA Margin (Adjusted)
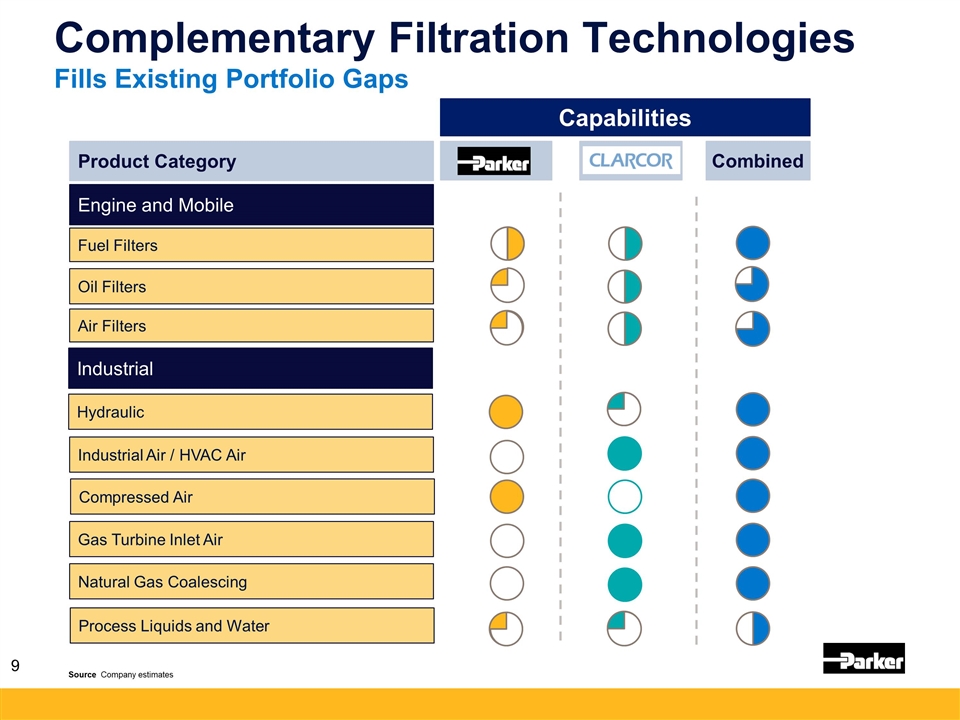
Complementary Filtration Technologies Fills Existing Portfolio Gaps Fuel Filters Oil Filters Air Filters Industrial Hydraulic Industrial Air / HVAC Air Compressed Air Gas Turbine Inlet Air Process Liquids and Water Product Category Combined Capabilities Source Company estimates Natural Gas Coalescing Engine and Mobile
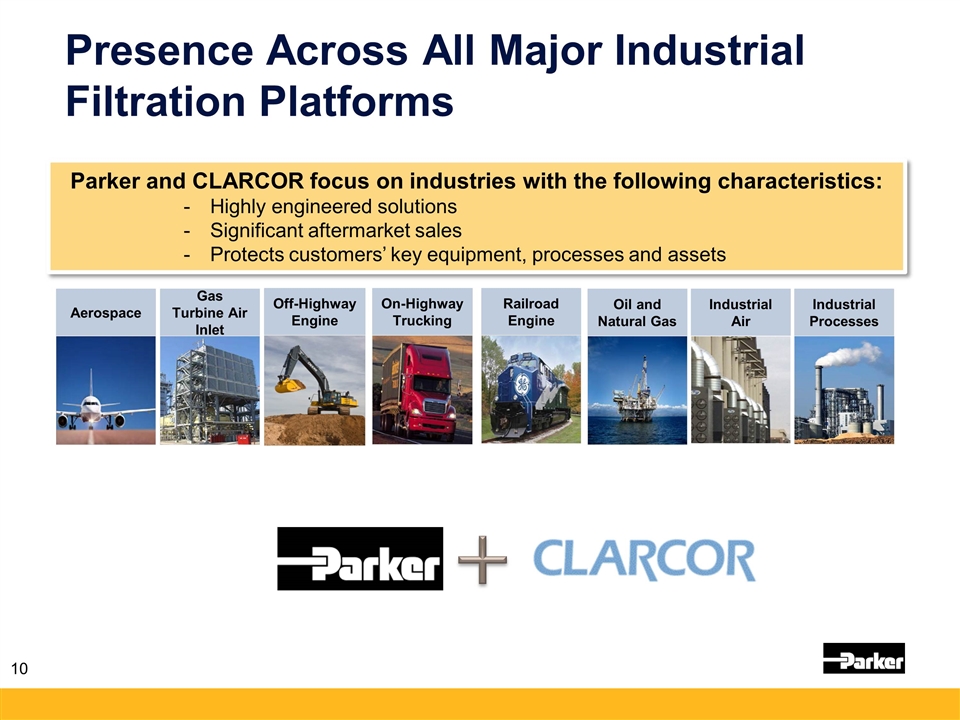
Industrial Processes Off-Highway Engine On-Highway Trucking Oil and Natural Gas Railroad Engine Parker and CLARCOR focus on industries with the following characteristics: Highly engineered solutions Significant aftermarket sales Protects customers’ key equipment, processes and assets Presence Across All Major Industrial Filtration Platforms Aerospace Gas Turbine Air Inlet Industrial Air
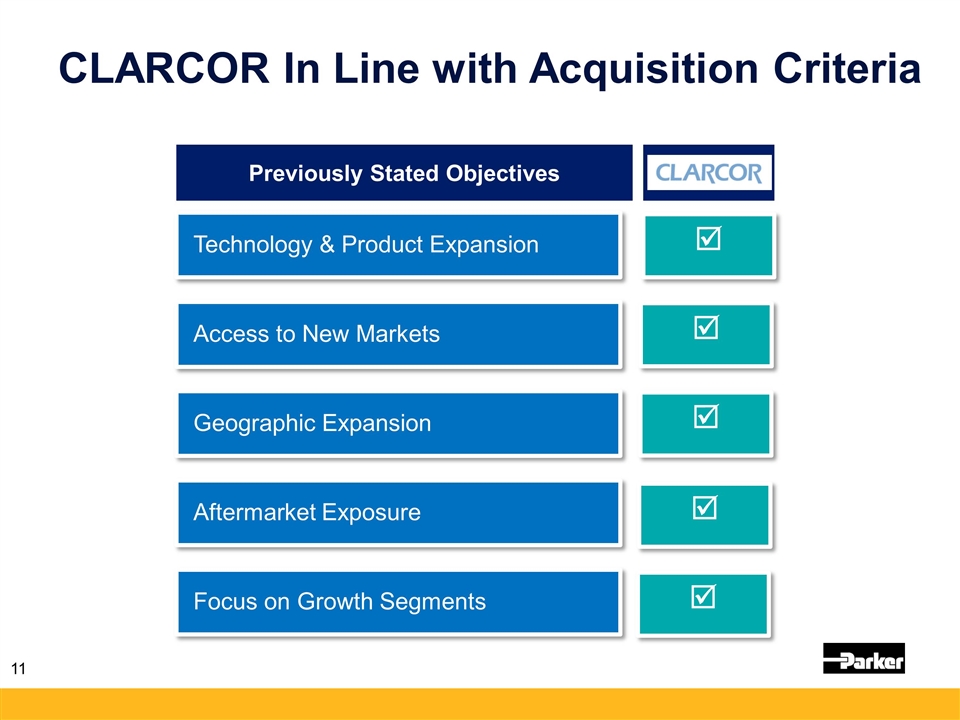
CLARCOR In Line with Acquisition Criteria Technology & Product Expansion Access to New Markets Geographic Expansion Aftermarket Exposure Focus on Growth Segments þ þ þ þ Previously Stated Objectives þ 11
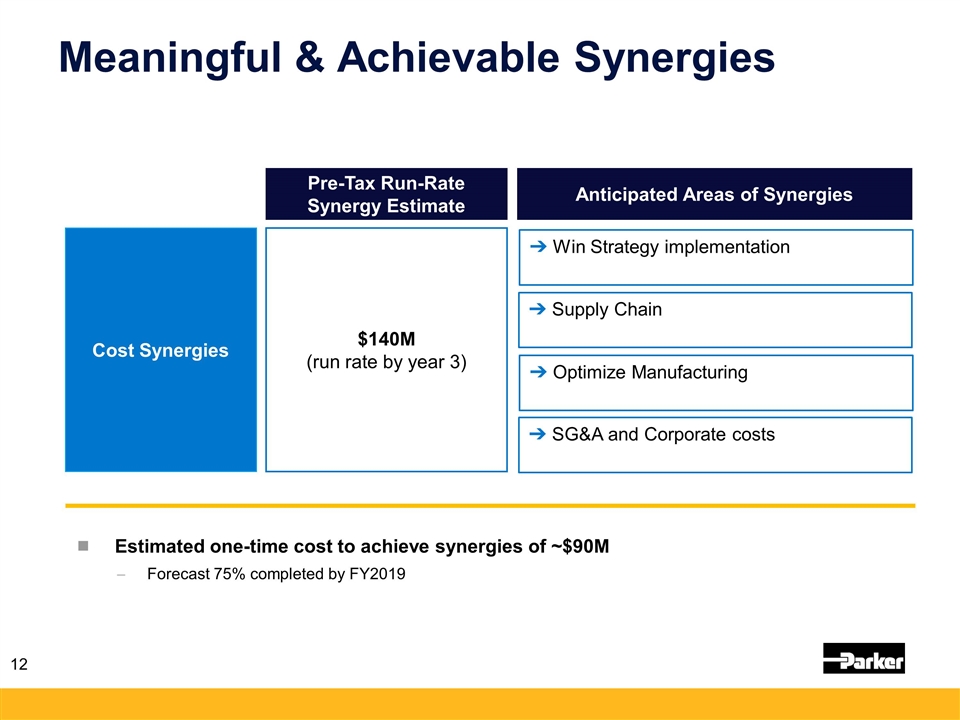
Meaningful & Achievable Synergies Anticipated Areas of Synergies Pre-Tax Run-Rate Synergy Estimate Cost Synergies $140M (run rate by year 3) Estimated one-time cost to achieve synergies of ~$90M Forecast 75% completed by FY2019 SG&A and Corporate costs Supply Chain Optimize Manufacturing Win Strategy implementation
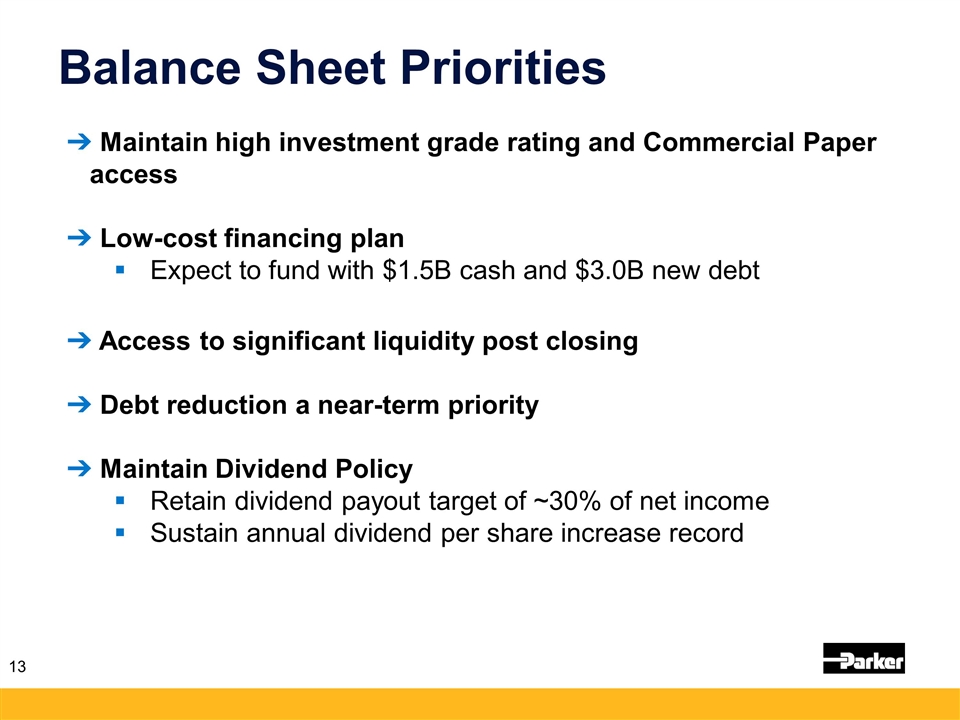
Balance Sheet Priorities Maintain high investment grade rating and Commercial Paper access Low-cost financing plan Expect to fund with $1.5B cash and $3.0B new debt Access to significant liquidity post closing Debt reduction a near-term priority Maintain Dividend Policy Retain dividend payout target of ~30% of net income Sustain annual dividend per share increase record
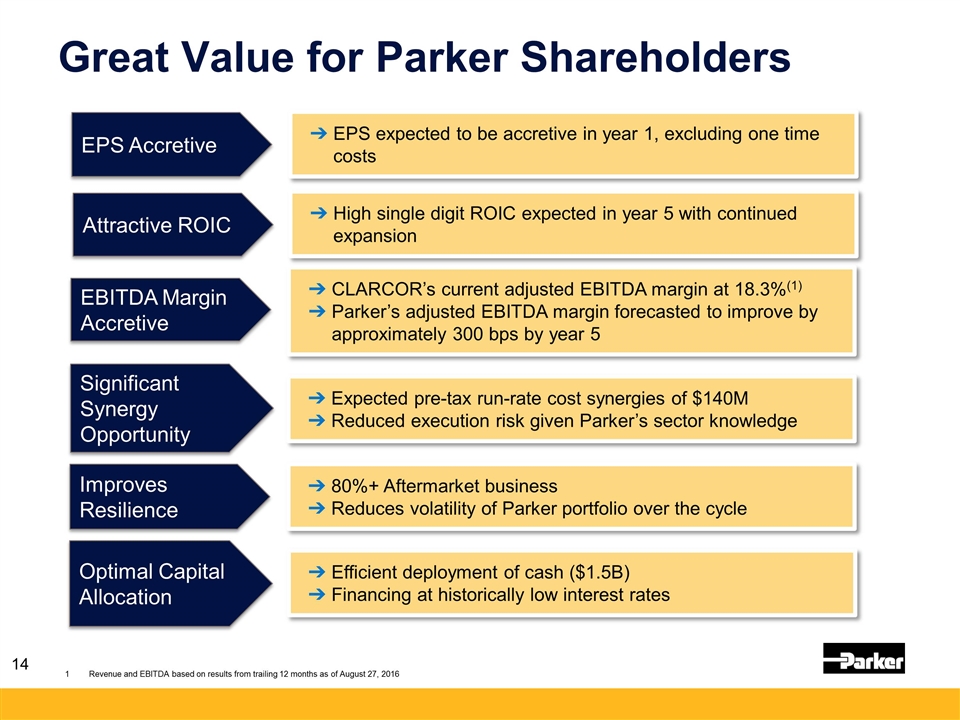
Great Value for Parker Shareholders EPS expected to be accretive in year 1, excluding one time costs High single digit ROIC expected in year 5 with continued expansion CLARCOR’s current adjusted EBITDA margin at 18.3%(1) Parker’s adjusted EBITDA margin forecasted to improve by approximately 300 bps by year 5 Expected pre-tax run-rate cost synergies of $140M Reduced execution risk given Parker’s sector knowledge 80%+ Aftermarket business Reduces volatility of Parker portfolio over the cycle Efficient deployment of cash ($1.5B) Financing at historically low interest rates EPS Accretive Attractive ROIC EBITDA Margin Accretive Significant Synergy Opportunity Improves Resilience Optimal Capital Allocation Revenue and EBITDA based on results from trailing 12 months as of August 27, 2016

Appendix GAAP to Non-GAAP Reconciliations Additional Information and Certain Information Concerning Participants
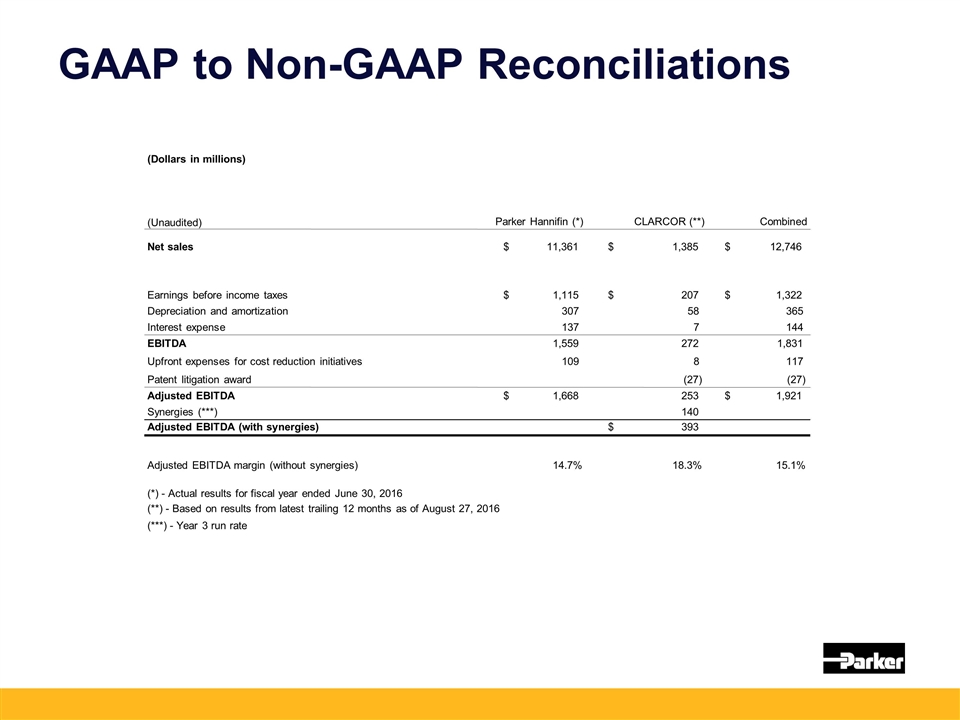
GAAP to Non-GAAP Reconciliations (Dollars in millions) (Unaudited) Parker Hannifin (*) CLARCOR (**) Combined Net sales 11,361 $ 1,385 $ 12,746 $ Earnings before income taxes 1,115 $ 207 $ 1,322 $ Depreciation and amortization 307 58 365 Interest expense 137 7 144 EBITDA 1,559 272 1,831 Upfront expenses for cost reduction initiatives 109 8 117 Patent litigation award (27) (27) Adjusted EBITDA 1,668 $ 253 1,921 $ Synergies (***) 140 Adjusted EBITDA (with synergies) 393 $ Adjusted EBITDA margin (without synergies) 14.7% 18.3% 15.1% (*) - Actual results for fiscal year ended June 30, 2016 (**) - Based on results from latest trailing 12 months as of August 27, 2016 (***) - Year 3 run rate
Additional Information and Certain Information Concerning Participants Additional Information and Where to Find It In connection with the proposed transaction, CLARCOR intends to file a preliminary proxy statement on Schedule 14A with the SEC. CLARCOR’S SHAREHOLDERS ARE ENCOURAGED TO READ THE PRELIMINARY PROXY STATEMENT AND ANY OTHER RELEVANT DOCUMENTS FILED WITH THE SEC CAREFULLY AND IN THEIR ENTIRETY WHEN THEY BECOME AVAILABLE BECAUSE THEY WILL CONTAIN IMPORTANT INFORMATION ABOUT THE PROPOSED MERGER. The final proxy statement will be mailed to shareholders of CLARCOR. Investors and security holders will be able to obtain the documents free of charge at the SEC’s website, www.sec.gov, or from CLARCOR’s website at www.clarcor.com under the heading “Investor Information”, or by emailing CLARCOR at investor@clarcor.com. Certain Information Concerning Participants Parker and CLARCOR and their respective directors and executive officers and other members of management and employees may be deemed to be participants in the solicitation of proxies in respect of the proposed merger. Information concerning Parker’s directors and executive officers is set forth in the proxy statement, filed September 26, 2016, for Parker’s 2016 annual meeting of shareholders as filed with the SEC on Schedule 14A and in its most recent Annual Report on Form 10-K for the fiscal year ended June 30, 2016 as filed with the SEC on August 26, 2016. Information concerning CLARCOR’s directors and executive officers is set forth in the proxy statement, filed February 19, 2016, for CLARCOR’s 2016 annual meeting of shareholders as filed with the SEC on Schedule 14A and in its most recent Annual Report on Form 10-K for the fiscal year ended November 28, 2015 as filed with the SEC on January 22, 2016. Additional information regarding the interests of such participants in the solicitation of proxies in respect of the proposed merger will be included in the proxy statement and other relevant materials to be filed with the SEC when they become available.
