Attached files
| file | filename |
|---|---|
| EX-99.1 - EX-99.1 - Catalent, Inc. | d297746dex991.htm |
| 8-K - FORM 8-K - Catalent, Inc. | d297746d8k.htm |
Exhibit 99.2
Unless otherwise indicated or the context otherwise requires, references herein to “we,” “our,” “us” and “the Company” refer to Catalent Pharma Solutions, Inc. and each of its consolidated subsidiaries, and “Catalent” refers to Catalent, Inc. and its consolidated subsidiaries. Notwithstanding the foregoing, with respect to the historical financial information and other data presented herein, including under the headings “Summary Historical Financial Information and Other Data,” as well as the historical financial and other information presented herein, unless otherwise specified or the context requires, “we,” “our,” “us” and “the Company” refer to Catalent, Inc. and its consolidated subsidiaries.
Certain information included herein may be deemed to be “forward-looking statements” within the meaning of Section 27A of the Securities Act and Section 21E of the Securities Exchange Act of 1934, as amended, which are subject to the “safe harbor” created by those sections. All statements, other than statements of historical facts, included herein, are forward-looking statements. In some cases, you can identify these forward-looking statements by the use of words such as “outlook,” “believes,” “expects,” “potential,” “continues,” “may,” “will,” “should,” “could,” “seeks,” “predicts,” “intends,” “plans,” “estimates,” “anticipates” or the negative version of these words or other comparable words.
These statements are based on assumptions and assessments made by our management in light of their experience and their perception of historical trends, current conditions, expected future developments and other factors they believe to be appropriate. Any forward-looking statement is subject to various risks and uncertainties. Accordingly, there are or will be important factors that could cause actual outcomes or results to differ materially from those indicated in these statements.
OUR COMPANY
We are the leading global provider of advanced delivery technologies and development solutions for drugs, biologics and consumer and animal health products. Our oral, injectable, and respiratory delivery technologies address the full diversity of the pharmaceutical industry, including small molecules, large molecule biologics and consumer and animal health products. Through our extensive capabilities and deep expertise in product development, we help our customers take products to market faster, including nearly half of new drug products approved by the U.S. Food and Drug Administration (the “FDA”) in the last decade. Our advanced delivery technology platforms, including those in our Softgel Technologies and Drug Delivery Solutions segments, our proven formulation, manufacturing and regulatory expertise, and our broad and deep intellectual property enable our customers to develop more products and better treatments for patients and consumers. Across both development and delivery, our commitment to reliably supply our customers’ and their patients’ needs is the foundation for the value we provide. Annually, we produce more than 70 billion doses for nearly 7,000 customer products, or approximately 1 in every 20 doses of such products taken each year by patients and consumers around the world. We believe that through our investments in growth-enabling capacity and capabilities, our ongoing focus on operational and quality excellence, the sales of existing customer products, the introduction of new customer products, our innovation activities and patents, and our entry into new markets, we will continue to benefit from attractive and differentiated margins, and realize the growth potential from these areas.
We continue to make investments to expand our sales and marketing activities, leading to growth in the number of active development programs for our customers in both of our two main strategic areas. This has further enhanced our extensive, long-duration relationships and long-term contracts with a broad and diverse range of industry-leading customers. In the fiscal year ended June 30, 2016, we did business with 87 of the top 100 branded drug marketers, 22 of the top 25 generics marketers, 24 of the top 25 biologics marketers, and 21 of the top 25 consumer health marketers globally. Selected key customers include Pfizer, Johnson & Johnson, GlaxoSmithKline, Novartis, Roche and Teva. We have many long-standing relationships with our customers, particularly in advanced delivery technologies, where we tend to follow a prescription molecule through all phases of its lifecycle, from the development and launch of the original brand prescription, to generics or over-the-counter switch. A prescription pharmaceutical product relationship with an innovator will often last many years, in several cases nearly two decades or more, extending from pre-clinical development through the end of the product’s life cycle. We serve customers who require innovative product development, superior quality, advanced manufacturing and skilled technical services to support their development and marketed product needs. Our broad and diverse range of technologies closely integrates with our customers’ molecules to yield final dose forms, and this generally results in the inclusion of Catalent in our customers’ prescription product regulatory filings. Both of these factors translate to long-duration supply relationships at an individual product level.
We believe our customers value us because our depth of development solutions and advanced delivery technologies, intellectual property, consistent and reliable supply, geographic reach, and substantial expertise enable us to create a broad range of business and product solutions that can be customized to fit their individual needs. Today we employ approximately 1,400 scientists and technicians and hold approximately 1,100 patents and patent applications in advanced delivery, drug and biologics formulation and manufacturing. The aim of our offerings is to allow our customers to bring more products to market faster, and develop and market
1
differentiated new products that improve patient outcomes. We believe our leading market position, significant global scale, and diversity of customers, offerings, regulatory categories, products, and geographies reduce our exposure to potential strategic and product shifts within the industry.
We provide a number of proprietary, differentiated technologies, products and service offerings to our customers across our advanced delivery technologies and development solutions platforms. The core technologies within our advanced delivery technologies platform include softgel capsules, our Zydis oral dissolving tablets, blow-fill-seal unit dose liquids and a range of other oral, injectable and respiratory technologies. The technologies and service offerings within our development solutions platform span the drug development process, ranging from our OptiForm Solutions Suite for bioavailability enhancement of early-stage molecules, and Gene Product Expression (“GPEx”) and SMARTag platforms for development of biologics and antibody-drug conjugates (ADCs), to formulation, analytical services, early stage clinical development, and clinical trials supply, including our unique FastChain demand-led clinical supply solution. Our offerings serve a critical need in the development and manufacturing of difficult-to-formulate products across a number of product types.
We have advanced our technologies and grown our service offerings over more than 80 years through internal development, strategic alliances, in-licensing and acquisitions. We initially introduced our softgel capsule technology in the 1930s and have continued to expand our range of new, technologically enhanced offerings. Since fiscal 2013, we have launched OptiShell, OptiMelt, Zydis Nano and Zydis Bio and OptiPact. In fiscal 2016, we launched OptiForm Solutions Suite and our FastChain demand-led clinical supply solution. Also in 2016, our customers received regulatory approval for first-to-market products using the OptiShell and ADVASEPT technologies. To extend the reach of our technologies and services, we have also formed several active partnerships, including partnerships with BASF (Germany), CEVEC (Germany), and CTC Bio (South Korea), and have active relationships with research universities around the world. We have also augmented our portfolio through ten acquisitions since fiscal 2012, including significantly expanding our scale through the acquisition of the Aptuit CTS business in February 2012, adding an ADC business through the completion of our acquisition of the Redwood Bioscience Inc. (“Redwood”) business in October 2014, extending our particle engineering capabilities via our November 2014 acquisition of MTI Pharma Solutions, Inc. (“Micron Technologies”), a leader in the category, and adding extensive early-phase drug development capabilities and spray-dry dispersion expertise through our September 2016 acquisition of Pharmatek Laboratories, Inc. (“Pharmatek”), a leading drug development and clinical manufacturing specialist. We believe our own internal innovation, supplemented by current and future external partnerships and acquisitions, will continue to strengthen and extend our leadership positions in the delivery and development of drugs, biologics and consumer and animal health products.
2
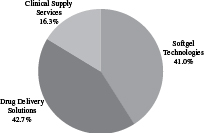
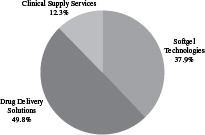
For the twelve months ended September 30, 2016, our revenues and Adjusted EBITDA were $1,867.3 million and $398.6 million, respectively. Including the full year impact of the Pharmatek Acquisition (as defined below) and the Accucaps Acquisition (as defined below), our Further Adjusted EBITDA was $412.0 million. For a reconciliation of Adjusted EBITDA and Further Adjusted EBITDA to earnings/(loss) from continuing operations, see note 4 to “—Summary Historical Financial Information and Other Data.”
| Revenue by Segment(1) | EBITDA by Segment | |
| Year Ended June 30, 2016 | Year Ended June 30, 2016 | |
|
| |
| Fiscal 2016 | ||||||||||||||
| Segment |
Offerings and Services |
Revenue(1) (in millions) |
EBITDA (in millions) |
EBITDA (% margin) |
||||||||||
| Softgel Technologies | Formulation, development and manufacturing of prescription and consumer health soft capsules, or “softgels,” including traditional softgel capsules (in which the shell is made from animal-derived materials) and Vegicaps and OptiShell capsules (in which the shell is made from vegetable-derived materials). | $775.0 | $163.8 | 21.1% | ||||||||||
| Drug Delivery Solutions | Formulation, development and manufacturing of prescription and consumer and animal health products using our proprietary OptiMelt, OptiPact, OptiForm and Zydis technologies, other proprietary and conventional drug delivery technologies such as prefilled syringes; blow-fill seal unit dose manufacturing including our ADVASEPT technology; biologic development including our GPEx and SMARTag technologies; and analytical and bioanalytical development and testing services. | $806.4 | $215.2 | 26.7% | ||||||||||
| Clinical Supply Services | Manufacturing, packaging, labeling, storage, distribution and inventory management of drugs and biologics for customer required patient kits for global clinical trials; FastChain demand-led clinical supply service; clinical e-solutions and informatics; and global comparator sourcing services. | $307.5 | $53.2 | 17.3% | ||||||||||
| (1) | Segment Revenue includes inter-segment revenue of $40.8 million. |
3
HISTORY
Catalent was formed in April 2007, when affiliates of The Blackstone Group L.P. (“Blackstone”) acquired the core of the Pharmaceutical Technologies and Services (“PTS”) segment of Cardinal Health, Inc. (“Cardinal”). Cardinal had created PTS through a series of acquisitions beginning with R.P. Scherer Corporation in 1998, with the intent of creating the world’s leading outsourcing provider of specialized, market-leading solutions to the global pharmaceutical and biotechnology industry. Catalent is a holding company that indirectly owns Catalent Pharma Solutions, Inc., which owns, directly or indirectly, all of the operating subsidiaries of Catalent. Since Catalent’s 2007 acquisition, Catalent has regularly reviewed its portfolio of offerings and operations in the context of its strategic growth plan, and, as a result, Catalent has sold five businesses and consolidated operations at five facilities, integrating them into the remaining facility network. Catalent has also actively acquired new businesses and facilities, completing ten transactions since fiscal 2012. In July 2014, Catalent completed the initial public offering of its common stock (the “IPO”), which is now listed on the New York Stock Exchange (the “NYSE”) under the symbol “CTLT.” Catalent is no longer an affiliate of Blackstone.
INDUSTRY
We participate in nearly every sector of the $900 billion annual revenue global pharmaceutical industry, including the prescription drug and biologic sectors, as well as consumer health, which includes the over-the-counter and vitamins and nutritional supplement sectors. Global demand for both pharmaceutical and consumer healthcare products continues to increase, driven by: expanded access to care arising from reforms in two large markets, the United States and China; increased life expectancy in aging and increasingly obese populations in both developed markets and emerging markets; and a rising number of affluent consumers in emerging markets.
While benefiting from this strong demand, innovator companies have faced many challenges, including significant patent expirations and challenges, pricing pressures, increasingly complex discovery and development activities, and higher regulatory expectations. In response, many larger pharmaceutical companies have been restructuring their in-house approaches to research and development, manufacturing and sales and marketing, including realigning therapeutic class focus, scaling back on idle capacity resulting from generic conversions, and accessing specialized capabilities and capacity through outsourcing arrangements. The total share of industry spend that is outsourced is estimated around 35% today, with the share of large company spend that is outsourced growing, and medium-to-smaller companies already outsourcing a significant portion of their activities due to their limited resources and more virtual business models.
Advanced Delivery Technologies Market. More than half of today’s prescription revenues come from dose forms that require more than simple, immediate release tablets and oral solutions—drugs and biologics frequently require specialized manufacturing and/or molecular profile modification to achieve expected clinical results. Today, there are more than 4,000 new drugs in active development, and an increasing share of these molecules will require advanced delivery technologies, with estimates ranging from 60% to 90% of all new molecules entering development. Consumer health products also benefit from advanced delivery technologies, to enable innovative new products, or to create new formats for existing products and extend a brand franchise. We believe, based on the reports of external industry analysts, that the size of the advanced delivery technologies market will grow approximately 6 to 10% annually driven by these factors.
Development Solutions Market. The global pharmaceutical industry invests approximately $160 billion annually in research and development (“R&D”), of which an estimated 40% is outsourced (approximately 25% in large companies, with more than 50% in mid-sized and specialty companies). Approximately 50% of R&D spend is for compounds in Phase II and later stages of development; separately approximately half of R&D spend is on the combination of clinical research and chemistry, manufacturing and controls (“CMC”) work. These areas are the most common areas of outsourcing, with large global and regional clinical research organizations participating in
4
clinical research spend (approximately 35% of R&D spend), and providers of development sciences, clinical trial supplies and logistics such as Catalent, participating in the CMC spend (approximately 15% of R&D spend). Global development and clinical activities are increasingly complex, with evolving global standards, and more complex multi-arm trials in multiple patient populations across both developed and emerging markets. Within the approximately $22.0 billion market segment for pharmaceutical CMC, only 25% of such spending is outsourced as compared to the clinical research market segment where 60% of such spending is outsourced. We believe that levels of outsourcing will increase in the CMC segment, driving long-term growth in the outsourced CMC industry.
OUR COMPETITIVE STRENGTHS
Leading Provider of Advanced Delivery Technologies and Development Solutions
We are the leading global provider of advanced delivery technologies and development solutions for drugs, biologics and consumer and animal health products. In the last decade, we have earned revenue with respect to nearly half of the drugs based on new molecular entities (“NMEs”) approved by the FDA, and over the past three years with respect to nearly 80% of the top 200 largest-selling compounds globally. With approximately 1,400 scientists and technicians worldwide and approximately 1,100 patents and patent applications, our expertise is in providing differentiated technologies and solutions that help our customers bring more products and better treatments to market faster. For example, in the high-value area of NMEs, approximately 90% of NME softgel approvals by the FDA over the last 25 years have been developed and supplied by us. We hold market leadership positions in all of our core businesses. We are the leading provider of softgels, fast dissolve oral solid and blow-fill-seal solutions for complex products. We are also one of the leading players in clinical trials supply and respiratory delivery, including metered dose and dry powder inhalers and intra-nasal forms.
Diversified Operating Platform
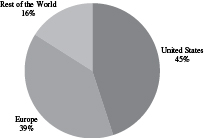
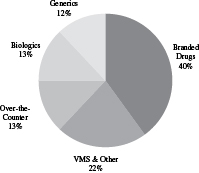
We are diversified by virtue of our geographic scope, our large customer base, the extensive range of products we produce, our broad service offerings, and our ability to provide solutions at nearly every stage of a product’s lifecycle. We produce nearly 7,000 distinct items across multiple categories, including brand and generic prescription drugs and biologics, over-the-counter, consumer health and veterinary products, medical devices and diagnostics. In fiscal 2016, our top 20 products represented approximately 25% of total revenue, with no single customer accounting for greater than 10% of revenue and with no individual product greater than 3%. We serve more than 1,000 customers in approximately 80 countries. In fiscal 2016, we generated 45% of our revenues in the United States, 39% in Europe and 16% in the rest of the world. This diversity, combined with long product lifecycles and close customer relationships, has contributed to the stability of our business. It has also allowed us to reduce our exposure to potential strategic, customer and product shifts as well as to payor-driven pricing pressures experienced by our branded drug and biologic customers.
| Revenue by Geography | Revenue by Product Type | |
| Year Ended June 30, 2016 | Year Ended June 30, 2016 | |
|
| |
5
Long-standing, Extensive Relationships with Blue Chip Customers
We have long-standing, extensive relationships with leading pharmaceutical and biotechnology customers. In fiscal 2016, we did business with 87 of the top 100 branded drug marketers, 22 of the top 25 generics marketers, 24 of the top 25 biologics marketers, and 21 of the top 25 consumer health marketers globally, as well as with more than 1,000 other customers, including emerging and specialty companies, which are often more reliant on outside partners as a result of their more virtual business models. Regardless of size, our customers seek innovative product development, superior quality, advanced manufacturing and skilled technical services to support their development and marketed product needs.
We believe our customers value us because our depth of development solutions and advanced delivery technologies, consistent and reliable supply, geographic reach and substantial expertise enable us to create a broad range of tailored solutions, many of which are unavailable from other individual providers.
Our customer relationships typically last over long periods of time, particularly in advanced delivery technologies, where we tend to follow a prescription molecule through all phases of its lifecycle, from the development and launch of the original brand prescription, to generics or over-the-counter switch. A prescription pharmaceutical product relationship with an innovator will often last many years, in several cases nearly two decades or more, extending from pre-clinical development through the end of the product’s life cycle.
Deep, Broad and Growing Technology Foundation
Our breadth of proprietary and patented technologies and long track record of innovation substantially differentiate us from other industry participants. Our leading softgel platforms, including Liqui-Gels, OptiShell and Vegicaps capsules, and our oral modified release technologies, including the Zydis family, OptiPact and OptiMelt technologies, provide formulation expertise to solve complex delivery challenges for our customers. We offer advanced technologies for delivery of small molecules and biologics via respiratory, ophthalmic and injectable routes, including the blow-fill-seal unit dose technology, ADVASEPT glass-free vials, and pre-filled syringes. We also provide advanced biologics formulation options, including our GPEx cell-line and SMARTag antibody-drug conjugate technologies. We have reinforced our leadership position in advanced delivery technologies over the last four years, as we have launched more than a dozen new technology platforms and applications, including in fiscal 2016 the launch of our Optiform Solutions Suite, a dose form-agnostic bioavailability enhancement platform for early-stage molecules. Our culture of creativity and innovation is grounded in our advanced delivery technologies, our scientists and engineers, and our patents and proprietary manufacturing processes throughout our global network. Our global product development team drives a focused application of resources to our highest priority opportunities for both new customer product introductions and platform technology development. As of September 30, 2016, we had approximately 625 product development programs in active development across our businesses.
Long-Duration Relationships Provide Sustainability
Our broad and diverse range of technologies closely integrates with our customers’ molecules to yield final dose forms, and this generally results in the inclusion of Catalent in our customers’ prescription product regulatory filings. Both of these factors translate to long-duration supply relationships at an individual product level, to which we apply our expertise in contracting to produce long-duration commercial supply agreements. These agreements typically have initial terms of three to 10 years with regular renewals of one to three years. Nearly two-thirds of our fiscal 2016 advanced delivery technology platform revenues (comprised of our Softgel Technologies and Drug Delivery Solutions reporting segments) were covered by such long-term contractual arrangements. We believe this base provides us with a sustainable competitive advantage.
6
Significant Recent Growth Investments
We have made significant investments over time to establish a global manufacturing network, and today employ 5.2 million square feet of manufacturing and laboratory space across five continents. We have invested approximately $630 million in the last five fiscal years in gross capital expenditures. Growth-related investments in facilities, capacity and capabilities across our businesses have positioned us for future growth in areas aligned with anticipated future demand. Through our focus on operational, quality and regulatory excellence, we drive ongoing and continuous improvements in safety, productivity and reliable supply to customer expectations, which we believe further differentiate us. Our manufacturing network and capabilities allow us the flexibility to reliably supply the changing needs of our customers while consistently meeting their quality, delivery and regulatory compliance expectations.
High Standards of Regulatory Compliance and Operational and Quality Excellence
We operate our plants in accordance with current good manufacturing practices (“cGMP”), following our own high standards that are consistent with those of many of our large global pharmaceutical and biotechnology customers. We have more than 1,100 employees around the globe focused on quality and regulatory compliance. More than half of our facilities are registered with the FDA, with the remaining facilities registered with other applicable regulatory agencies, such as the European Medicines Agency (the “EMA”). In some cases, facilities are registered with multiple regulatory agencies. In fiscal 2016, we were subject to 49 regulatory audits and, over the last five fiscal years, we successfully completed more than 250 regulatory audits. We also undergo more than 400 customer and internal audits annually. We believe our quality and regulatory track record to be a competitive differentiator for Catalent.
Strong and Experienced Management Team
Our executive leadership team collectively has more than 200 years of combined and diverse experience within the pharmaceutical and healthcare industries. With an average of more than 20 years of functional experience, this team possesses deep knowledge and a wide network of industry relationships.
OUR STRATEGY
We are pursuing the following key growth initiatives:
“Follow the Molecule” by Providing Solutions to our Customers across all Phases of the Product Lifecycle
We intend to use our advanced delivery technologies and development solutions across the entire lifecycle of our customers’ products to drive future growth. Our development solutions span the drug development process, starting with our platforms for development of small molecules, biologics and antibody-drug conjugates, to formulation and analytical services, through early stage clinical development and manufacturing of clinical trials supply, to regulatory consulting. Once a molecule is ready for late-stage trials and subsequent commercialization, we provide our customers with a range of advanced delivery technologies and manufacturing expertise that allow them to deliver their molecules to the end-users in appropriate dosage forms. The relationship between a molecule and our advanced delivery technologies typically starts with developing and manufacturing the innovator product, then extends throughout the molecule’s commercial life, including through potential generic launches or over-the-counter conversion. For prescription products, we are typically the sole and/or exclusive provider, and are reflected in customers’ new drug applications.
Our breadth of solutions gives us multiple entry points into the lifecycle of our customers’ molecules. Our initial commercial opportunity arises during the discovery and development of a molecule, when our development and particle engineering solutions can be applied. Once a product reaches late-stage development,
7
we can provide our customers with drug delivery solutions for the commercialization of their products. We have two additional entry points during the commercial phase: upon loss-of-exclusivity and upon conversion to over-the-counter status. At these points, we partner with the makers and marketers of both generic and over-the-counter products to provide them with advanced delivery technologies that can be applied to their products through these stages of the product lifecycle. Our revenues from our advanced delivery technologies are primarily driven by volume and, as a result, the loss of exclusivity may not have a significant negative impact if we continue to work with both branded and generic partners.
An example of this can be found in a leading over-the-counter respiratory brand, which today uses both our Zydis fast dissolve and our Liqui-Gels softgel technologies. We originally began development of the prescription format of this product for our multinational pharmaceutical company partner in 1992 to address specific patient sub-segment needs. After four years of development, we then commercially supplied the prescription Zydis product for six years, and we have continued to provide the Zydis form since the switch to over-the-counter status in the United States and other markets in the early 2000s. More recently, we proactively brought a softgel product concept for the brand to the customer, which the customer elected to develop and launch as well. By following this molecule, we have built a strong, 24-year long relationship across multiple formats and markets.
Continue to Grow Through New Product Launches and Projects
We intend to grow by supplementing our existing diverse base of commercialized advanced delivery technology products with new development programs. As of September 30, 2016, our product development teams were working on approximately 625 new customer programs. Our base of active development programs has expanded in recent years from growing market demand, as well as from our investments since 2010 to expand our global sales and marketing function; once developed and approved in the future, we expect these programs to add to long-duration commercial revenues under long-term contracts and grow our existing product base. In the year ended June 30, 2016, we introduced 184 new products, which is up 12% versus new product introductions in the year ended June 30, 2015 and up more than 200% since the year ended June 30, 2012, when we introduced 59 new products. In the year ended June 30, 2016, we recognized approximately $330 million of revenue related to the development of products on behalf of customers, included in our Softgel Technologies and Drug Delivery Solutions reporting segments, up 19% from the prior year. In addition, substantially all of the revenues associated with the Clinical Supply Services segment relate to our support of customer products in development.
We expect that our expanded offerings and capacity, such as our OptiForm Solutions Suite bioavailability enhancement offering, expanded bioanalytical testing and commercial-scale metered dose inhaler production, ongoing service offering and geographic network expansion in our clinical supply services business, our expanded presence in Brazil, and our continued growth in China, will further expand our active advanced delivery technologies development programs, and position us for ongoing future growth. Our development solutions business is driven by thousands of projects annually, ranging from individual short-duration analytical projects to multi-year clinical supply programs.
Accelerate Growth with Existing Customers through Increased Penetration and Broadening of Services
While we have a broad presence across the pharmaceutical and biotechnology industries, we believe there are significant opportunities for additional revenue growth in our existing customer base, by providing advanced delivery solutions for new pipeline or commercial molecules, and by expanding the range and depth of our development solutions used by those customers. Within our top 50 customers, nearly 75% use less than half of our individual offerings. In order to ensure we provide the most value to our customers, we have increased our field sales and marketing force by approximately 20% since fiscal 2009. We have continued to follow a targeted account strategy, designating certain accounts as global accounts, based on current materiality, partnering approach and growth potential. We also designate other accounts as growth accounts, based primarily on
8
partnering approach and potential to become global accounts in the future. In both cases, we assign incremental business development product development resources to identify and pursue new opportunities to partner. Global accounts represented nearly 29% of our revenues in fiscal 2016, while growth accounts represented approximately 8% of revenues in that same period.
Enter Into and Expand Into Attractive Technologies and Geographies
We have made a number of internal investments in new geographies and markets, including the construction and ongoing expansion of a state-of-the-art biomanufacturing facility in Wisconsin to serve the growing global biologics development market, a recently completed significant expansion of oral solid controlled release production capacity in Kentucky, the scaling-up of commercial manufacturing capacity for metered-dose inhalers and continuing development and scale-up of the SMARTag™ antibody-drug conjugate technology to address the growing need for improved targeted delivery of therapeutic compounds directly to tumor sites.
In addition, we intend to increase our presence in emerging/high-growth geographies and other markets where we are currently only narrowly represented, including China, Brazil, Japan, and the animal health market.
Capitalize on Our Substantial Technology Platform
We have a broad and diverse technology platform that is supported by approximately 1,100 patents and patent applications in more than 100 families across advanced delivery technologies, drug and biologics formulation and manufacturing. This platform is supported by substantial know-how and trade secrets that provide us with additional competitive advantages. For example, we have significant softgel fill and formulation databases and substantial softgel regulatory approval expertise, and as a result, approximately 90% of NME softgel approvals by the FDA over the last 25 years have been developed and supplied by us.
In addition to resolving product challenges for our customers’ molecules, for more than two decades we have applied our technology platforms and development expertise to proactively develop proof-of-concept products, whether improved versions of existing drugs, new generic formulations or innovative consumer health products. In the consumer health area, we file product dossiers with regulators in relevant jurisdictions for self-created products, which help contribute sustainable growth to our consumer health business. We expect to continue to seek proactive development and other non-traditional relationships to increase demand for and value realized from our technology platforms. These activities have provided us with opportunities to capture an increased share of end-market value through out-licensing, profit-sharing and other arrangements.
Leverage Existing Infrastructure and Operational Discipline to Drive Profitable Growth
Through our existing infrastructure, including our global network of operating locations and programs, we promote operational discipline and drive margin expansion. With our Lean Manufacturing and Lean Six Sigma programs, a global procurement function and conversion cost productivity metrics in place, we have created a culture of functional excellence and cost accountability. We intend to continue to apply this discipline to further leverage our operational network for profitable growth. Since fiscal 2009, we have expanded gross margin by over 400 basis points and Adjusted EBITDA margin by over 200 basis points.
Pursue Strategic Acquisitions and Licensing to Build upon our Existing Platform
We operate in highly fragmented markets in both our advanced delivery technologies and development solutions businesses. Within those markets, the five top players represent nearly 35% and 10% of the total market share, respectively, by revenue. Our broad platform, global infrastructure and diversified customer base provide us with a strong foundation from which to consolidate within these markets and to generate operating leverage through such acquisitions. Since fiscal 2012, we have executed ten transactions, investing more than $750 million, and have demonstrated an ability to efficiently and effectively integrate these acquisitions.
9
While we are rigorously focused on driving Catalent’s organic growth, we intend to continue to opportunistically source and execute bolt-on strategic acquisitions within our existing business areas, as well as to undertake transactions that provide us with expansion opportunities within new geographic markets or adjacent market segments. We have a dedicated corporate development team in place to identify these opportunities and have a rigorous and financially disciplined process for evaluating, executing and integrating such acquisitions.
The Pharmatek Acquisition
On September 22, 2016, we acquired Pharmatek (the “Pharmatek Acquisition”), a contract drug development and clinical manufacturing company, based in the U.S. Pharmatek adds discovery-to-clinic drug development capabilities, expands our capability for handling highly potent compounds, and adds spray drying to our technologies.
The Accucaps Acquisition
On November 23, 2016, we entered into a share purchase agreement with, among others, Apotex Holdings, Inc., pursuant to which we agreed to acquire Accucaps Industries Limited (“Accucaps”) for a purchase price of approximately $75.0 million (U.S. dollar equivalent) (the “Accucaps Acquisition”). Accucaps operates two facilities in Ontario, Canada that manufacture and package softgel capsules for the prescription and over-the-counter markets. The transaction is subject to customary closing conditions. We intend to use a portion of the net proceeds from the private financing transaction to fund the purchase price for the Accucaps Acquisition. The closing of the private financing transaction is not conditioned upon the consummation of the Accucaps Acquisition and there can be no assurance that the Accucaps Acquisition will be consummated.
Repricing of Term Loans
Concurrently with the closing of the private financing transaction, we intend to amend the credit agreement governing our senior secured credit facilities to reduce the applicable margin on the term loans. The closing of the private financing transaction is not conditioned upon the consummation of the credit agreement amendment and there can be no assurance that we will be able to obtain any such reduction to the applicable margin.
10
SUMMARY HISTORICAL FINANCIAL INFORMATION AND OTHER DATA
The following table presents our summary historical financial information and other data as of the dates and for the periods presented. The summary historical financial information as of June 30, 2016 and 2015 and for the fiscal years ended June 30, 2016, 2015 and 2014 has been derived from our audited consolidated financial statements. The summary historical financial information as of June 30, 2014 has been derived from our audited consolidated financial statements. The summary historical financial information as of September 30, 2016 and 2015 and for the three months ended September 30, 2016 and 2015 have been derived from our unaudited consolidated financial statements. The summary historical financial information as of September 30, 2015 has been derived from our unaudited consolidated financial statements. The unaudited interim consolidated financial statements have been prepared on the same basis as the audited consolidated financial statements and, in the opinion of our management, include all adjustments, consisting only of normal and recurring adjustments, necessary for a fair presentation of the information set forth herein. Interim financial results are not necessarily indicative of results for the full fiscal year or any future reporting period.
The unaudited consolidated financial information for the twelve months ended September 30, 2016 has been derived by adding the financial information from our audited consolidated financial statements for the fiscal year ended June 30, 2016 to the financial data from our unaudited consolidated financial statements for the three months ended September 30, 2016 and subtracting the financial information from our unaudited consolidated financial statements for the three months ended September 30, 2015.
| Twelve Months Ended September 30, |
Three Months Ended September 30, |
Fiscal Years Ended June 30, | ||||||||||||||||||||||
| 2016 | 2016 | 2015 | 2016 | 2015 | 2014 | |||||||||||||||||||
| (Unaudited) | ||||||||||||||||||||||||
| (in millions, except as noted) | ||||||||||||||||||||||||
| Statement of Operations Data: |
||||||||||||||||||||||||
| Net revenue(1) |
$ | 1,867.3 | $ | 442.2 | $ | 423.0 | $ | 1,848.1 | $ | 1,830.8 | $ | 1,827.7 | ||||||||||||
| Cost of sales |
1,277.1 | 318.1 | 301.5 | 1,260.5 | 1,215.5 | 1,229.1 | ||||||||||||||||||
|
|
|
|
|
|
|
|
|
|
|
|
|
|||||||||||||
| Gross margin(1) |
590.2 | 124.1 | 121.5 | 587.6 | 615.3 | 598.6 | ||||||||||||||||||
| Selling, general and administrative expense |
374.0 | 98.2 | 82.3 | 358.1 | 337.3 | 334.8 | ||||||||||||||||||
| Impairment charges and (gain)/loss on sale of assets |
1.5 | — | 1.2 | 2.7 | 4.7 | 3.2 | ||||||||||||||||||
| Restructuring and other |
9.1 | 1.1 | 1.0 | 9.0 | 13.4 | 19.7 | ||||||||||||||||||
|
|
|
|
|
|
|
|
|
|
|
|
|
|||||||||||||
| Operating earnings/(loss) |
205.6 | 24.8 | 37.0 | 217.8 | 259.9 | 240.9 | ||||||||||||||||||
| Interest expense, net |
87.9 | 22.1 | 22.7 | 88.5 | 105.0 | 163.1 | ||||||||||||||||||
| Other (income)/expense, net |
(18.3 | ) | (2.1 | ) | 0.6 | (15.6 | ) | 42.4 | 10.4 | |||||||||||||||
|
|
|
|
|
|
|
|
|
|
|
|
|
|||||||||||||
| Earnings/(loss) from continuing operations before income taxes |
136.0 | 4.8 | 13.7 | 144.9 | 112.5 | 67.4 | ||||||||||||||||||
| Income tax expense/(benefit) |
31.9 | 0.2 | 2.0 | 33.7 | (97.7 | ) | 49.5 | |||||||||||||||||
|
|
|
|
|
|
|
|
|
|
|
|
|
|||||||||||||
| Earnings/(loss) from continuing operations |
104.1 | 4.6 | 11.7 | 111.2 | 210.2 | 17.9 | ||||||||||||||||||
| Earnings/(loss) from discontinued operations, net of tax |
— | — | — | — | 0.1 | (2.7 | ) | |||||||||||||||||
|
|
|
|
|
|
|
|
|
|
|
|
|
|||||||||||||
| Net earnings/(loss) |
104.1 | 4.6 | 11.7 | 111.2 | 210.3 | 15.2 | ||||||||||||||||||
| Less: Net earnings/(loss) attributable to noncontrolling interest, net of tax |
(0.1 | ) | — | (0.2 | ) | (0.3 | ) | (1.9 | ) | (1.0 | ) | |||||||||||||
| Net earnings/(loss) attributable to Catalent |
$ | 104.2 | $ | 4.6 | $ | 11.9 | $ | 111.5 | $ | 212.2 | $ | 16.2 | ||||||||||||
|
|
|
|
|
|
|
|
|
|
|
|
|
|||||||||||||
11
| Twelve Months Ended September 30, |
Three Months Ended September 30, |
Fiscal Years Ended June 30, |
||||||||||||||||||||||
| 2016 | 2016 | 2015 | 2016 | 2015 | 2014 | |||||||||||||||||||
| (Unaudited) | ||||||||||||||||||||||||
| (in millions, except as noted) | ||||||||||||||||||||||||
| Statement of Cash Flow Data: |
||||||||||||||||||||||||
| Net cash provided by/(used in) continuing operations: |
||||||||||||||||||||||||
| Operating activities |
$ | 48.3 | $ | 44.9 | $ | 155.3 | $ | 171.7 | $ | 180.2 | ||||||||||||||
| Investing activities |
(114.6 | ) | (33.2 | ) | (137.7 | ) | (271.8 | ) | (175.2 | ) | ||||||||||||||
| Financing activities |
65.9 | (10.3 | ) | (30.8 | ) | 196.5 | (42.1 | ) | ||||||||||||||||
| Balance Sheet Data (at period end): |
||||||||||||||||||||||||
| Cash and cash equivalents |
$ | 132.1 | $ | 151.4 | $ | 131.6 | $ | 151.3 | $ | 74.4 | ||||||||||||||
| Total assets(2) |
3,128.1 | 3,049.5 | 3,091.1 | 3,138.3 | 3,073.4 | |||||||||||||||||||
| Long term debt, including current portion and other short term borrowing(2) |
1,937.3 | 1,877.0 | 1,860.5 | 1,880.8 | 2,693.8 | |||||||||||||||||||
| Total liabilities(2) |
2,513.6 | 2,446.5 | 2,455.2 | 2,498.5 | 3,440.7 | |||||||||||||||||||
| Other Financial Data: |
||||||||||||||||||||||||
| Capital expenditures |
$ | 27.7 | $ | 33.2 | $ | 139.6 | $ | 141.0 | $ | 122.4 | ||||||||||||||
| Cash interest expense(3) |
$ | 88.1 | 20.2 | 20.8 | 82.4 | 107.1 | 153.8 | |||||||||||||||||
| Adjusted EBITDA(1)(4) |
398.6 | 75.0 | (5) | 77.6 | 401.2 | (5) | 443.1 | 432.3 | ||||||||||||||||
| Other Adjusted Financial Data: |
||||||||||||||||||||||||
| Further Adjusted EBITDA(1)(4) |
$ | 412.0 | ||||||||||||||||||||||
| Total debt / Further Adjusted EBITDA(1)(4) |
5.0 | x | ||||||||||||||||||||||
| Total net debt / Further Adjusted EBITDA(1)(4)(6) |
4.6 | x | ||||||||||||||||||||||
| Further Adjusted EBITDA / Cash interest expense(1)(3)(4) |
4.7 | x | ||||||||||||||||||||||
| (1) | On November 13, 2015, the primary French drug regulatory agency (the “ANSM”) issued an order temporarily suspending operations at our softgel manufacturing facility in Beinheim, France, which was lifted on April 28, 2016. The temporary suspension of operations at our facility in Beinheim, France resulted in a reduction of Softgel Technologies segment revenues by approximately $35.0 million and $6.0 million for fiscal 2016 and the first quarter of fiscal 2017, respectively, as compared to pre-suspension levels of production and impacted Softgel Technologies’ Segment EBITDA by approximately $32.0 million and $5.0 million, respectively, for the same periods. EBITDA, Adjusted EBITDA and Further Adjusted EBITDA have not been adjusted to remove the impact of the Beinheim suspension. |
| (2) | In connection with the Company’s adoption of Accounting Standards Update (“ASU”) 2015-03, Simplifying the Presentation of Debt Issuance Costs, as of January 1, 2016, prior year debt balances have been retrospectively adjusted to include a direct deduction of unamortized debt issuance costs, resulting in a reclassification of $7.1 million, $16.8 million and $6.9 million of debt issuance costs as of June 30, 2015 and 2014 and September 30, 2015, respectively, to long-term debt, including current portion and other short-term borrowing for the respective periods. Prior to the adoption of ASU 2015-03, the unamortized debt issuance costs were included in other assets on the Company’s consolidated balance sheets. The unamortized debt issuance costs associated with the Company’s revolving credit facility continues to be included within other assets. |
12
| (3) | Cash interest expense for the twelve months ended September 30, 2016 is adjusted for the private financing transaction and the use of the net proceeds therefrom. Cash interest expense assumes that the interest rate on our term loans was constant for the twelve month period ended September 30, 2016 and does not give effect to any reduction in the applicable margin on the term loans that we seek to obtain concurrently with the closing of the private financing transaction. Assuming that our revolving credit facility is undrawn and LIBOR is above any applicable minimum floor, each one-eighth percent change in interest rates would result in a change of approximately $2.0 million in annual interest expense on the indebtedness under our senior secured credit facilities. |
| (4) | For additional information regarding our use of EBITDA from continuing operations, Adjusted EBITDA and Further Adjusted EBITDA and limitations on their usefulness as analytical tools, see “Use of Non-GAAP Measures.” A reconciliation of earnings/(loss) from continuing operations, the most directly comparable U.S. GAAP measure, to EBITDA from continuing operations, Adjusted EBITDA and Further Adjusted EBITDA is as follows: |
| Twelve Months Ended September 30, |
Three Months Ended September 30, |
Fiscal Years Ended June 30, |
||||||||||||||||||||||
| 2016 | 2016 | 2015 | 2016 | 2015 | 2014 | |||||||||||||||||||
| Earnings/(loss) from continuing operations |
$ | 104.1 | $ | 4.6 | $ | 11.7 | $ | 111.2 | $ | 210.2 | $ | 17.9 | ||||||||||||
| Interest expense, net |
87.9 | 22.1 | 22.7 | 88.5 | 105.0 | 163.1 | ||||||||||||||||||
| Depreciation and amortization |
140.9 | 35.8 | 35.5 | 140.6 | 140.8 | 142.9 | ||||||||||||||||||
| Income tax (benefit)/expense(a) |
31.9 | 0.2 | 2.0 | 33.7 | (97.7 | ) | 49.5 | |||||||||||||||||
| Non-controlling interest |
0.1 | — | 0.2 | 0.3 | 1.9 | 1.0 | ||||||||||||||||||
|
|
|
|
|
|
|
|
|
|
|
|
|
|||||||||||||
| EBITDA from continuing operations |
$ | 364.9 | $ | 62.7 | $ | 72.1 | $ | 374.3 | $ | 360.2 | $ | 374.4 | ||||||||||||
| Equity compensation |
15.1 | 6.9 | 2.6 | 10.8 | 9.0 | 4.5 | ||||||||||||||||||
| Impairment charges and (gain)/loss on sale of assets |
1.5 | — | 1.2 | 2.7 | 4.7 | 3.2 | ||||||||||||||||||
| Financing related expenses and other(b) |
— | — | — | — | 21.8 | 11.0 | ||||||||||||||||||
| U.S. GAAP Restructuring |
9.1 | 1.1 | 1.0 | 9.0 | 13.4 | 19.7 | ||||||||||||||||||
| Acquisition, integration and other special items |
22.0 | 4.8 | 1.0 | 18.2 | 13.8 | 9.8 | ||||||||||||||||||
| Foreign exchange loss/(gain) (included in other, net)(c) |
(10.5 | ) | (0.5 | ) | (0.5 | ) | (10.5 | ) | (2.7 | ) | (3.5 | ) | ||||||||||||
| Sponsor advisory fee(d) |
— | — | — | — | — | 12.9 | ||||||||||||||||||
| Other adjustments(e) |
(3.5 | ) | — | 0.2 | (3.3 | ) | 22.9 | 0.3 | ||||||||||||||||
|
|
|
|
|
|
|
|
|
|
|
|
|
|||||||||||||
| Adjusted EBITDA |
398.6 | 75.0 | (f) | 77.6 | 401.2 | (f) | 443.1 | 432.3 | ||||||||||||||||
| Pharmatek Acquisition(g) |
6.0 | |||||||||||||||||||||||
| Accucaps Acquisition(h) |
7.4 | |||||||||||||||||||||||
|
|
|
|||||||||||||||||||||||
| Further Adjusted EBITDA(i) |
$ | 412.0 | ||||||||||||||||||||||
|
|
|
|||||||||||||||||||||||
| (a) | Represents the amount of income tax-related expense/(benefit) recorded within our net earnings/(loss) that may not result in cash payment or receipt. |
| (b) | Financing-related expenses for the three months ended September 30, 2014 include $20.6 million of early debt termination expenses incurred in connection with the repayment of debt with the net proceeds of the IPO. See footnote (e) below for an additional $29.8 million of IPO-related costs, totaling $50.4 million. |
| (c) | For the twelve months ended September 30, 2016 and the fiscal years ended June 30, 2016, 2015 and 2014, foreign exchange gains of $10.5 million, $10.5 million, $2.7 million and $3.5 million, respectively, included $16.9 million, $16.3 million, $16.4 million and $17.1 million of unrealized foreign currency exchange rate gains. For the twelve months ended September 30, 2016, such gains were primarily driven by gains of $6.2 million related to foreign trade receivables and payables, $9.3 million of unrealized gains on inter-company loans and $1.3 million of unrealized gains on the effective portion of the Company’s net investment hedge. For the fiscal years ended June 30, 2016, 2015 and 2014, such gains were primarily driven by gains of $9.0 million, losses of $31.4 million and gains of $26.6 million, respectively, related to inter-company loans denominated in a currency different from the functional currency of either the borrower or the lender and foreign currency exchange gains of $3.8 million, $47.8 million and $9.5 million, respectively, driven by the ineffective portion of the net investment hedge related to the euro-denominated debt. For the twelve months ended September 30, 2016 and the fiscal years ended June 30, 2016, 2015 and 2014, the foreign exchange adjustment was also affected by the exclusion of realized foreign currency exchange rate losses from the non-cash and cash settlement of inter-company loans of $6.3 million, $5.8 million, $13.7 million and $13.6 million, respectively. Inter-company loans are between Catalent entities and do not reflect the ongoing results of Catalent’s trade operations. |
| (d) | Represents the amount of sponsor advisory fee for each respective period. The sponsor advisory fee agreement was terminated in connection with the completion of our IPO. |
| (e) | Other Adjustments for the twelve months ended June 30, 2015 includes $29.8 million for a sponsor advisory agreement termination fee paid in connection with the IPO. See footnote (b) above for an additional $20.6 million of IPO-related costs, totaling $50.4 million. |
| (f) | See footnote (5) below for the impact of unfavorable currency exchange rates on Adjusted EBITDA for the periods. |
| (g) | We closed the Pharmatek Acquisition in September 2016. This adjustment represents estimated EBITDA attributable to the Pharmatek Acquisition for the twelve months ended September 30, 2016, net of potential cost dissynergies. See “—Recent Developments—The Pharmatek Acquisition” above and note (i) below. |
13
| (h) | This adjustment represents estimated EBITDA attributable to the Accucaps Acquisition for the twelve months ended September 30, 2016. See “—Recent Developments—The Accucaps Acquisition” above and note (i) below. |
| (i) | Further Adjusted EBITDA gives effect to the Pharmatek Acquisition and the Accucaps Acquisition as if such acquisitions had occurred on October 1, 2015. The information relating to the estimated EBITDA attributable to Pharmatek prior to our ownership was derived from audited financial information provided by Pharmatek. In addition, the estimated EBITDA attributable to Accucaps has been derived from unaudited financial information provided by Accucaps. Such financial information was prepared by Pharmatek and Accucaps, respectively, pursuant to applicable accounting principles for such entities, which may differ from U.S. GAAP and our accounting principles. We did not control Pharmatek prior to September 22, 2016 and will not control Accucaps until consummation of the Accucaps Acquisition. Accordingly, although we believe such information to be accurate, such information cannot be independently verified by our management. In addition, our auditors have not audited, reviewed, compiled or performed any procedures with respect to such financial information and, accordingly, do not express an opinion or any other form of assurance with respect thereto. The amounts attributable to Pharmatek and Accucaps presented herein have not been prepared in accordance with the requirements of Regulation S-X or any other securities laws relating to the presentation of pro forma financial information, are presented for illustrative purposes only, do not purport to be indicative of the contribution that Pharmatek or Accucaps would have made to our Adjusted EBITDA had such businesses been included in our operations for the twelve months ended September 30, 2016 and do not purport to project our future operating results. Such Further Adjusted EBITDA does not reflect any transaction costs, financing costs, or integration costs relating to such acquisitions, or any potential synergies therefrom, and is not intended as a forecast of future operating results or financial performance. Furthermore, the Accucaps Acquisition is subject to customary closing conditions, and there can be no assurance that the Accucaps Acquisition will be consummated. |
| (5) | On a constant currency basis, Adjusted EBITDA for the fiscal year ended June 30, 2016 and the three months ended September 30, 2016 was $422.0 million and $80.0 million, respectively, after adjusting for a $20.8 million and a $5.0 million unfavorable impact from currency exchange rates, respectively. |
| (6) | Total net debt represents our total debt, including capital lease and other financing obligations, as of September 30, 2016, less the amount of cash and cash equivalents as of September 30, 2016, in each case, as adjusted to give effect to the private financing transaction and the use of the net proceeds therefrom. |
The Company’s results on a segment basis for the fiscal year ended June 30, 2016 compared to the twelve months ended June 30, 2015 were as follows:
| Fiscal Year Ended June 30, |
||||||||
| (in millions) | 2016 | 2015 | ||||||
| Softgel Technologies |
||||||||
| Net revenue |
$ | 775.0 | $ | 787.5 | ||||
| Segment EBITDA |
163.8 | 173.6 | ||||||
| Drug Delivery Solutions |
||||||||
| Net revenue |
806.4 | 798.3 | ||||||
| Segment EBITDA |
215.2 | 230.7 | ||||||
| Clinical Supply Services |
||||||||
| Net revenue |
307.5 | 288.4 | ||||||
| Segment EBITDA |
53.2 | 56.7 | ||||||
| Inter-segment revenue elimination |
(40.8 | ) | (43.4 | ) | ||||
| Unallocated Costs (1) |
(57.9 | ) | (100.8 | ) | ||||
| Combined Total |
||||||||
|
|
|
|
|
|||||
| Net revenue |
$ | 1,848.1 | $ | 1,830.8 | ||||
|
|
|
|
|
|||||
| EBITDA from continuing operations |
$ | 374.3 | $ | 360.2 | ||||
|
|
|
|
|
|||||
| (1) | Unallocated costs includes equity-based compensation, certain acquisition-related costs, impairment charges, certain other corporate directed costs, and other costs that are not allocated to the segments as follows: |
| Fiscal Year Ended June 30, |
||||||||
| (in millions) | 2016 | 2015 | ||||||
| Impairment charges and gain/(loss) on sale of assets |
$ | (2.7 | ) | $ | (4.7 | ) | ||
| Equity compensation |
(10.8 | ) | (9.0 | ) | ||||
| Restructuring and other special items (2) |
(27.2 | ) | (27.2 | ) | ||||
| Noncontrolling interest |
0.3 | 1.9 | ||||||
| Other income/(expense), net (3) |
15.6 | (42.4 | ) | |||||
| Non-allocated corporate costs, net |
(33.1 | ) | (19.4 | ) | ||||
|
|
|
|
|
|||||
| Total unallocated costs |
$ | (57.9 | ) | $ | (100.8 | ) | ||
|
|
|
|
|
|||||
| (2) | Segment results do not include restructuring and certain acquisition-related costs. |
| (3) | Amounts for fiscal 2015 primarily relate to the expense associated with the termination of the sponsor advisory fee agreement of $29.8 million resulting from the IPO, expenses related to financing transactions of $21.8 million and non-recurring non-cash purchase accounting gains of approximately $8.9 million related to acquisitions completed. |
14
USE OF NON-GAAP MEASURES
Management measures operating performance based on consolidated earnings from continuing operations before interest expense, expense/(benefit) for income taxes and depreciation and amortization, which is further adjusted for the income or loss attributable to noncontrolling interests (“EBITDA from continuing operations”). EBITDA from continuing operations is not defined under those accounting principles generally accepted in the United States (“U.S. GAAP”) and is not a measure of operating income, operating performance or liquidity presented in accordance with U.S. GAAP and is subject to important limitations.
We believe that the presentation of EBITDA from continuing operations enhances an investor’s understanding of our financial performance. We believe this measure is a useful financial metric to assess our operating performance from period to period and use this measure for business planning purposes.
In addition, given the significant investments that we have made in the past in property, plant and equipment, depreciation and amortization expenses represent a meaningful portion of our cost structure. We believe that EBITDA from continuing operations provides investors with a useful tool for assessing the comparability between periods of our ability to generate cash from operations sufficient to pay taxes, to service debt and to undertake capital expenditures because it eliminates depreciation and amortization expense. We present EBITDA from continuing operations in order to provide supplemental information that we consider relevant for the readers of the consolidated financial statements, and such information is not meant to replace or supersede U.S. GAAP measures. Our definition of EBITDA from continuing operations may not be the same as similarly titled measures used by other companies.
In addition, we evaluate the performance of our segments based on segment earnings before noncontrolling interest, other (income)/expense, impairments, restructuring costs, interest expense, income tax expense/(benefit), and depreciation and amortization (“Segment EBITDA”). Moreover, under the credit agreement governing our senior secured credit facilities and the indenture, our ability to engage in certain activities such as incurring certain additional indebtedness, making certain investments and paying certain dividends is tied to ratios based on Adjusted EBITDA (which is defined as “Consolidated EBITDA” in the credit agreement governing our senior secured credit facilities and “EBITDA” in the indenture). Adjusted EBITDA is based on the definitions in the credit agreement governing our senior secured credit facilities and in the indenture, is not defined under U.S. GAAP and is subject to important limitations. We have included the calculations of Adjusted EBITDA for the periods presented.
In applying Adjusted EBITDA to determine our ability to engage in the activities described above under the credit agreement governing our senior secured credit facilities we are permitted to make further adjustments to Adjusted EBITDA as provided by the credit agreement governing our senior secured credit facilities. We refer to this further adjusted measure as “Further Adjusted EBITDA.” Further Adjusted EBITDA is based on the definitions in the credit agreement governing our senior secured credit facilities is not defined under U.S. GAAP, and is subject to important limitations. We have included the calculation of Further Adjusted EBITDA for the twelve months ended September 30, 2016.
Because not all companies use identical calculations, our presentation of EBITDA from continuing operations, Adjusted EBITDA and Further Adjusted EBITDA may not be comparable to other similarly titled measures of other companies. Included herein is a reconciliation of earnings/(loss) from continuing operations to EBITDA from continuing operations, to Adjusted EBITDA and to Further Adjusted EBITDA.
EBITDA from continuing operations, Adjusted EBITDA and Further Adjusted EBITDA have important limitations as analytical tools and you should not consider them in isolation or as substitutes for analysis of our results as reported under U.S. GAAP. For example, EBITDA from continuing operations, Adjusted EBITDA and Further Adjusted EBITDA: exclude certain tax obligations relating to excluded financial measures; do not reflect any cash capital expenditure requirements for the assets being depreciated and amortized that may have to be replaced in the future; do not reflect changes in, or cash requirements for, our working capital needs; and do not reflect the significant interest expense, or the cash requirements necessary to service interest or principal payments, on our debt.
In calculating Adjusted EBITDA and Further Adjusted EBITDA, we add back certain non-cash, nonrecurring and other items that are included in EBITDA and net income as required by various covenants in the credit agreement governing our senior secured credit facilities. Adjusted EBITDA and Further Adjusted EBITDA, among other things: do not include non-cash stock-based employee compensation expense and certain other non-cash charges; do not include cash and non-cash restructuring, severance and relocation costs incurred to realize future cost savings and enhance our operations; add back noncontrolling interest expense, which represents the minority investors’ ownership of certain of our consolidated subsidiaries and is, therefore not available to us; and include estimated cost savings that have not yet been fully reflected in our results.
In calculating Further Adjusted EBITDA, we give pro forma effect to acquisitions as if they had occurred at the beginning of the period presented. Certain of these pro forma effects are based on estimates and assumptions, all of which we believe we have a reasonable basis for and are subject to change. Actual results could differ from those estimates.
As exchange rates are an important factor in understanding period-to-period comparisons, we believe the presentation of results on a constant currency basis in addition to reported results helps improve investors’ ability to understand our operating results and evaluate our performance in comparison to prior periods. Constant currency information compares results between periods as if exchange rates had remained constant period-over-period. We use results on a constant currency basis as one measure to evaluate our performance. We calculate constant currency by calculating current-year results using prior-year foreign currency exchange rates. We generally refer to such amounts calculated on a constant currency basis as excluding the impact of foreign exchange. These results should be considered in addition to, not as a substitute for, results reported in accordance with U.S. GAAP. Results on a constant currency basis, as we present them, may not be comparable to similarly titled measures used by other companies and are not measures of performance presented in accordance with U.S. GAAP. Unless specifically indicated, our results, including EBITDA from continuing operations, Adjusted EBITDA and Further Adjusted EBITDA, presented herein, are not provided on a constant currency basis.
15